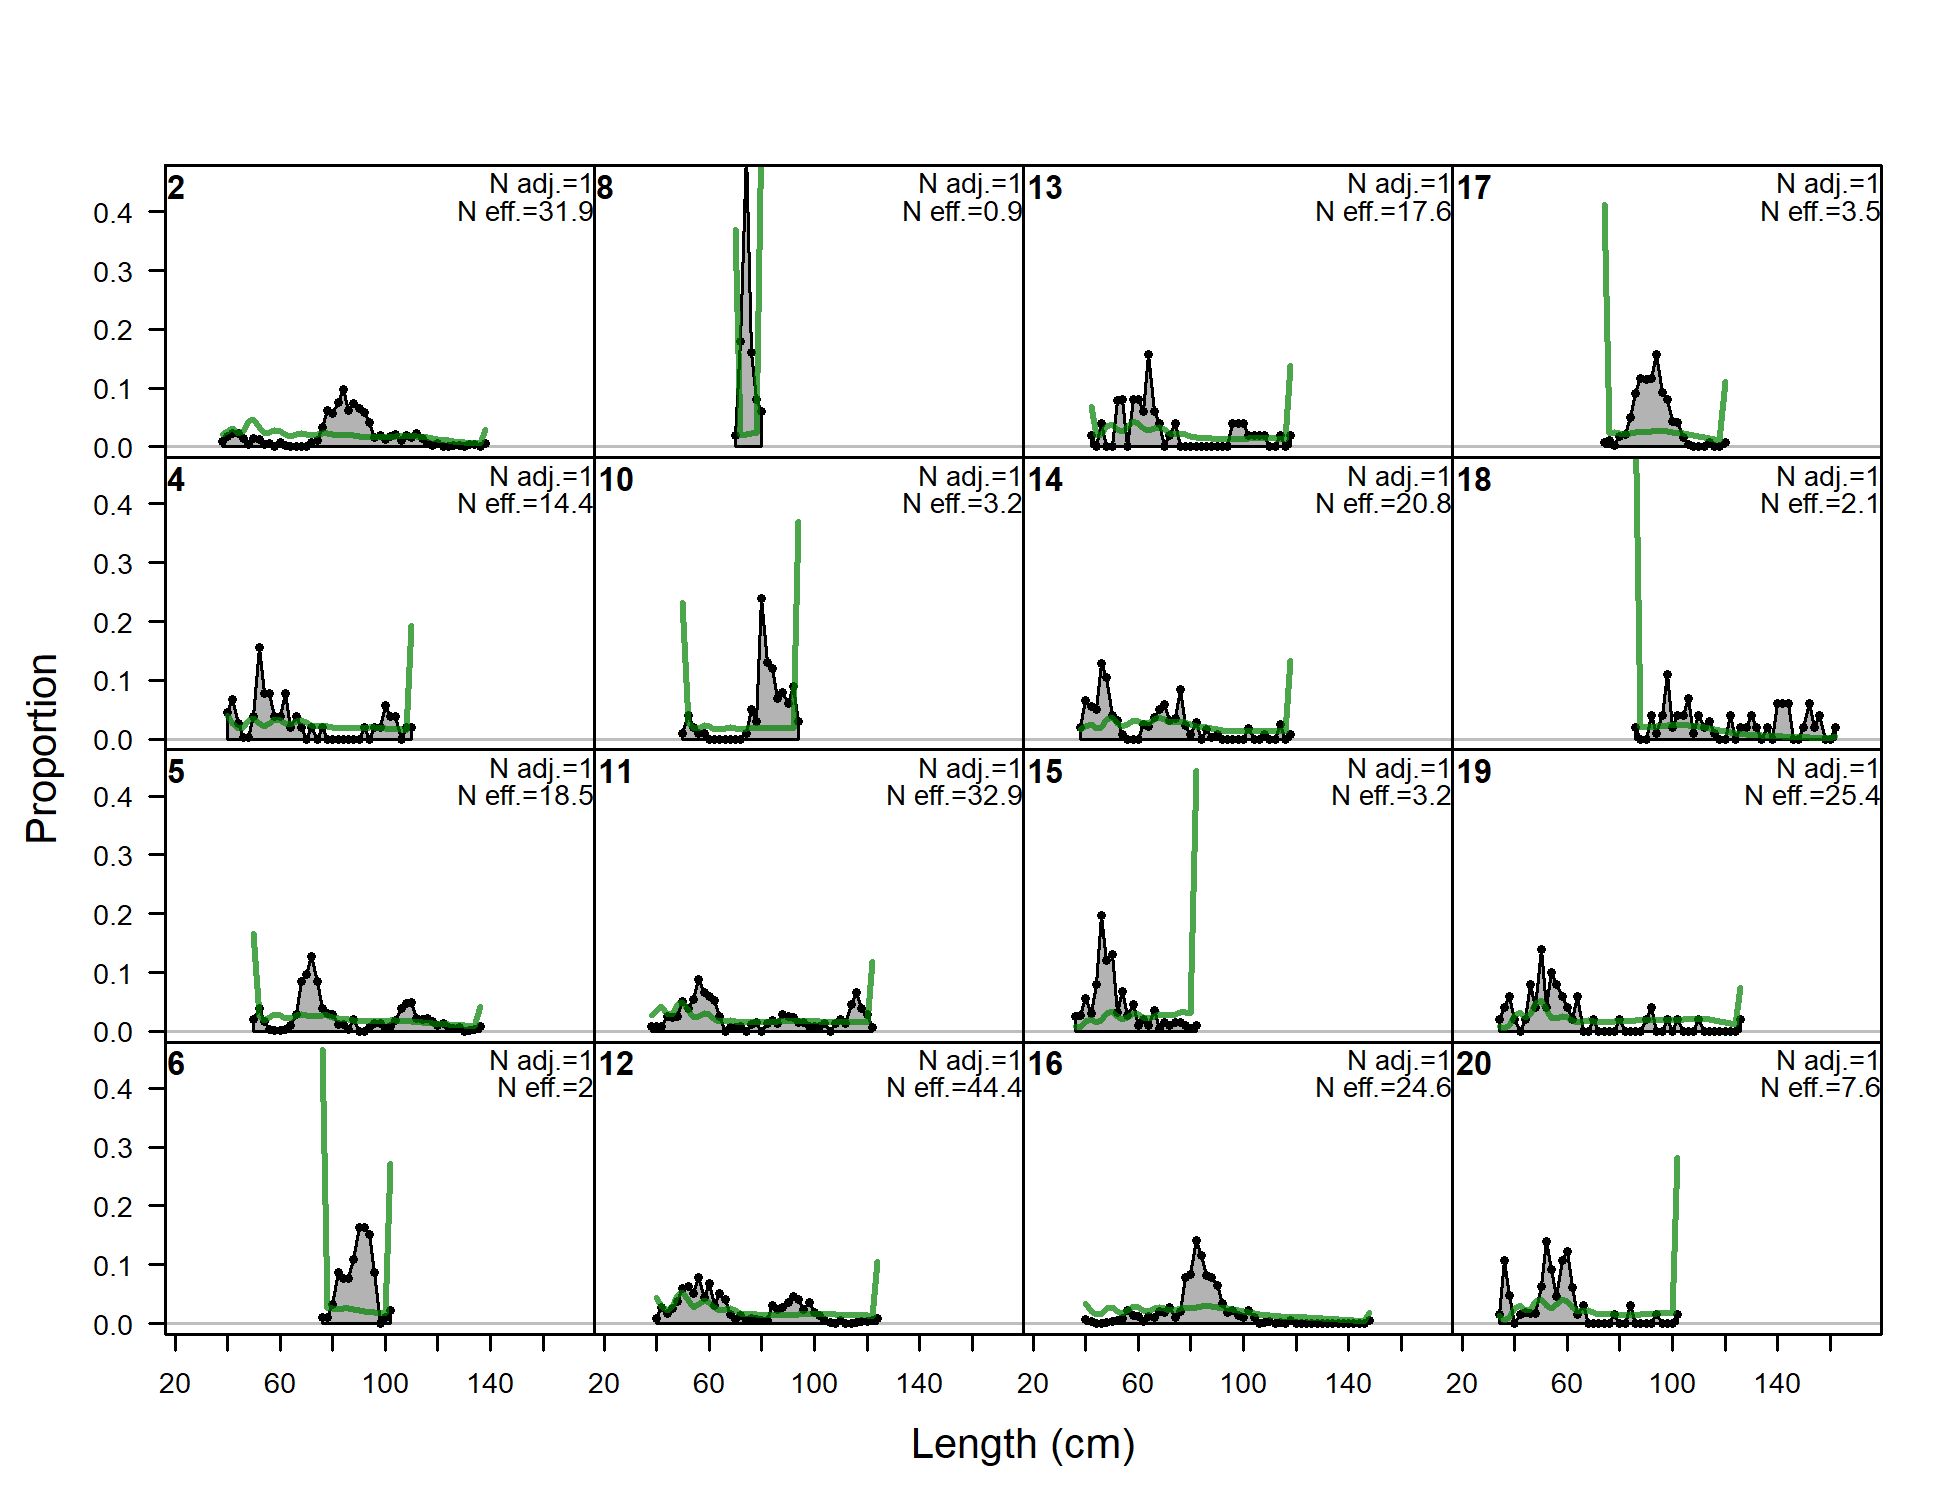
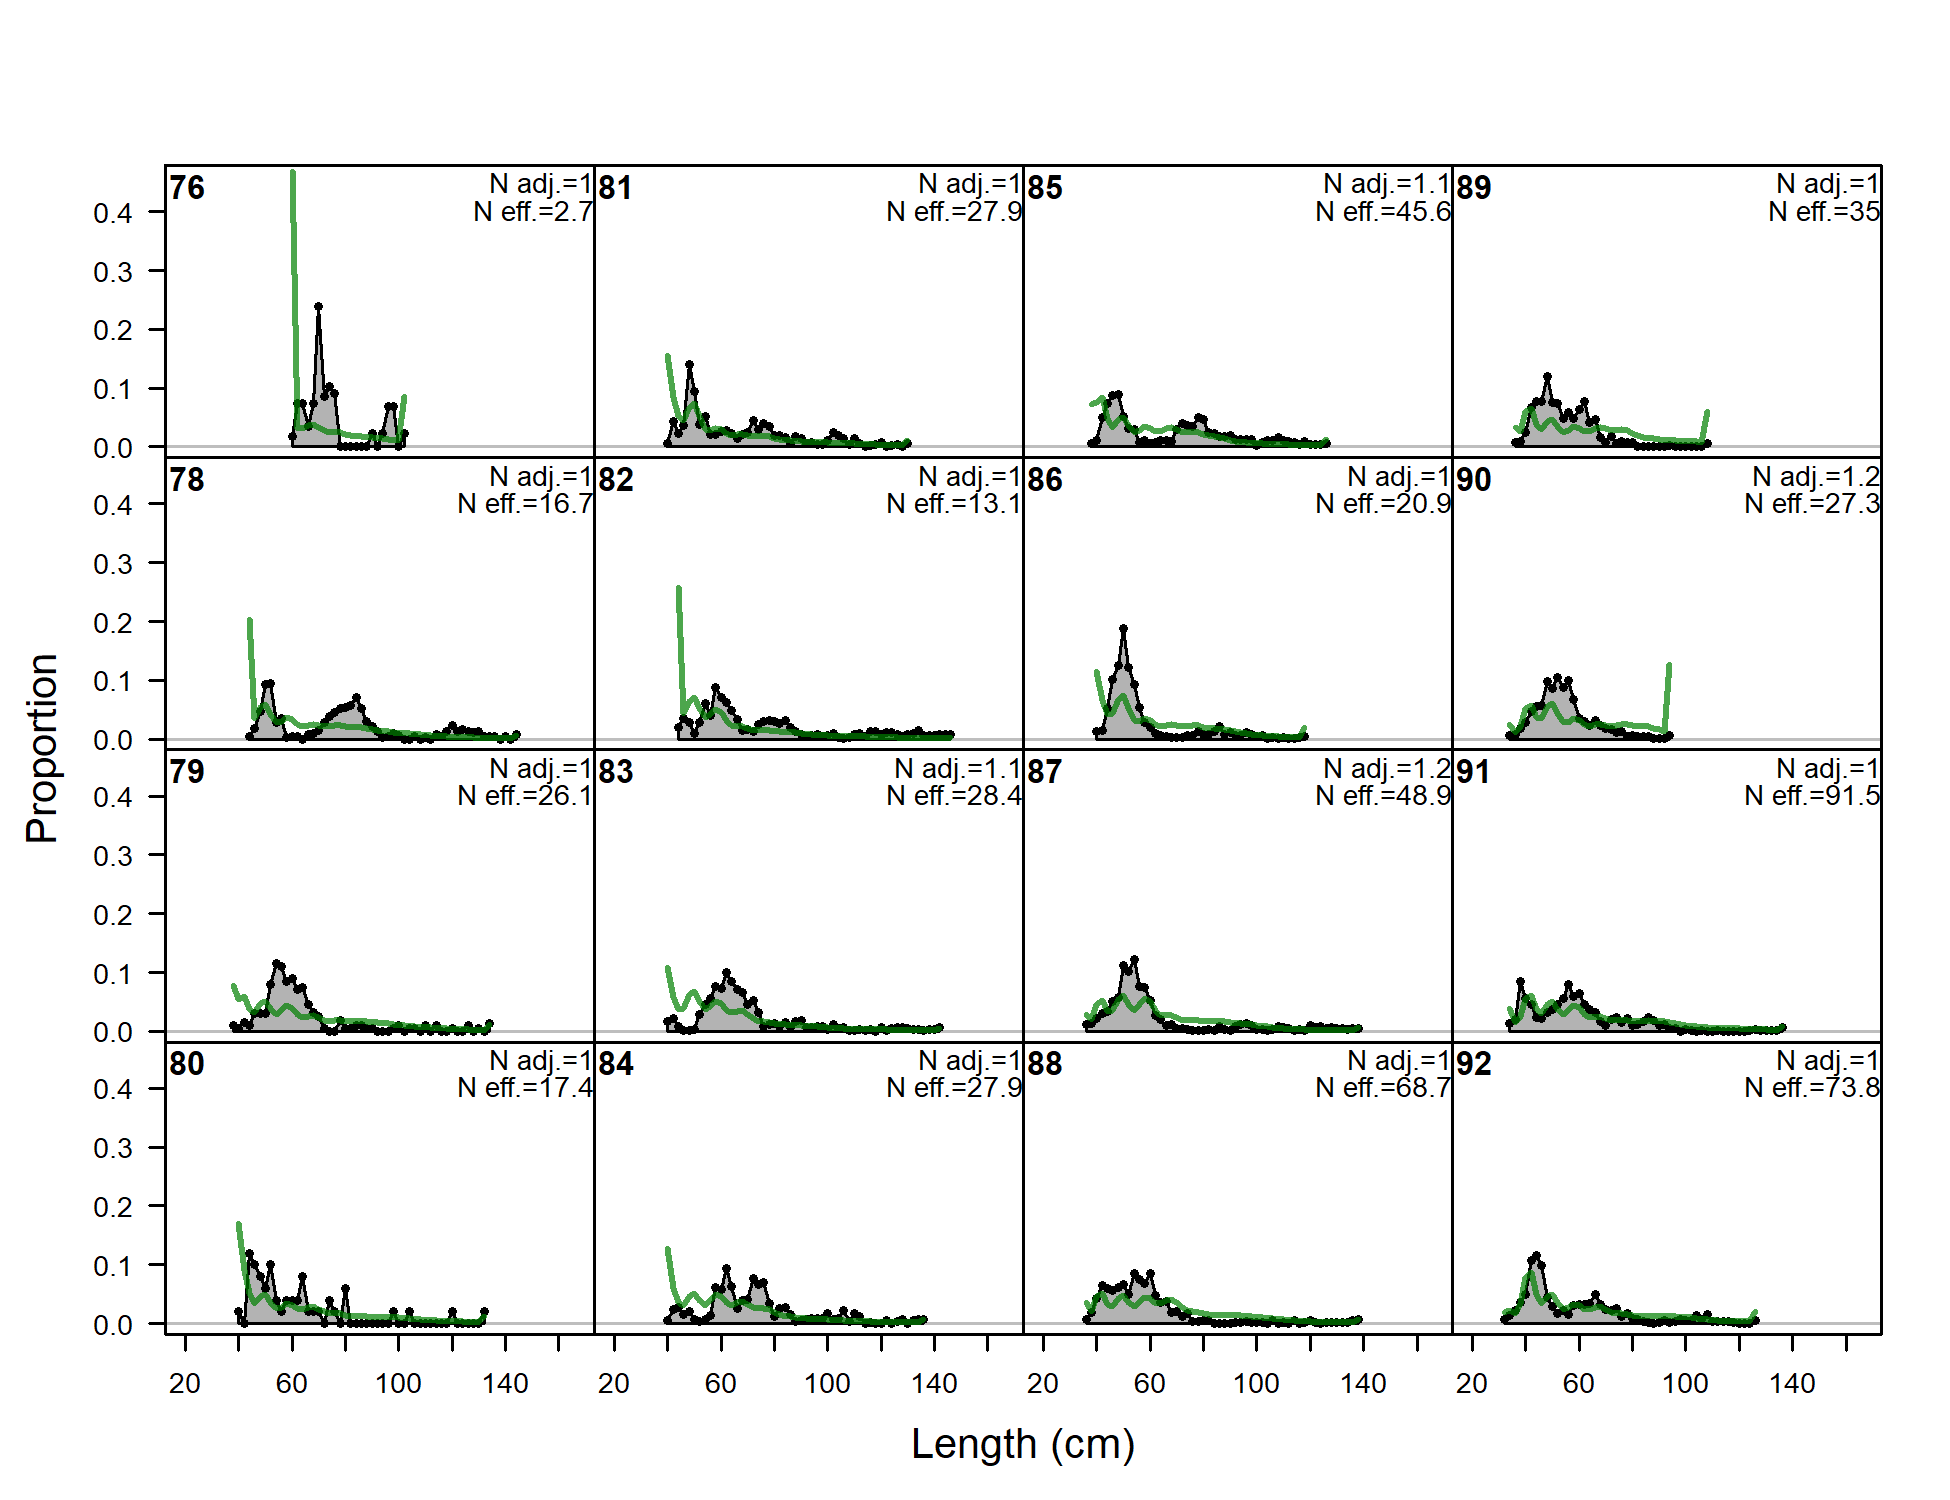
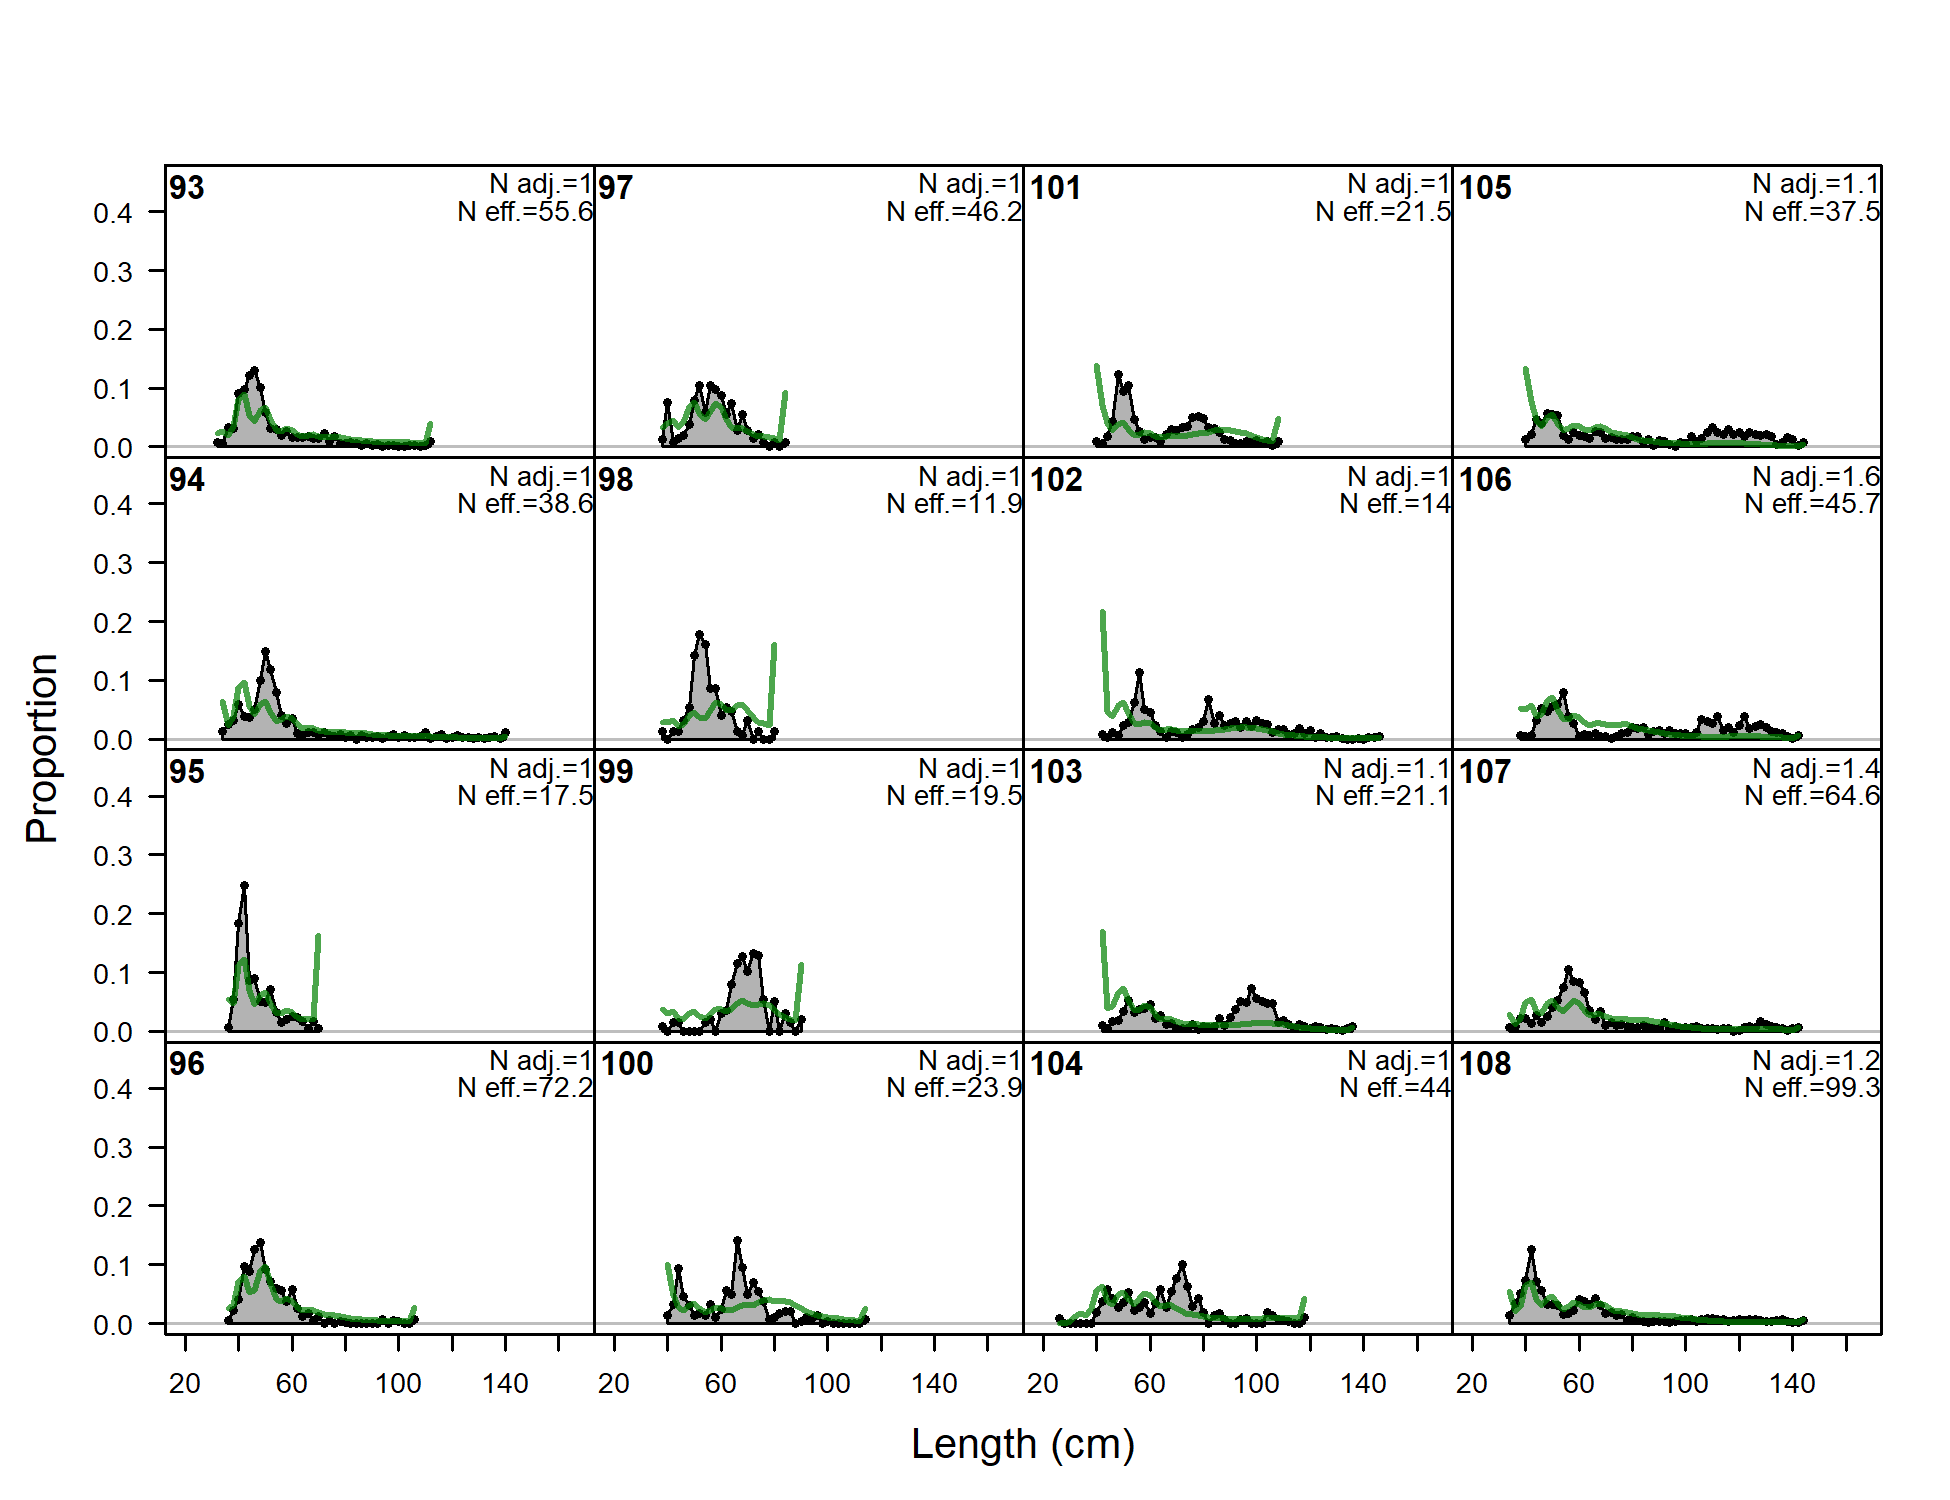
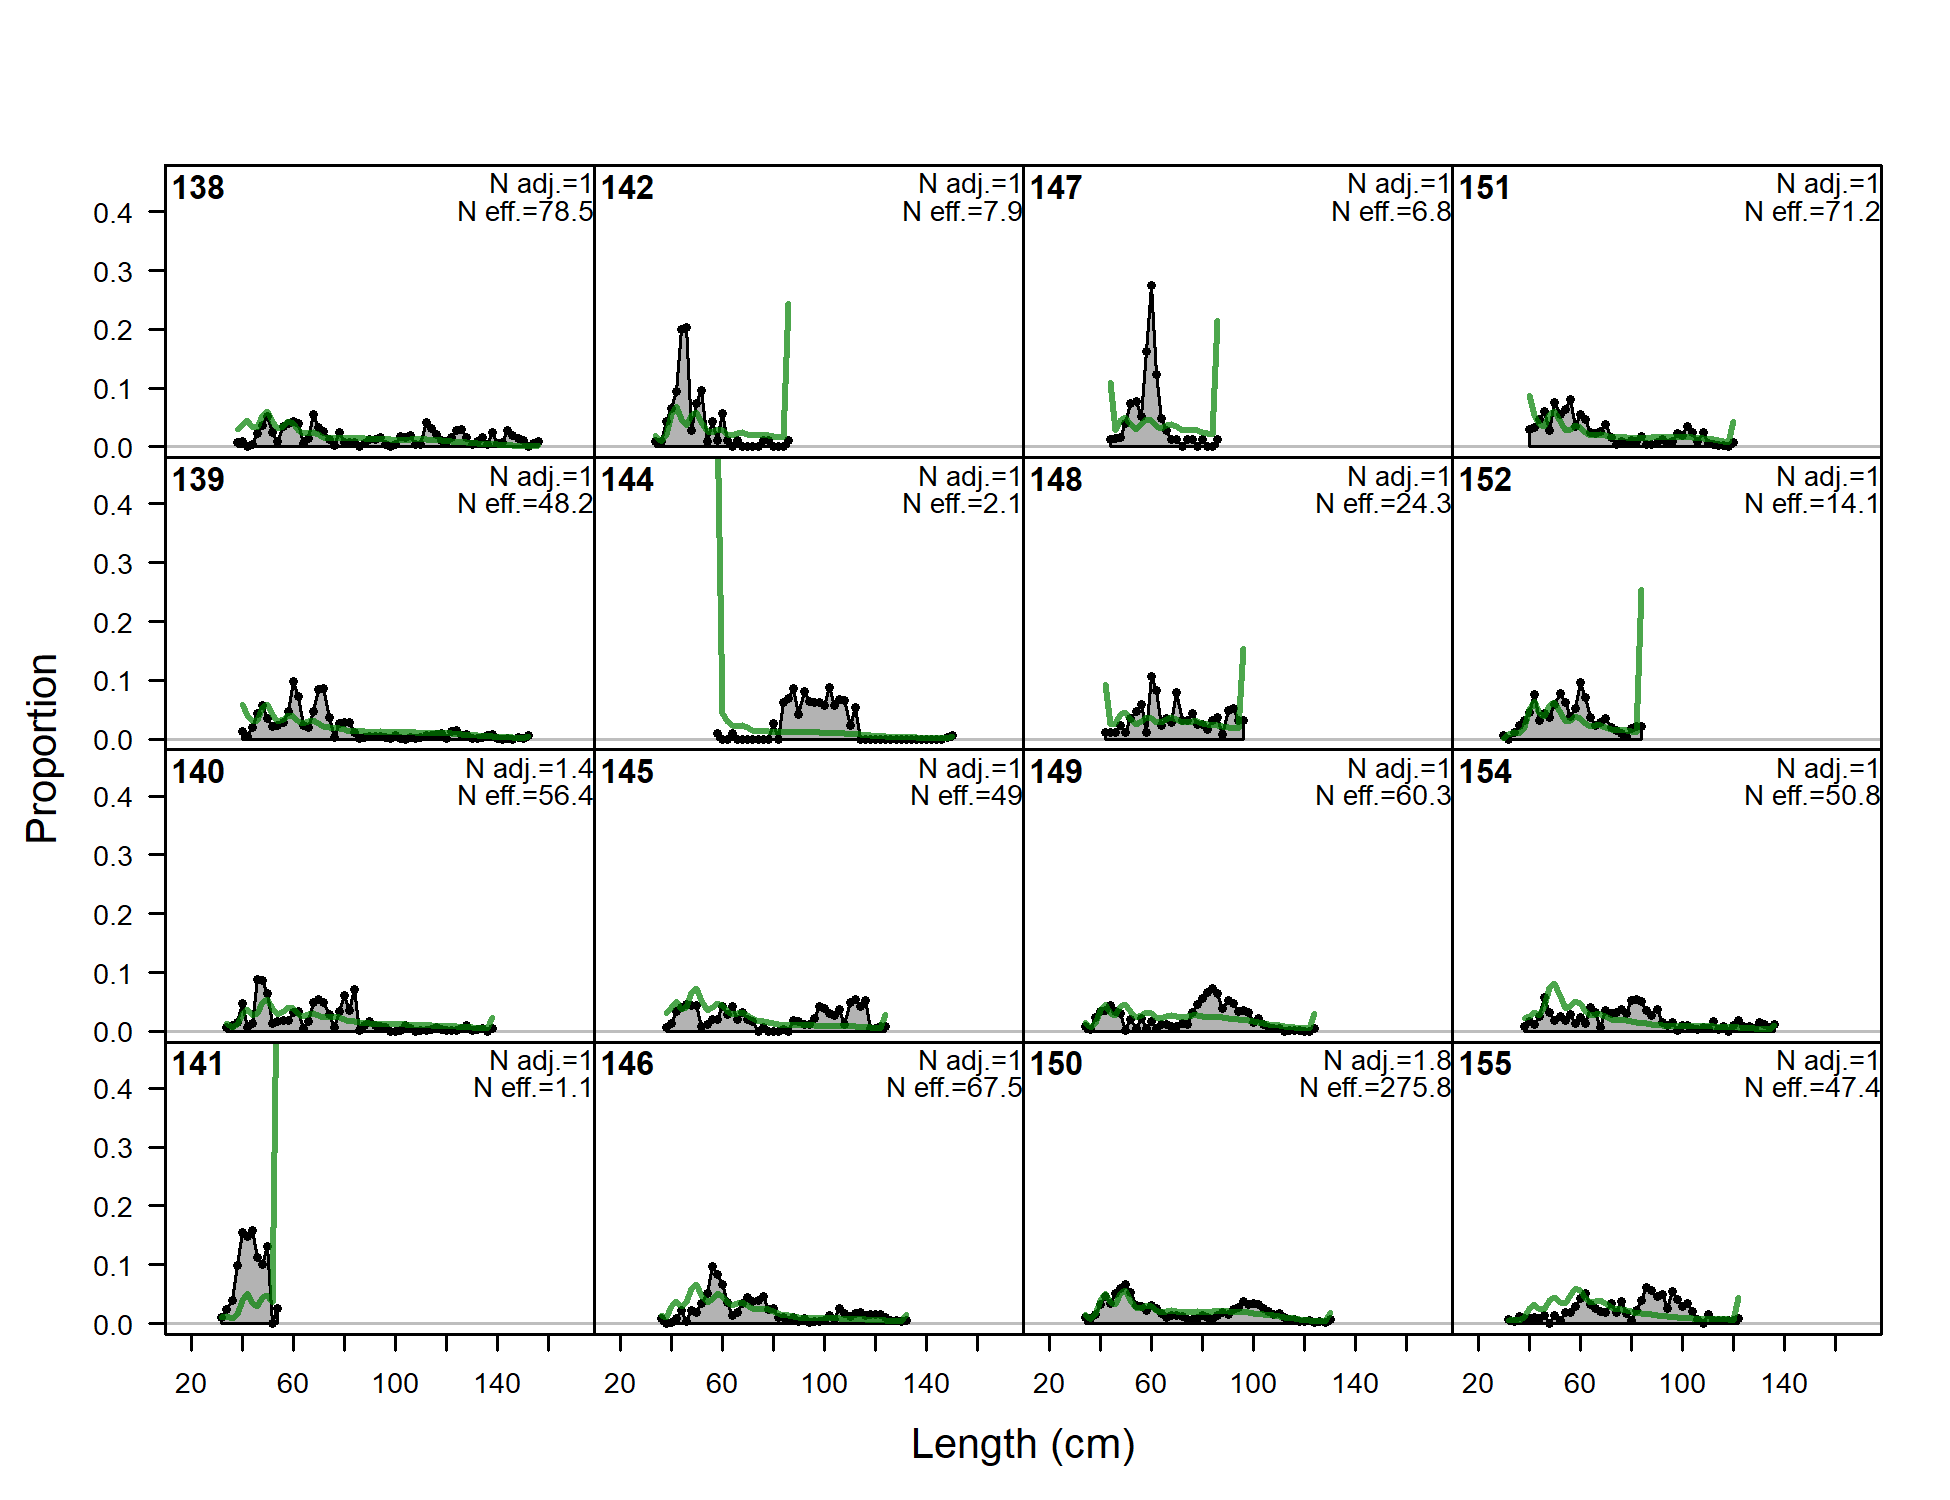
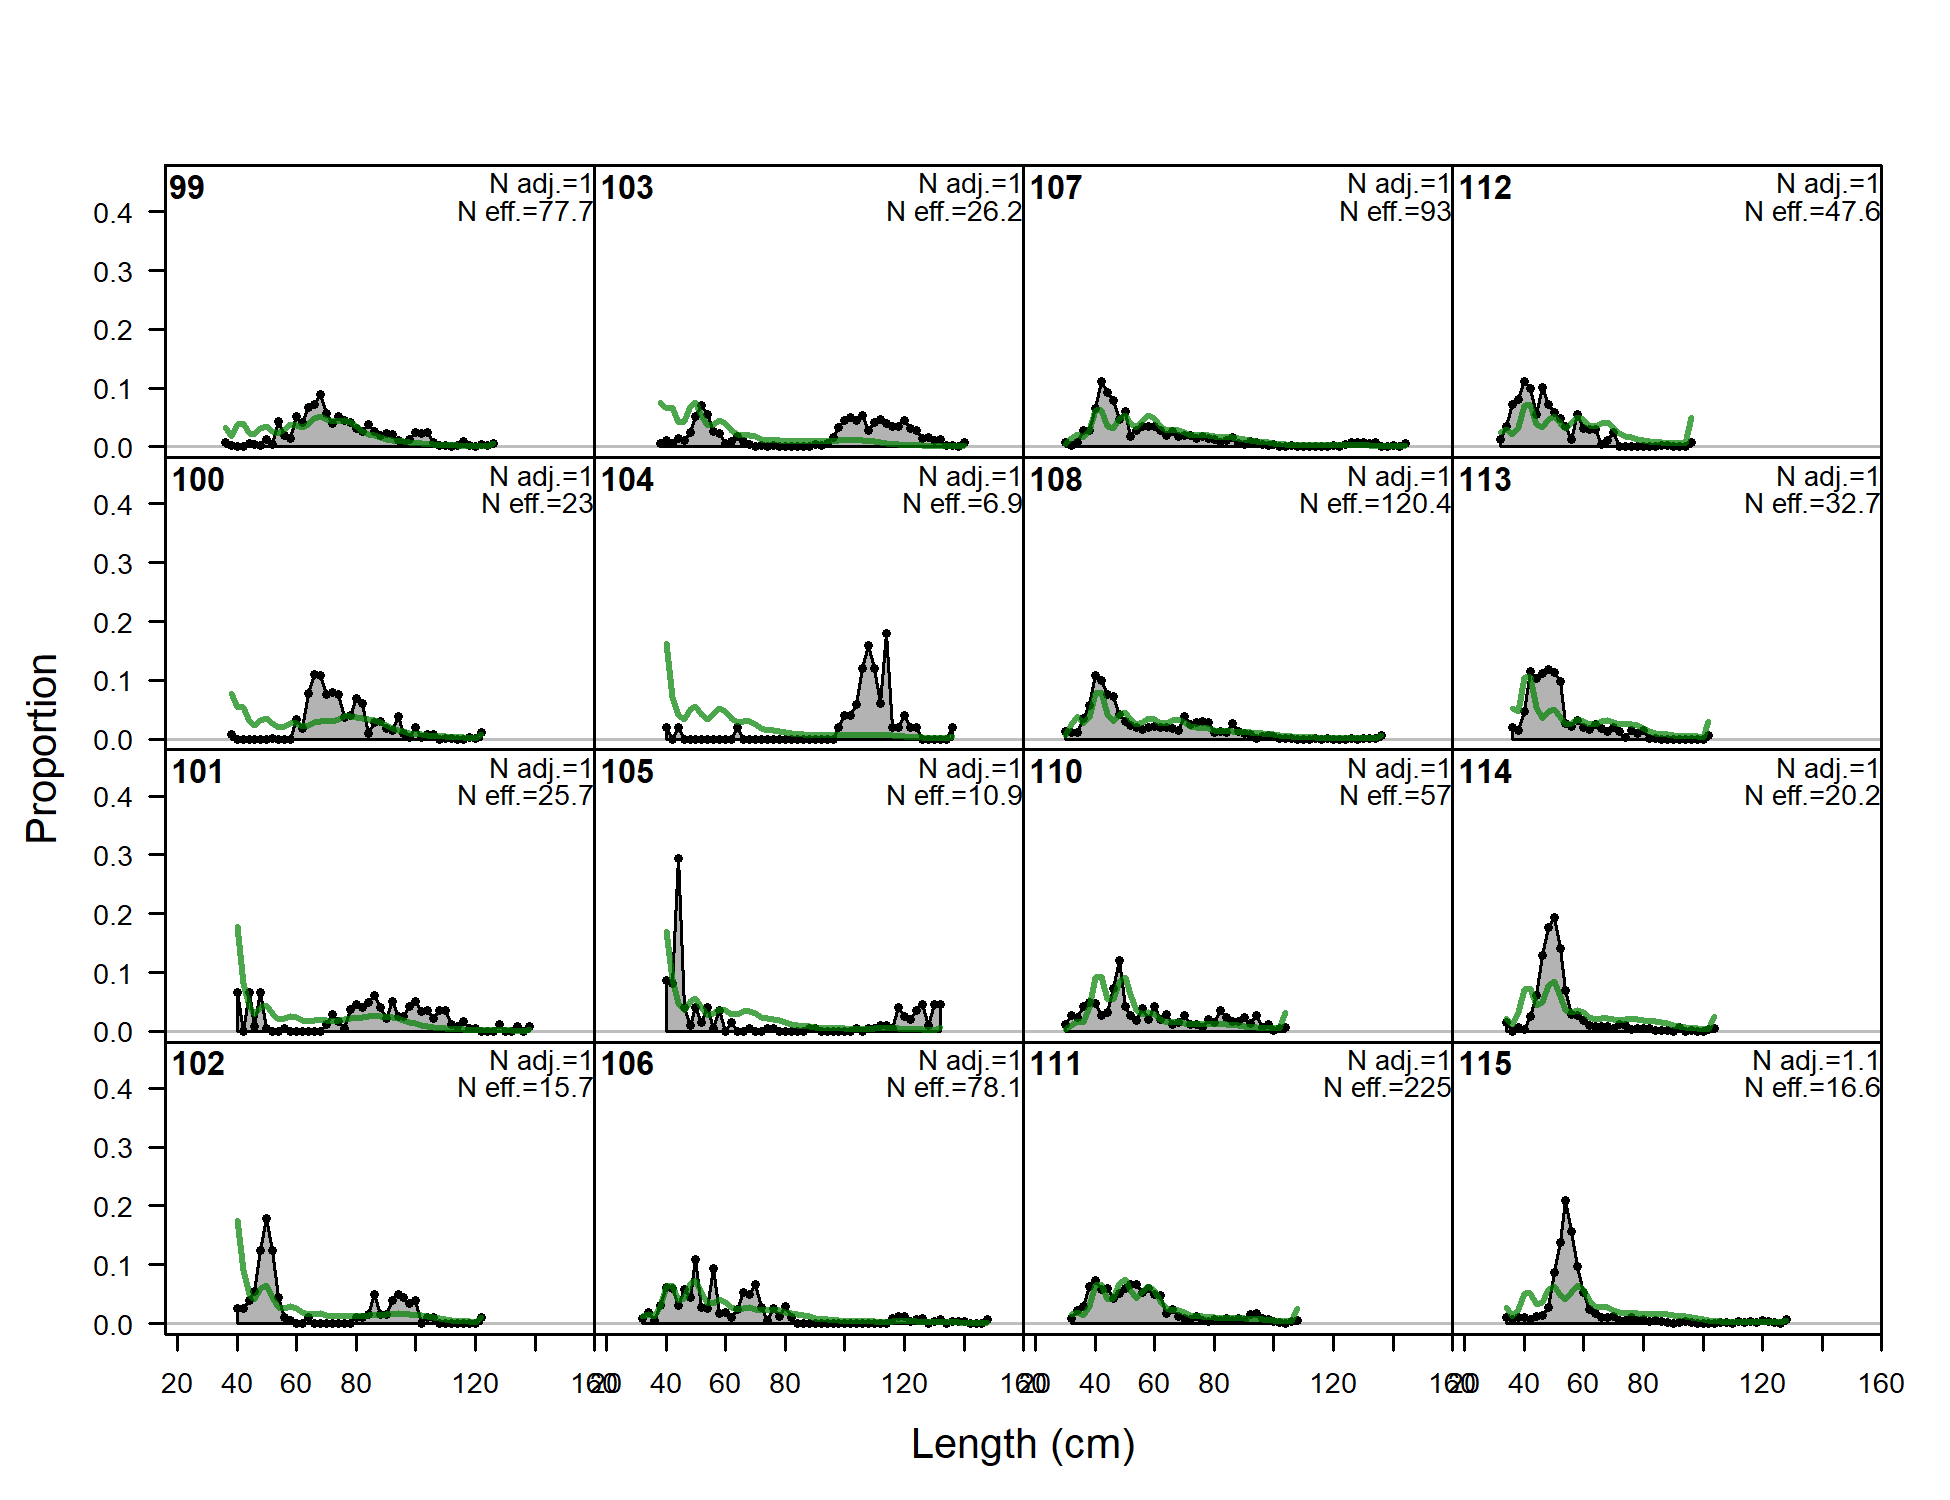
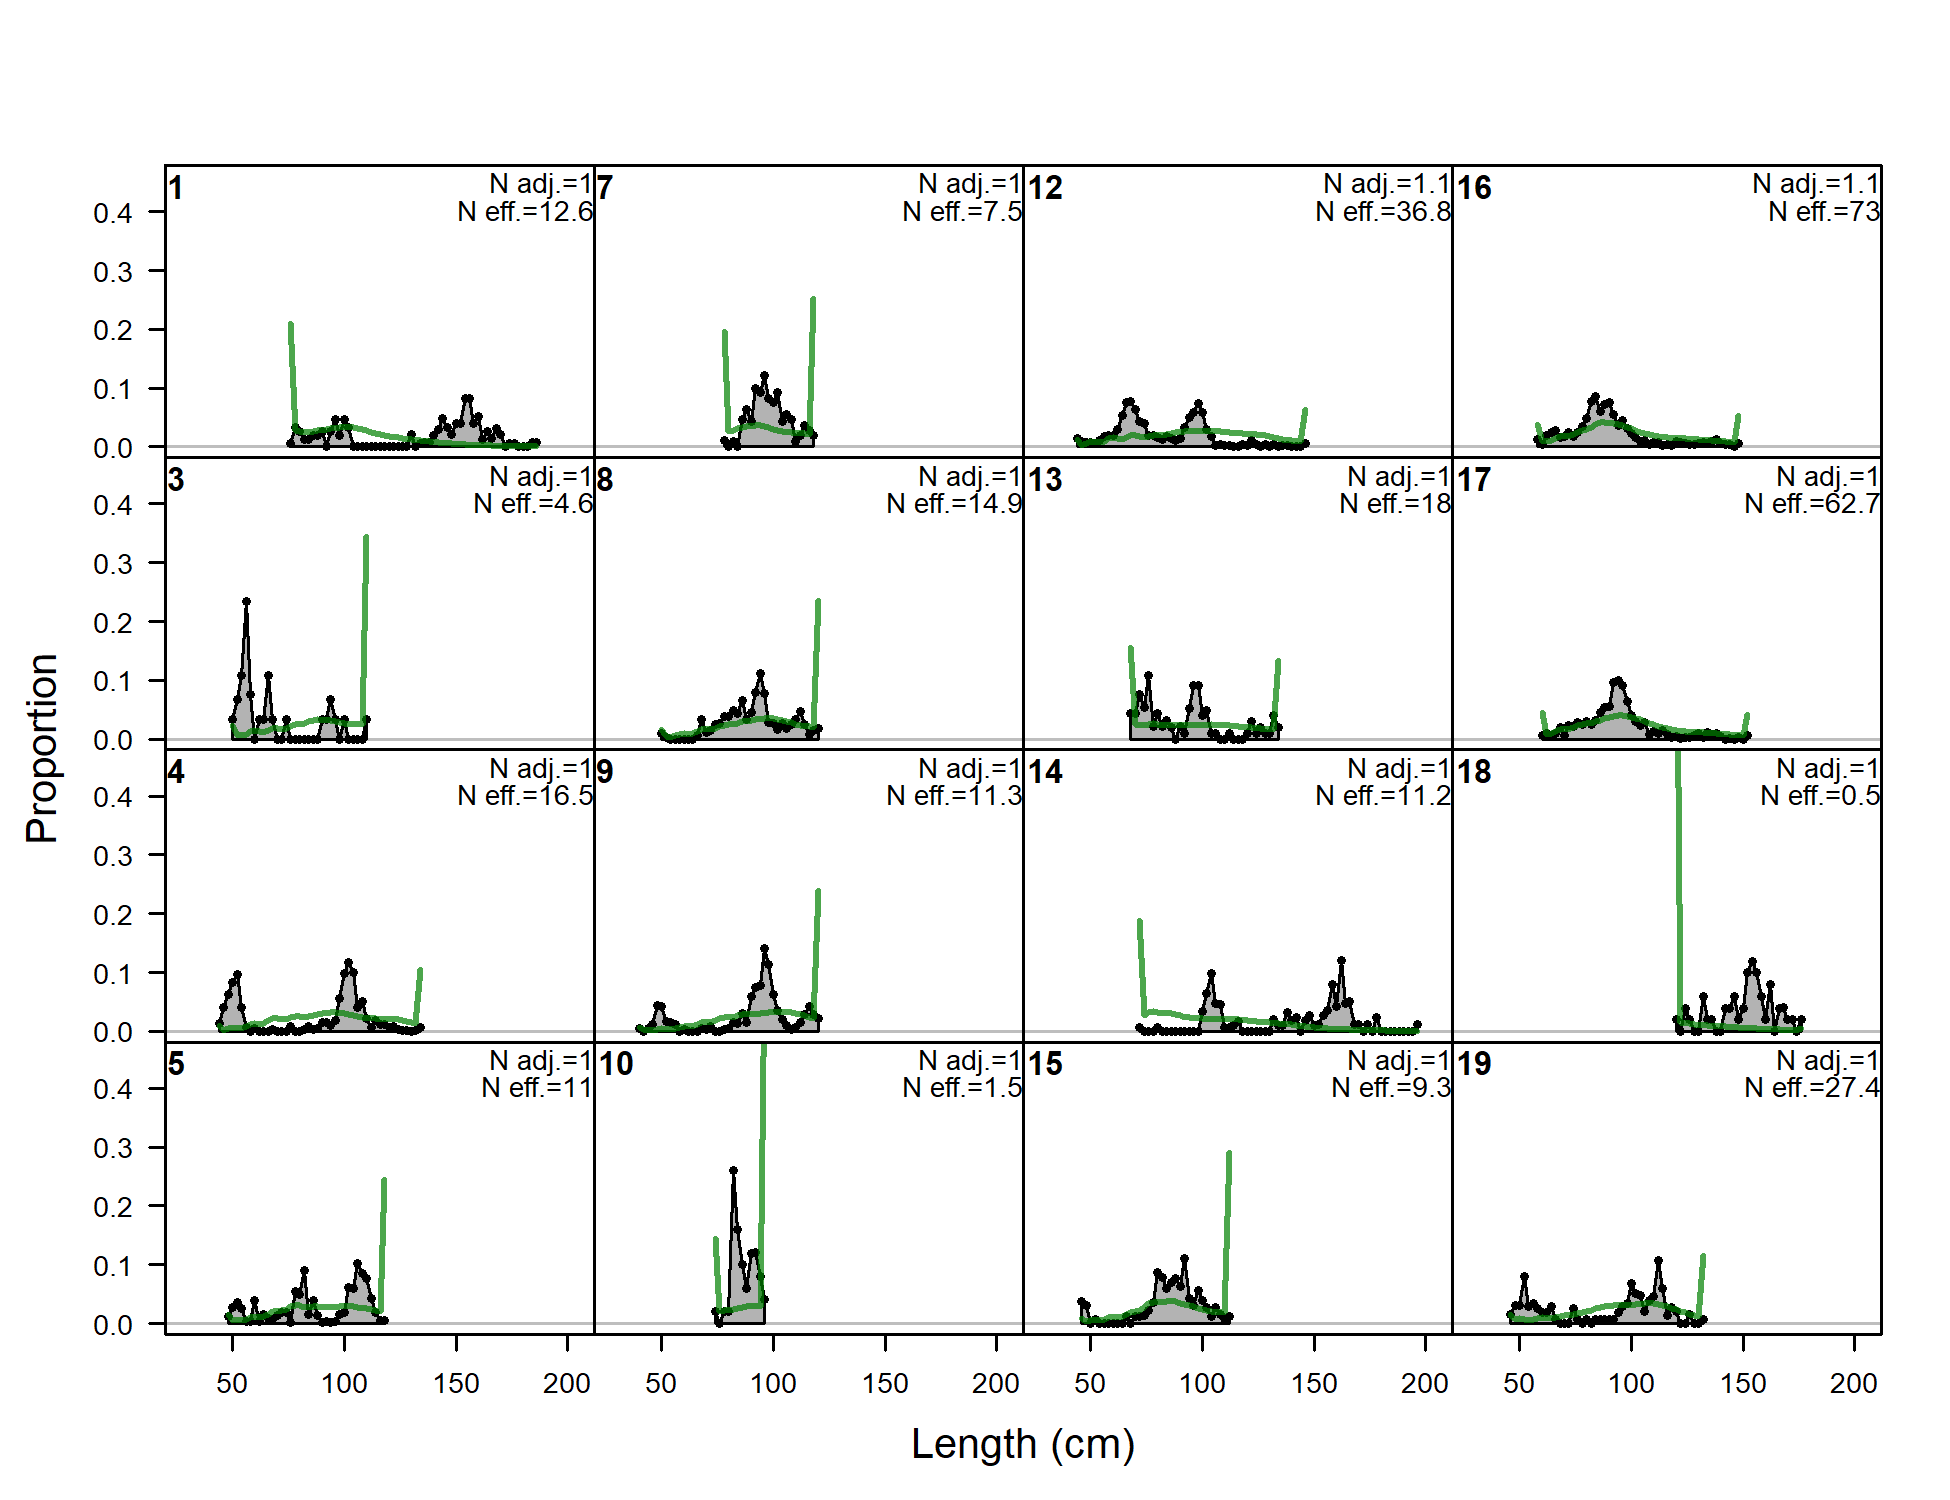
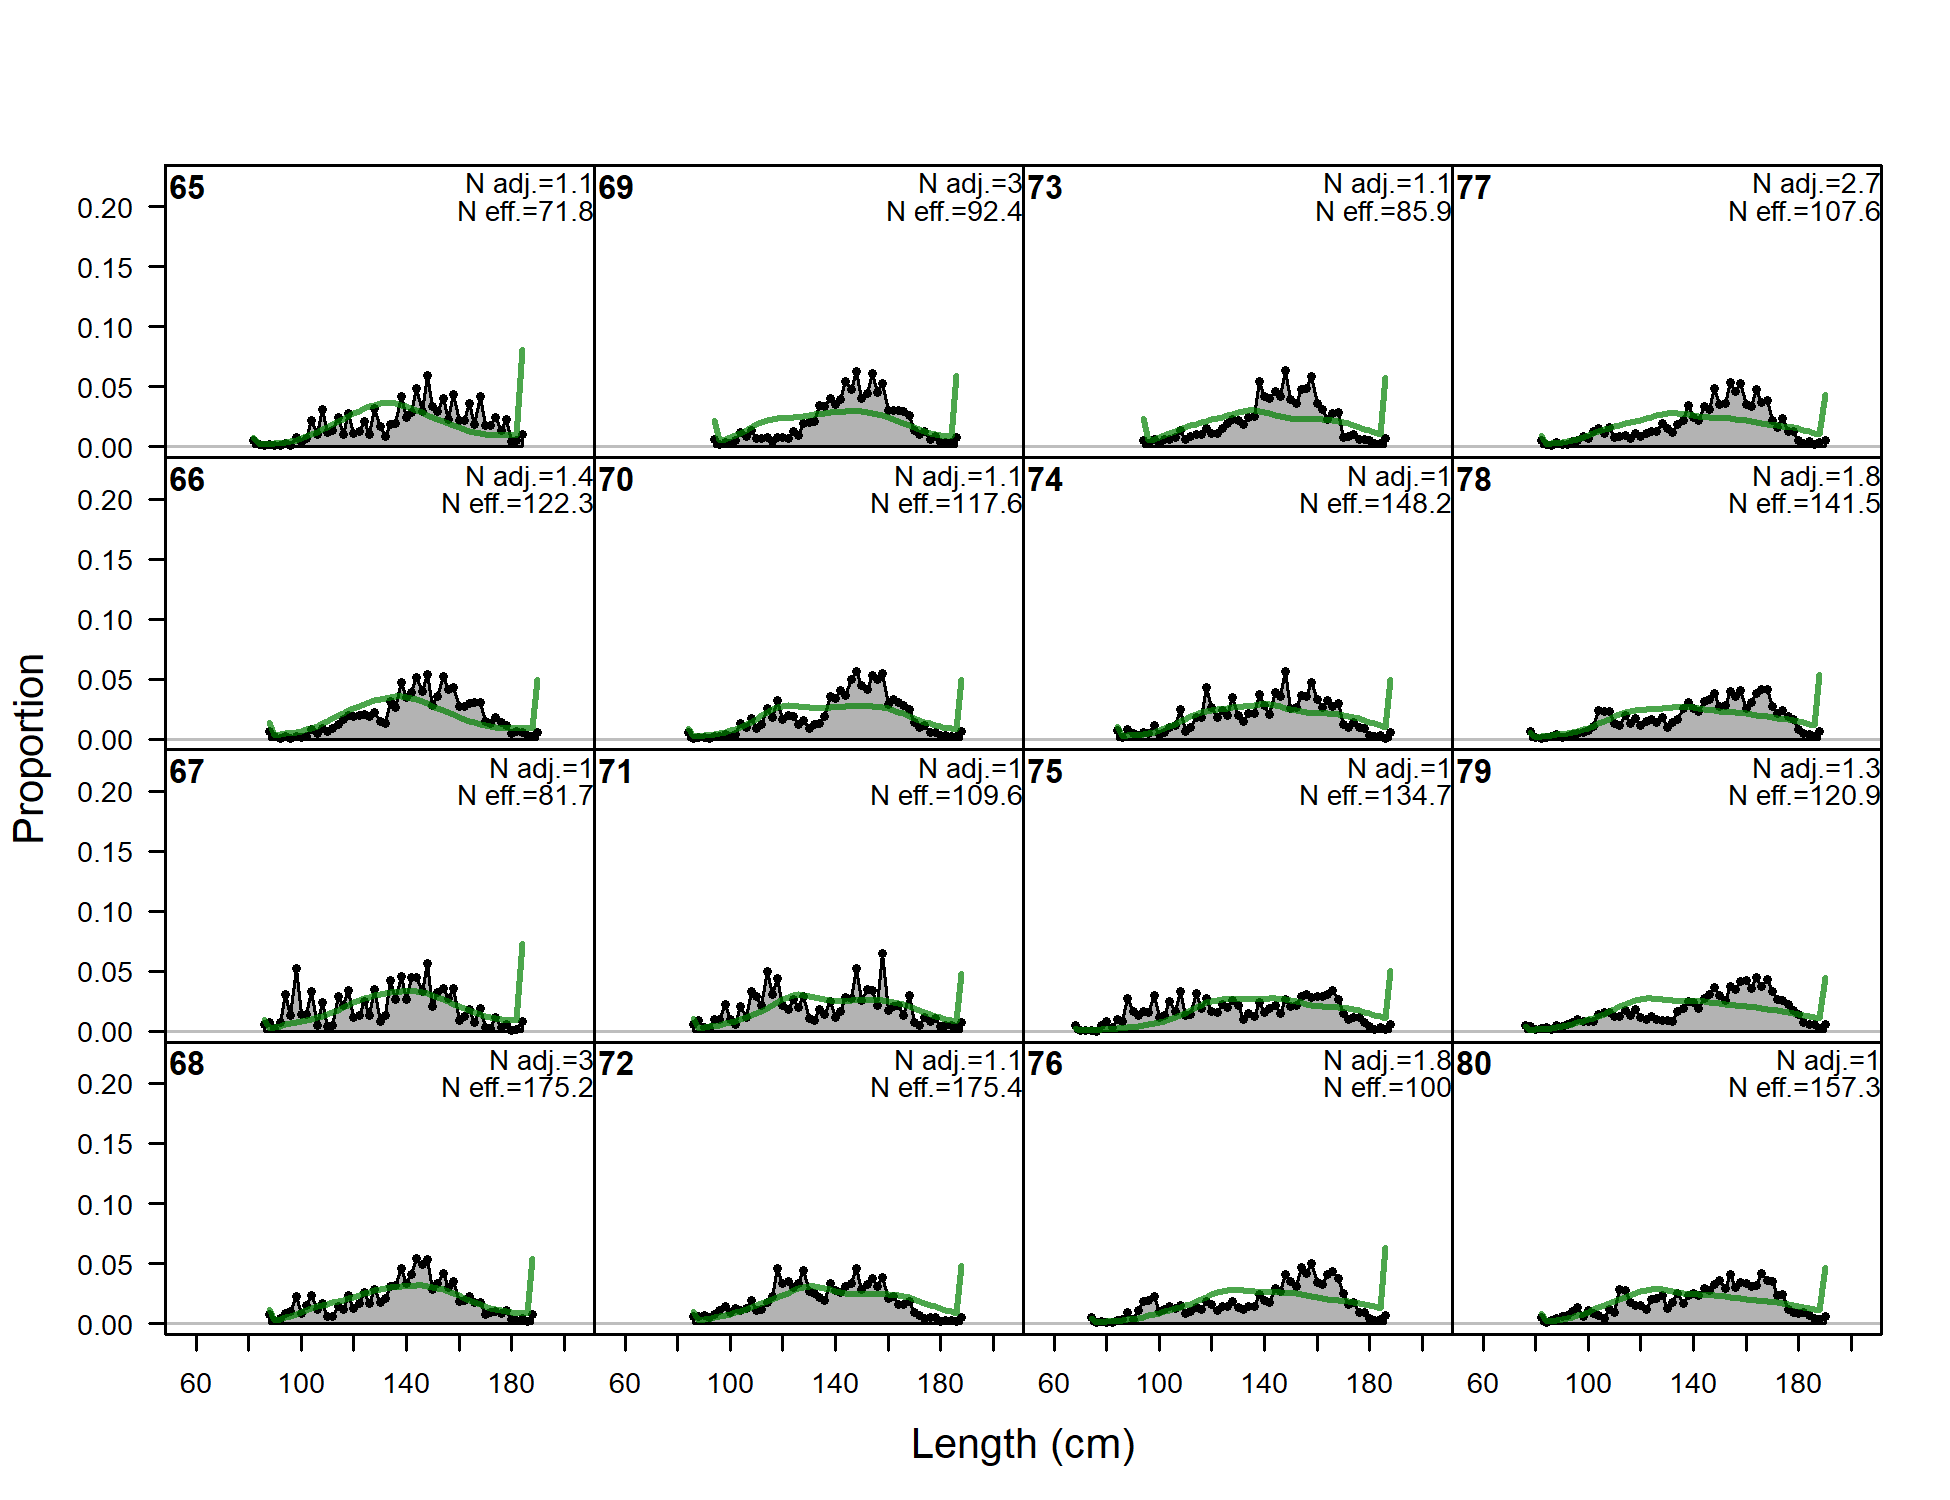
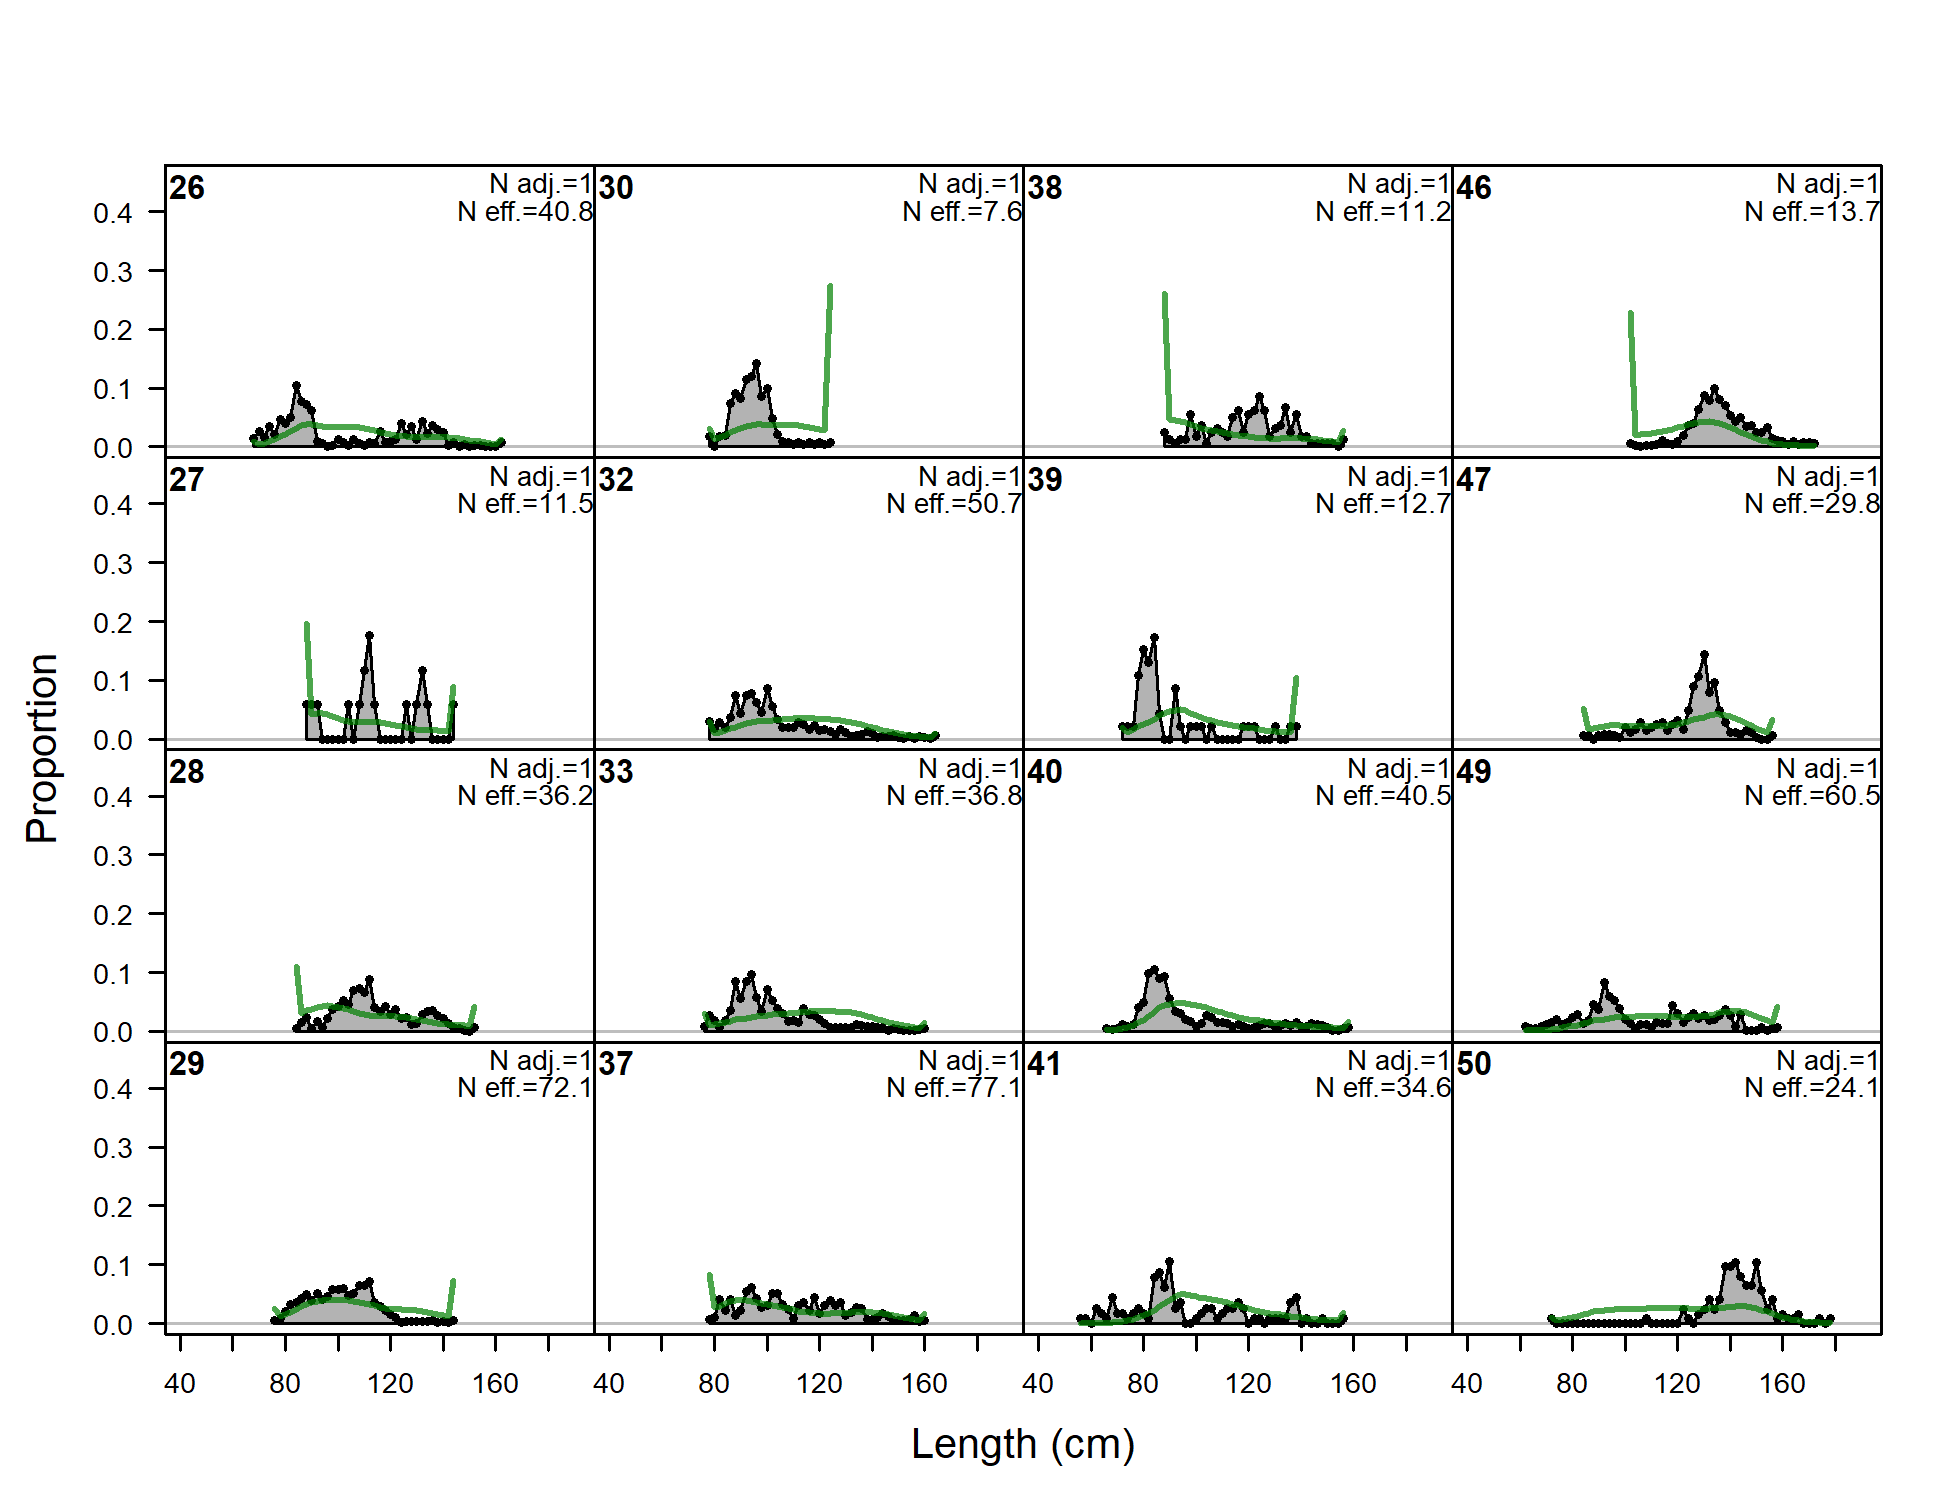
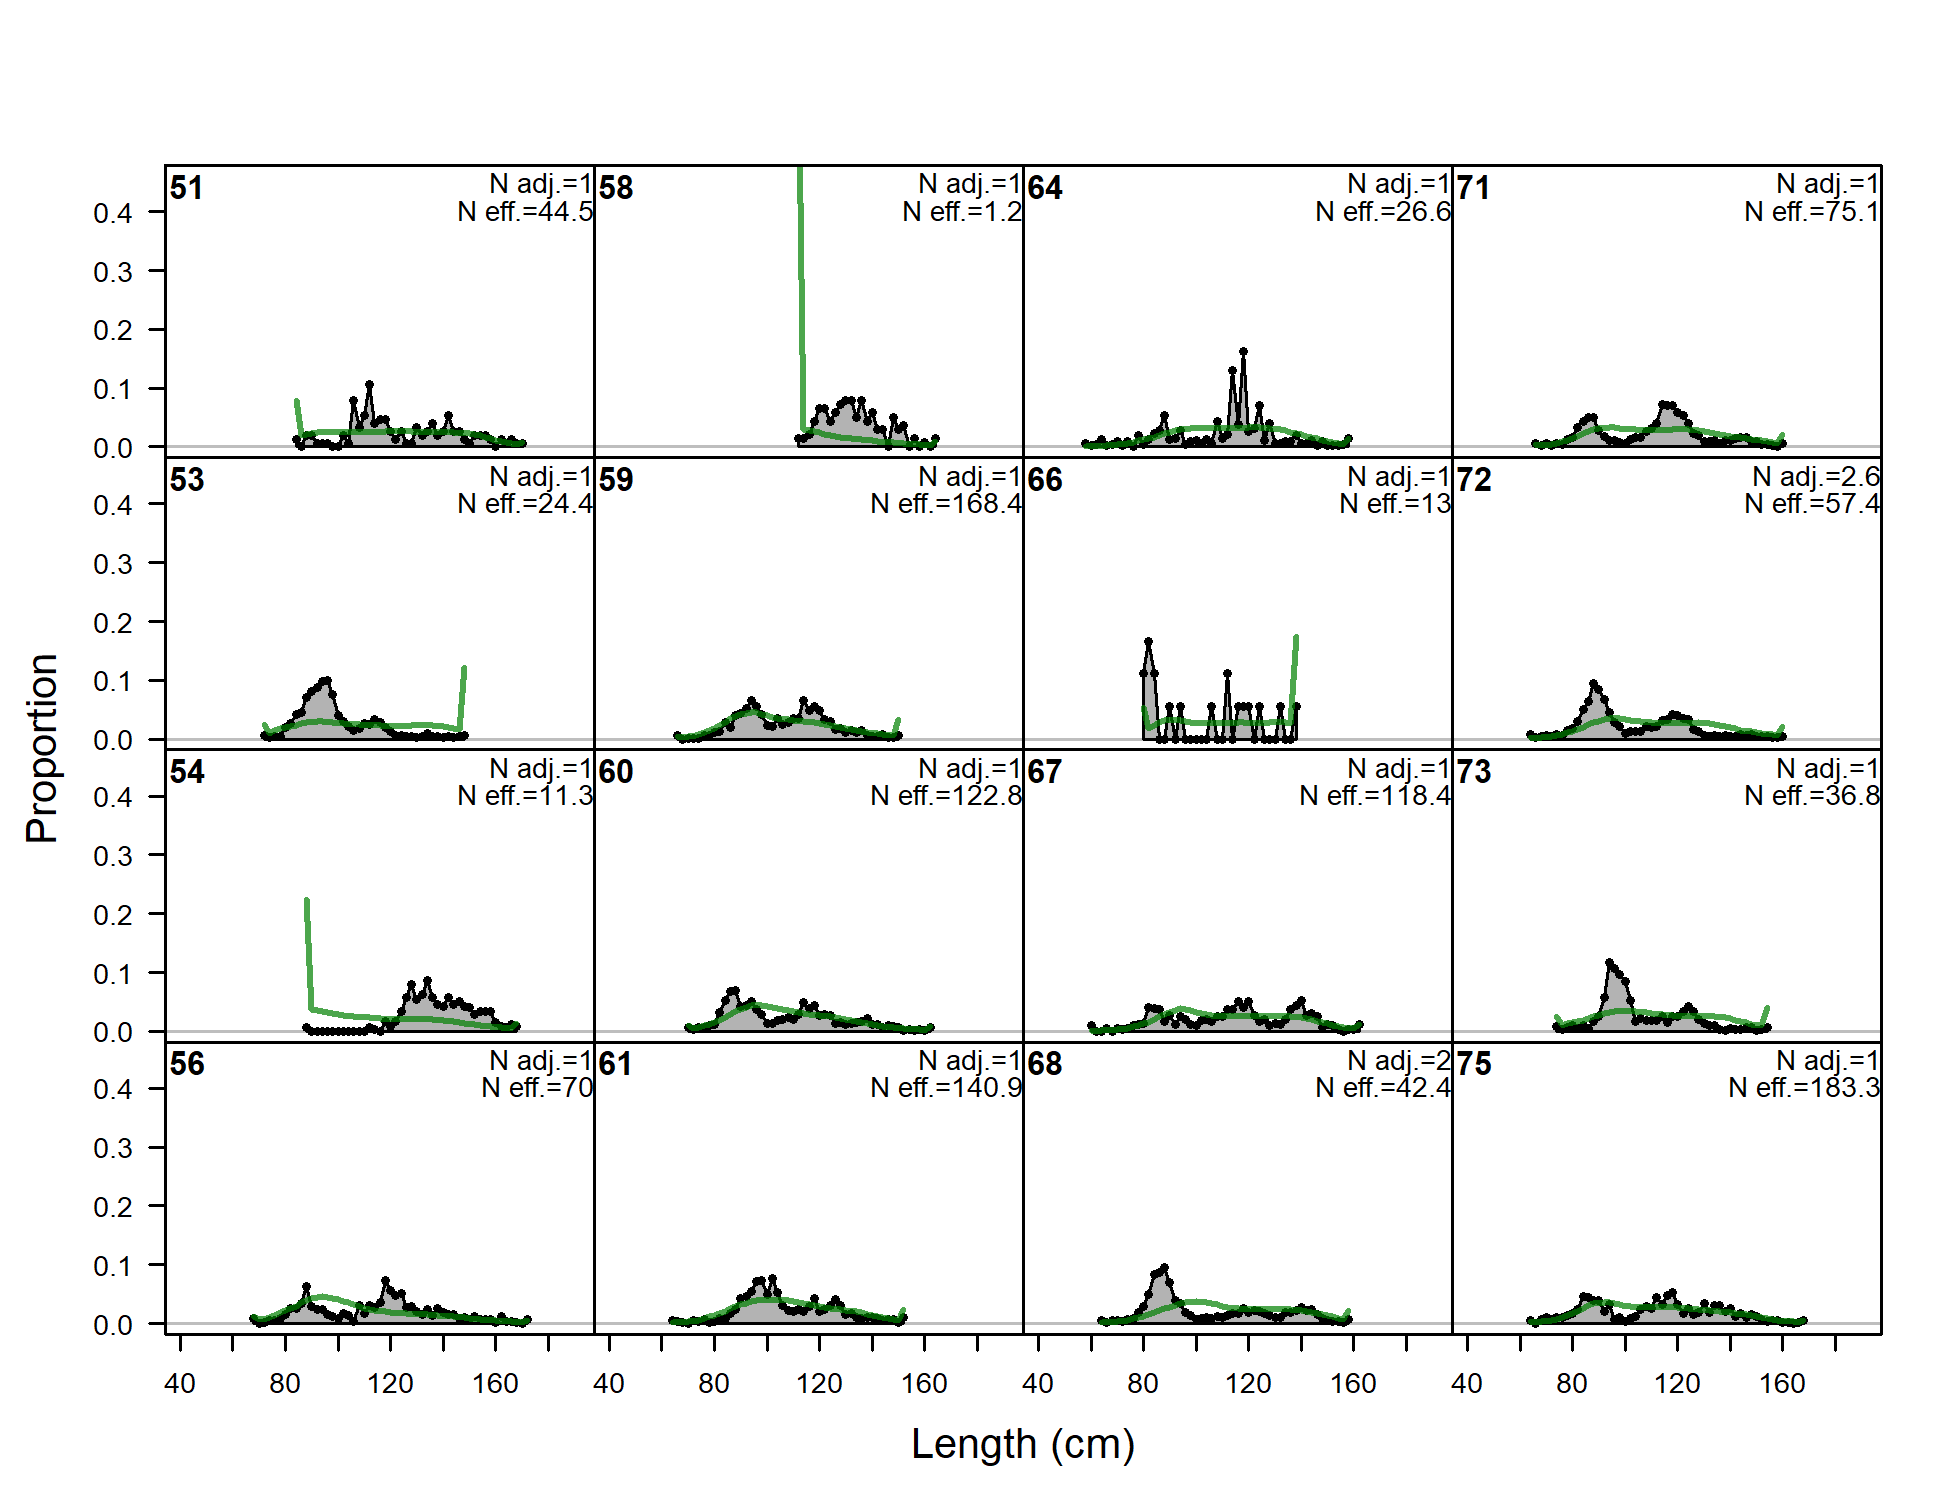
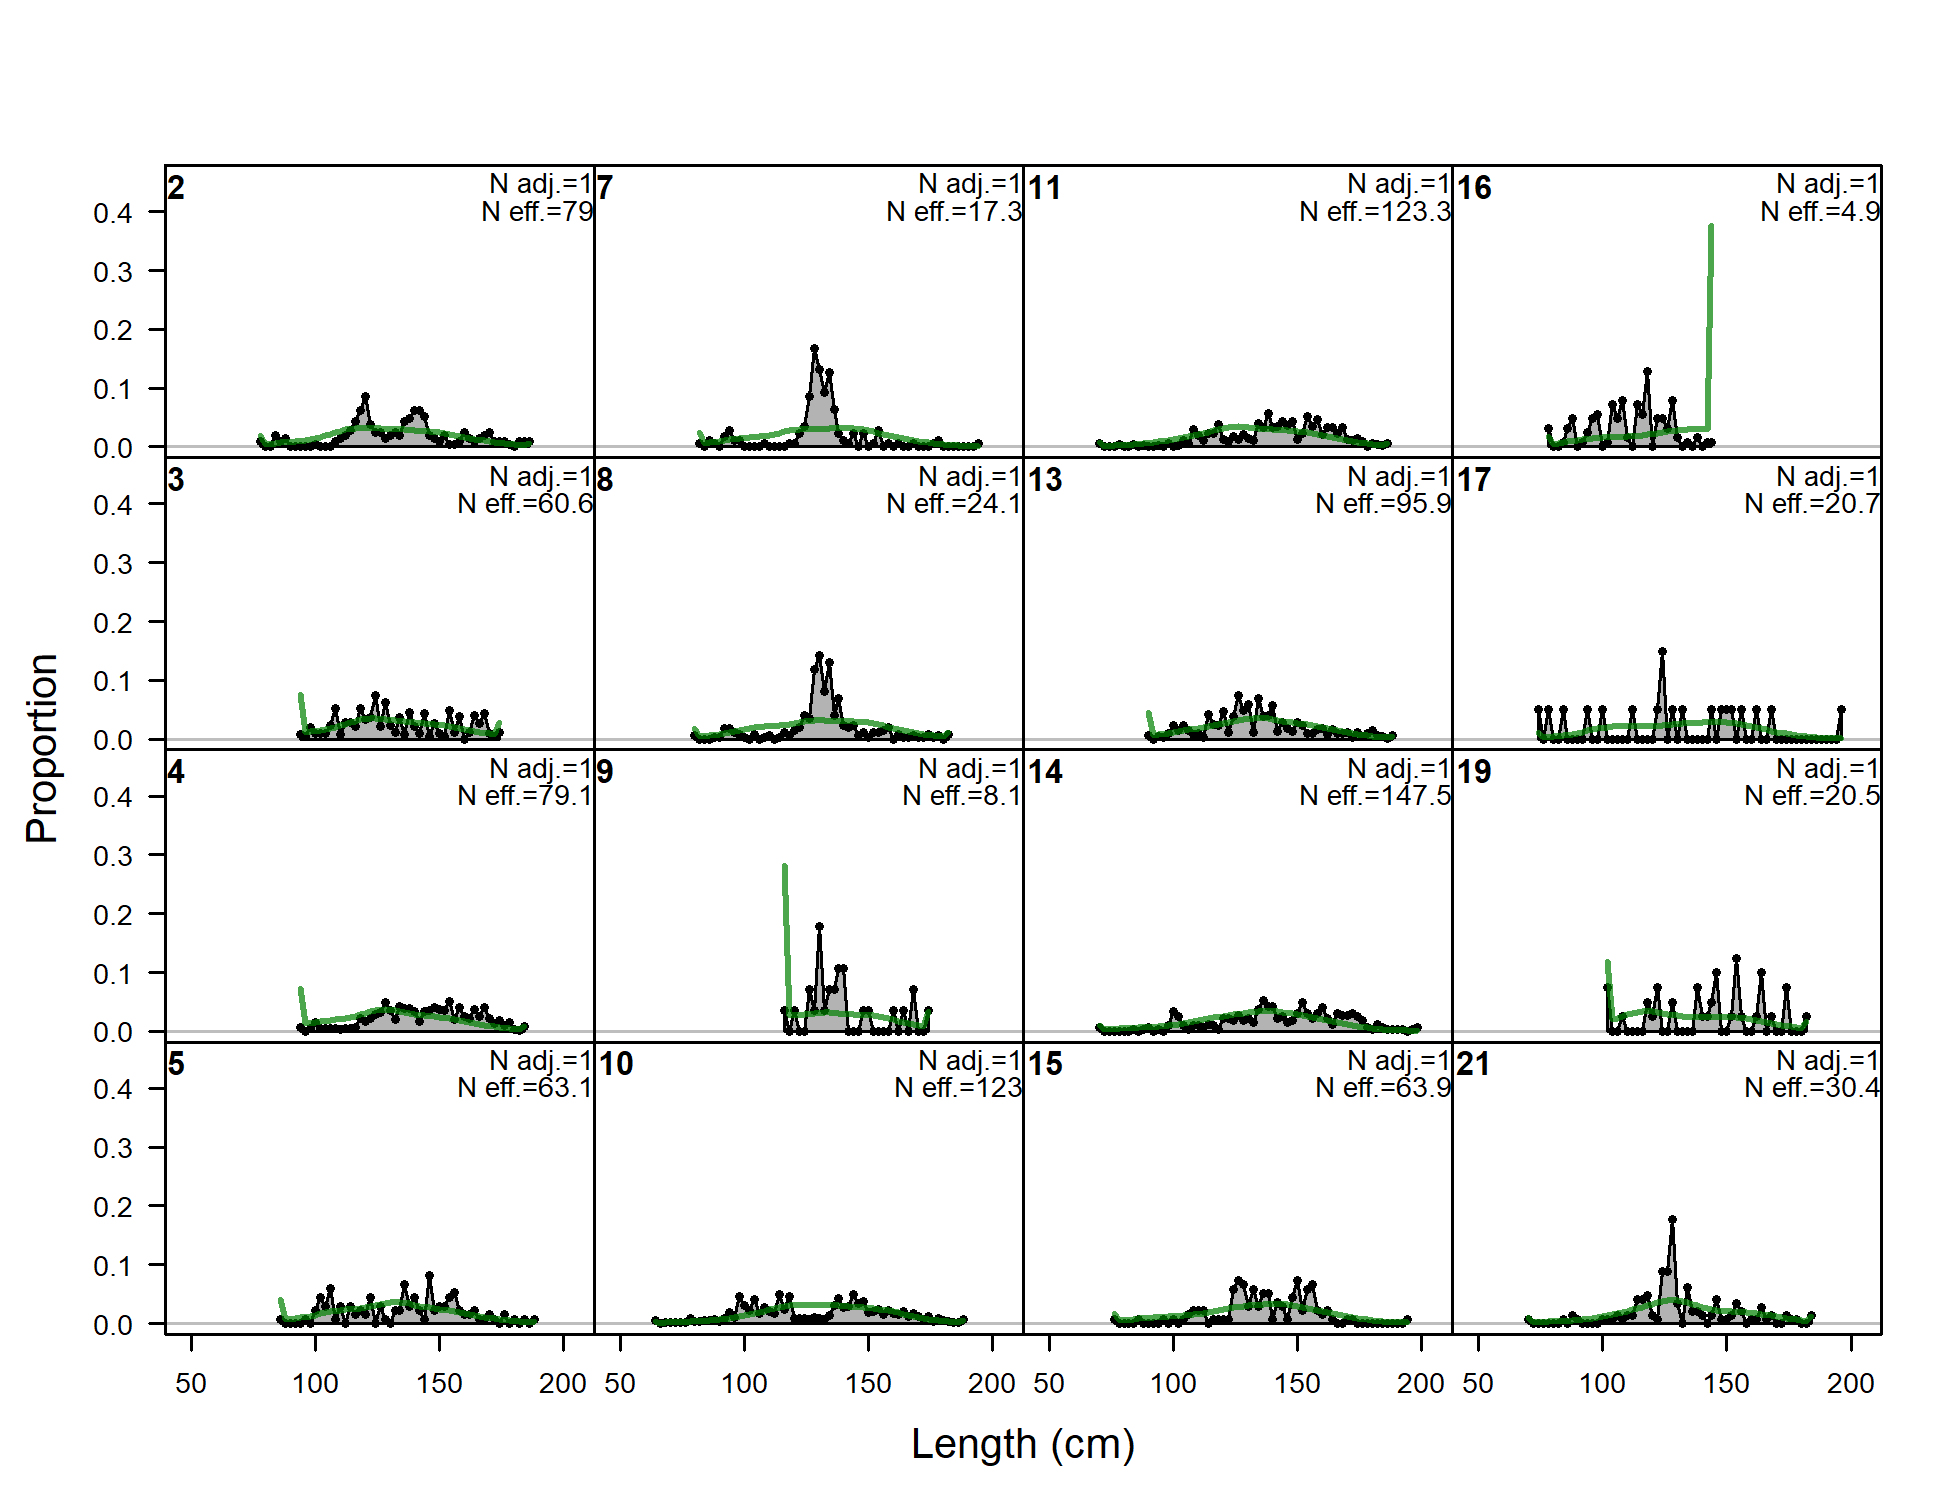
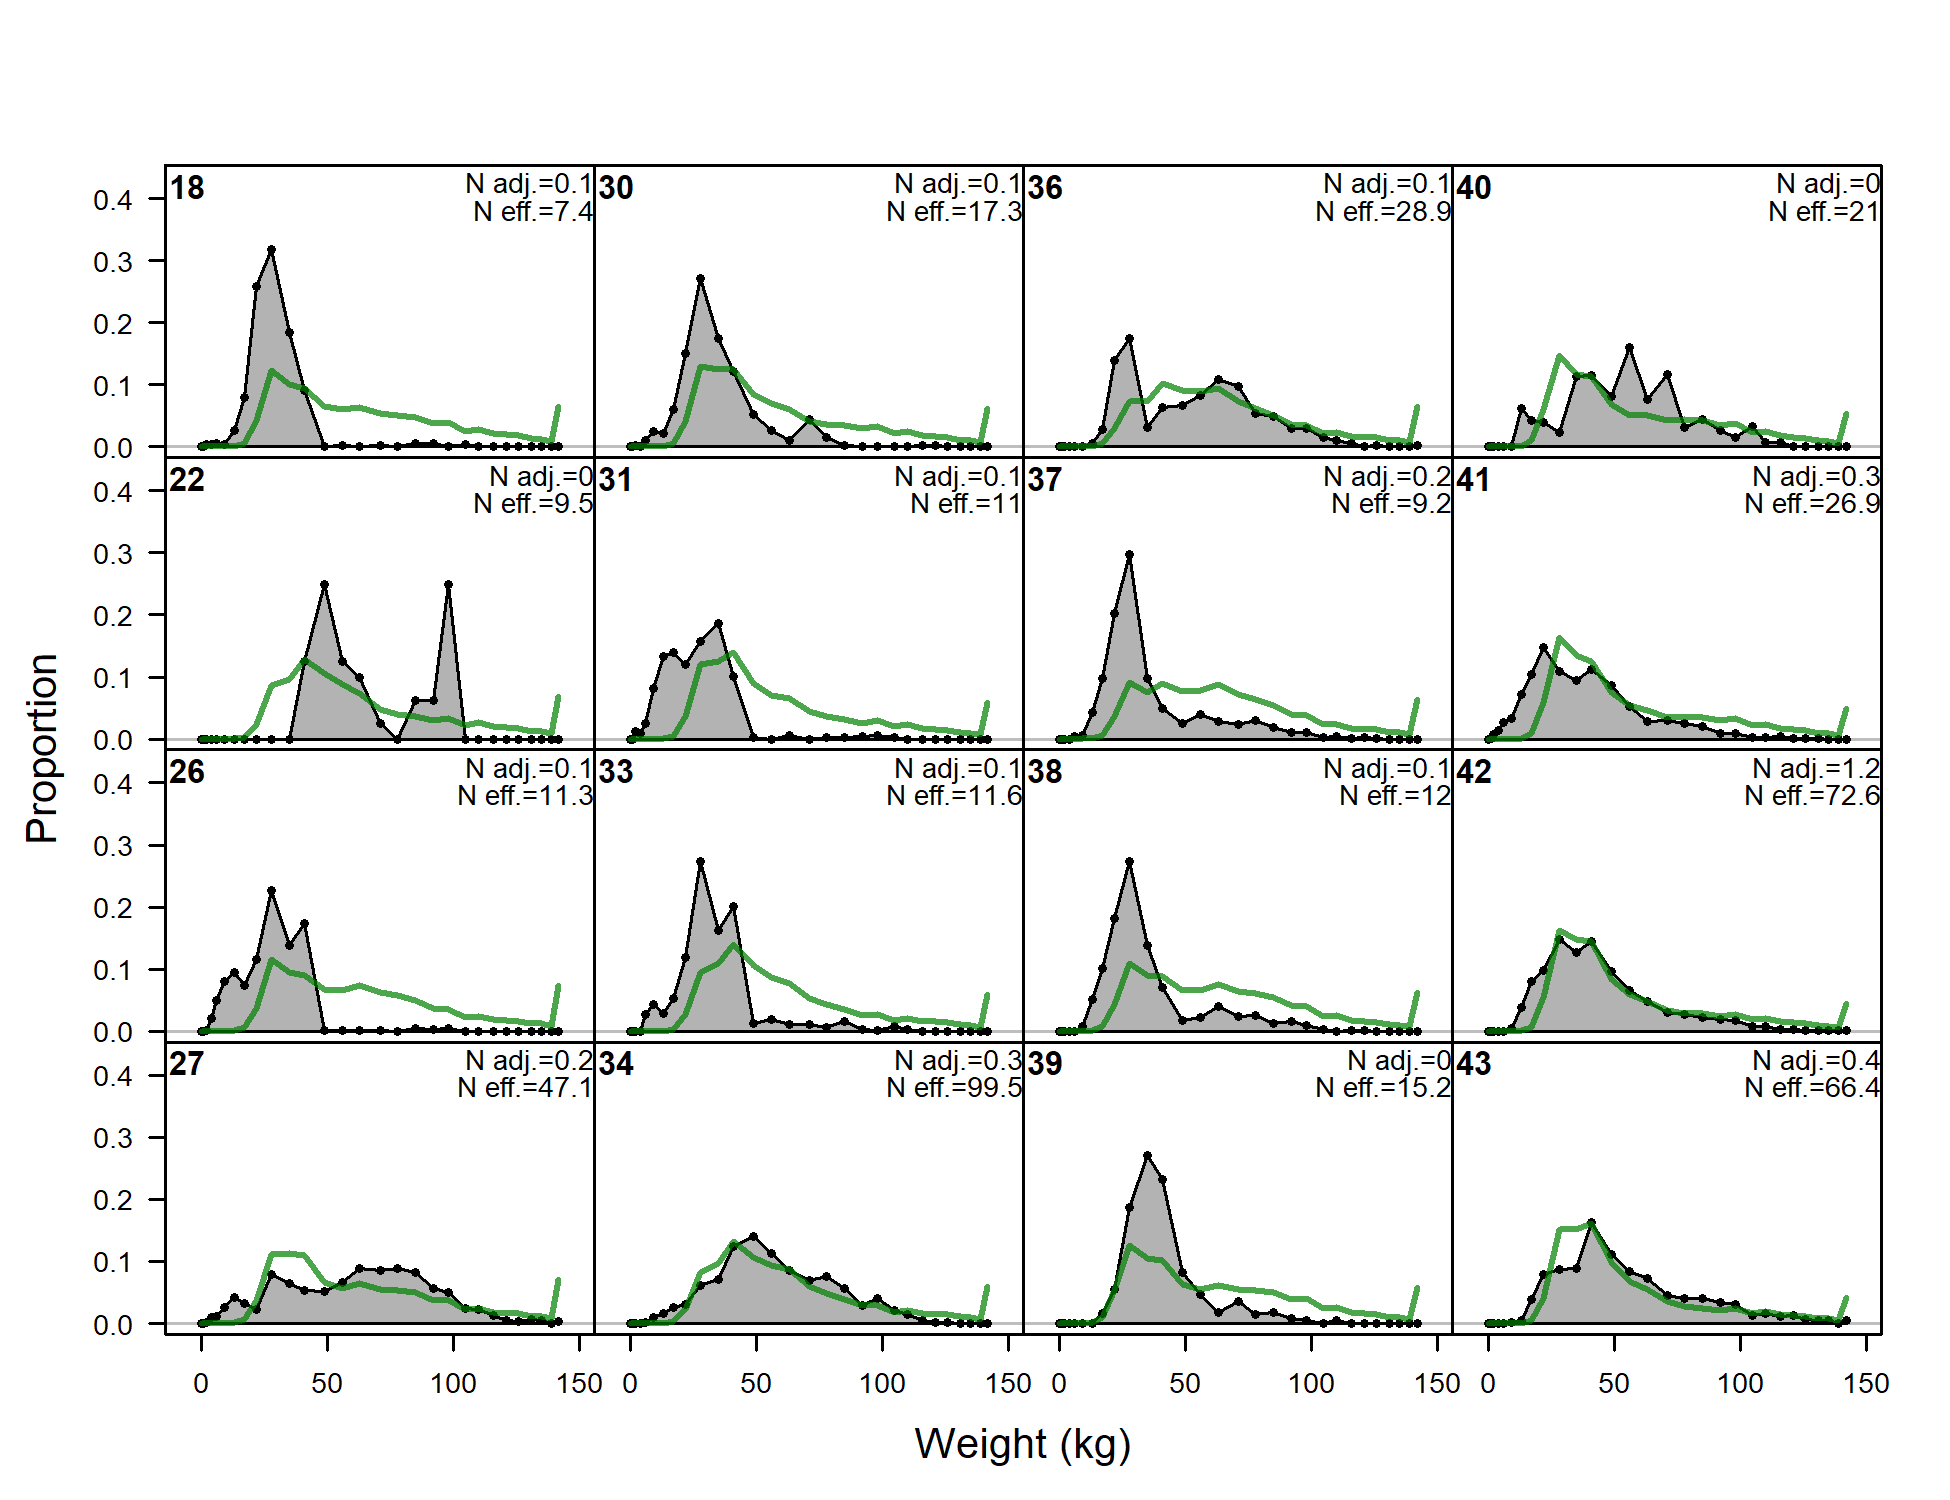
Length comps, whole catch, F1-OBJ_early (plot 1 of 4).
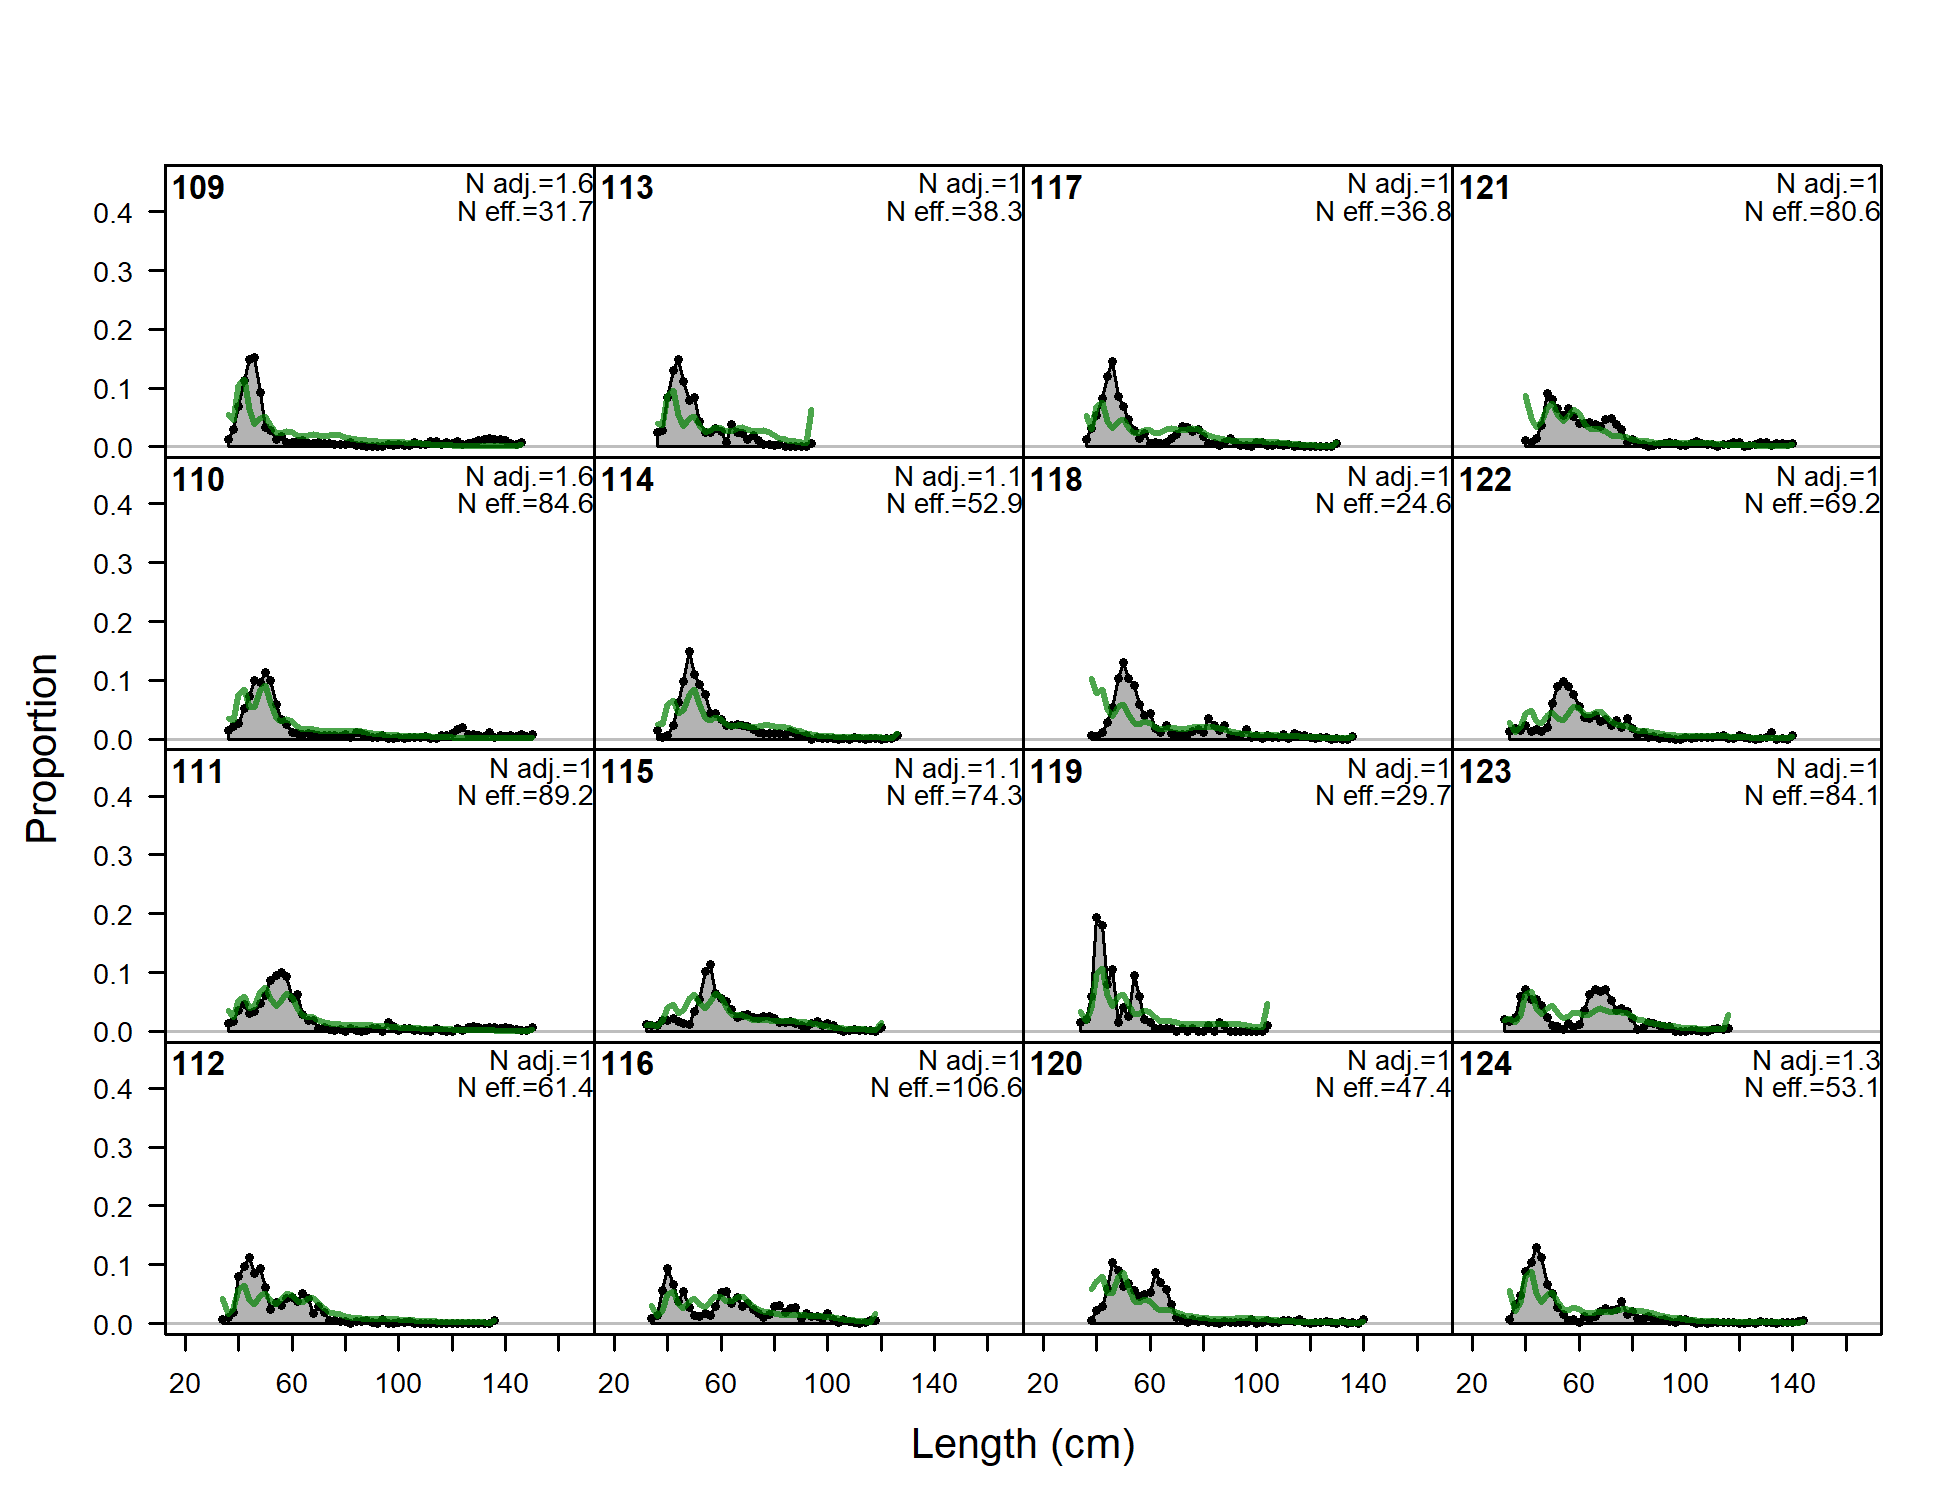
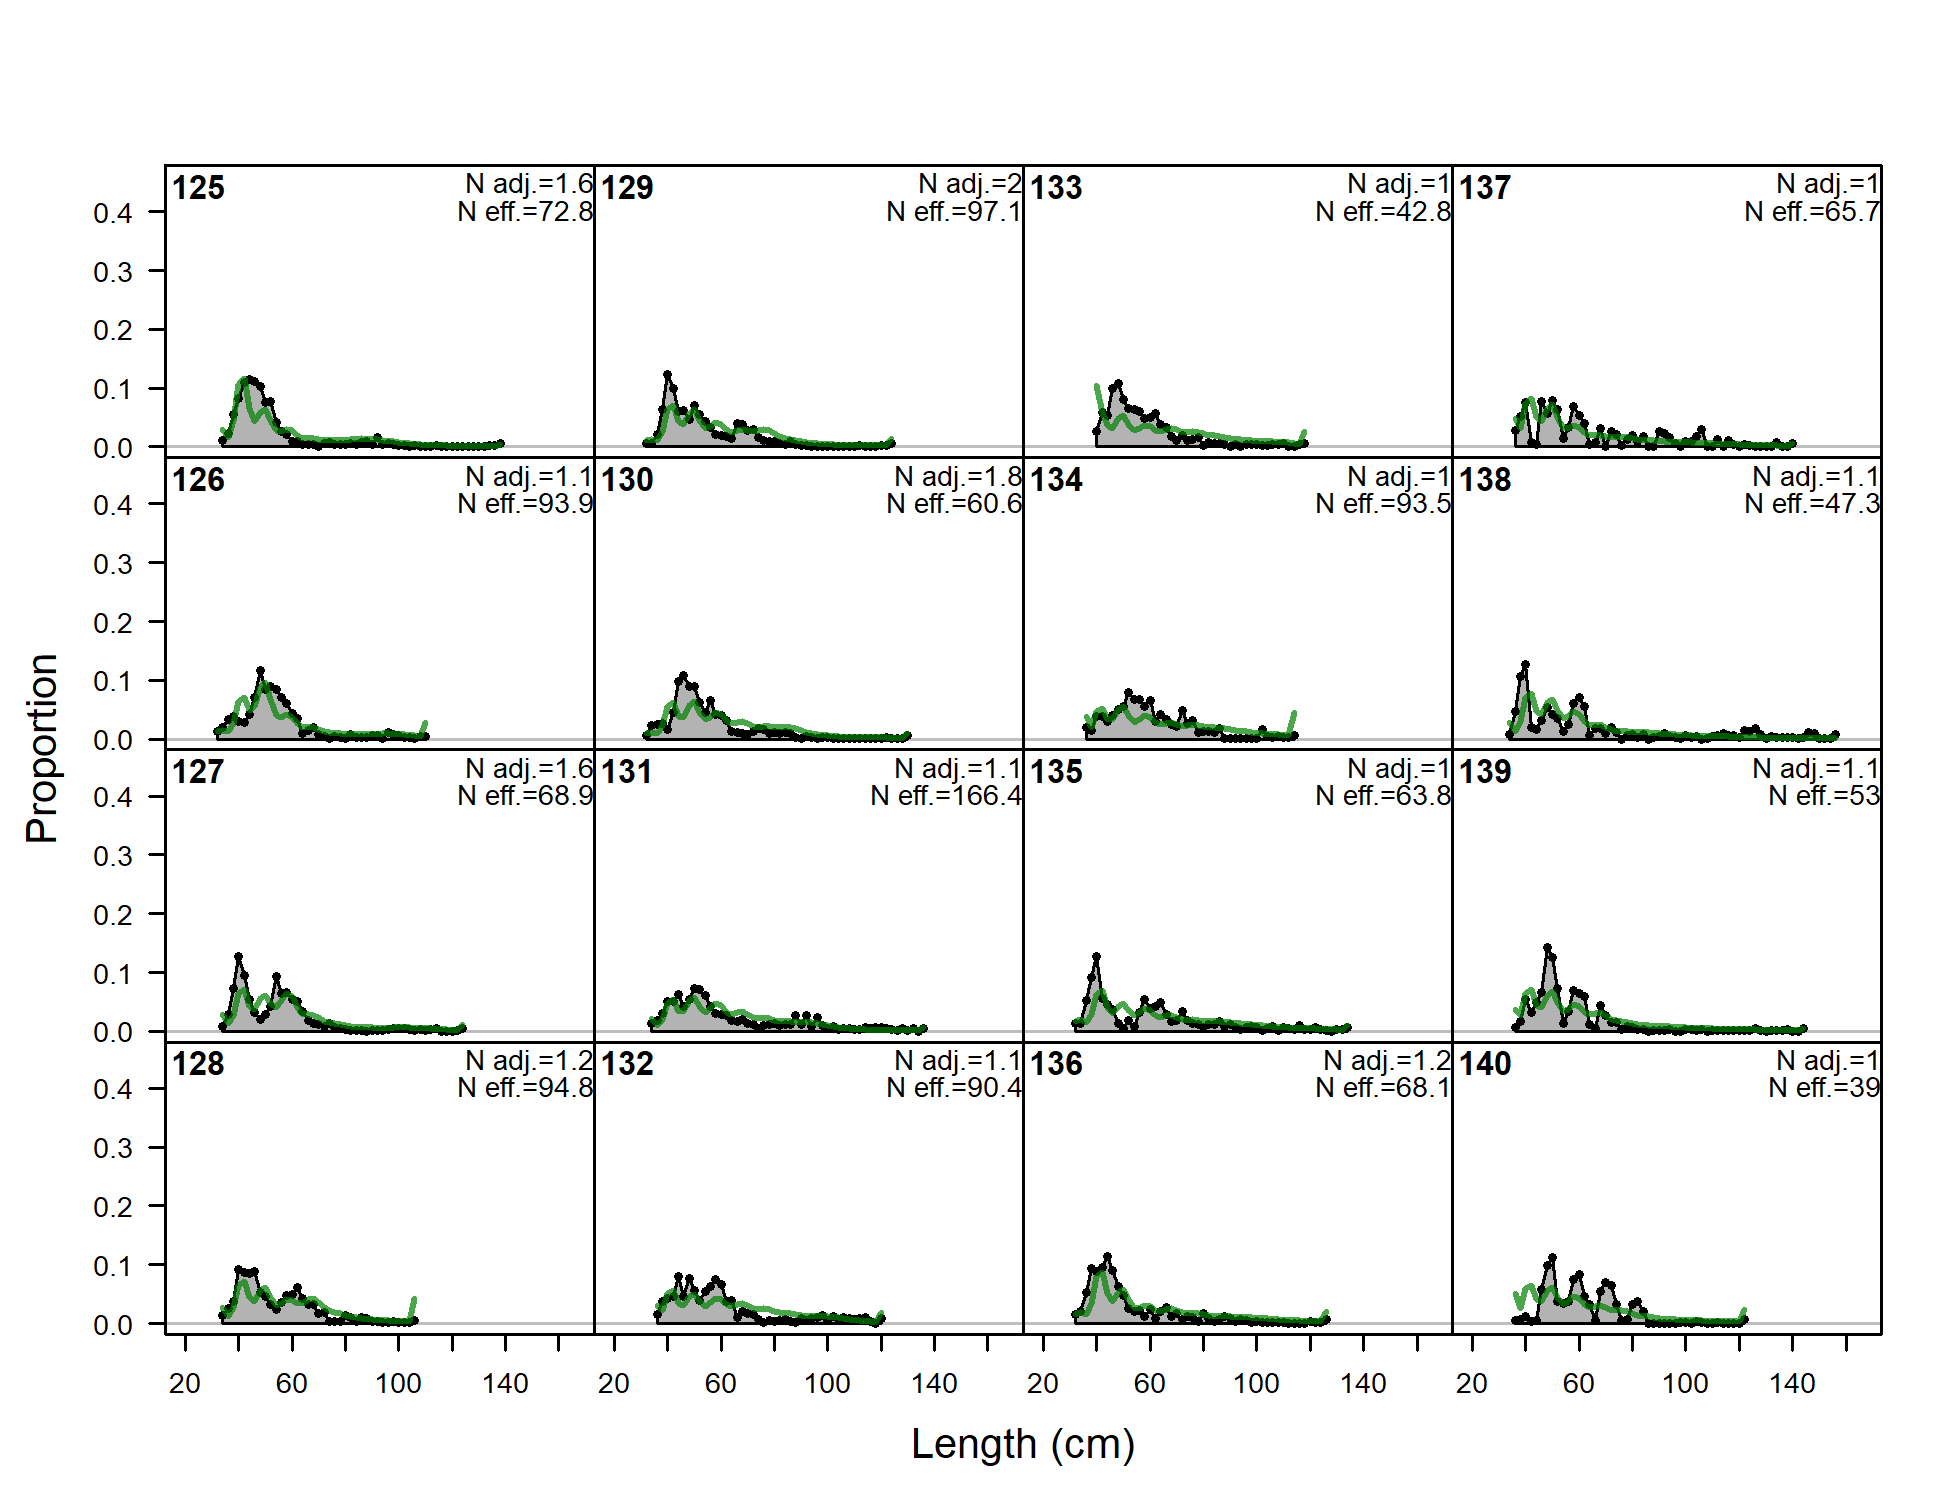
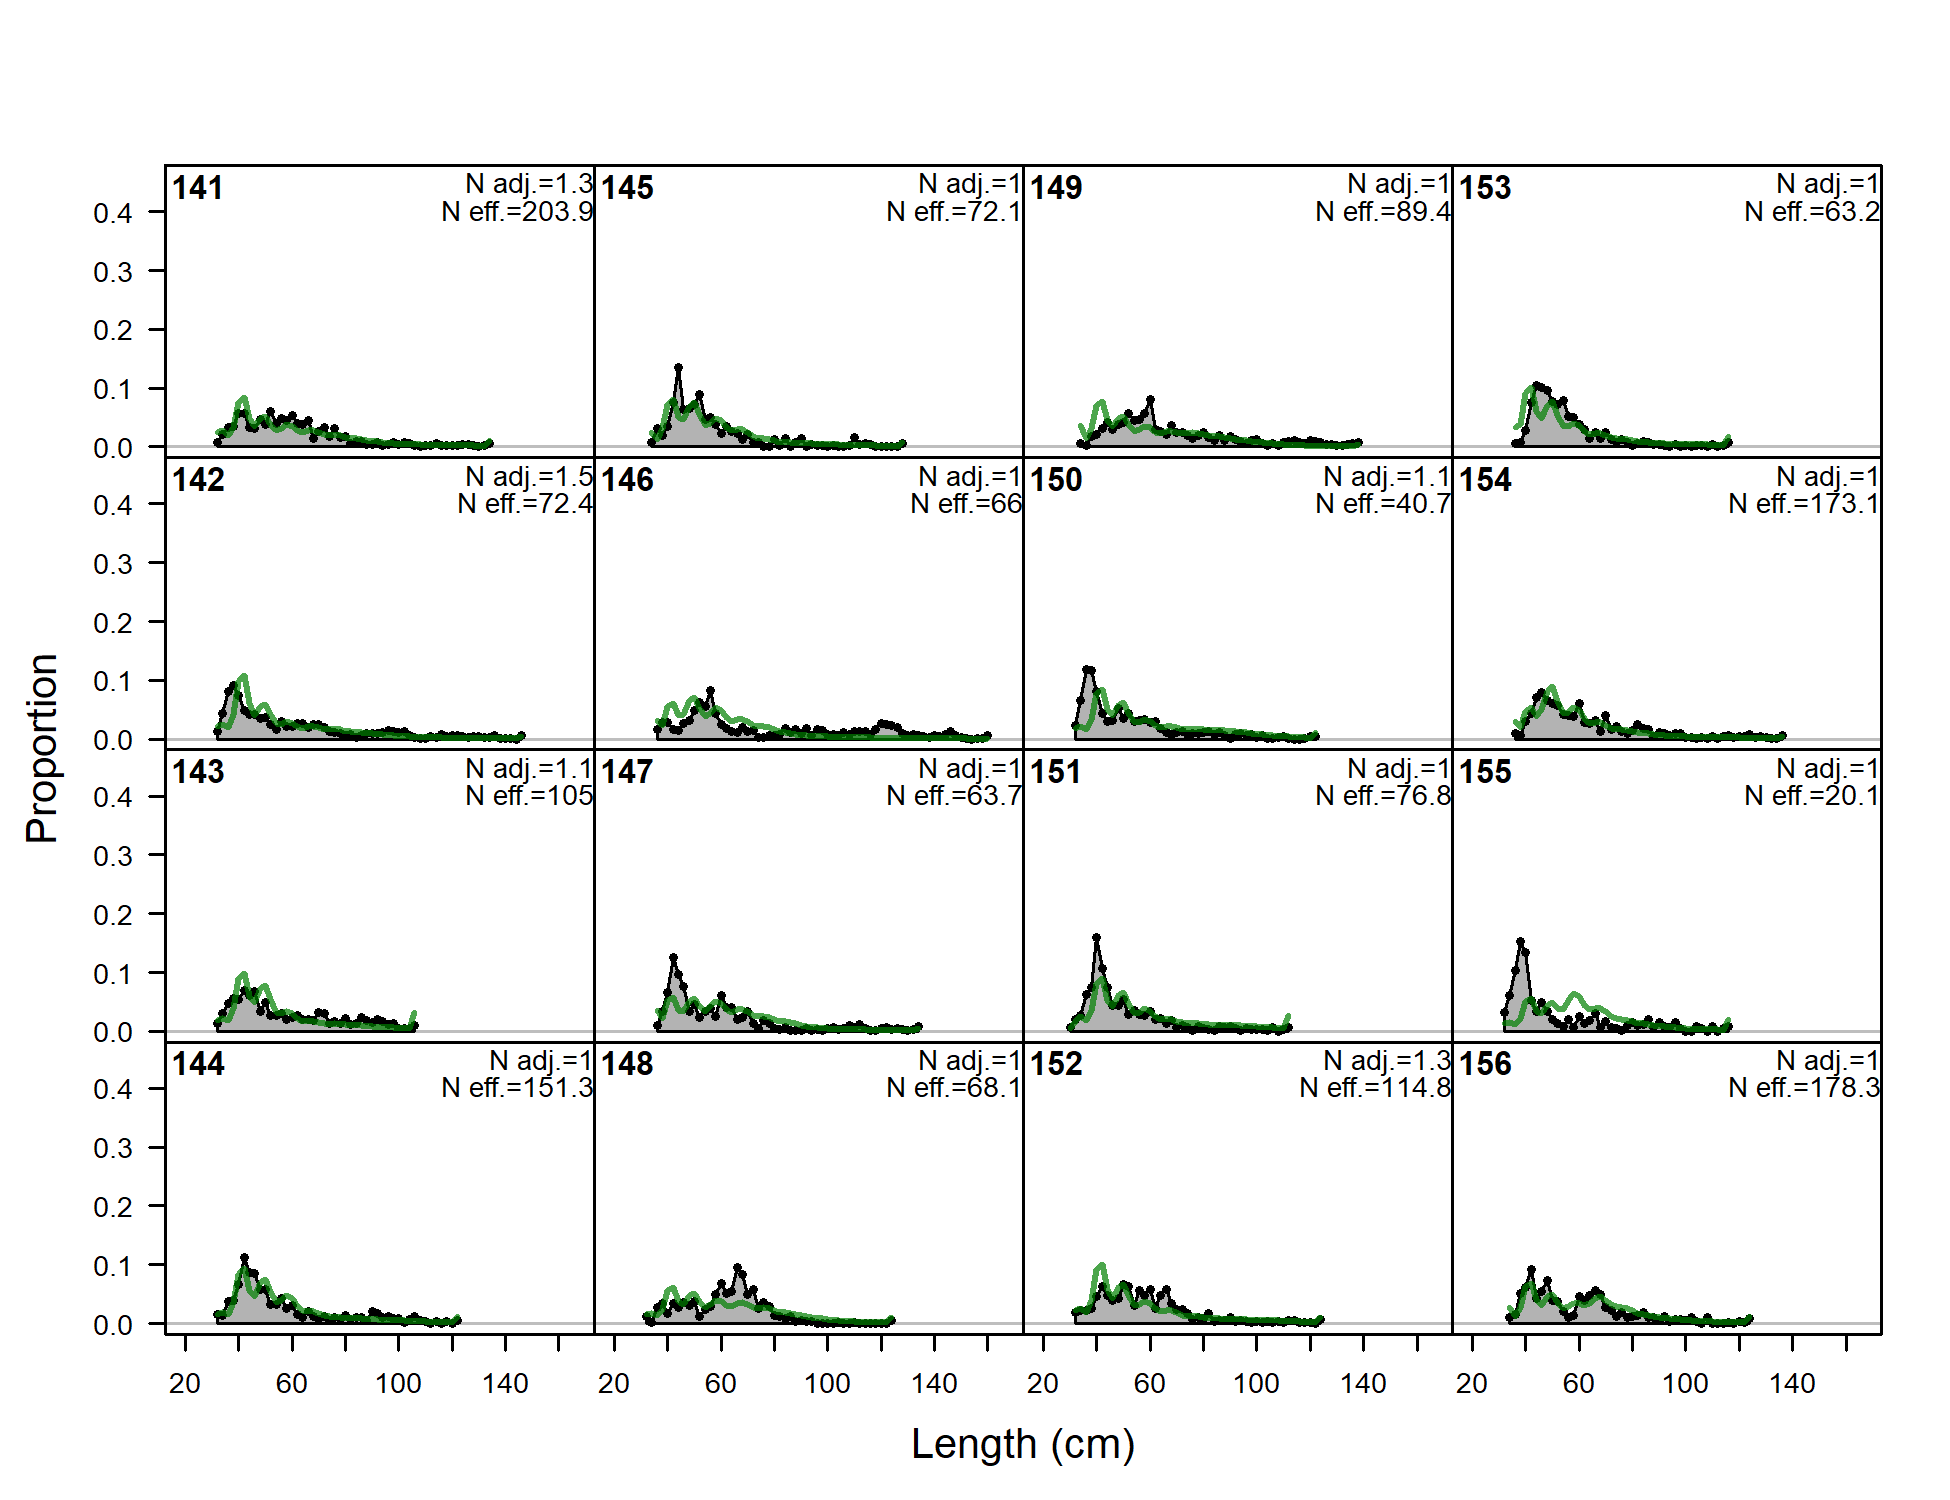
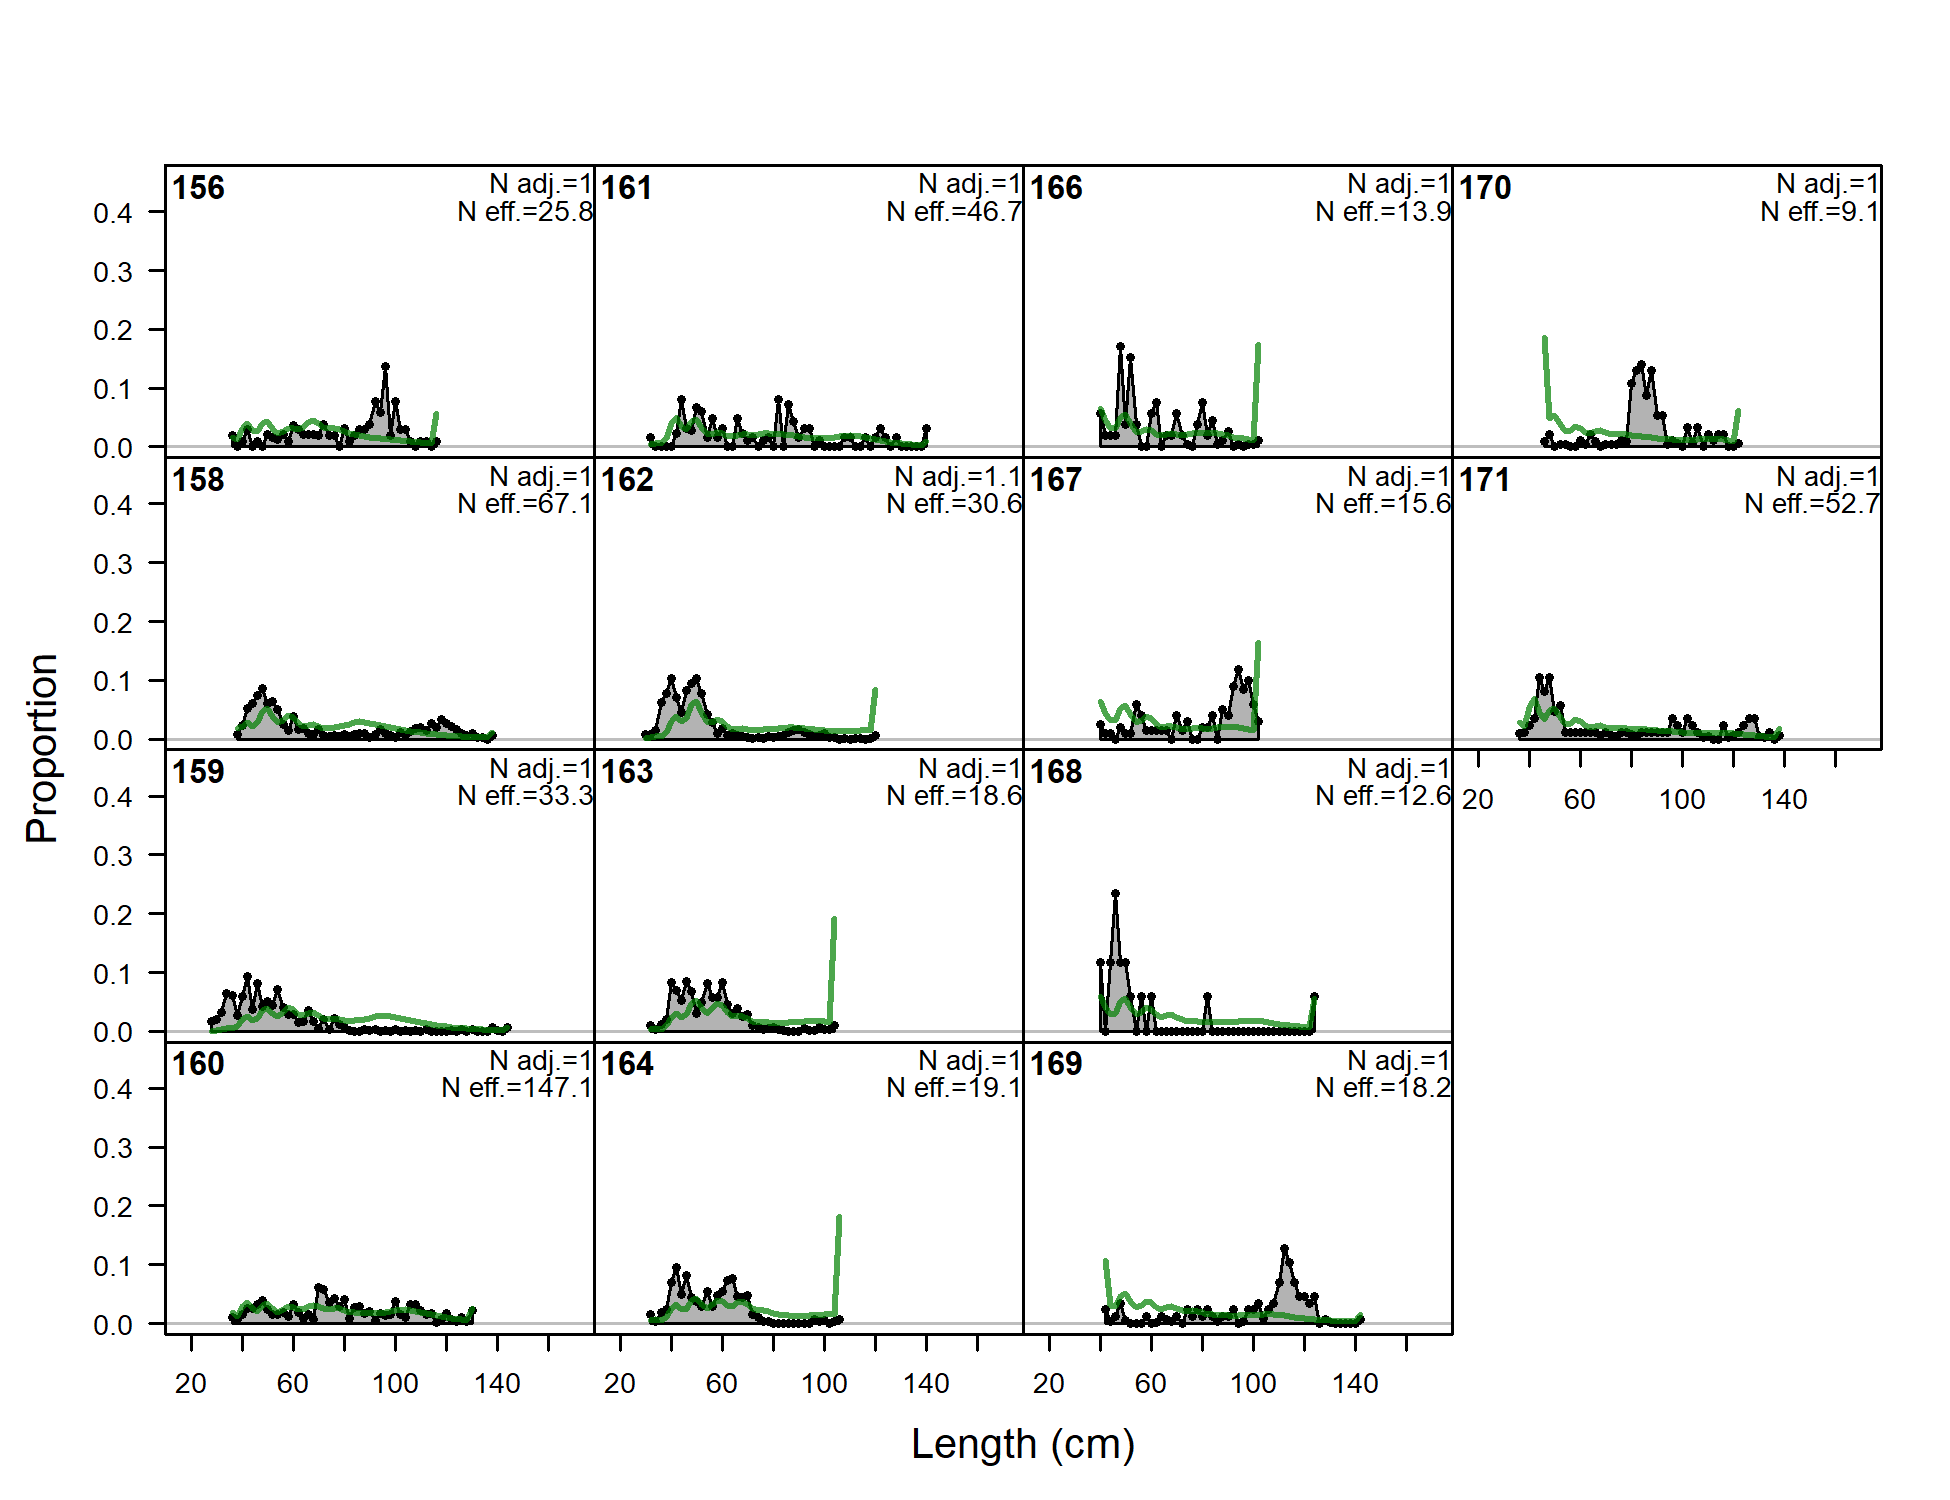
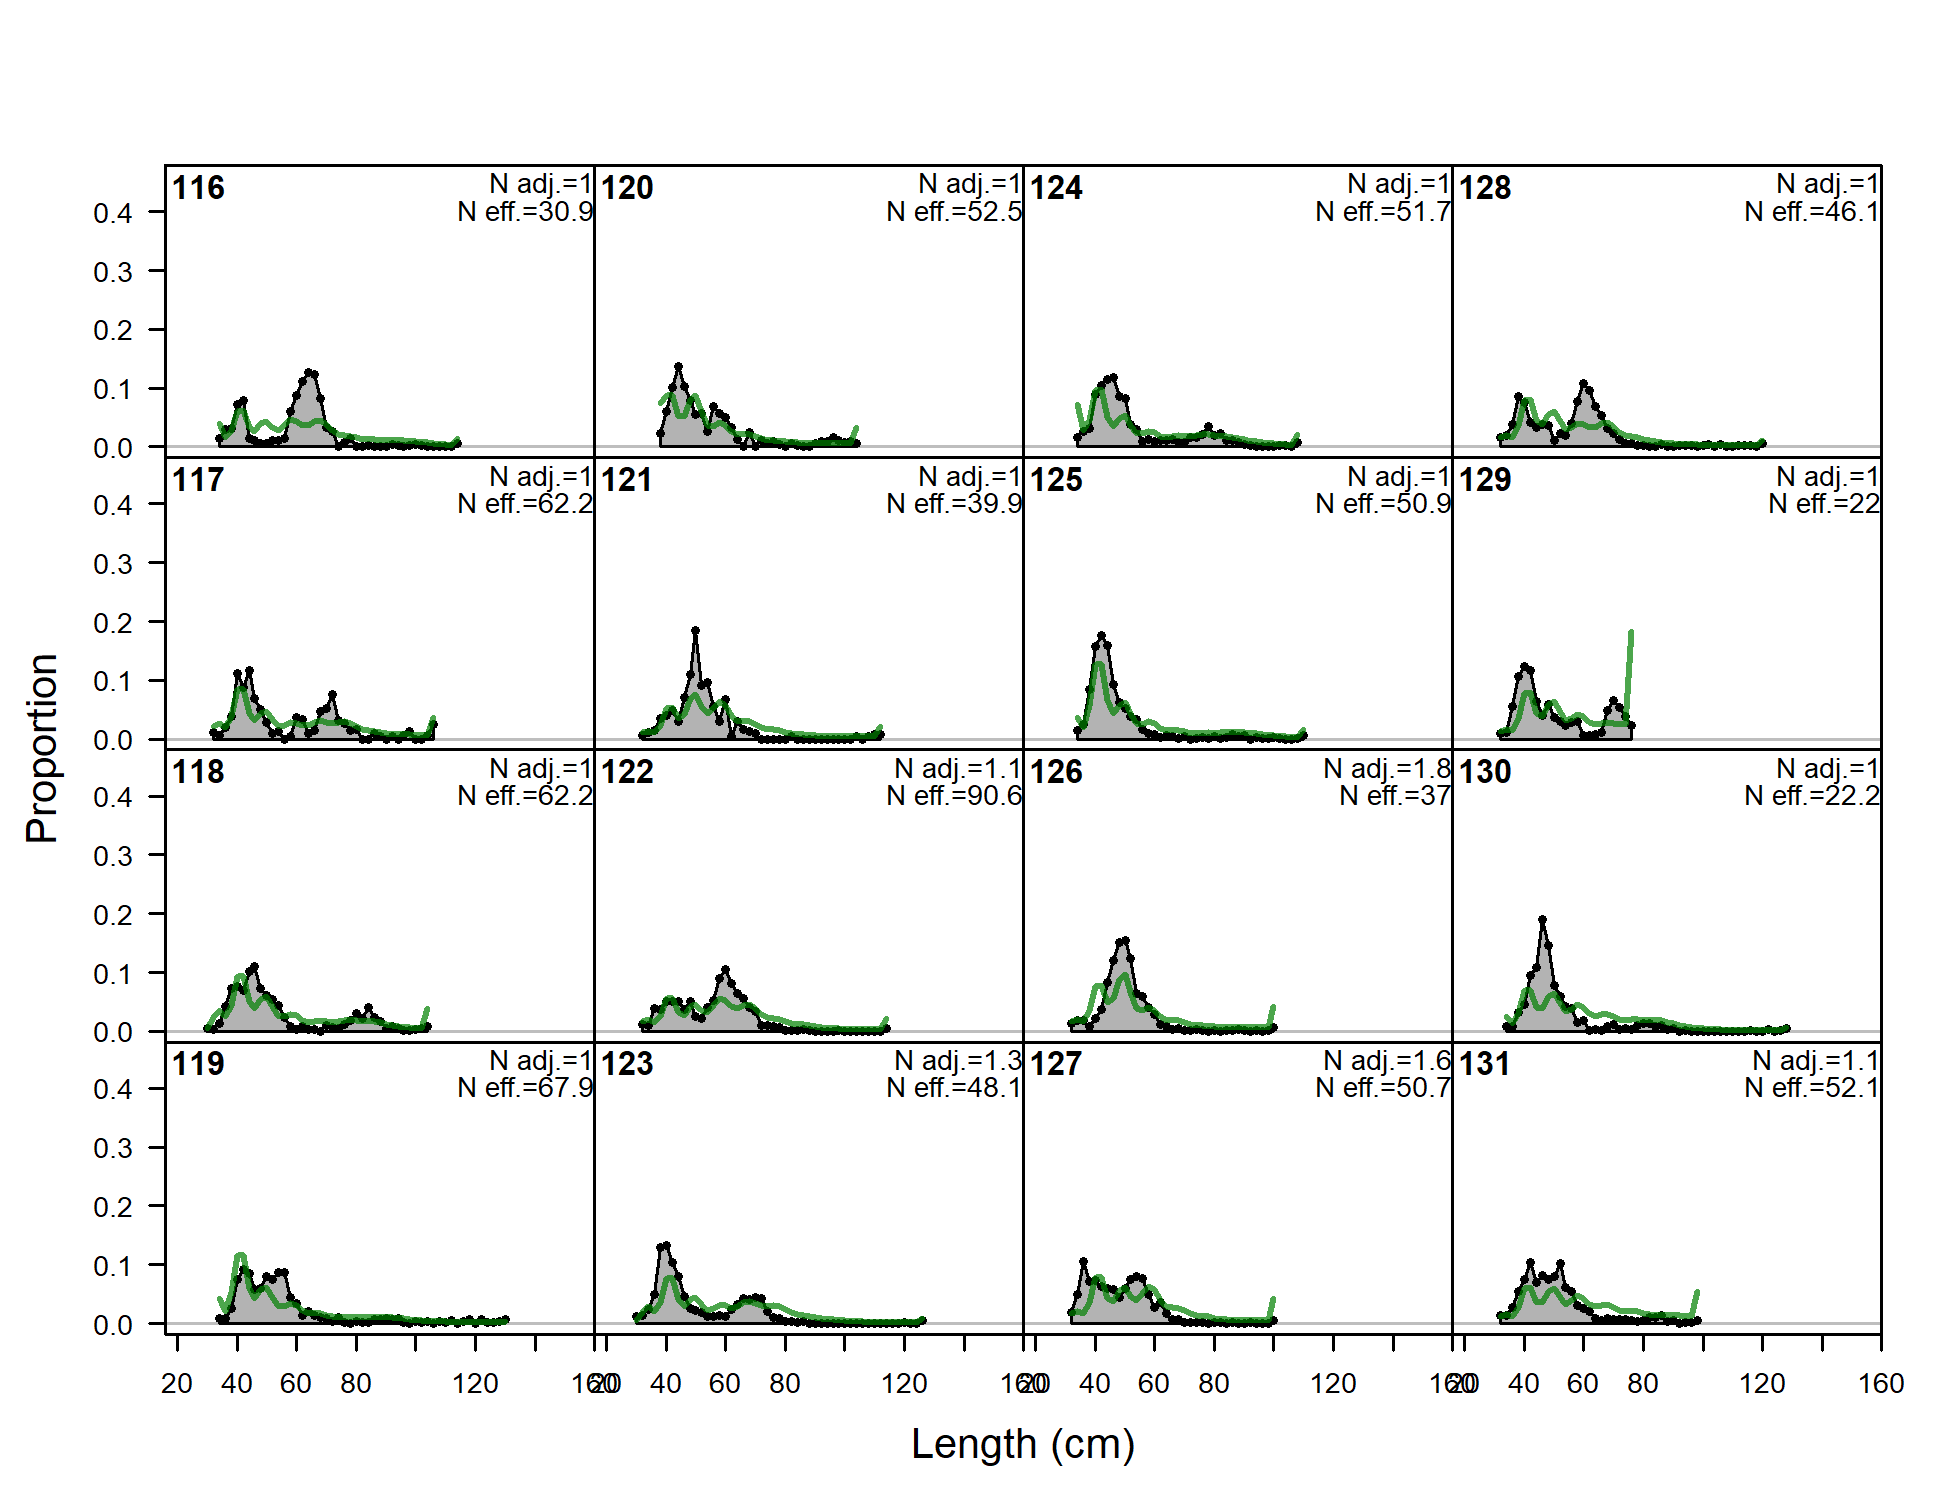
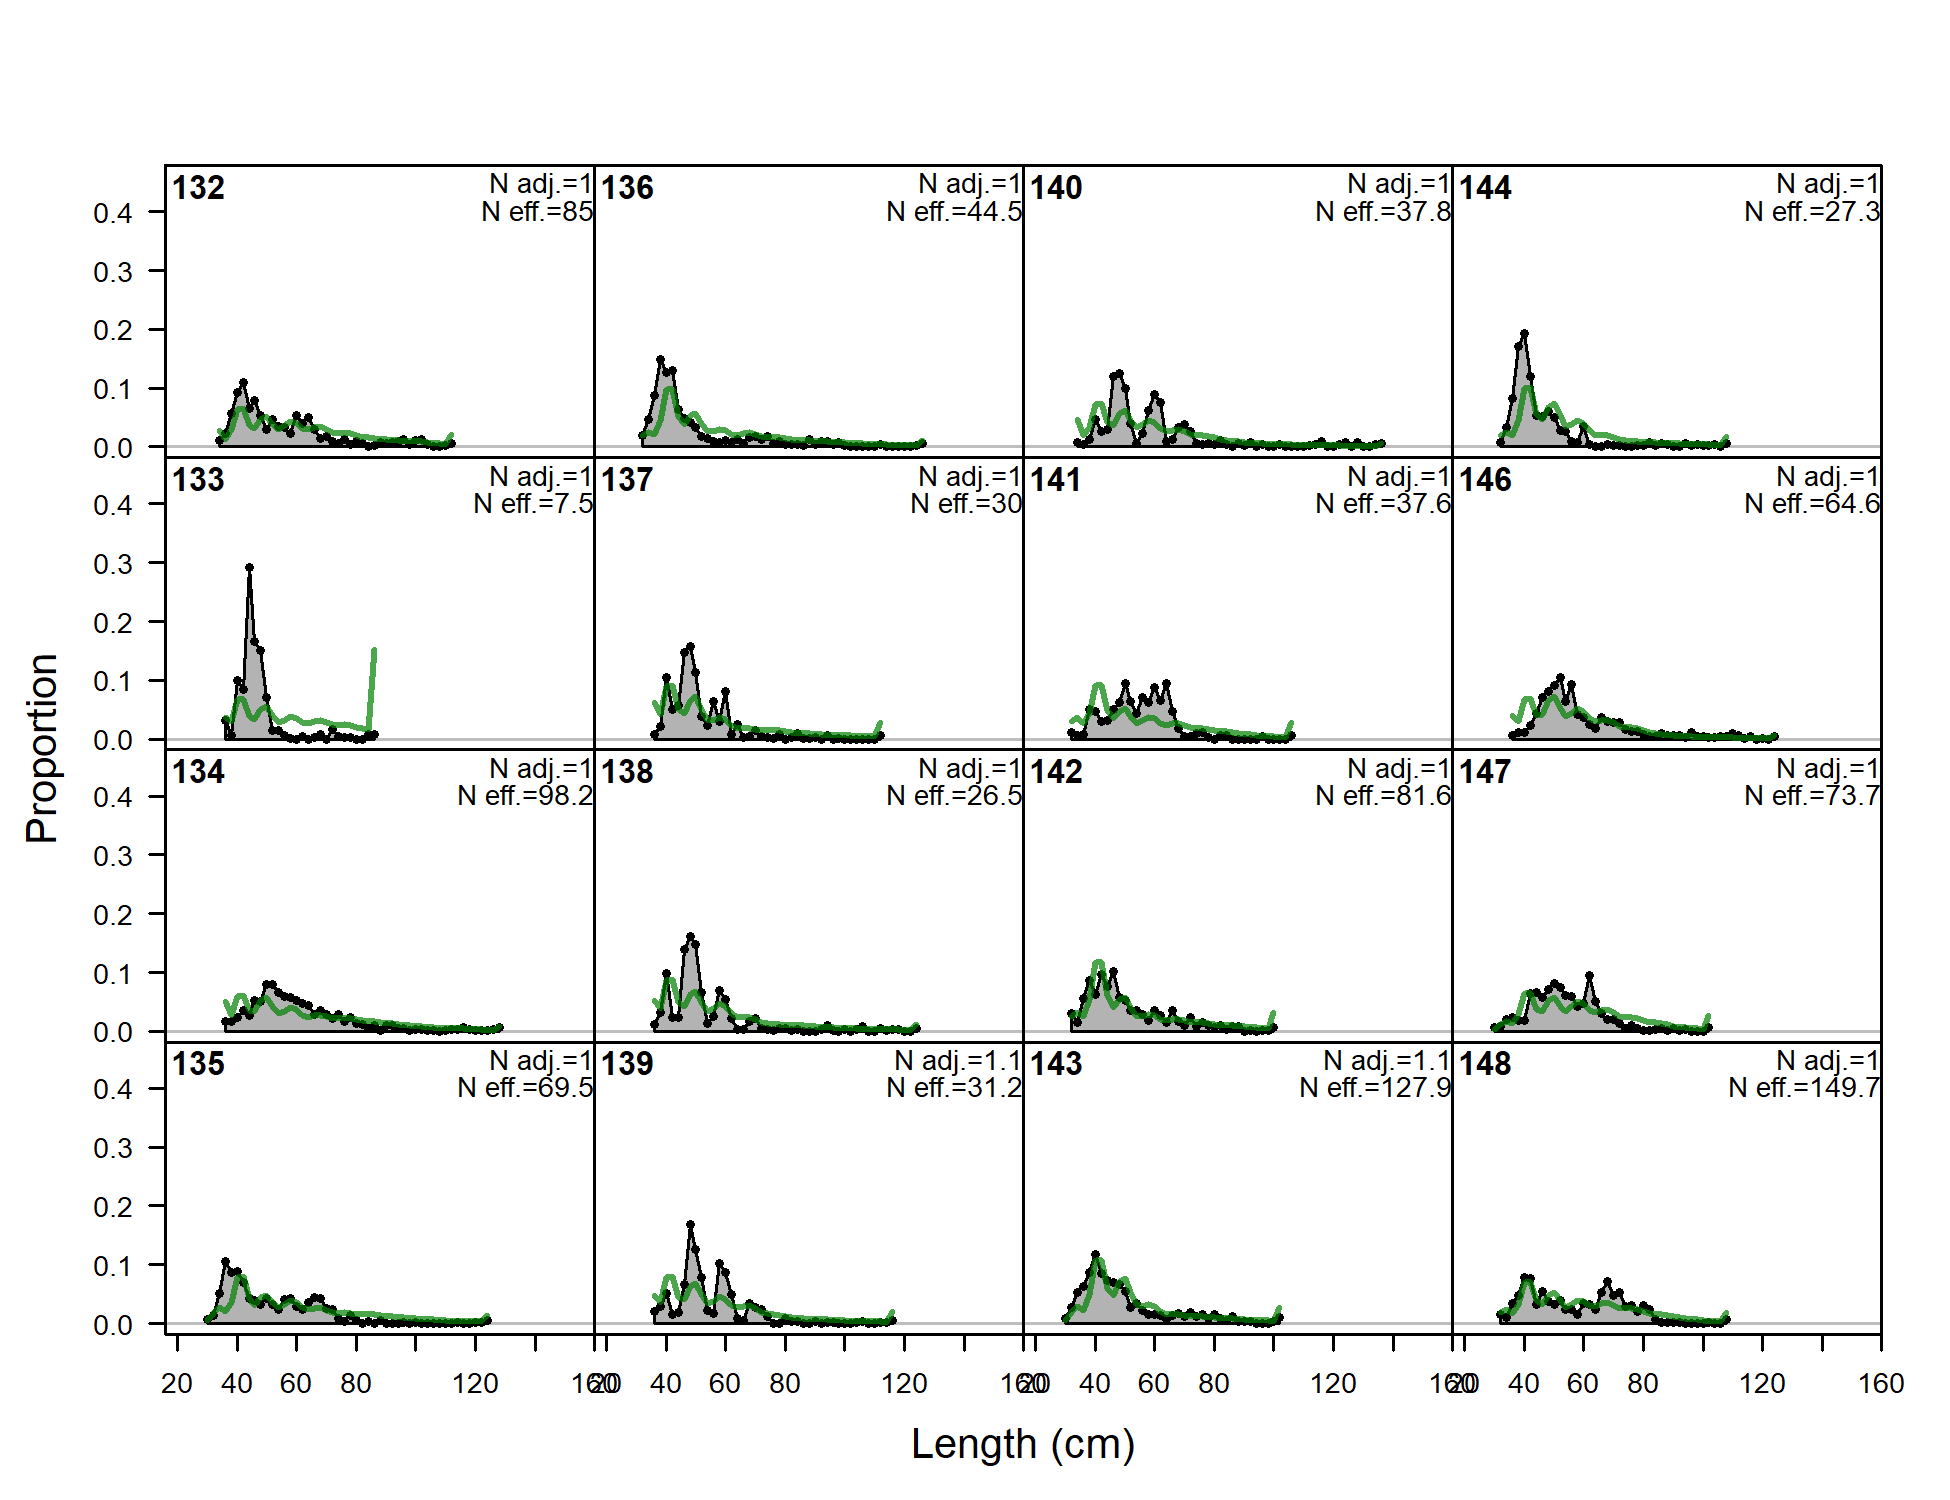
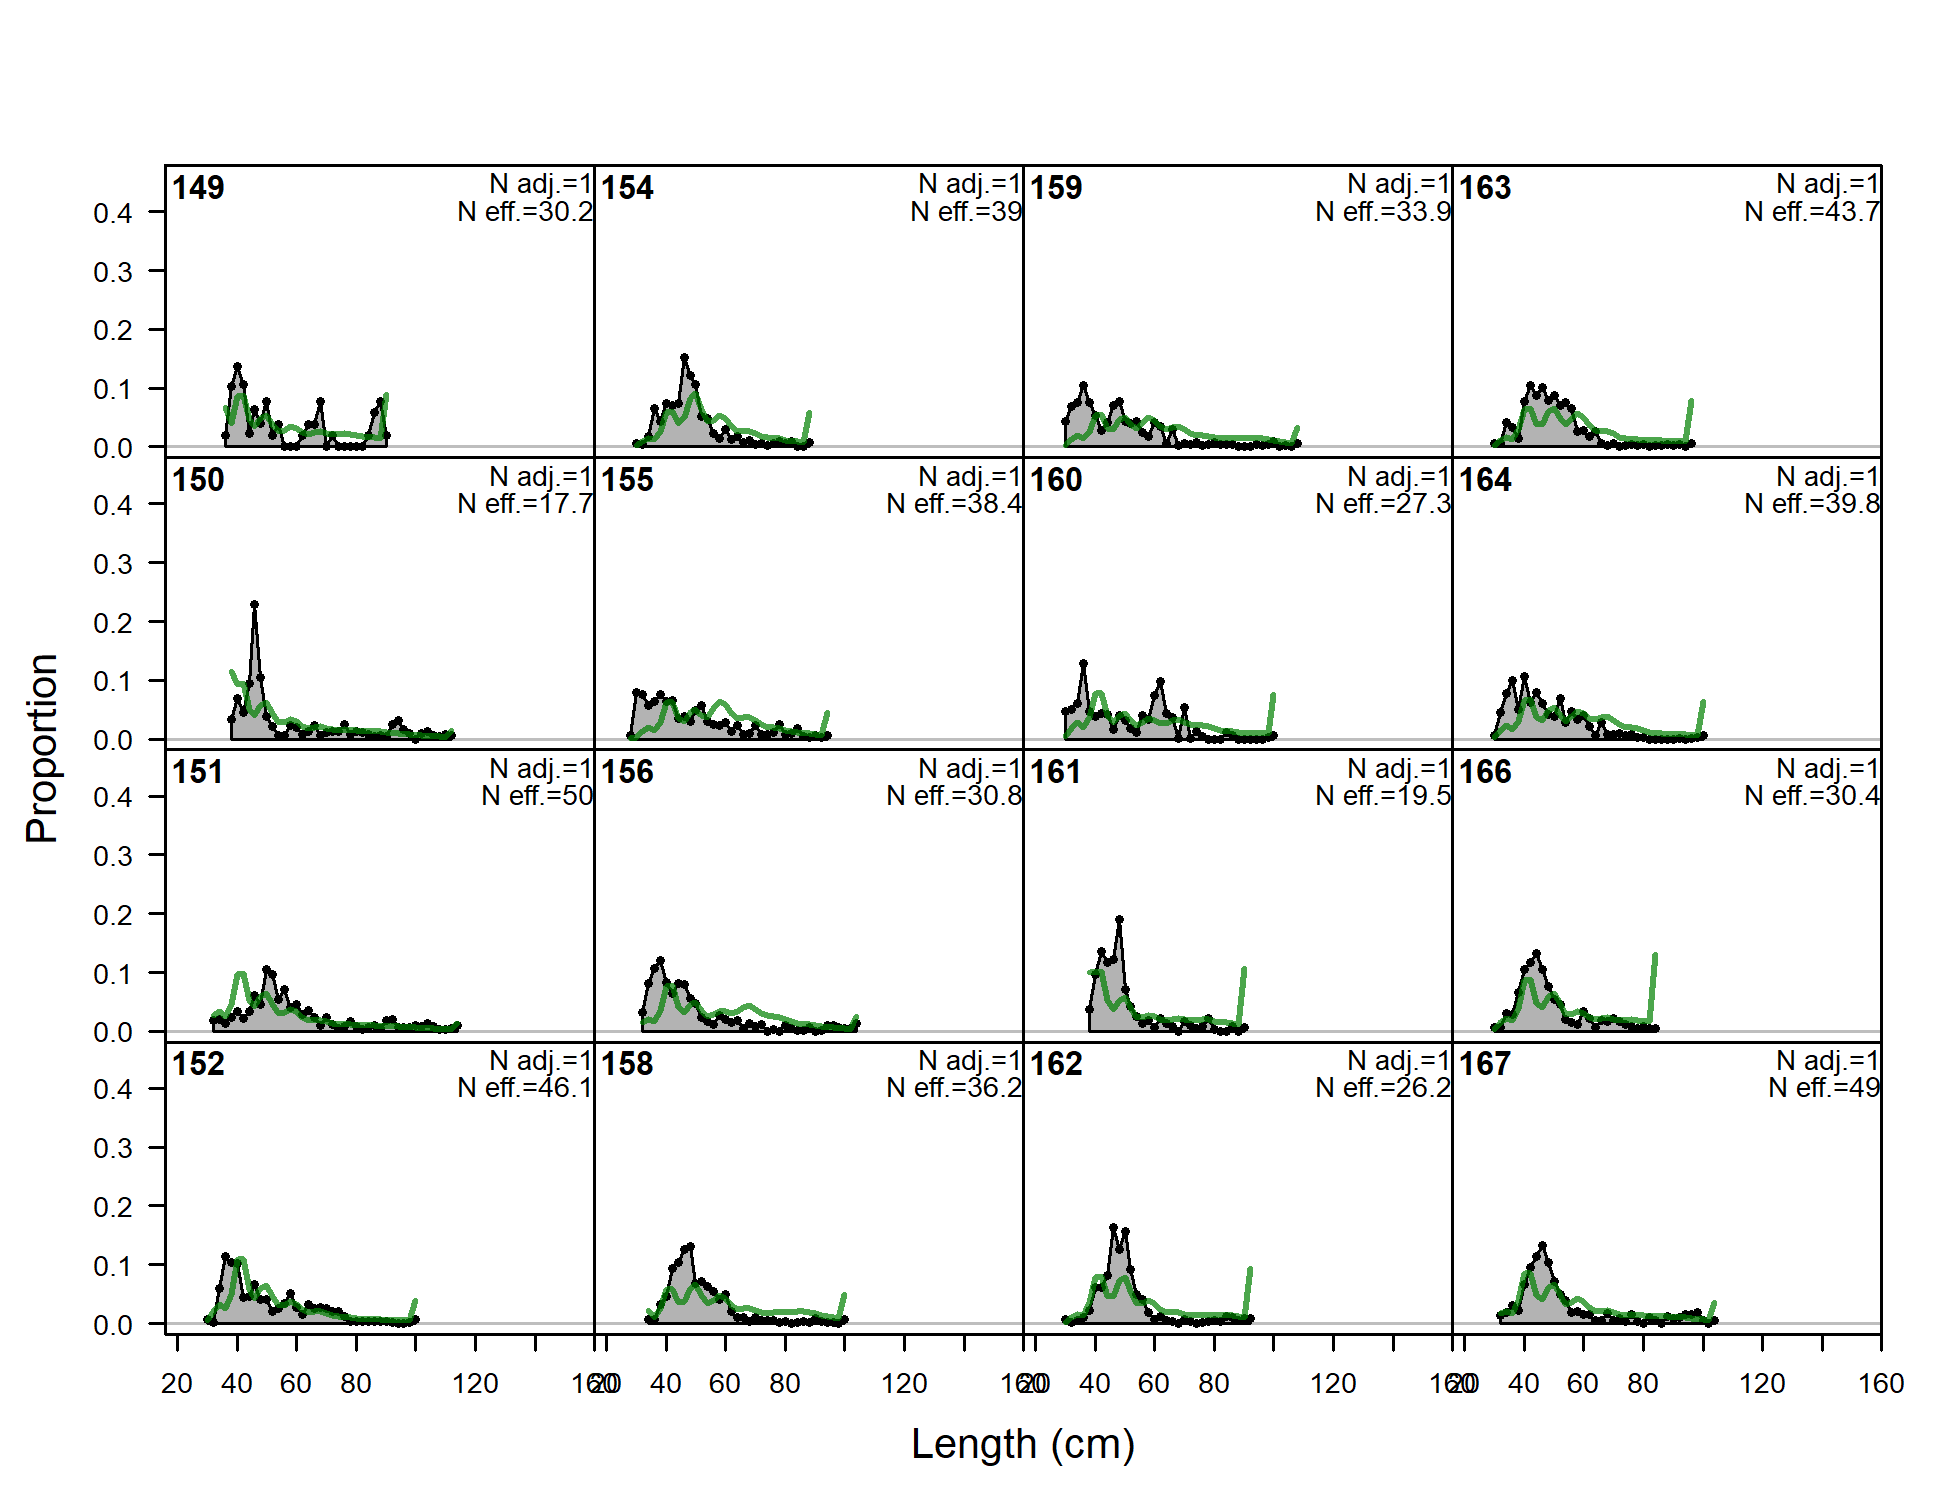
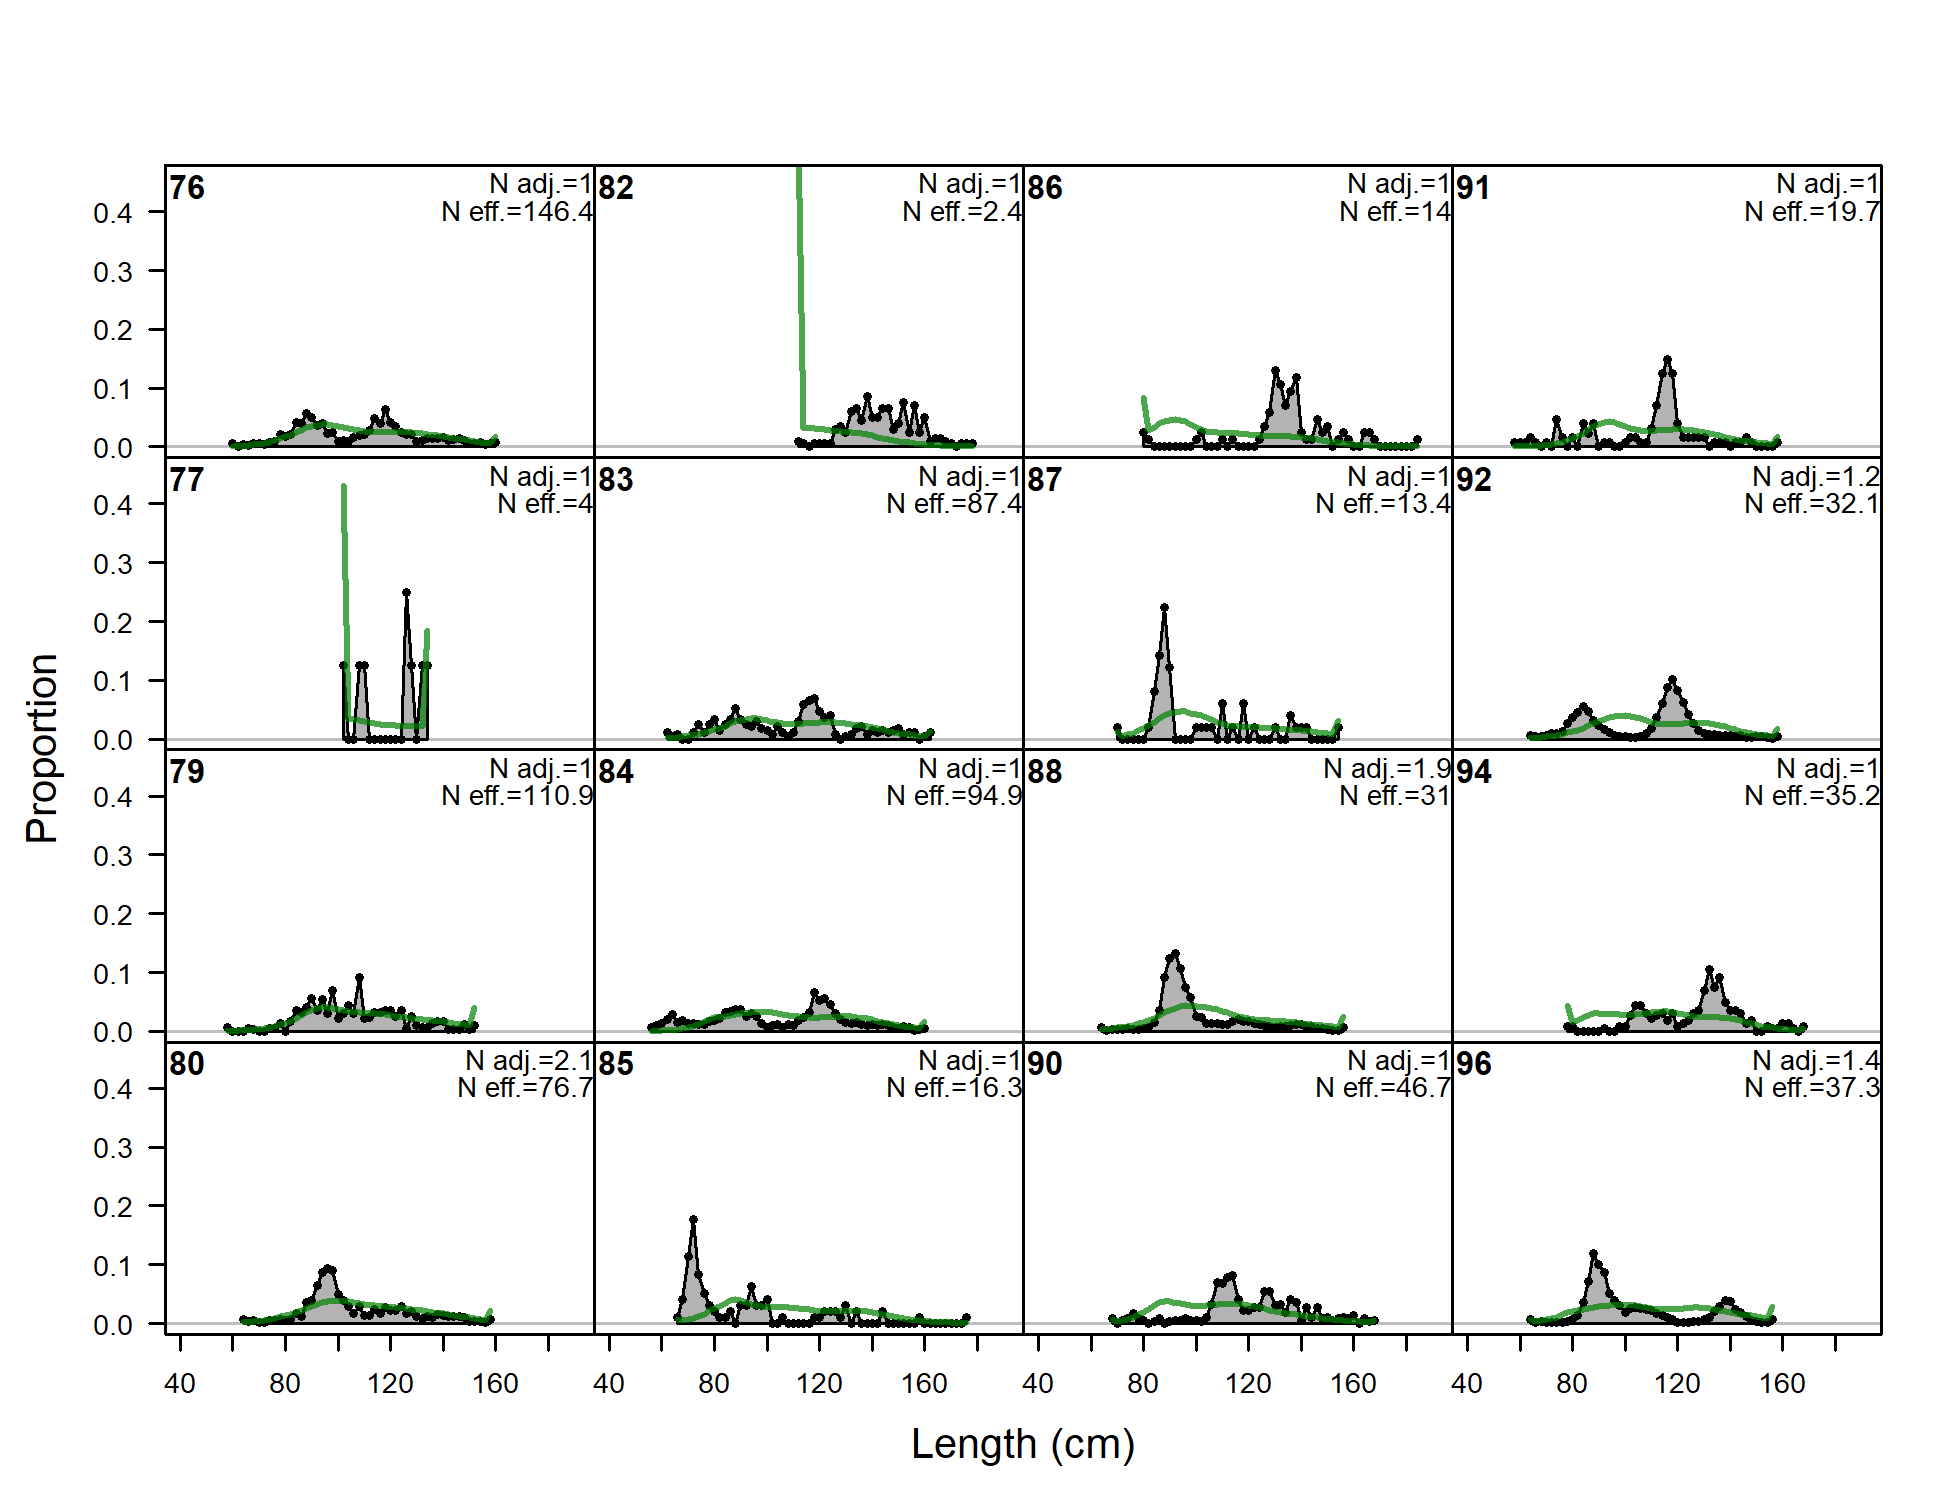
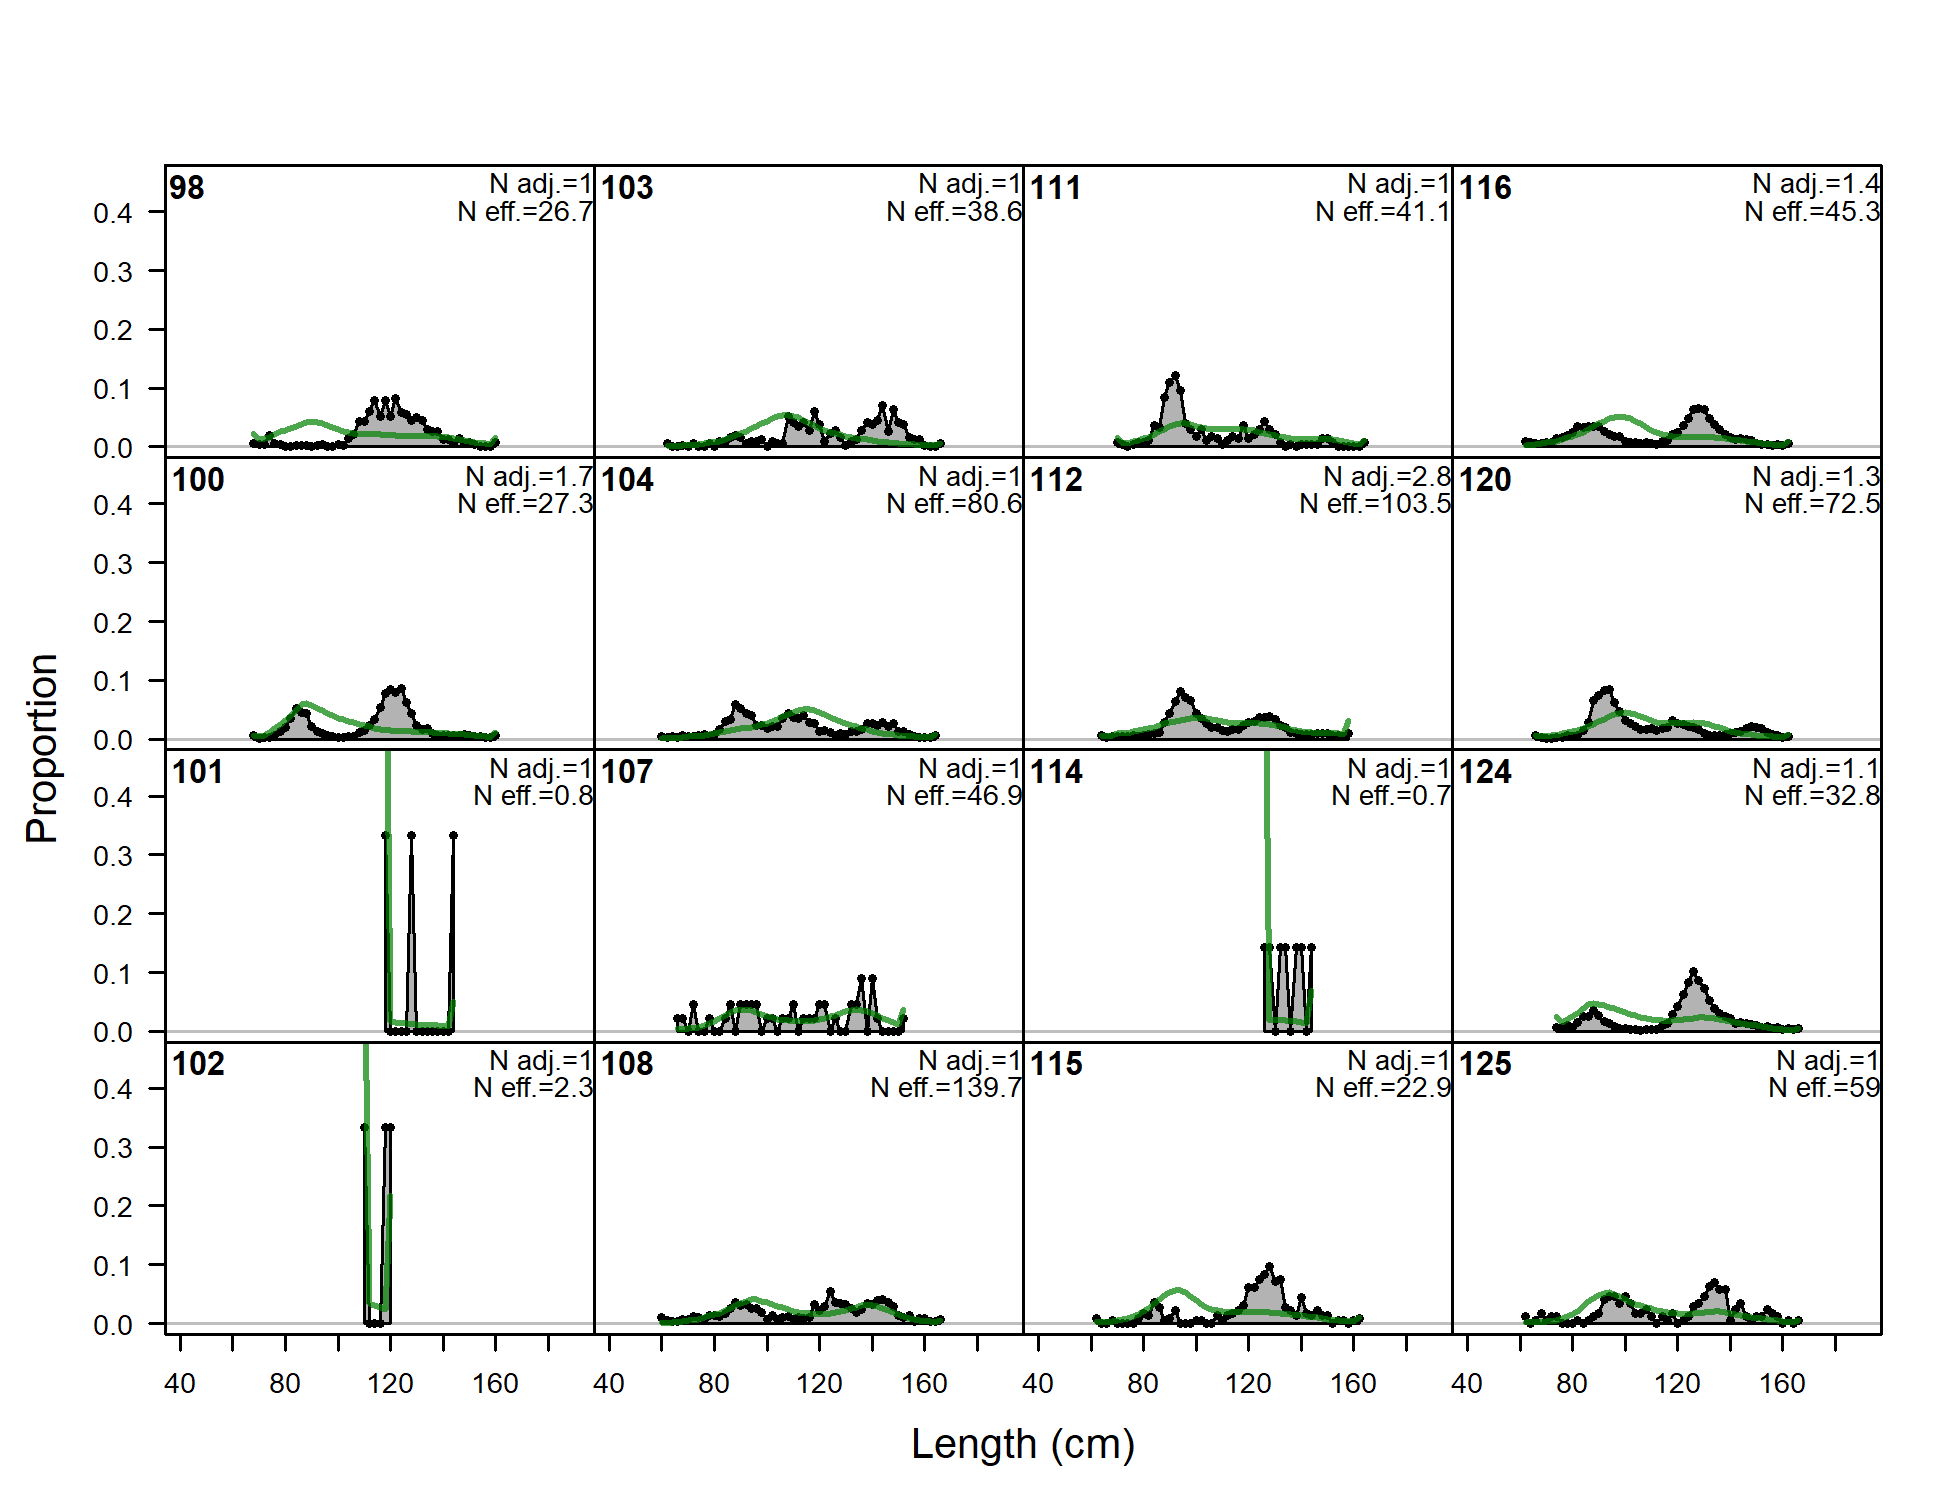
'N adj.' is the input sample size after data-weighting adjustment.N eff. is the calculated effective sample size used in the McAllister-Iannelli tuning method.
file: comp_lenfit_flt1mkt0_page1.png
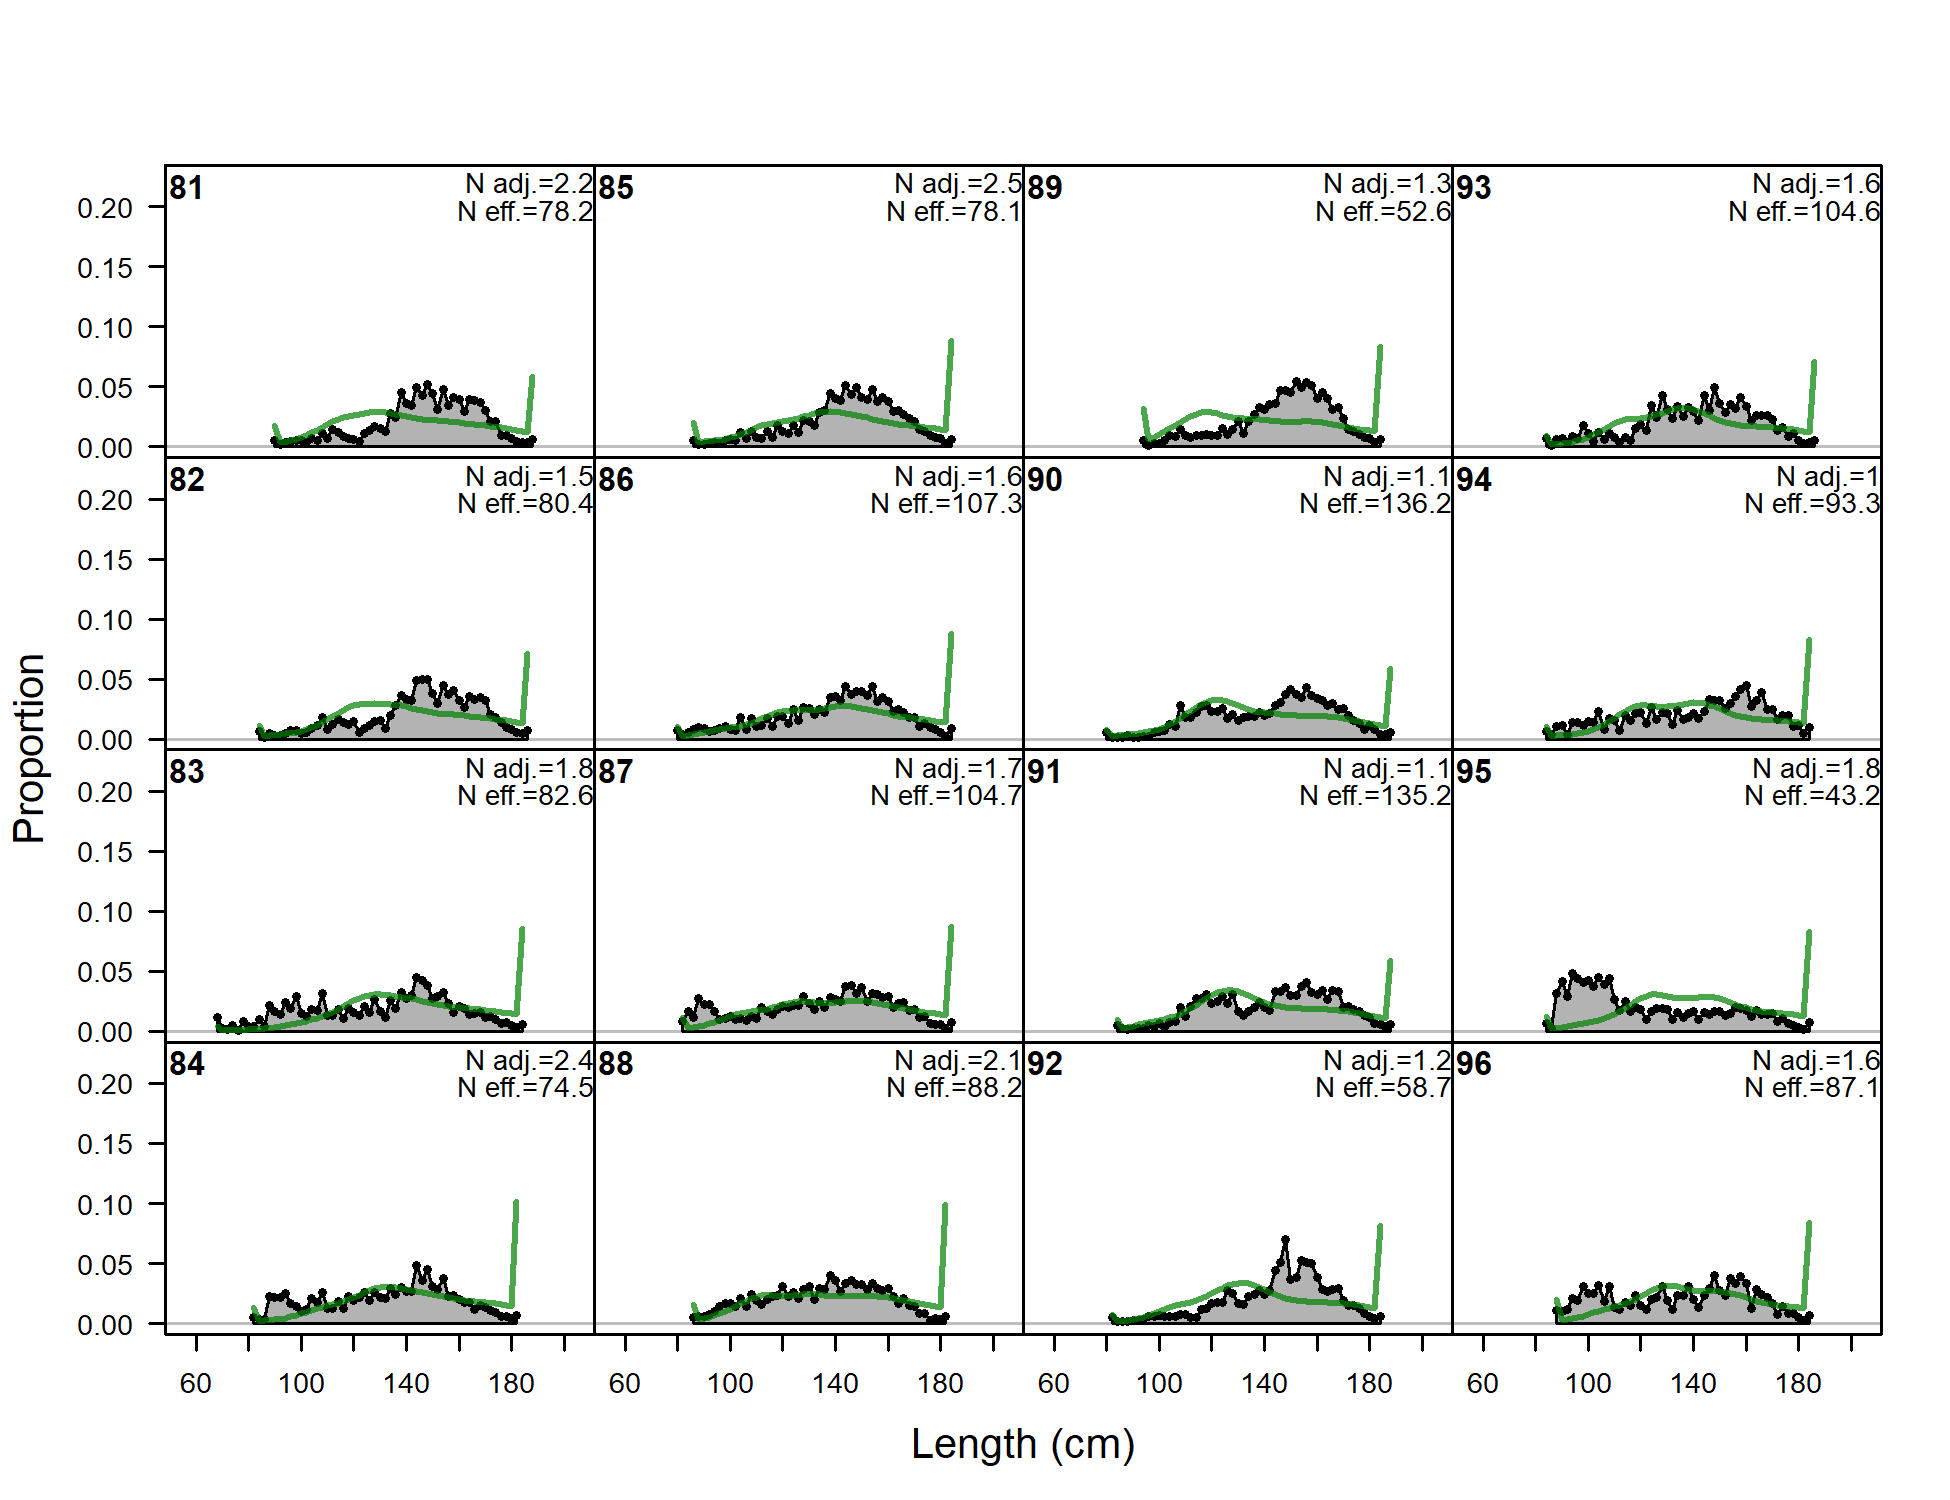
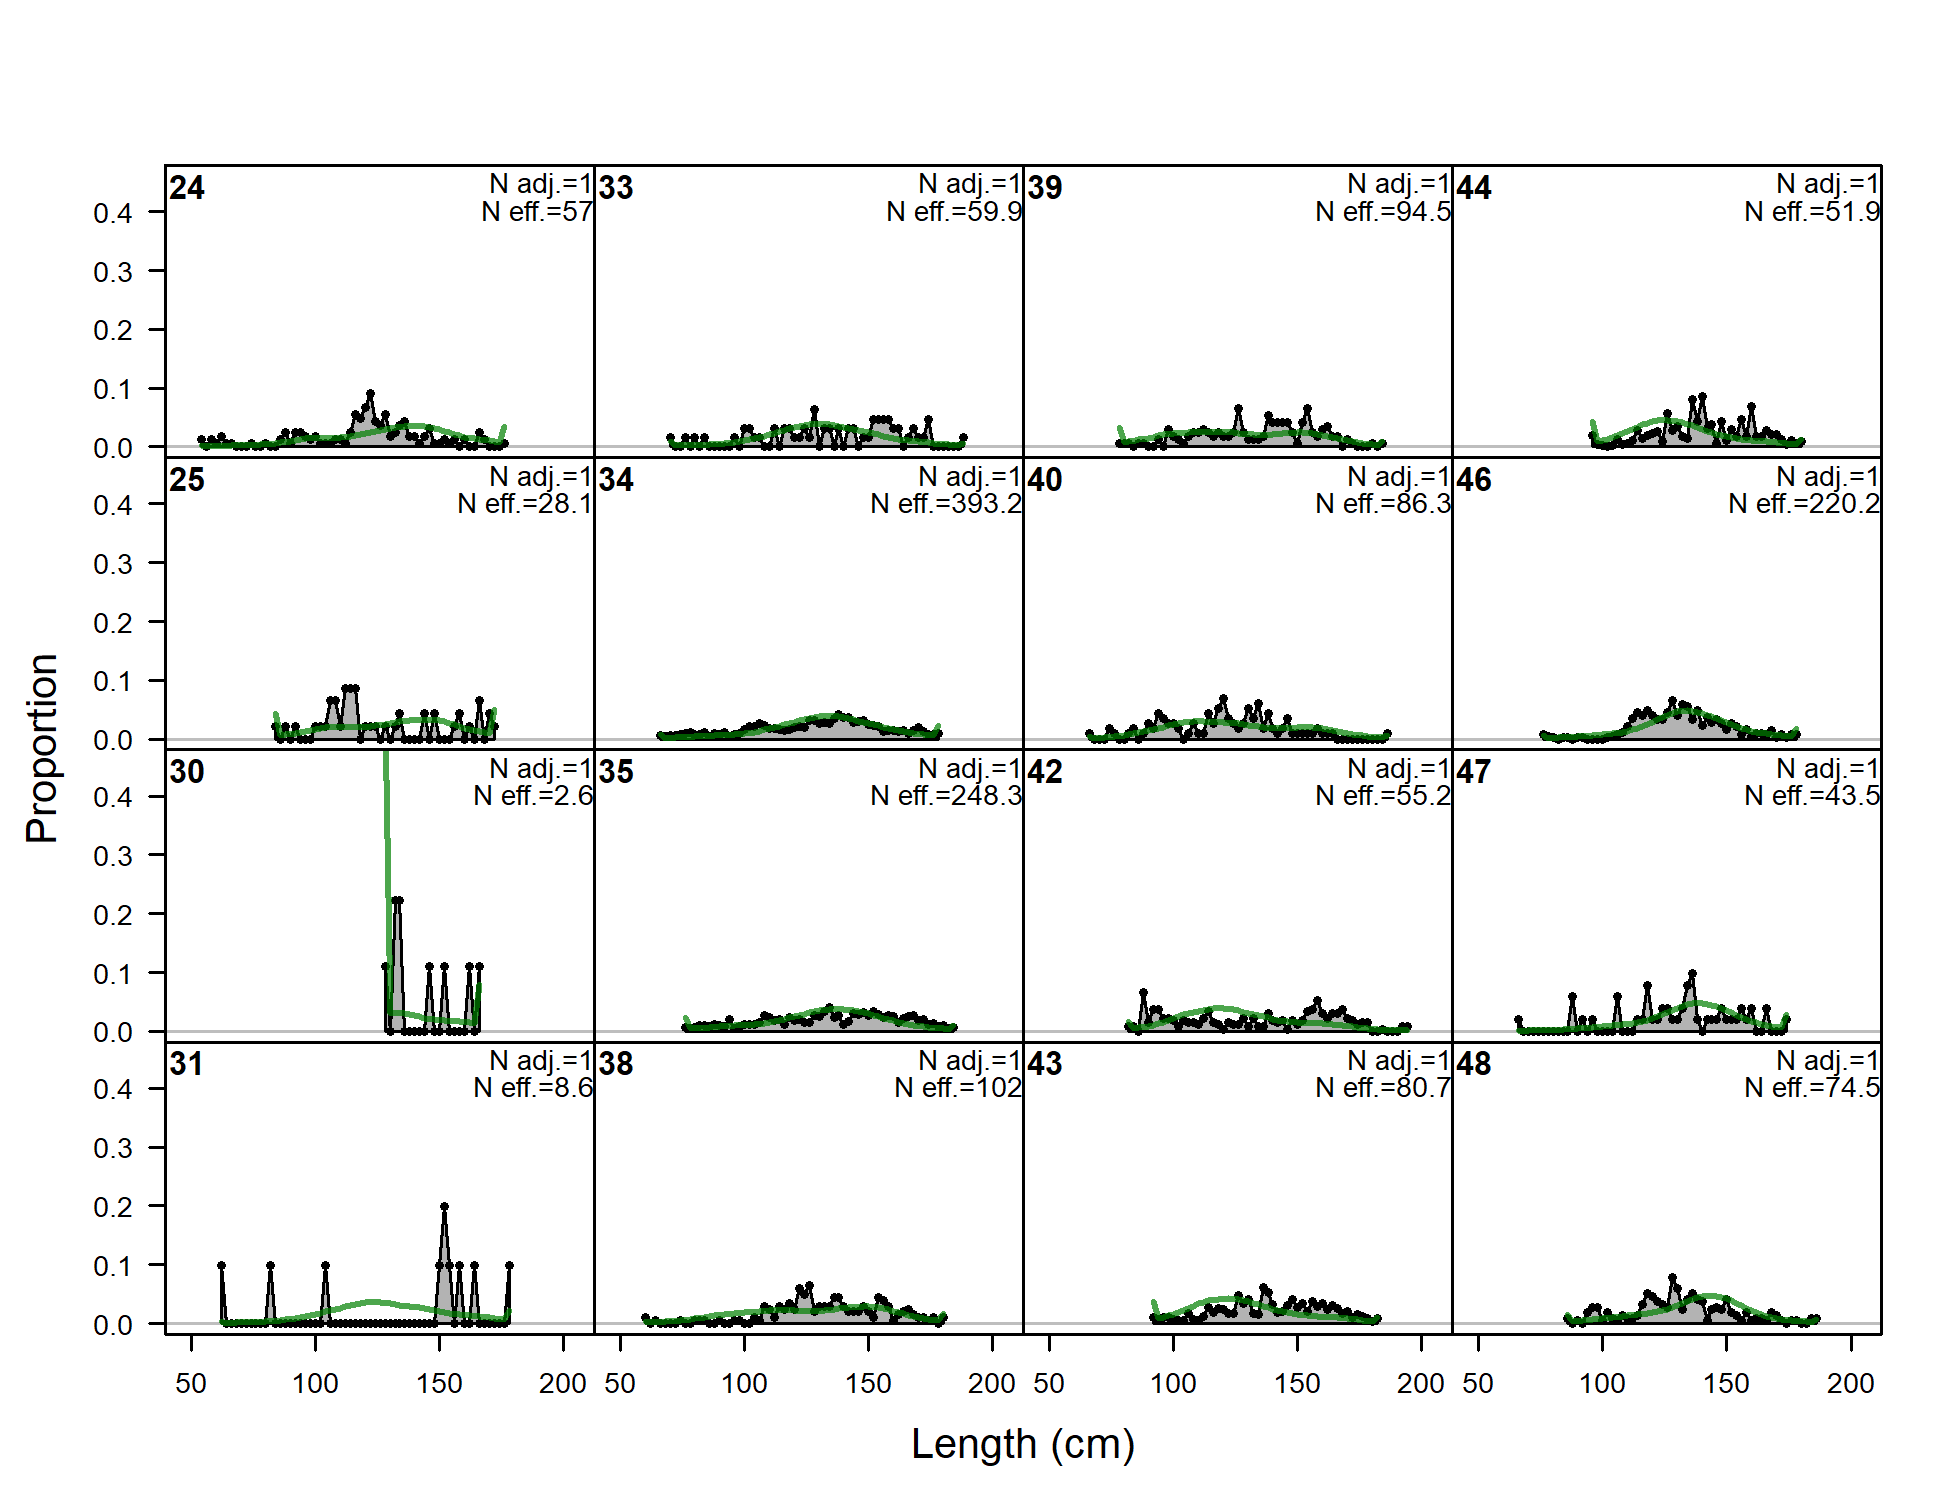
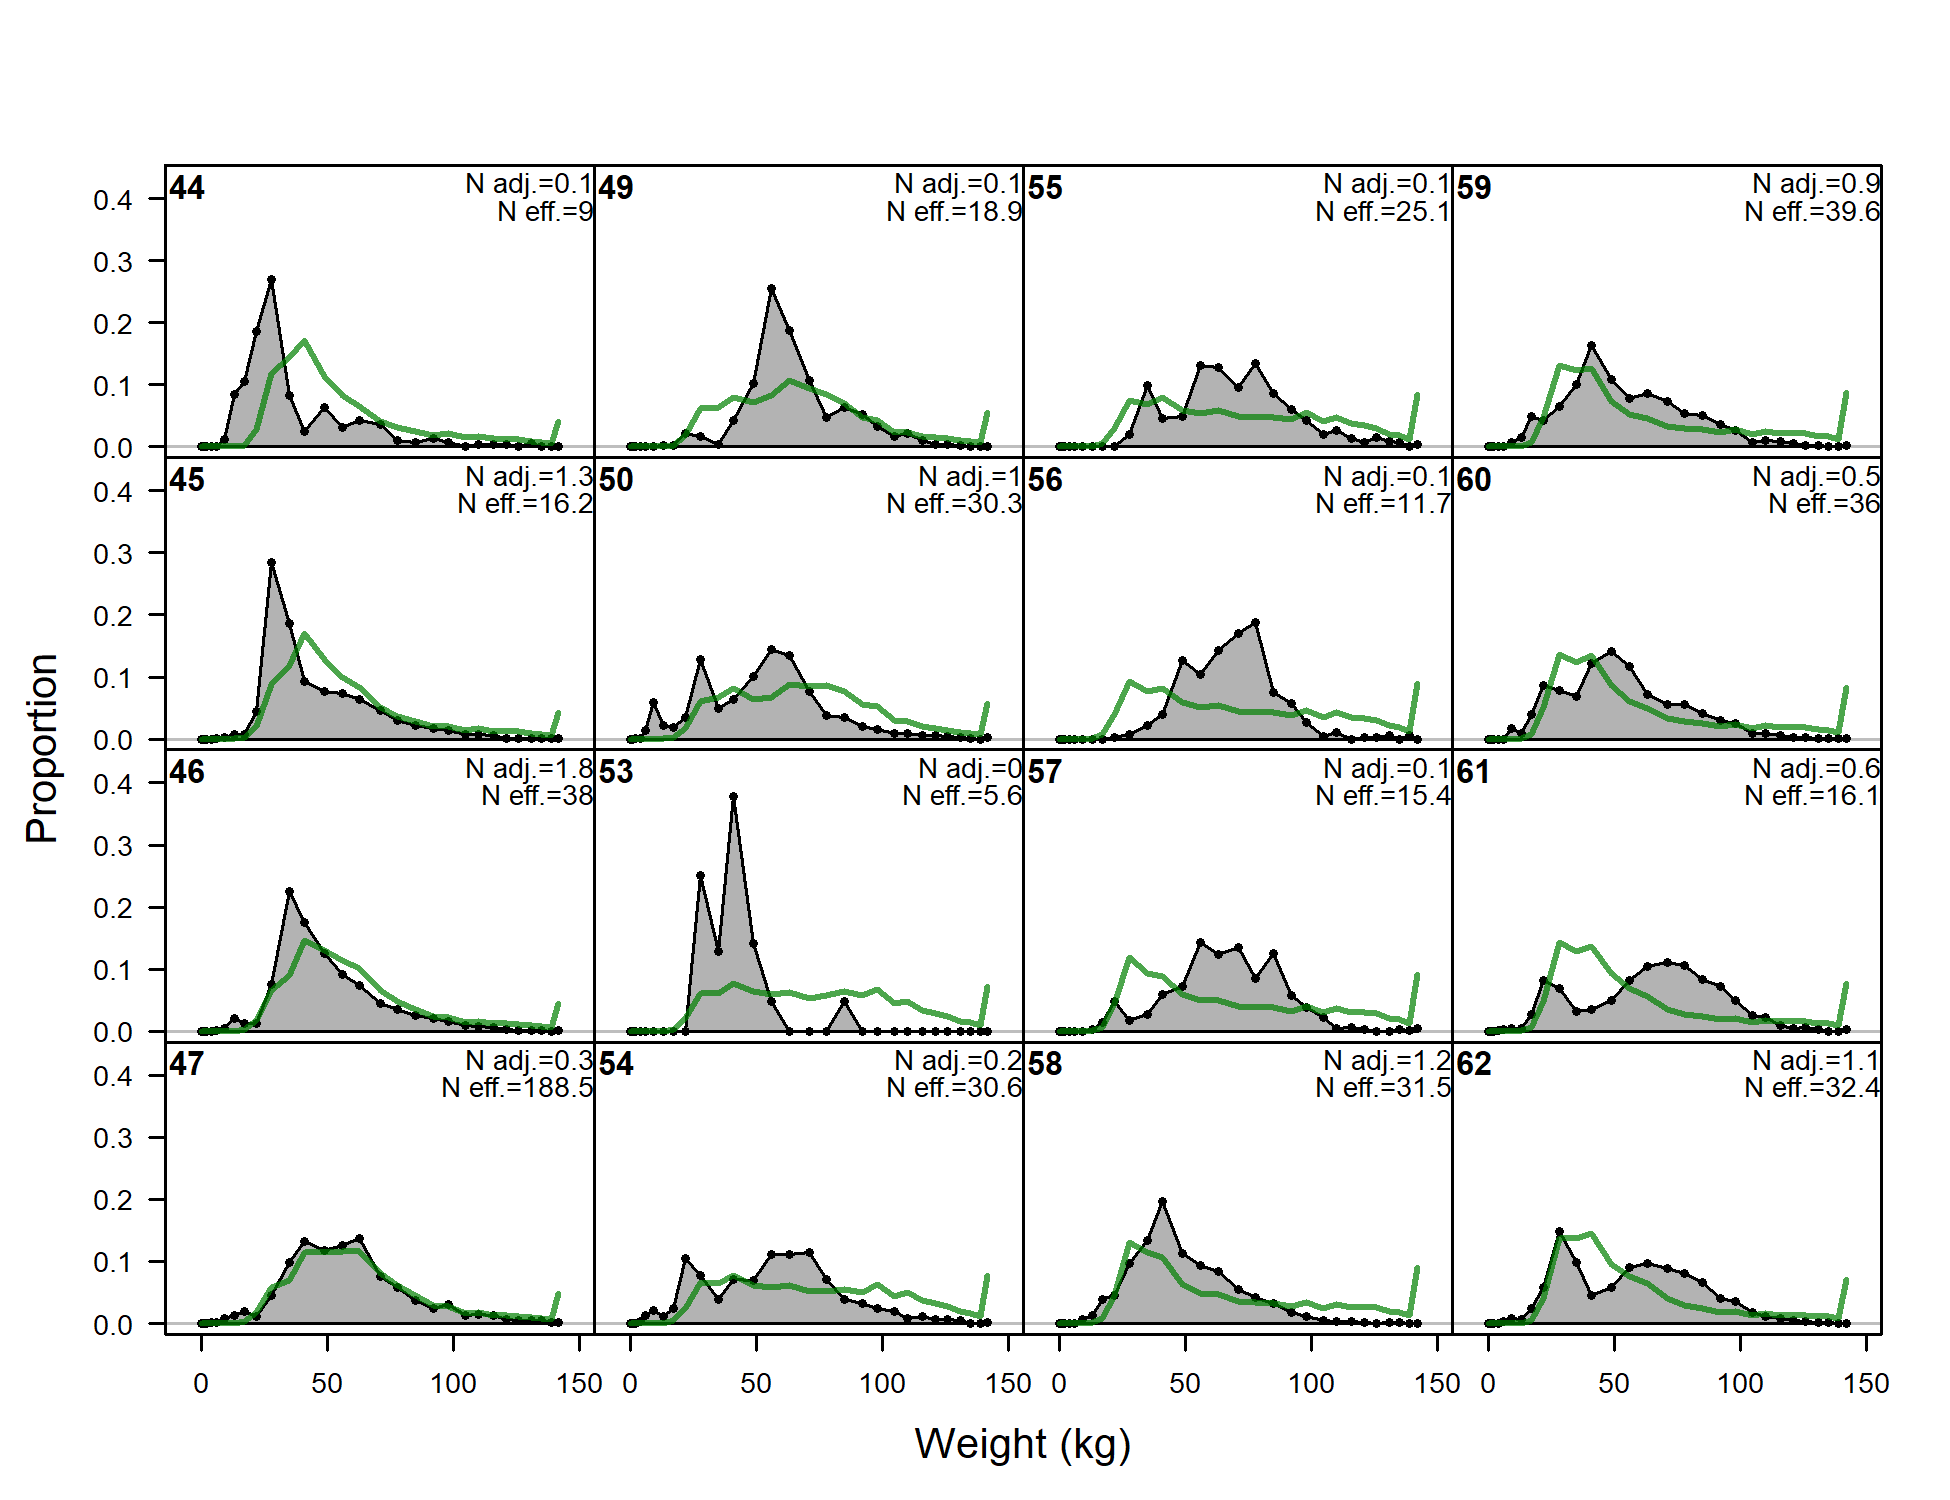
Length comps, whole catch, F1-OBJ_early (plot 2 of 4)
file: comp_lenfit_flt1mkt0_page2.png
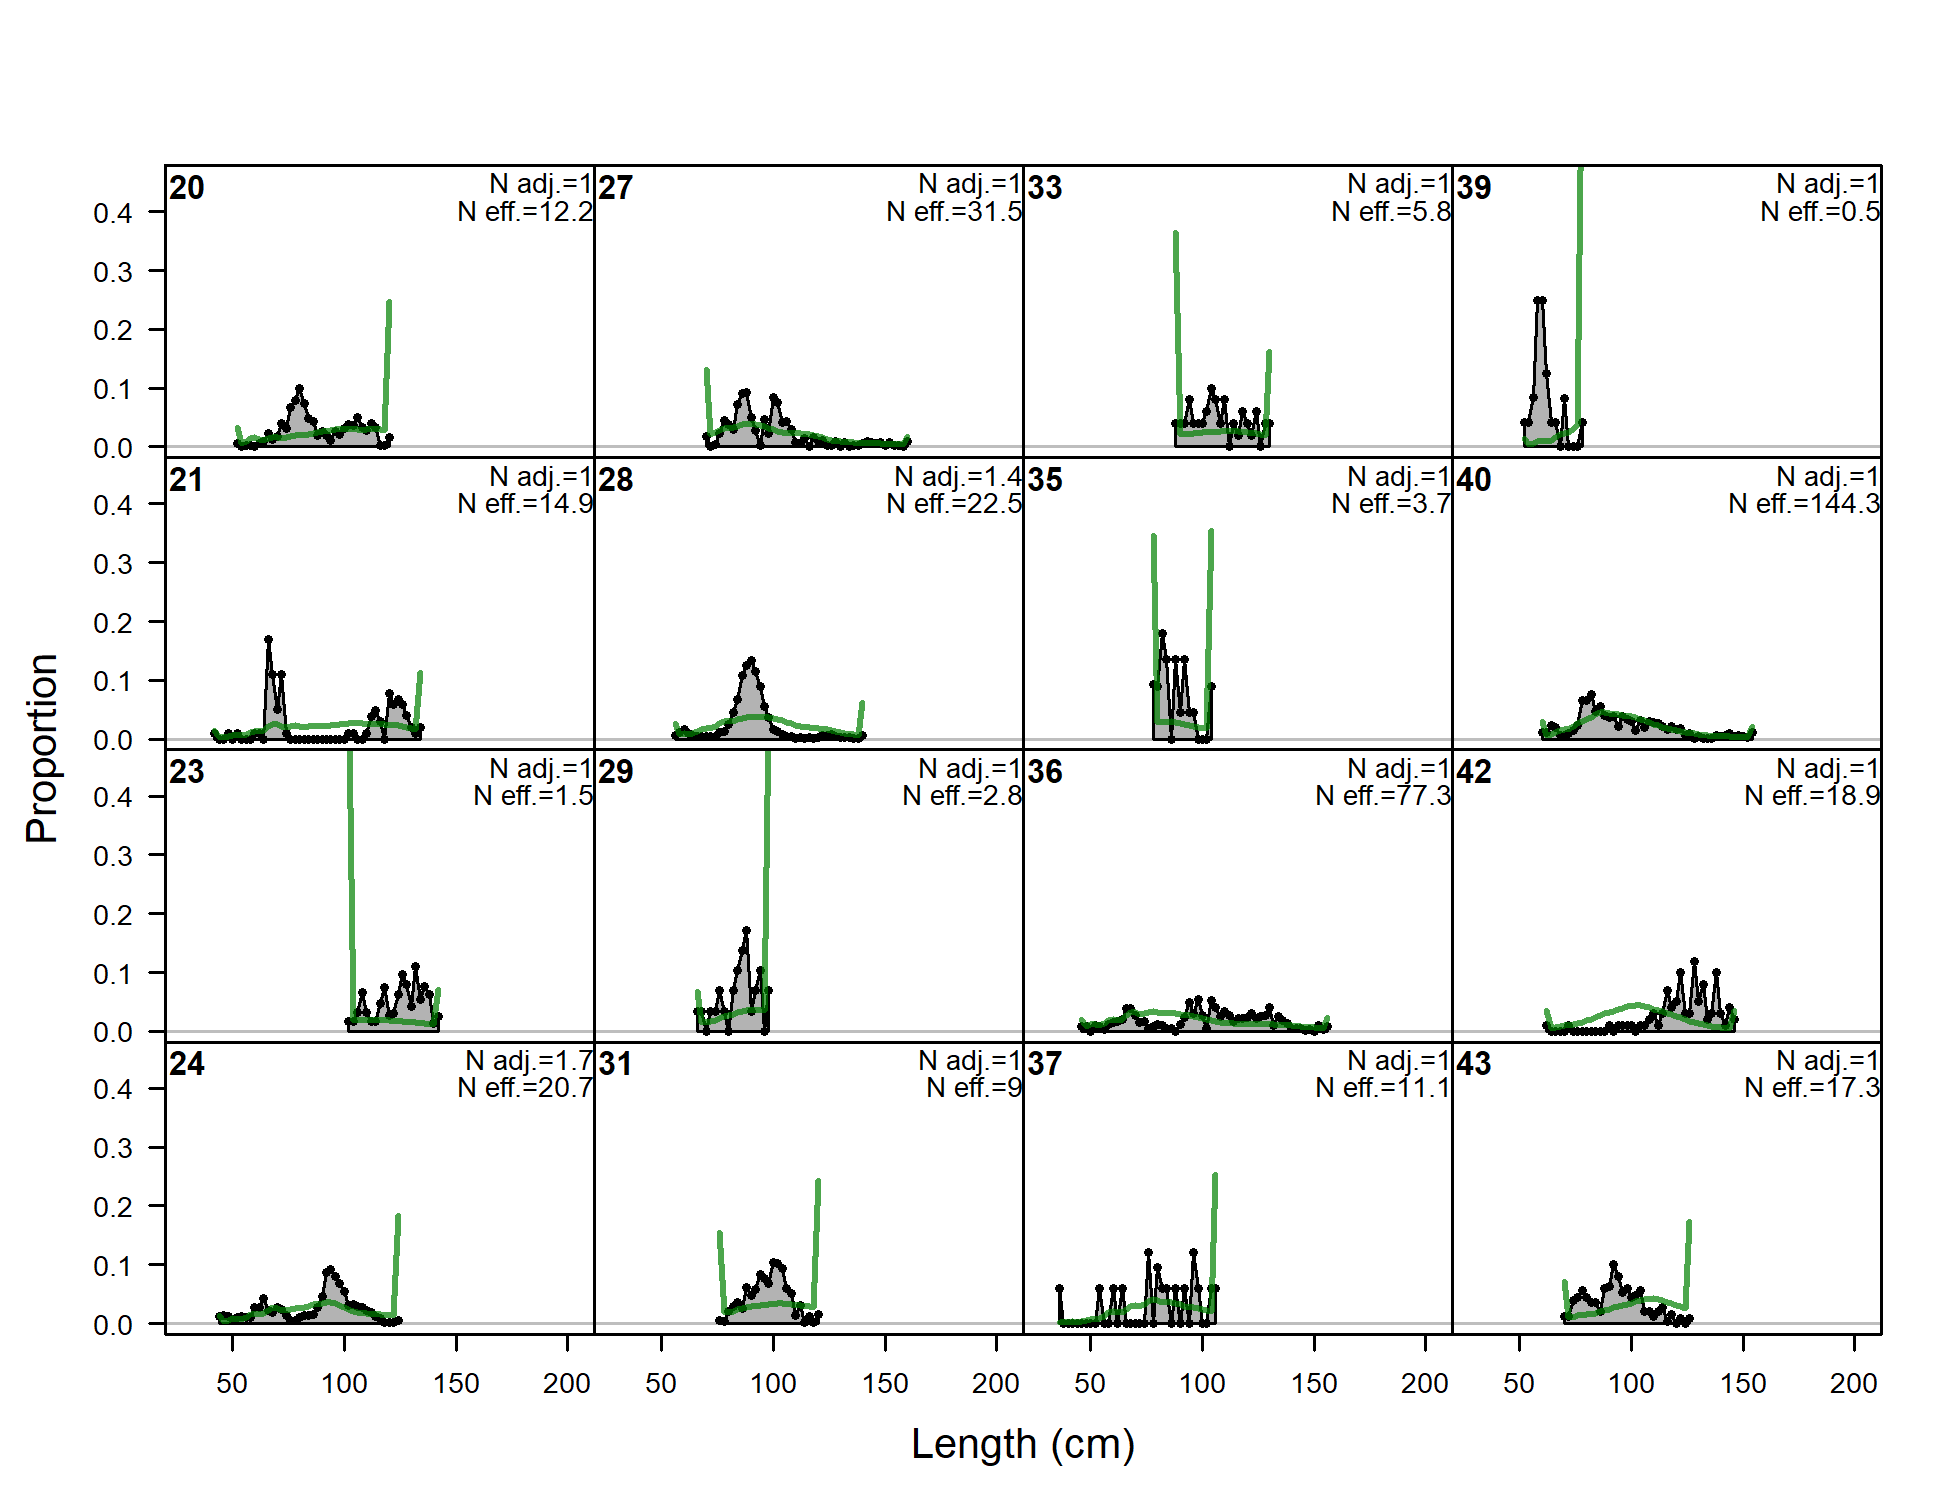
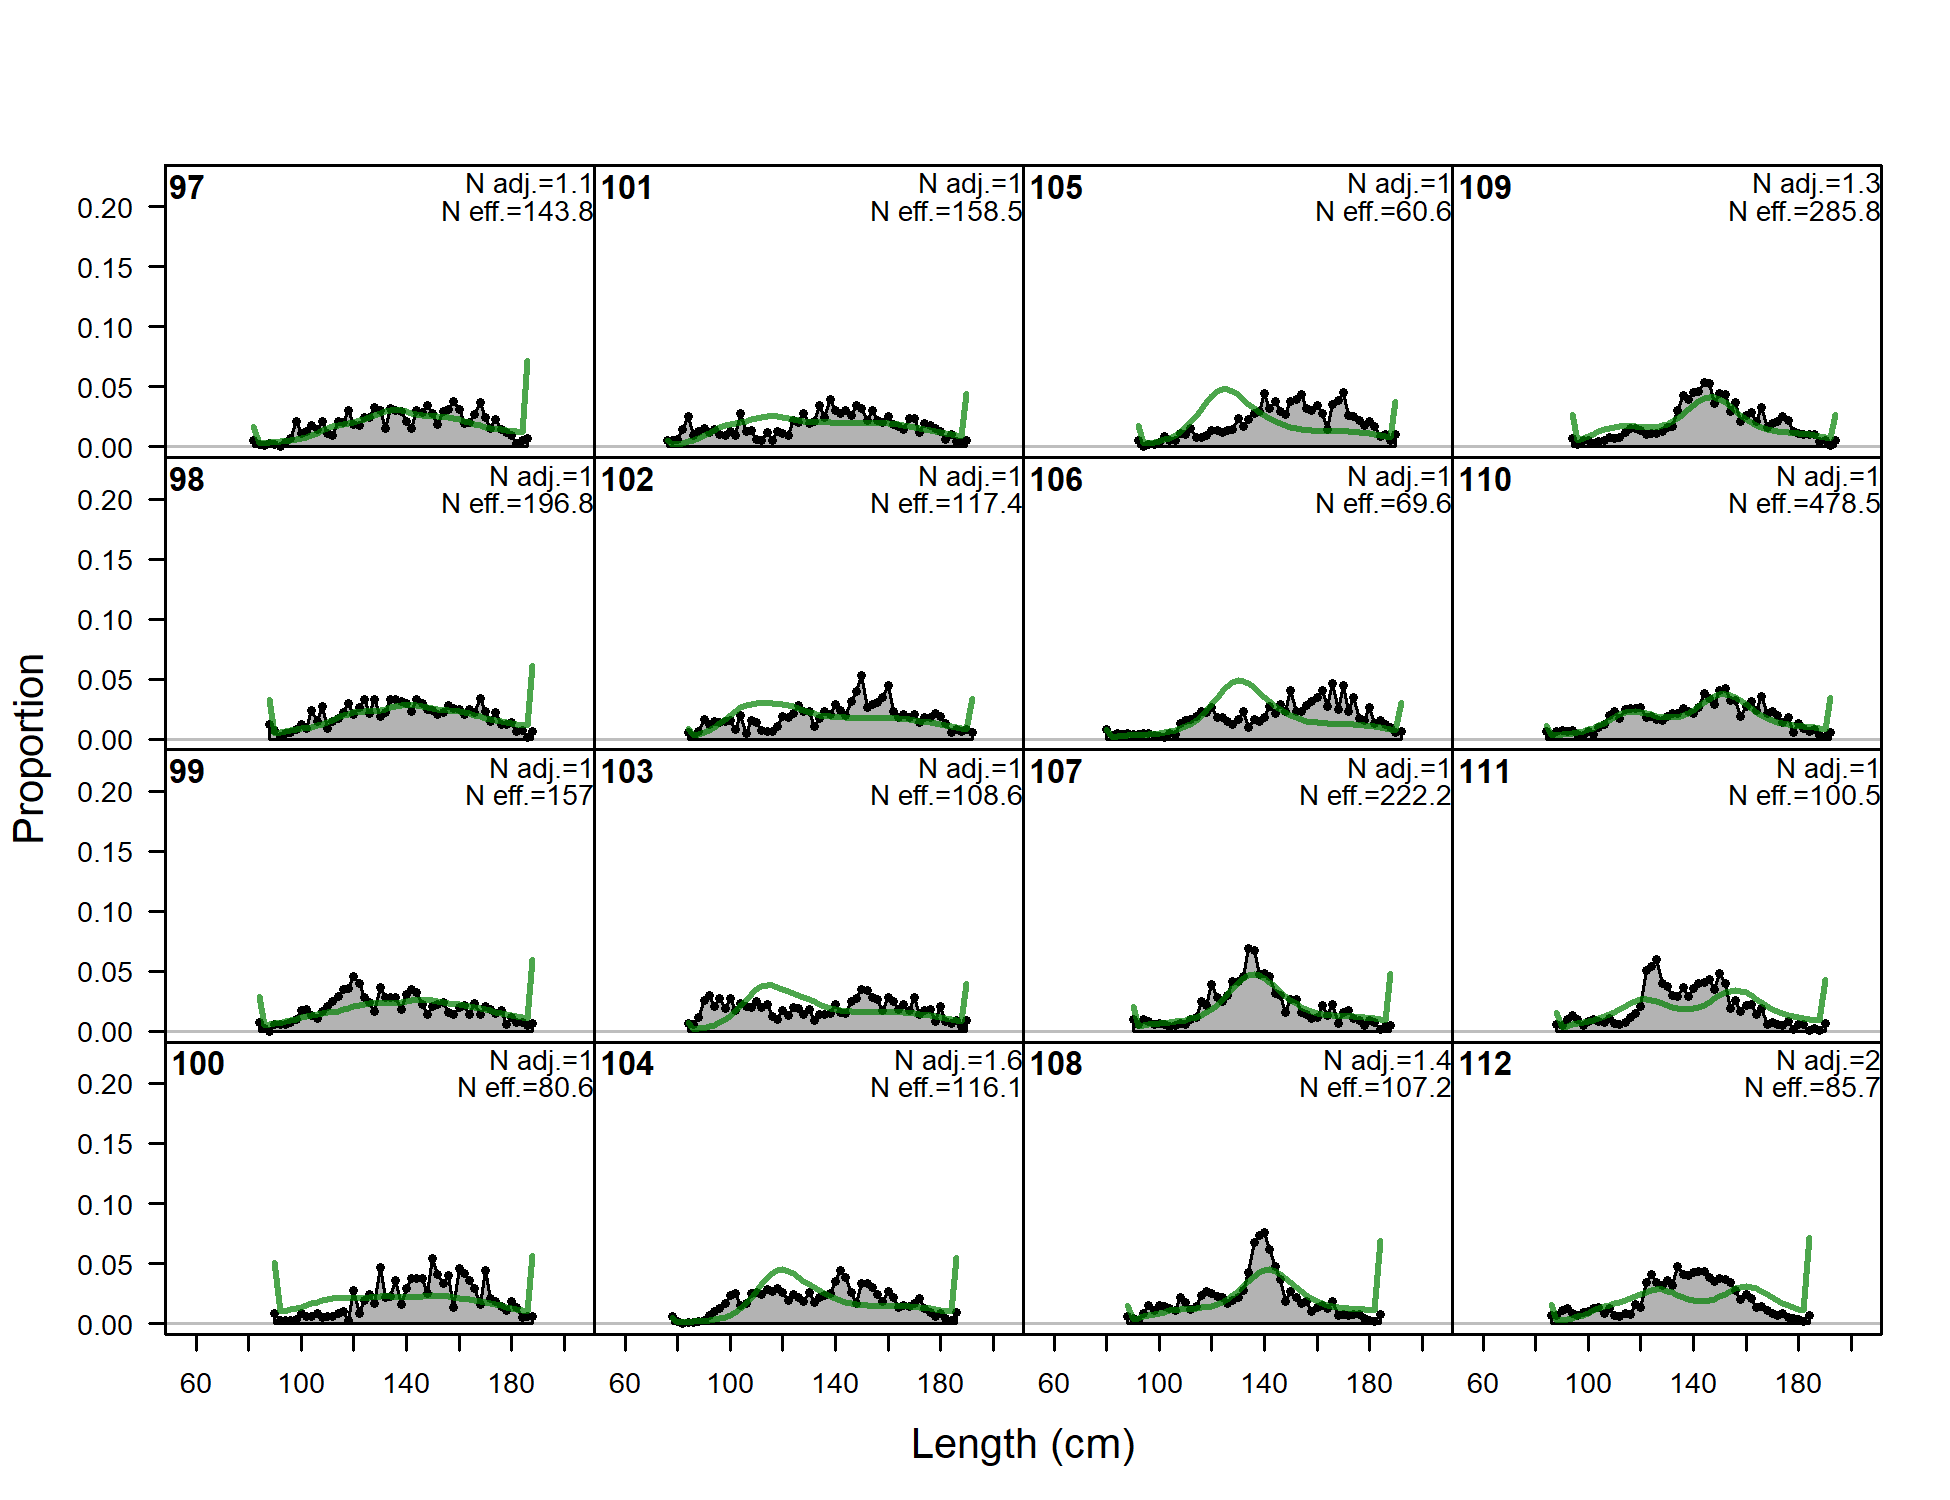
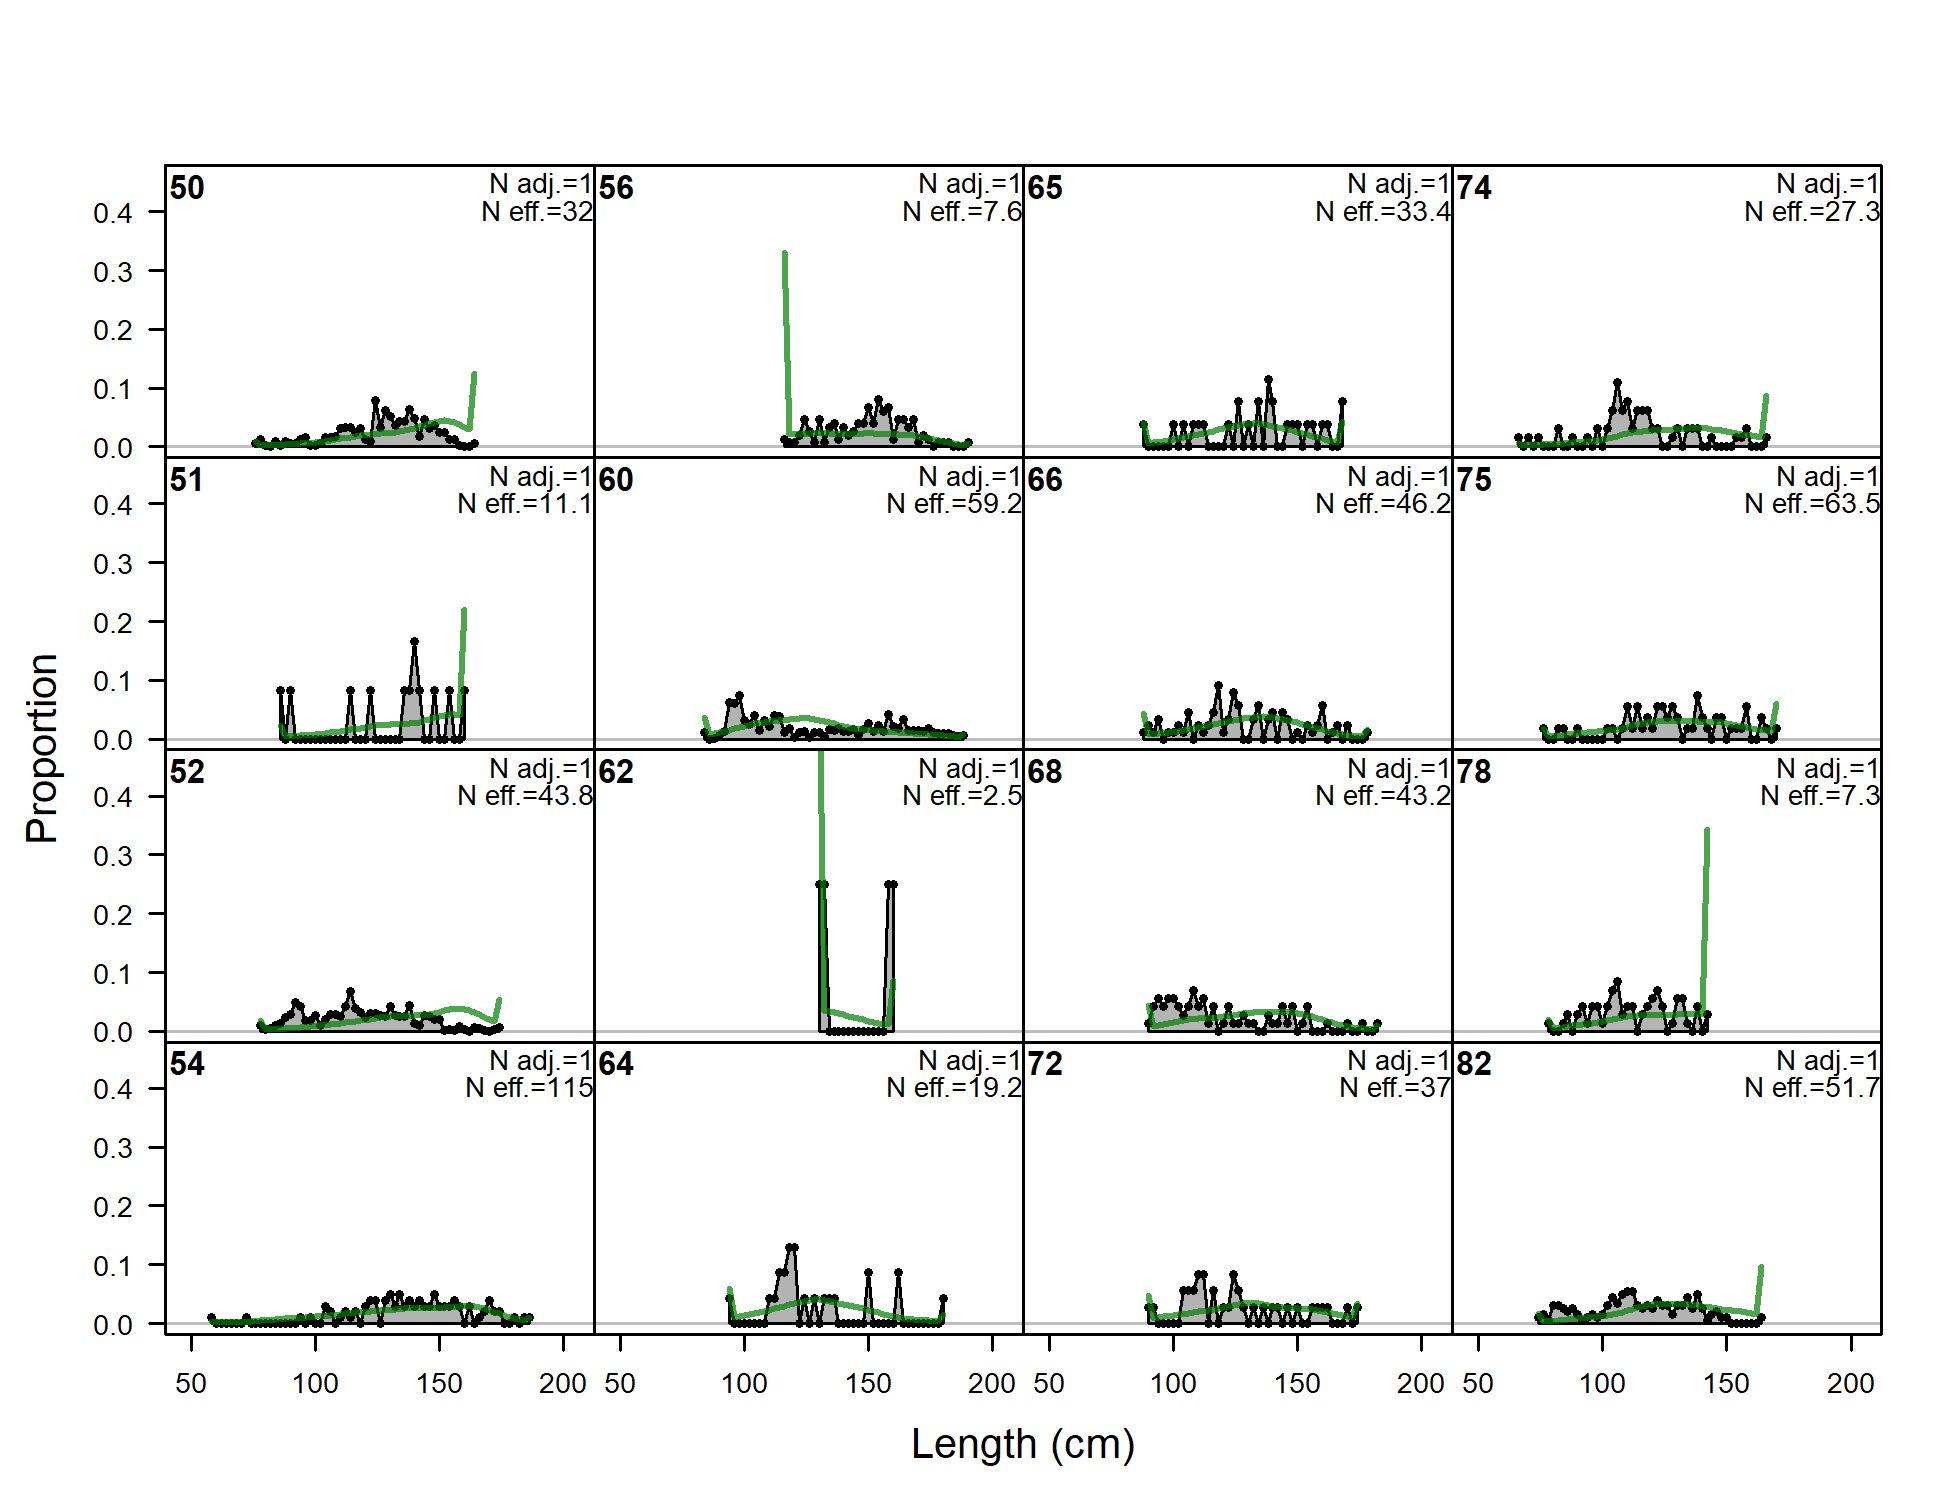
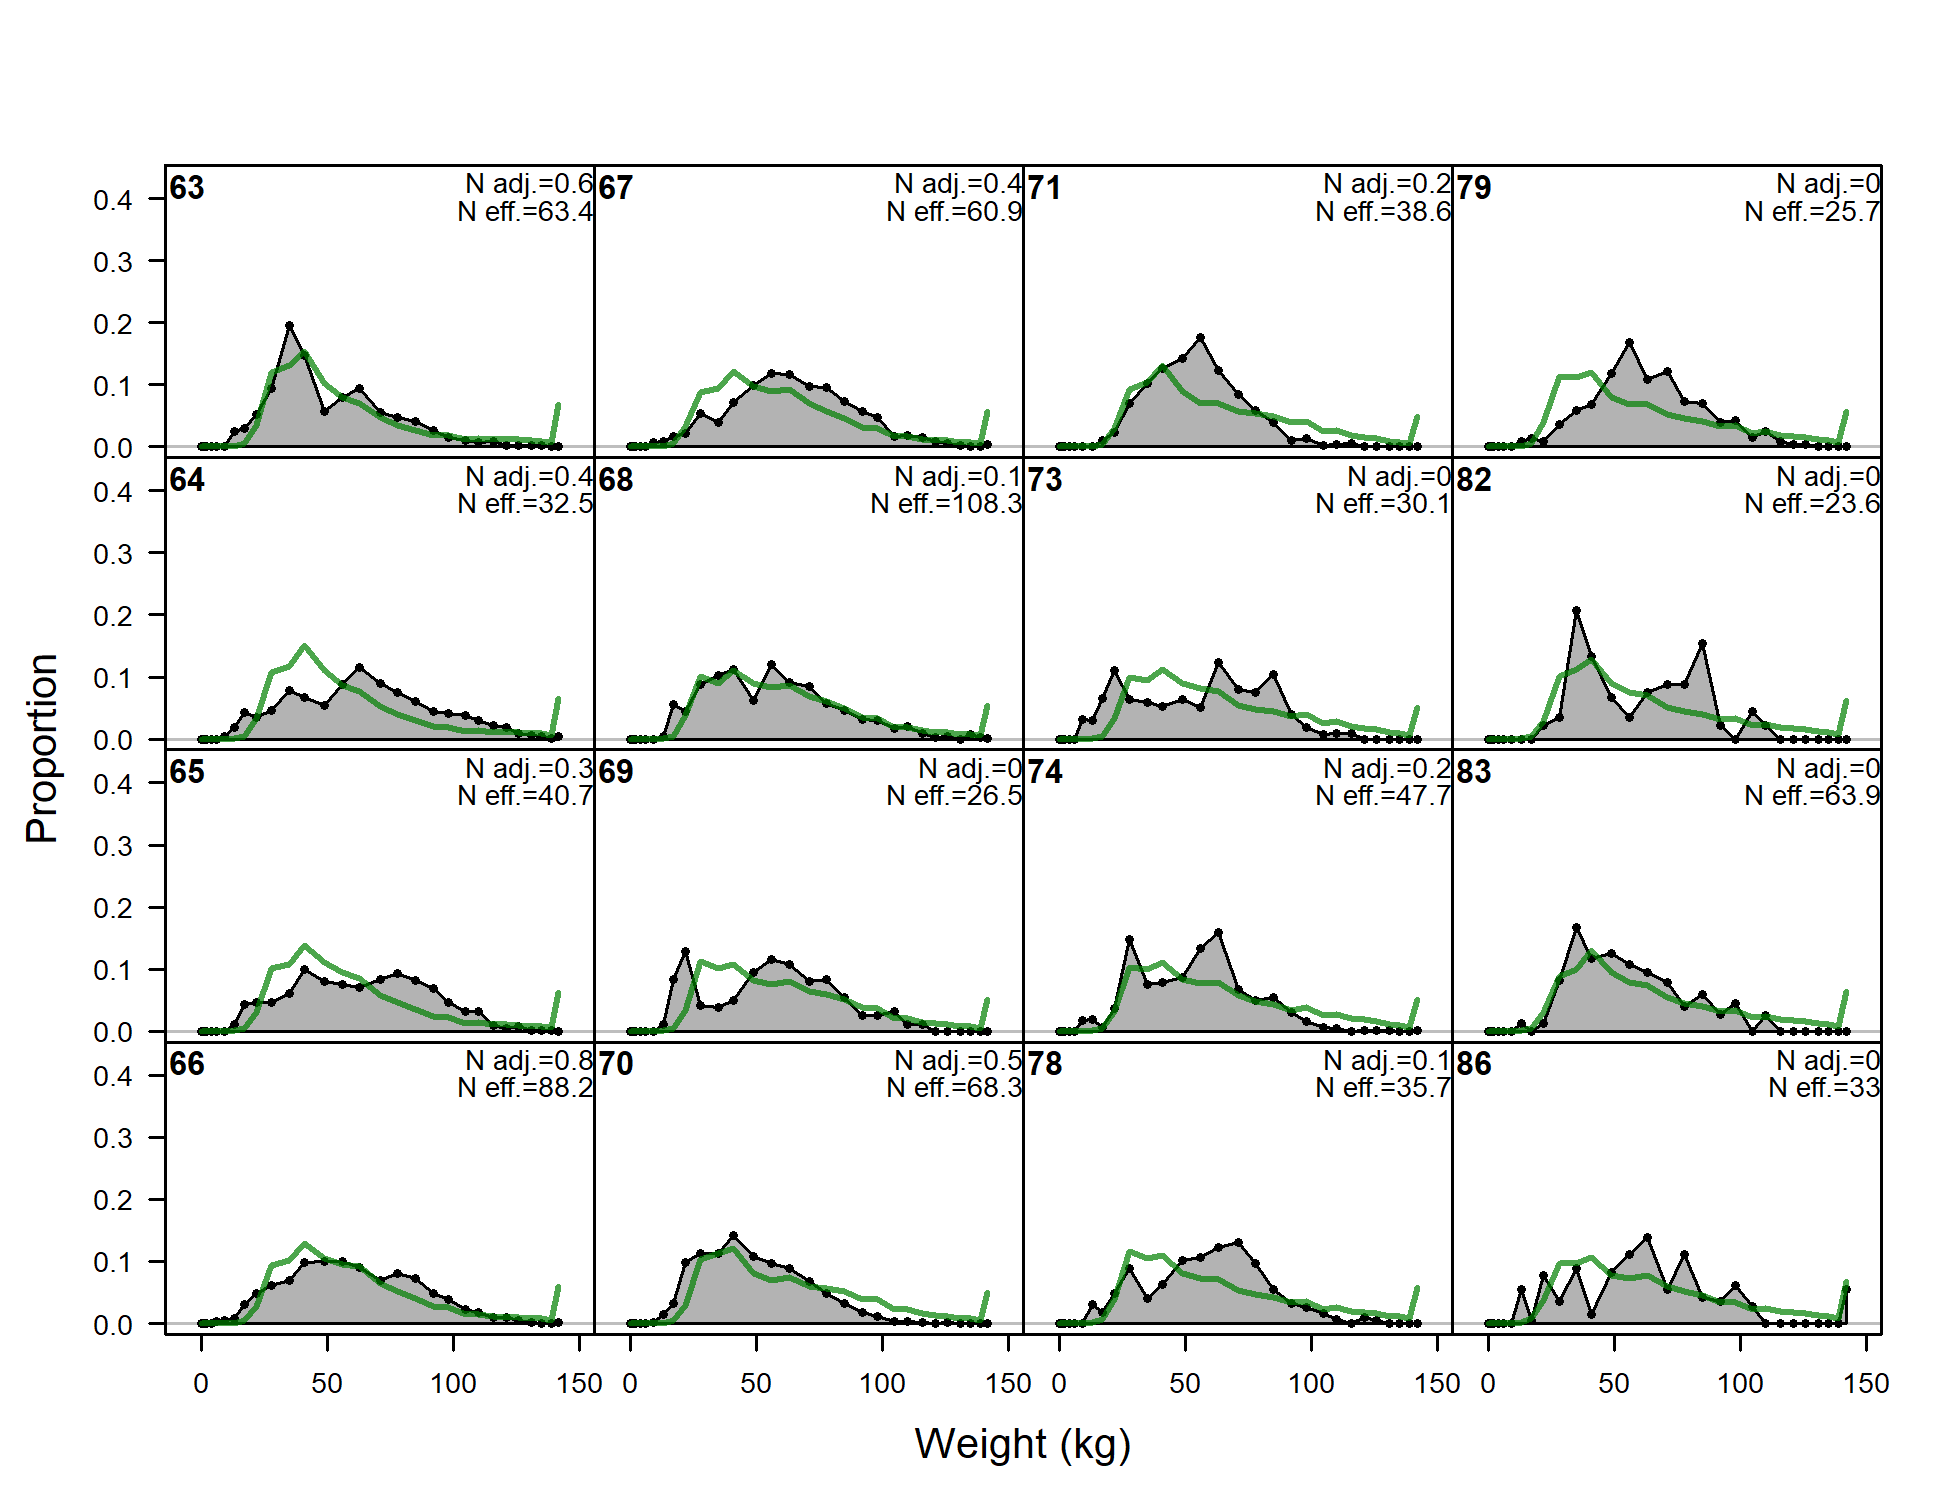
Length comps, whole catch, F1-OBJ_early (plot 3 of 4)
file: comp_lenfit_flt1mkt0_page3.png
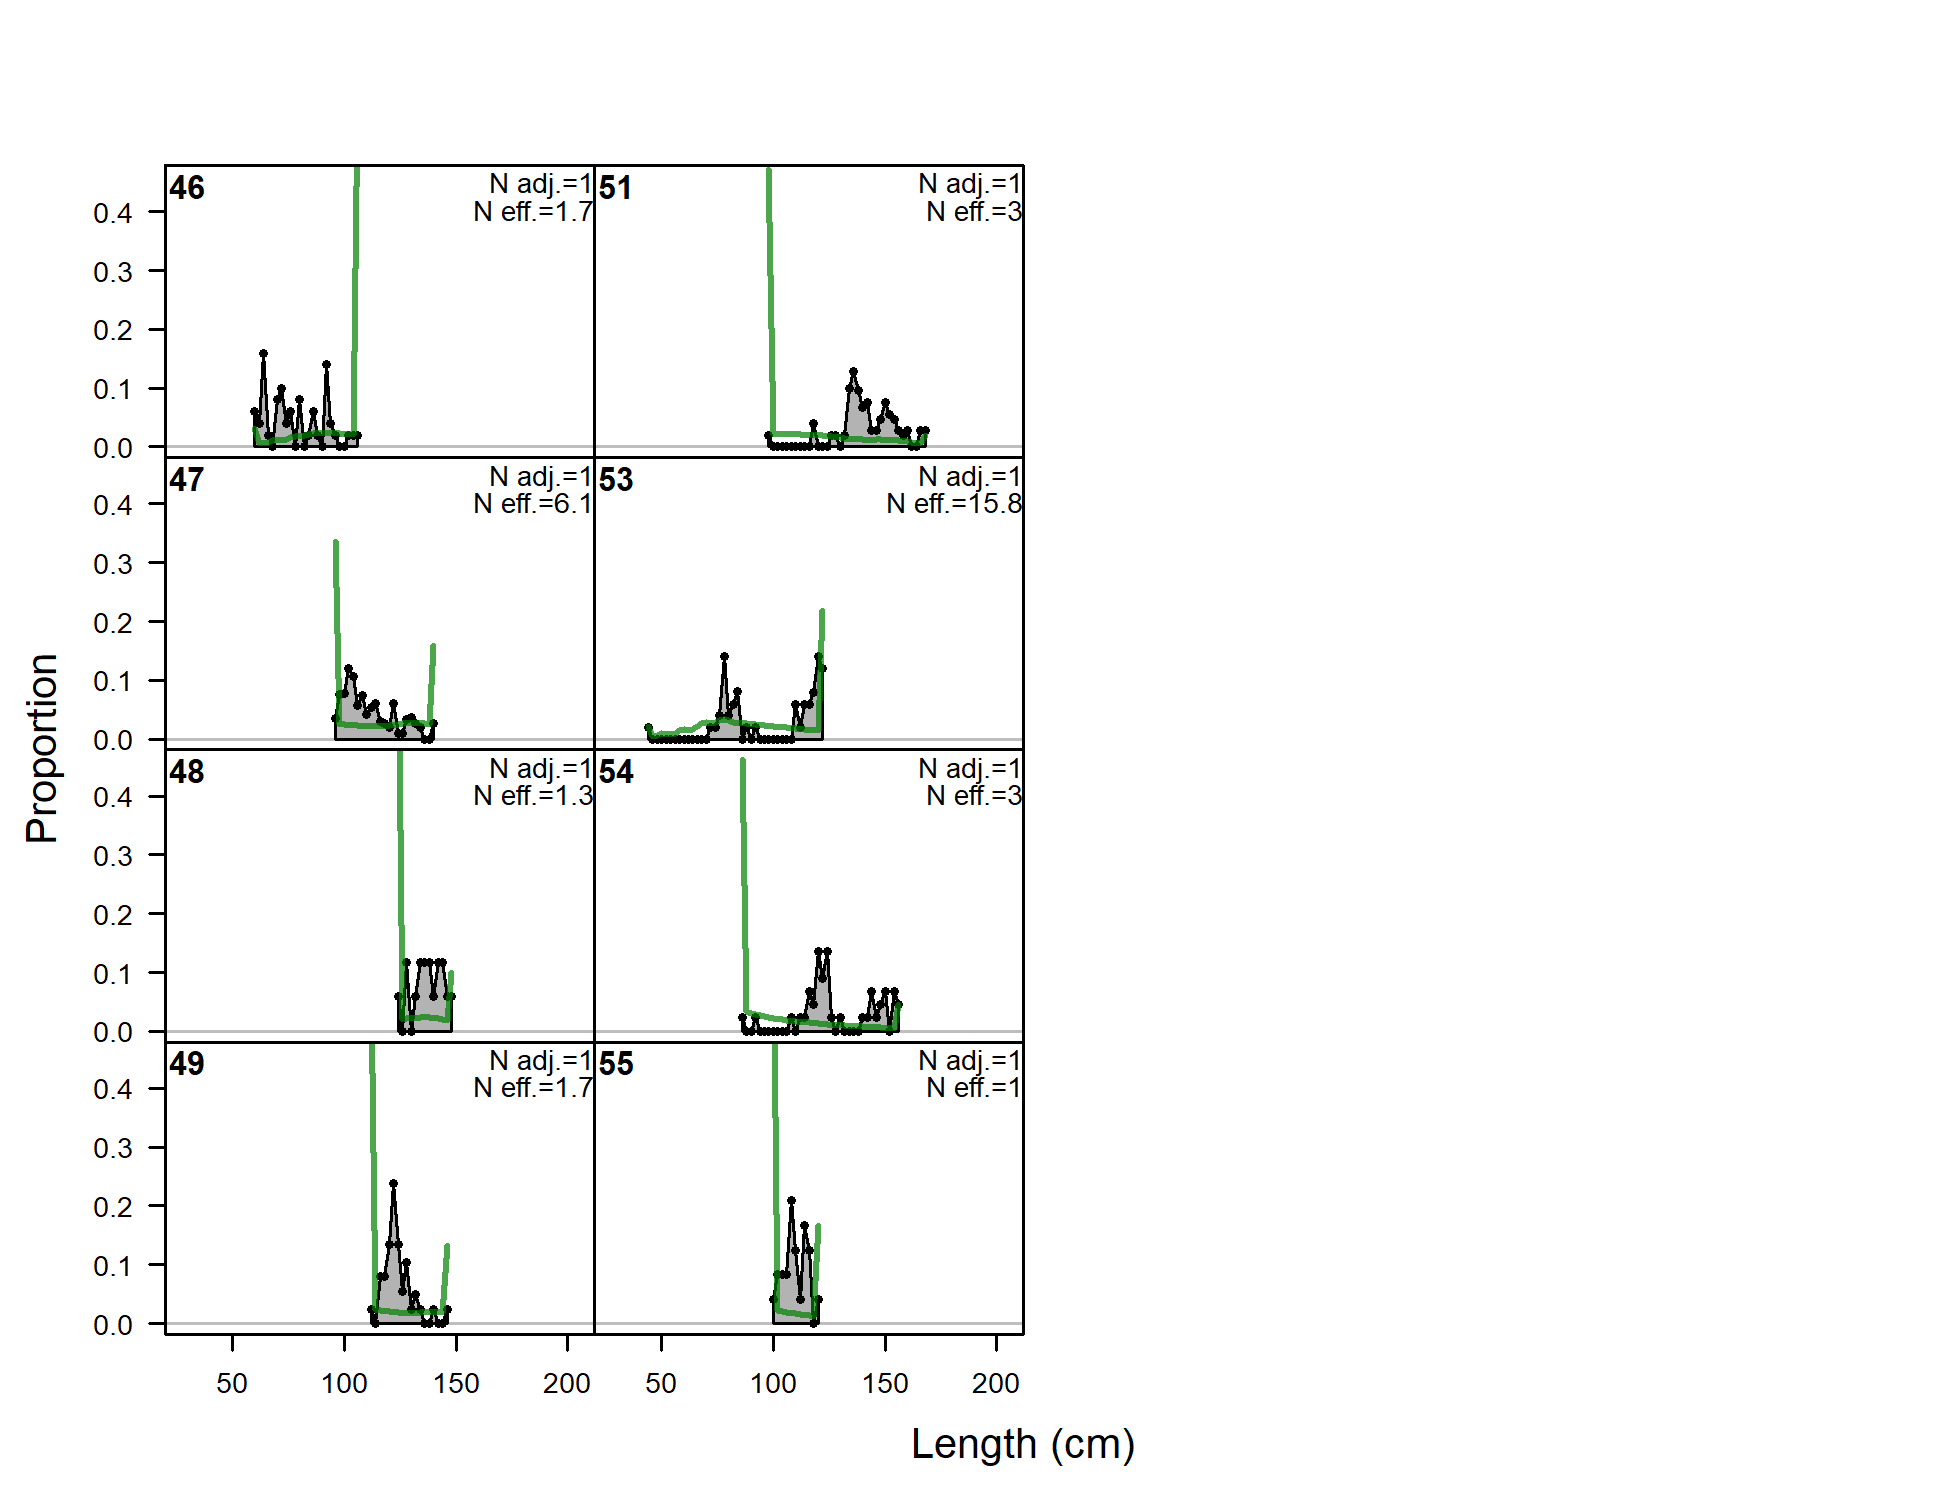
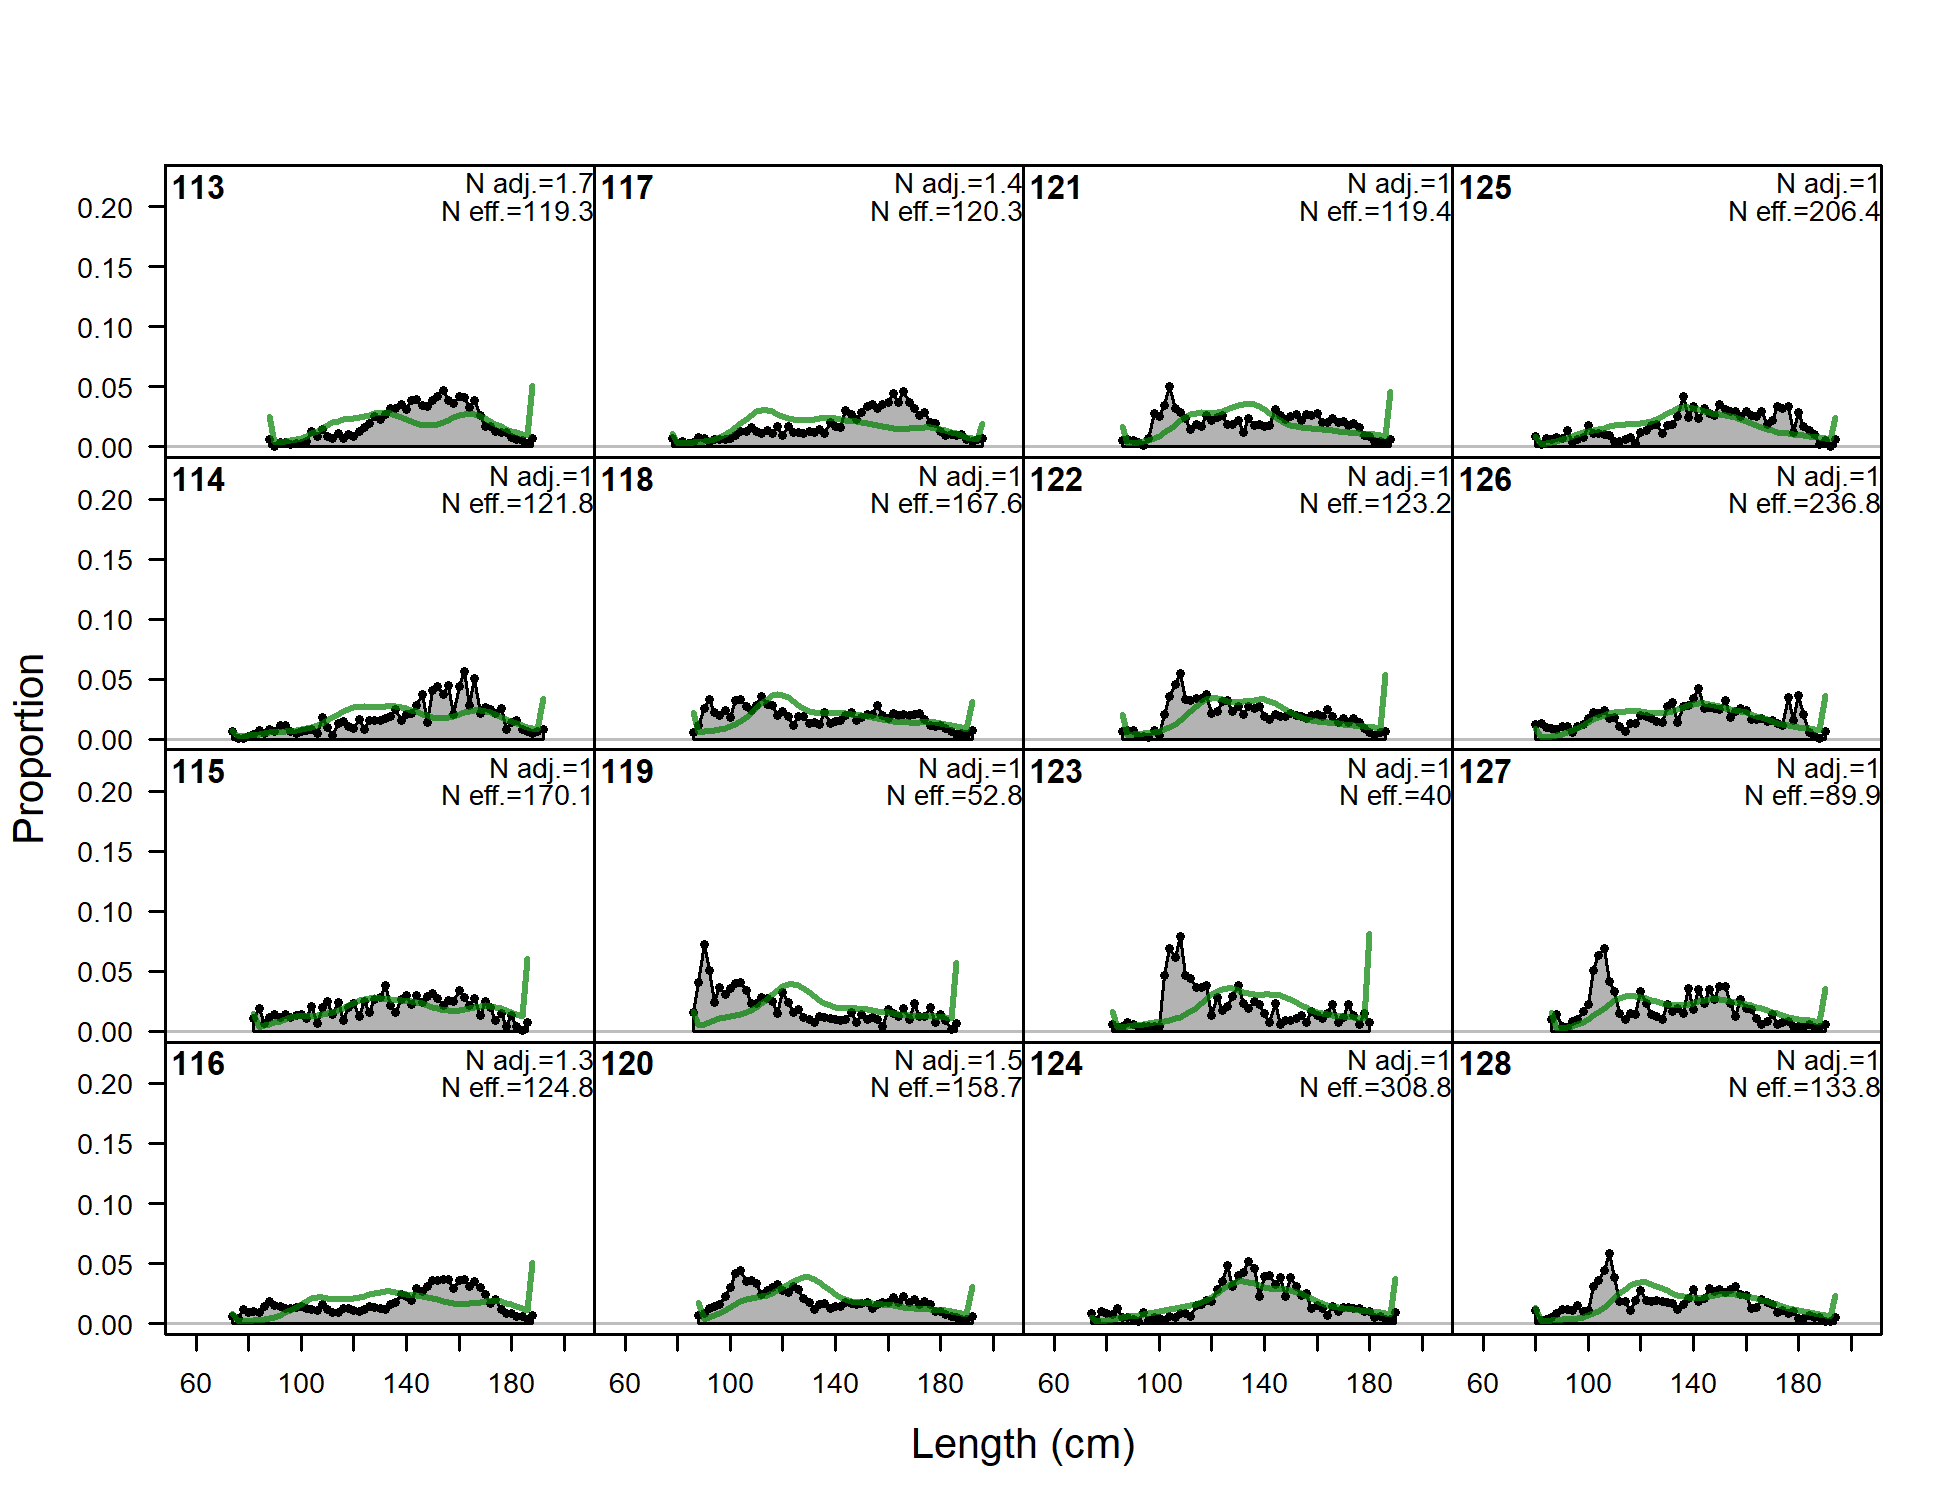
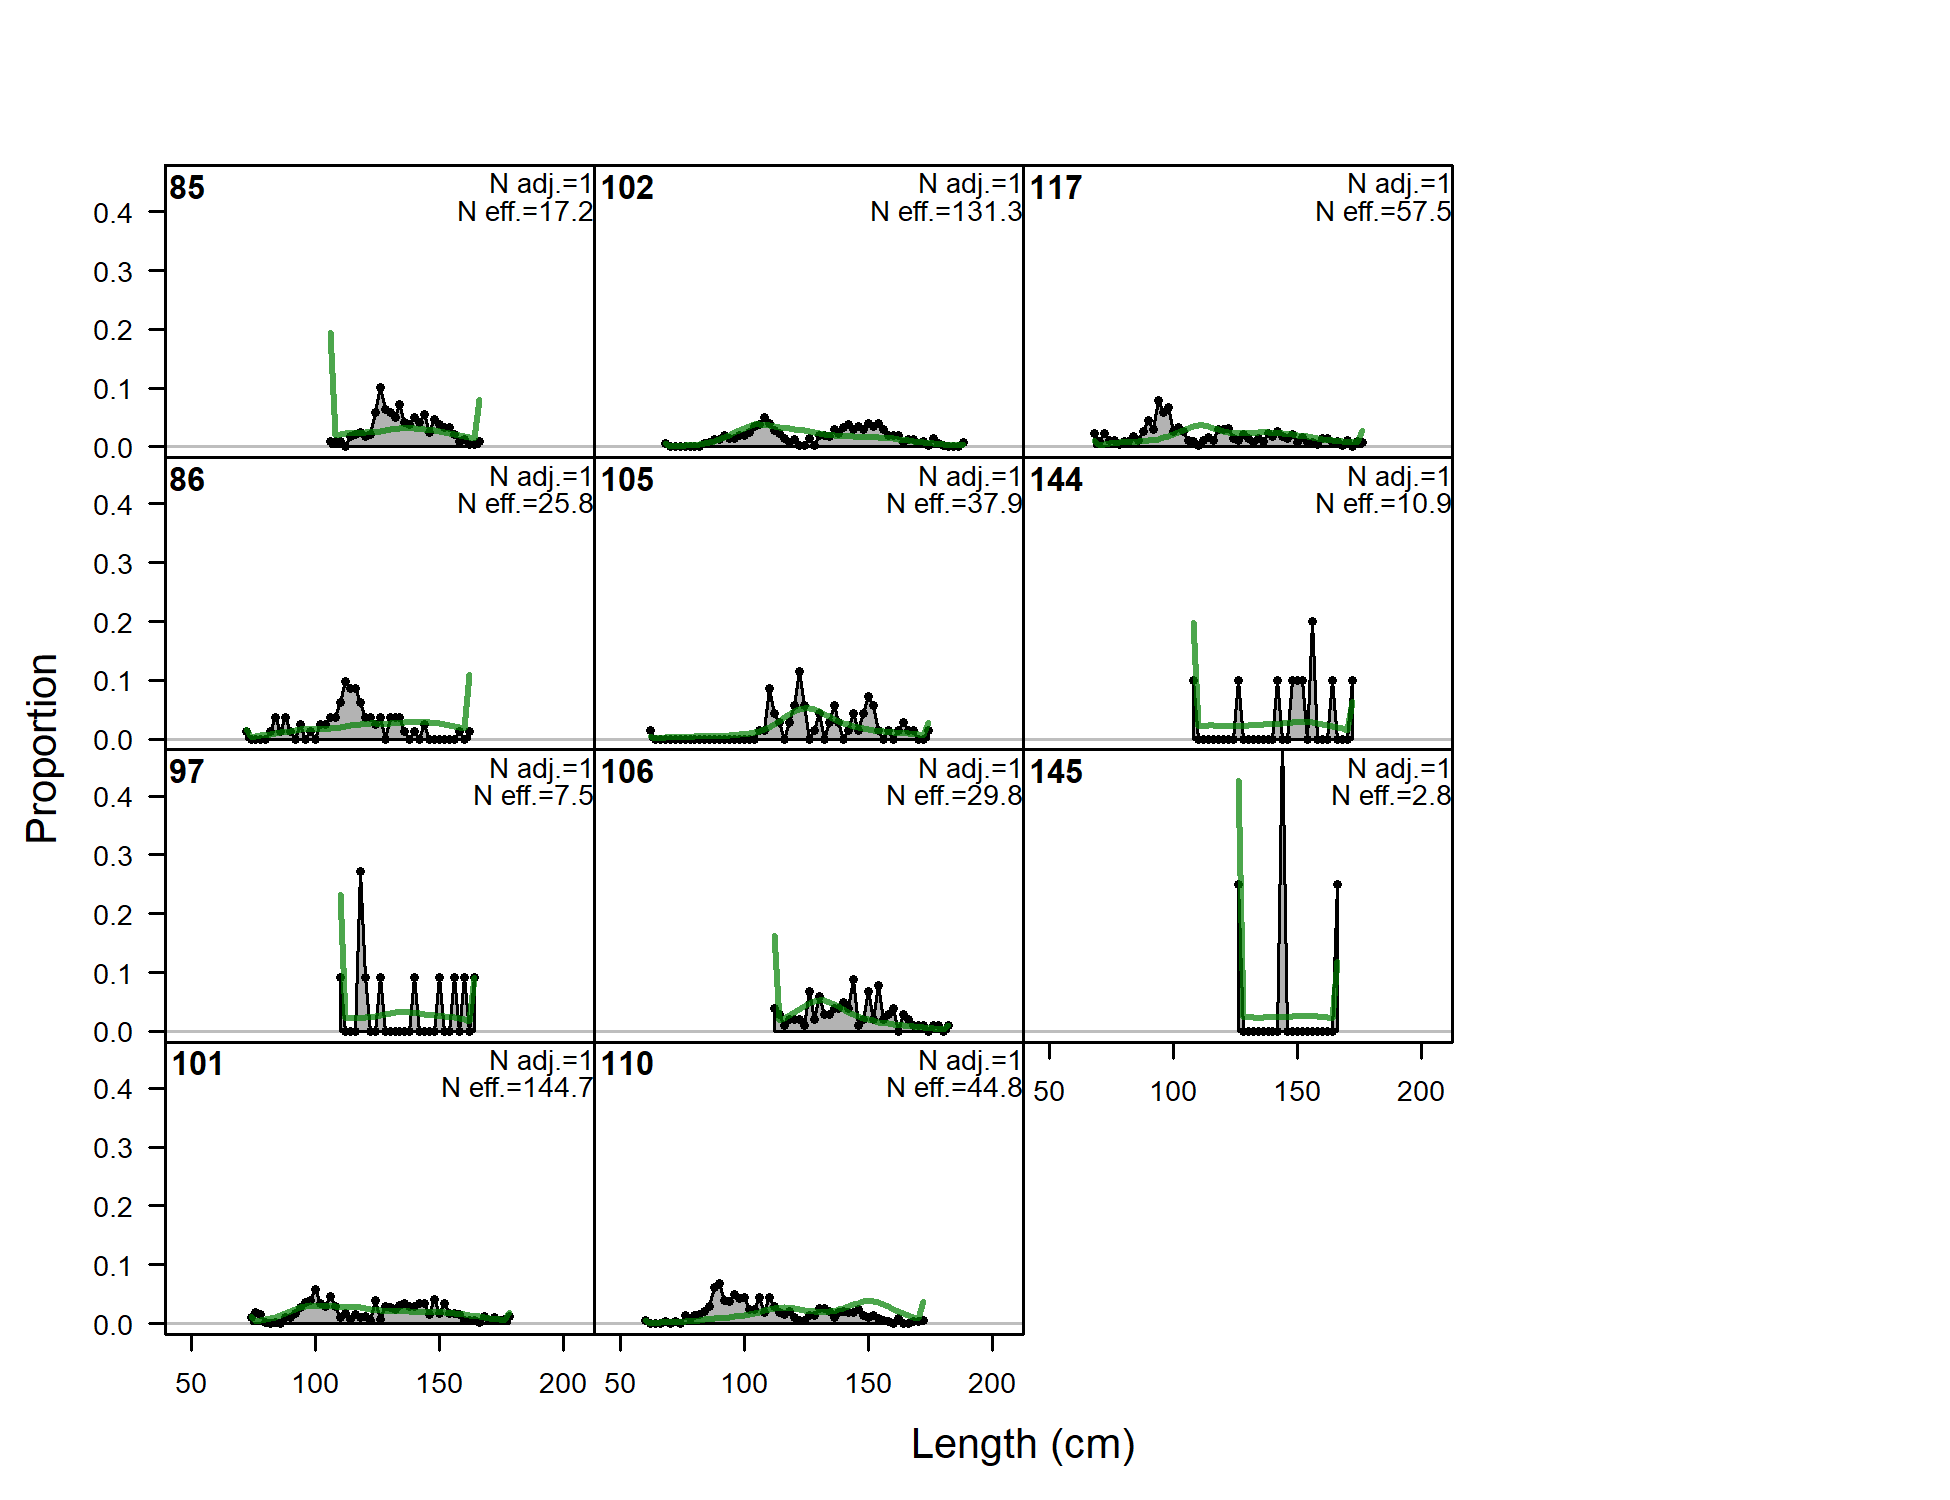
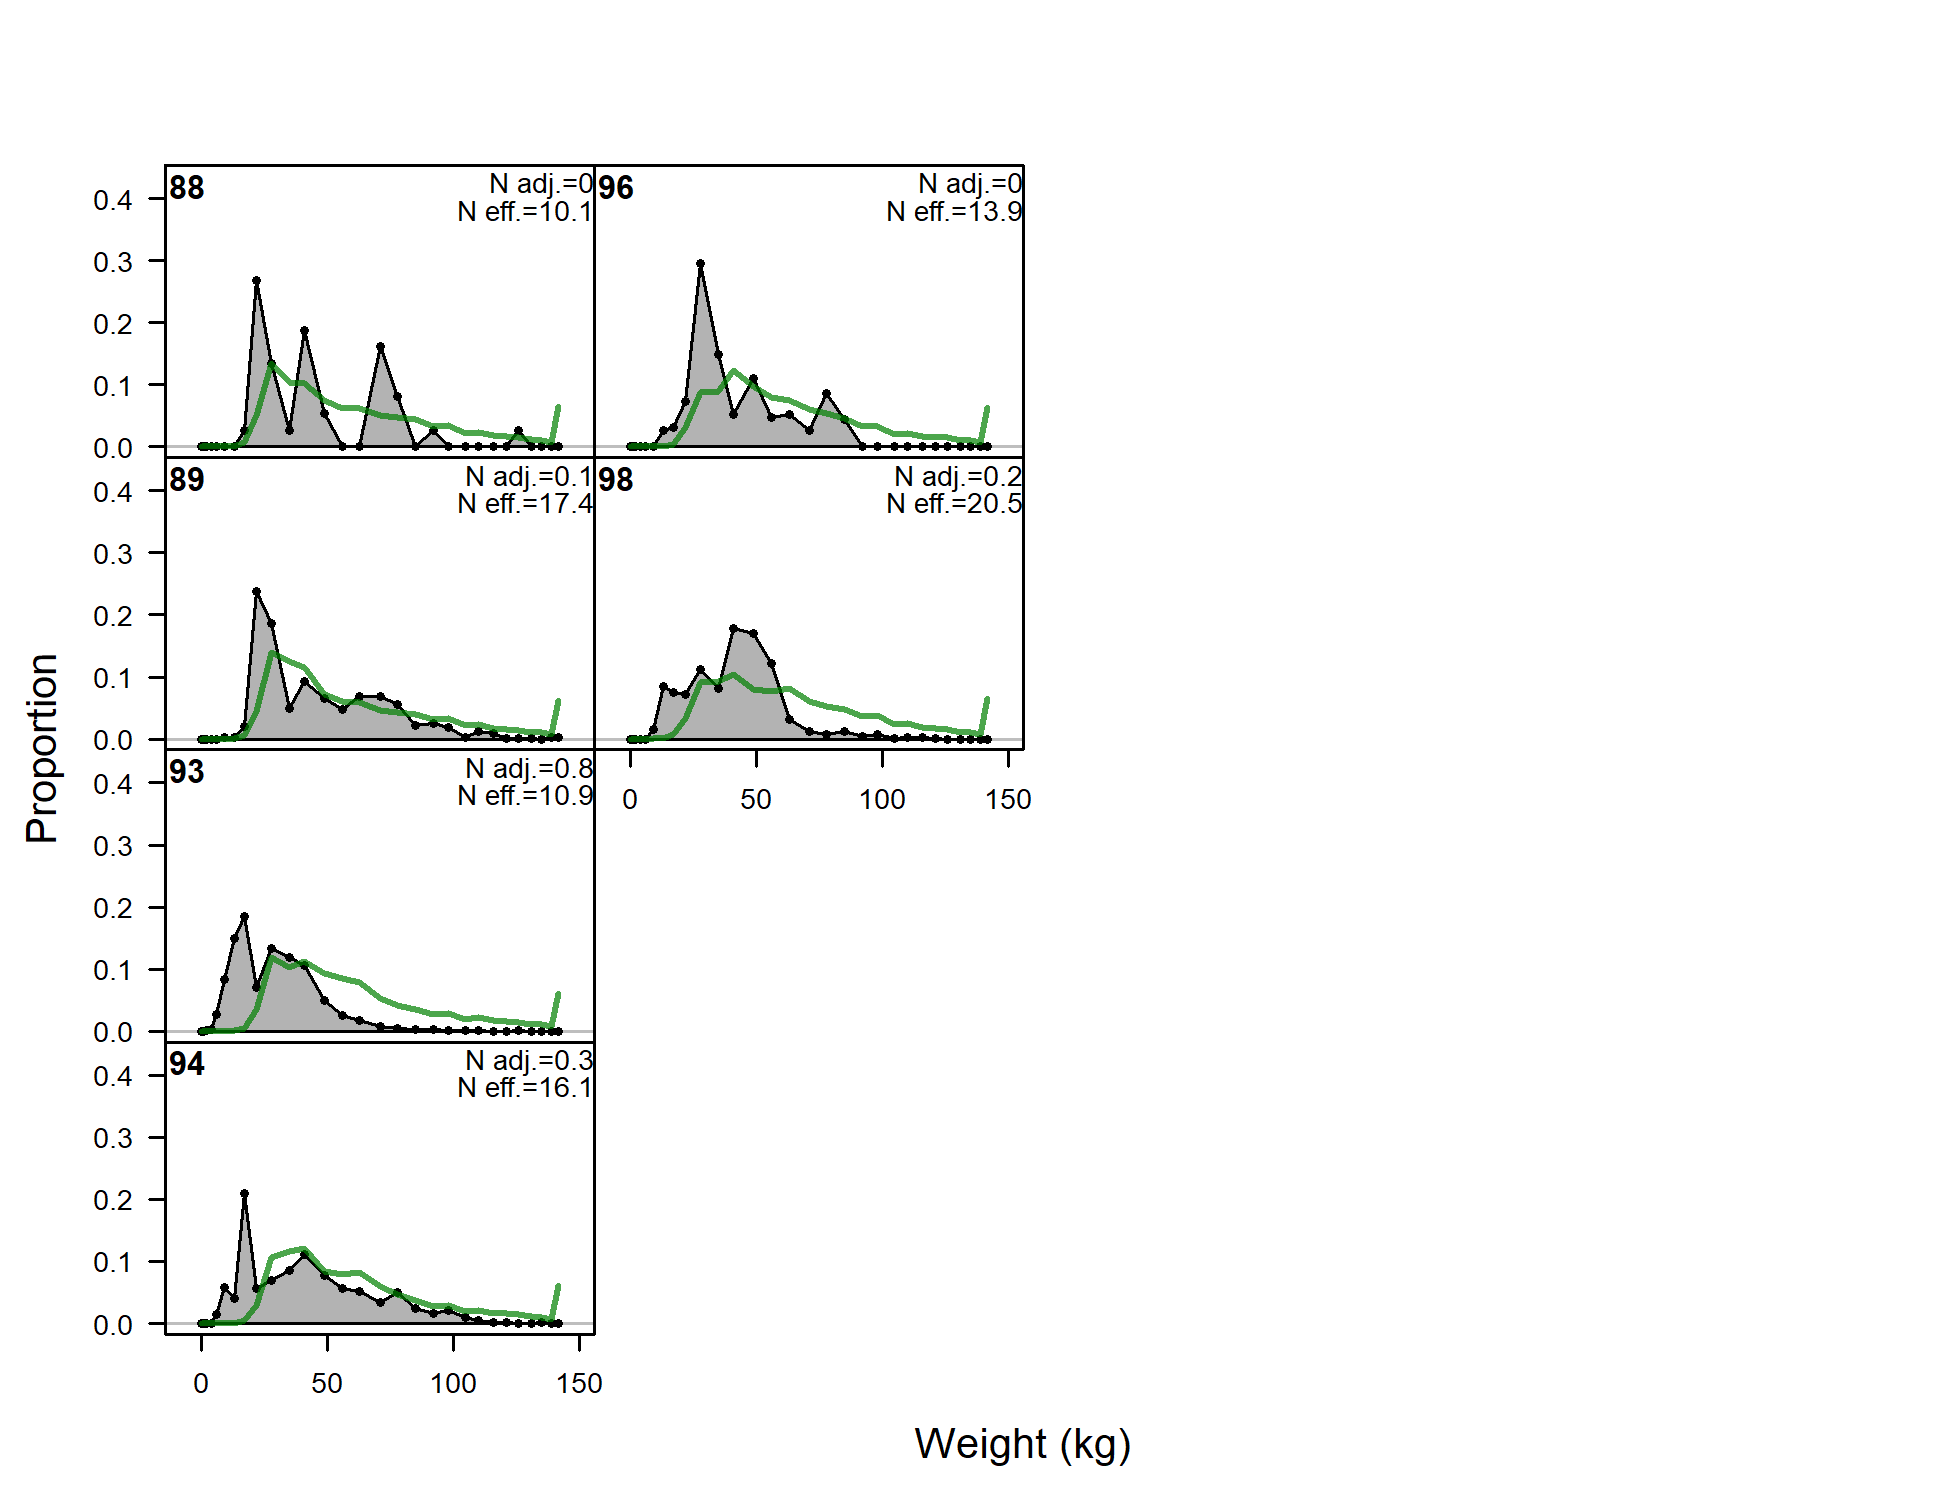
Length comps, whole catch, F1-OBJ_early (plot 4 of 4)
file: comp_lenfit_flt1mkt0_page4.png
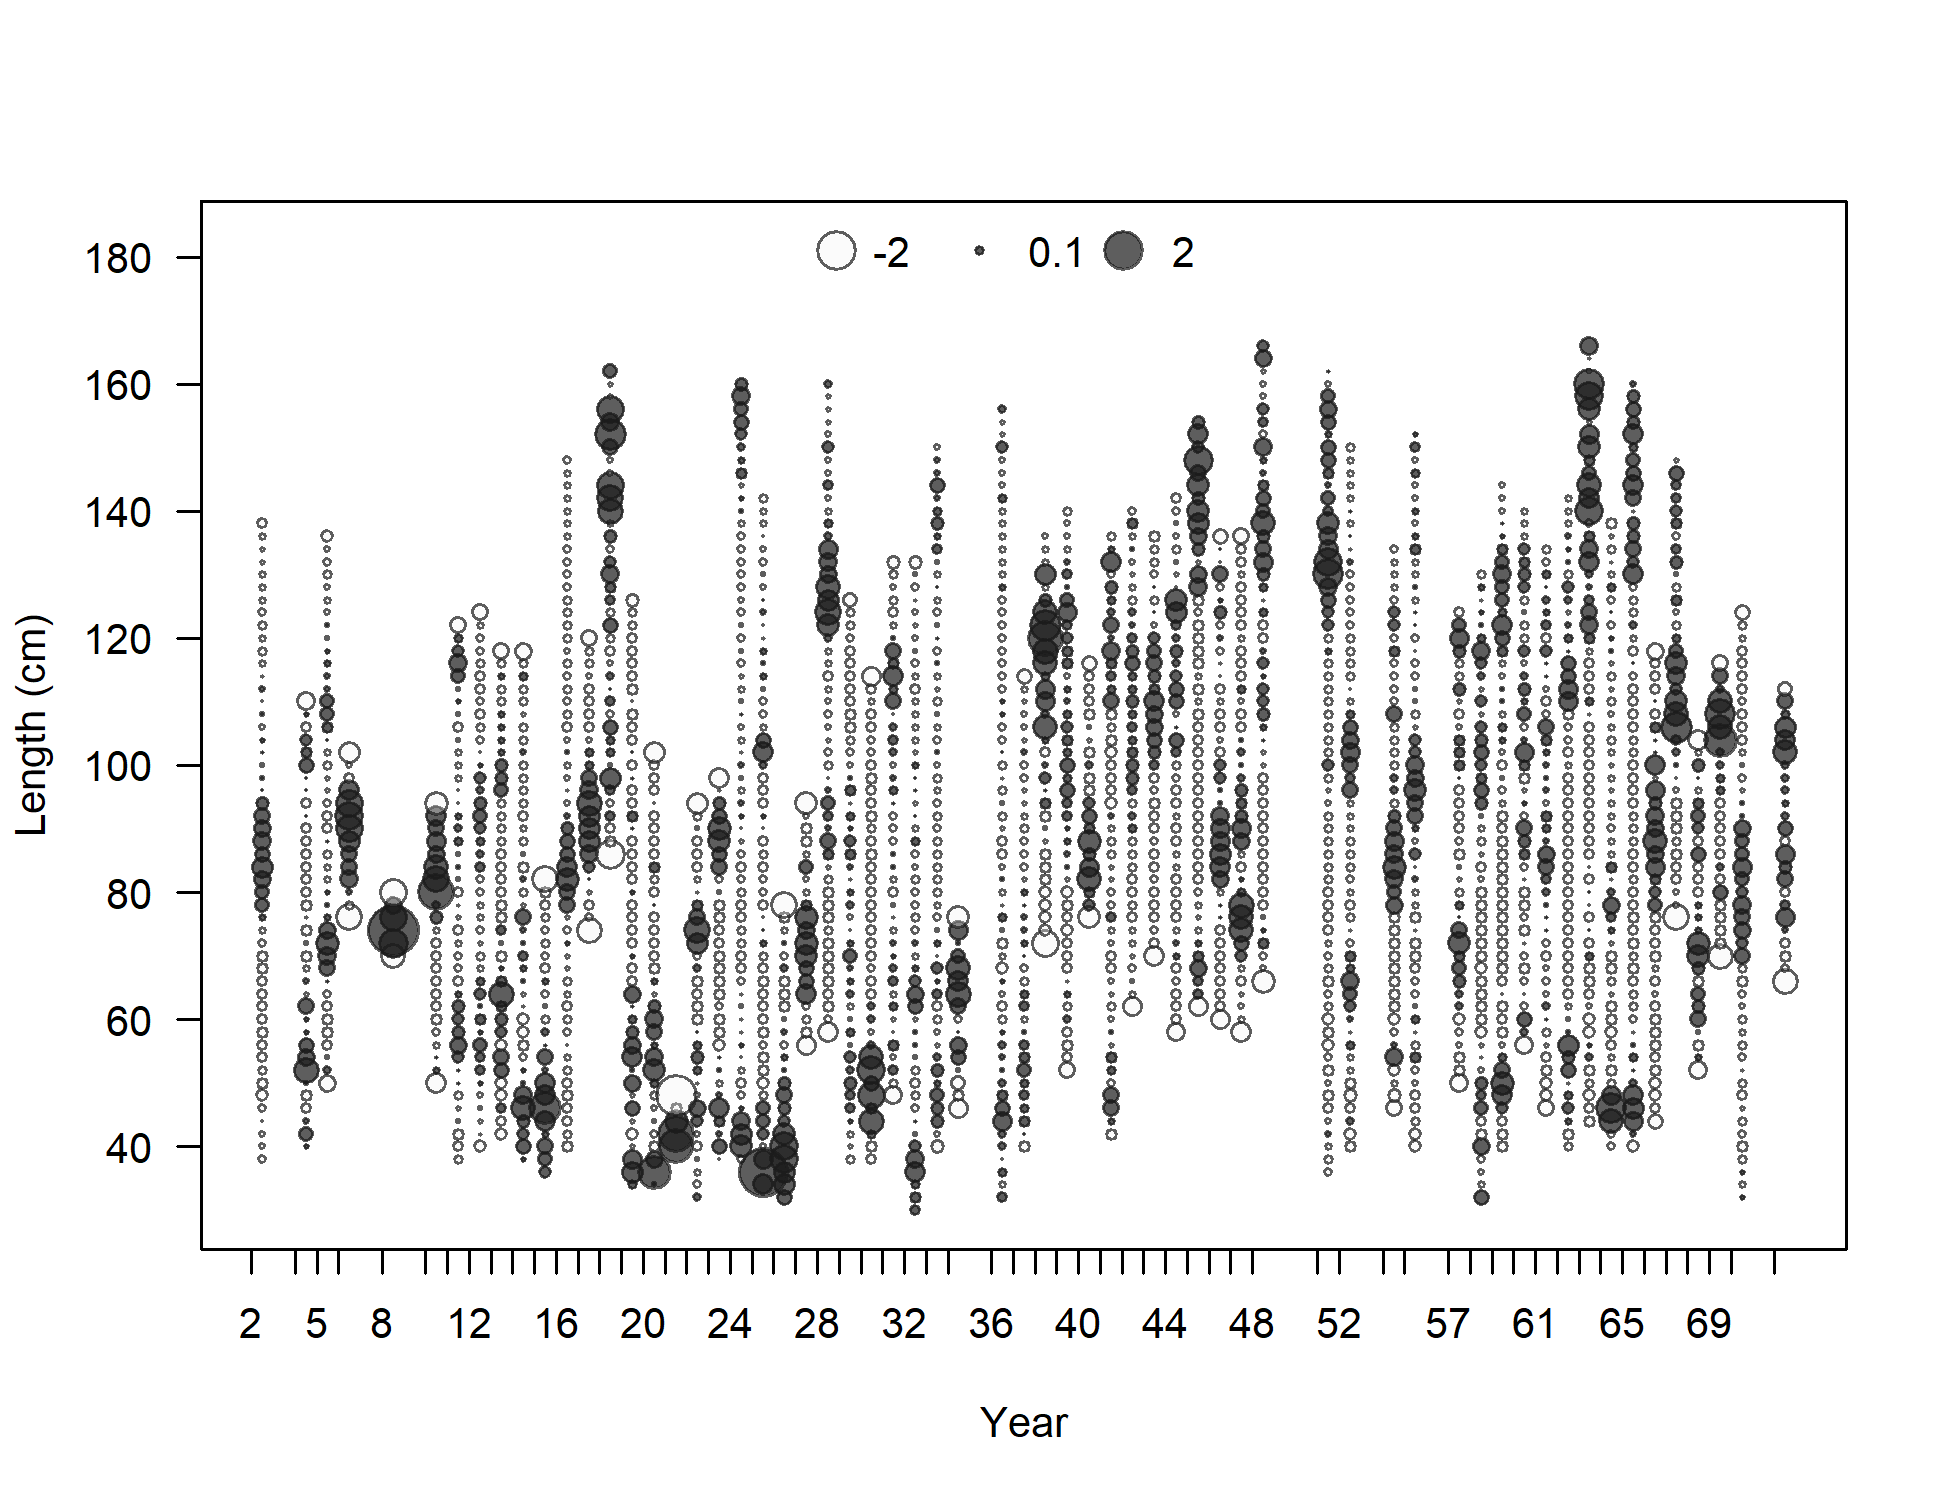
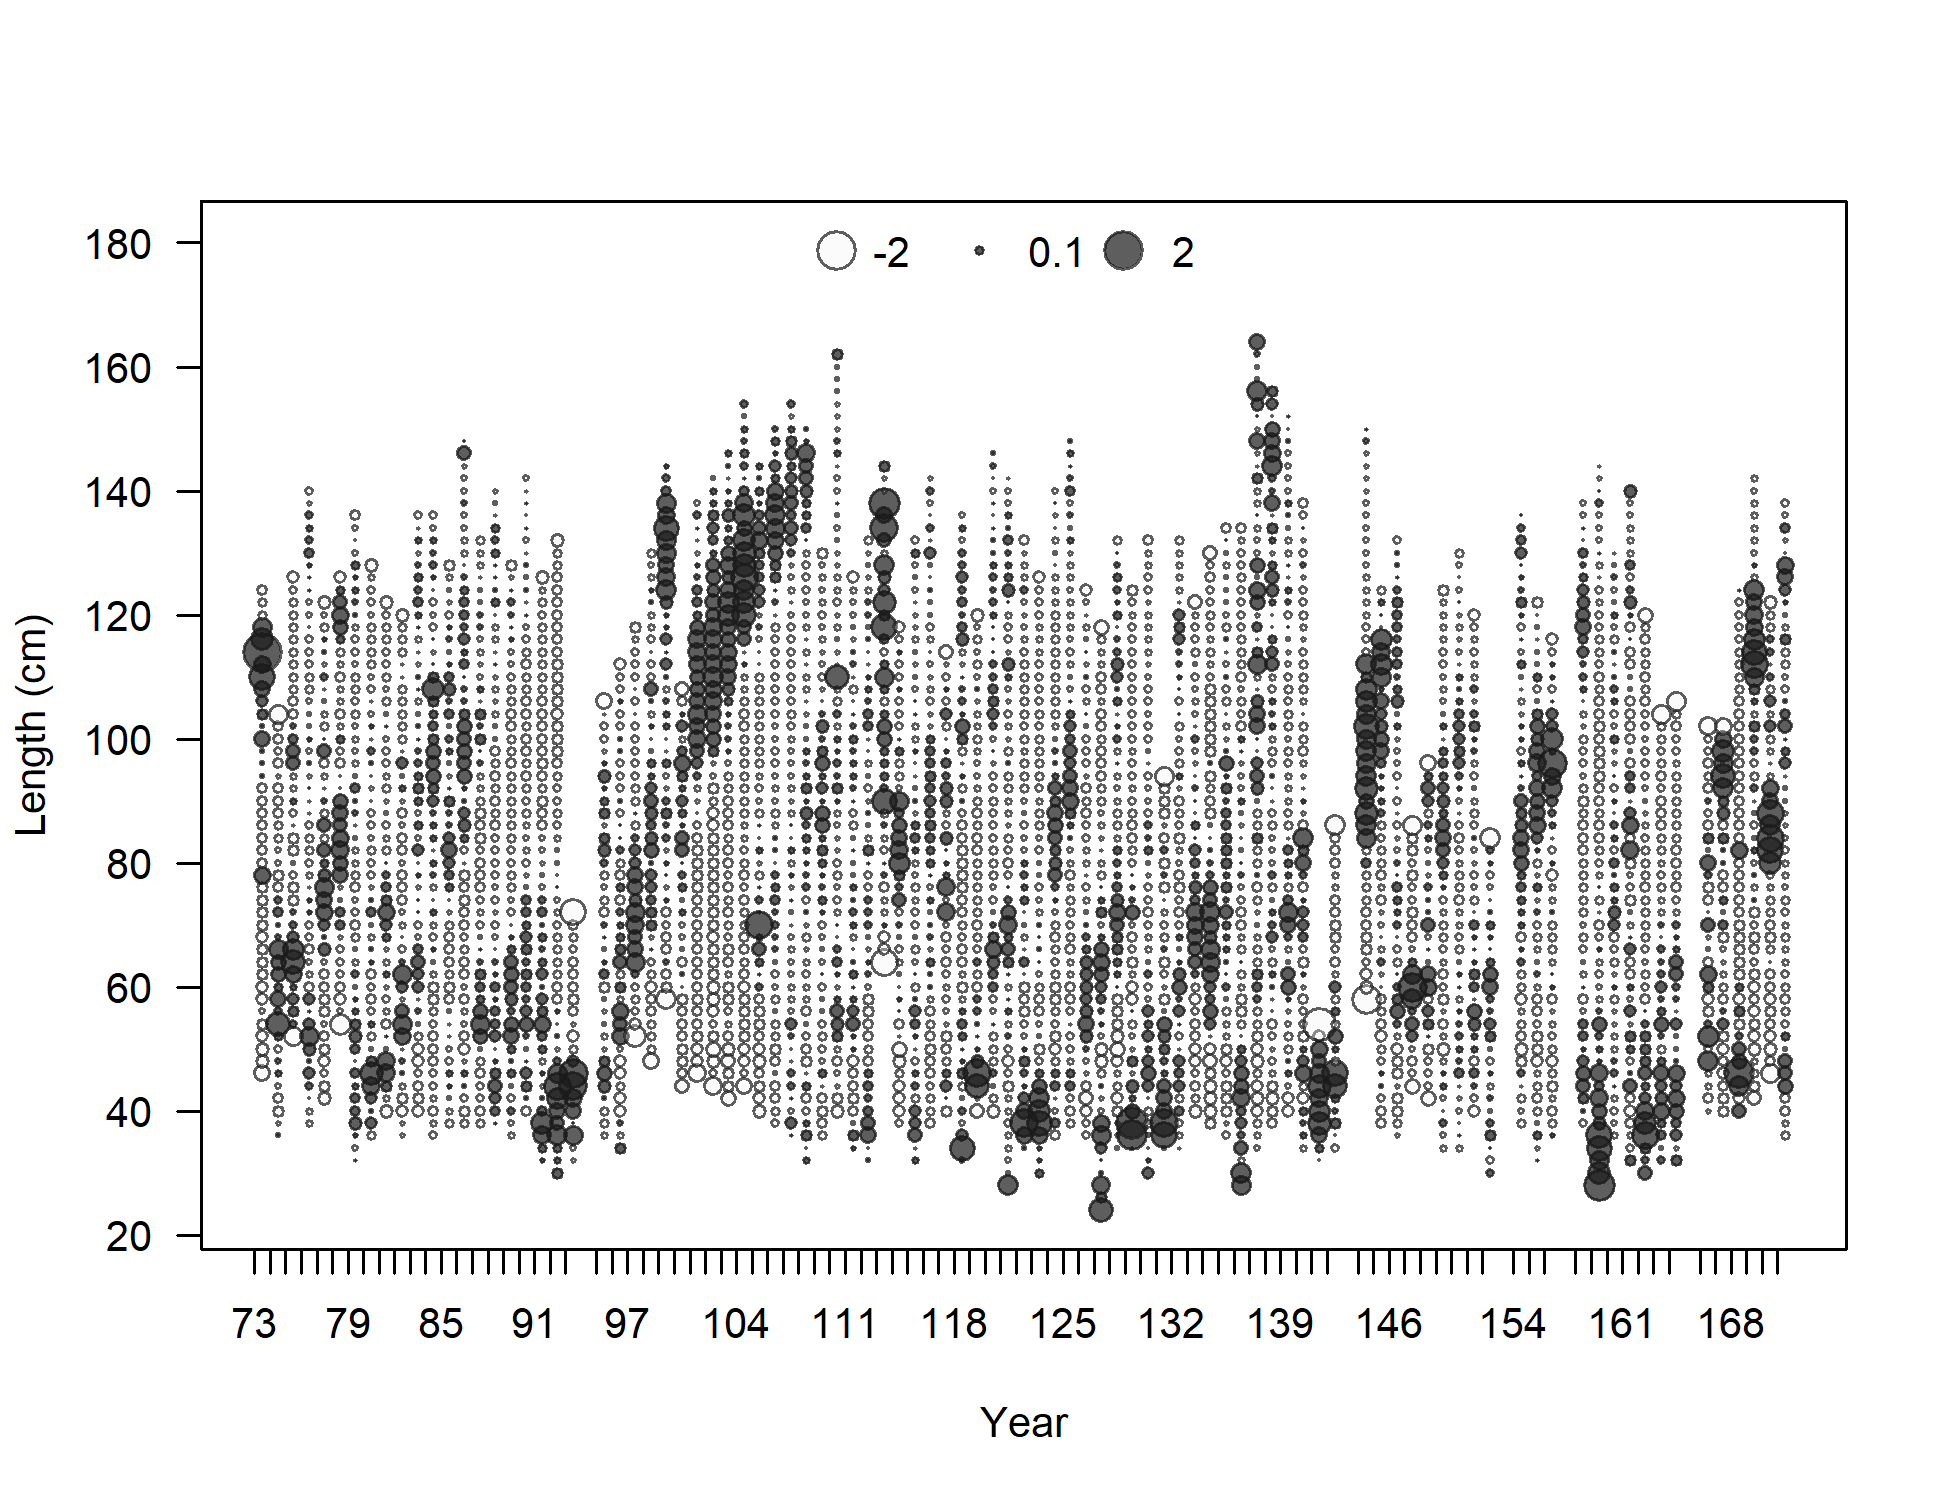
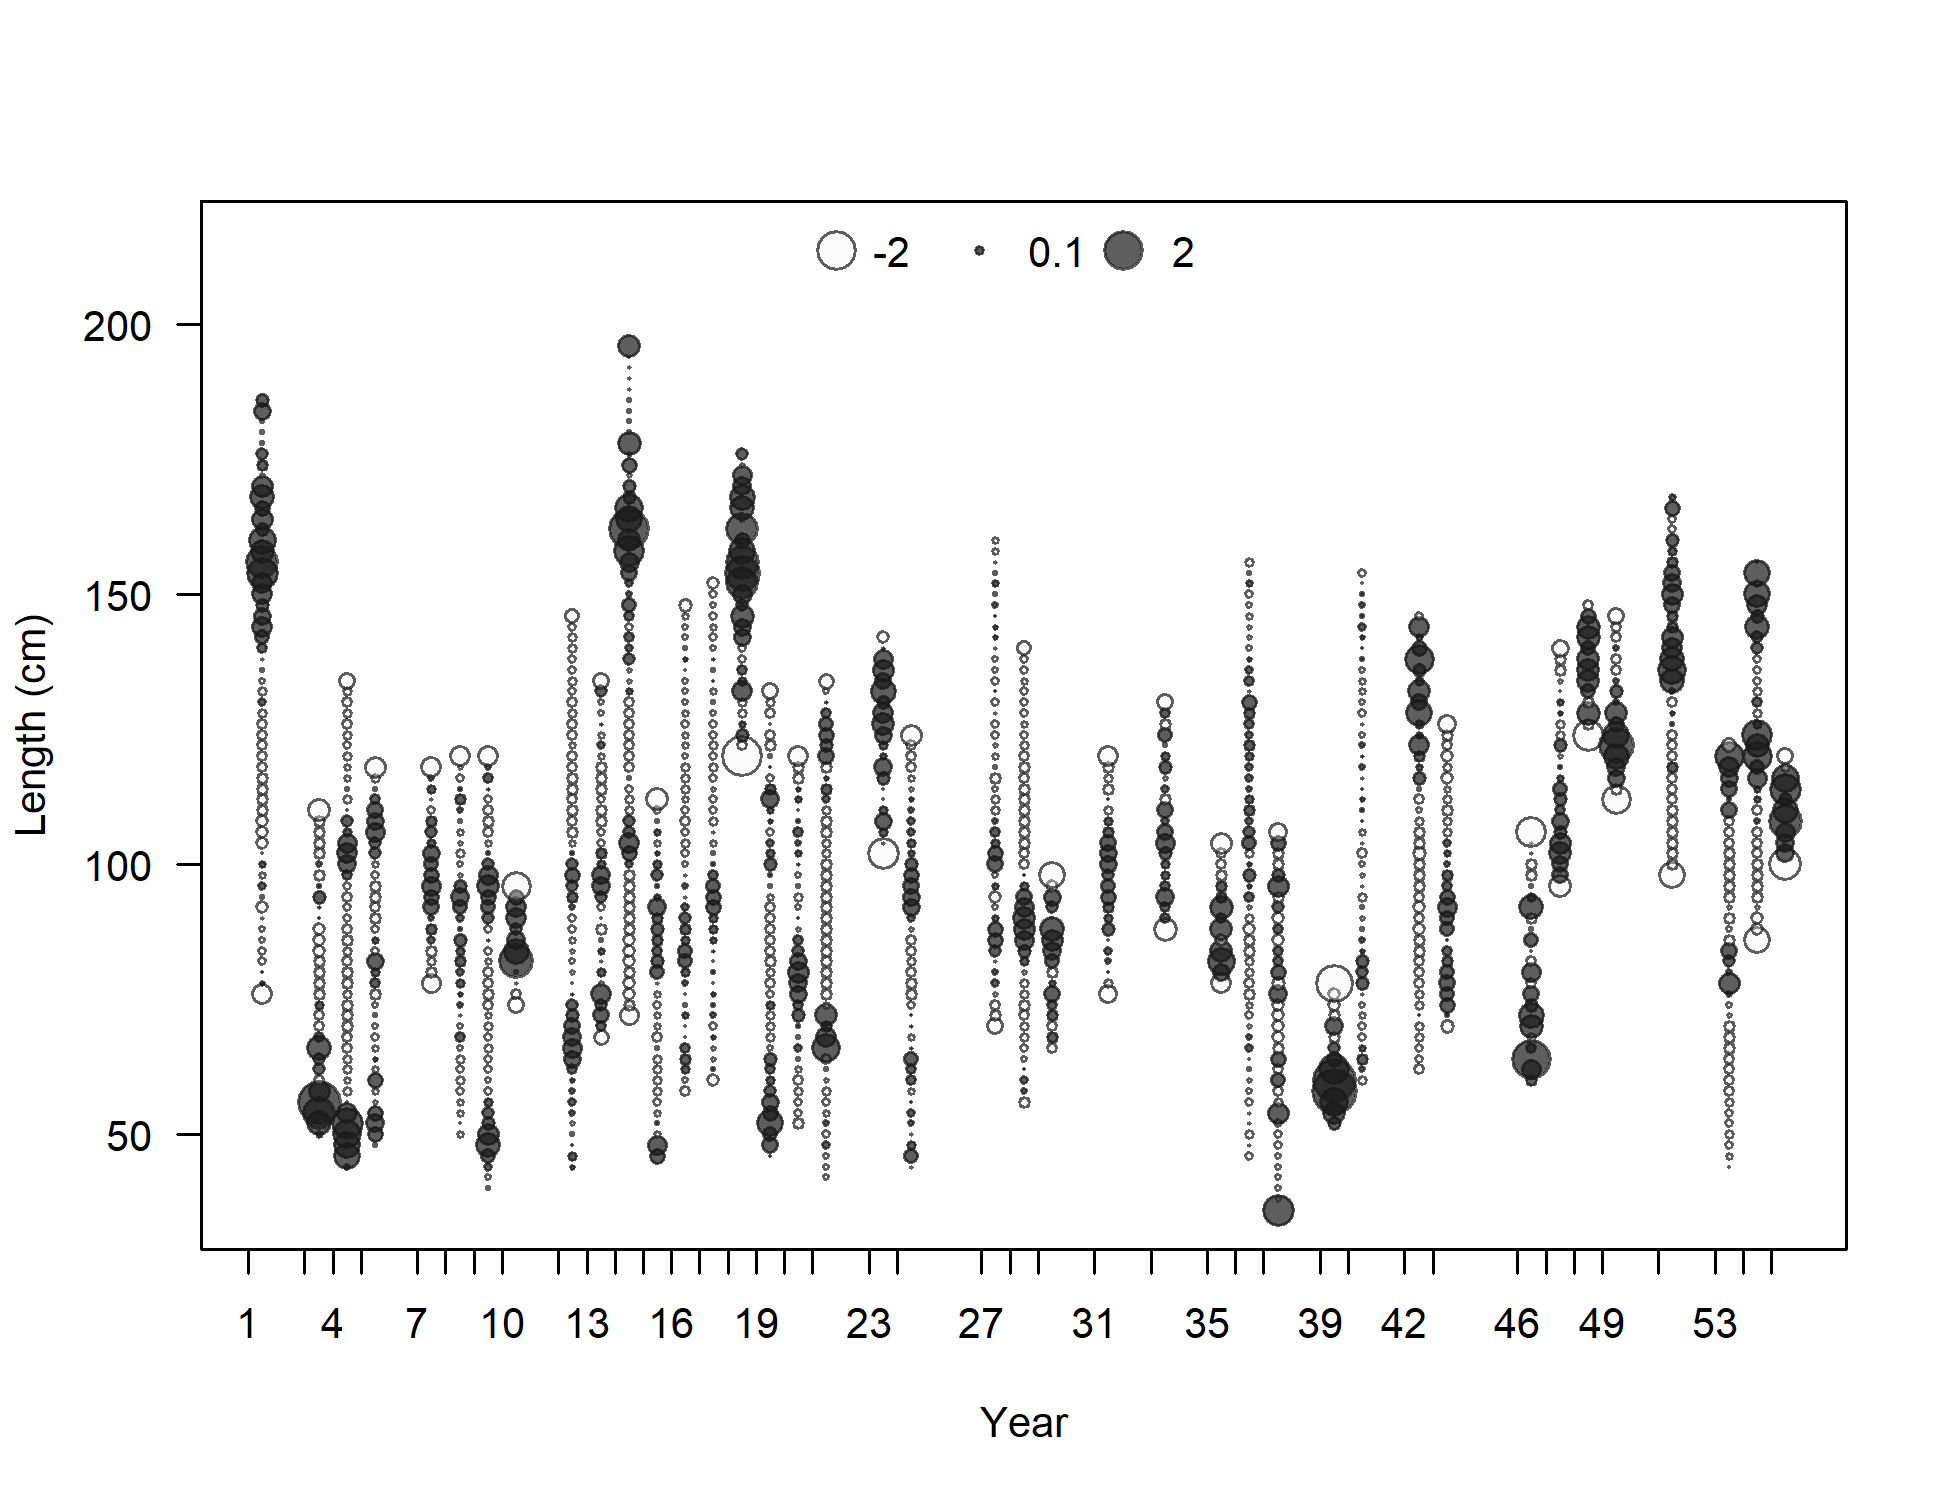
Pearson residuals, whole catch, F1-OBJ_early (max=3.37) (plot 4 of 4)
Closed bubbles are positive residuals (observed > expected) and open bubbles are negative residuals (observed < expected).
file: comp_lenfit_residsflt1mkt0_page4.png
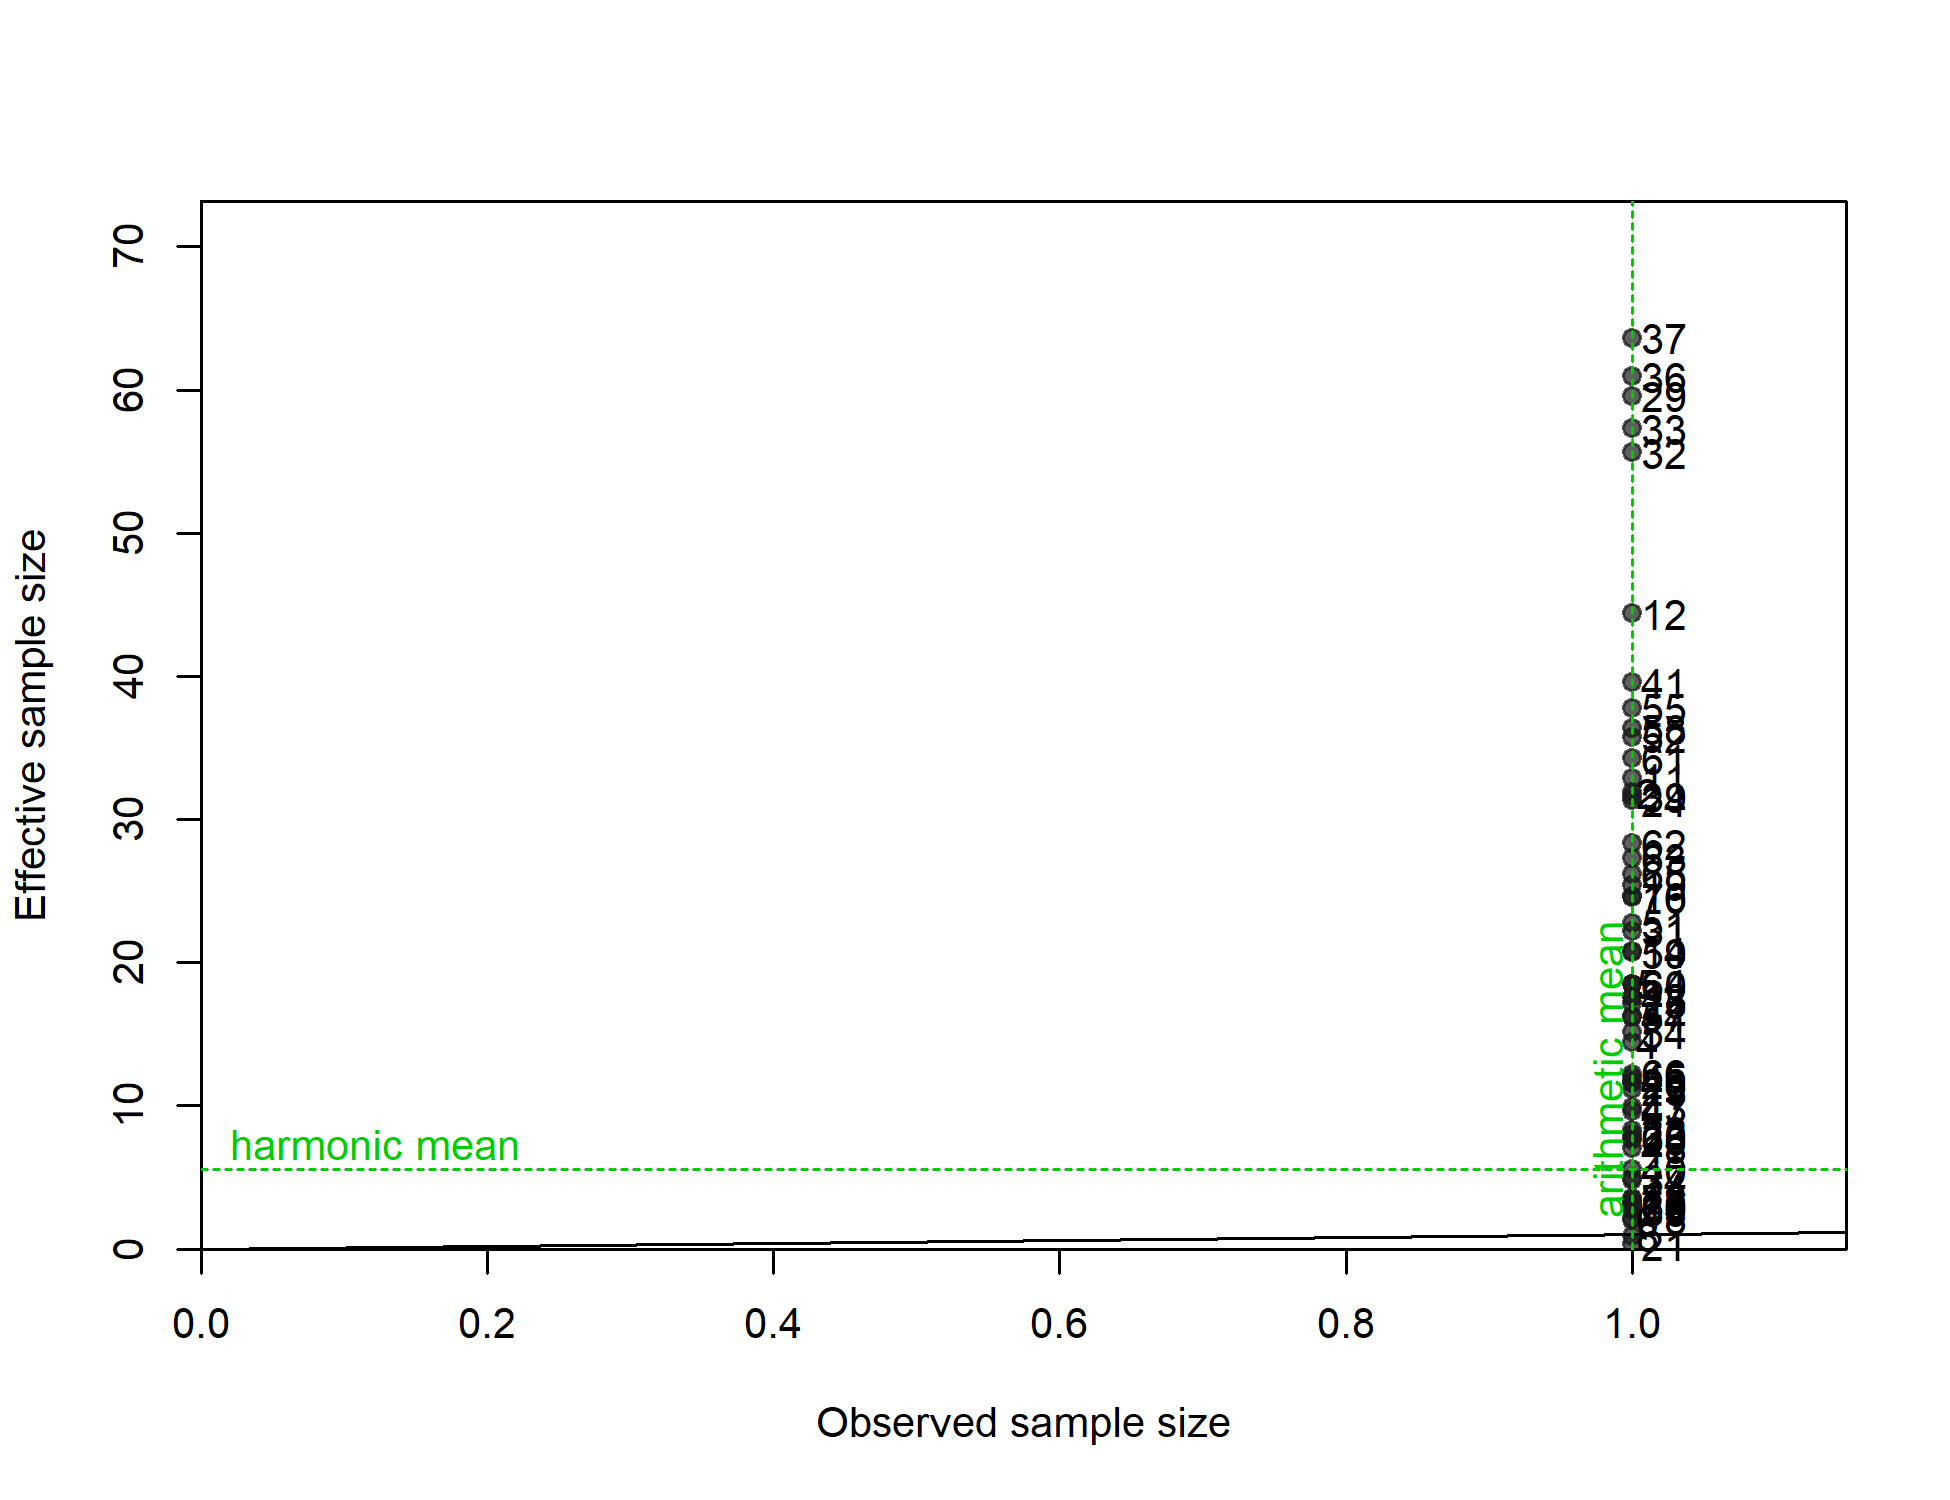
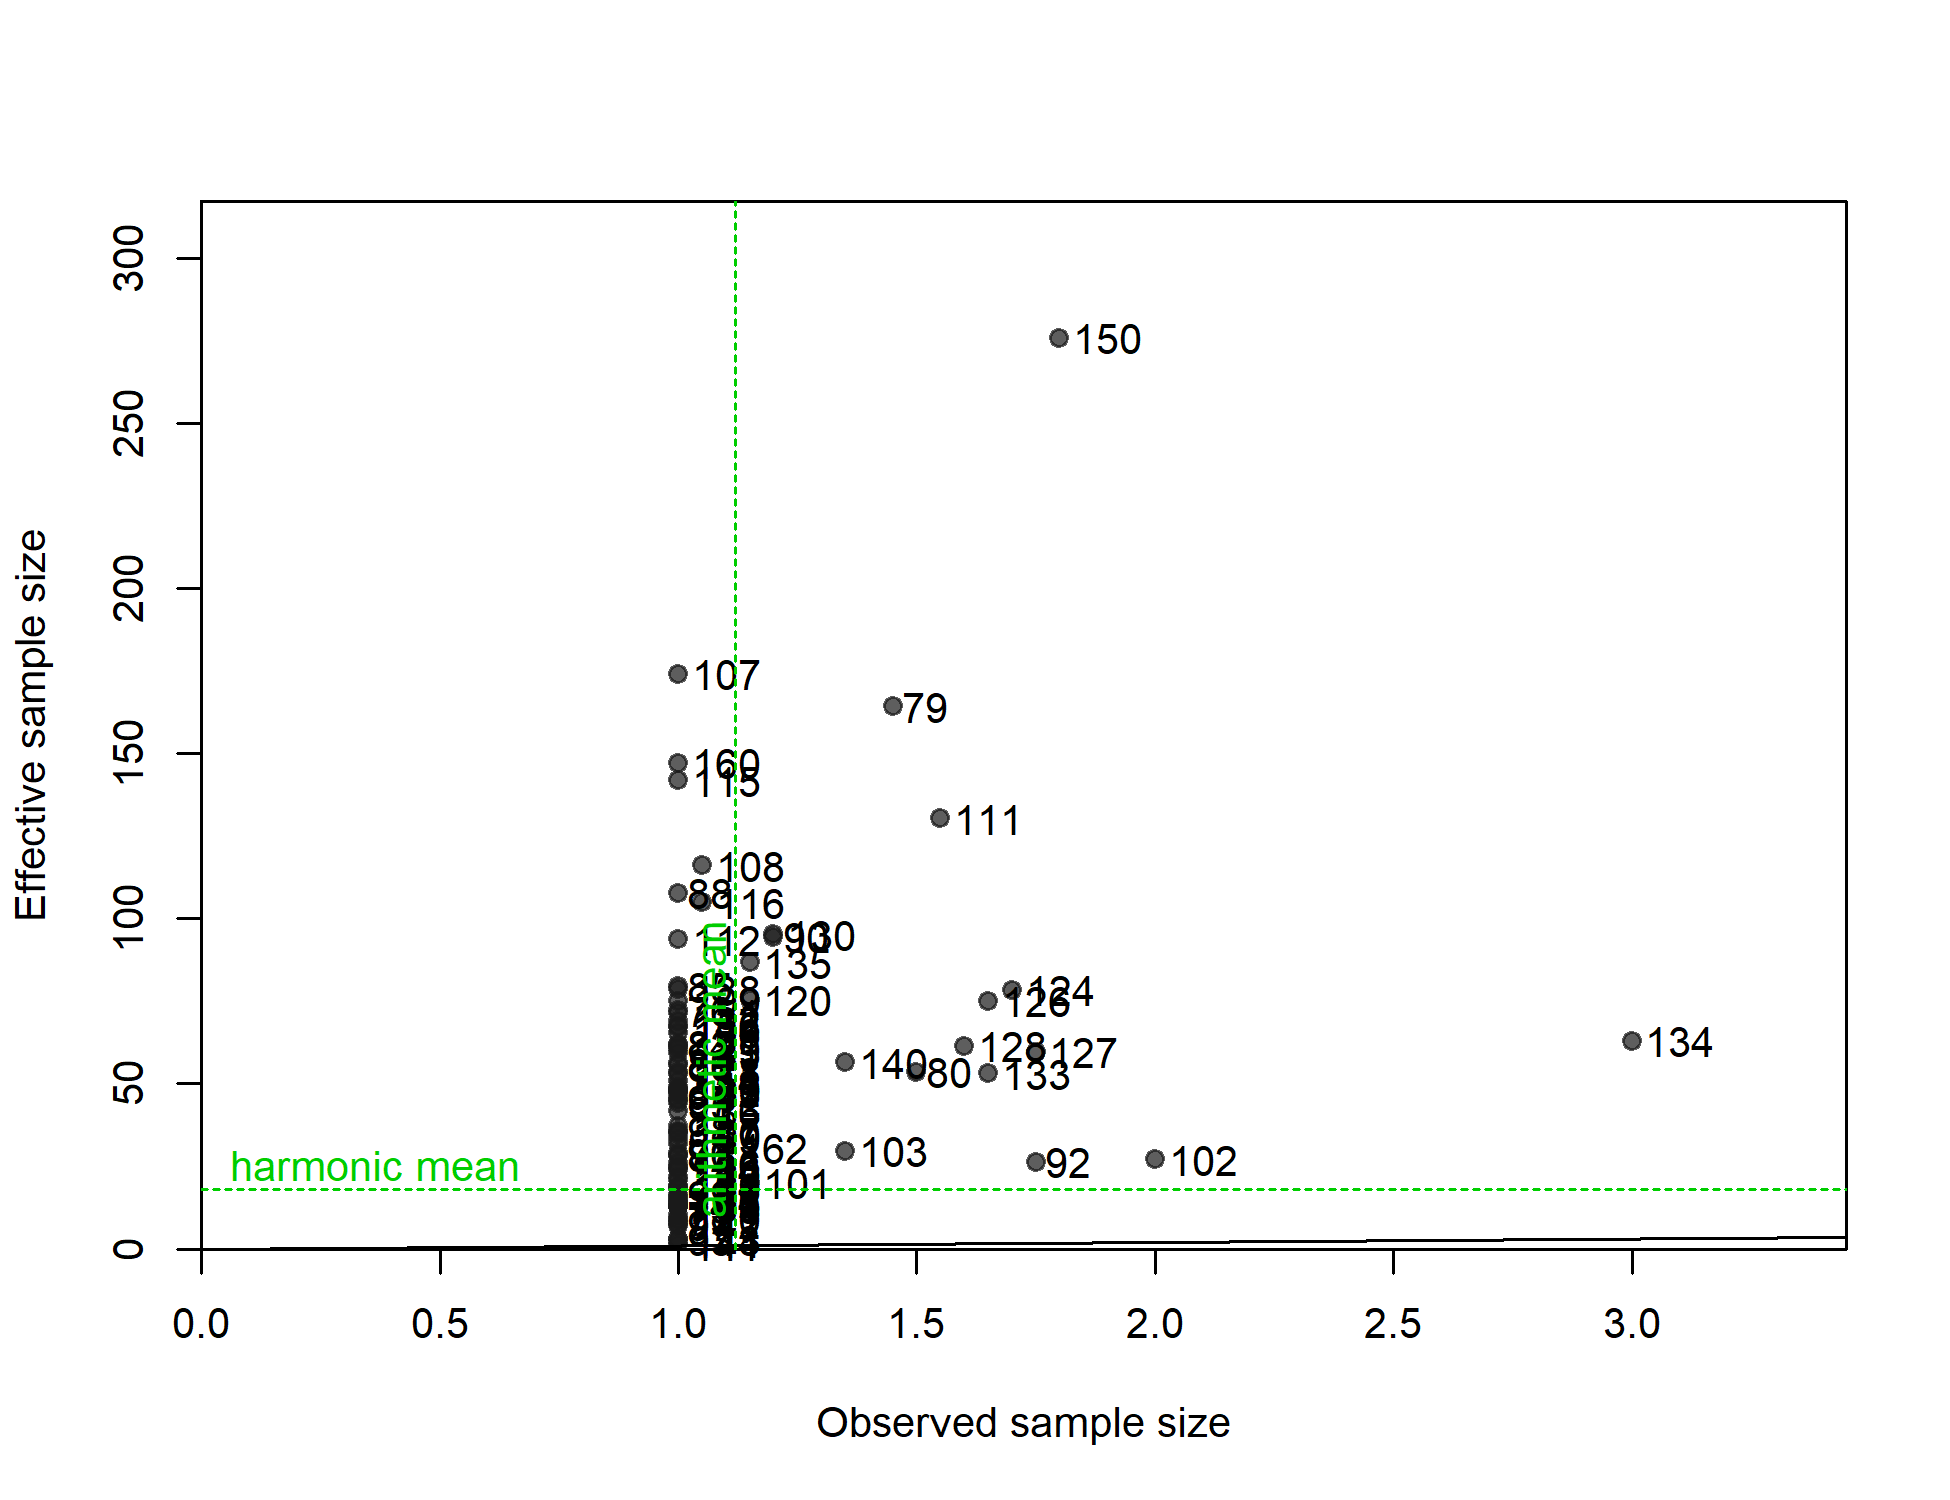
N-EffN comparison, Length comps, whole catch, F1-OBJ_early
file: comp_lenfit_sampsize_flt1mkt0.png
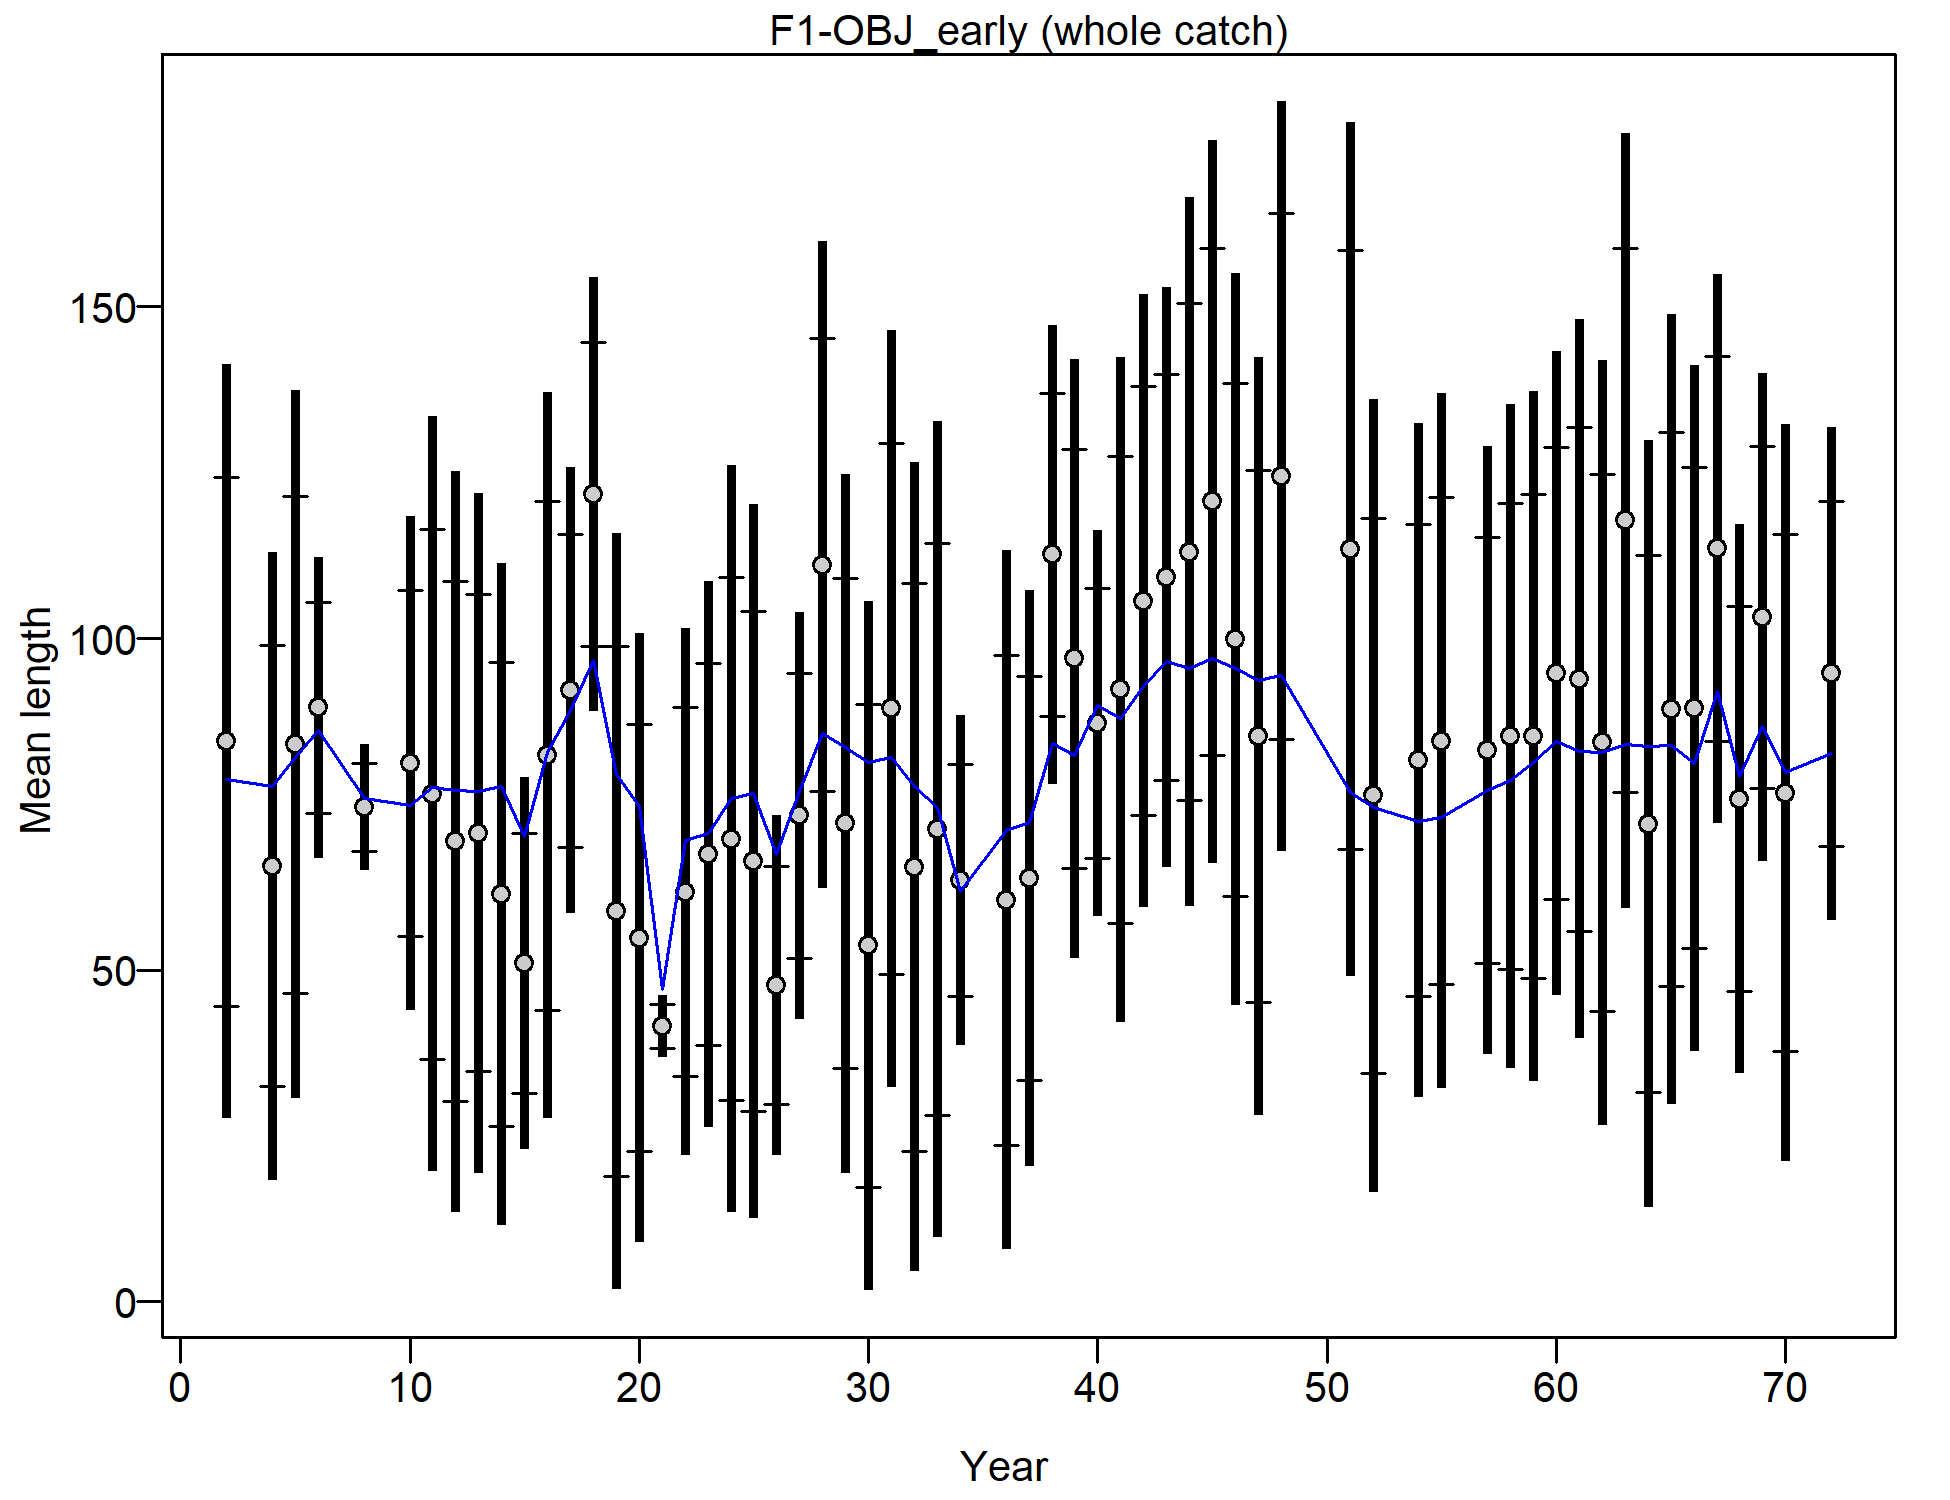
Mean length for F1-OBJ_early with 95% confidence intervals based on current samples sizes.
Francis data weighting method TA1.8: thinner intervals (with capped ends) show result of further adjusting sample sizes based on suggested multiplier (with 95% interval) for len data from F1-OBJ_early:
2.034 (1.3136-3.5742)
For more info, see
Francis, R.I.C.C. (2011). Data weighting in statistical fisheries stock assessment models. Can. J. Fish. Aquat. Sci. 68: 1124-1138. https://doi.org/10.1139/f2011-025
file: comp_lenfit_data_weighting_TA1.8_F1-OBJ_early.png
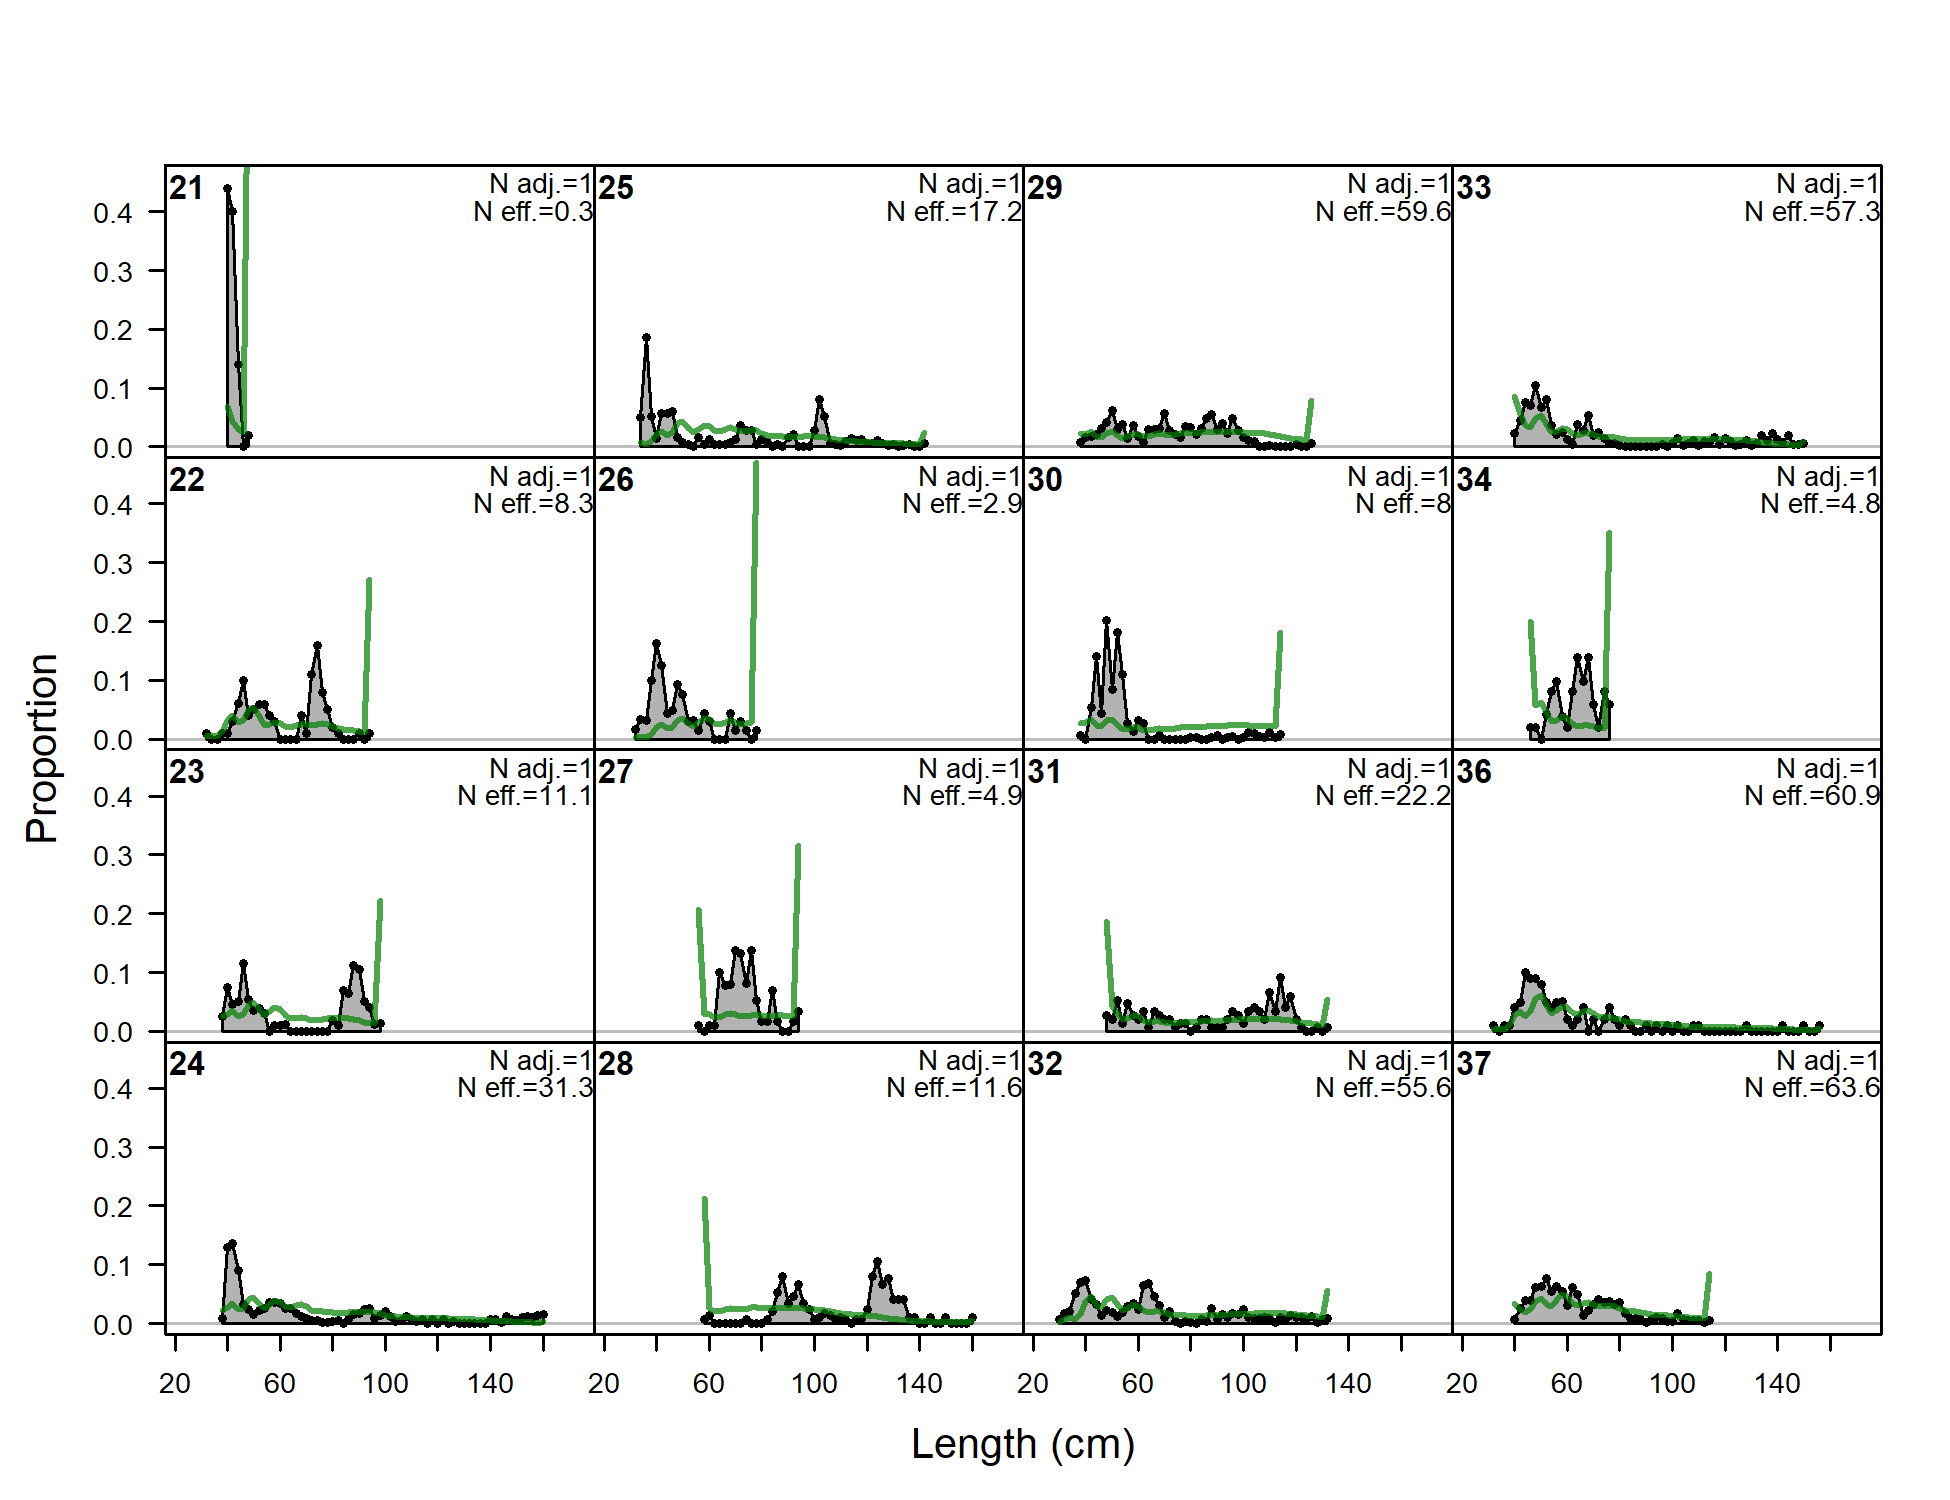
Length comps, whole catch, F2-OBJ_S (plot 1 of 6).
'N adj.' is the input sample size after data-weighting adjustment.N eff. is the calculated effective sample size used in the McAllister-Iannelli tuning method.
file: comp_lenfit_flt2mkt0_page1.png
Length comps, whole catch, F2-OBJ_S (plot 2 of 6)
file: comp_lenfit_flt2mkt0_page2.png
Length comps, whole catch, F2-OBJ_S (plot 3 of 6)
file: comp_lenfit_flt2mkt0_page3.png
Length comps, whole catch, F2-OBJ_S (plot 4 of 6)
file: comp_lenfit_flt2mkt0_page4.png
Length comps, whole catch, F2-OBJ_S (plot 5 of 6)
file: comp_lenfit_flt2mkt0_page5.png
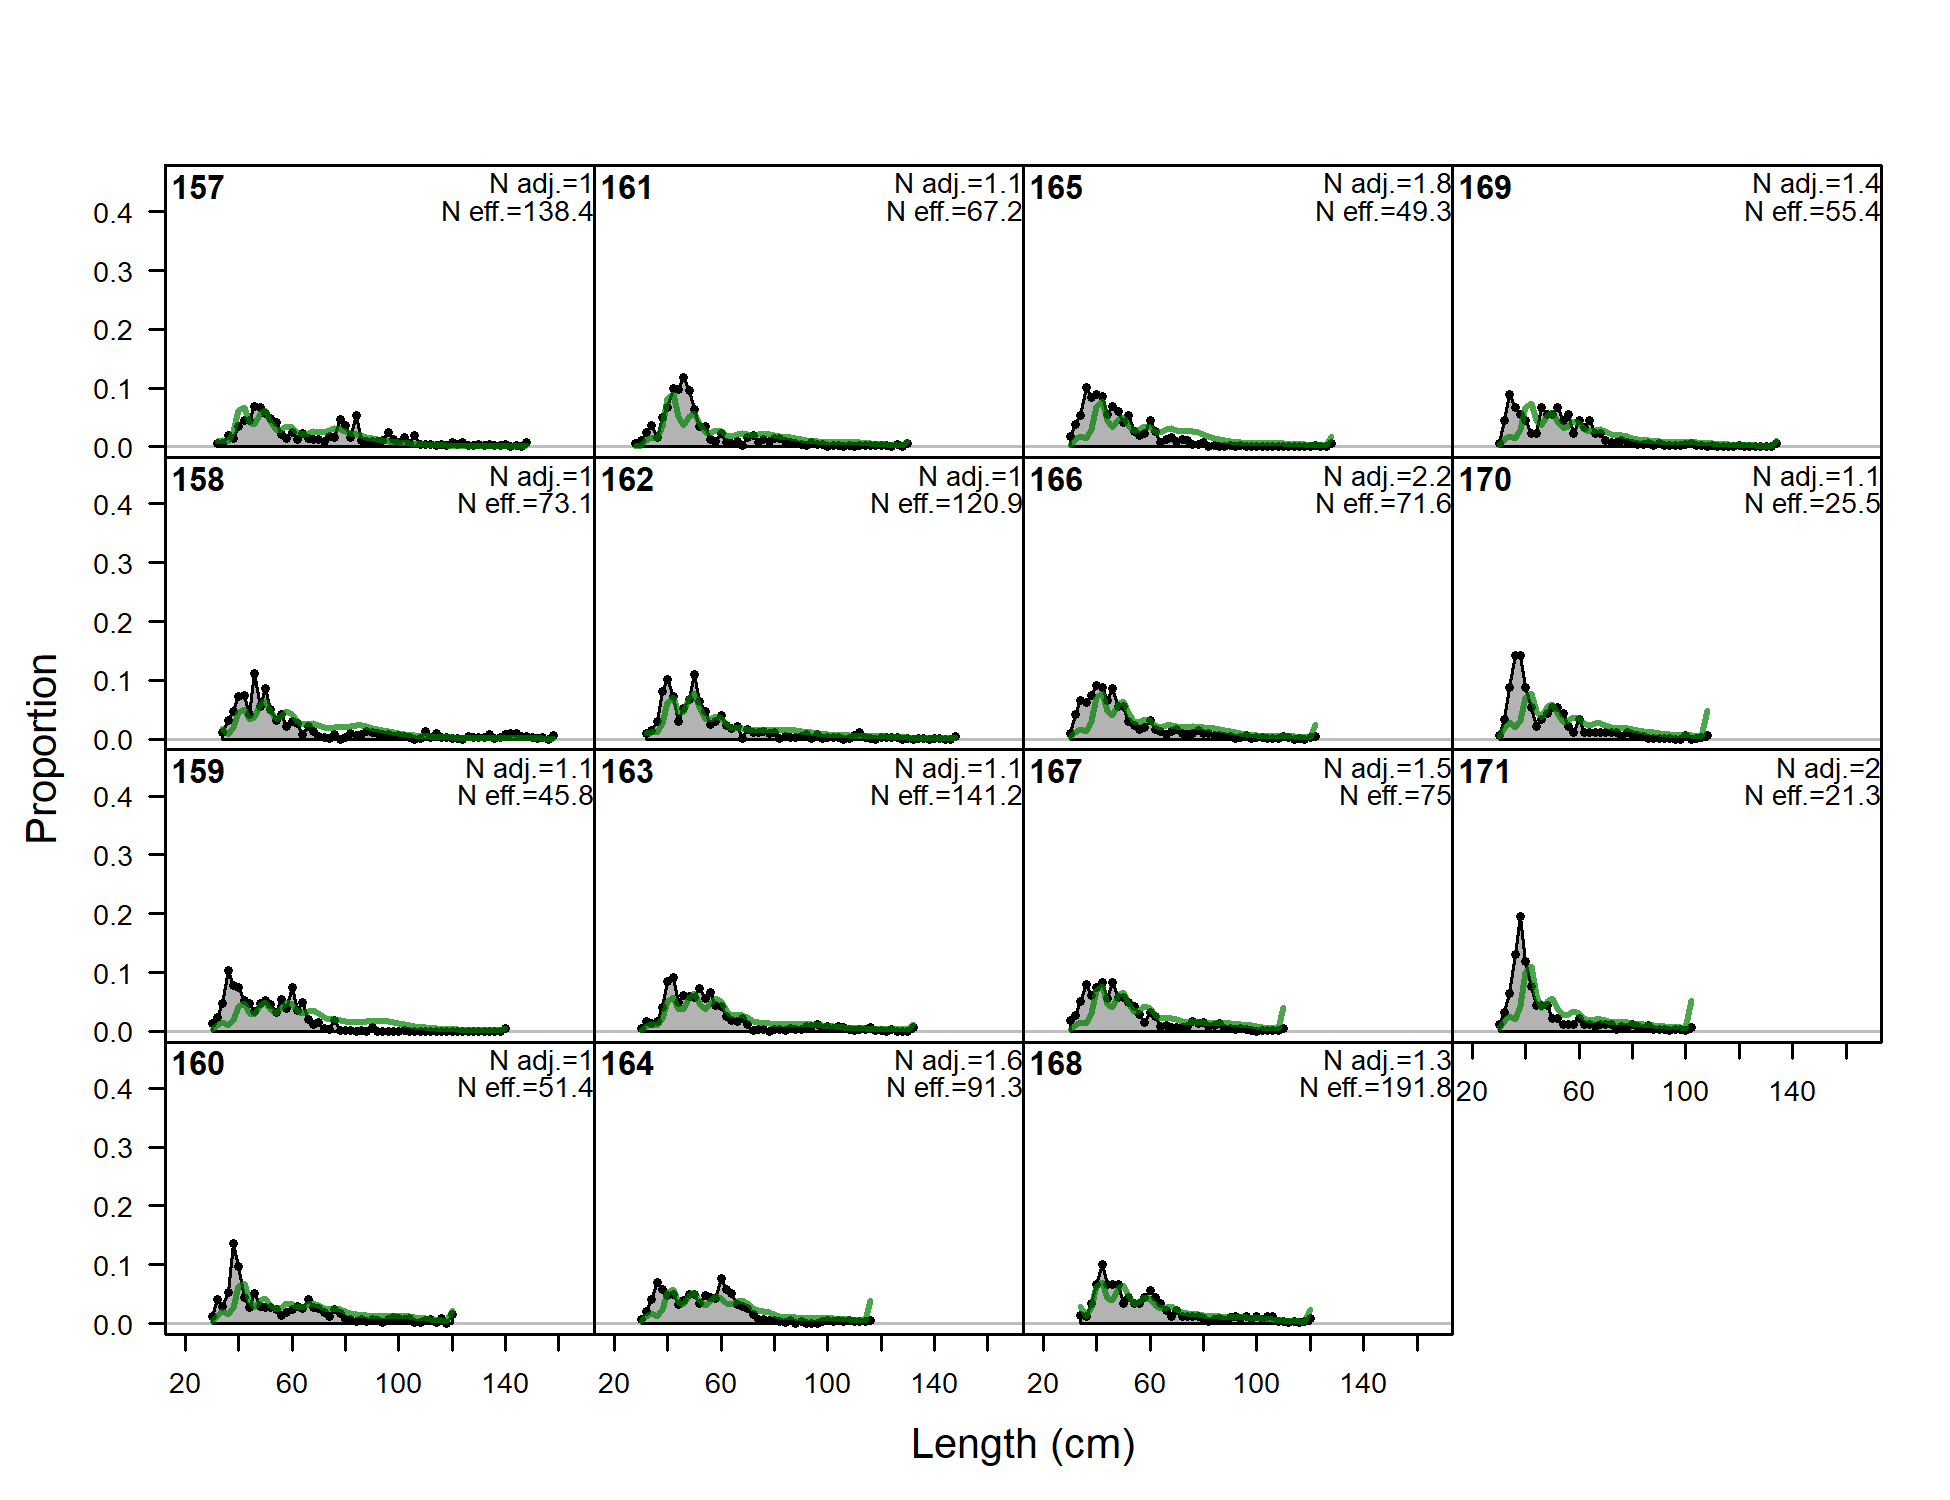
Length comps, whole catch, F2-OBJ_S (plot 6 of 6)
file: comp_lenfit_flt2mkt0_page6.png
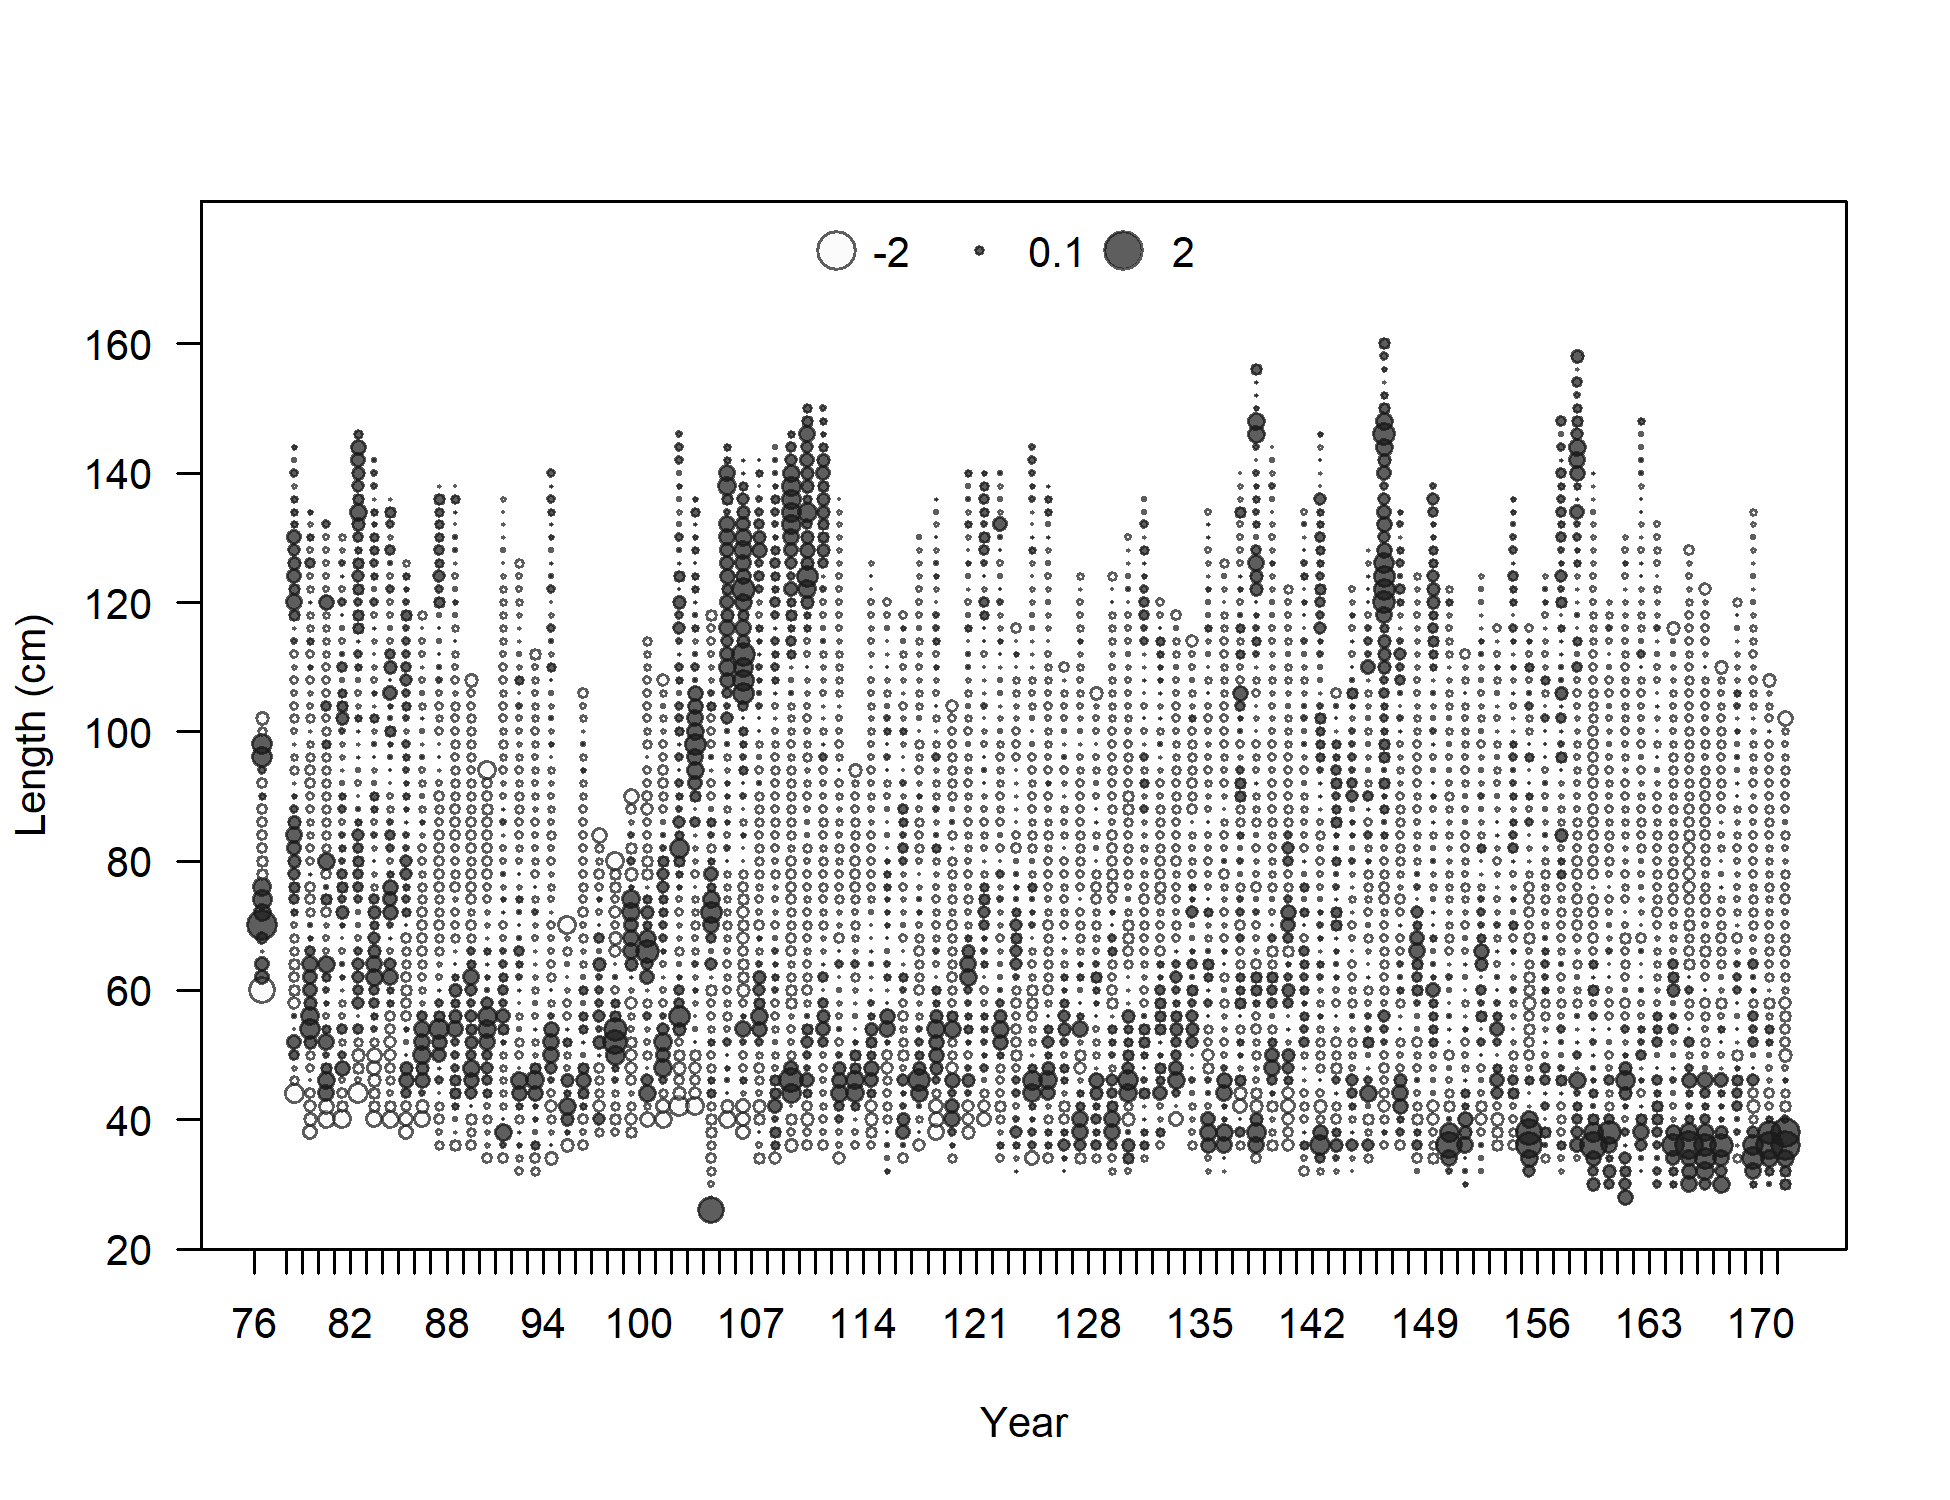
Pearson residuals, whole catch, F2-OBJ_S (max=1.15) (plot 6 of 6)
Closed bubbles are positive residuals (observed > expected) and open bubbles are negative residuals (observed < expected).
file: comp_lenfit_residsflt2mkt0_page6.png
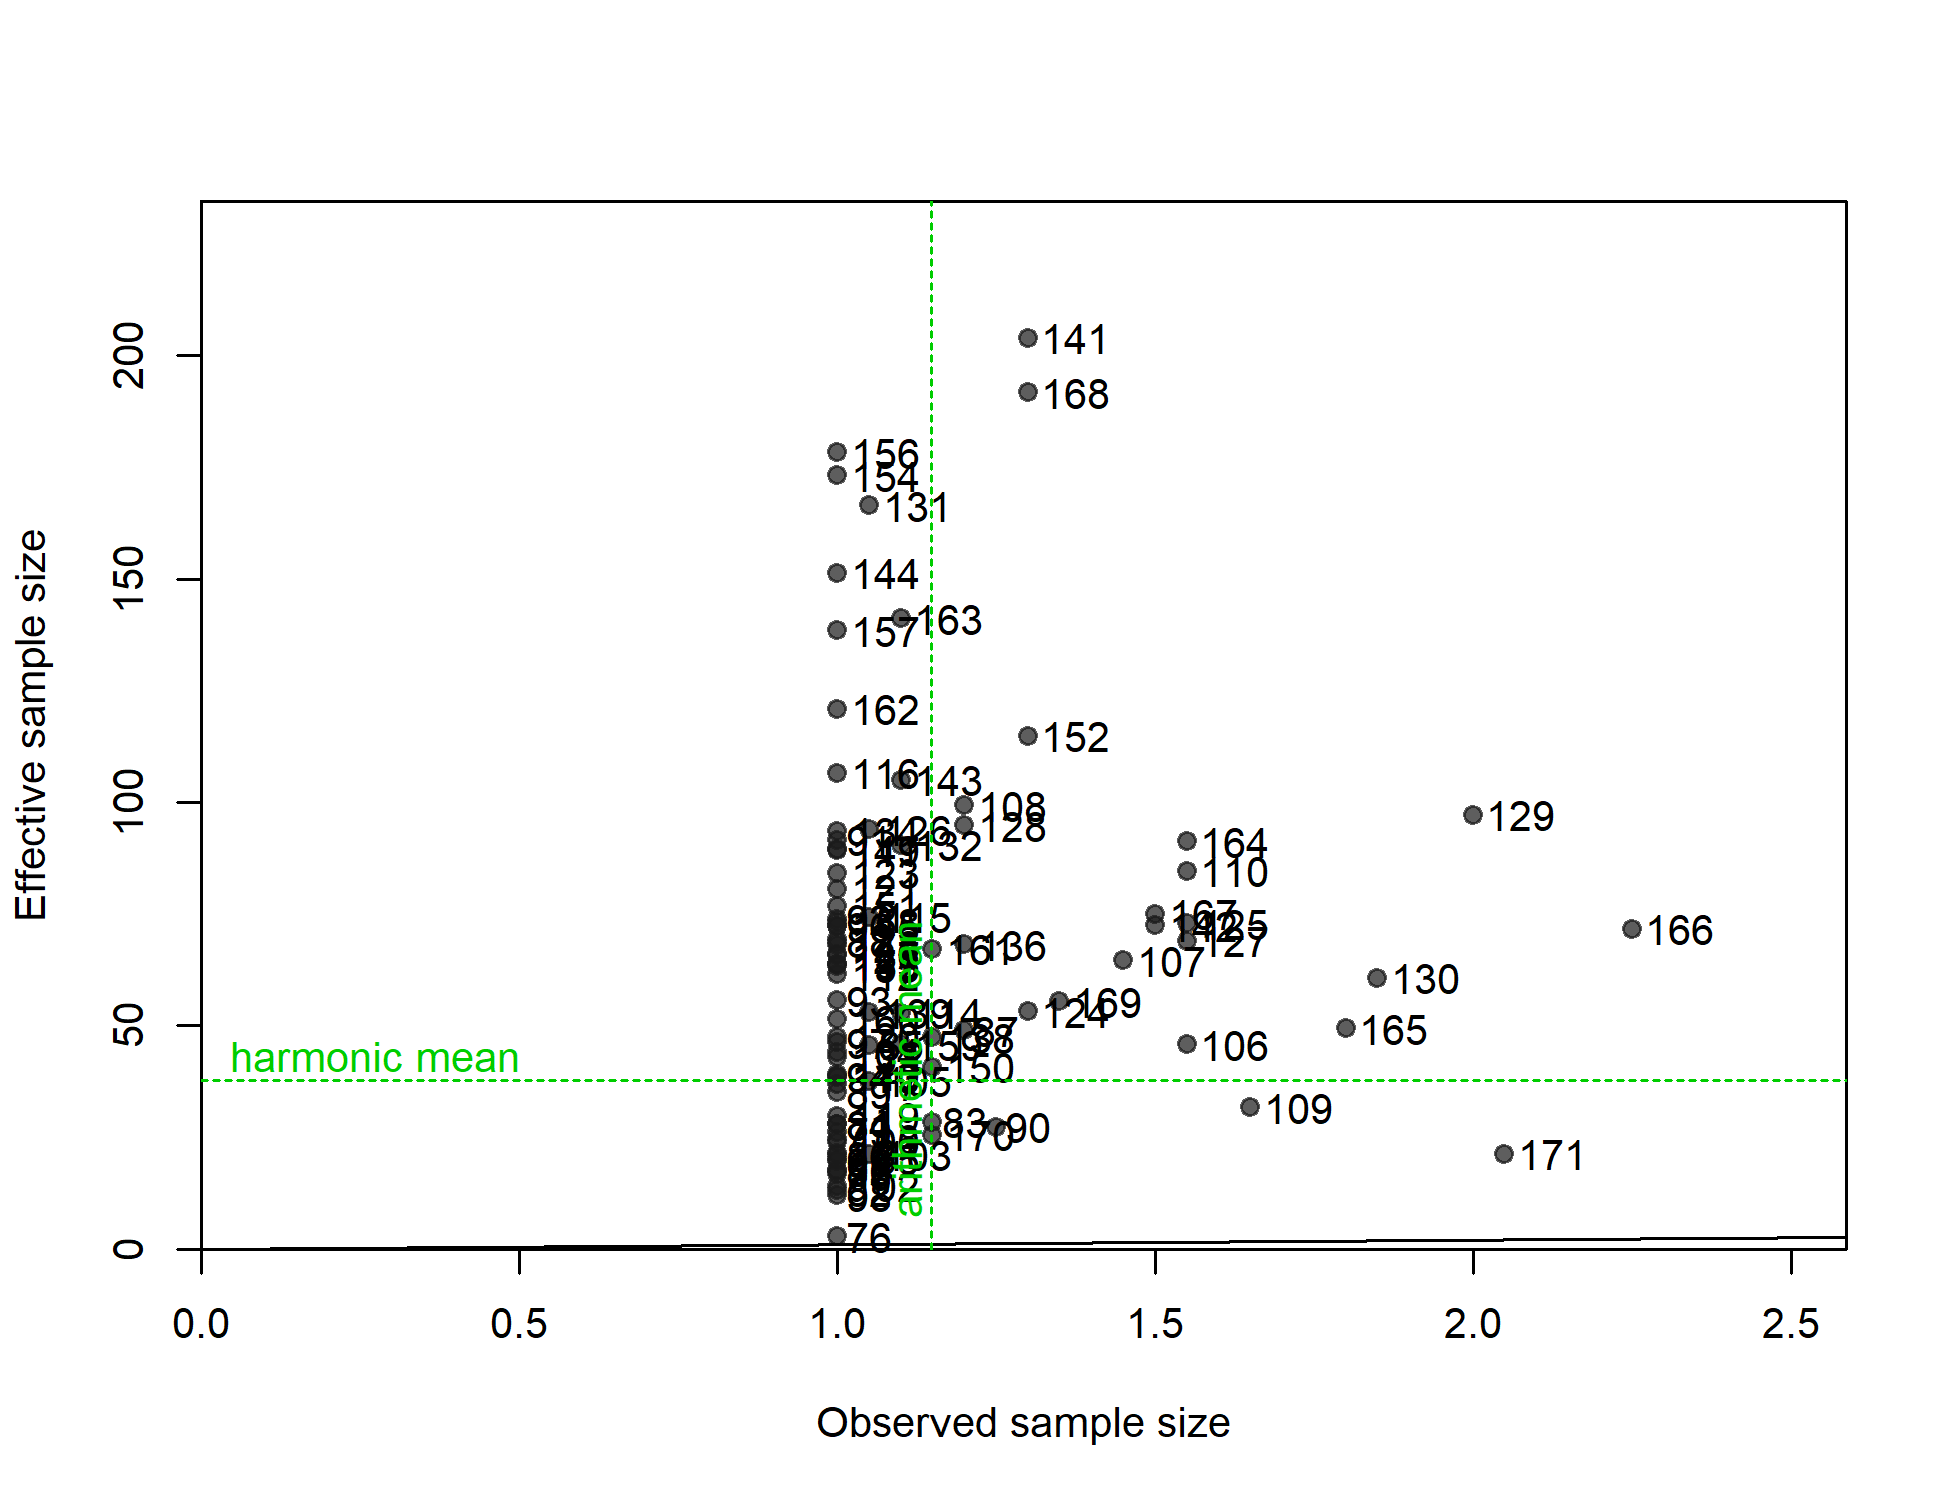
N-EffN comparison, Length comps, whole catch, F2-OBJ_S
file: comp_lenfit_sampsize_flt2mkt0.png
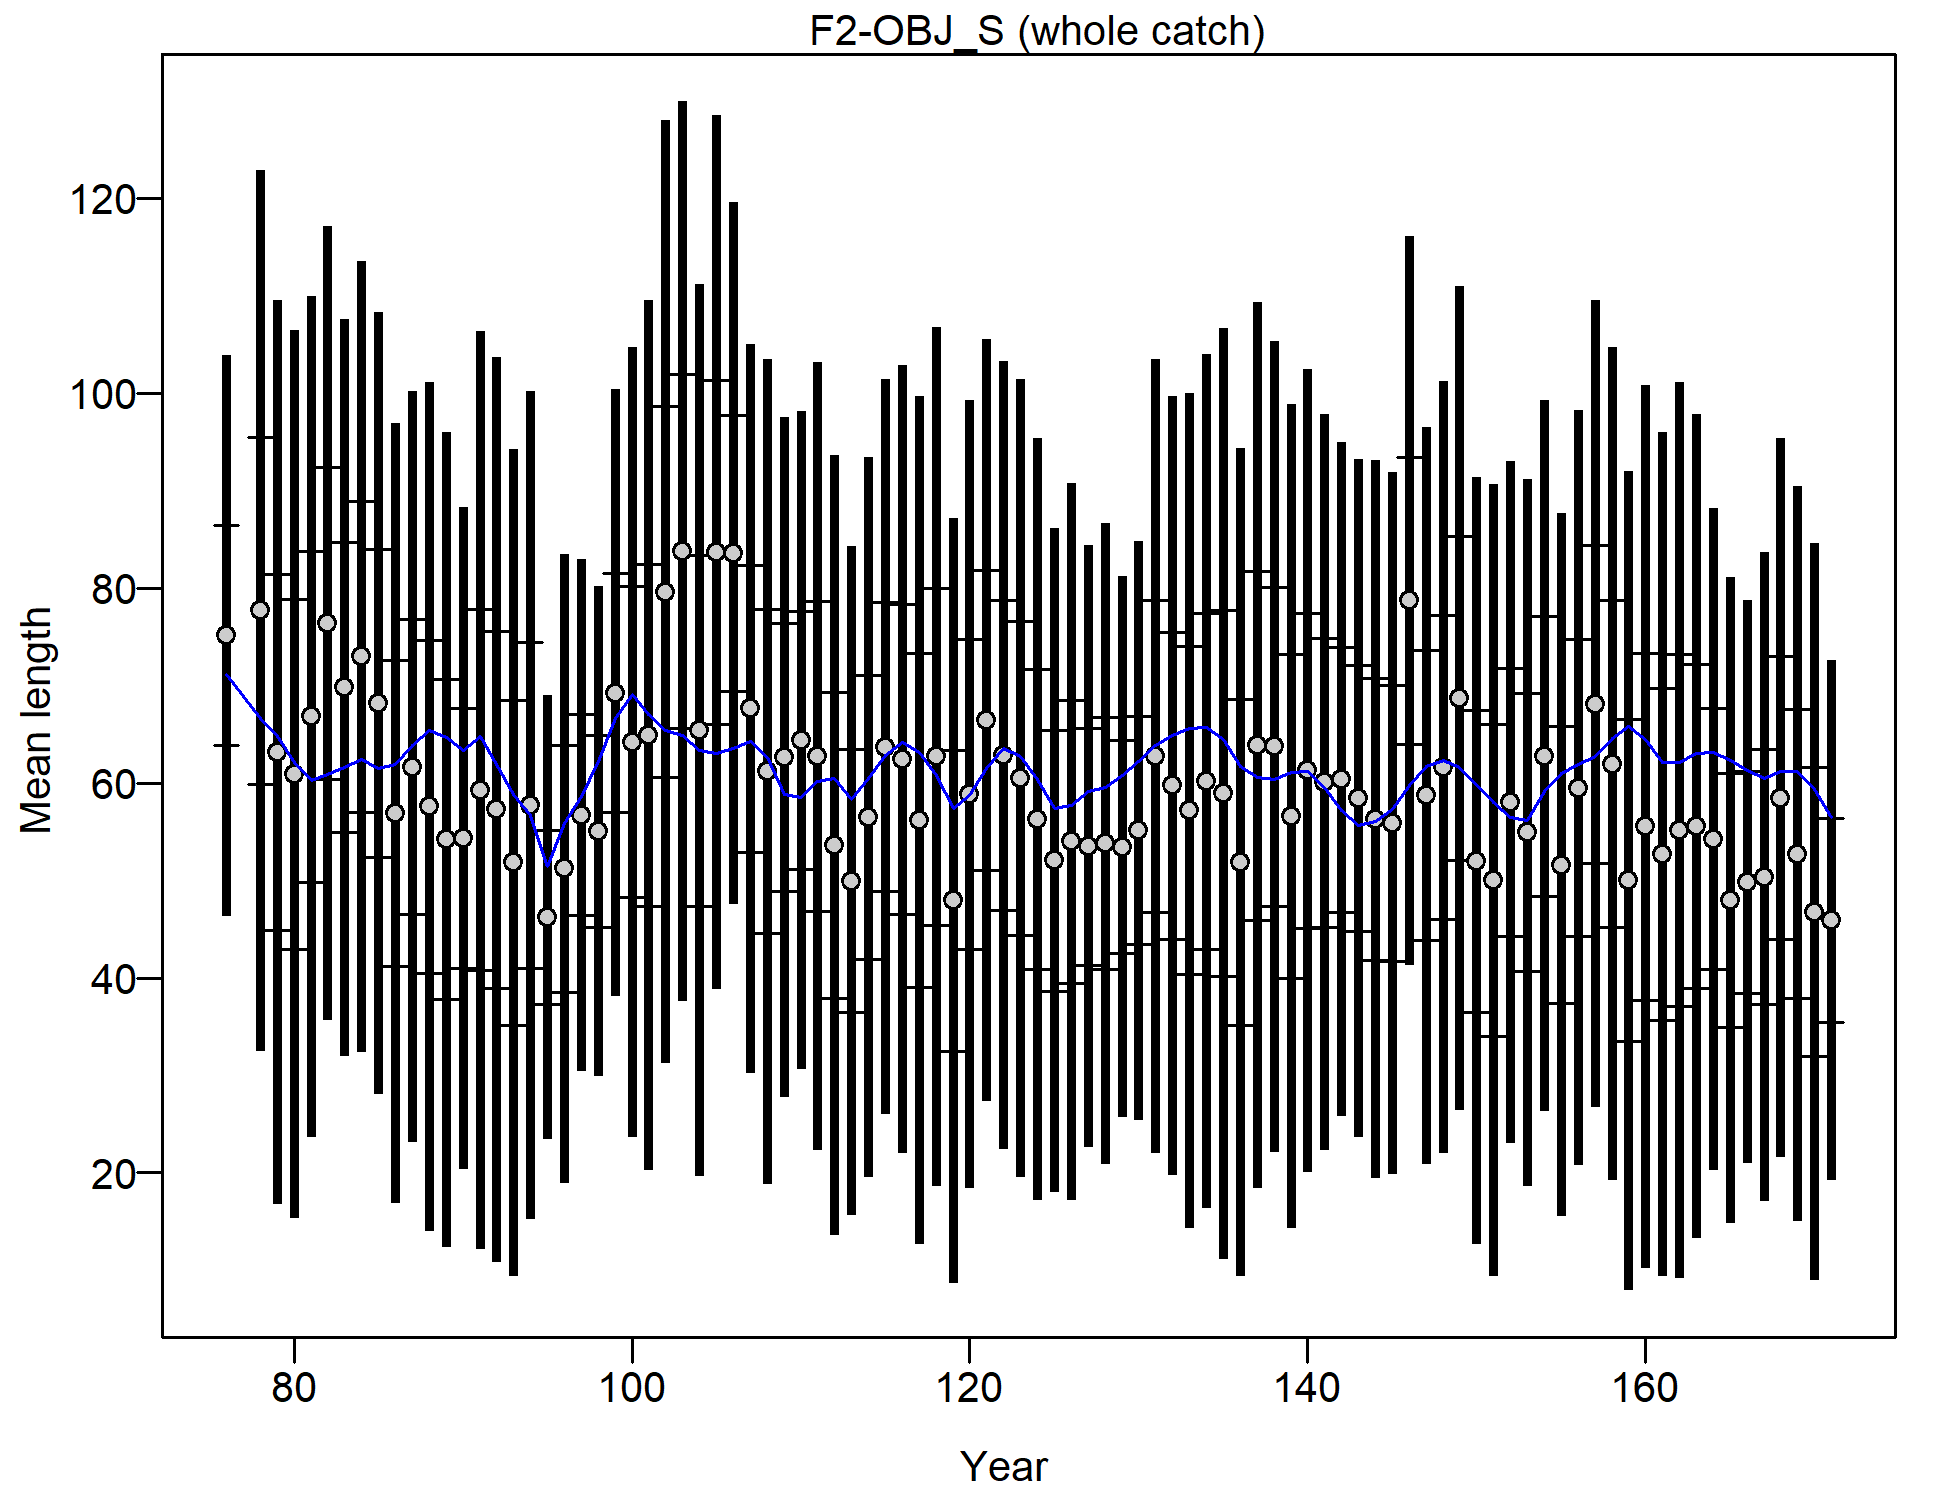
Mean length for F2-OBJ_S with 95% confidence intervals based on current samples sizes.
Francis data weighting method TA1.8: thinner intervals (with capped ends) show result of further adjusting sample sizes based on suggested multiplier (with 95% interval) for len data from F2-OBJ_S:
6.4663 (4.8607-9.641)
For more info, see
Francis, R.I.C.C. (2011). Data weighting in statistical fisheries stock assessment models. Can. J. Fish. Aquat. Sci. 68: 1124-1138. https://doi.org/10.1139/f2011-025
file: comp_lenfit_data_weighting_TA1.8_F2-OBJ_S.png
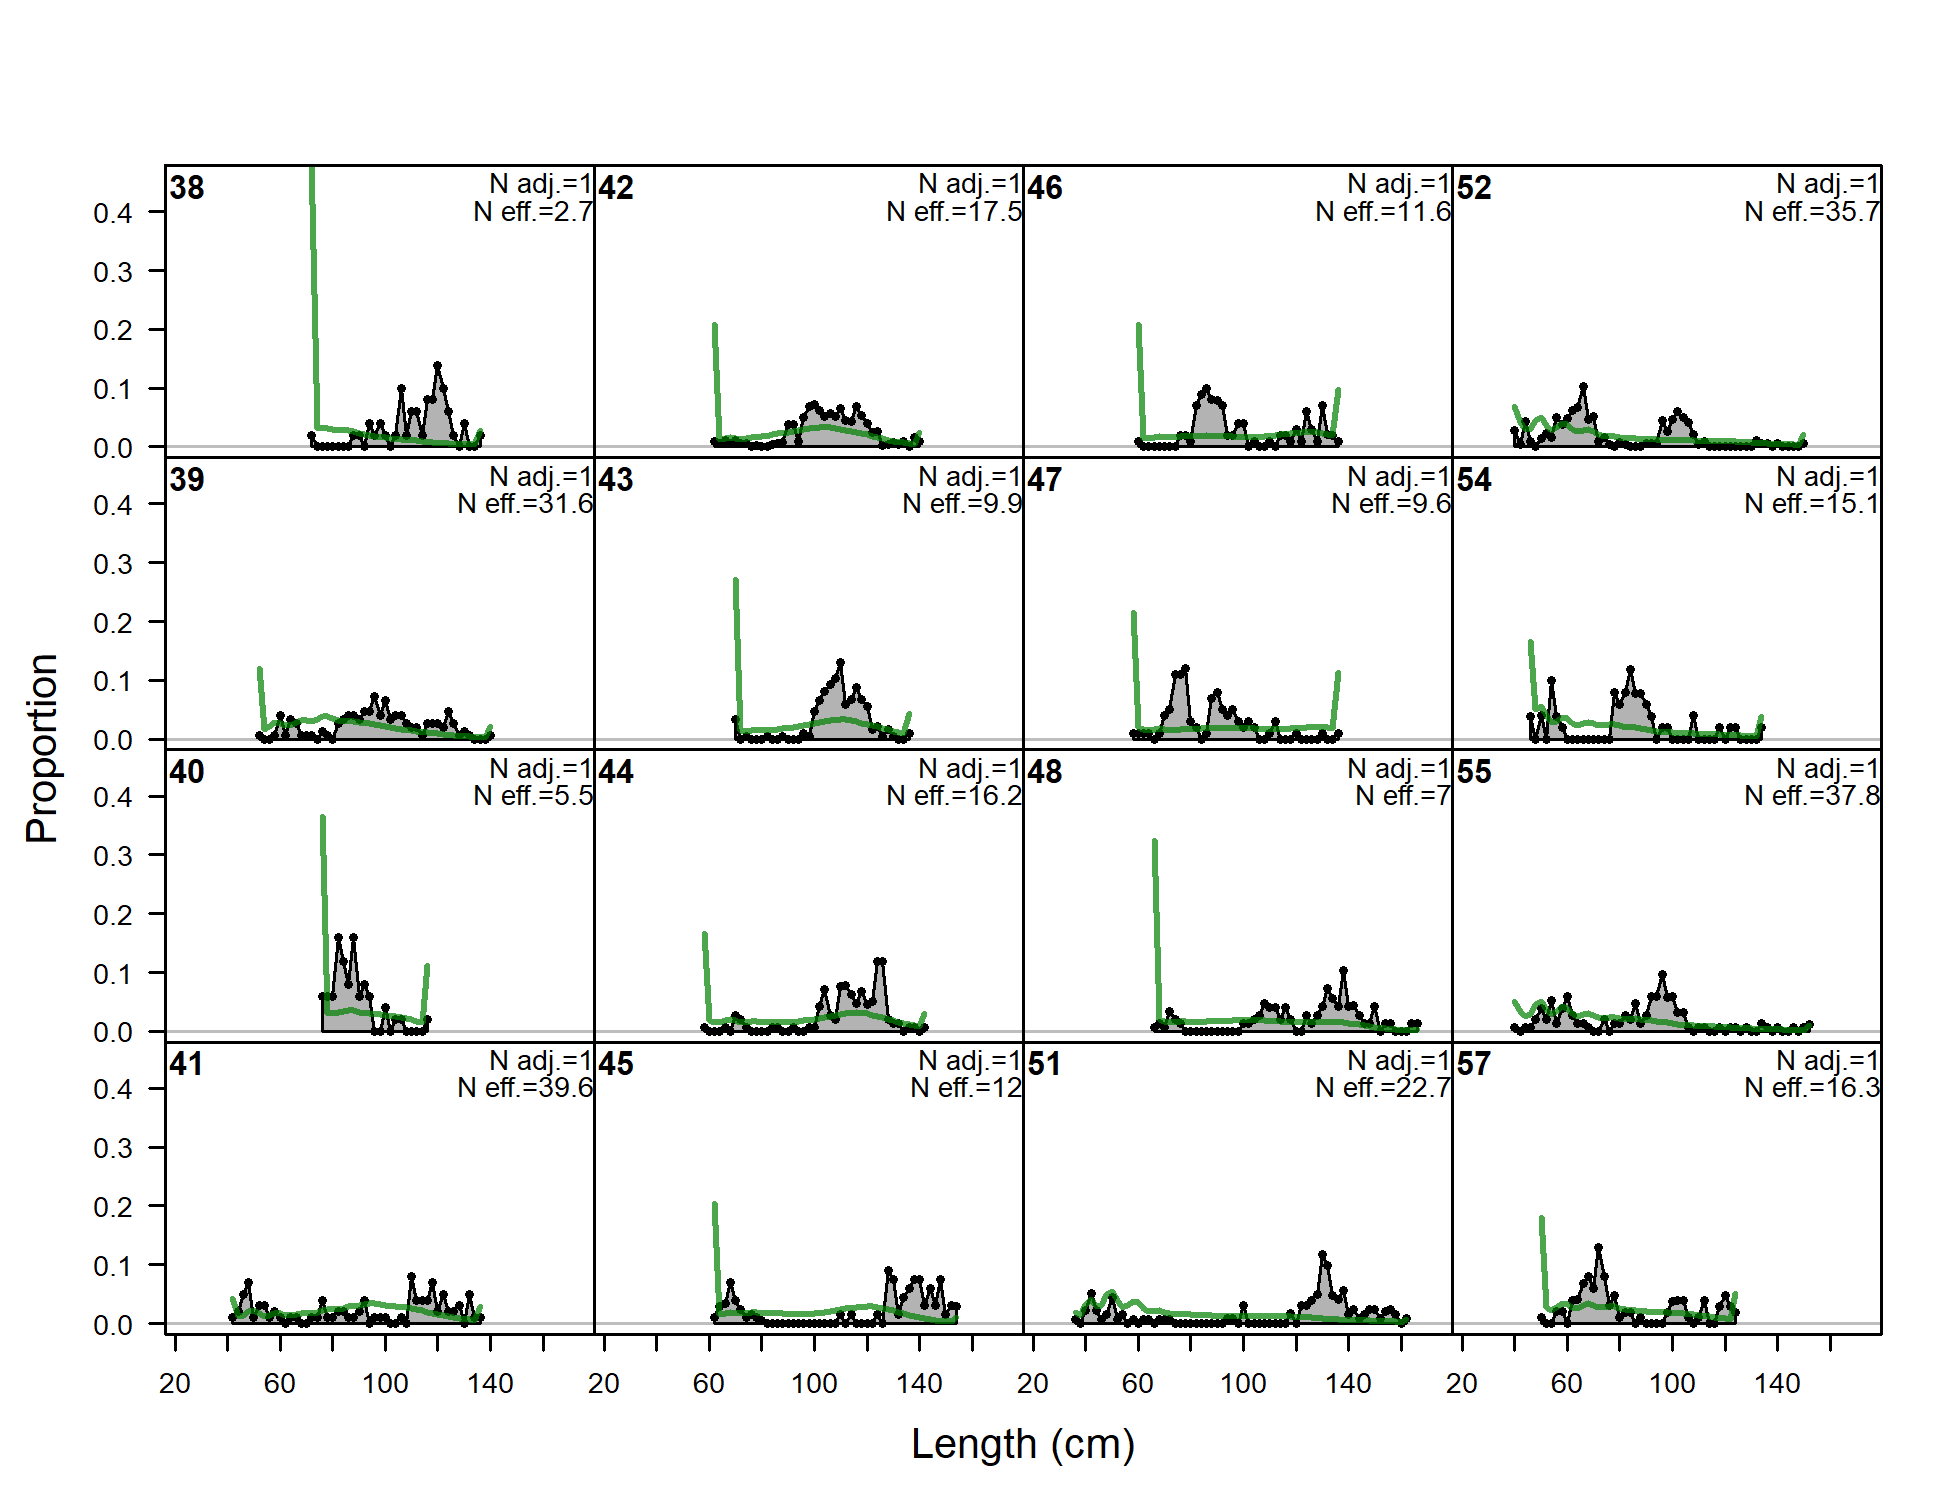
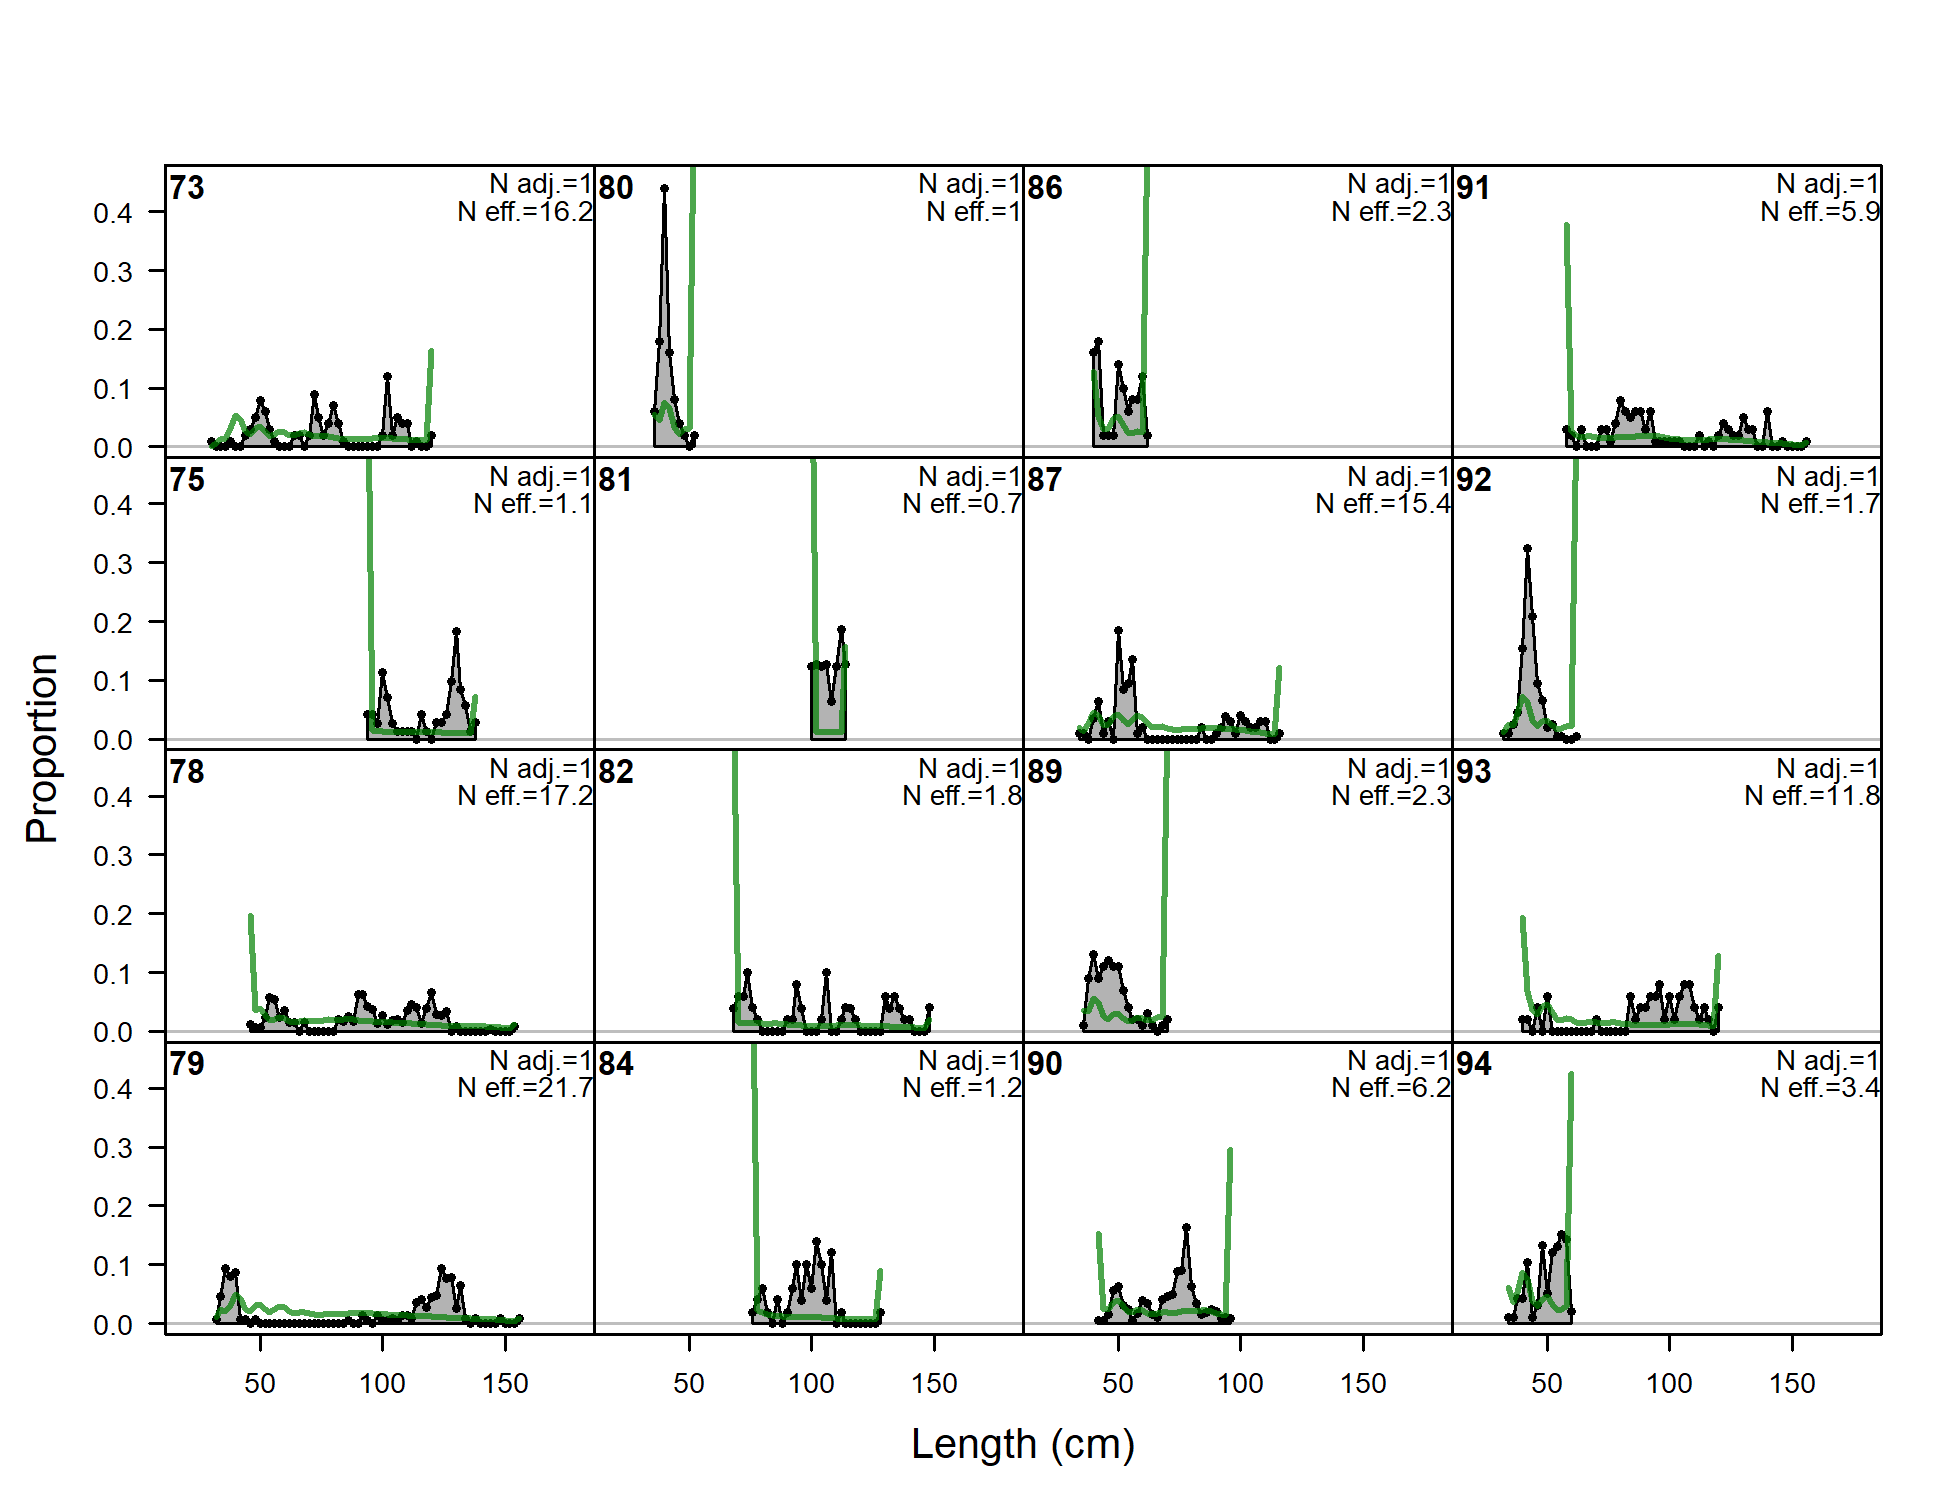
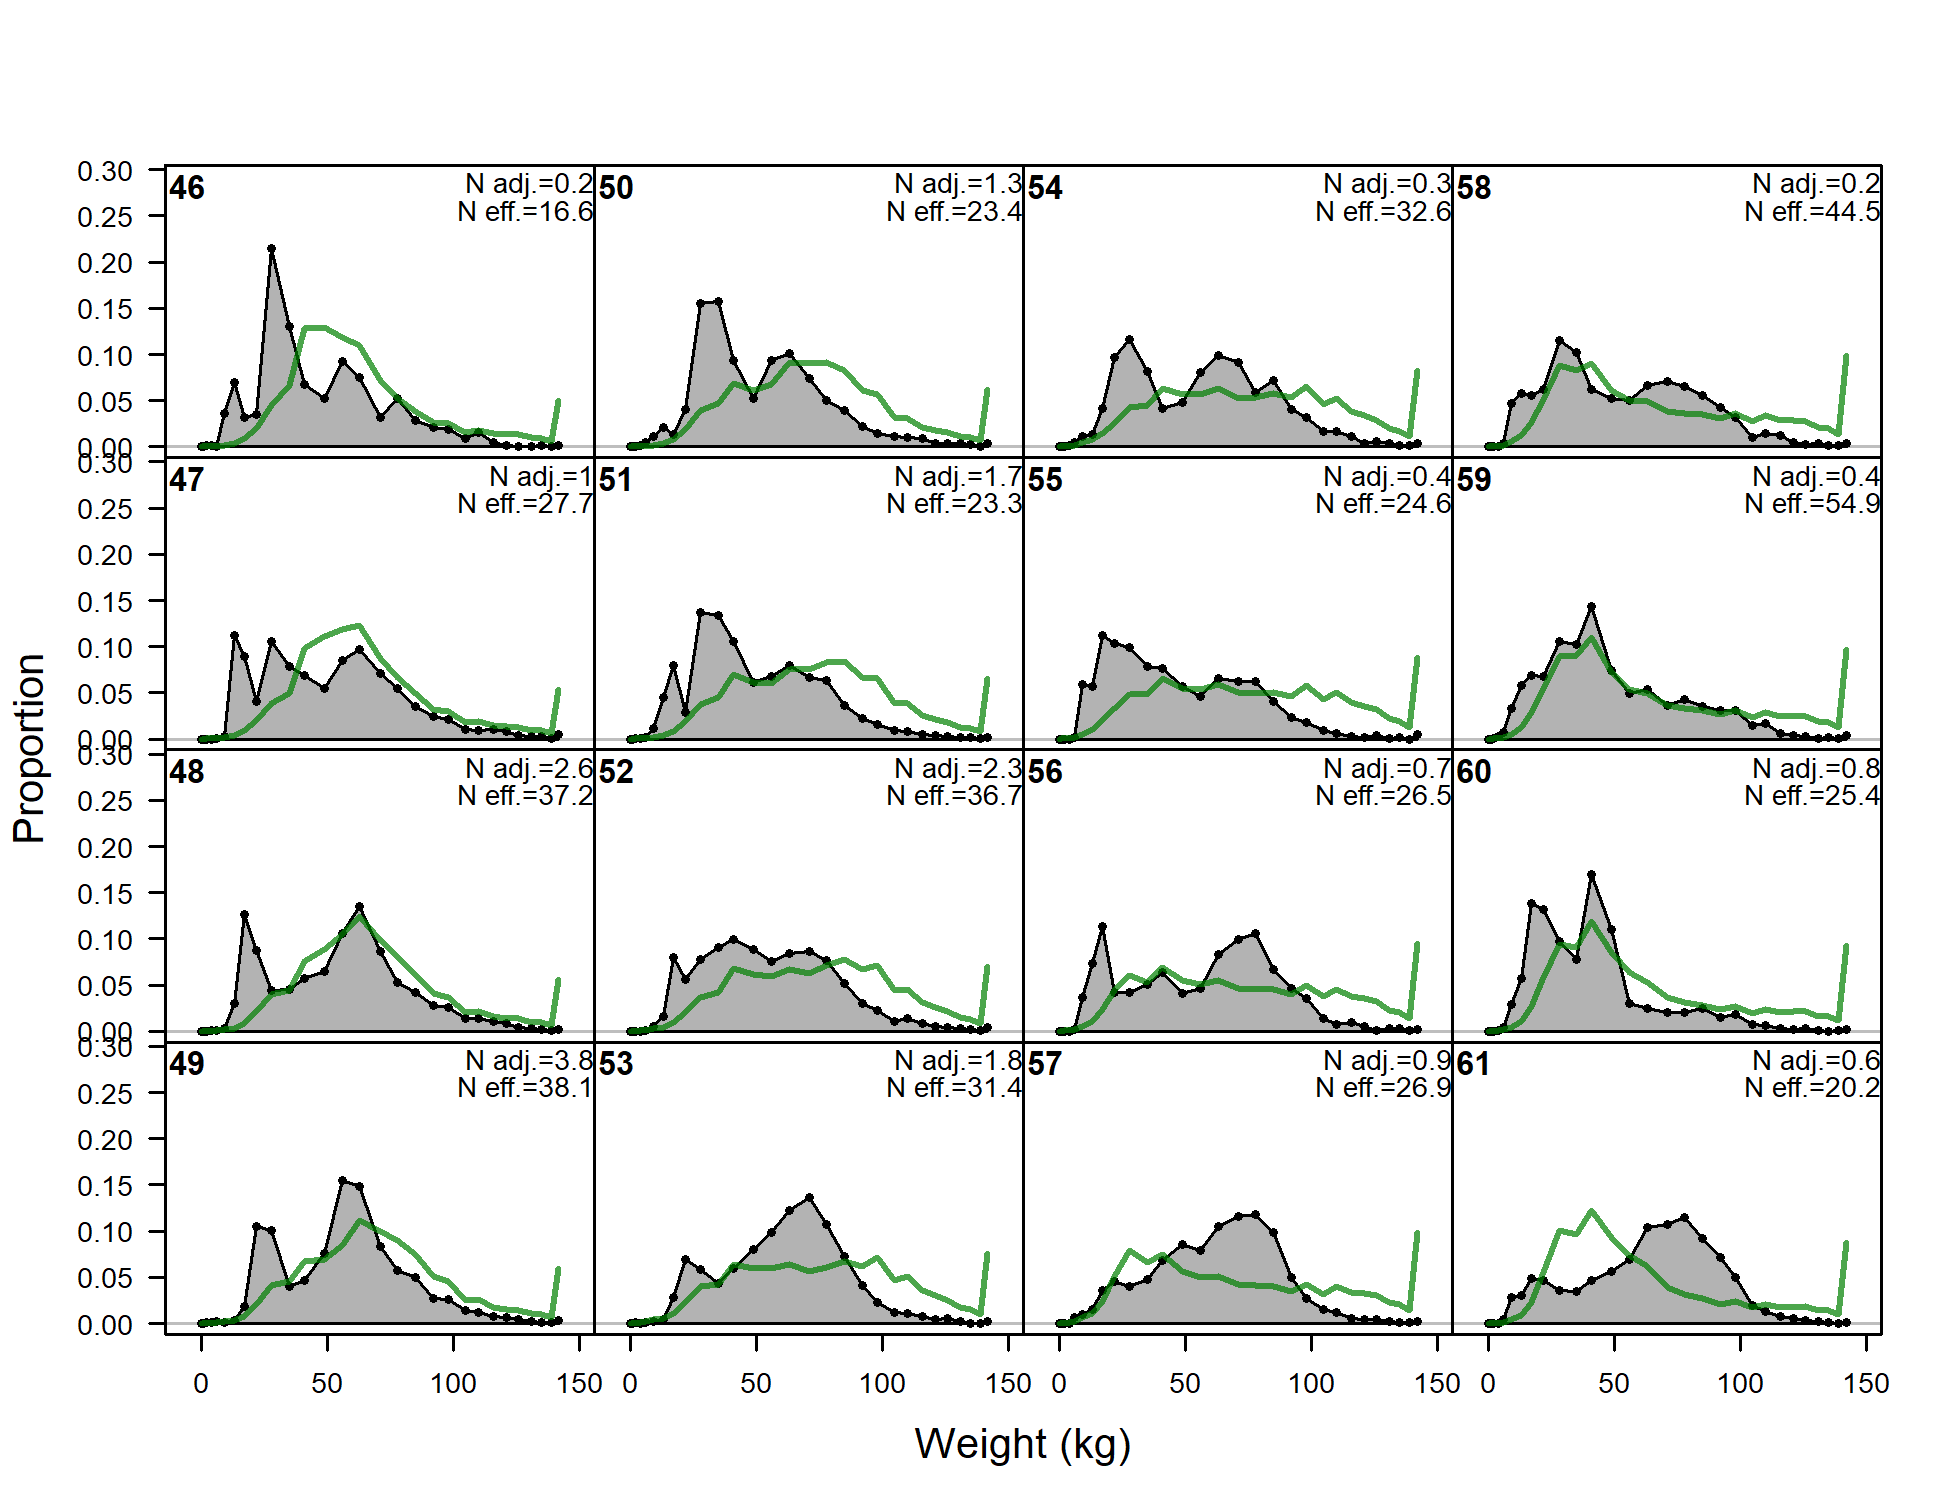
Length comps, whole catch, F3-OBJ_C (plot 1 of 6).
'N adj.' is the input sample size after data-weighting adjustment.N eff. is the calculated effective sample size used in the McAllister-Iannelli tuning method.
file: comp_lenfit_flt3mkt0_page1.png
Length comps, whole catch, F3-OBJ_C (plot 2 of 6)
file: comp_lenfit_flt3mkt0_page2.png
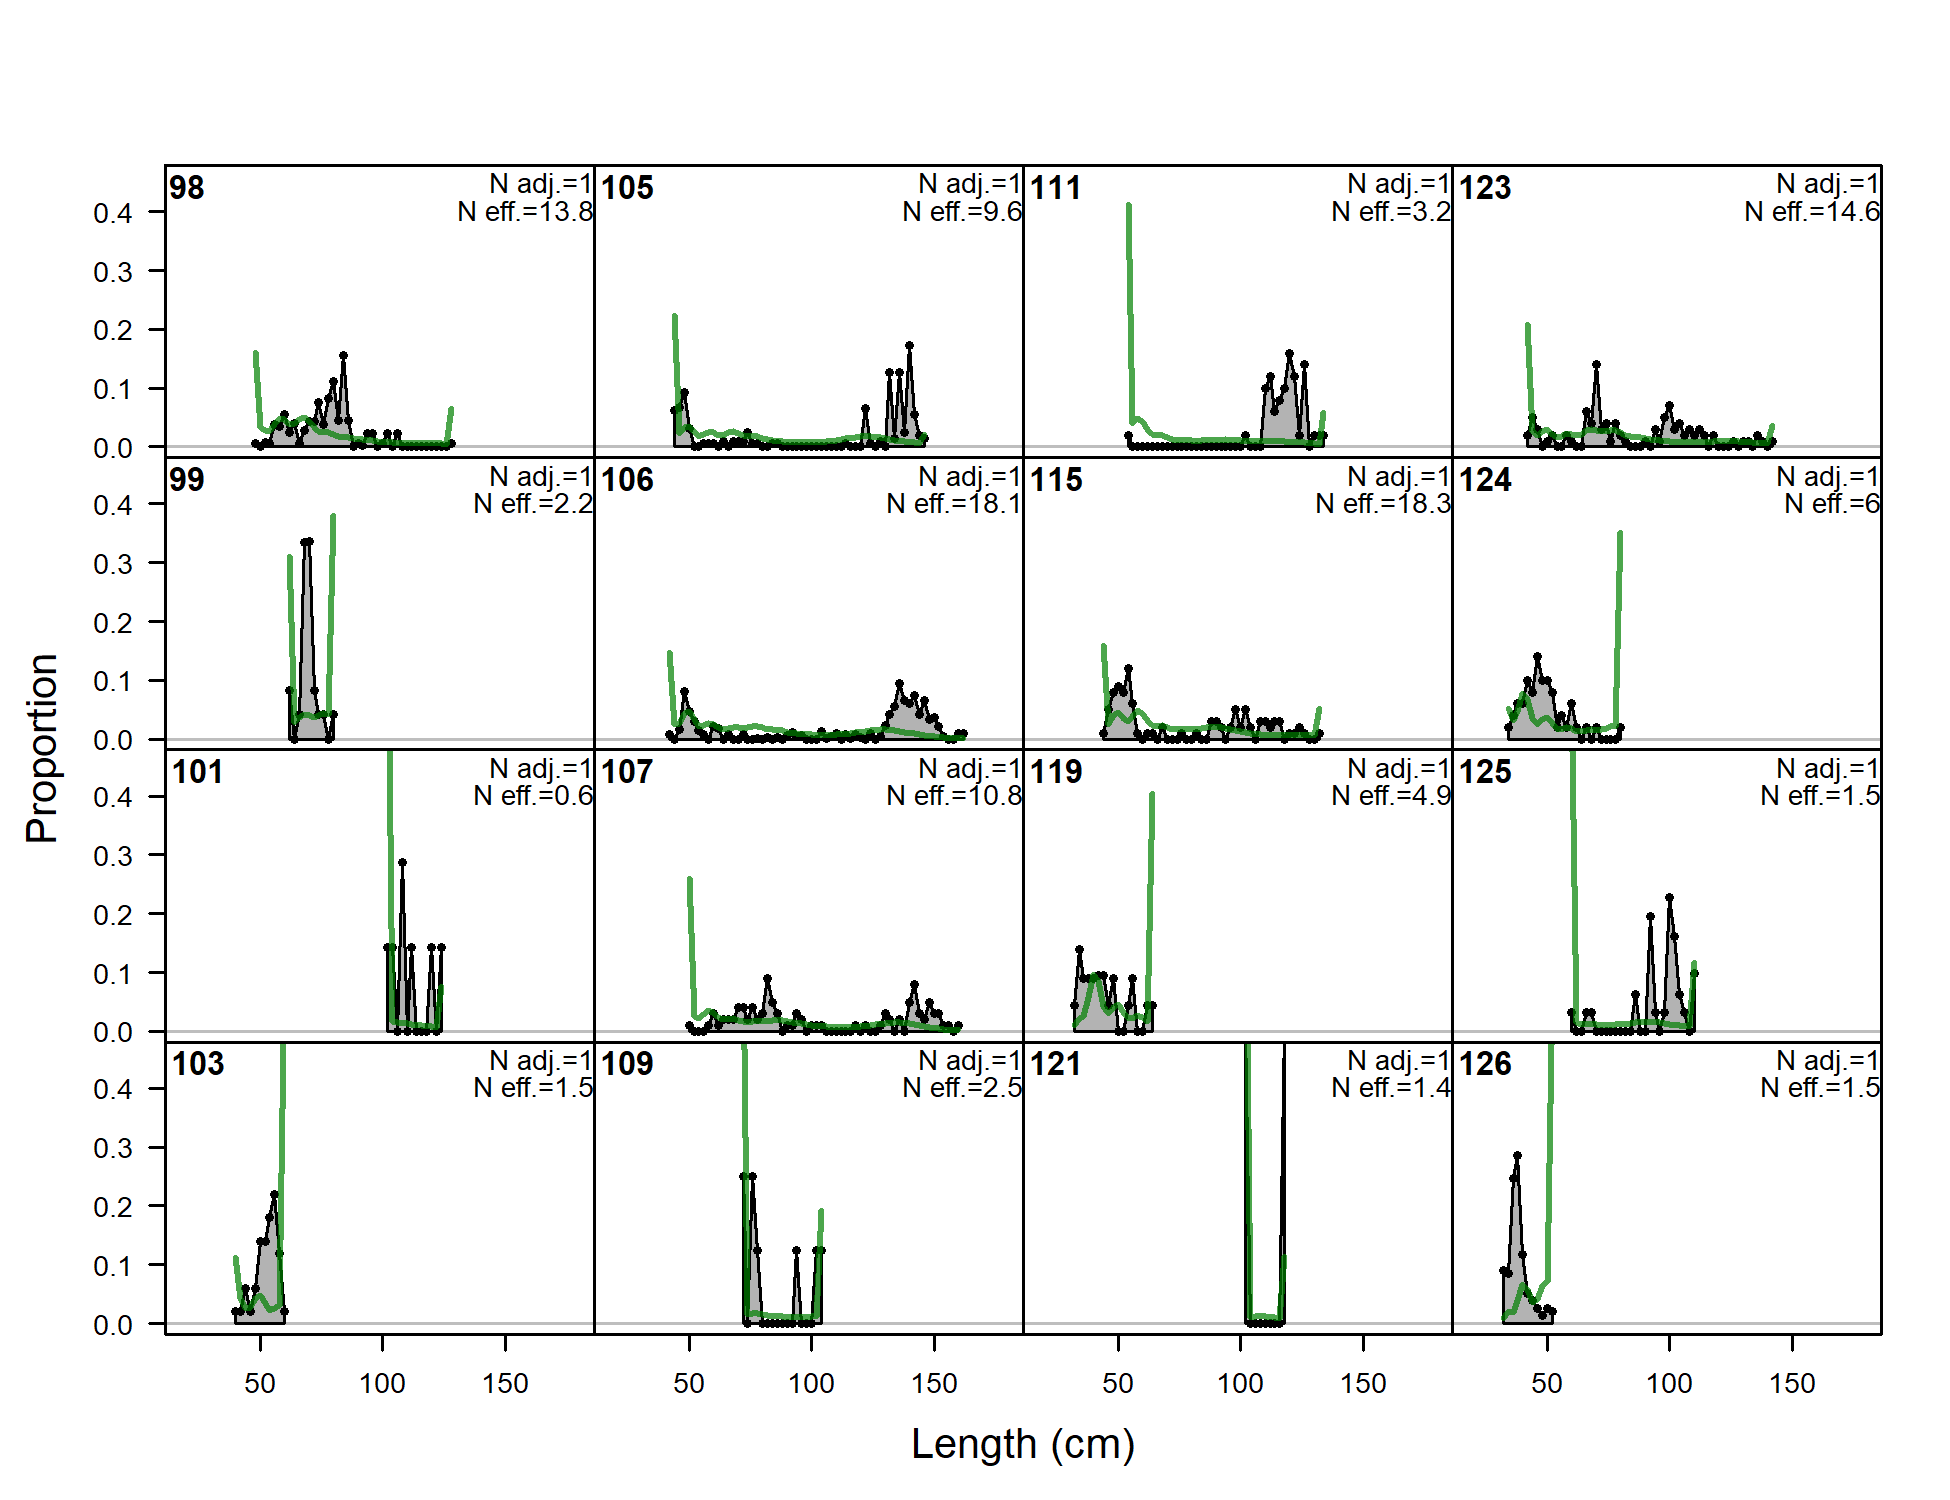
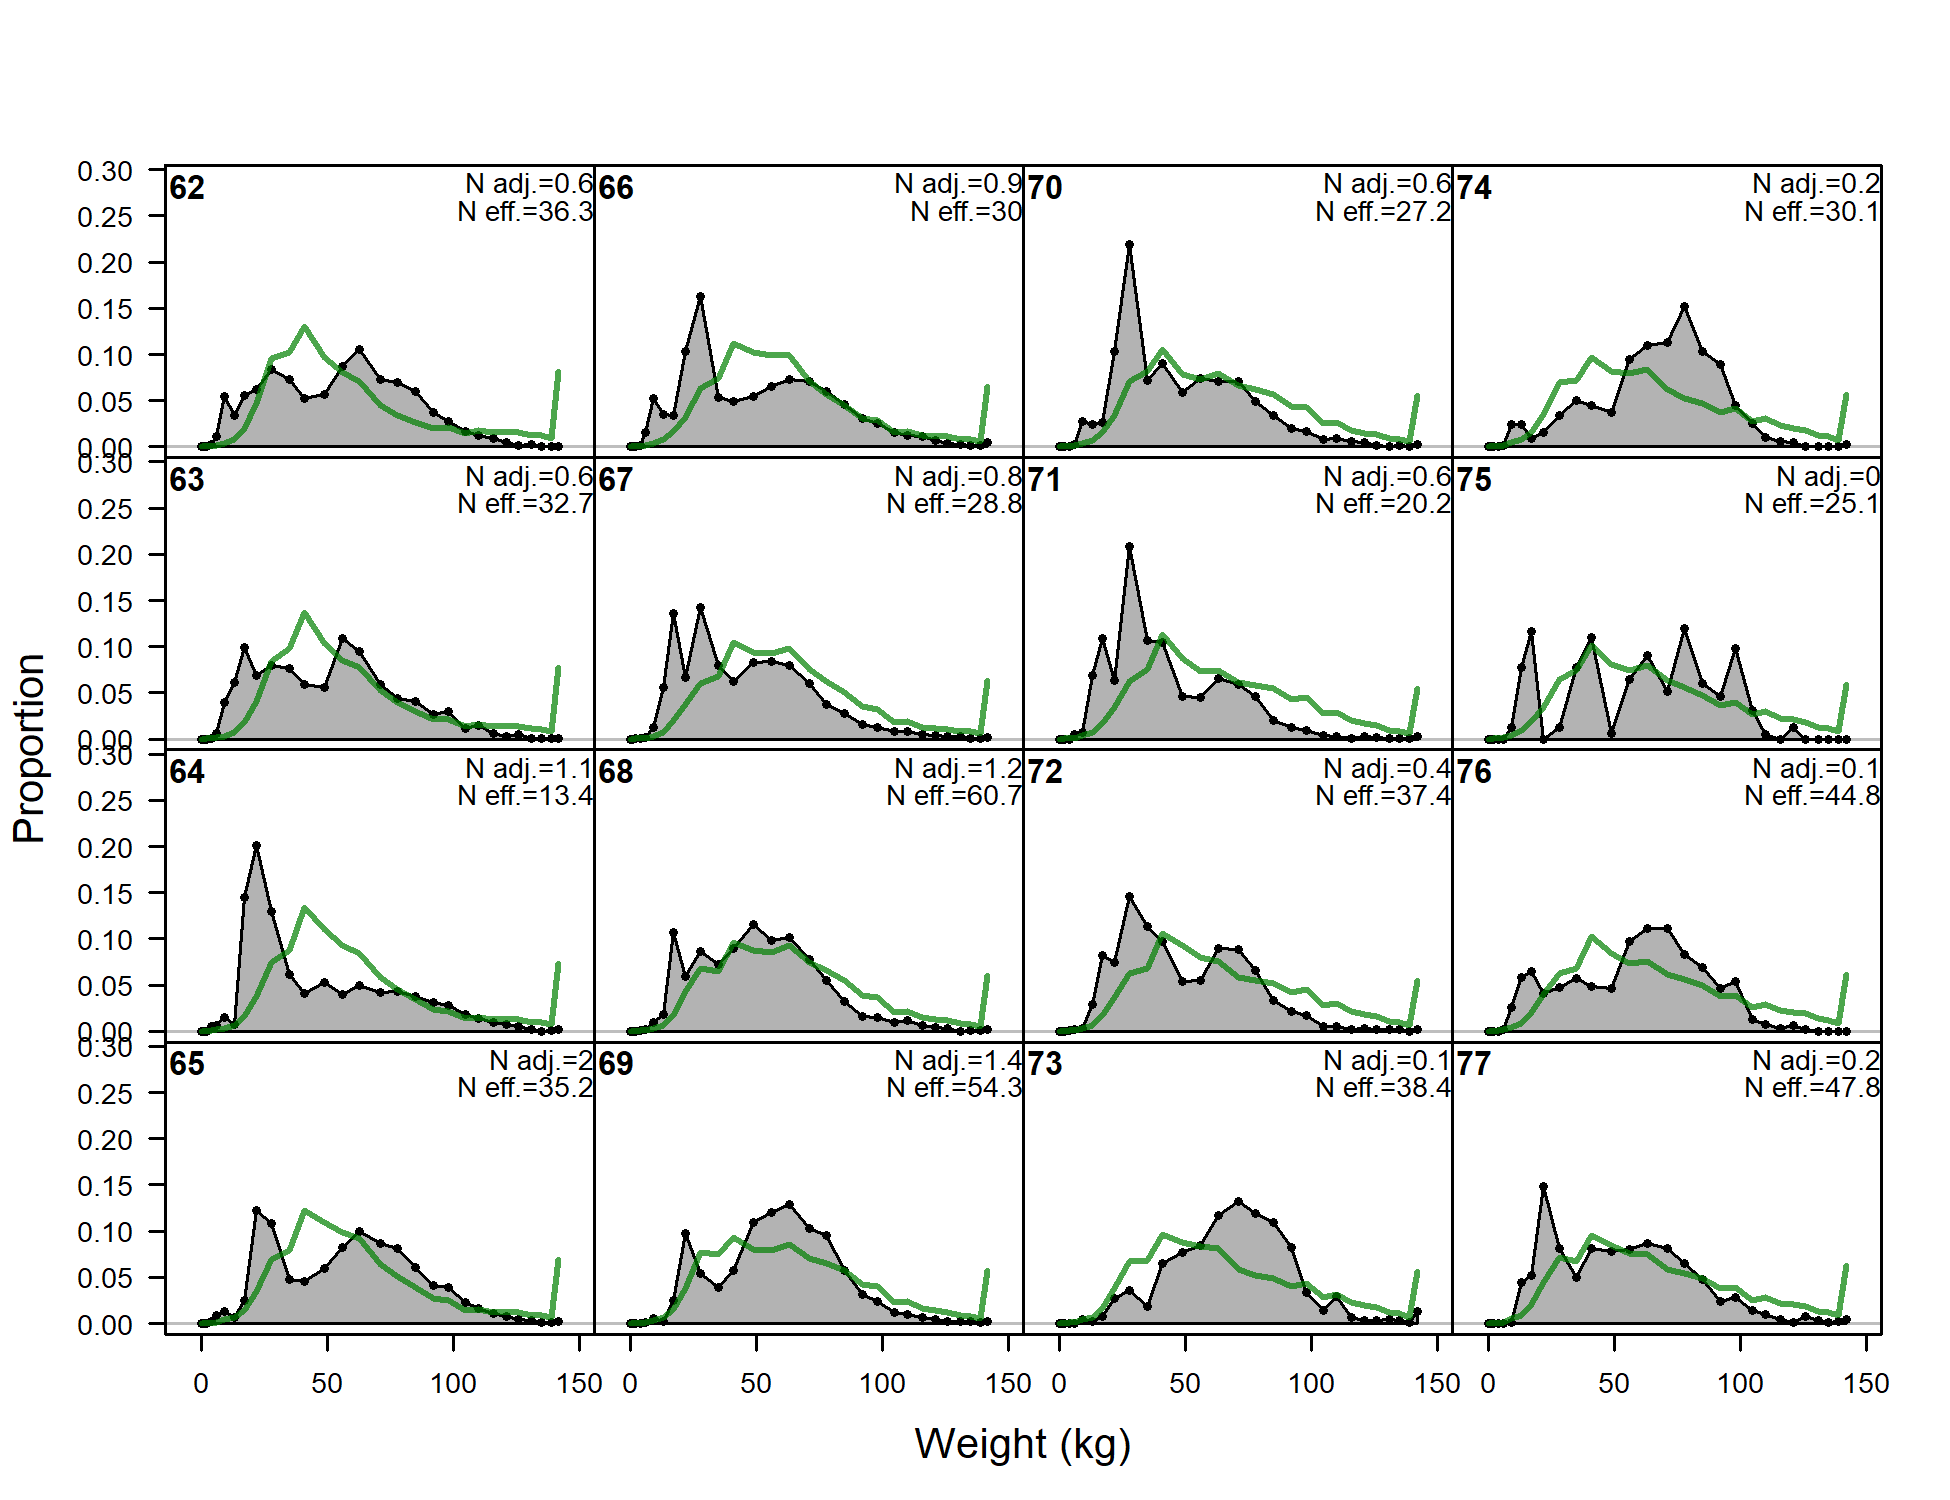
Length comps, whole catch, F3-OBJ_C (plot 3 of 6)
file: comp_lenfit_flt3mkt0_page3.png
Length comps, whole catch, F3-OBJ_C (plot 4 of 6)
file: comp_lenfit_flt3mkt0_page4.png
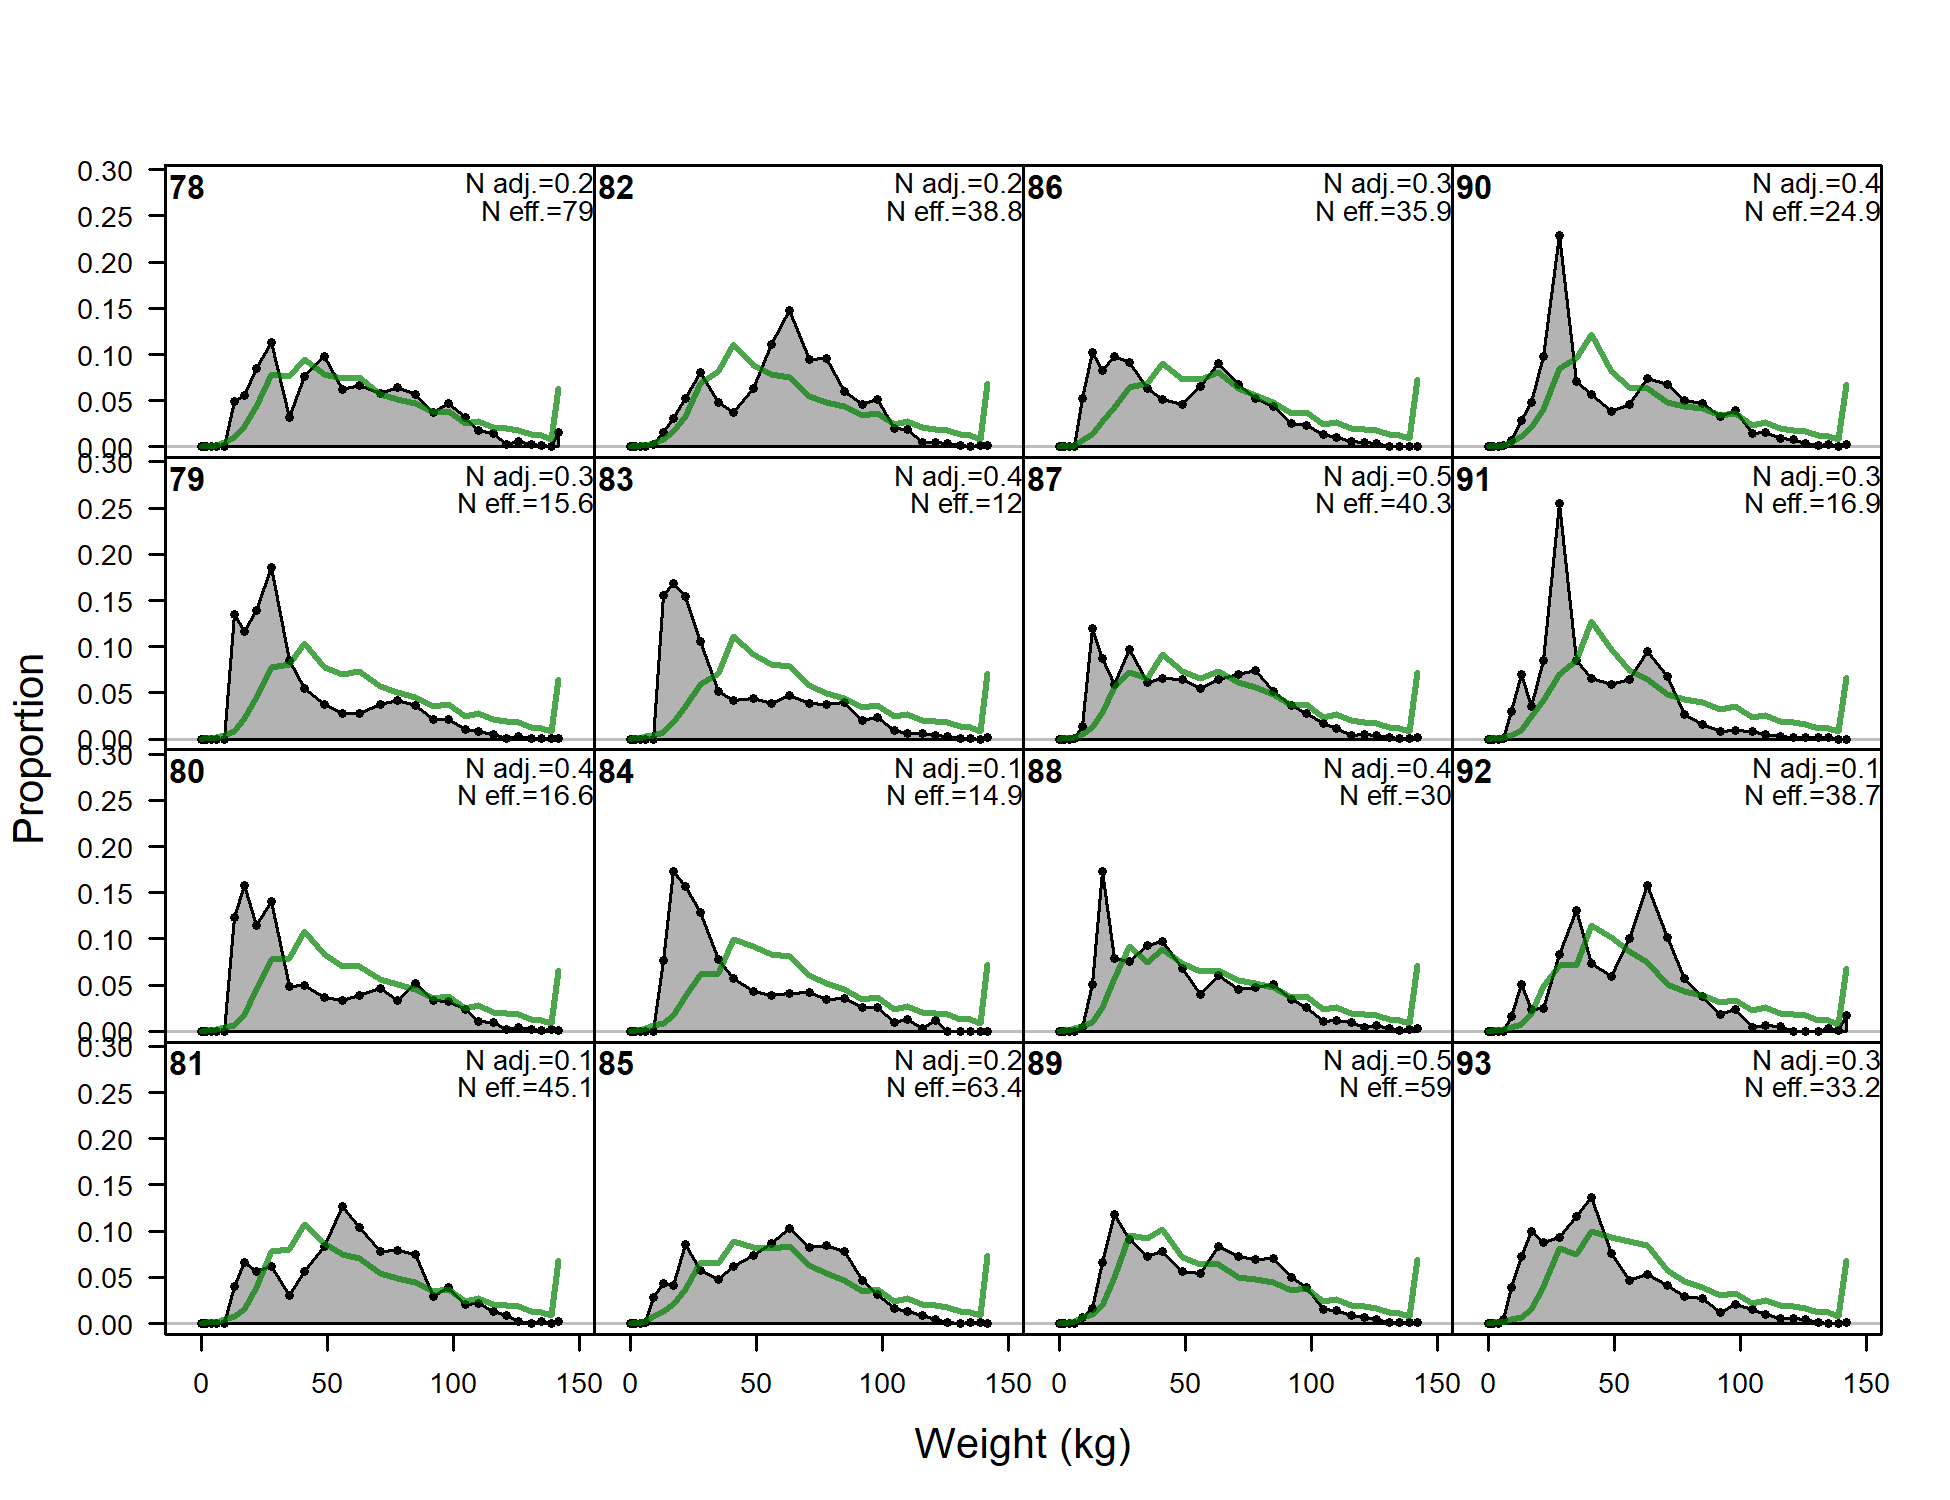
Length comps, whole catch, F3-OBJ_C (plot 5 of 6)
file: comp_lenfit_flt3mkt0_page5.png
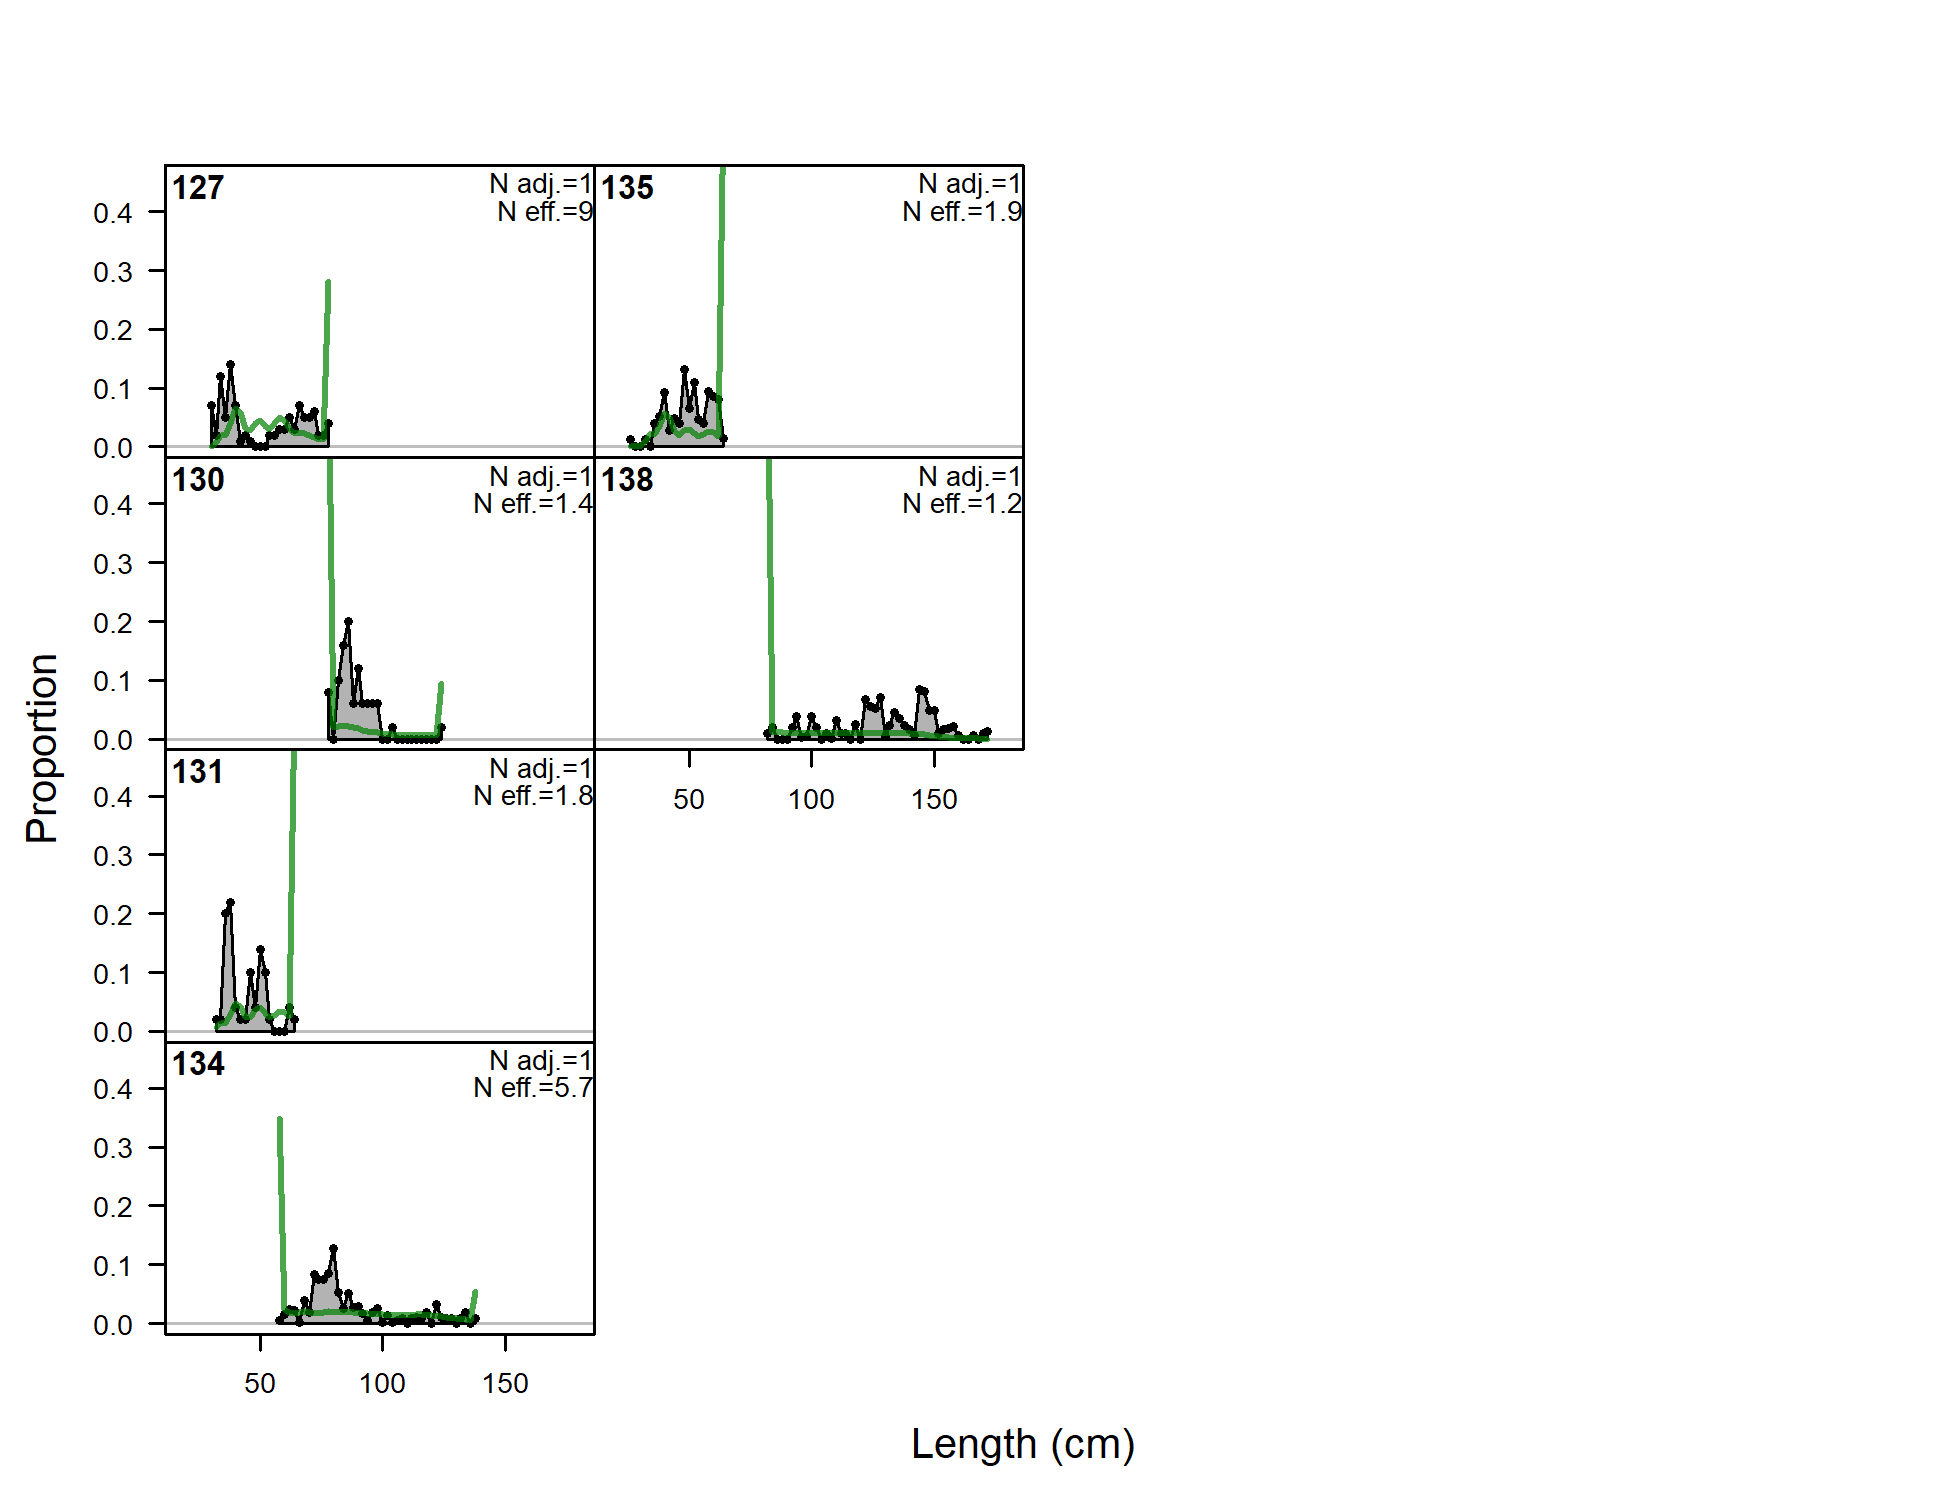
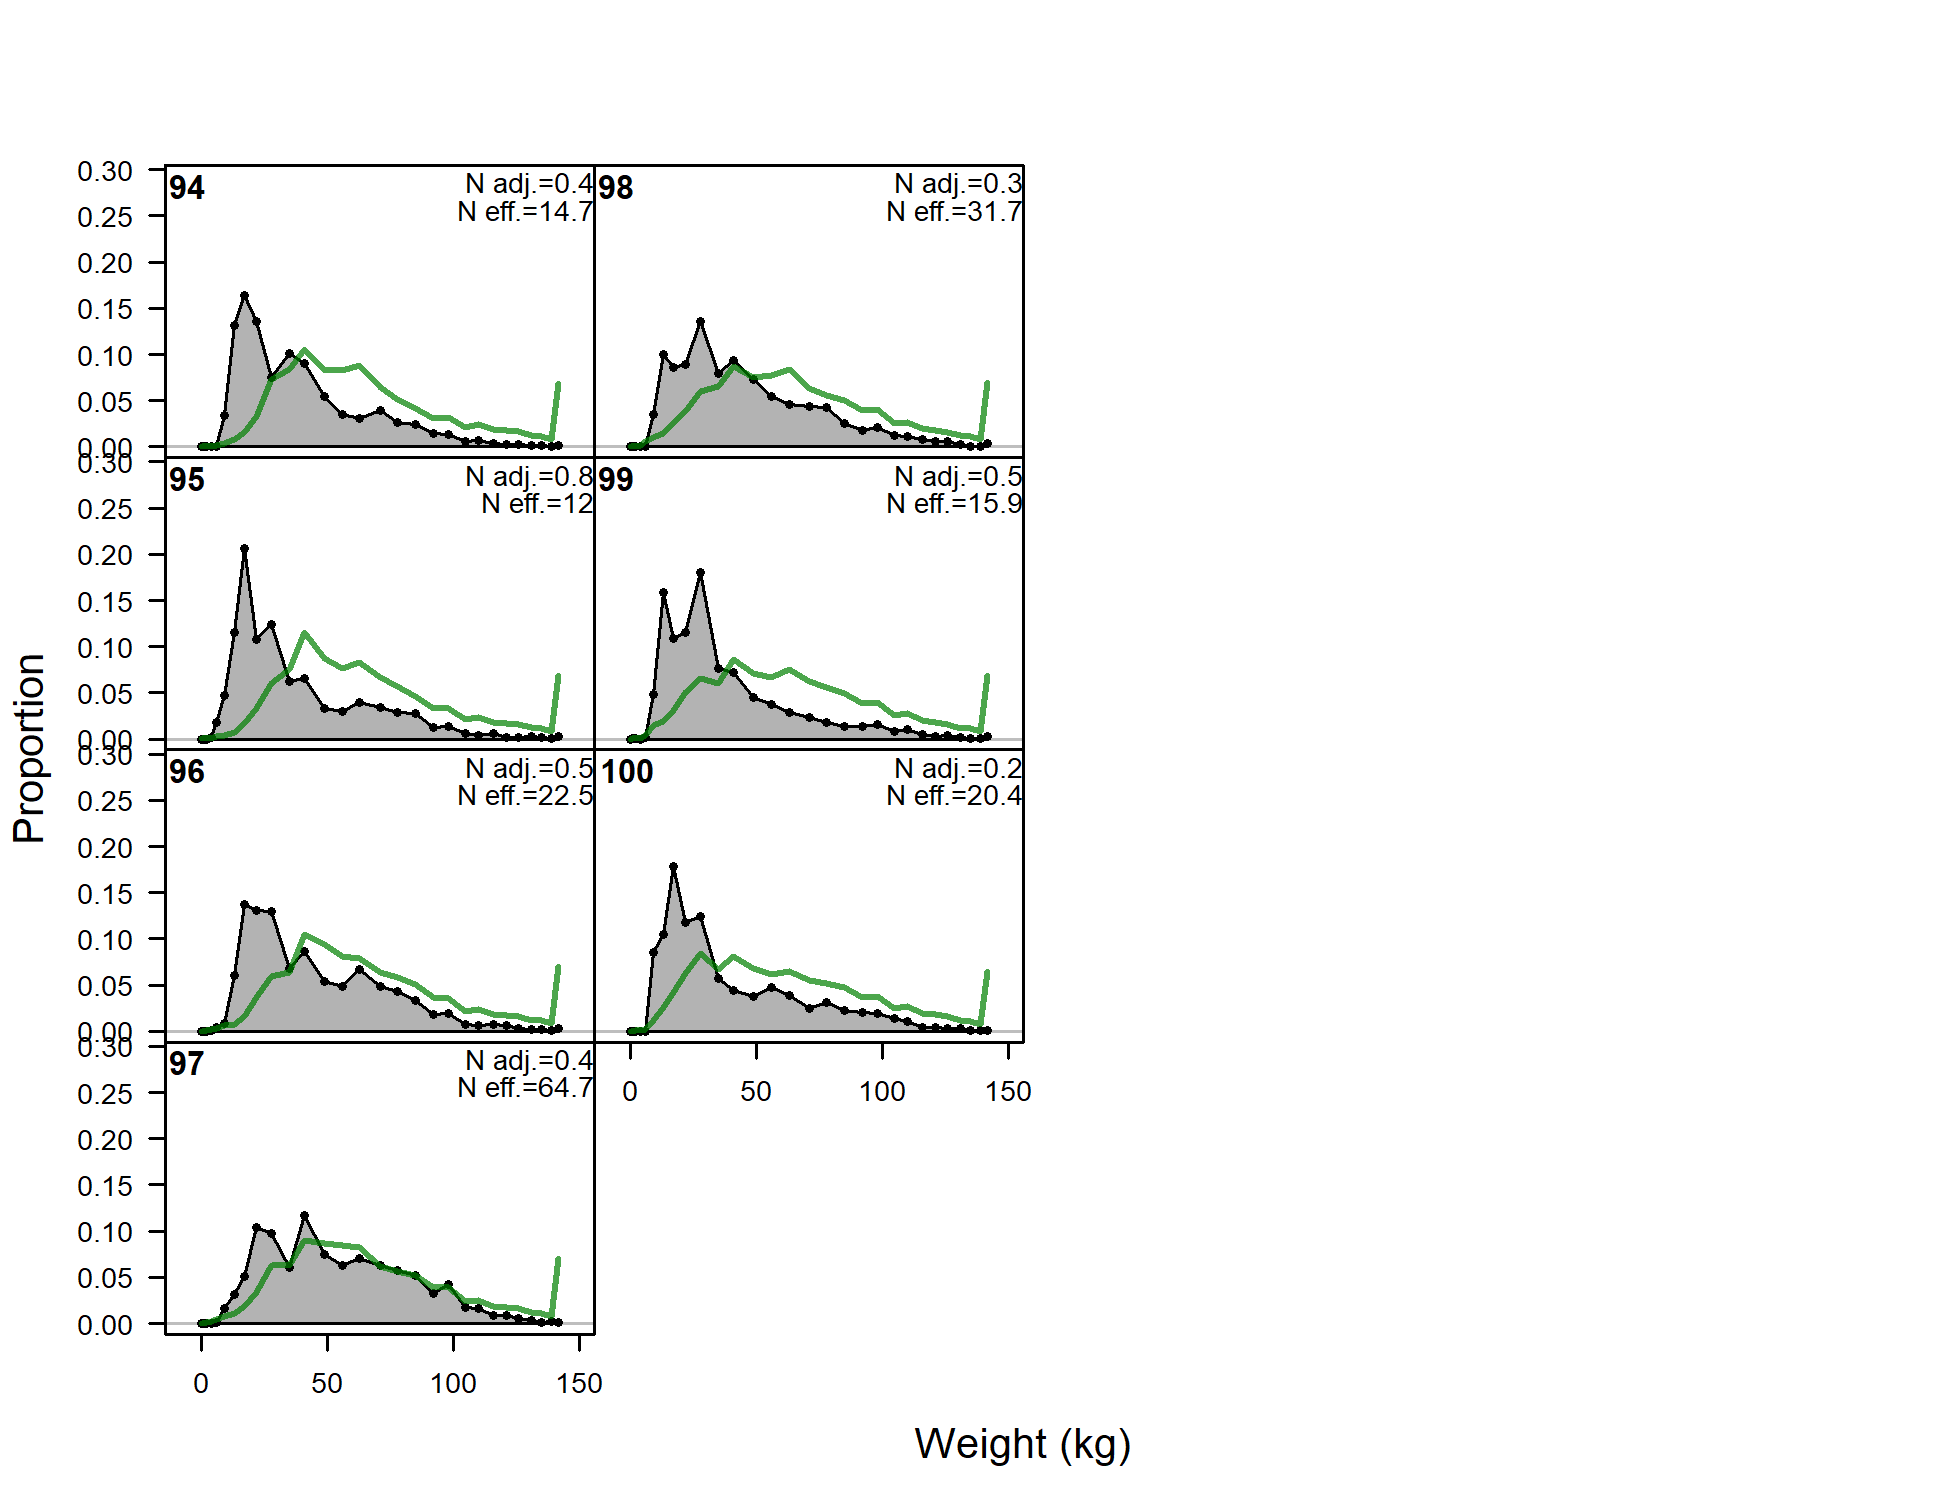
Length comps, whole catch, F3-OBJ_C (plot 6 of 6)
file: comp_lenfit_flt3mkt0_page6.png
Pearson residuals, whole catch, F3-OBJ_C (max=2.01) (plot 6 of 6)
Closed bubbles are positive residuals (observed > expected) and open bubbles are negative residuals (observed < expected).
file: comp_lenfit_residsflt3mkt0_page6.png
N-EffN comparison, Length comps, whole catch, F3-OBJ_C
file: comp_lenfit_sampsize_flt3mkt0.png
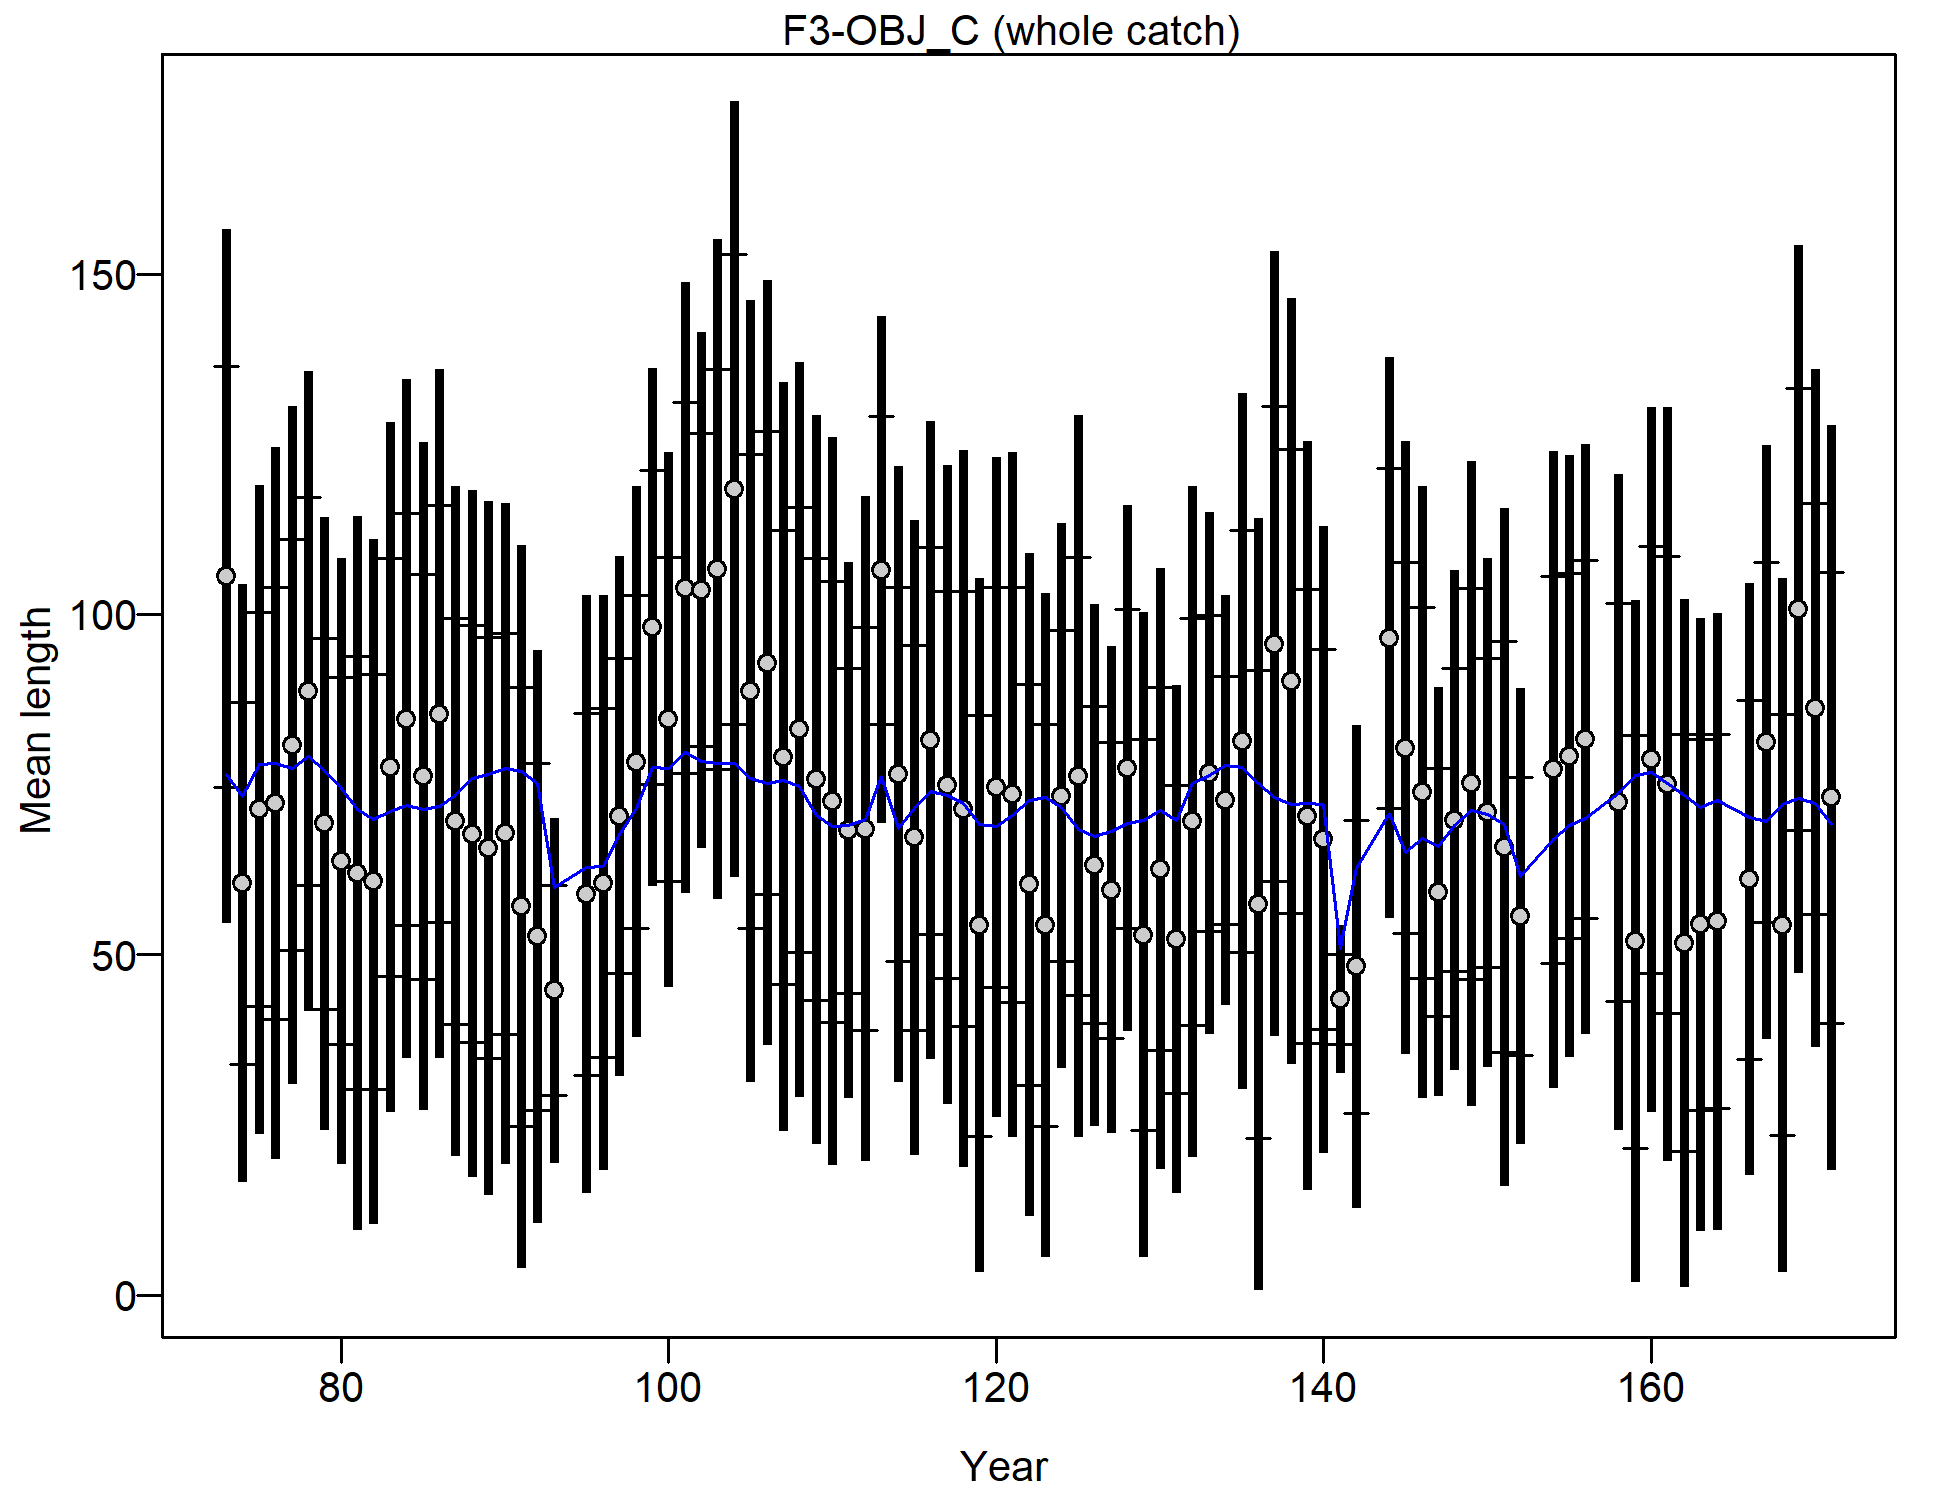
Mean length for F3-OBJ_C with 95% confidence intervals based on current samples sizes.
Francis data weighting method TA1.8: thinner intervals (with capped ends) show result of further adjusting sample sizes based on suggested multiplier (with 95% interval) for len data from F3-OBJ_C:
2.7197 (2.1394-3.8021)
For more info, see
Francis, R.I.C.C. (2011). Data weighting in statistical fisheries stock assessment models. Can. J. Fish. Aquat. Sci. 68: 1124-1138. https://doi.org/10.1139/f2011-025
file: comp_lenfit_data_weighting_TA1.8_F3-OBJ_C.png
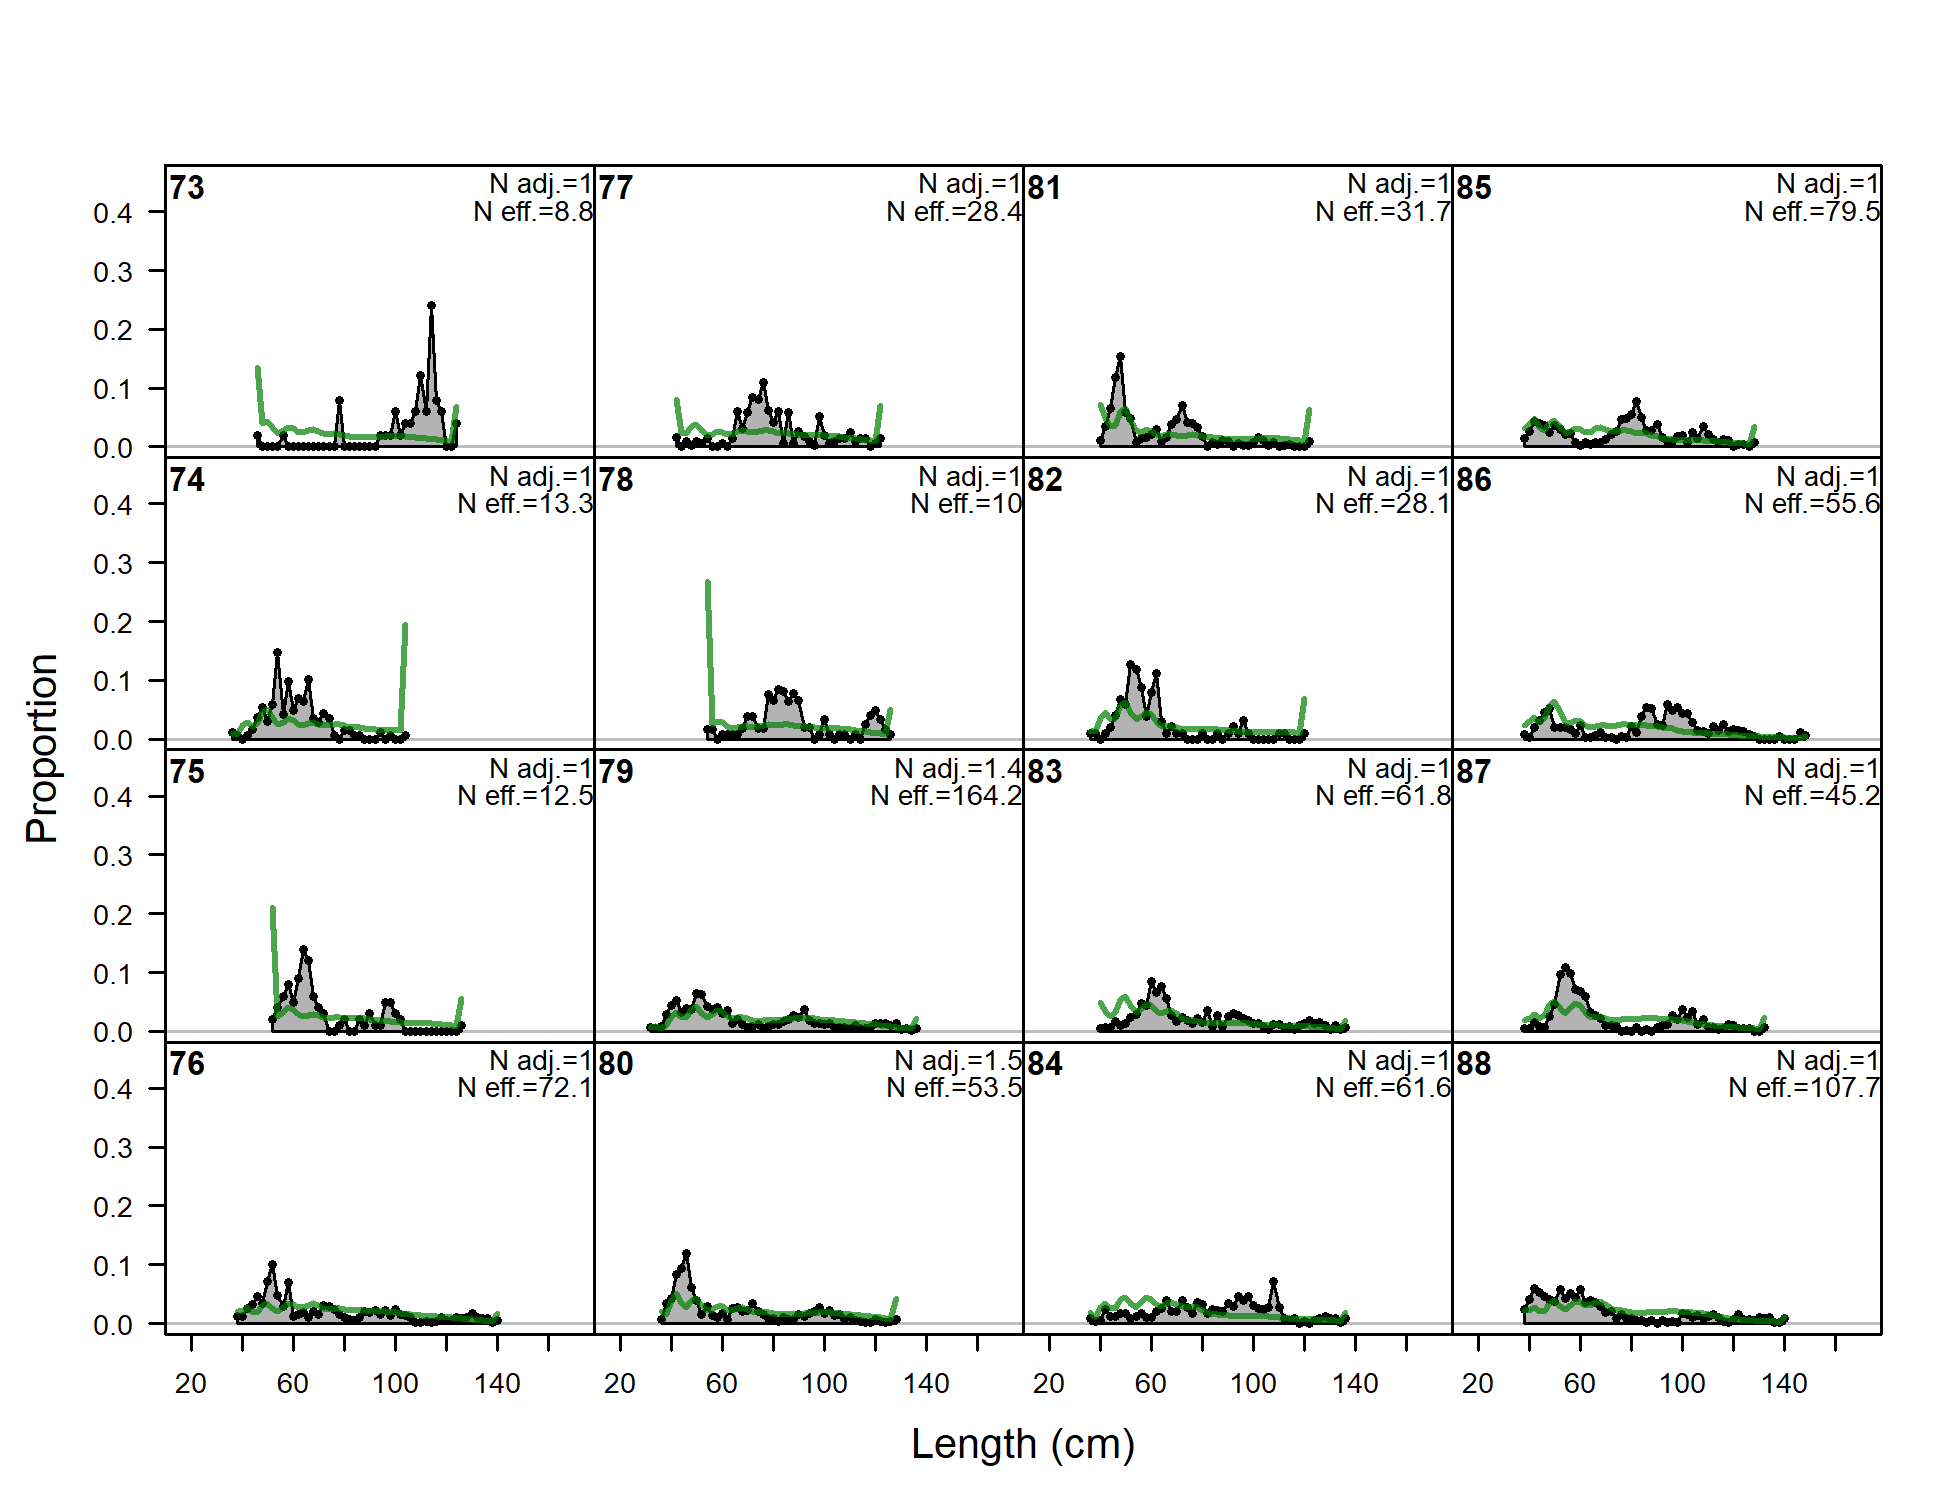
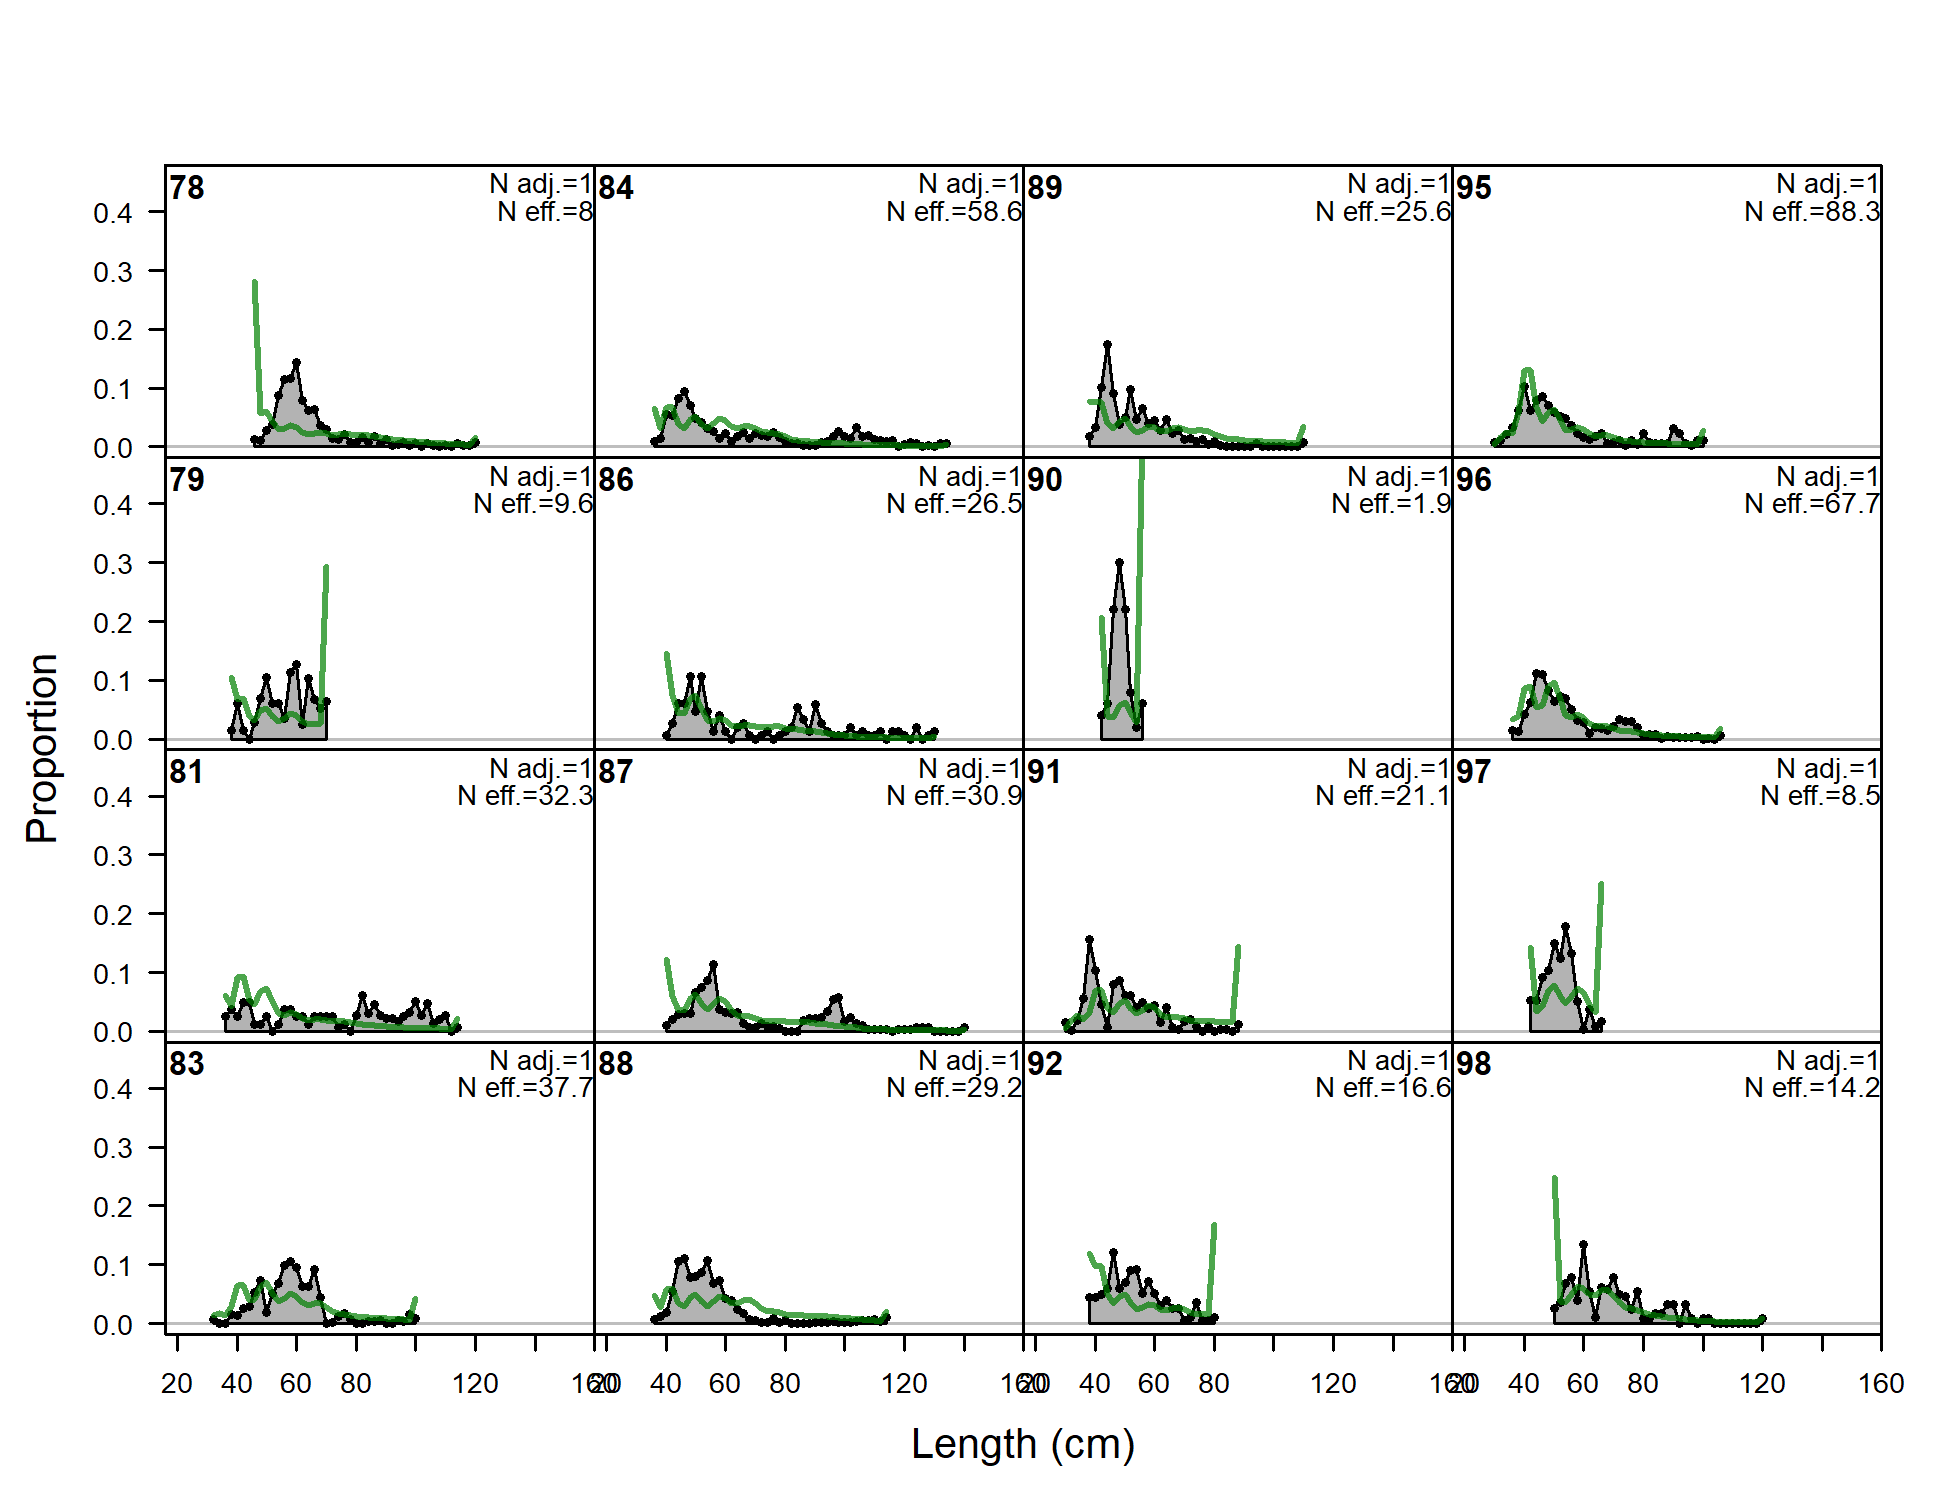
Length comps, whole catch, F4-OBJ_I (plot 1 of 3).
'N adj.' is the input sample size after data-weighting adjustment.N eff. is the calculated effective sample size used in the McAllister-Iannelli tuning method.
file: comp_lenfit_flt4mkt0_page1.png
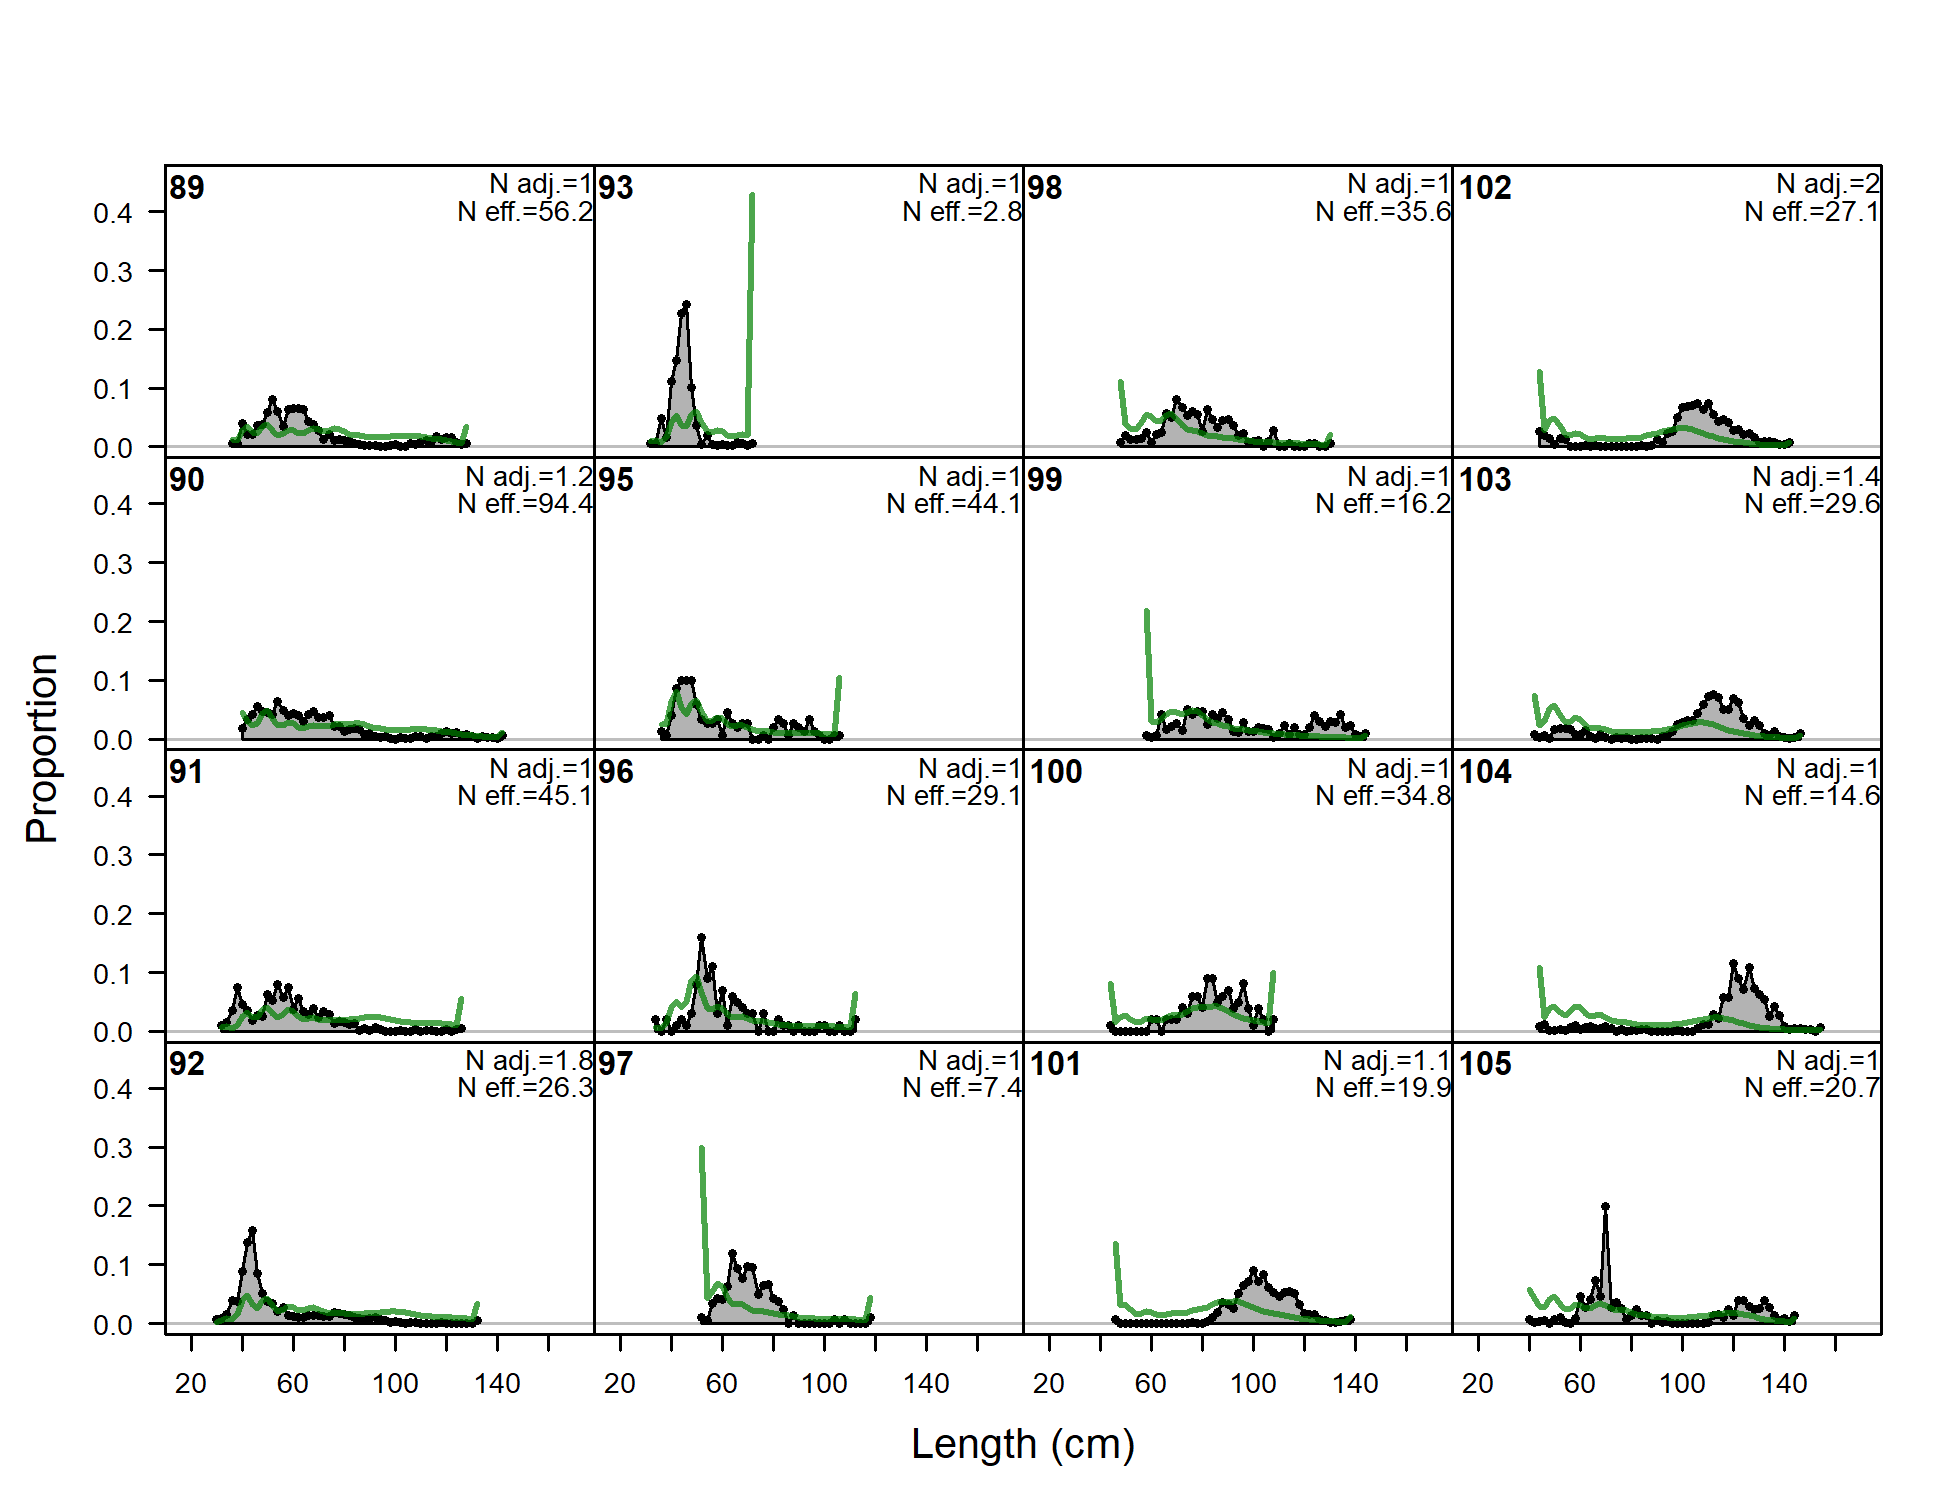
Length comps, whole catch, F4-OBJ_I (plot 2 of 3)
file: comp_lenfit_flt4mkt0_page2.png
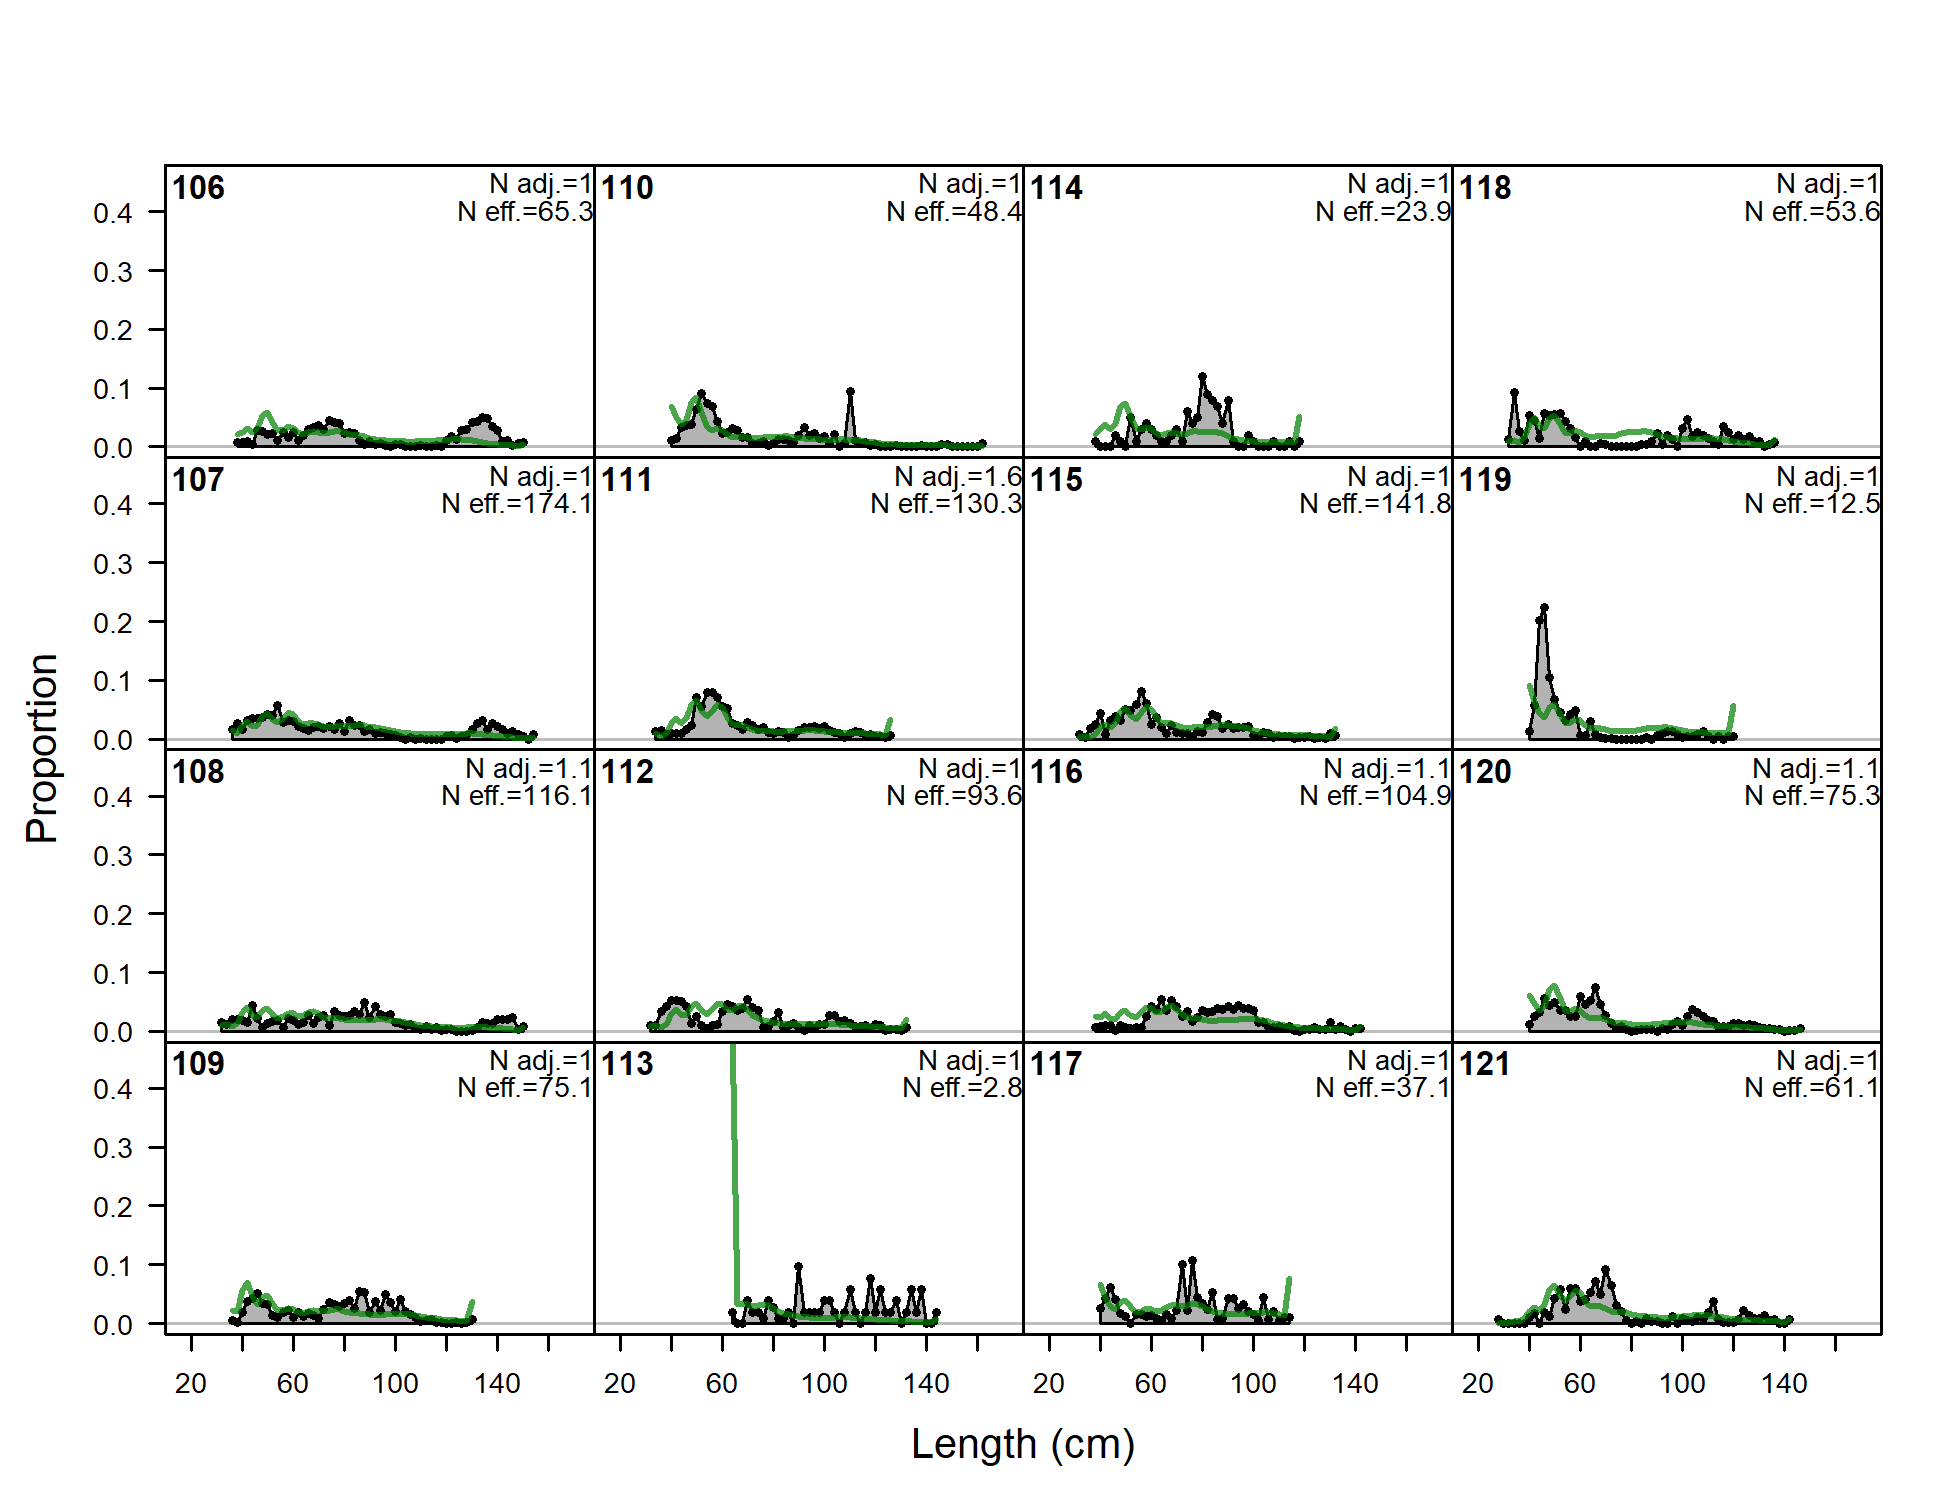
Length comps, whole catch, F4-OBJ_I (plot 3 of 3)
file: comp_lenfit_flt4mkt0_page3.png
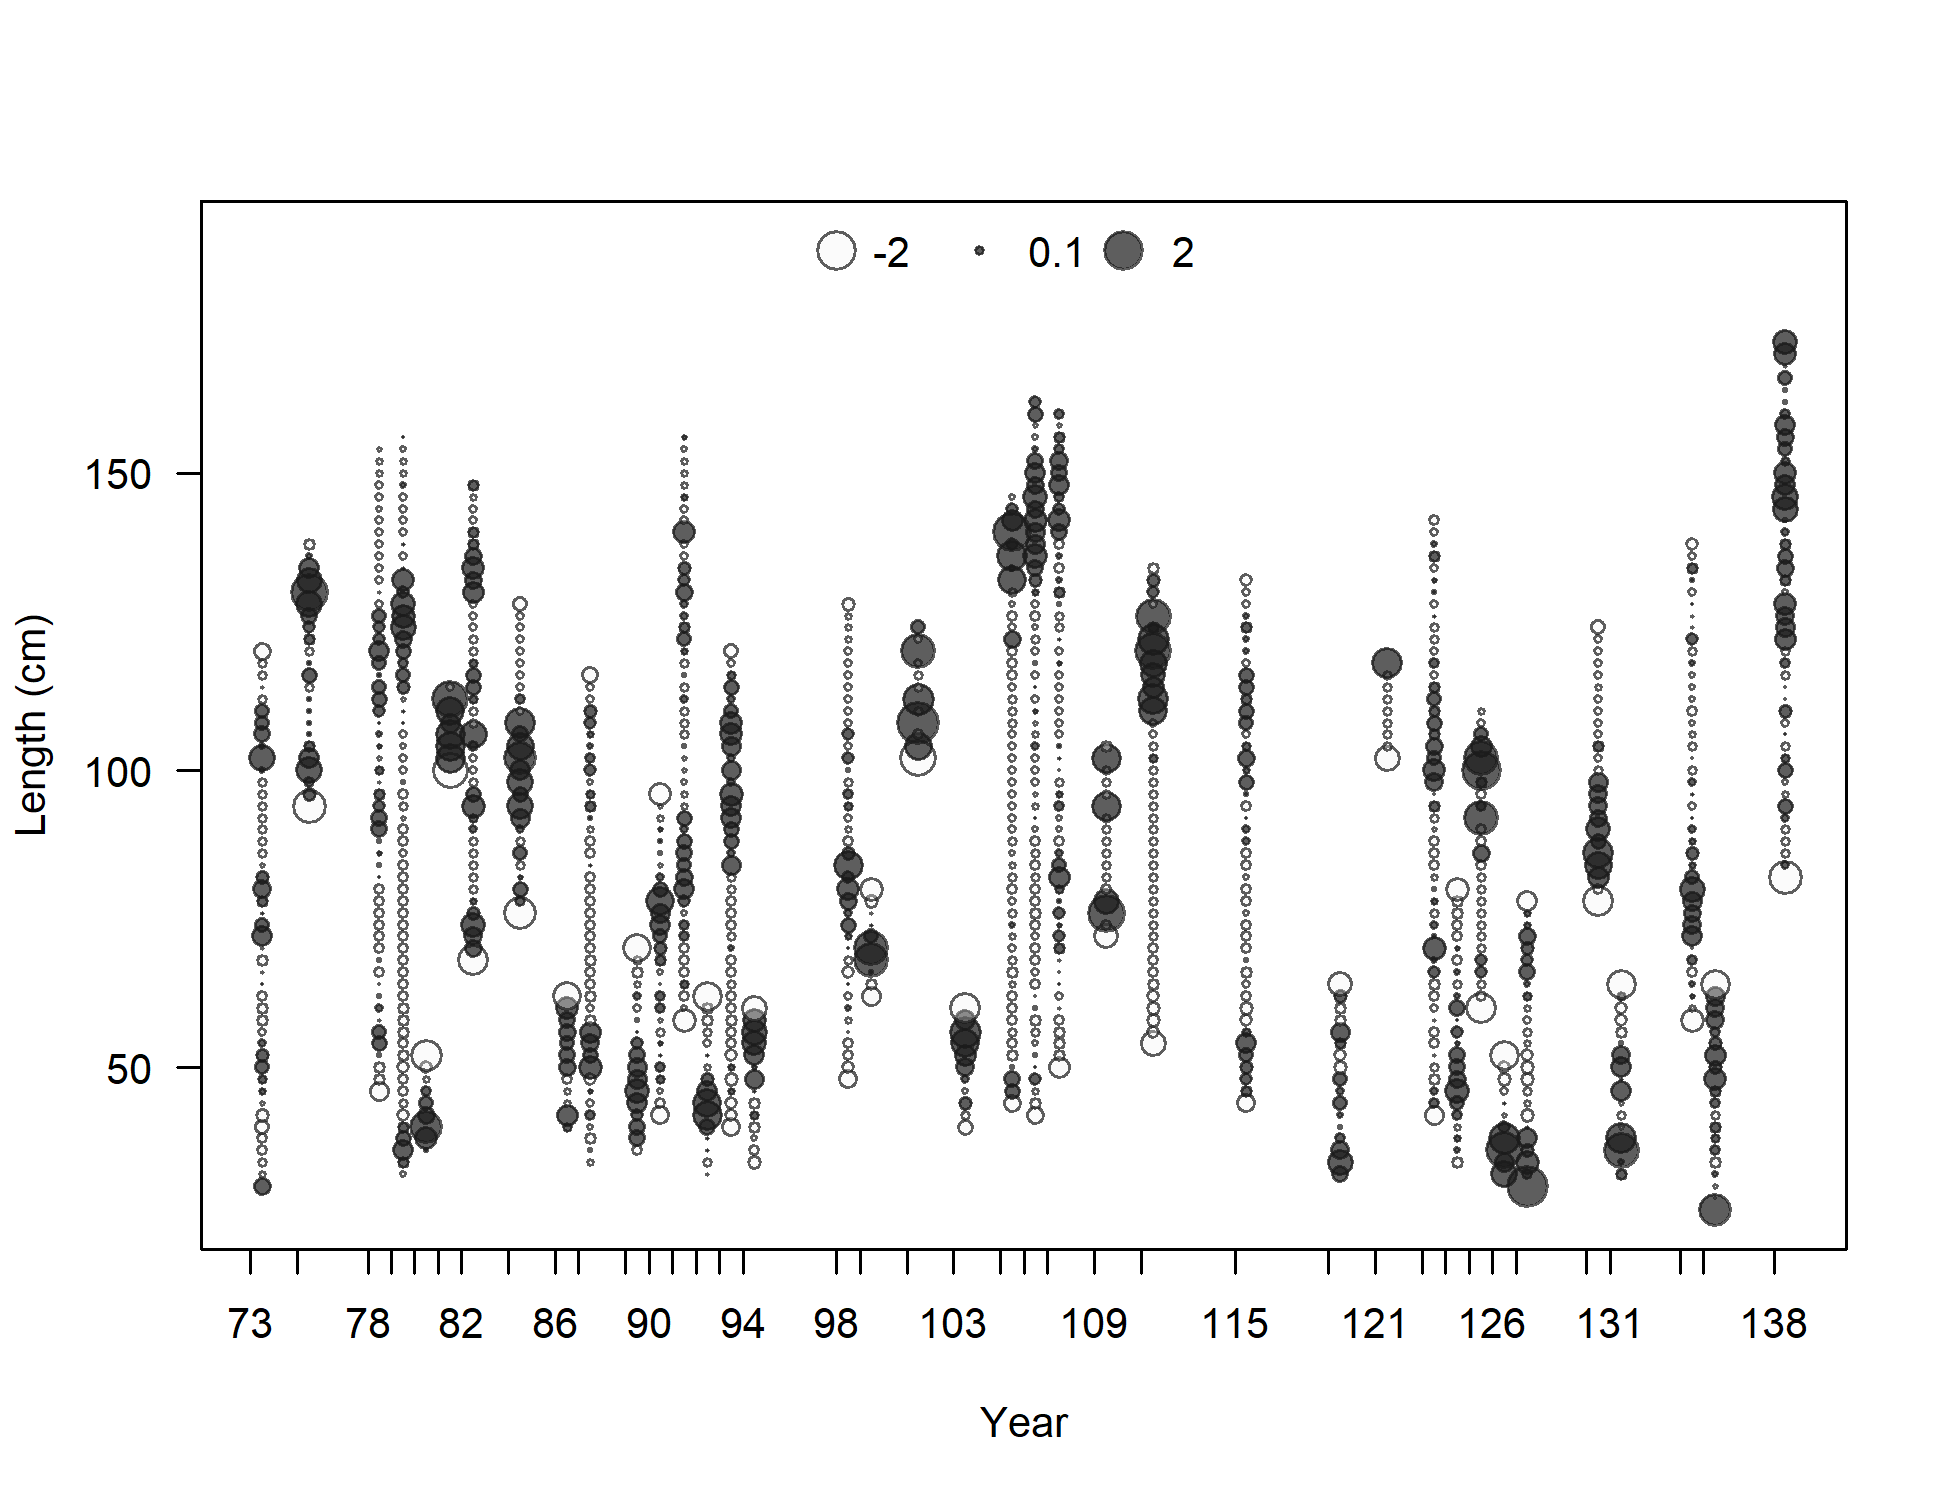
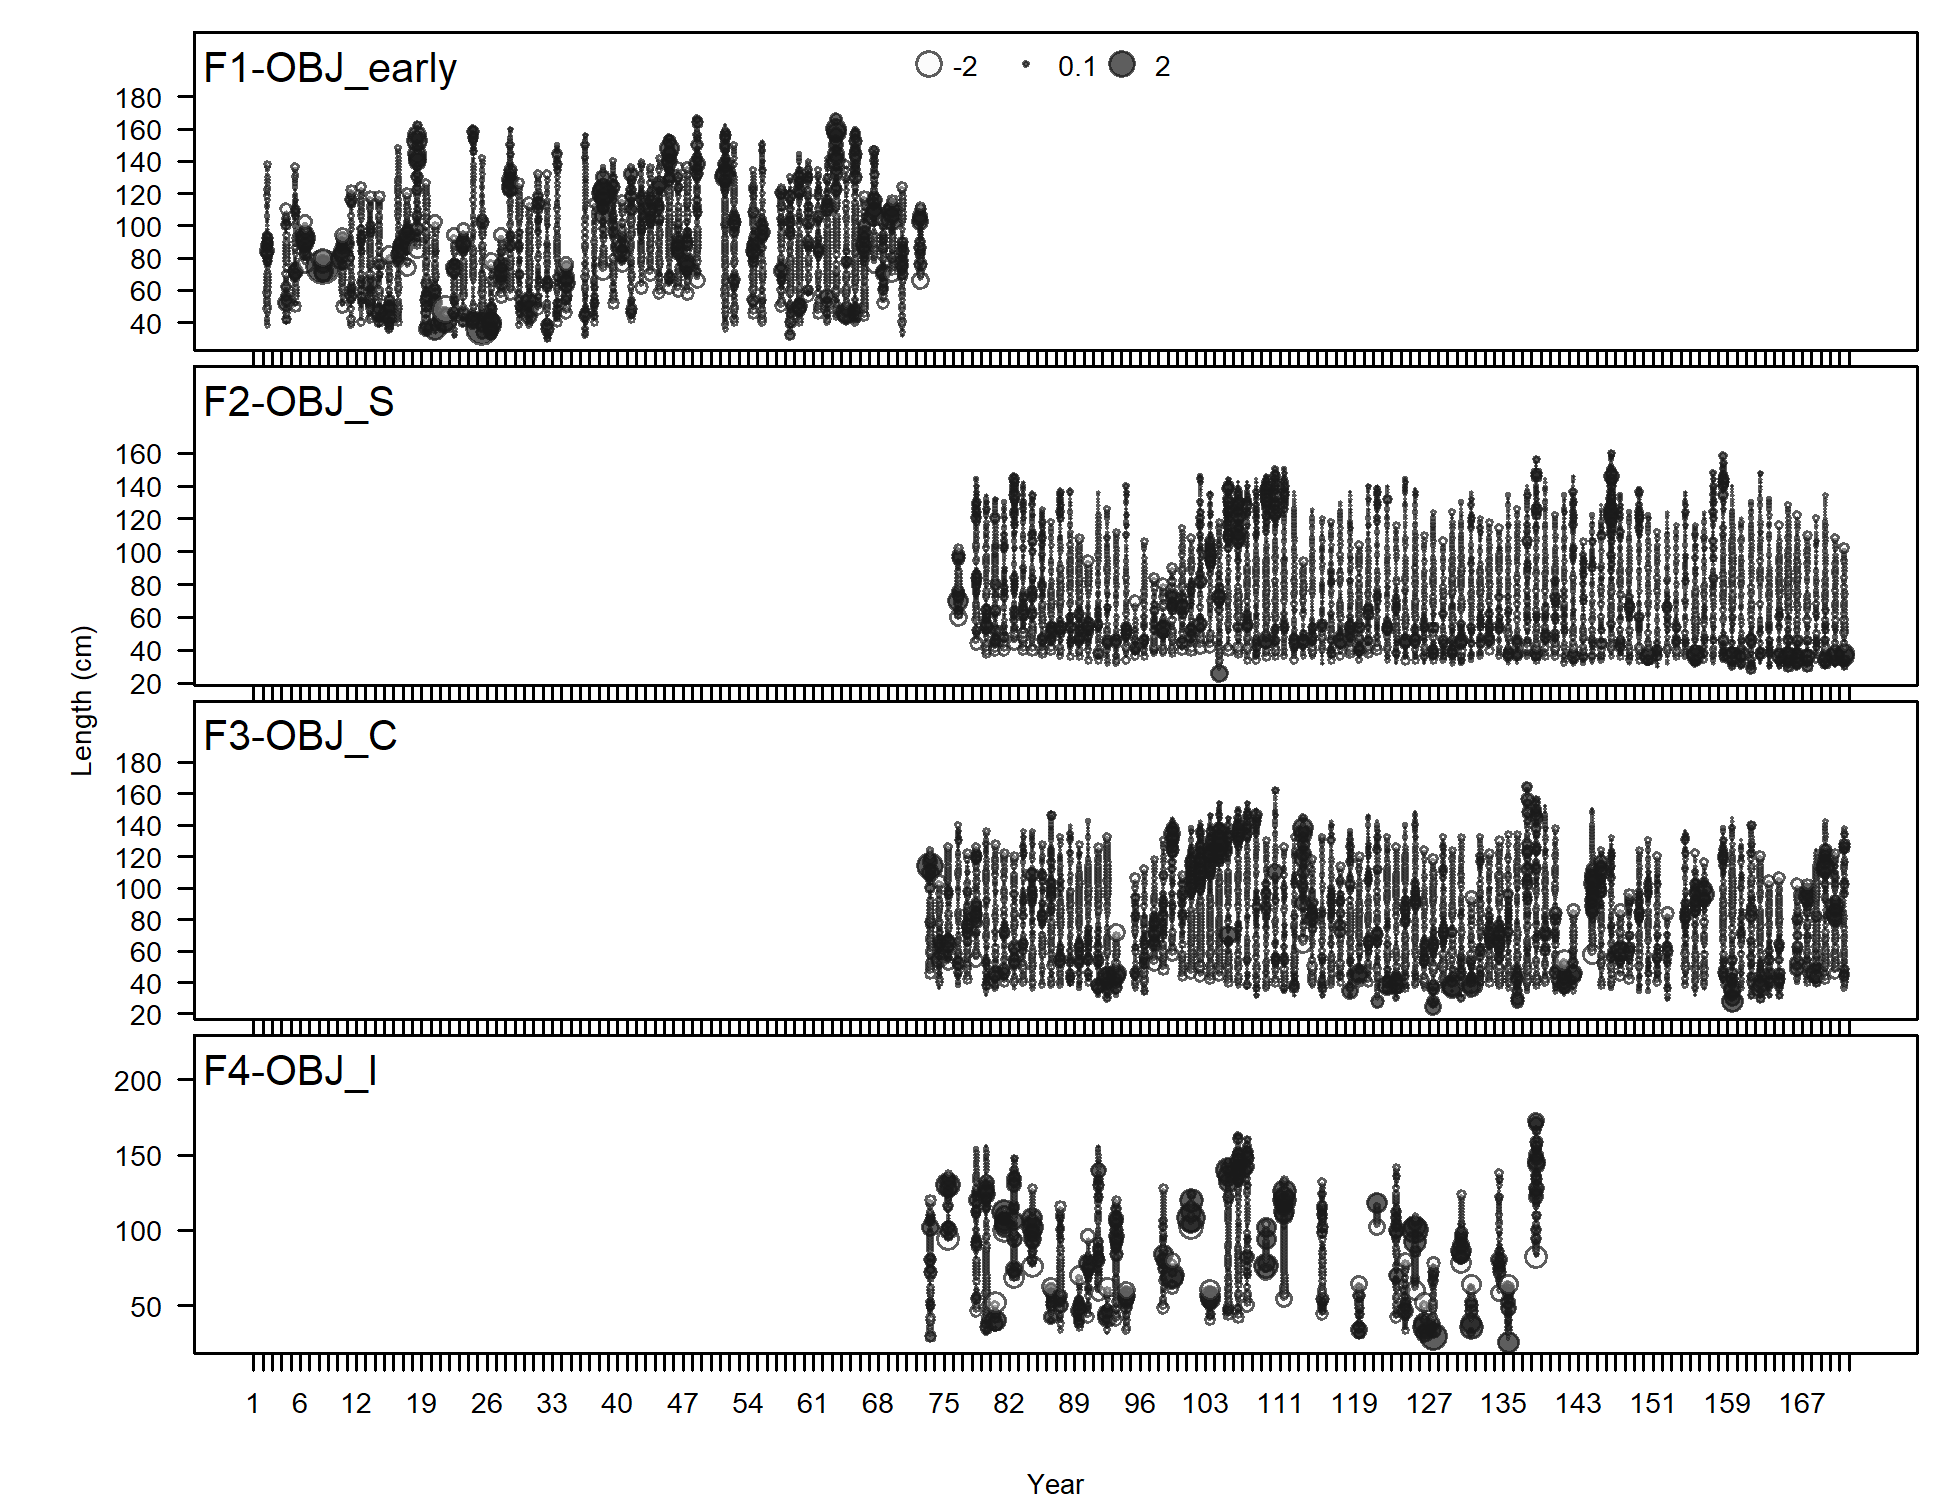
Pearson residuals, whole catch, F4-OBJ_I (max=2.33) (plot 3 of 3)
Closed bubbles are positive residuals (observed > expected) and open bubbles are negative residuals (observed < expected).
file: comp_lenfit_residsflt4mkt0_page3.png
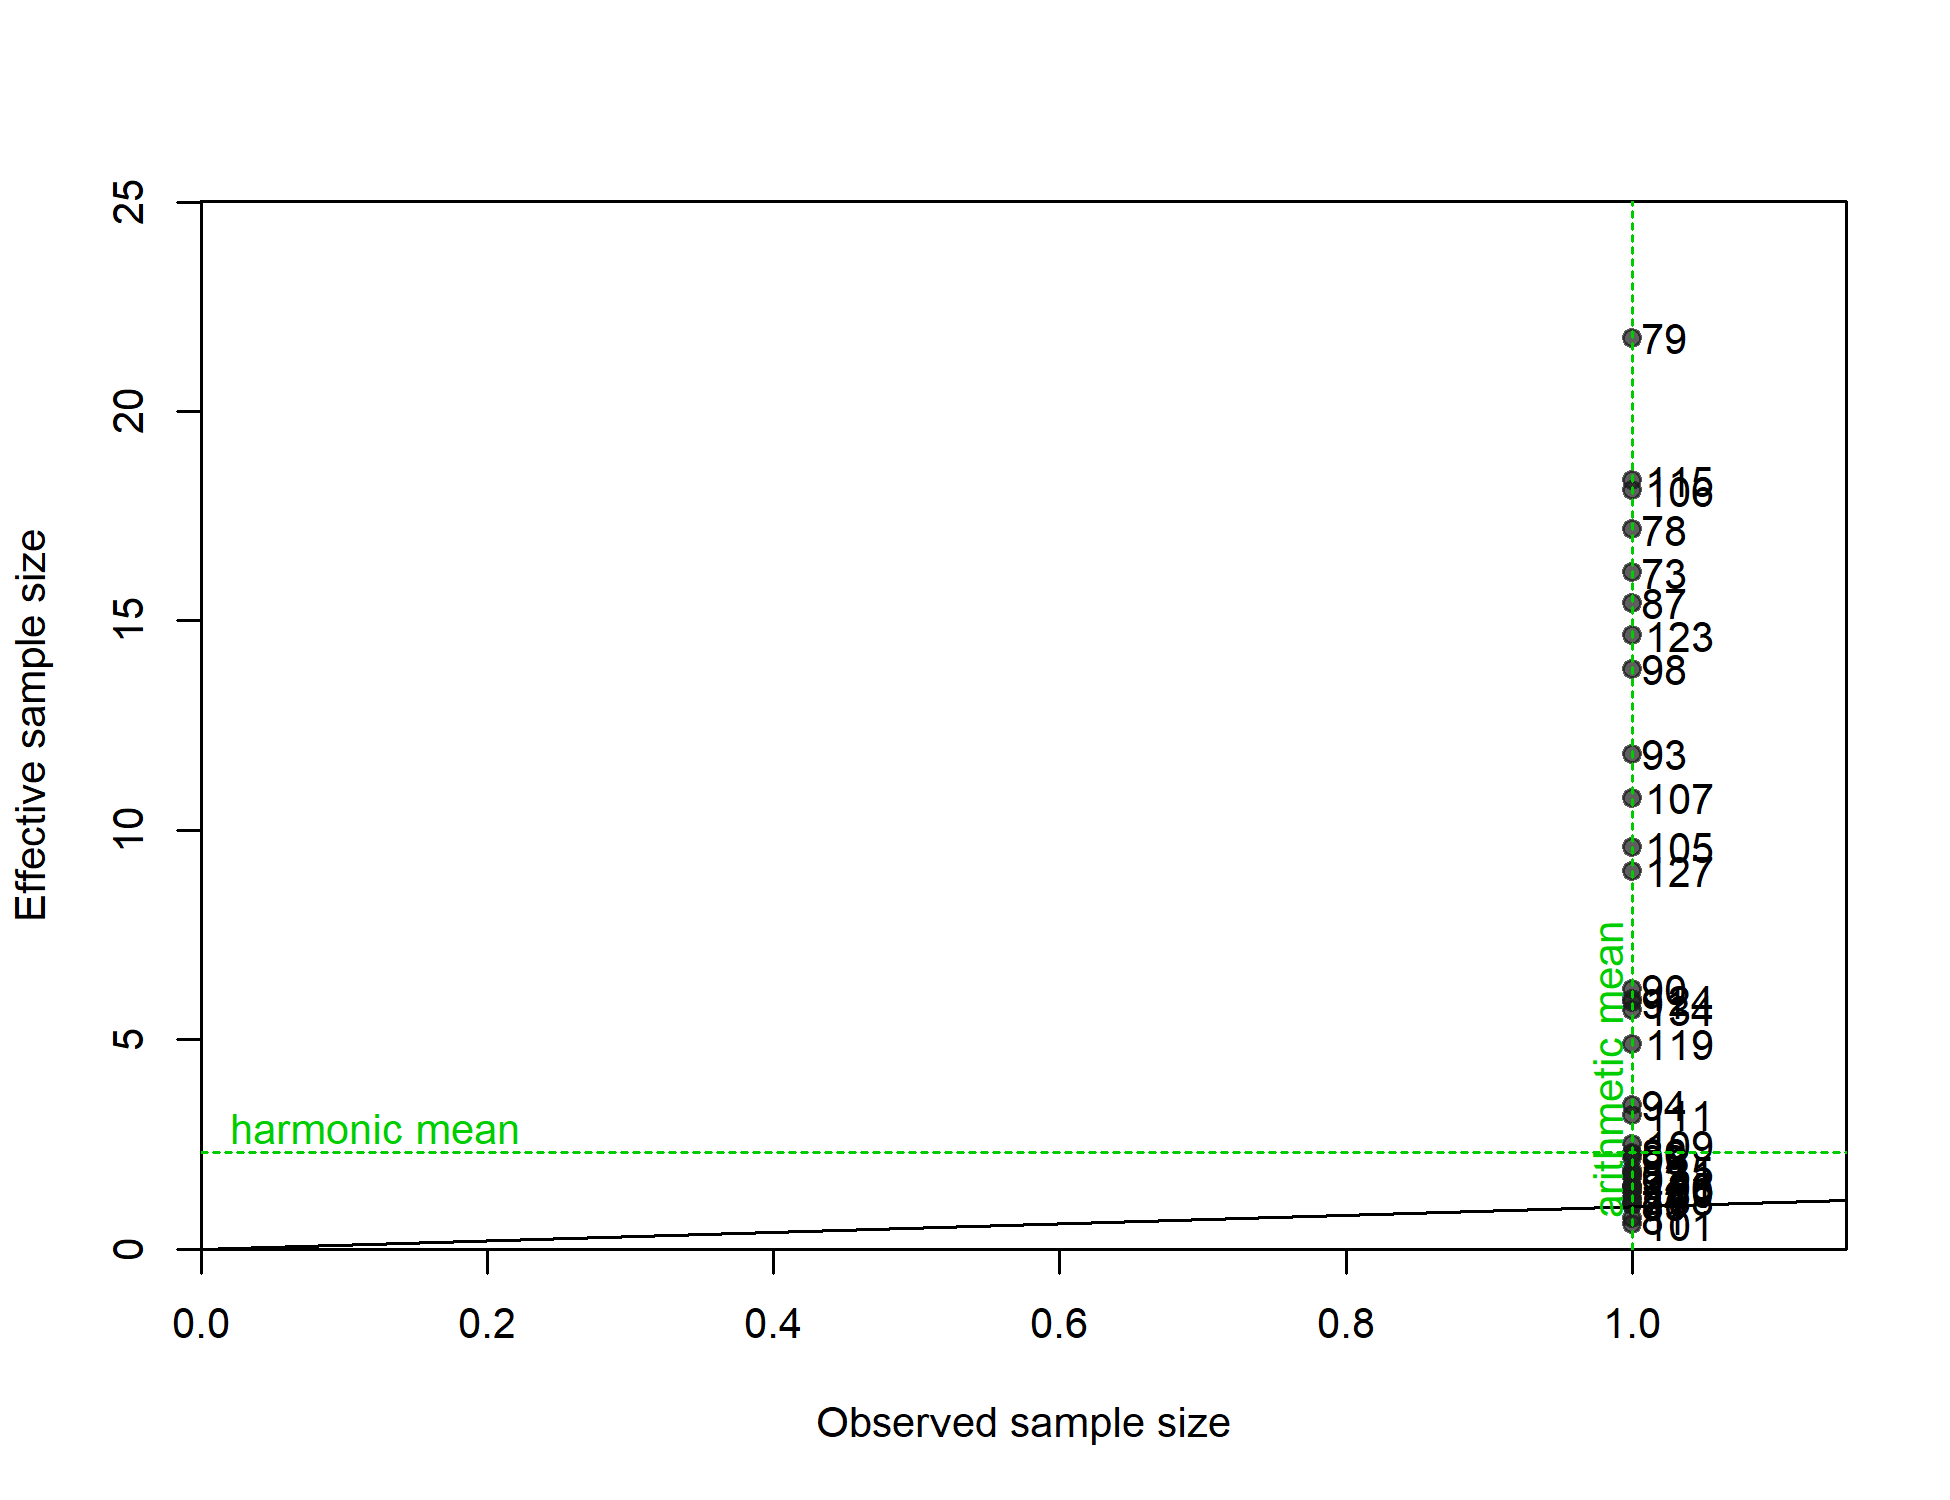
N-EffN comparison, Length comps, whole catch, F4-OBJ_I
file: comp_lenfit_sampsize_flt4mkt0.png
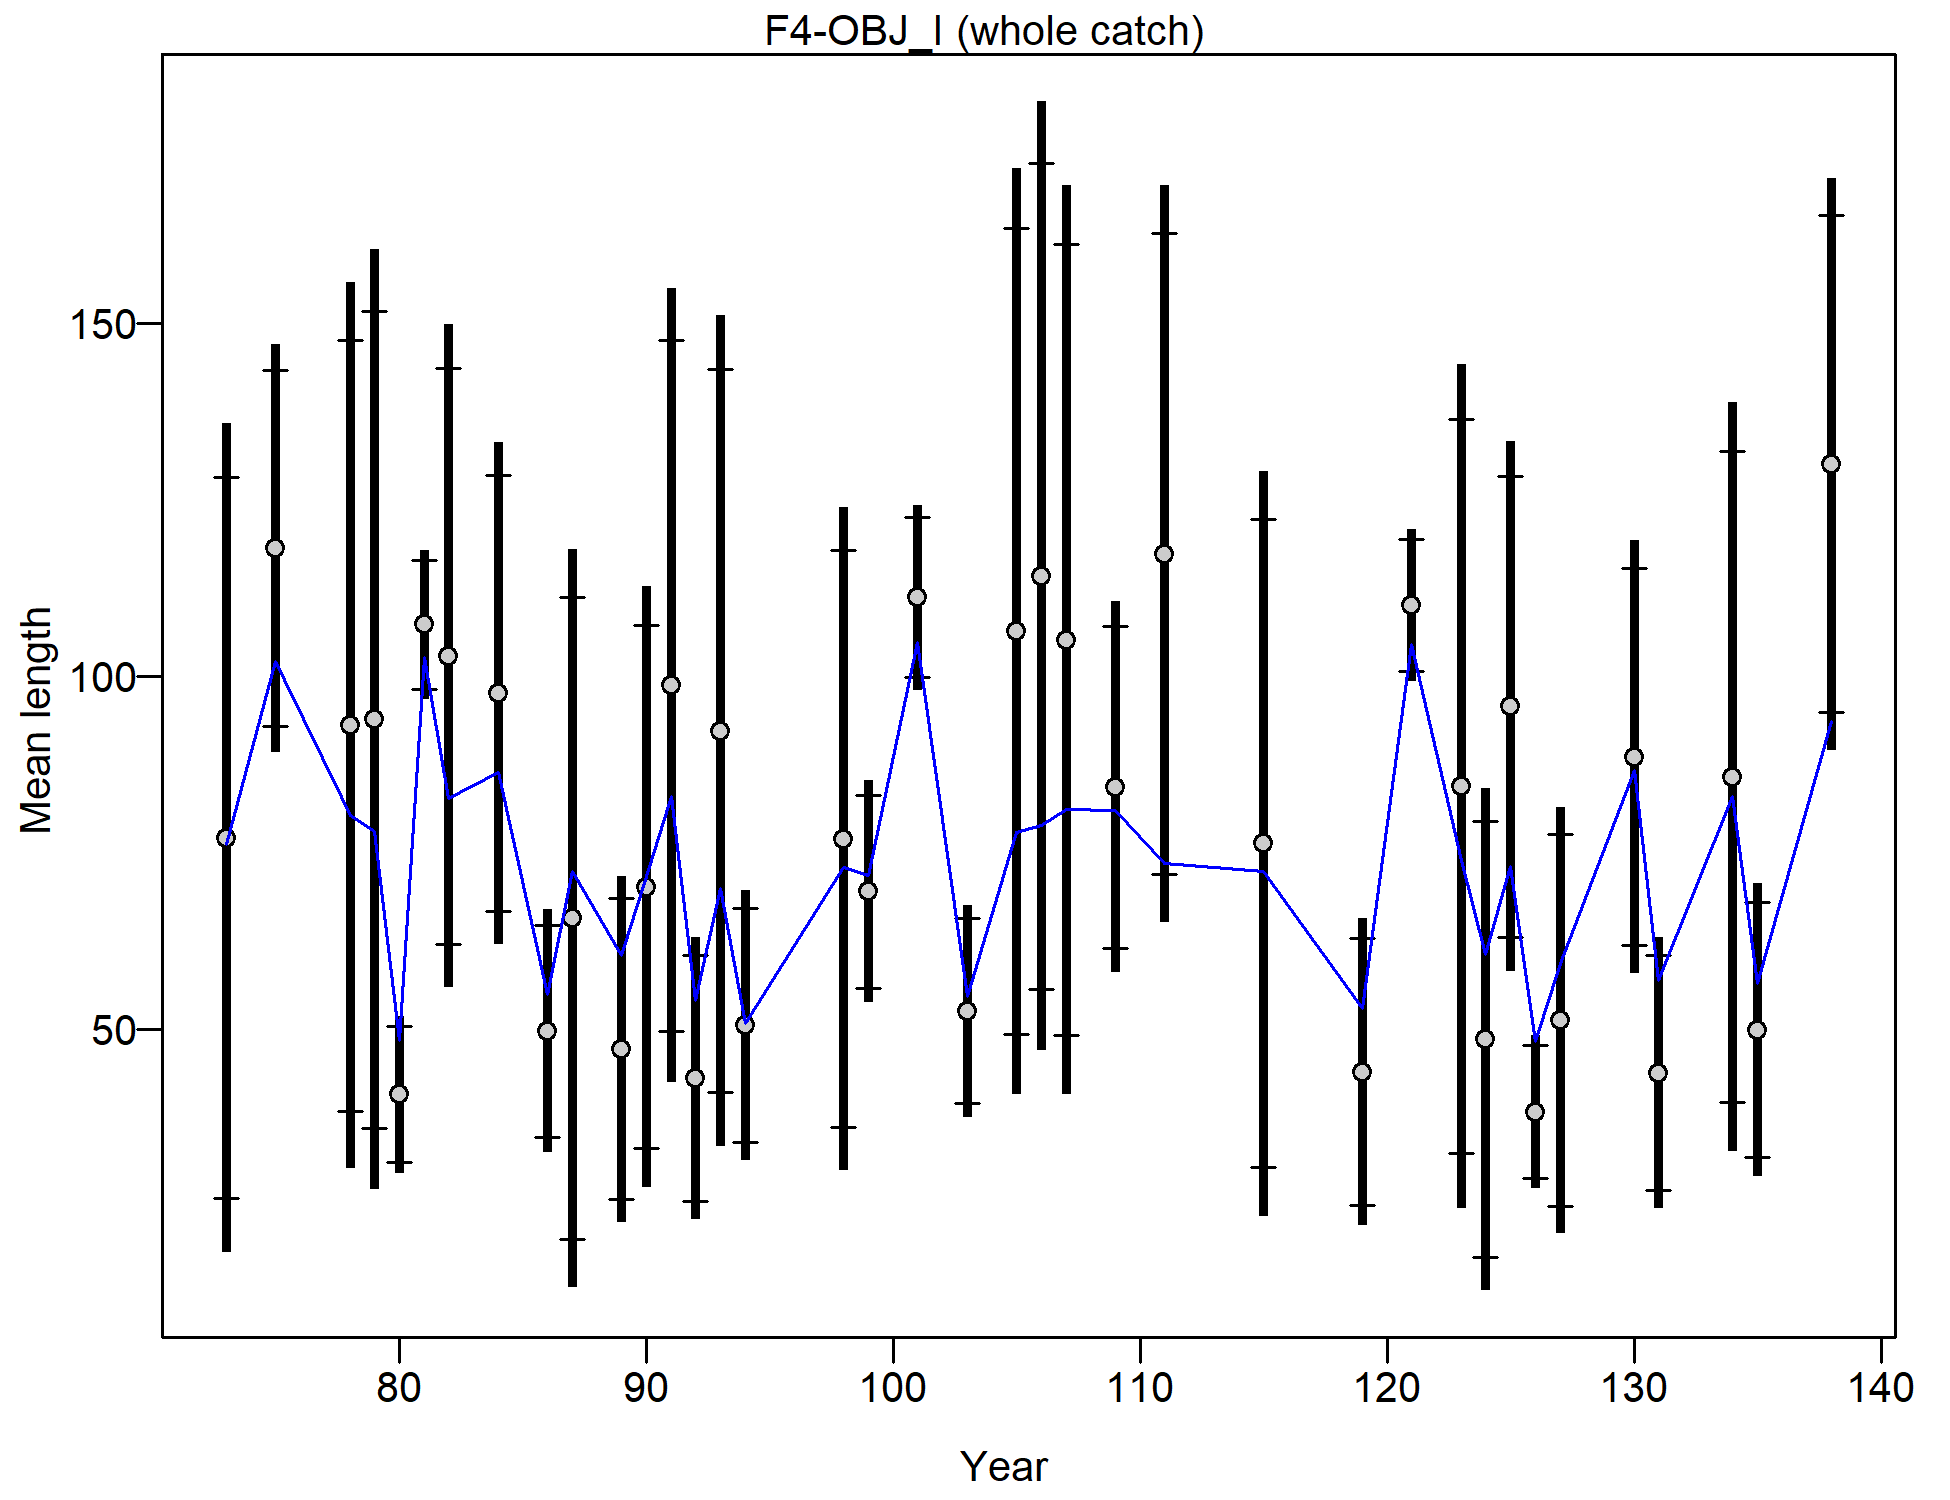
Mean length for F4-OBJ_I with 95% confidence intervals based on current samples sizes.
Francis data weighting method TA1.8: thinner intervals (with capped ends) show result of further adjusting sample sizes based on suggested multiplier (with 95% interval) for len data from F4-OBJ_I:
1.3218 (0.9669-2.1617)
For more info, see
Francis, R.I.C.C. (2011). Data weighting in statistical fisheries stock assessment models. Can. J. Fish. Aquat. Sci. 68: 1124-1138. https://doi.org/10.1139/f2011-025
file: comp_lenfit_data_weighting_TA1.8_F4-OBJ_I.png
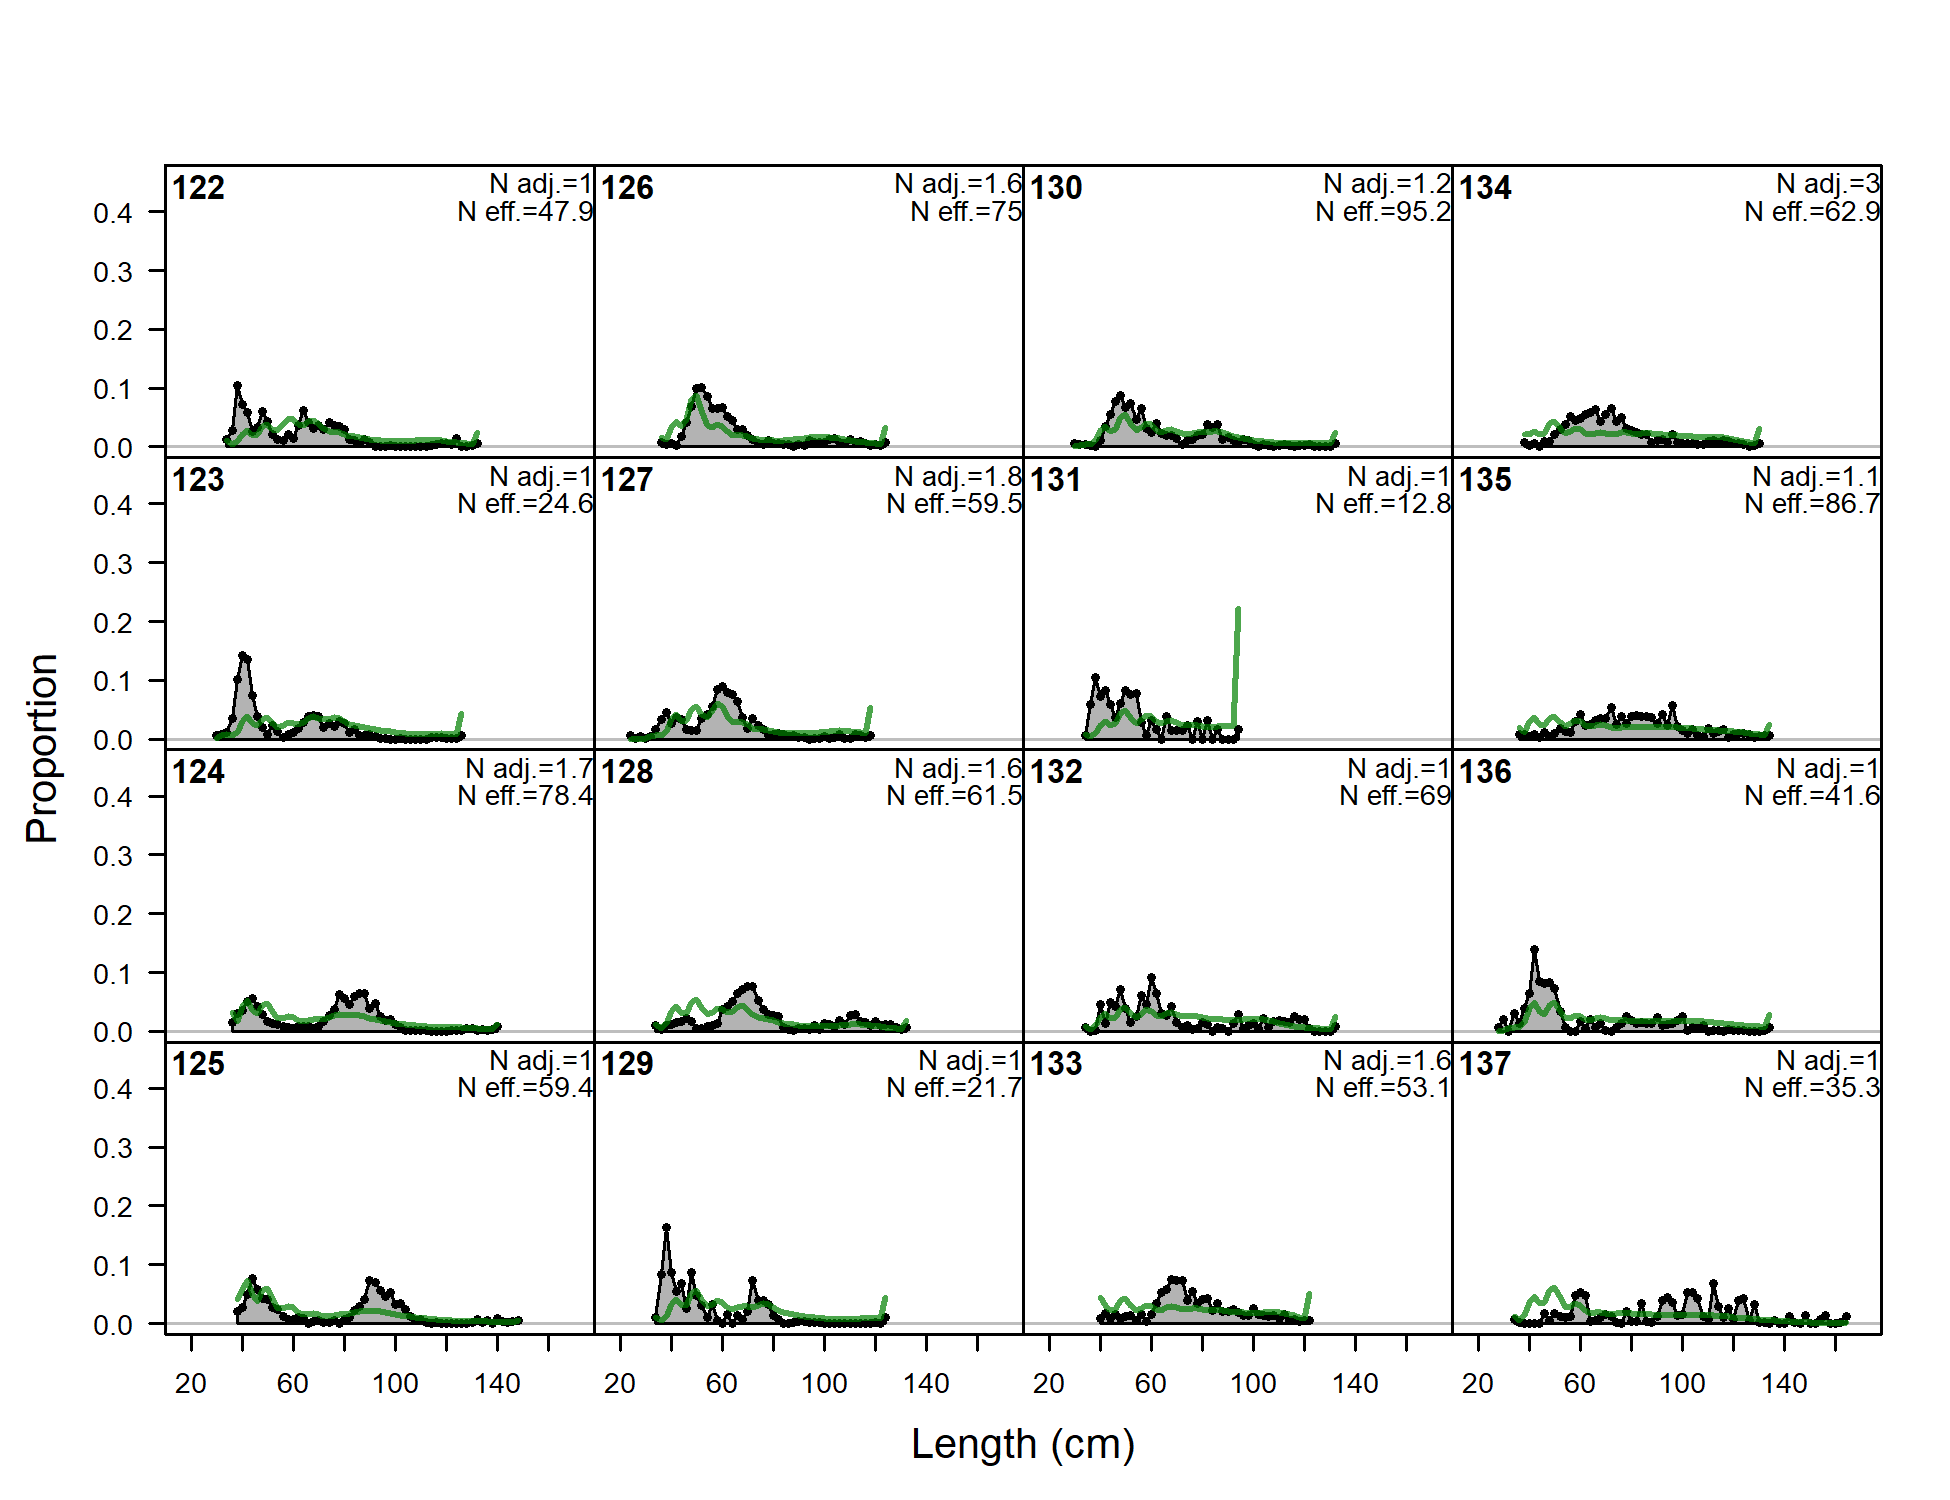
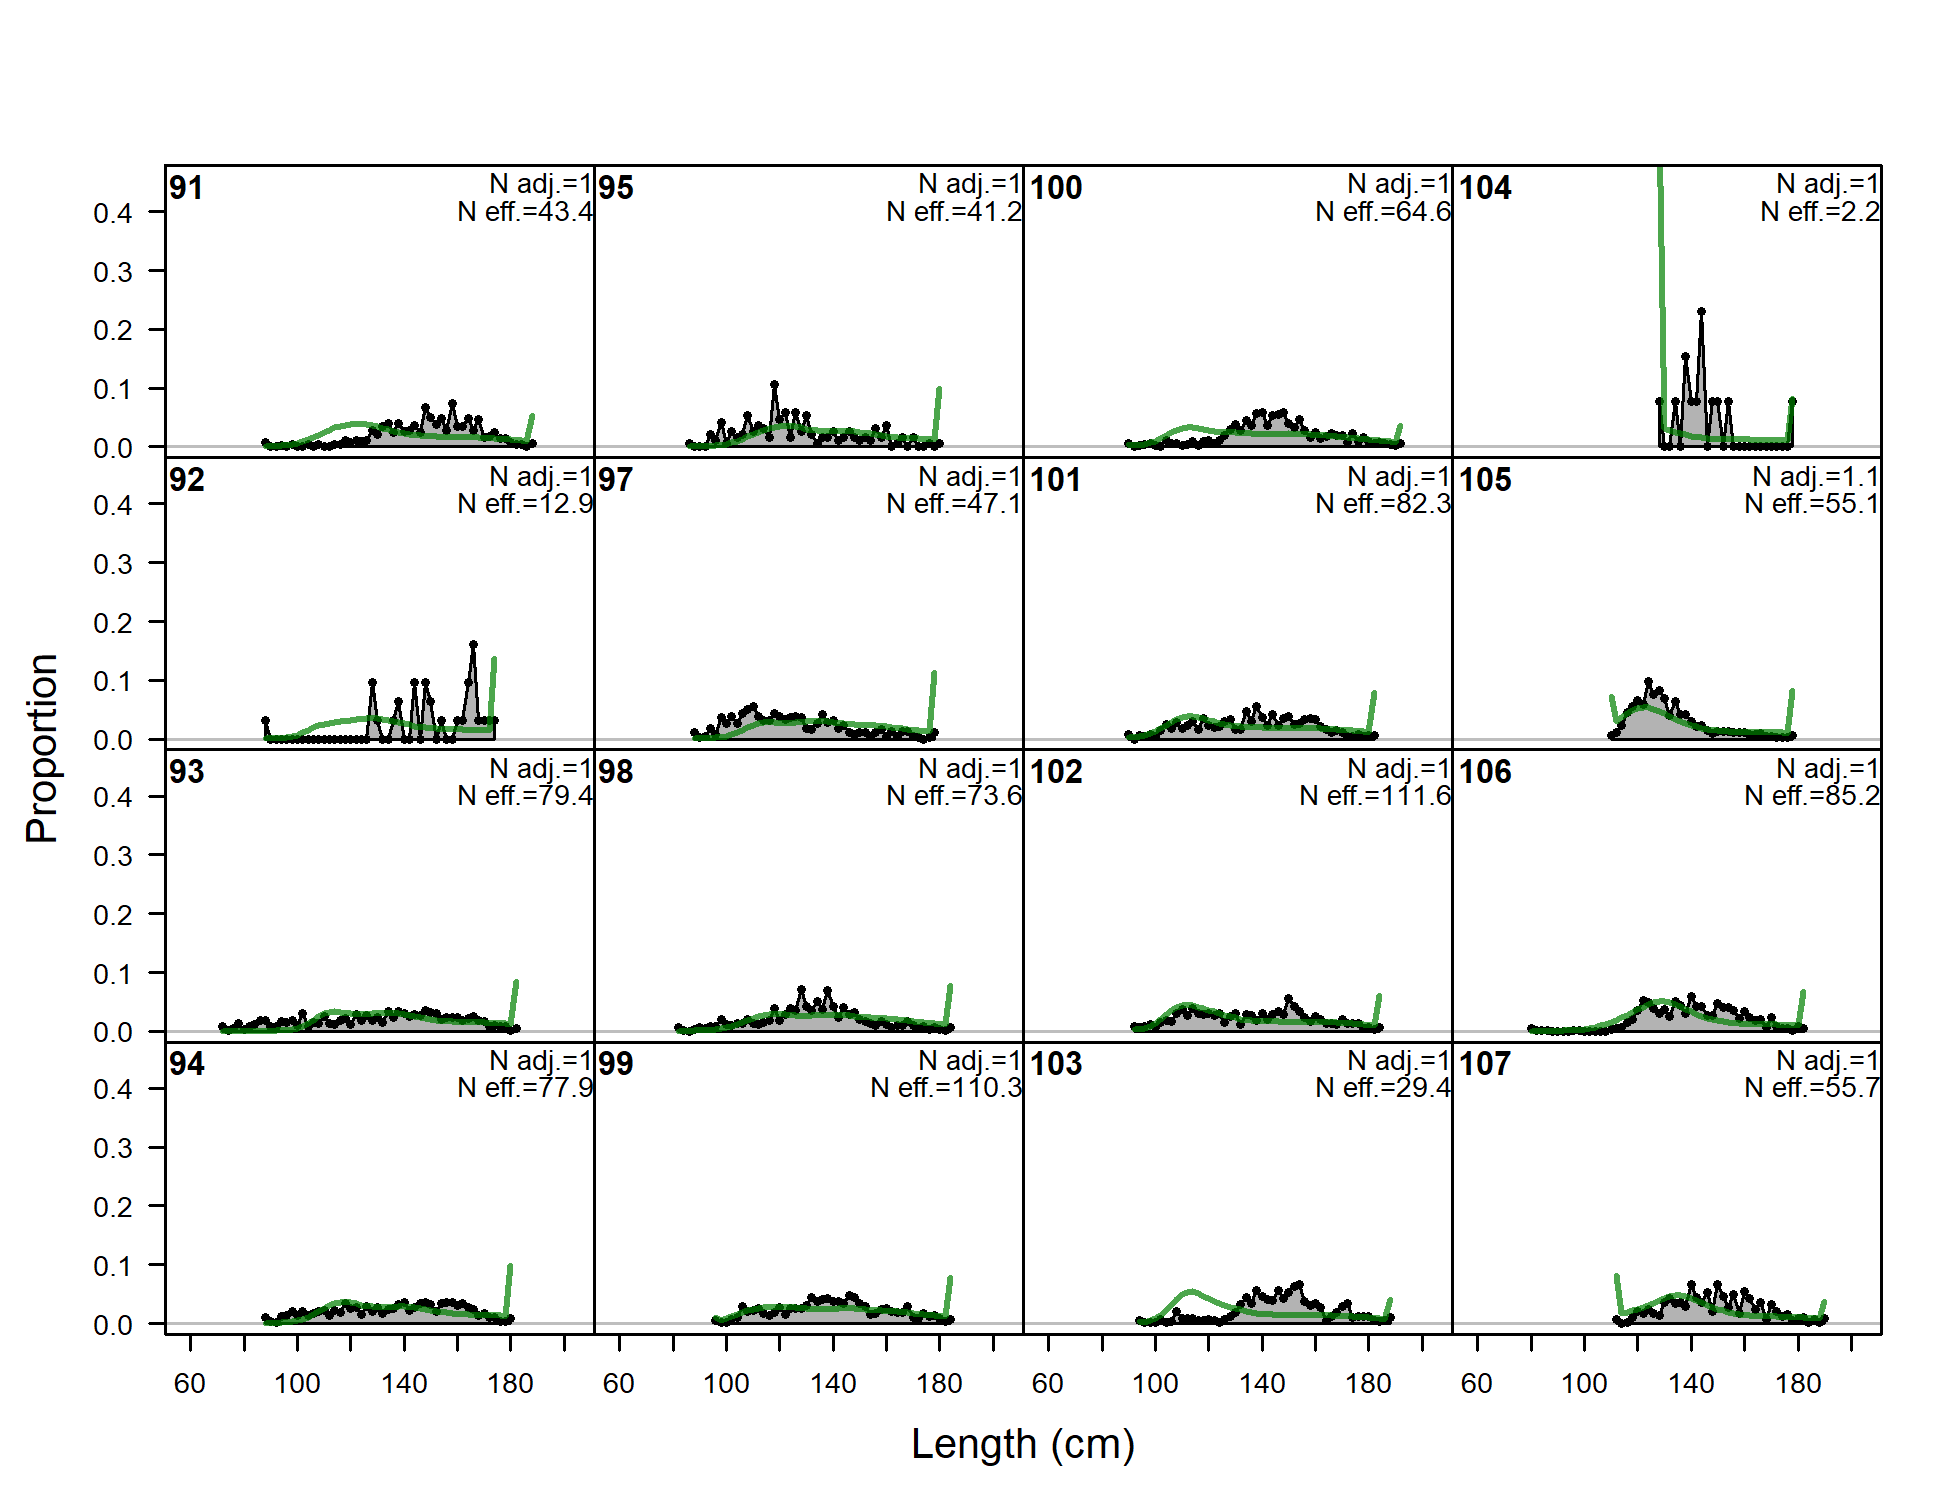
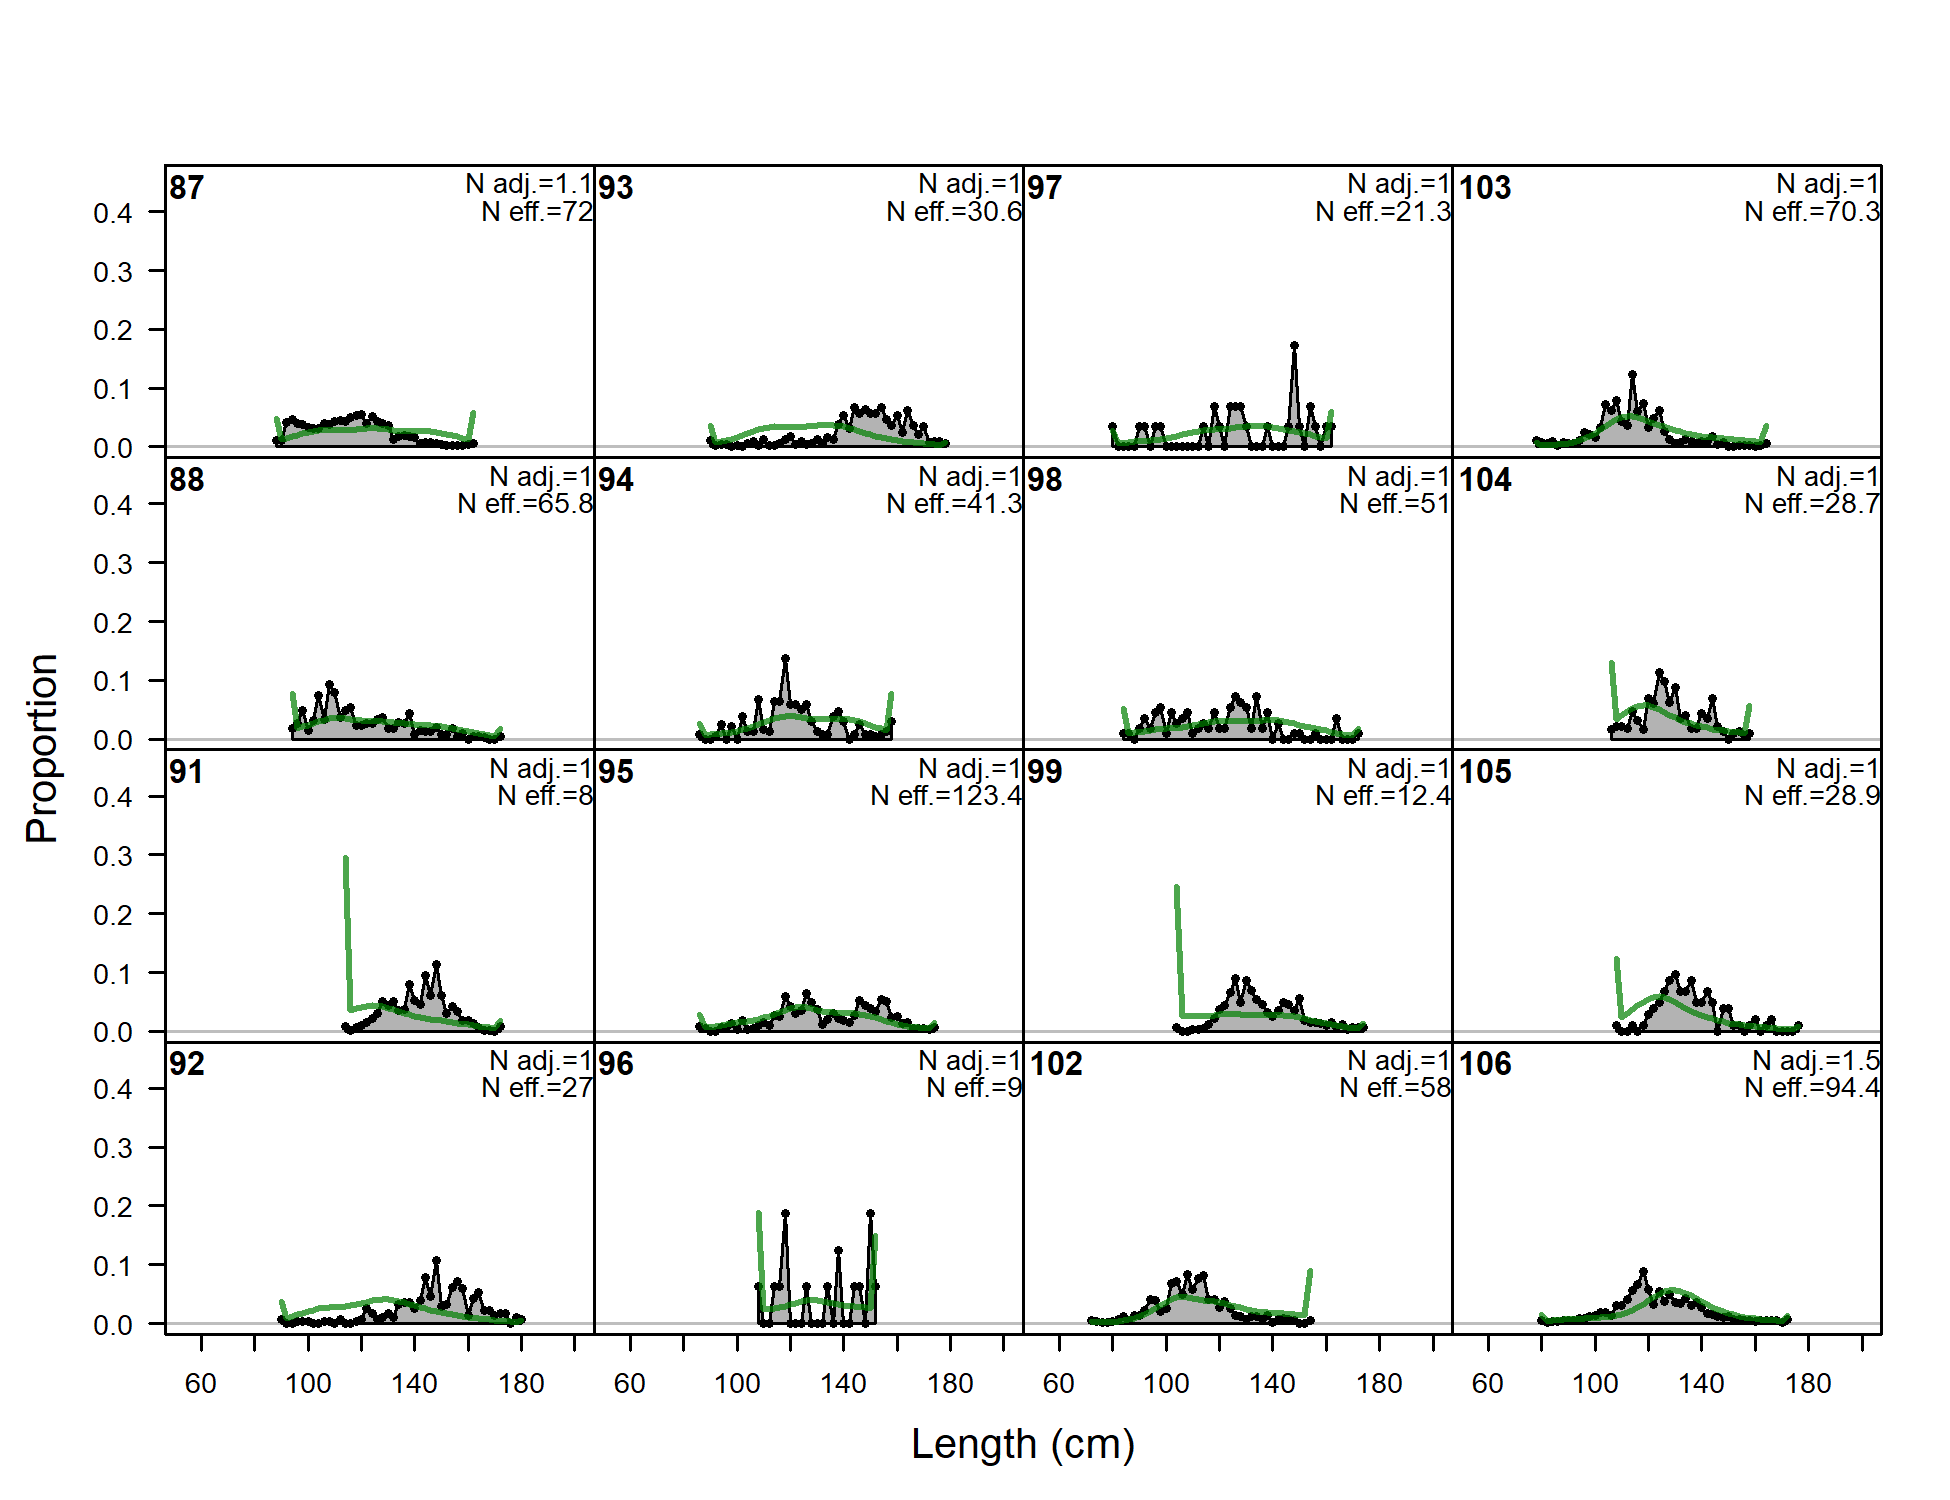
Length comps, whole catch, F5-OBJ_N (plot 1 of 6).
'N adj.' is the input sample size after data-weighting adjustment.N eff. is the calculated effective sample size used in the McAllister-Iannelli tuning method.
file: comp_lenfit_flt5mkt0_page1.png
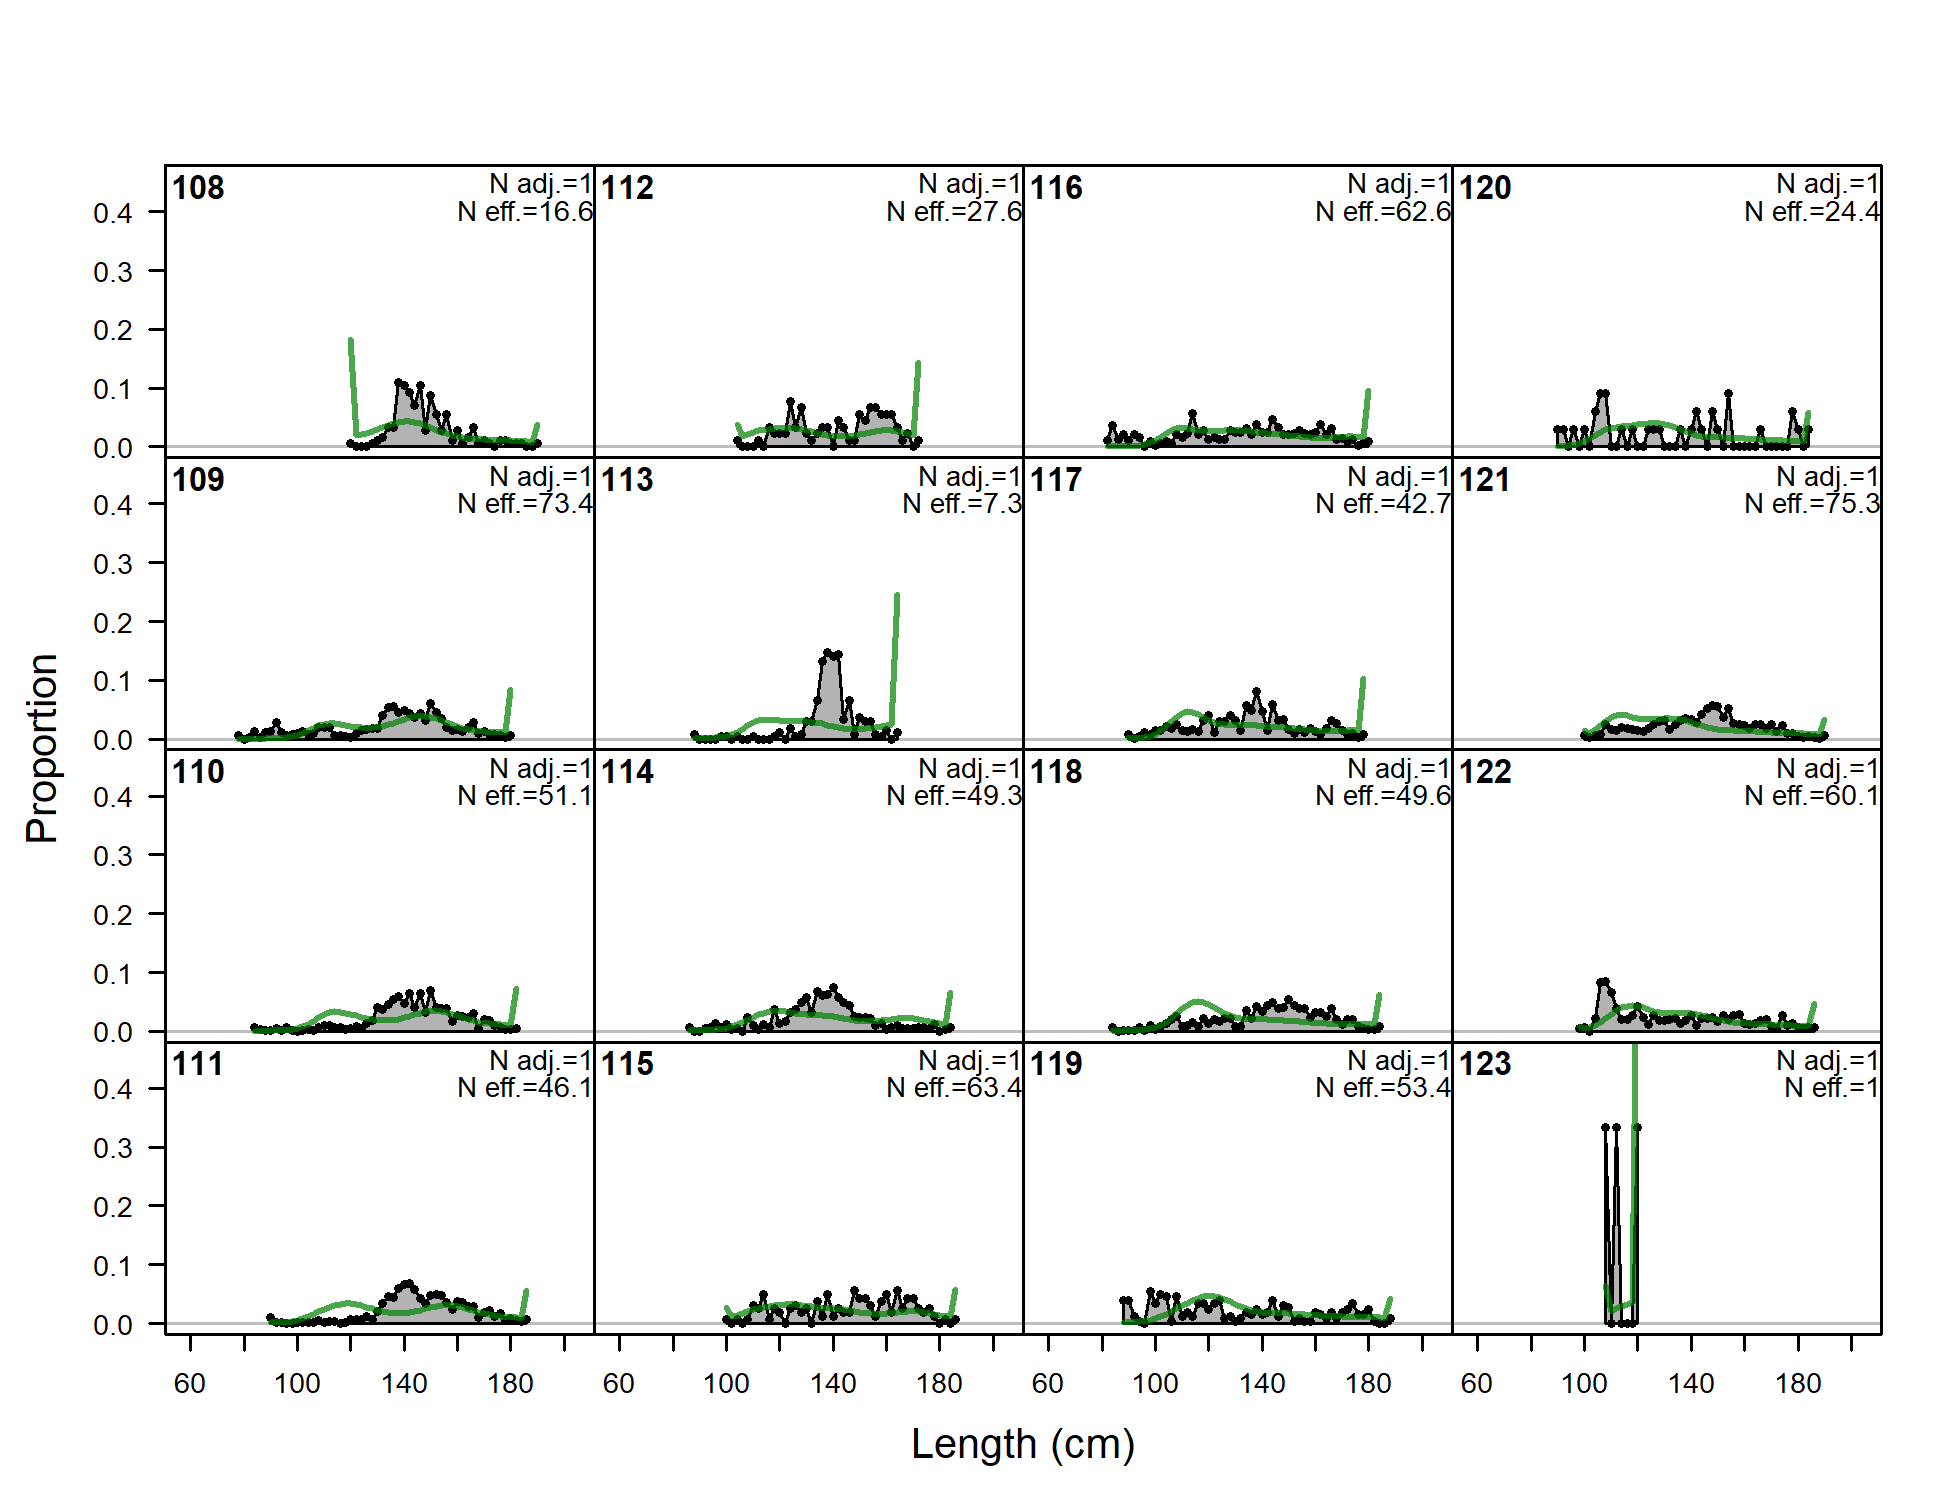
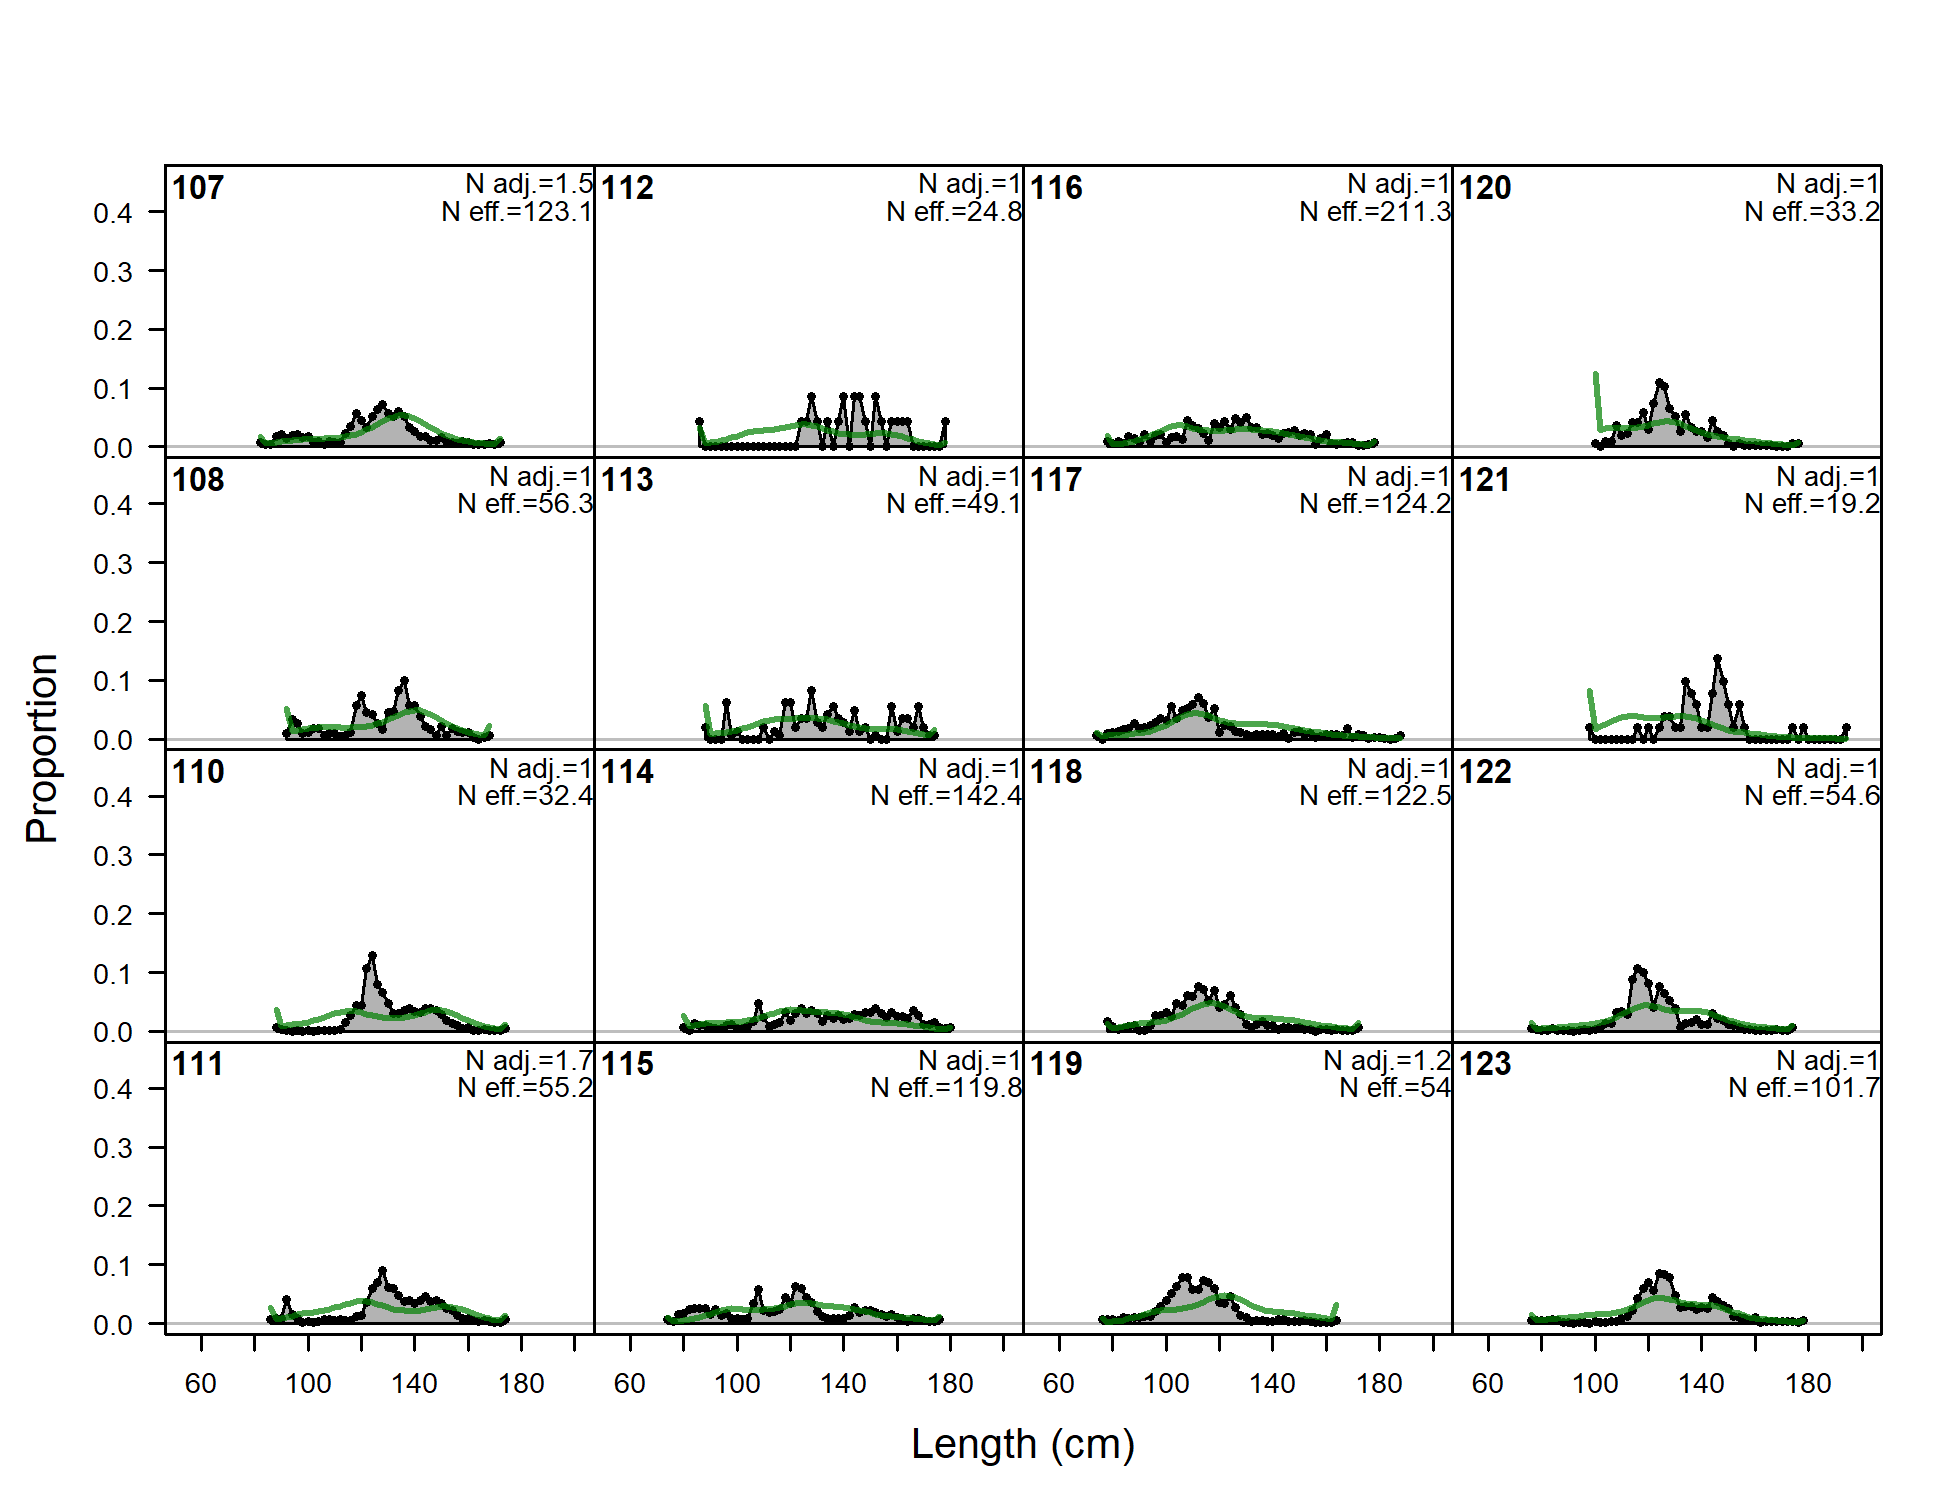
Length comps, whole catch, F5-OBJ_N (plot 2 of 6)
file: comp_lenfit_flt5mkt0_page2.png
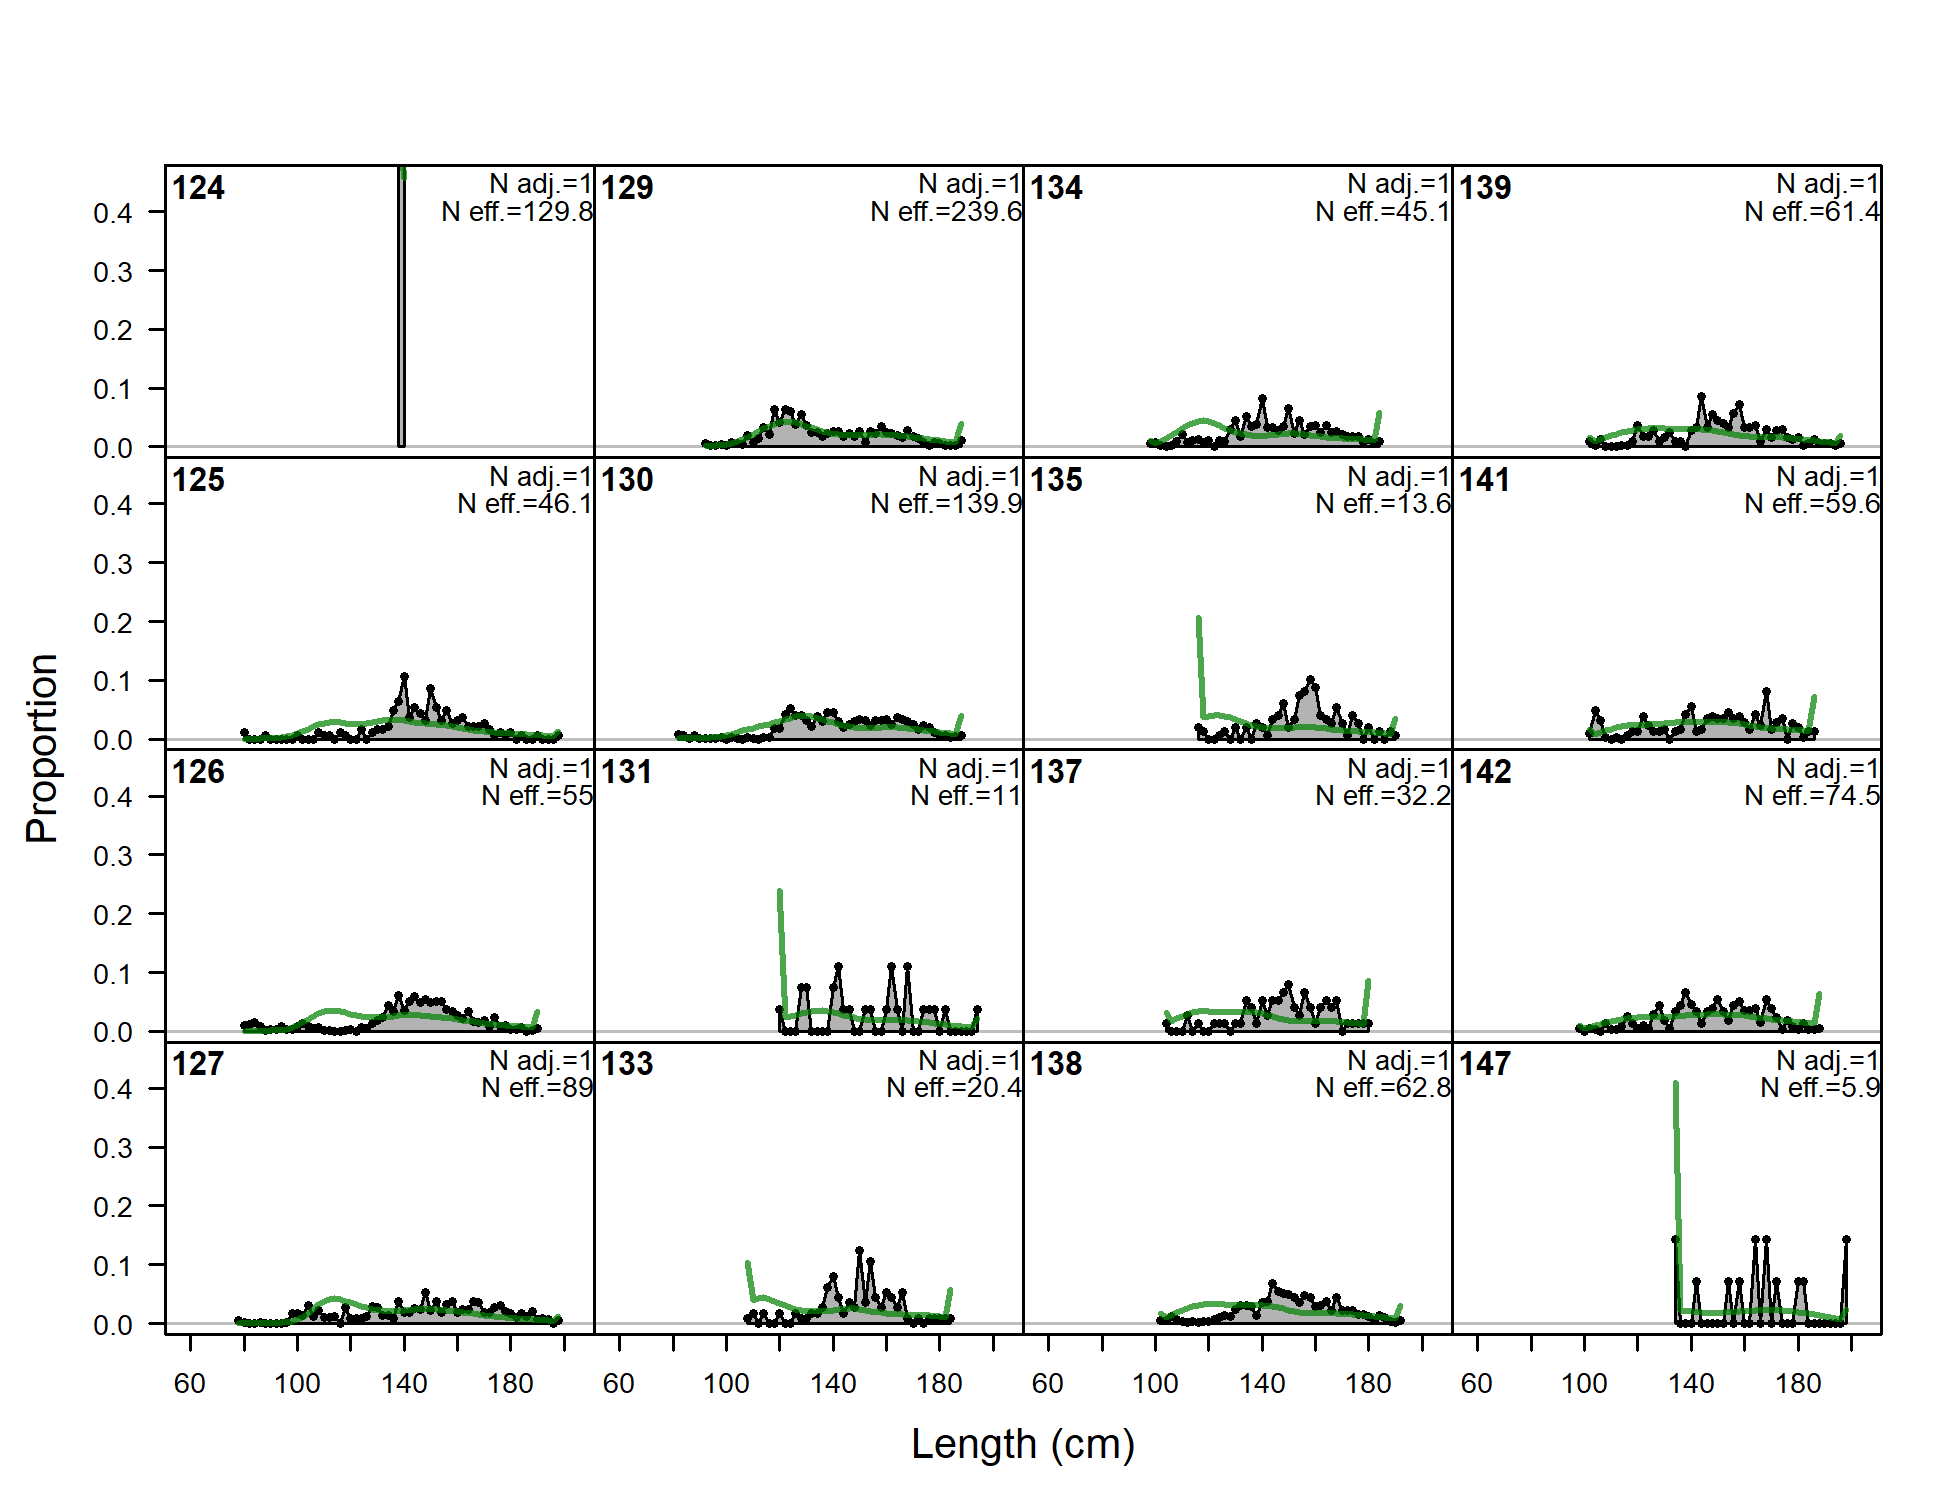
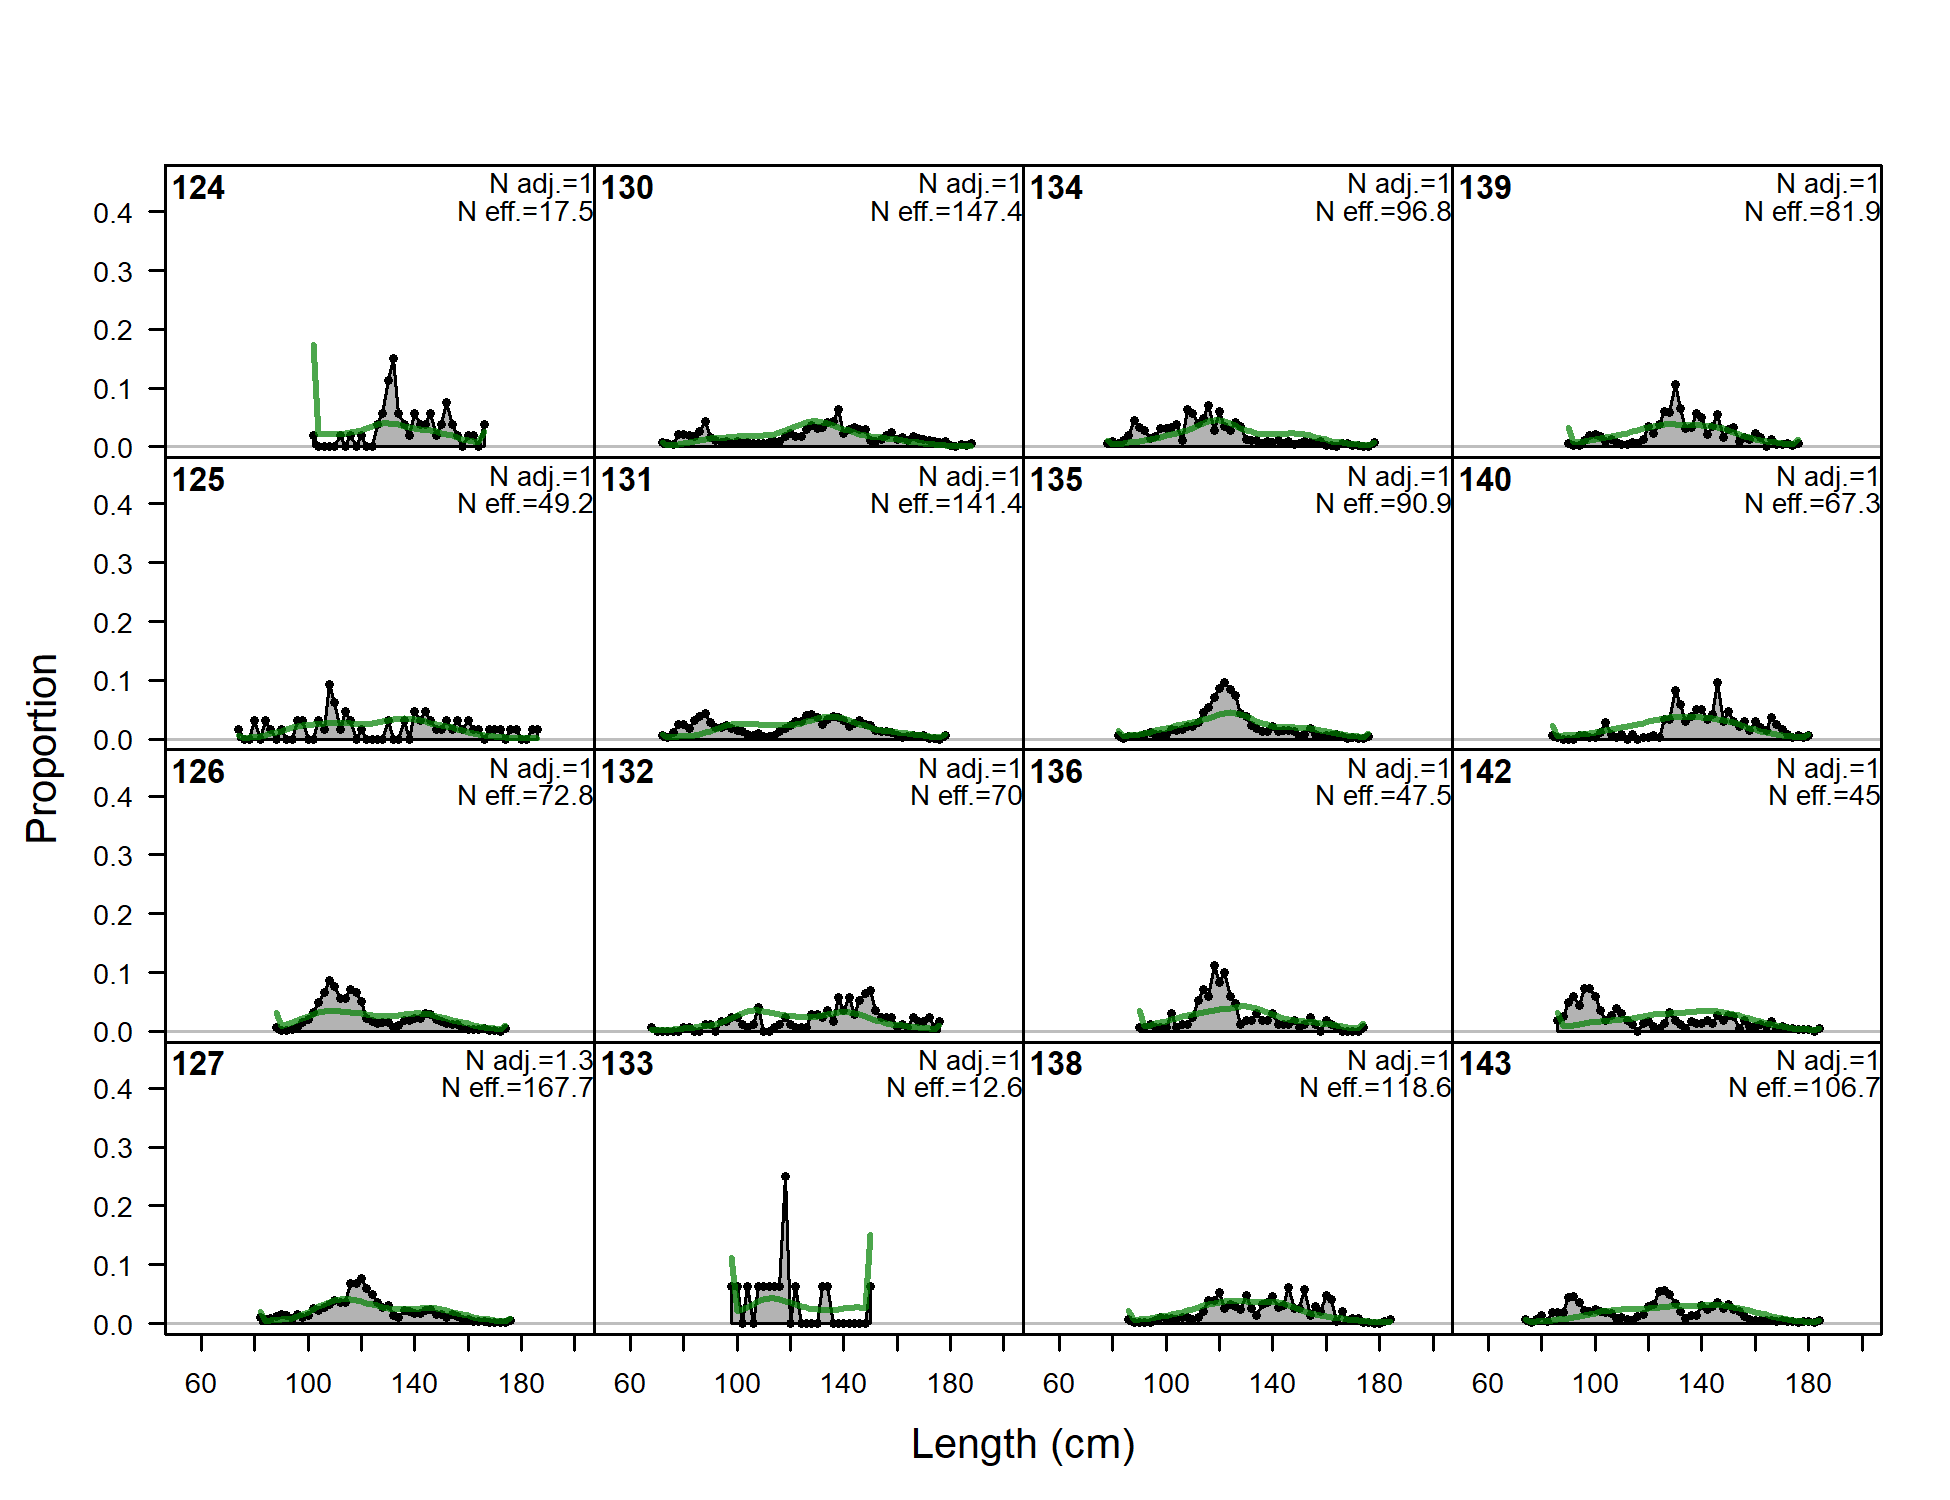
Length comps, whole catch, F5-OBJ_N (plot 3 of 6)
file: comp_lenfit_flt5mkt0_page3.png
Length comps, whole catch, F5-OBJ_N (plot 4 of 6)
file: comp_lenfit_flt5mkt0_page4.png
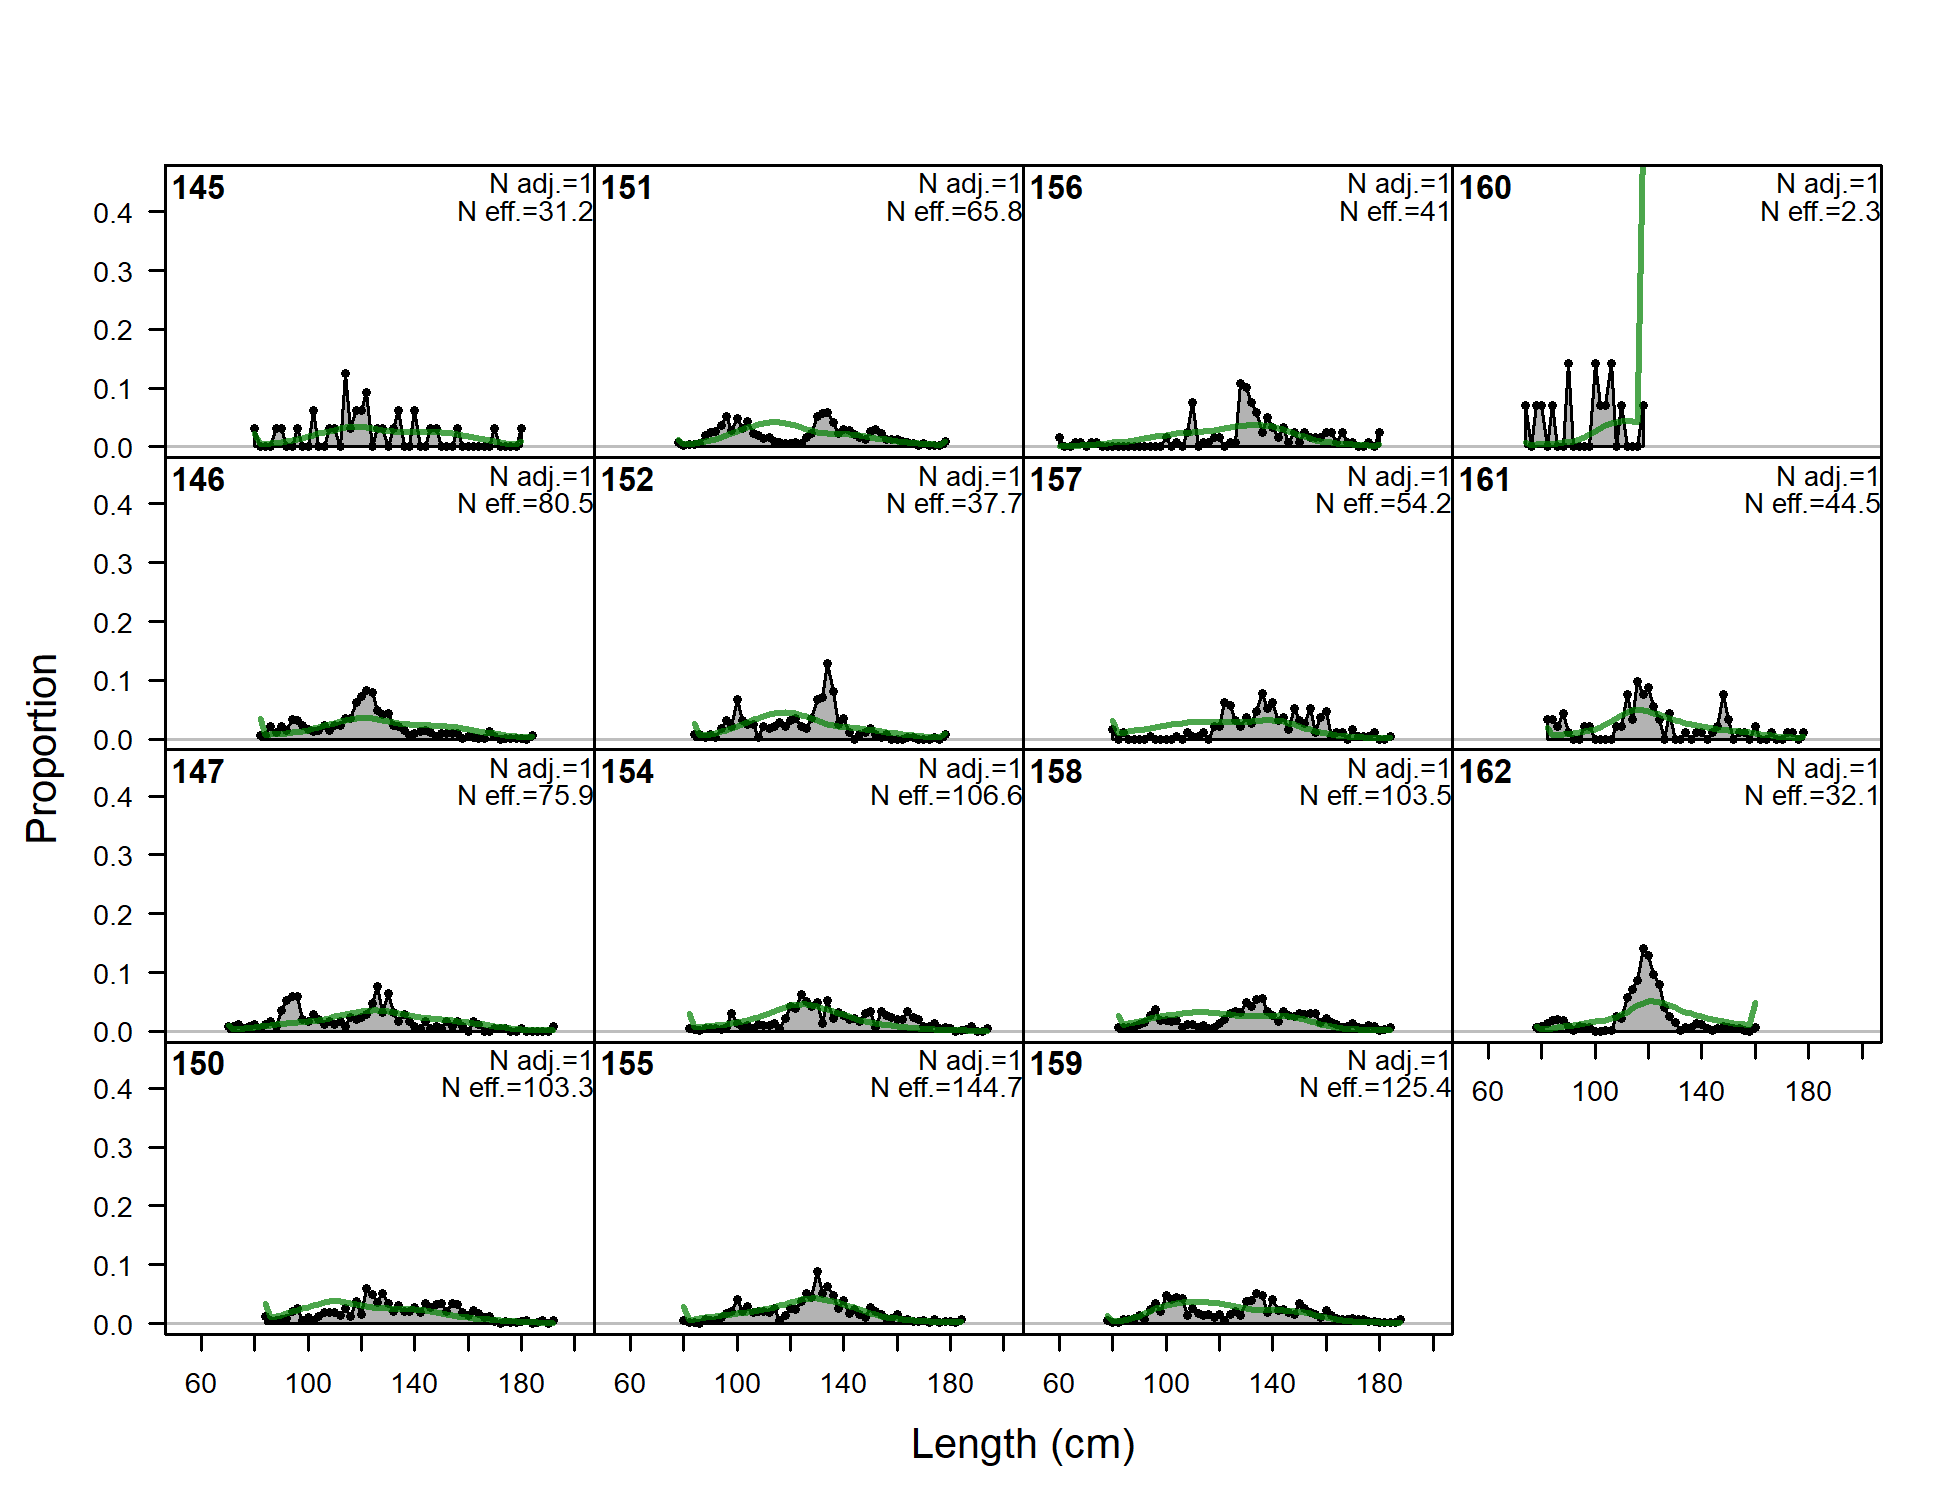
Length comps, whole catch, F5-OBJ_N (plot 5 of 6)
file: comp_lenfit_flt5mkt0_page5.png
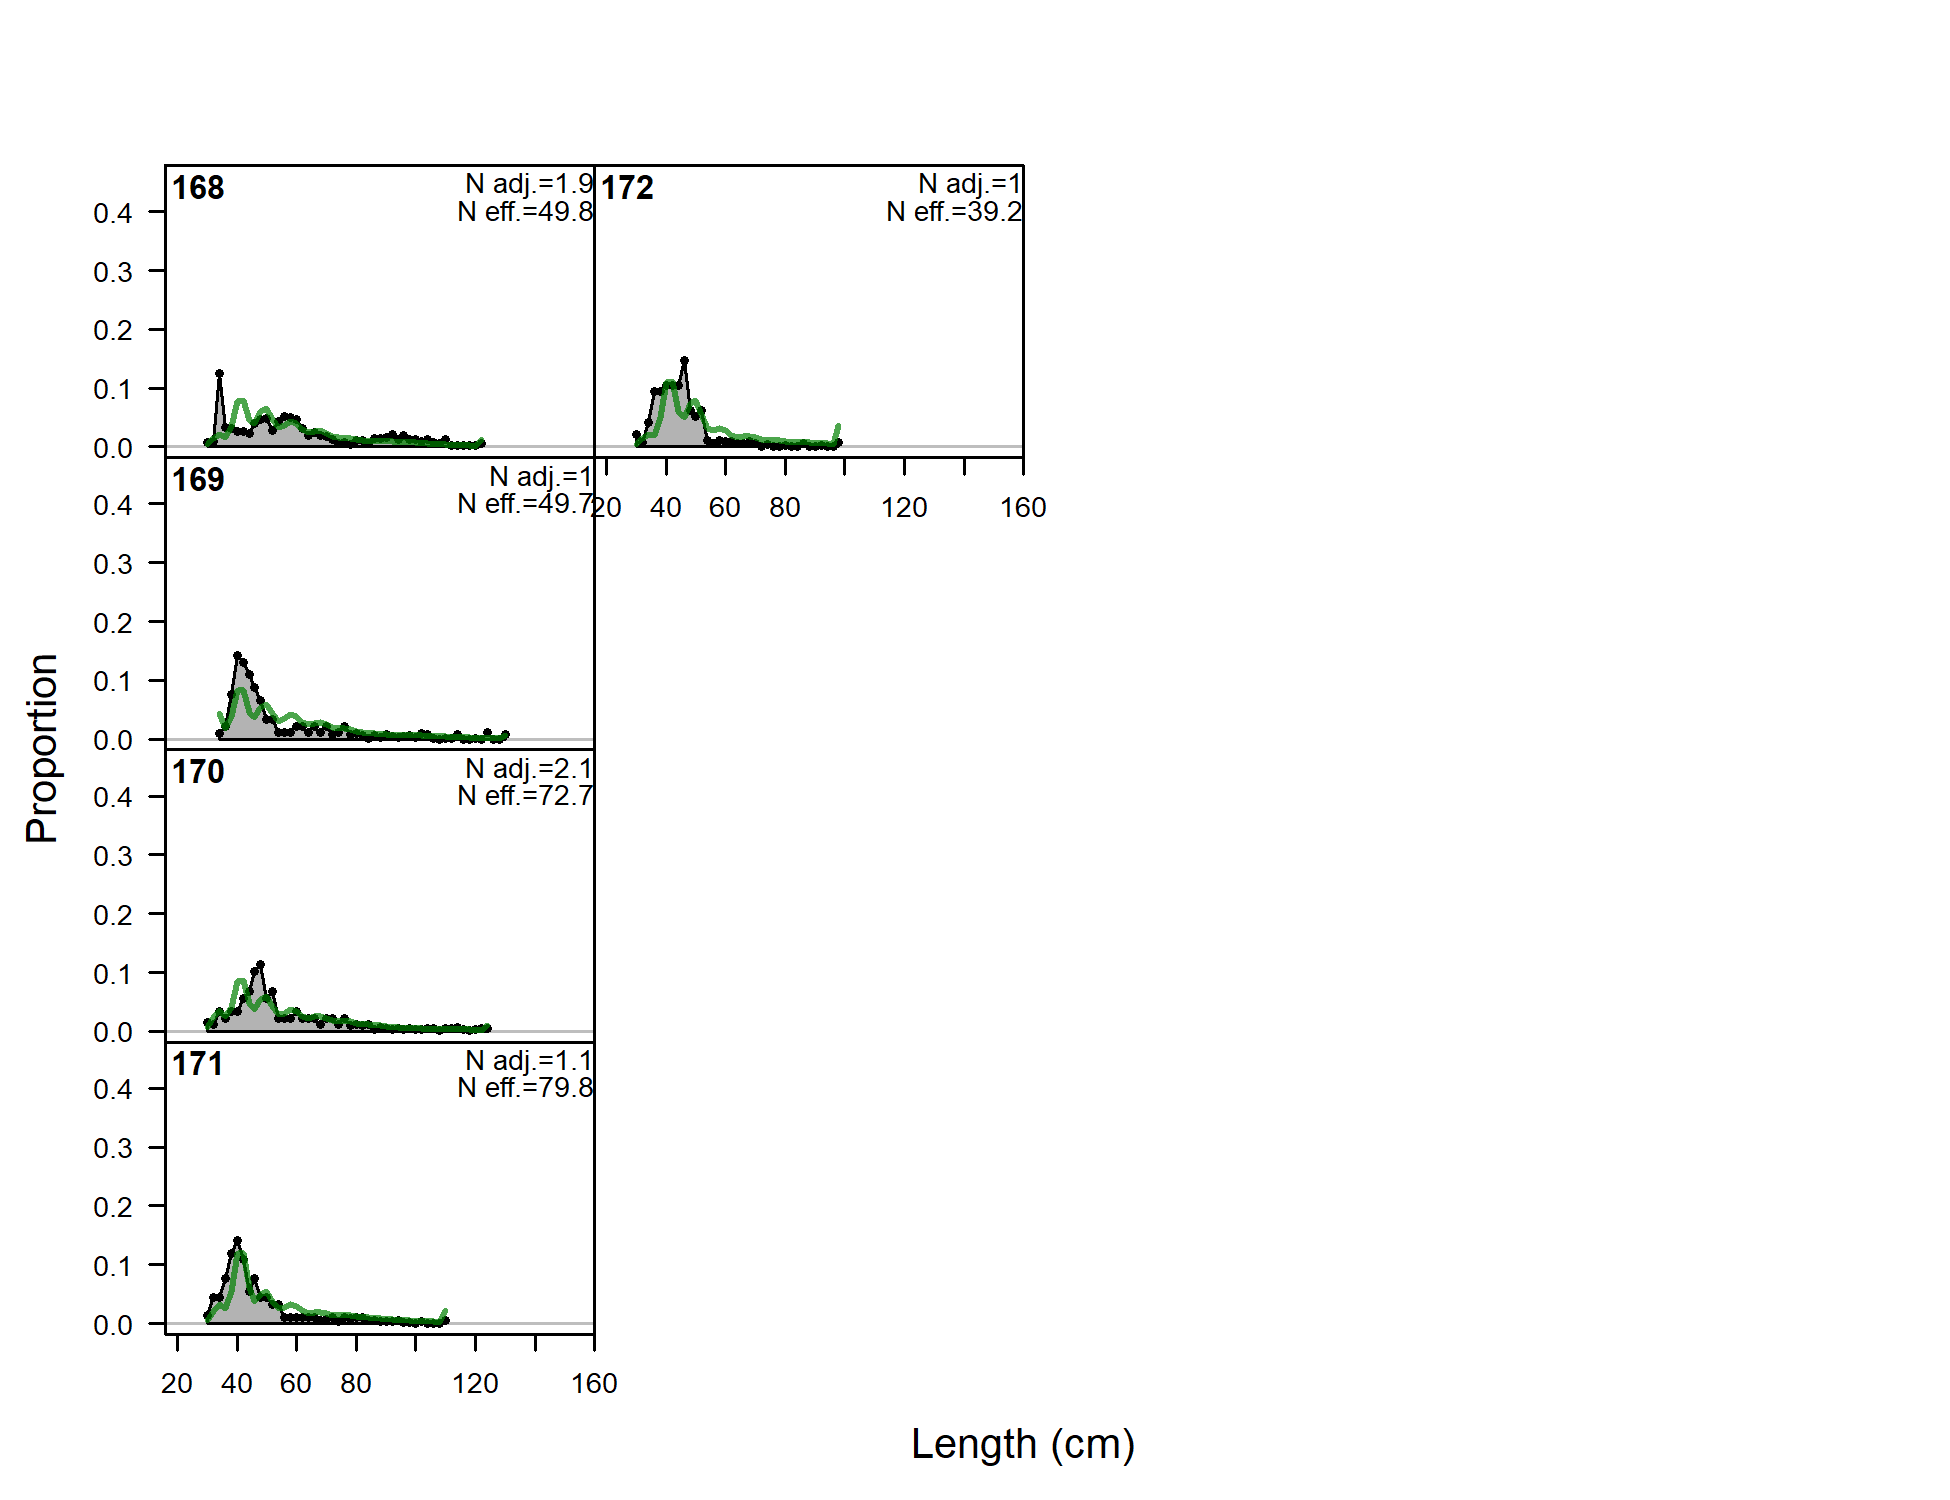
Length comps, whole catch, F5-OBJ_N (plot 6 of 6)
file: comp_lenfit_flt5mkt0_page6.png
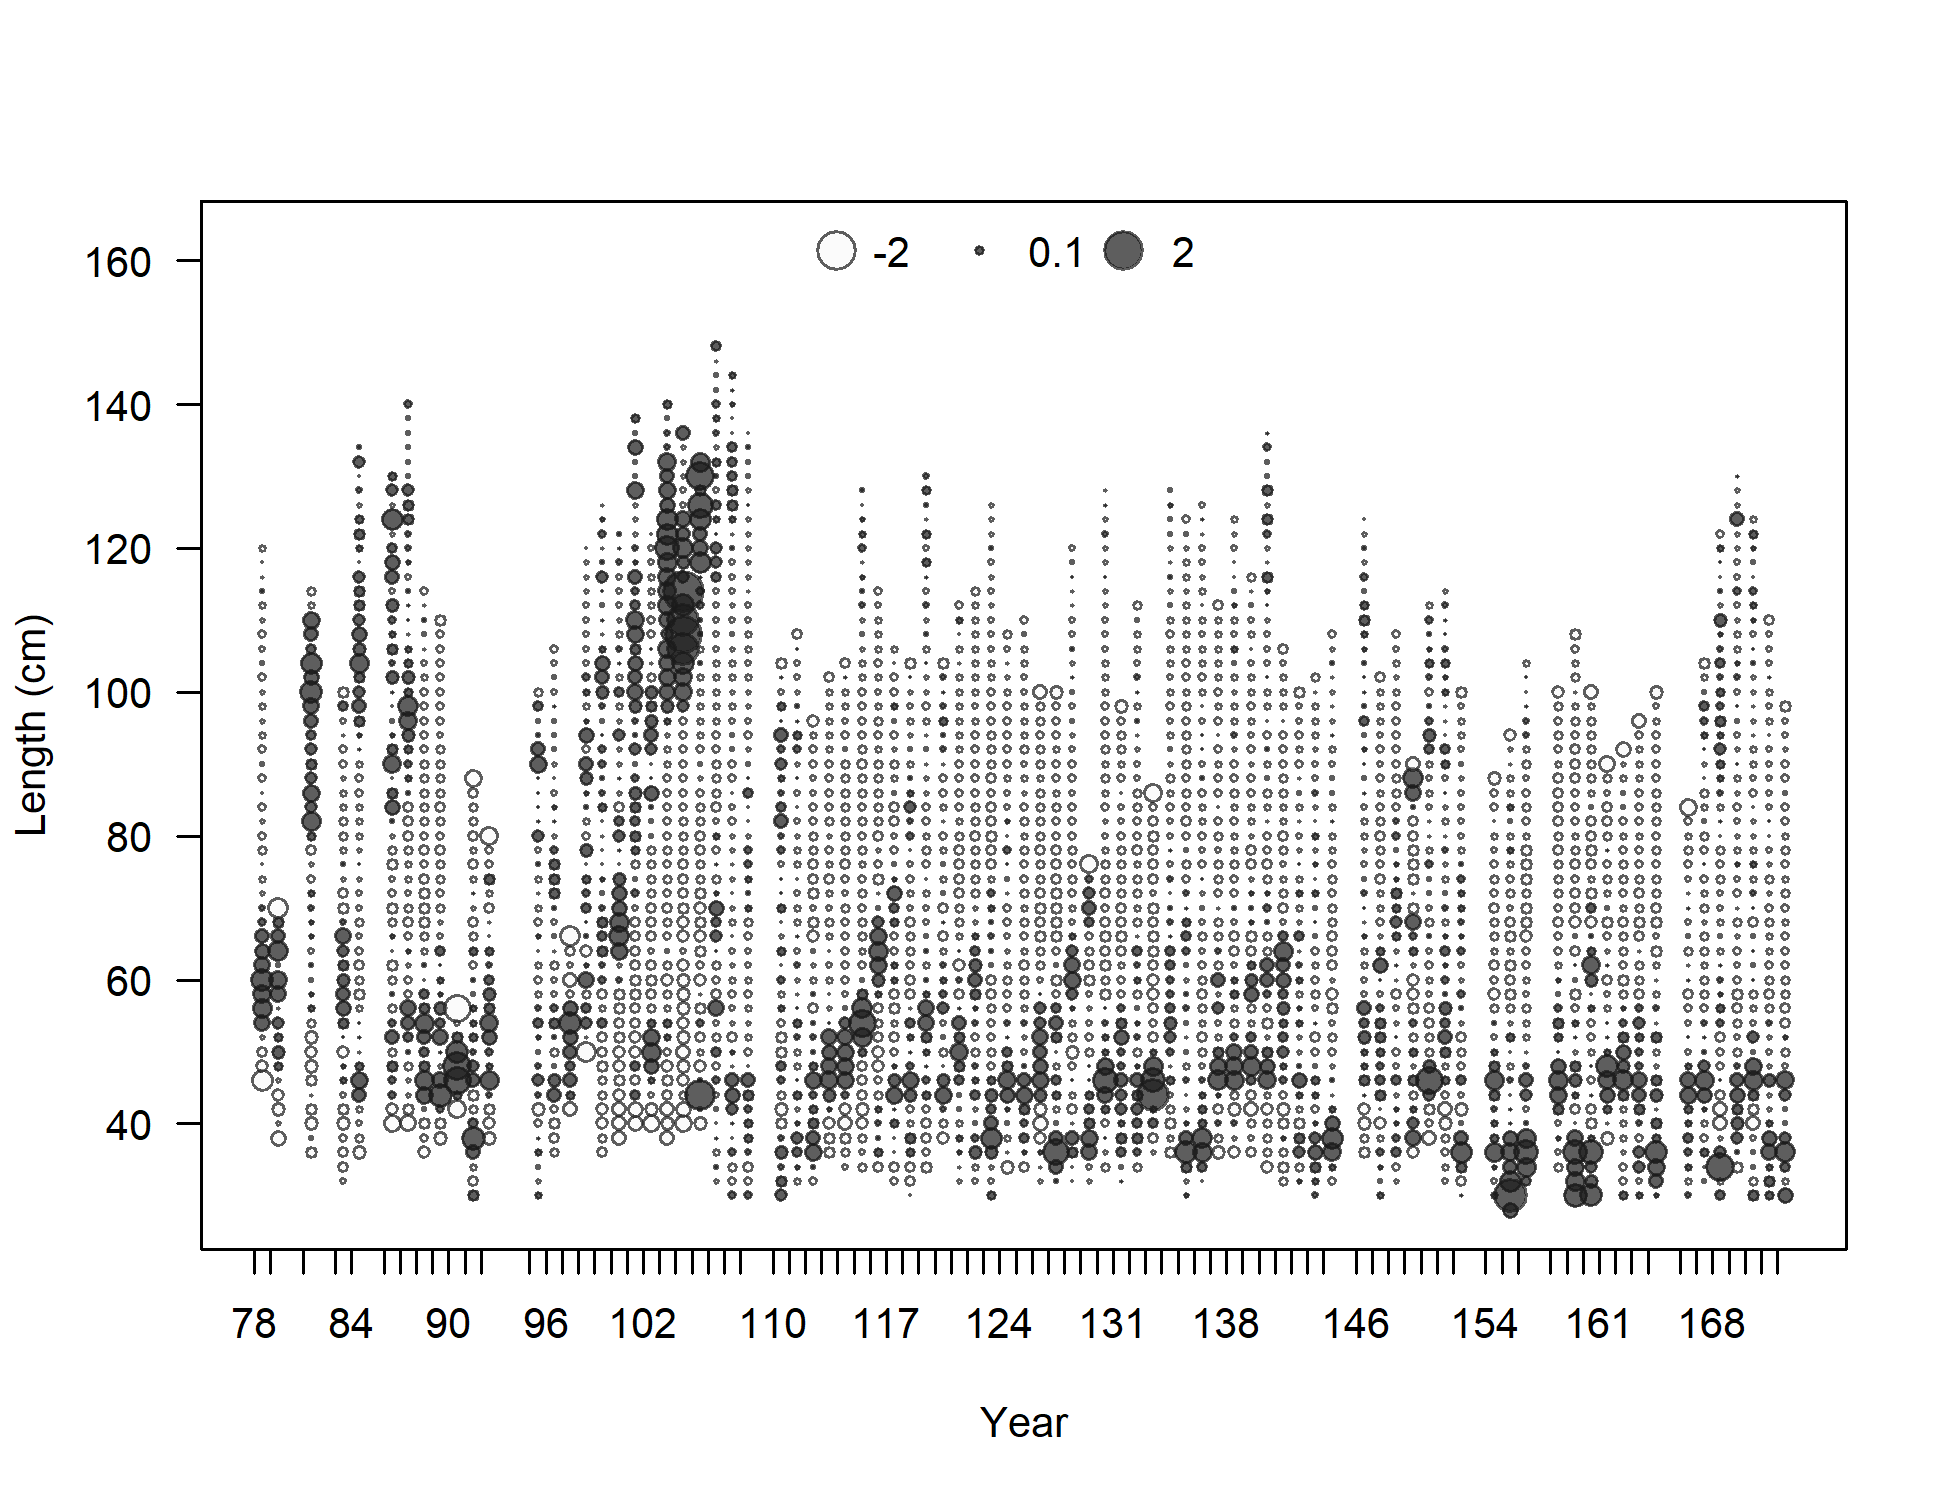
Pearson residuals, whole catch, F5-OBJ_N (max=2.17) (plot 6 of 6)
Closed bubbles are positive residuals (observed > expected) and open bubbles are negative residuals (observed < expected).
file: comp_lenfit_residsflt5mkt0_page6.png
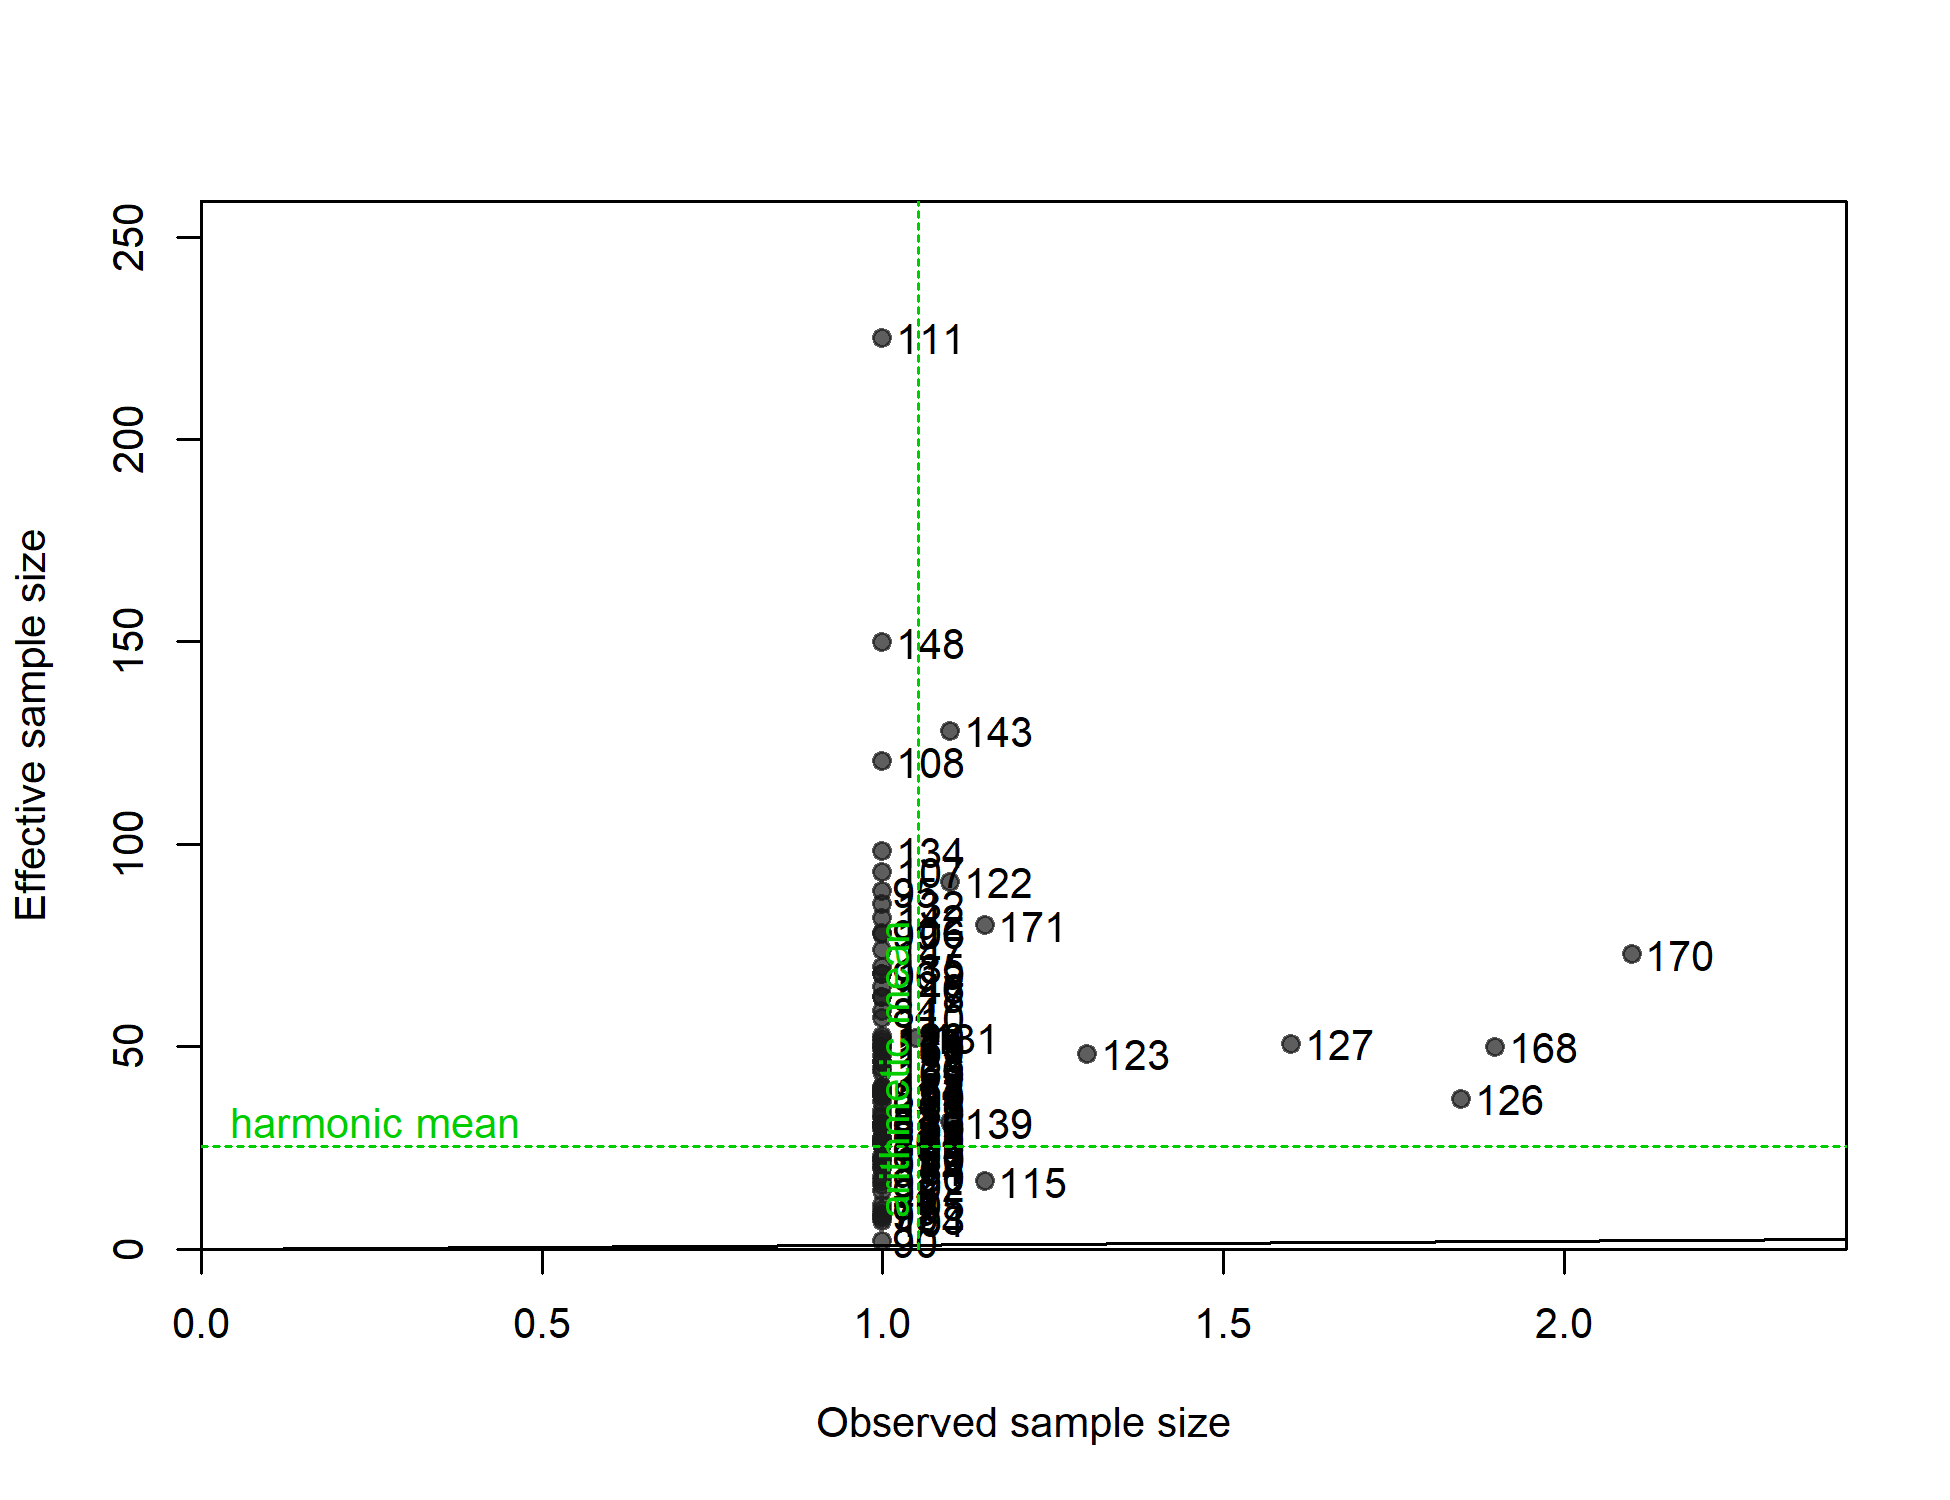
N-EffN comparison, Length comps, whole catch, F5-OBJ_N
file: comp_lenfit_sampsize_flt5mkt0.png
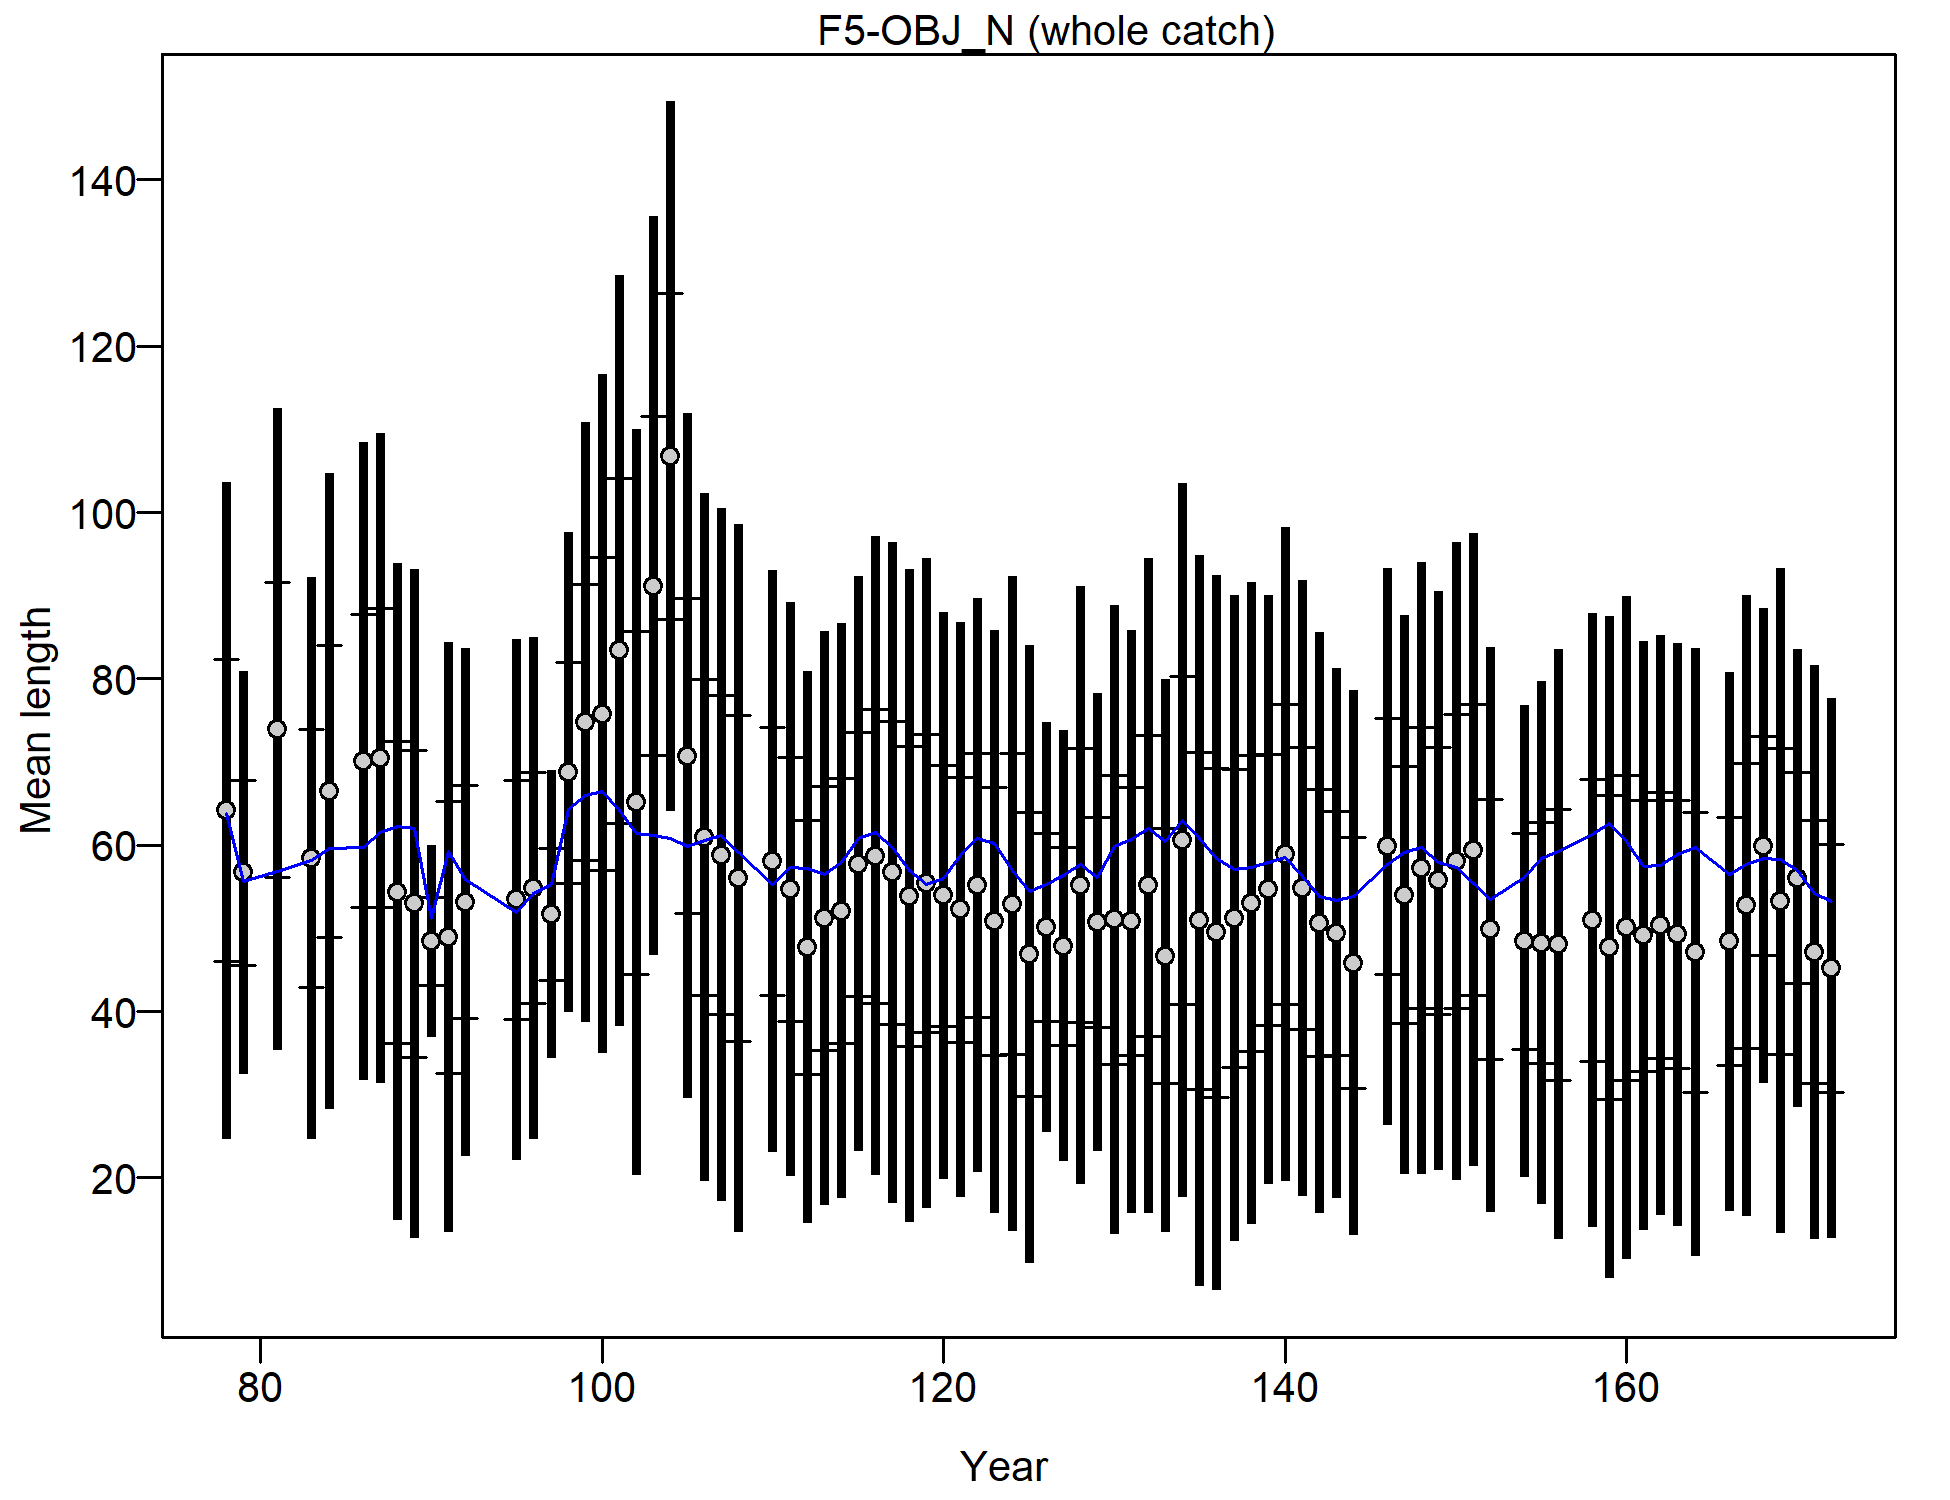
Mean length for F5-OBJ_N with 95% confidence intervals based on current samples sizes.
Francis data weighting method TA1.8: thinner intervals (with capped ends) show result of further adjusting sample sizes based on suggested multiplier (with 95% interval) for len data from F5-OBJ_N:
4.7337 (2.8578-10.0859)
For more info, see
Francis, R.I.C.C. (2011). Data weighting in statistical fisheries stock assessment models. Can. J. Fish. Aquat. Sci. 68: 1124-1138. https://doi.org/10.1139/f2011-025
file: comp_lenfit_data_weighting_TA1.8_F5-OBJ_N.png
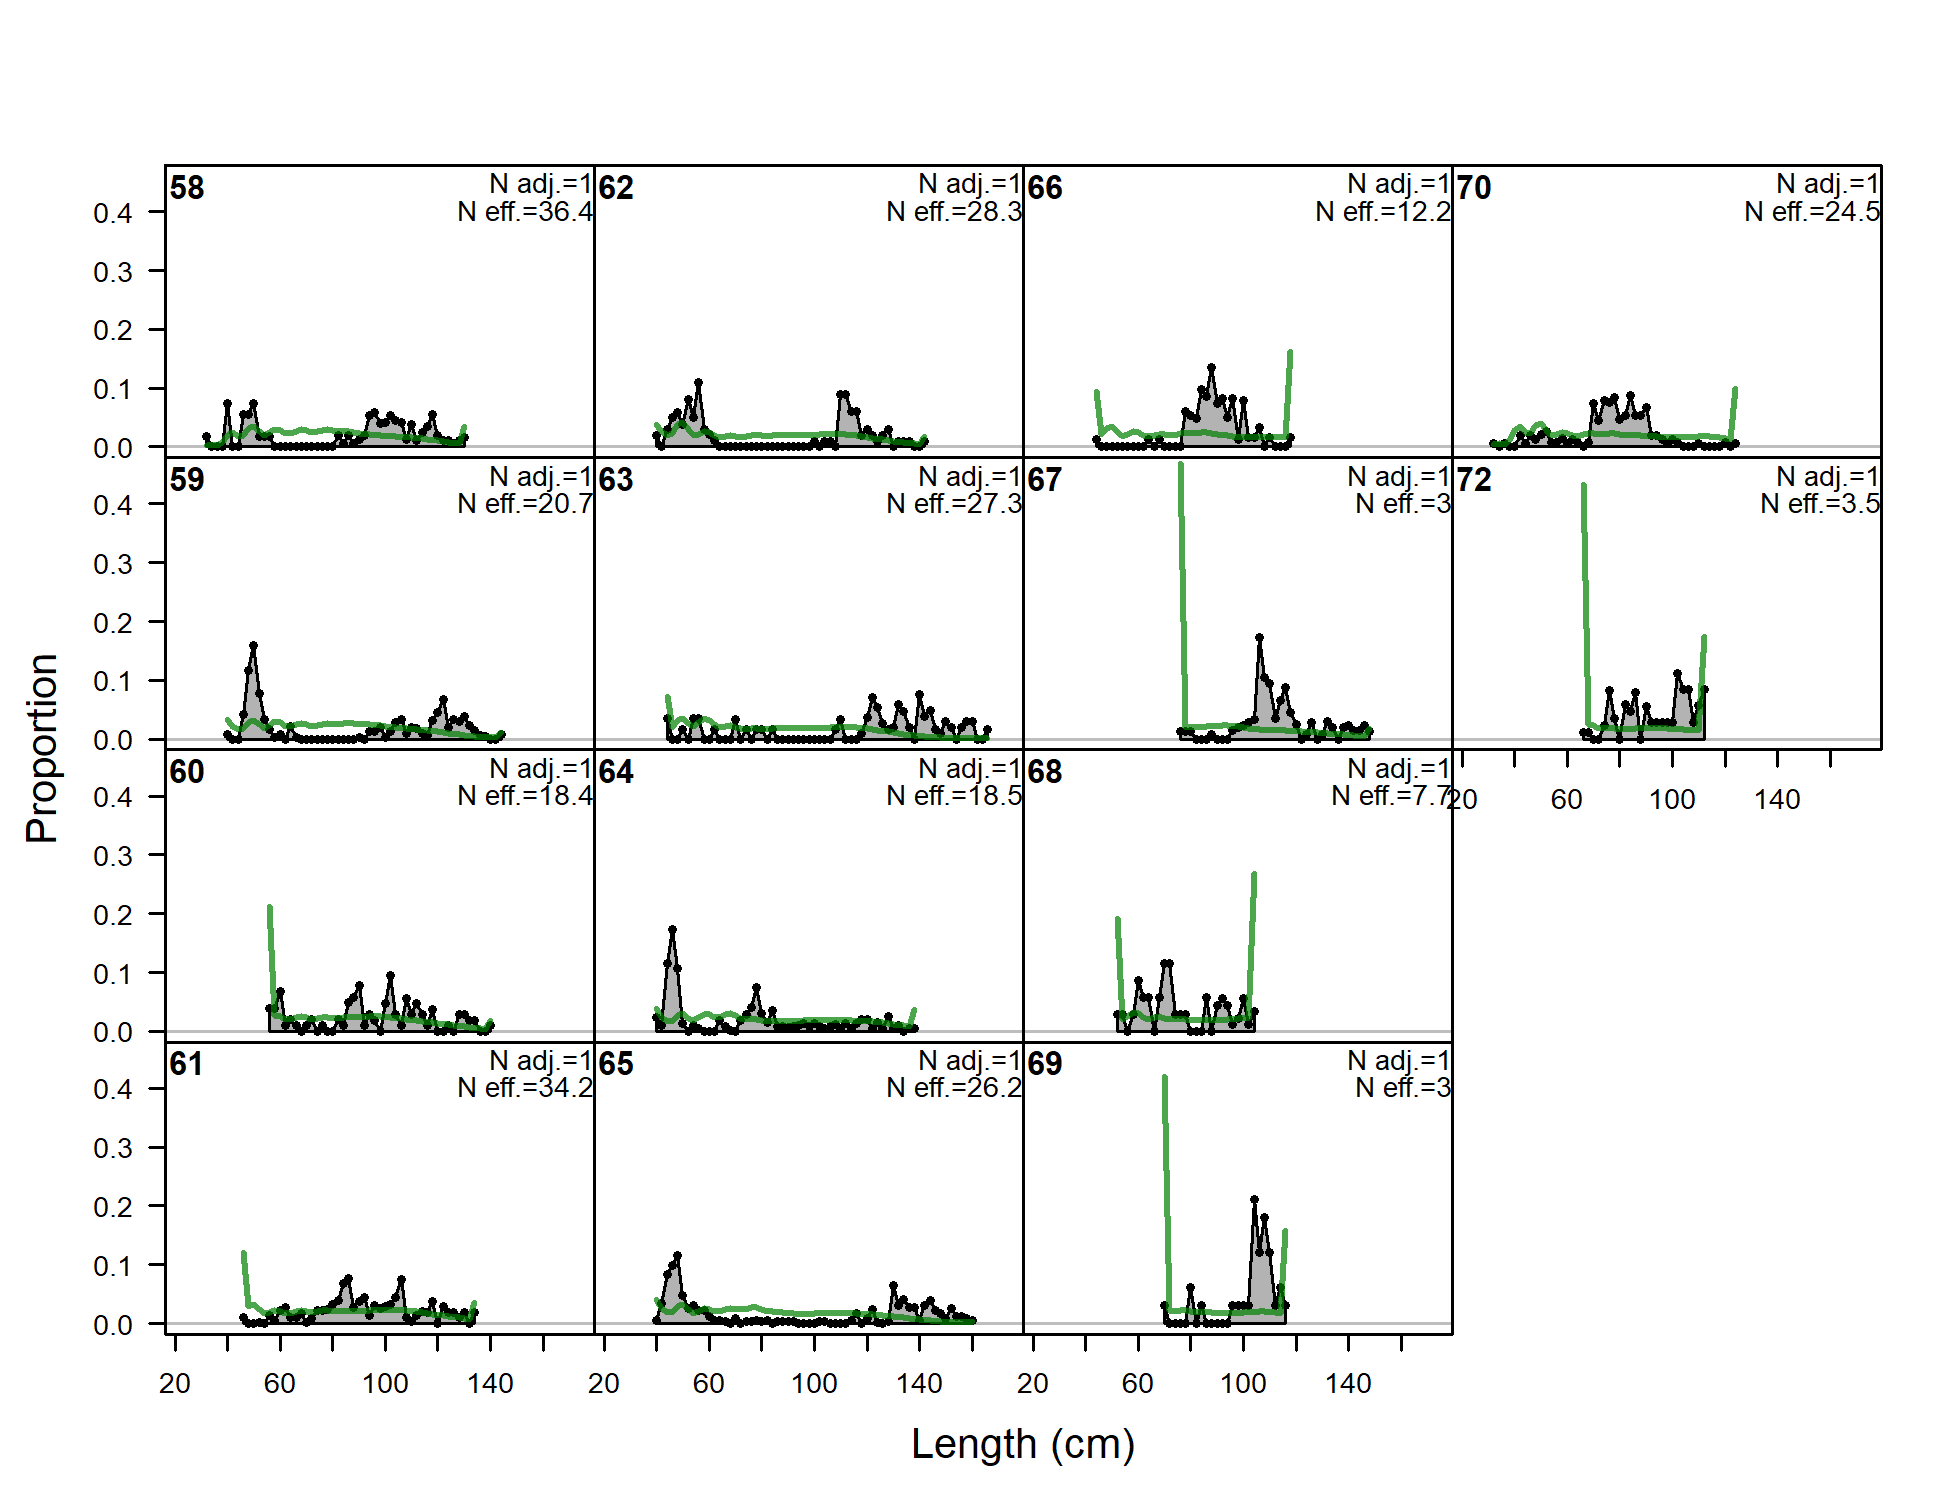
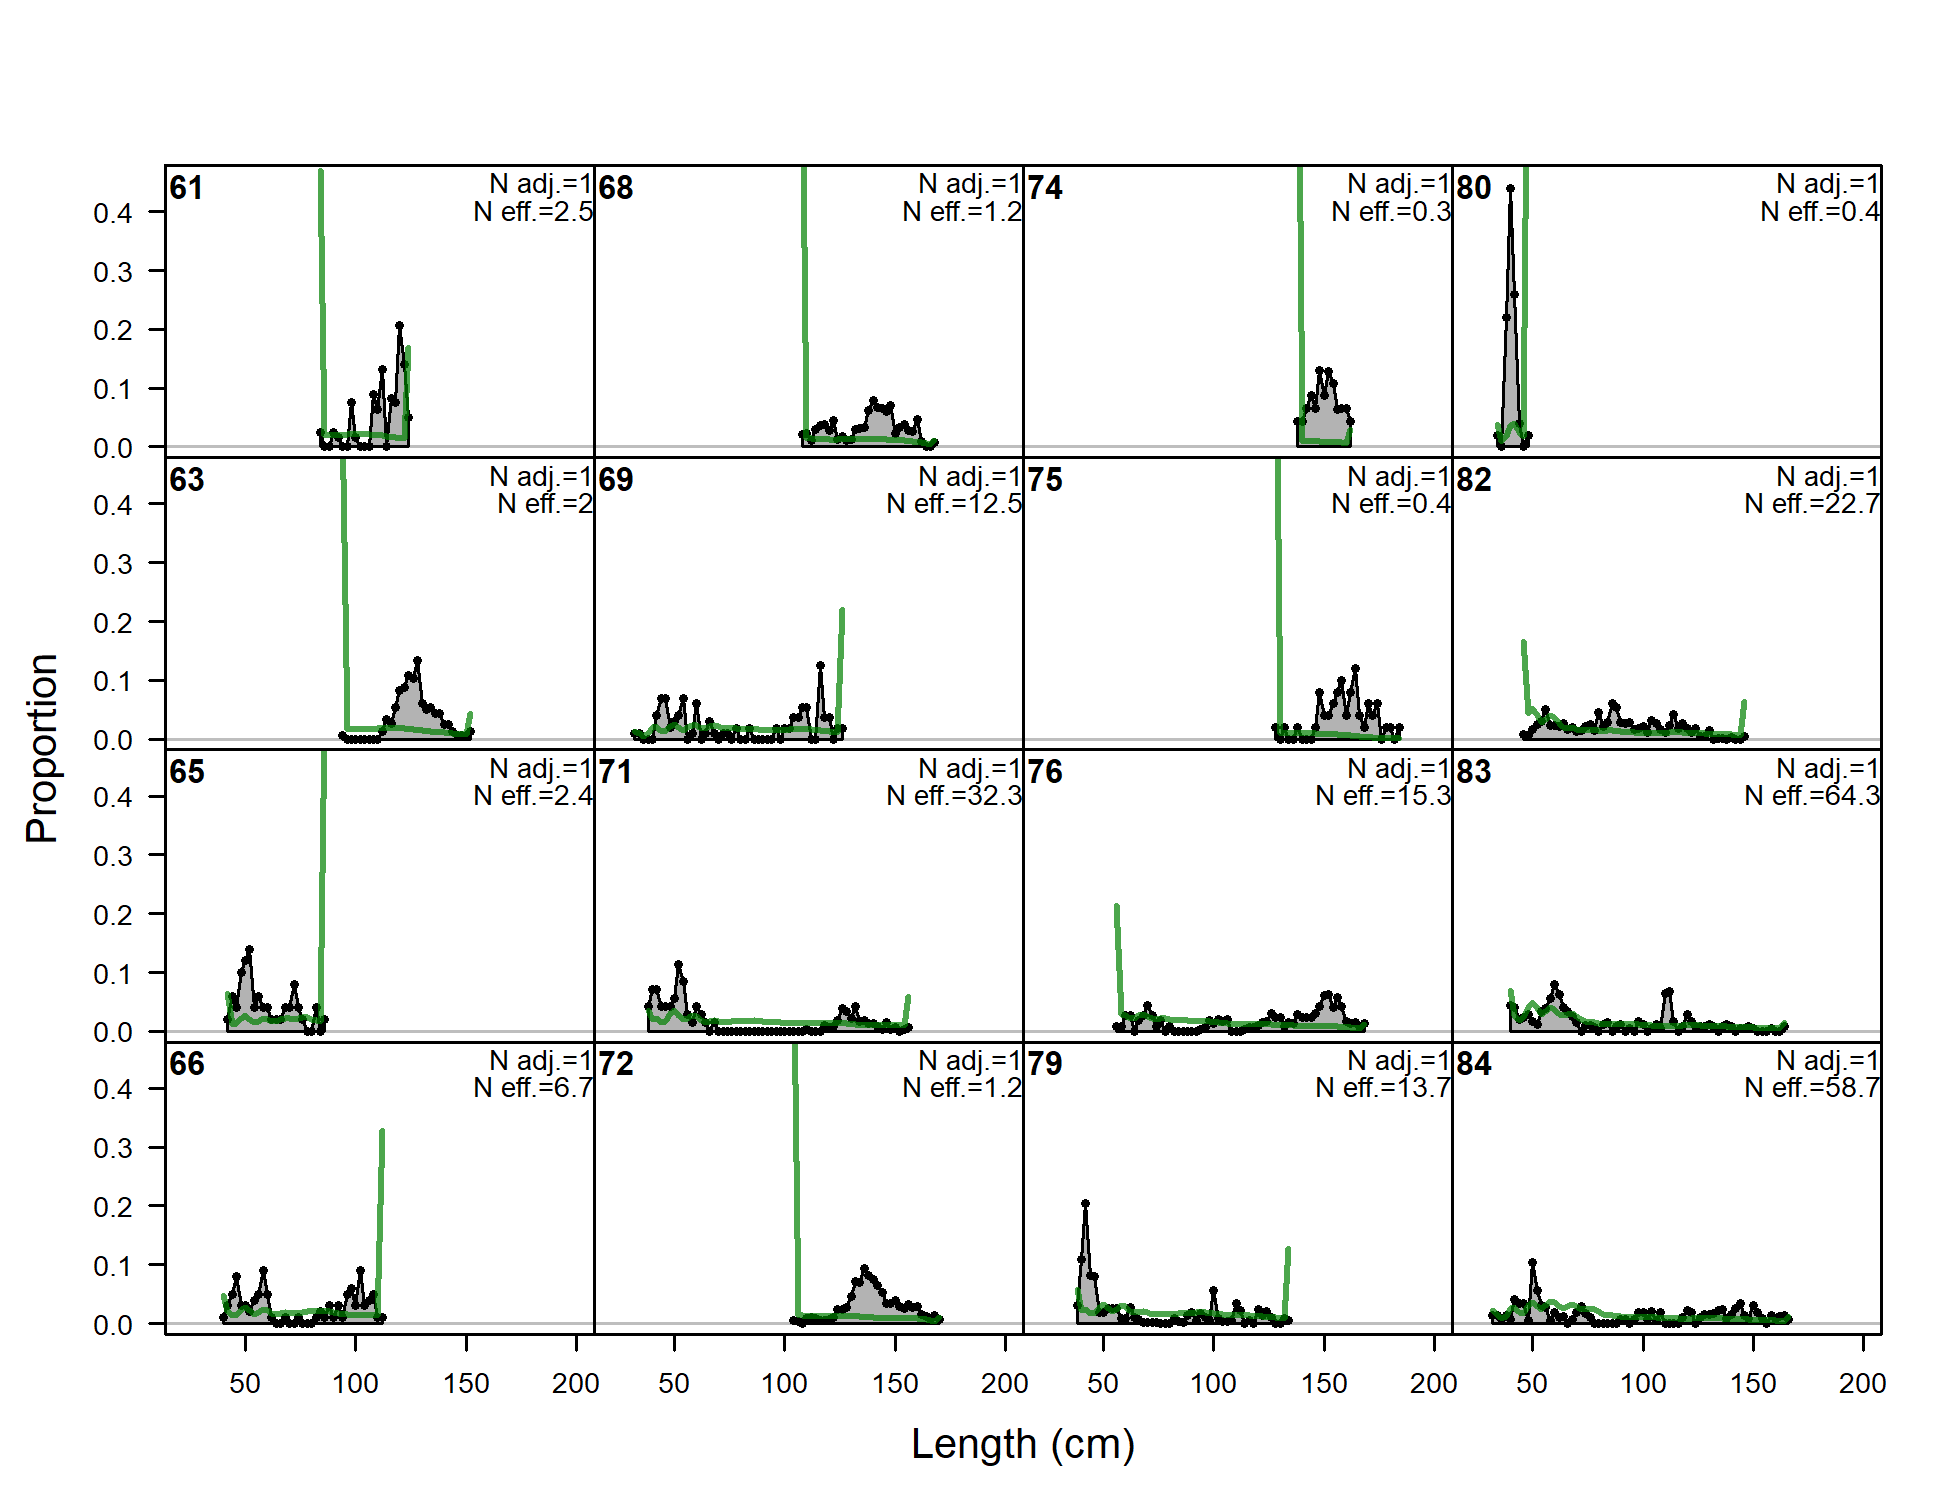
Length comps, whole catch, F6-NOA-DEL_early (plot 1 of 3).
'N adj.' is the input sample size after data-weighting adjustment.N eff. is the calculated effective sample size used in the McAllister-Iannelli tuning method.
file: comp_lenfit_flt6mkt0_page1.png
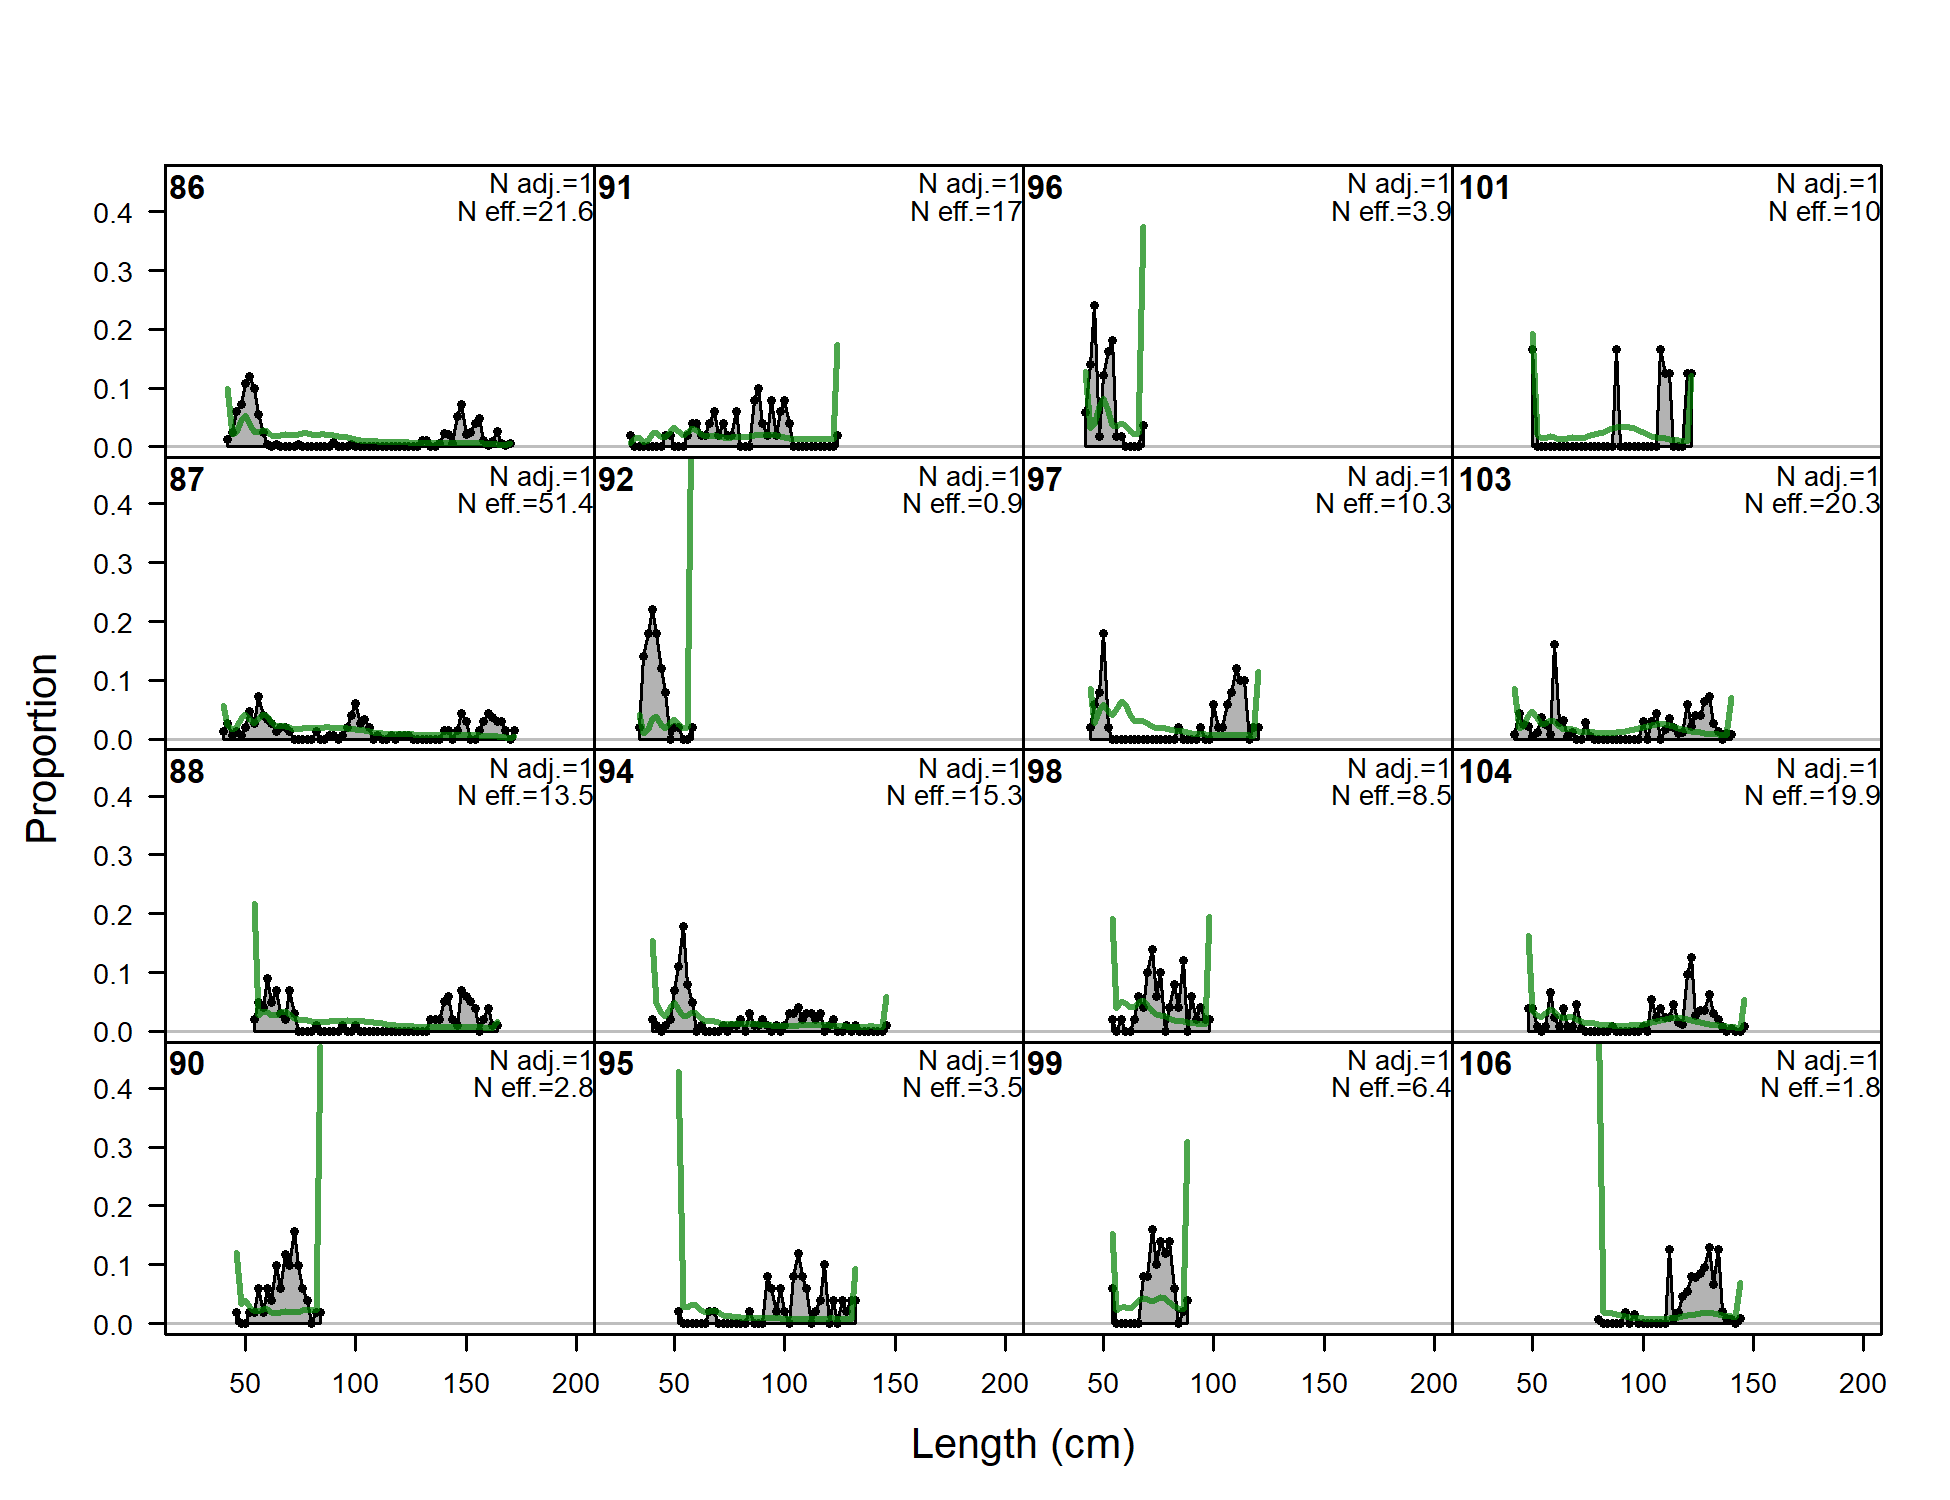
Length comps, whole catch, F6-NOA-DEL_early (plot 2 of 3)
file: comp_lenfit_flt6mkt0_page2.png
Length comps, whole catch, F6-NOA-DEL_early (plot 3 of 3)
file: comp_lenfit_flt6mkt0_page3.png
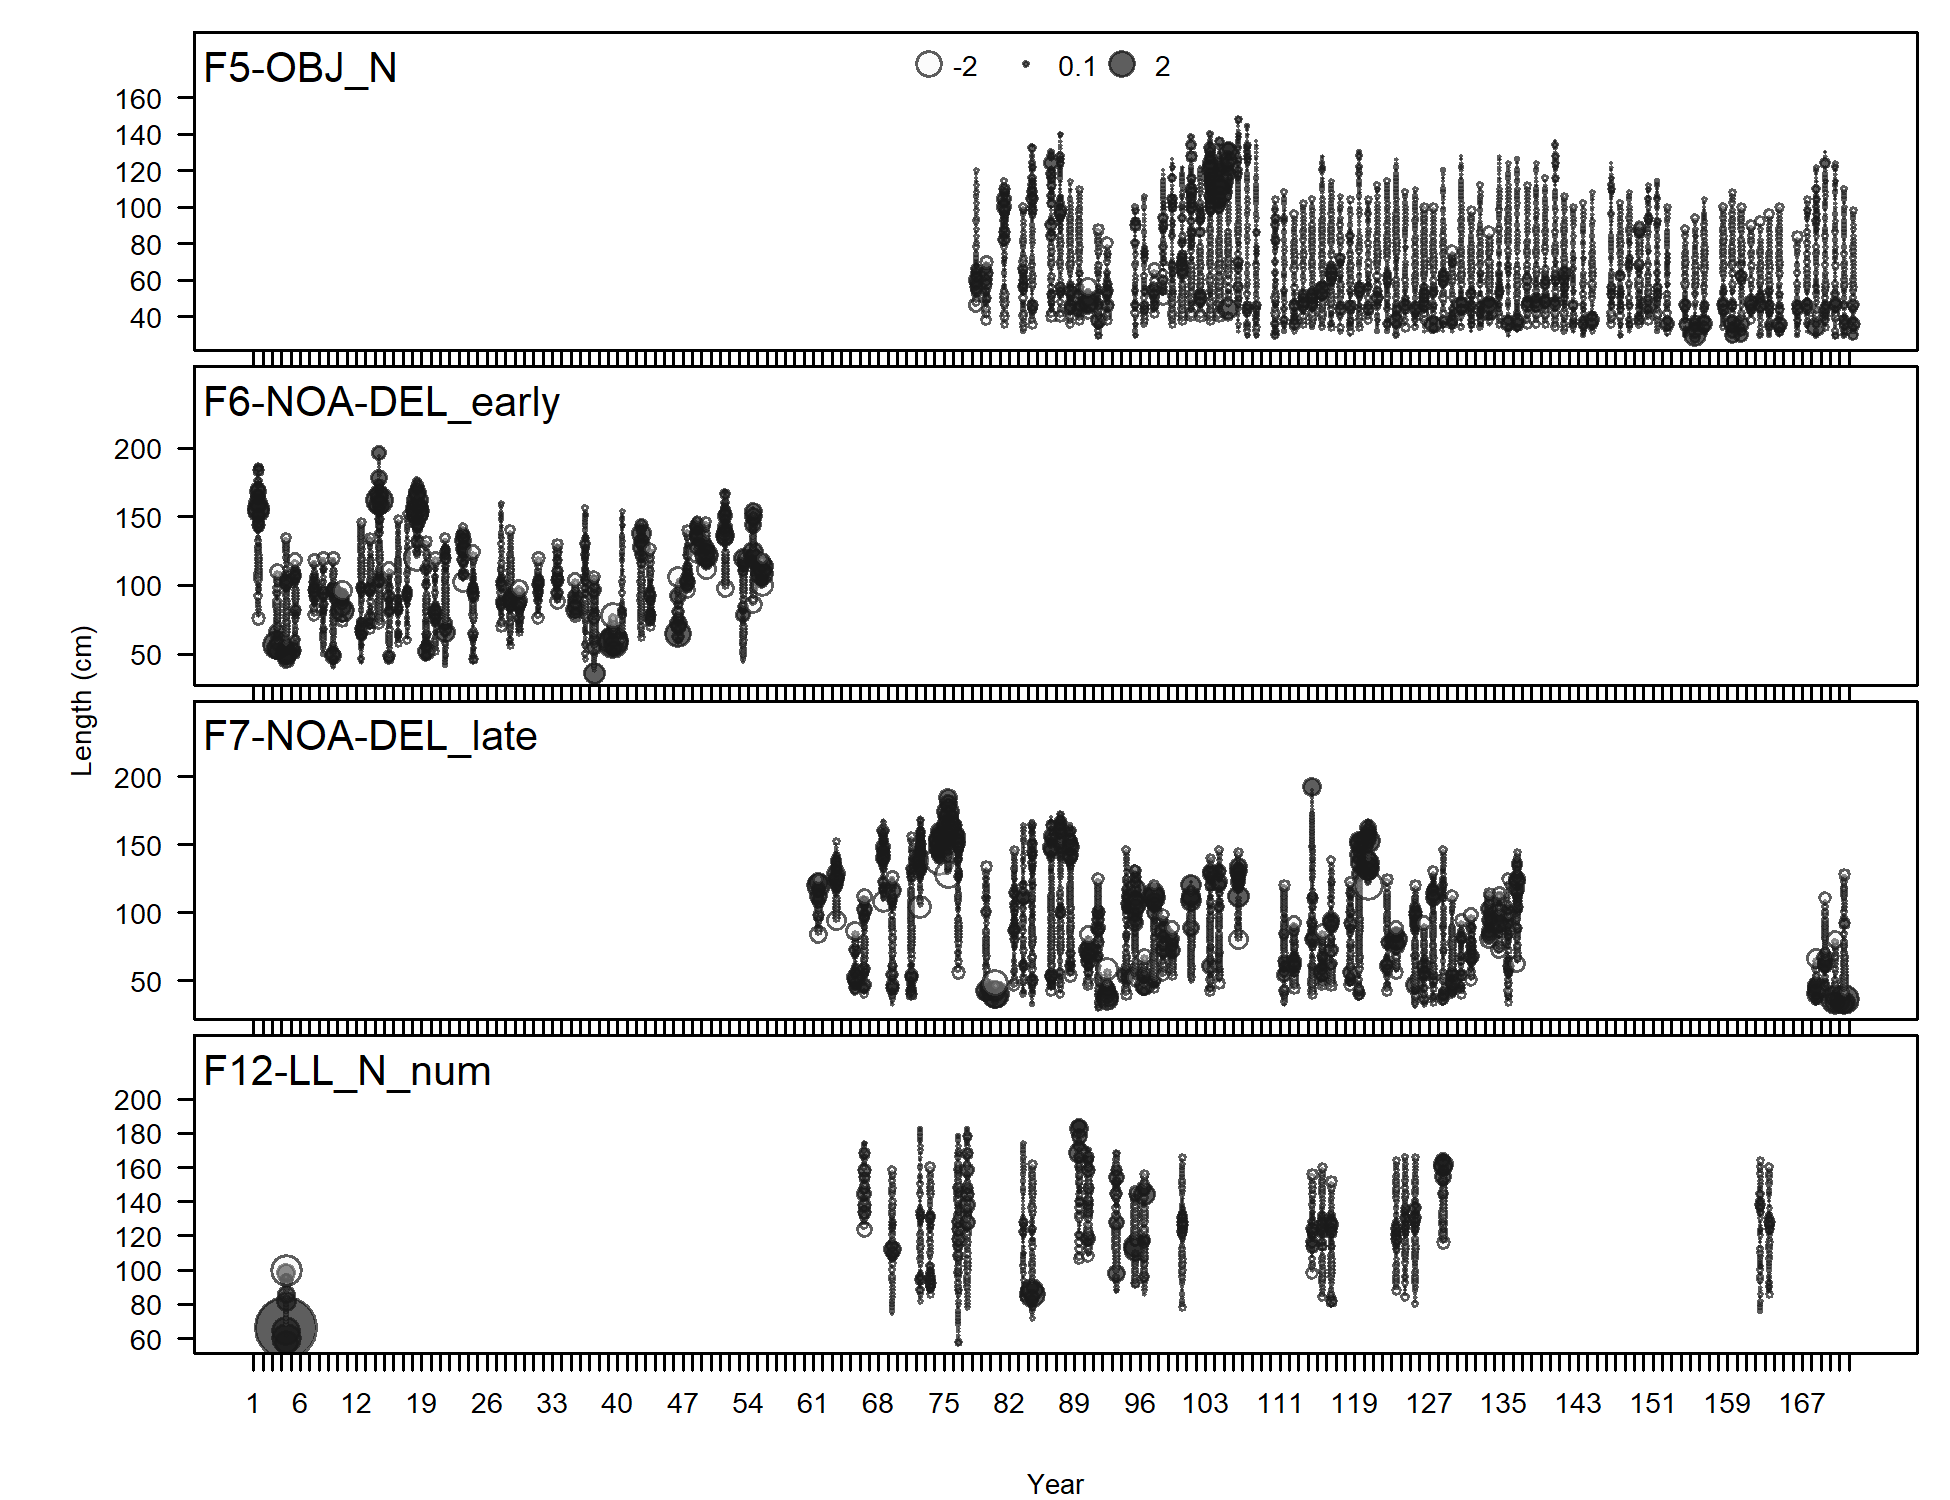
Pearson residuals, whole catch, F6-NOA-DEL_early (max=2.63) (plot 3 of 3)
Closed bubbles are positive residuals (observed > expected) and open bubbles are negative residuals (observed < expected).
file: comp_lenfit_residsflt6mkt0_page3.png
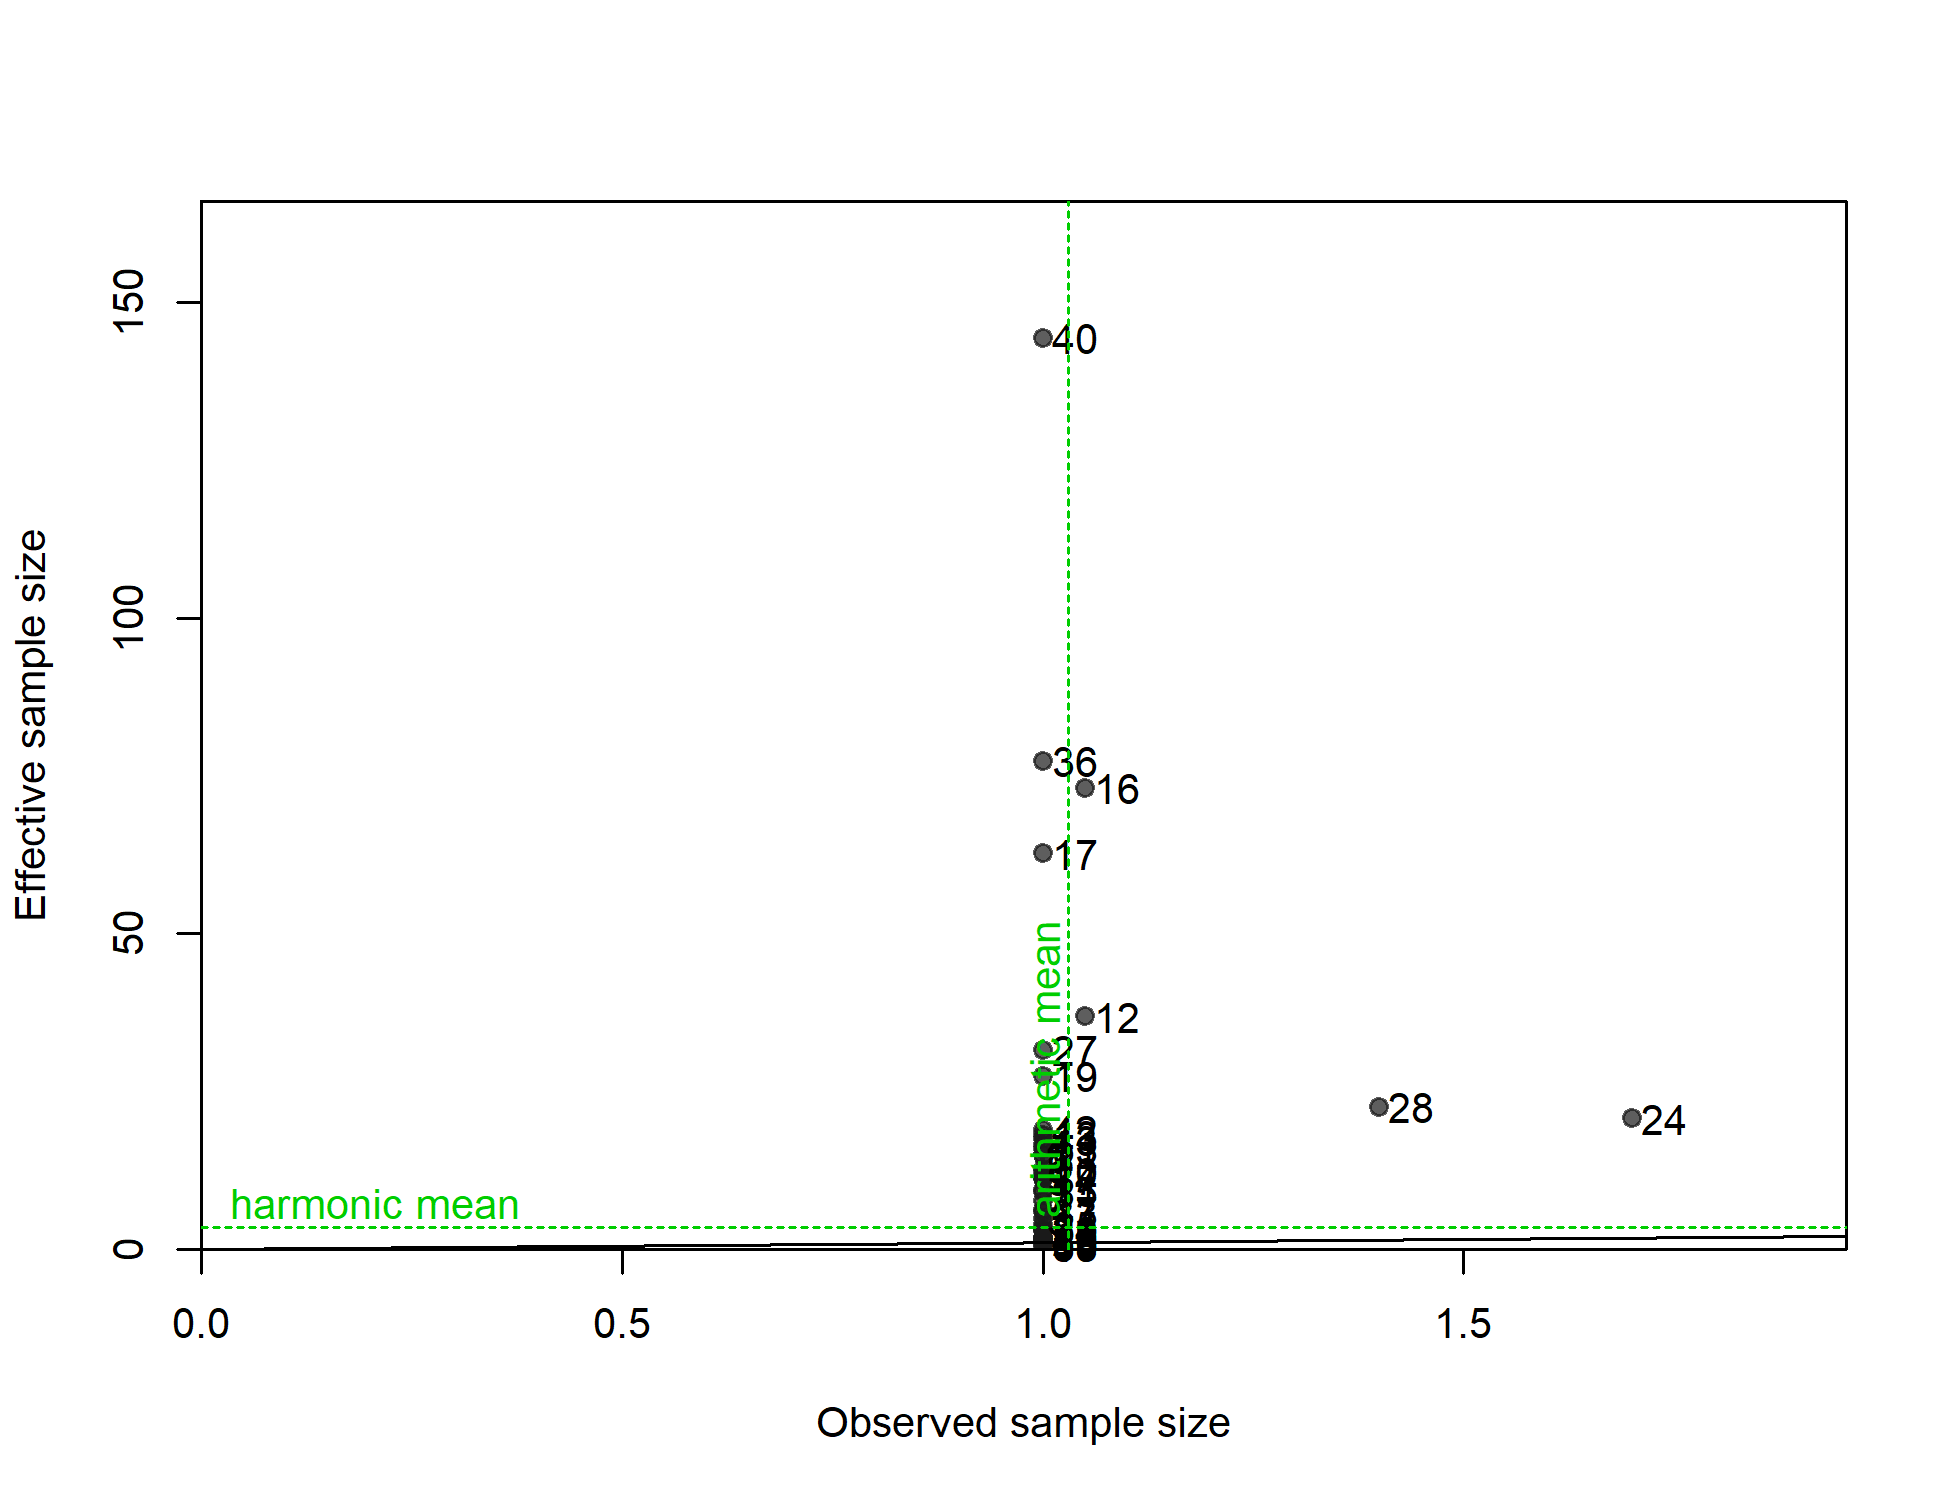
N-EffN comparison, Length comps, whole catch, F6-NOA-DEL_early
file: comp_lenfit_sampsize_flt6mkt0.png
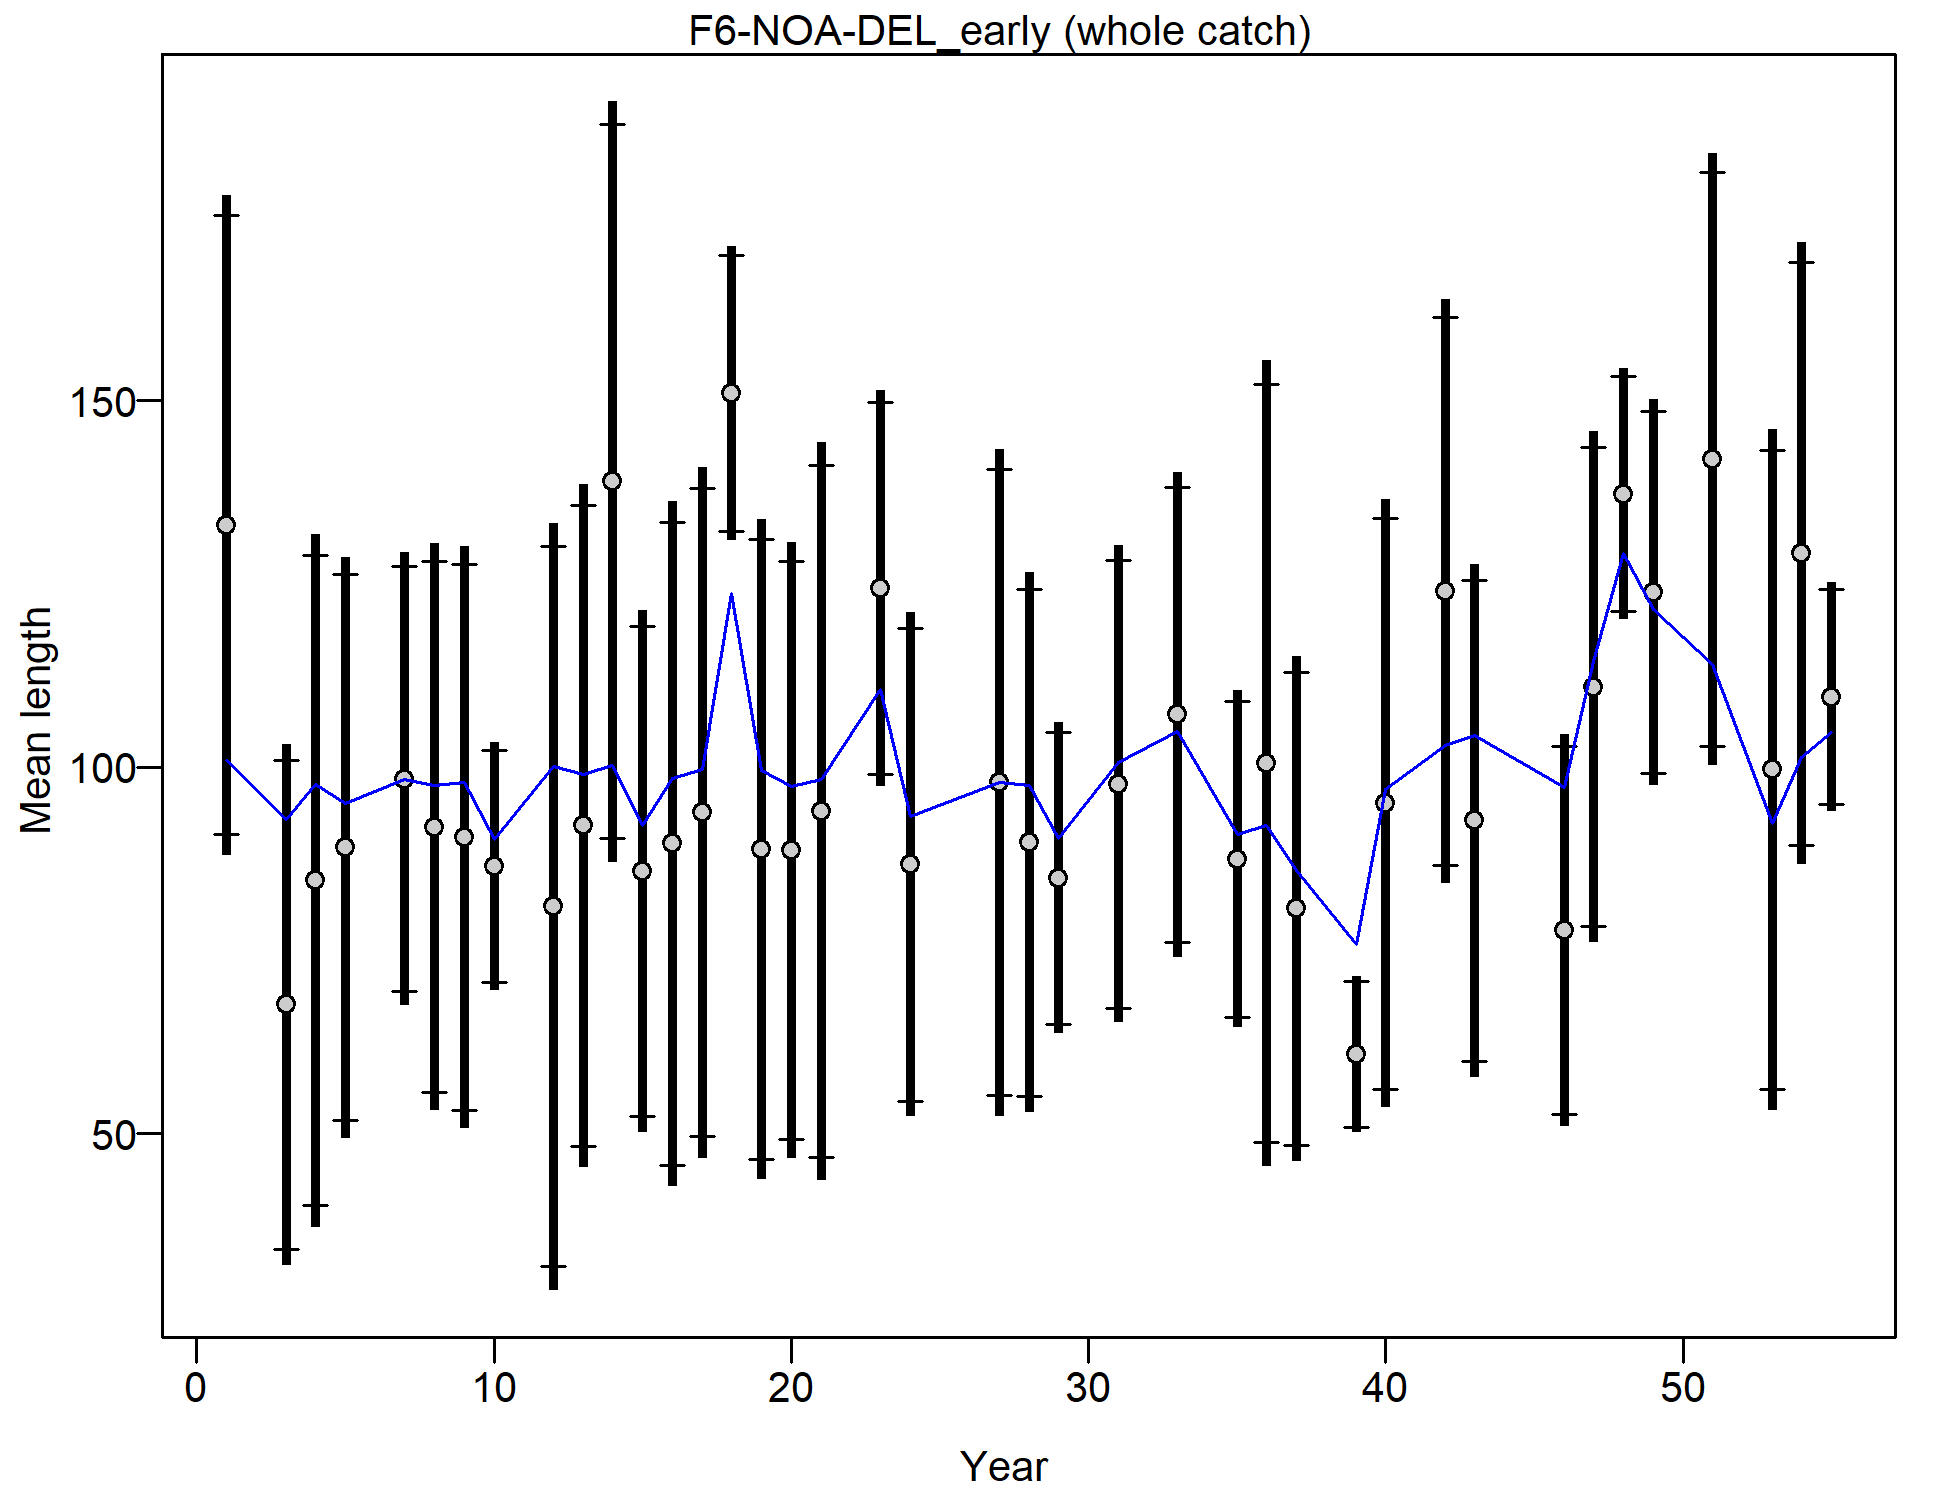
Mean length for F6-NOA-DEL_early with 95% confidence intervals based on current samples sizes.
Francis data weighting method TA1.8: thinner intervals (with capped ends) show result of further adjusting sample sizes based on suggested multiplier (with 95% interval) for len data from F6-NOA-DEL_early:
1.135 (0.6722-2.5169)
For more info, see
Francis, R.I.C.C. (2011). Data weighting in statistical fisheries stock assessment models. Can. J. Fish. Aquat. Sci. 68: 1124-1138. https://doi.org/10.1139/f2011-025
file: comp_lenfit_data_weighting_TA1.8_F6-NOA-DEL_early.png
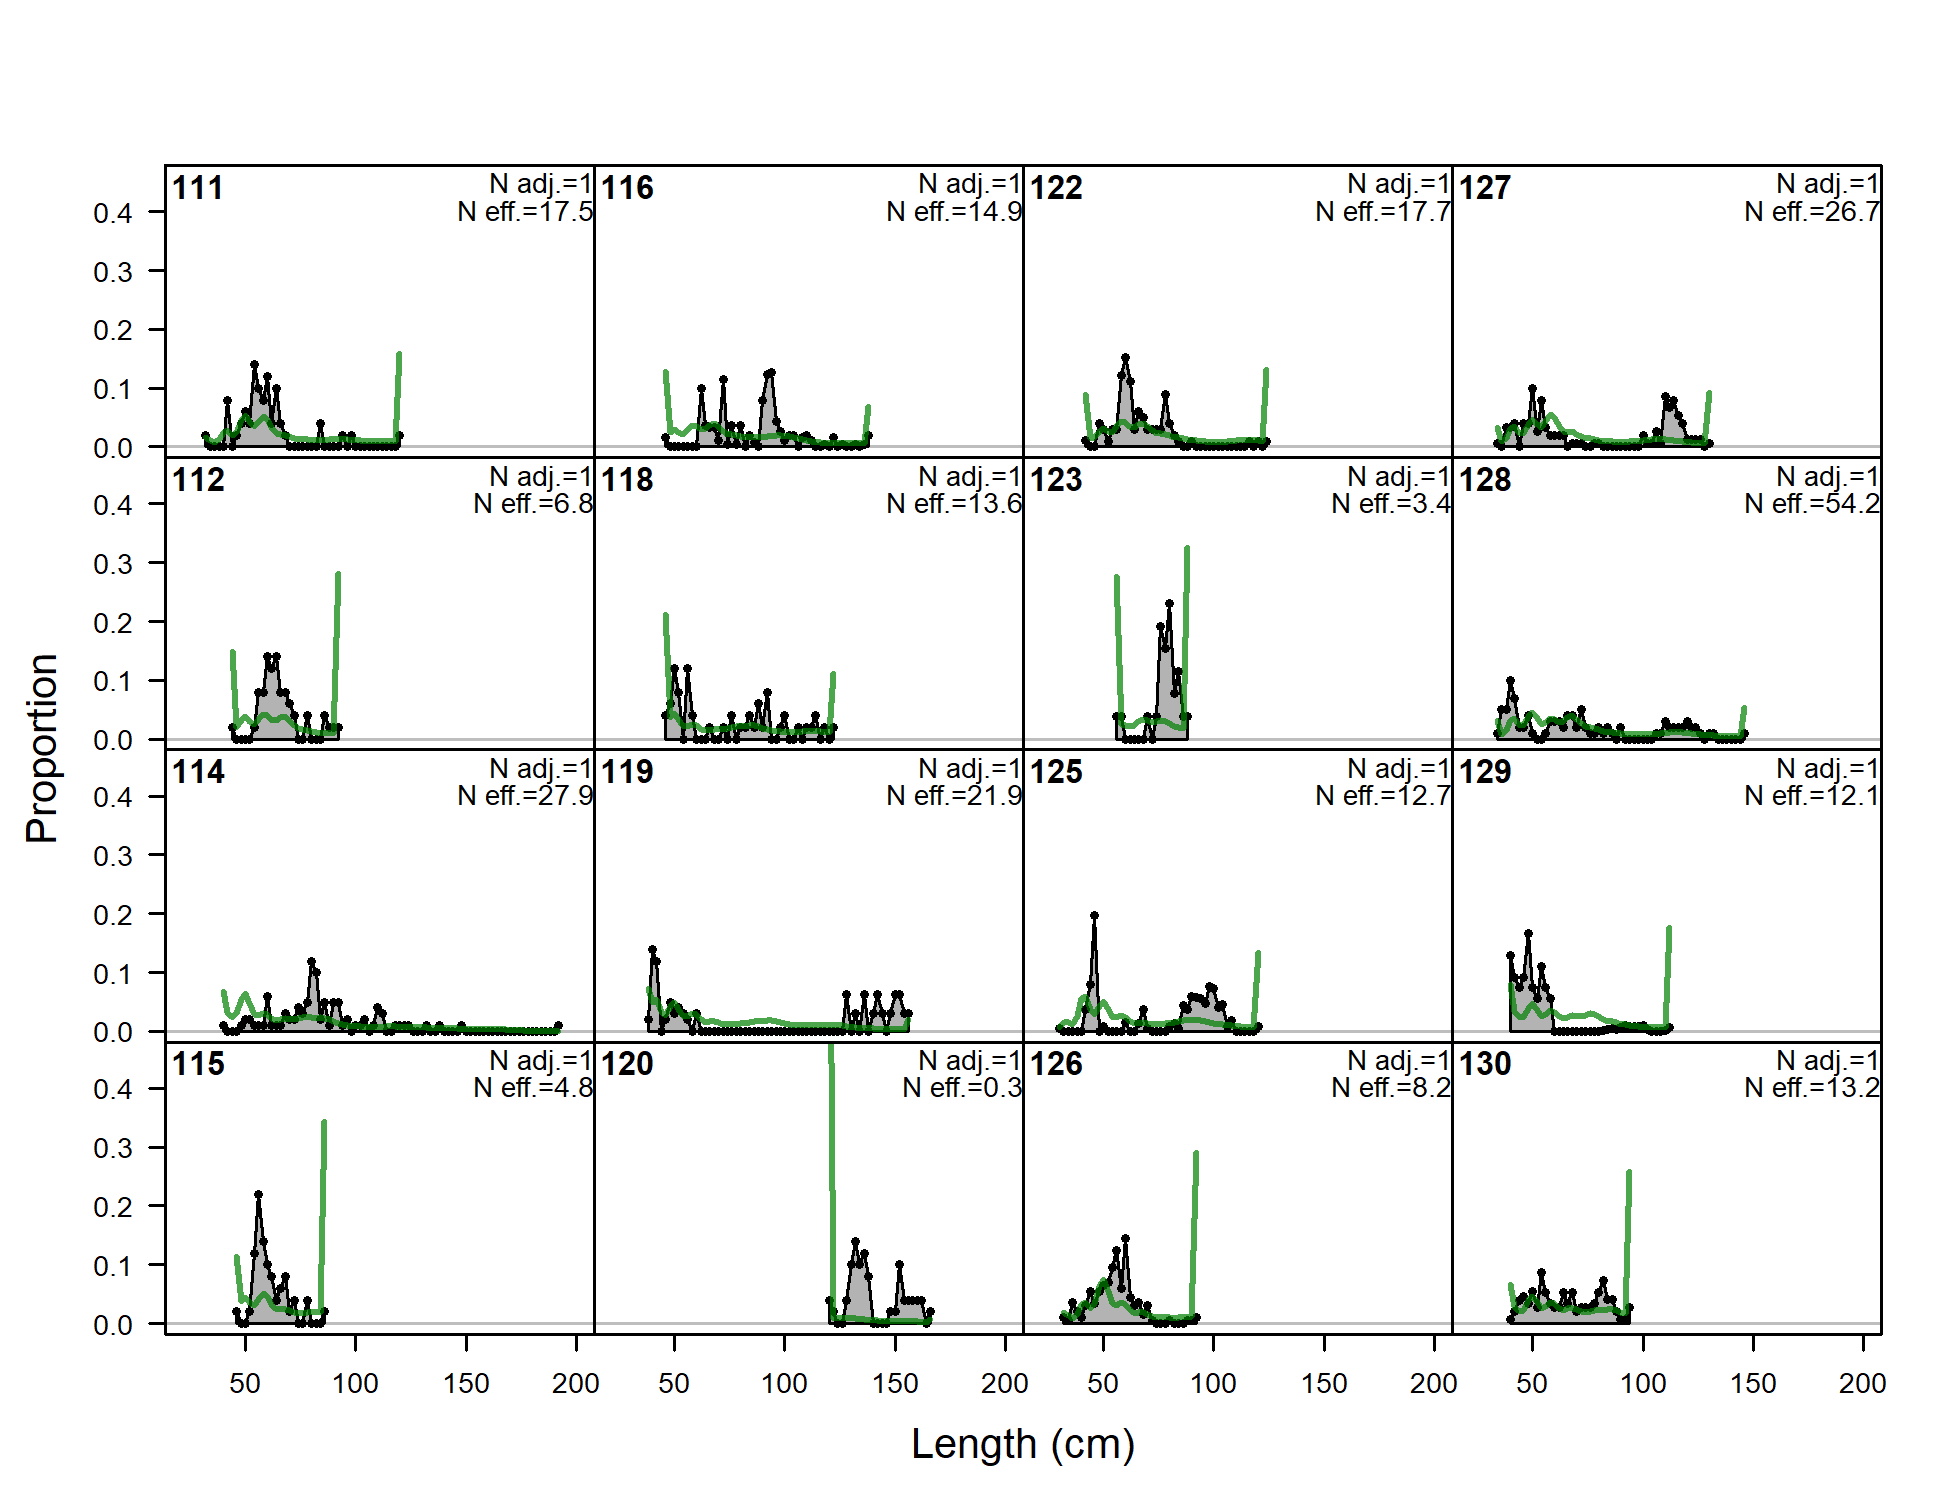
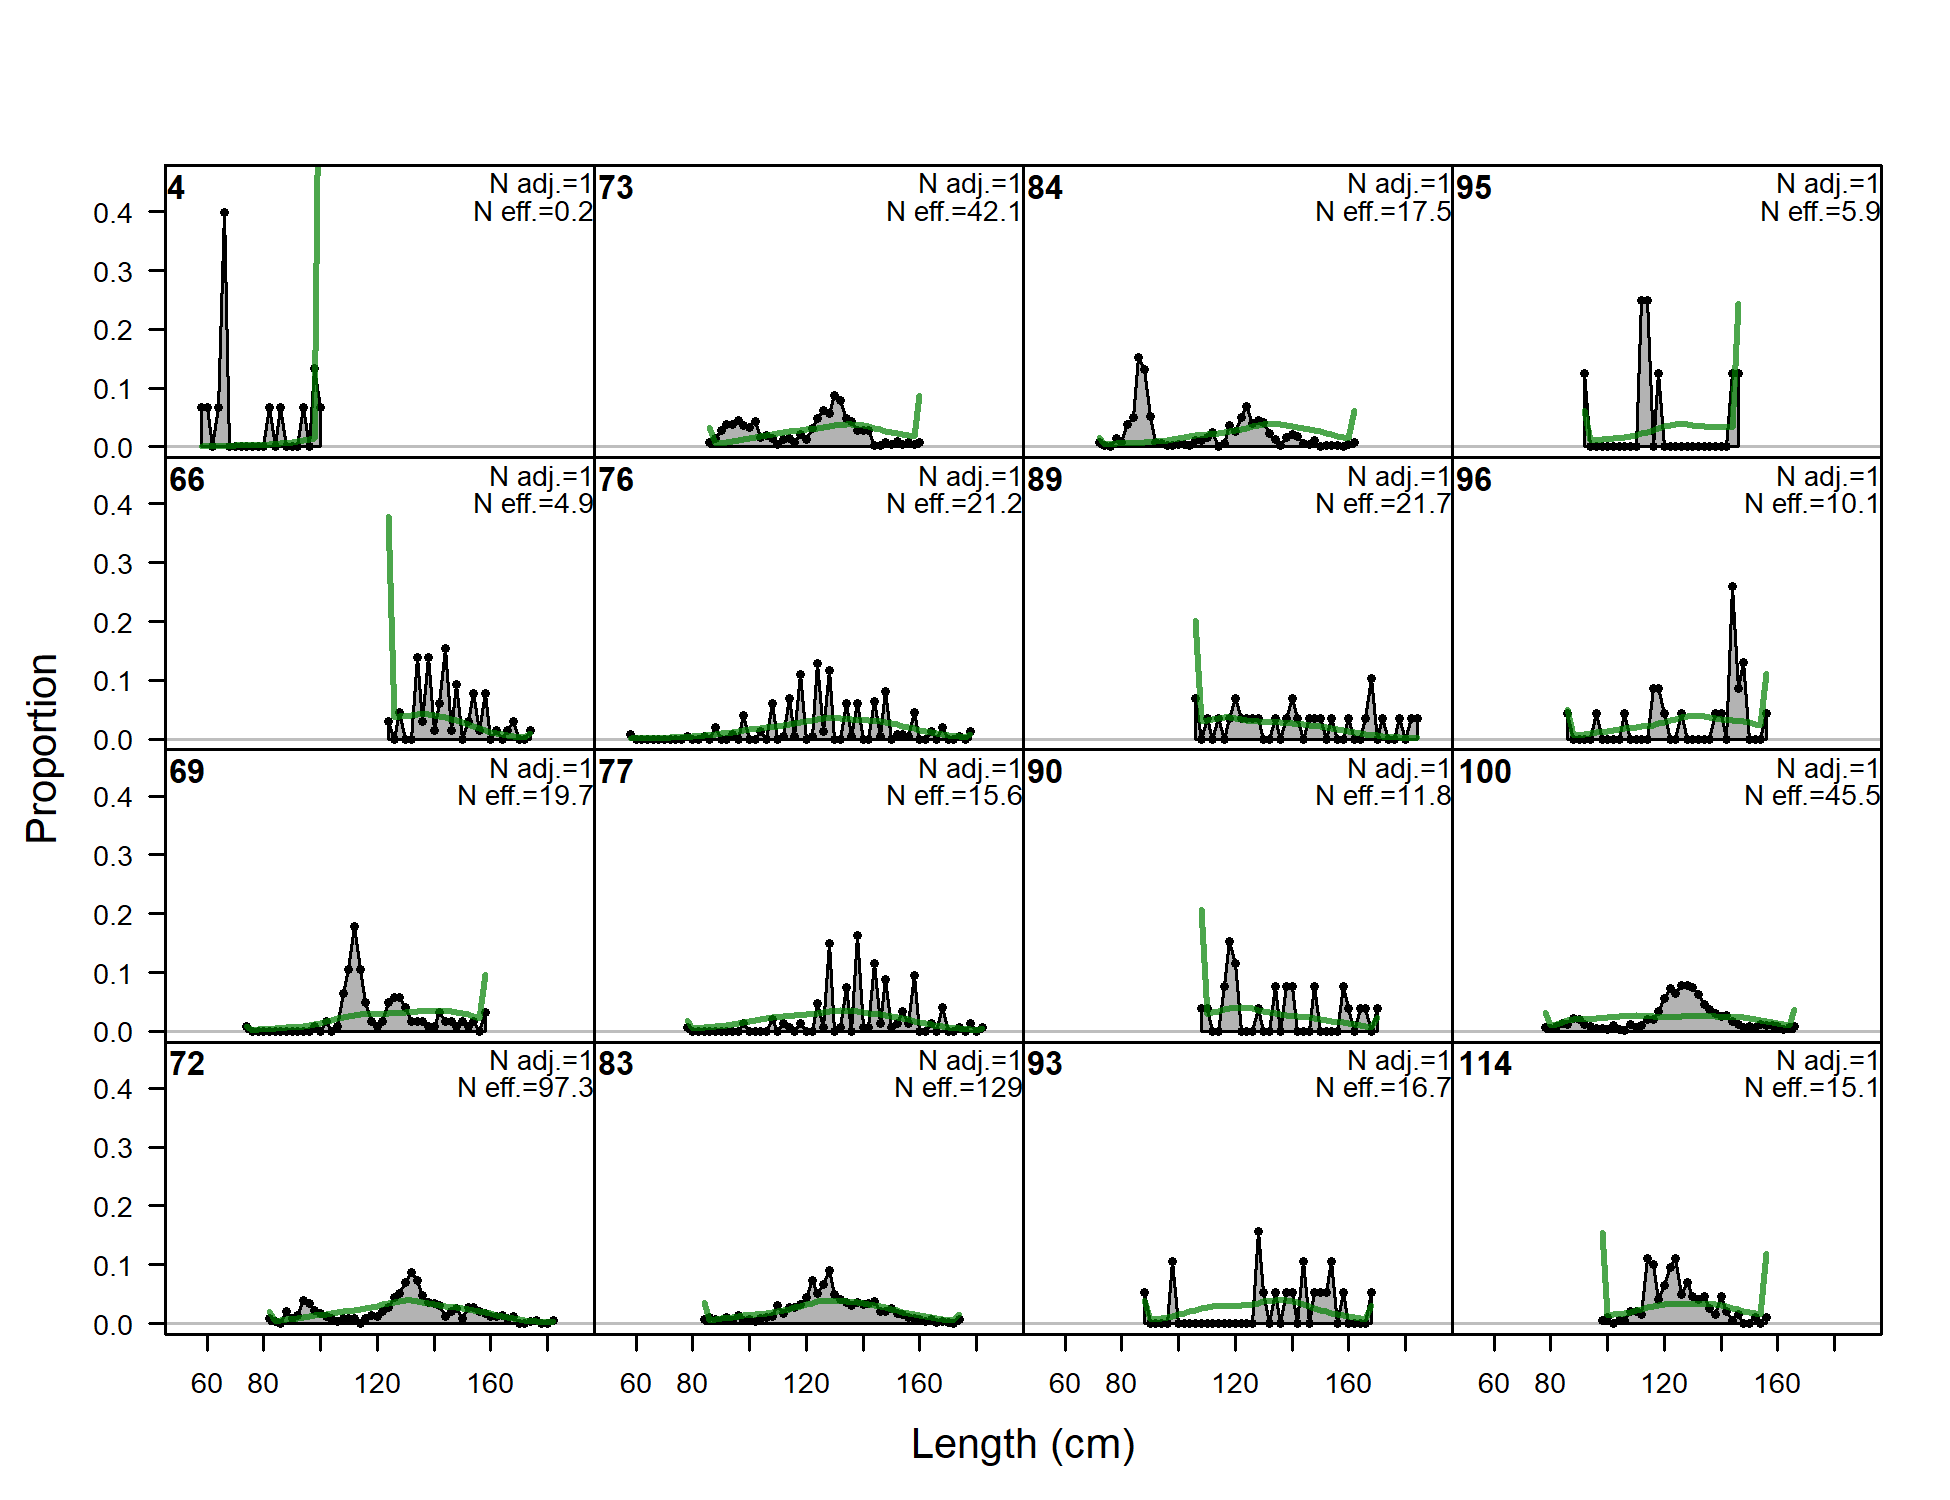
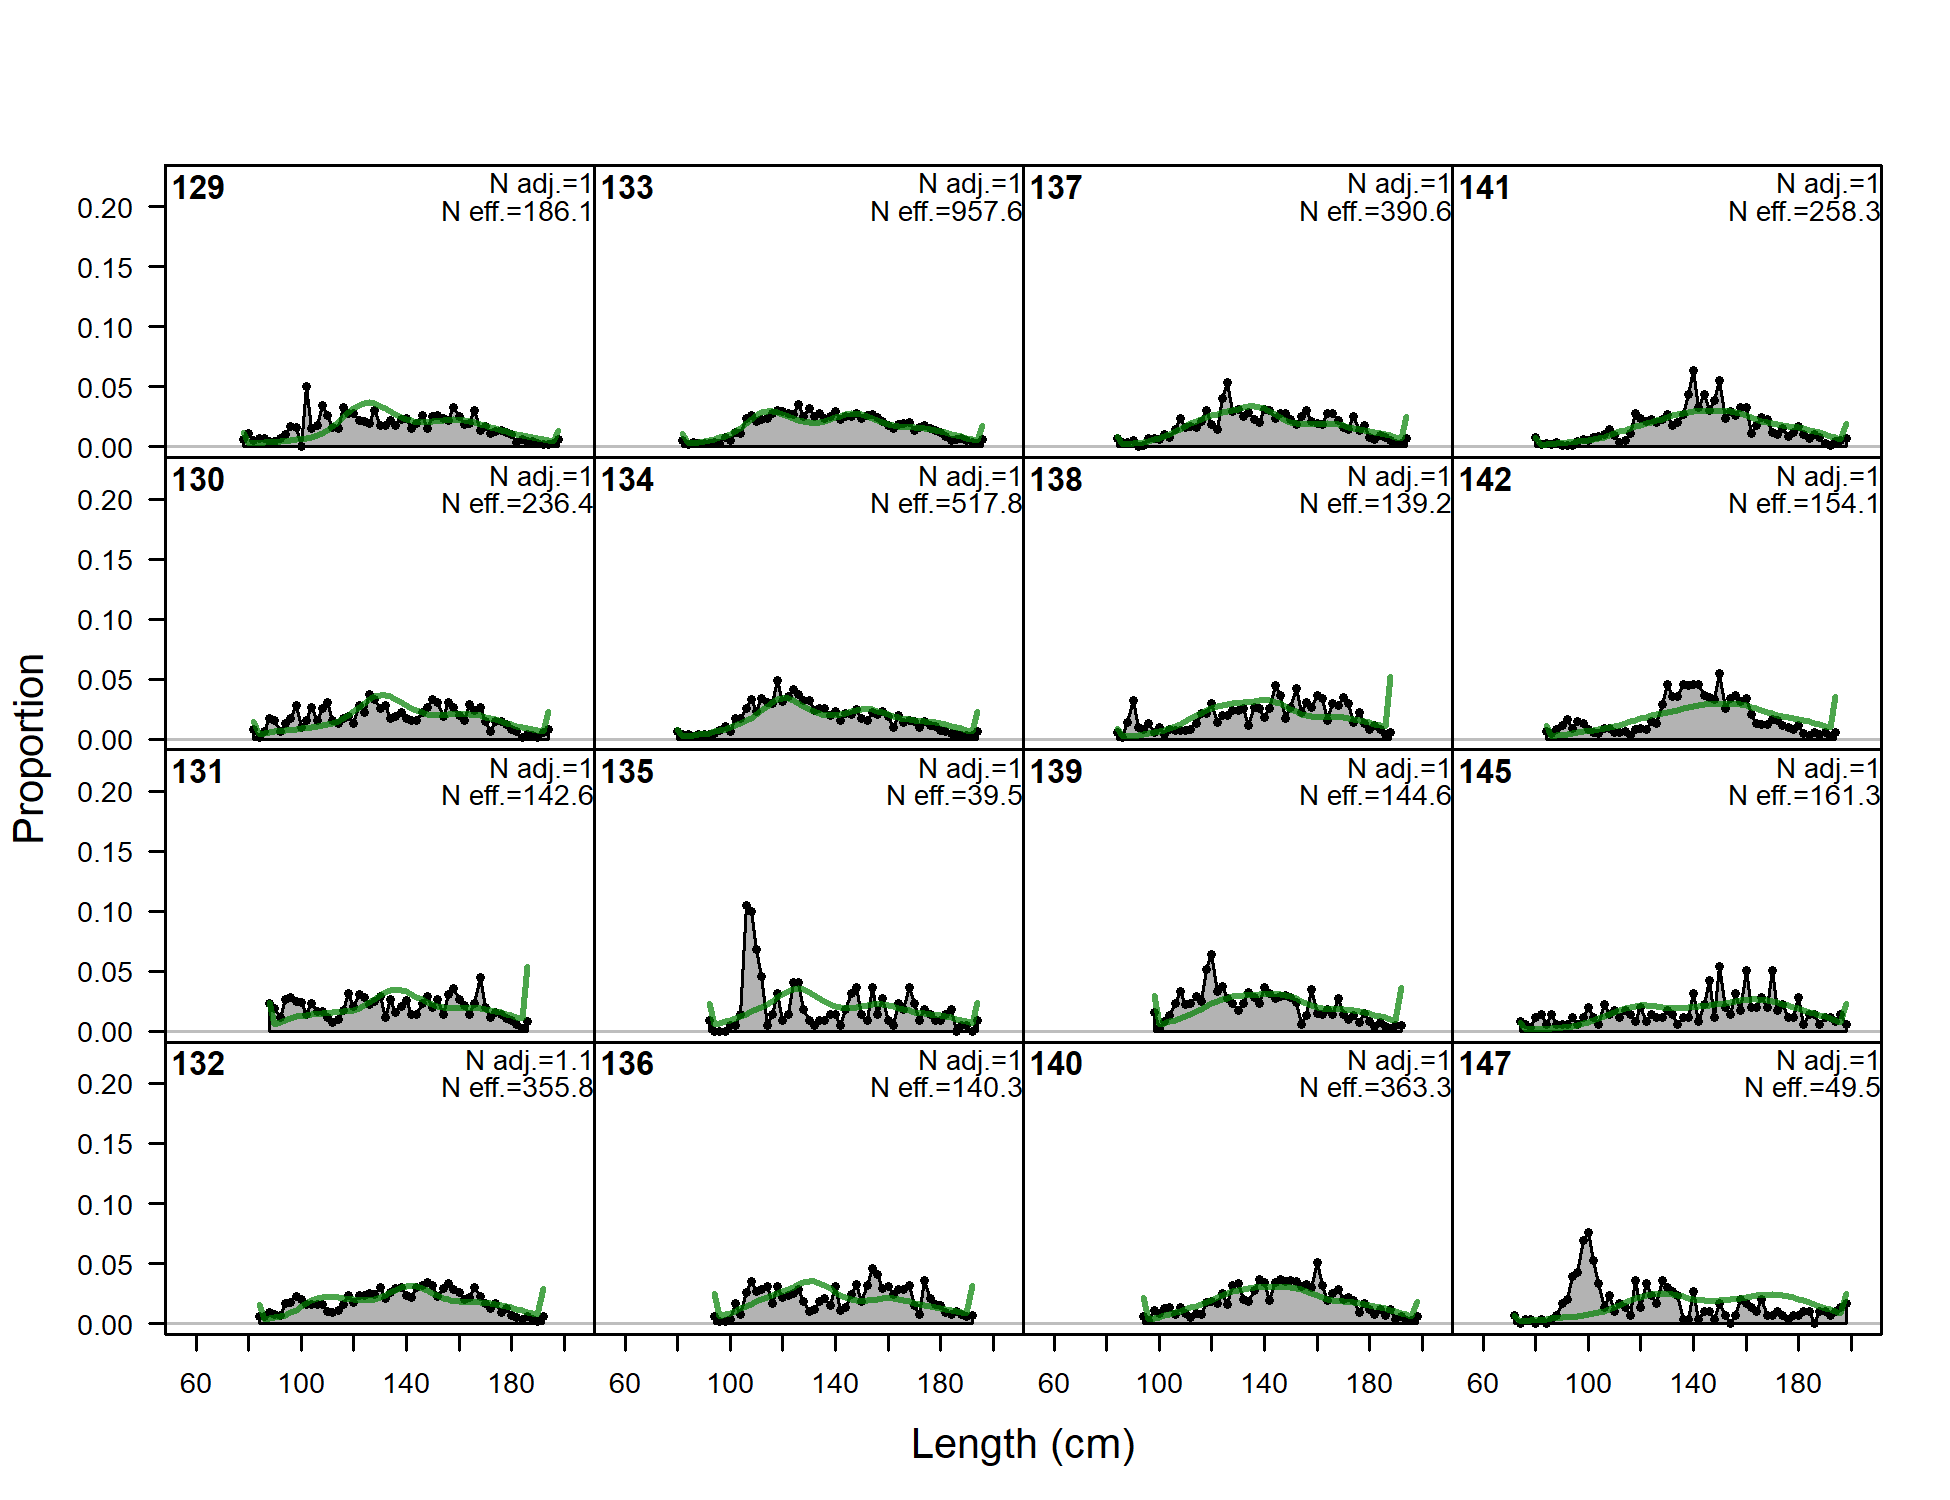
Length comps, whole catch, F7-NOA-DEL_late (plot 1 of 4).
'N adj.' is the input sample size after data-weighting adjustment.N eff. is the calculated effective sample size used in the McAllister-Iannelli tuning method.
file: comp_lenfit_flt7mkt0_page1.png
Length comps, whole catch, F7-NOA-DEL_late (plot 2 of 4)
file: comp_lenfit_flt7mkt0_page2.png
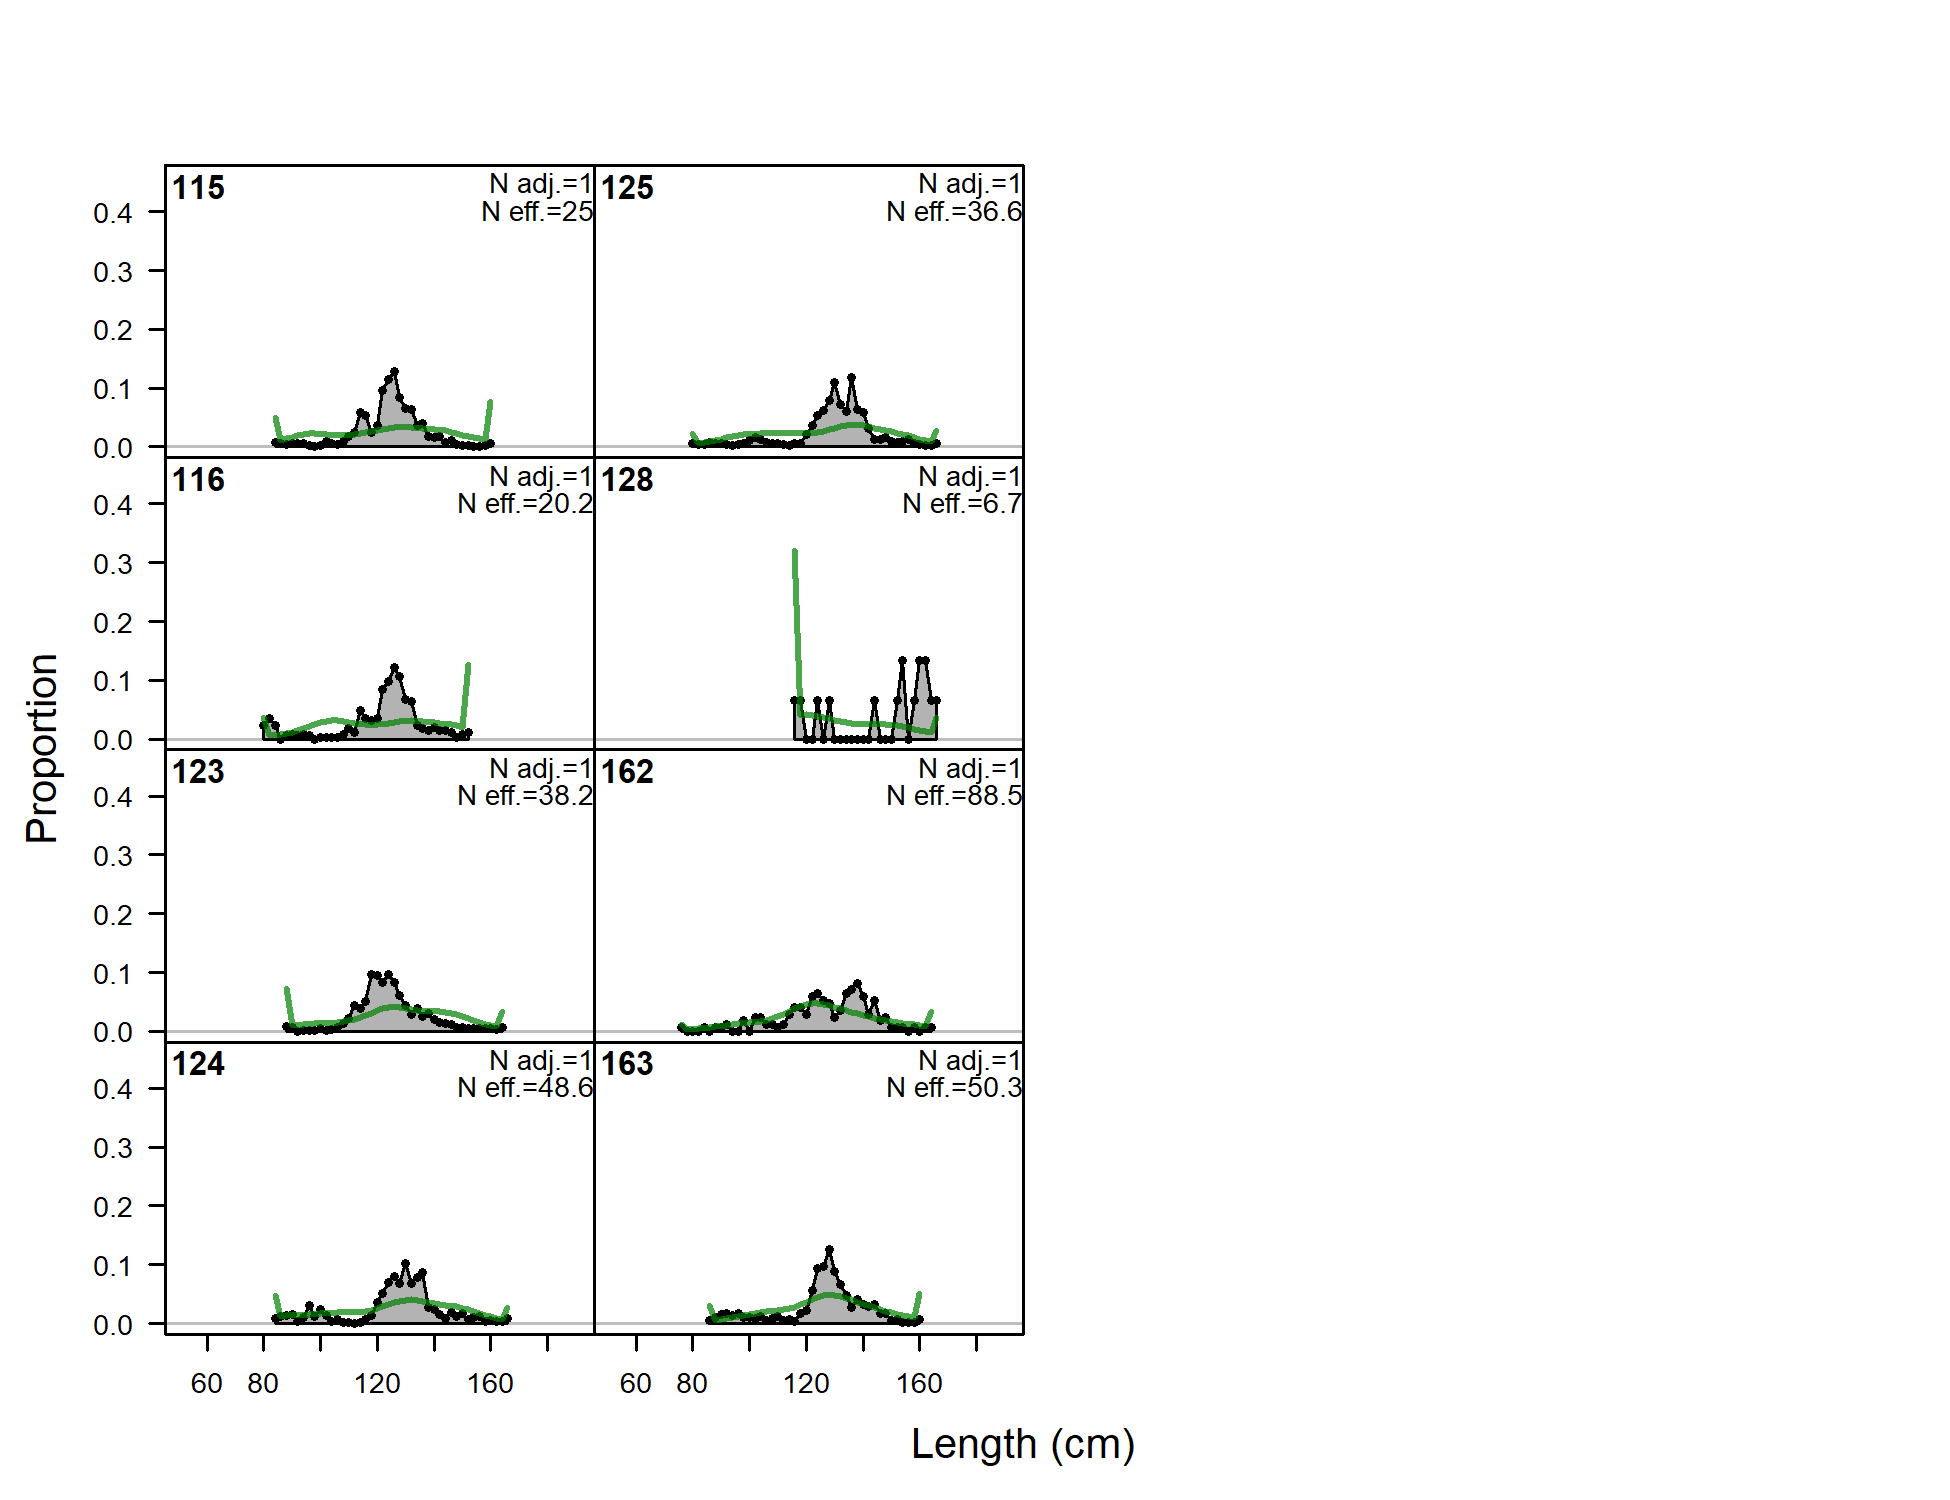
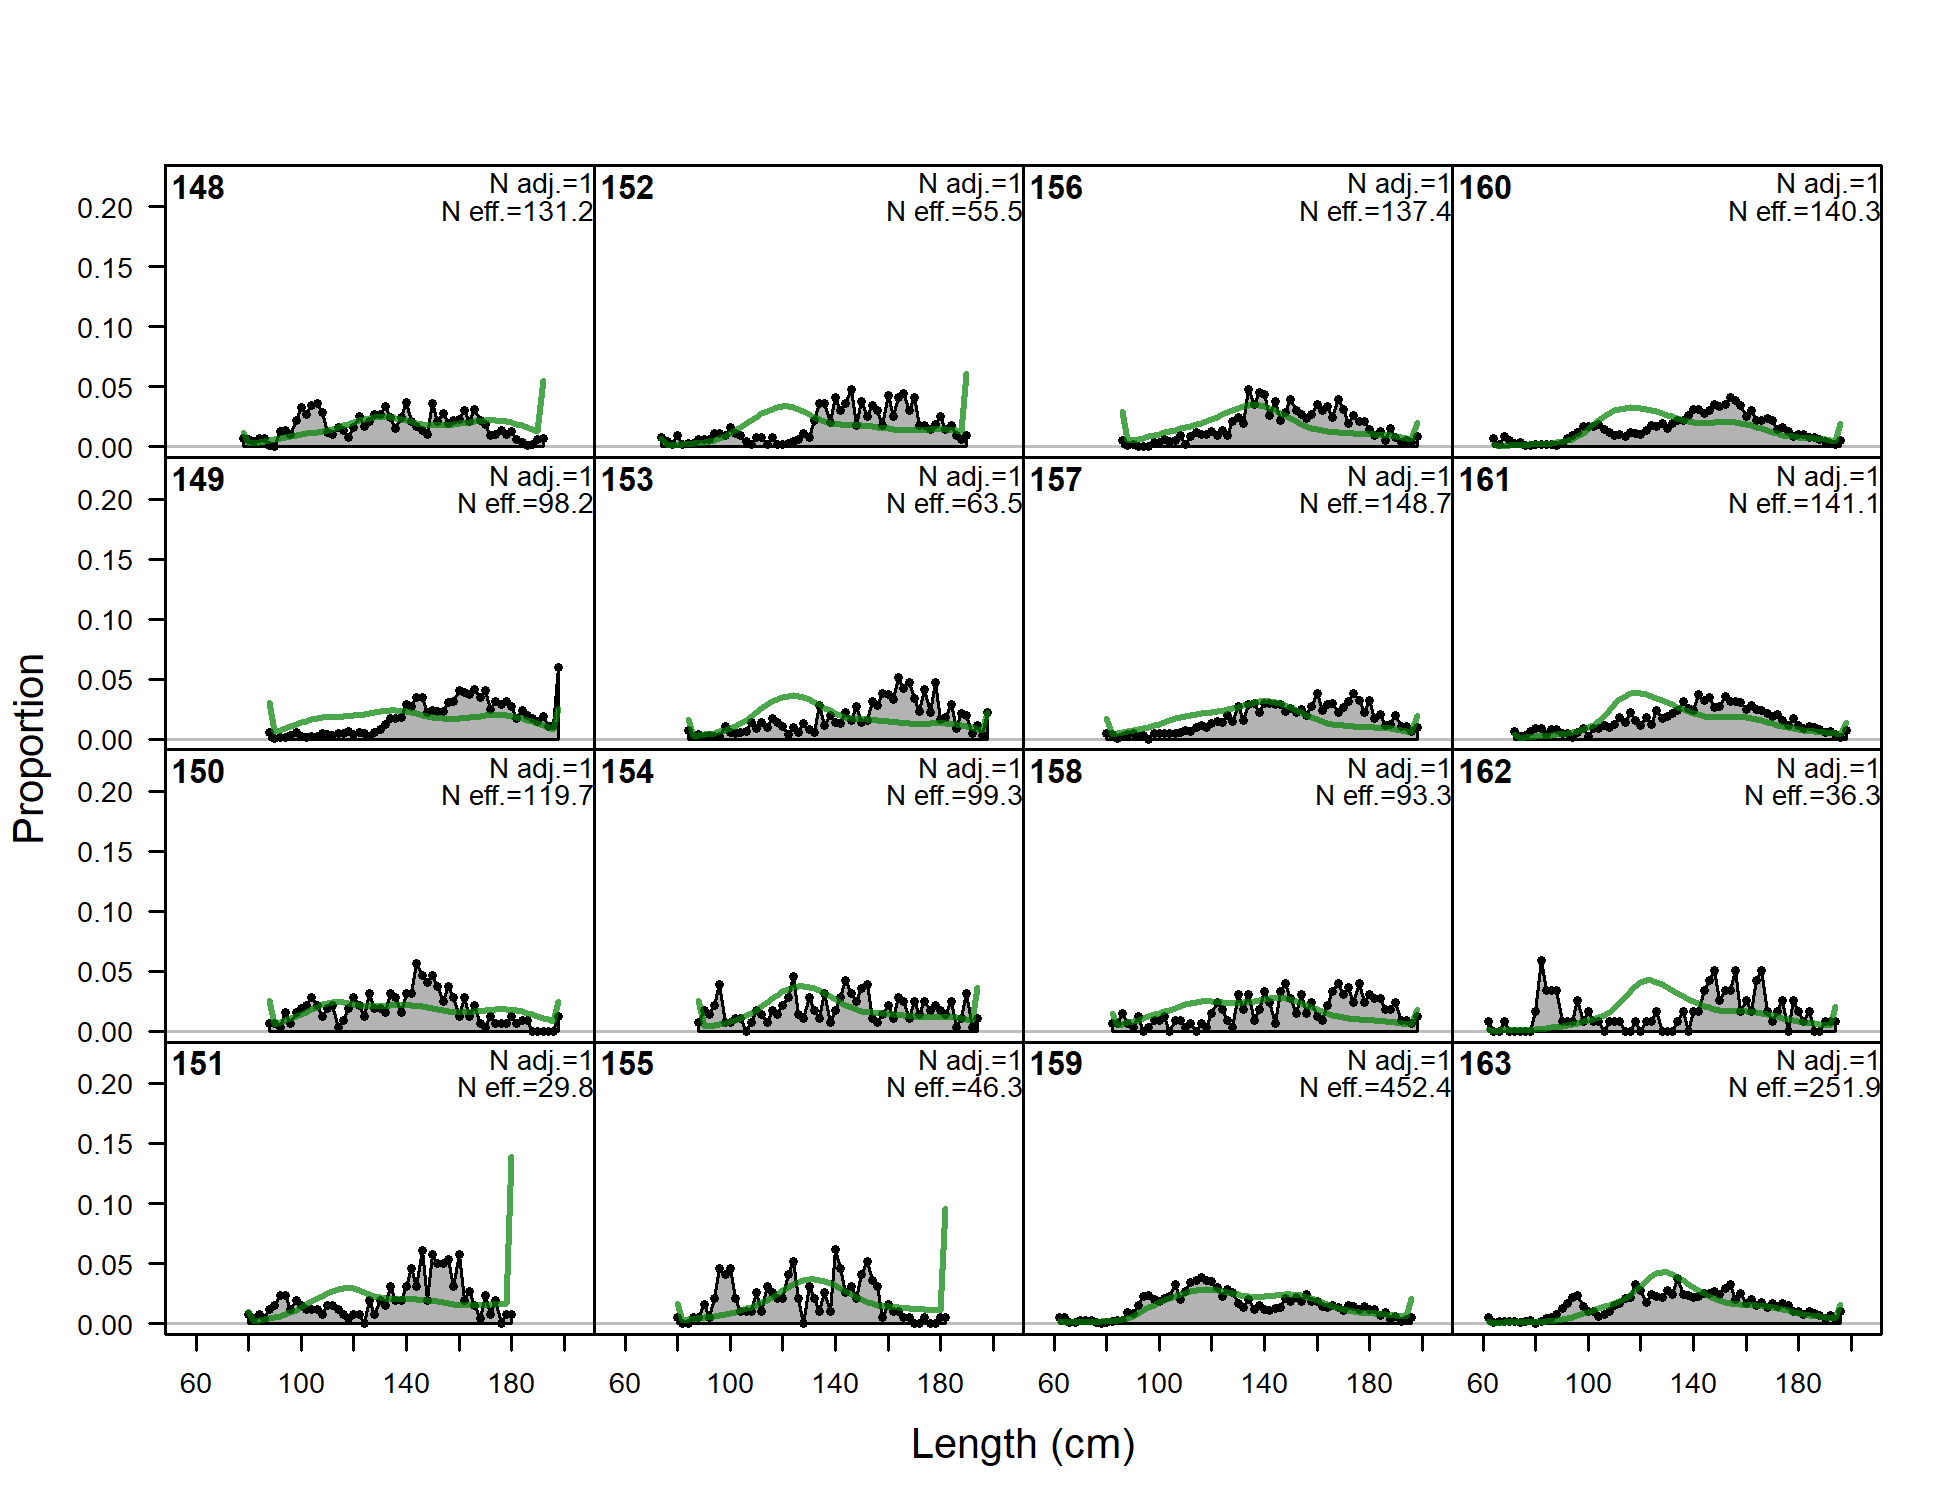
Length comps, whole catch, F7-NOA-DEL_late (plot 3 of 4)
file: comp_lenfit_flt7mkt0_page3.png
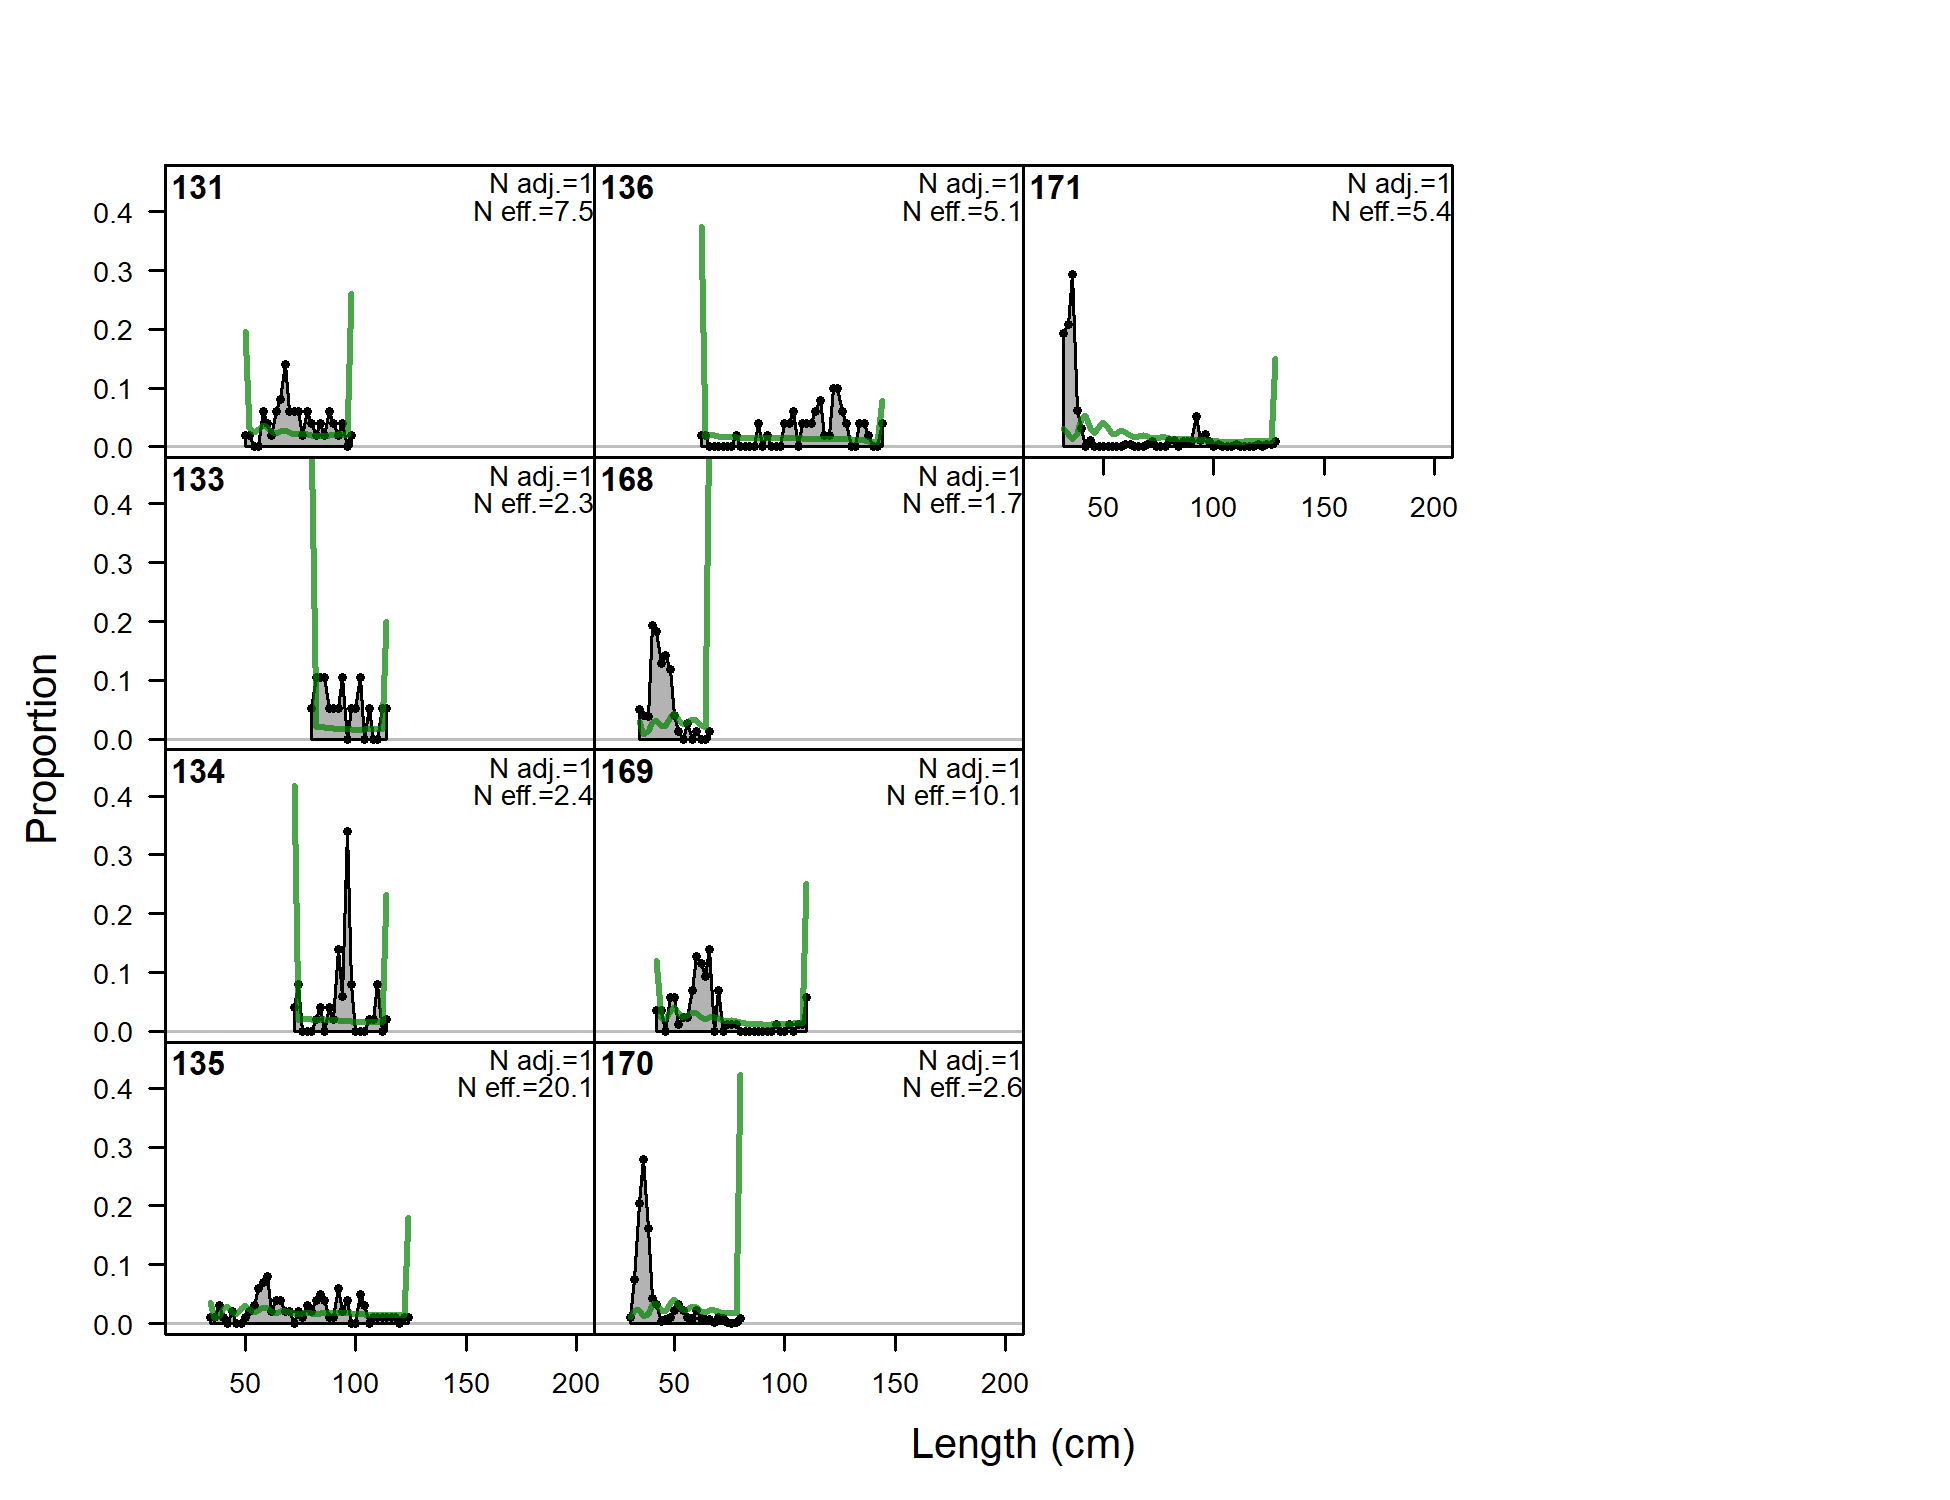
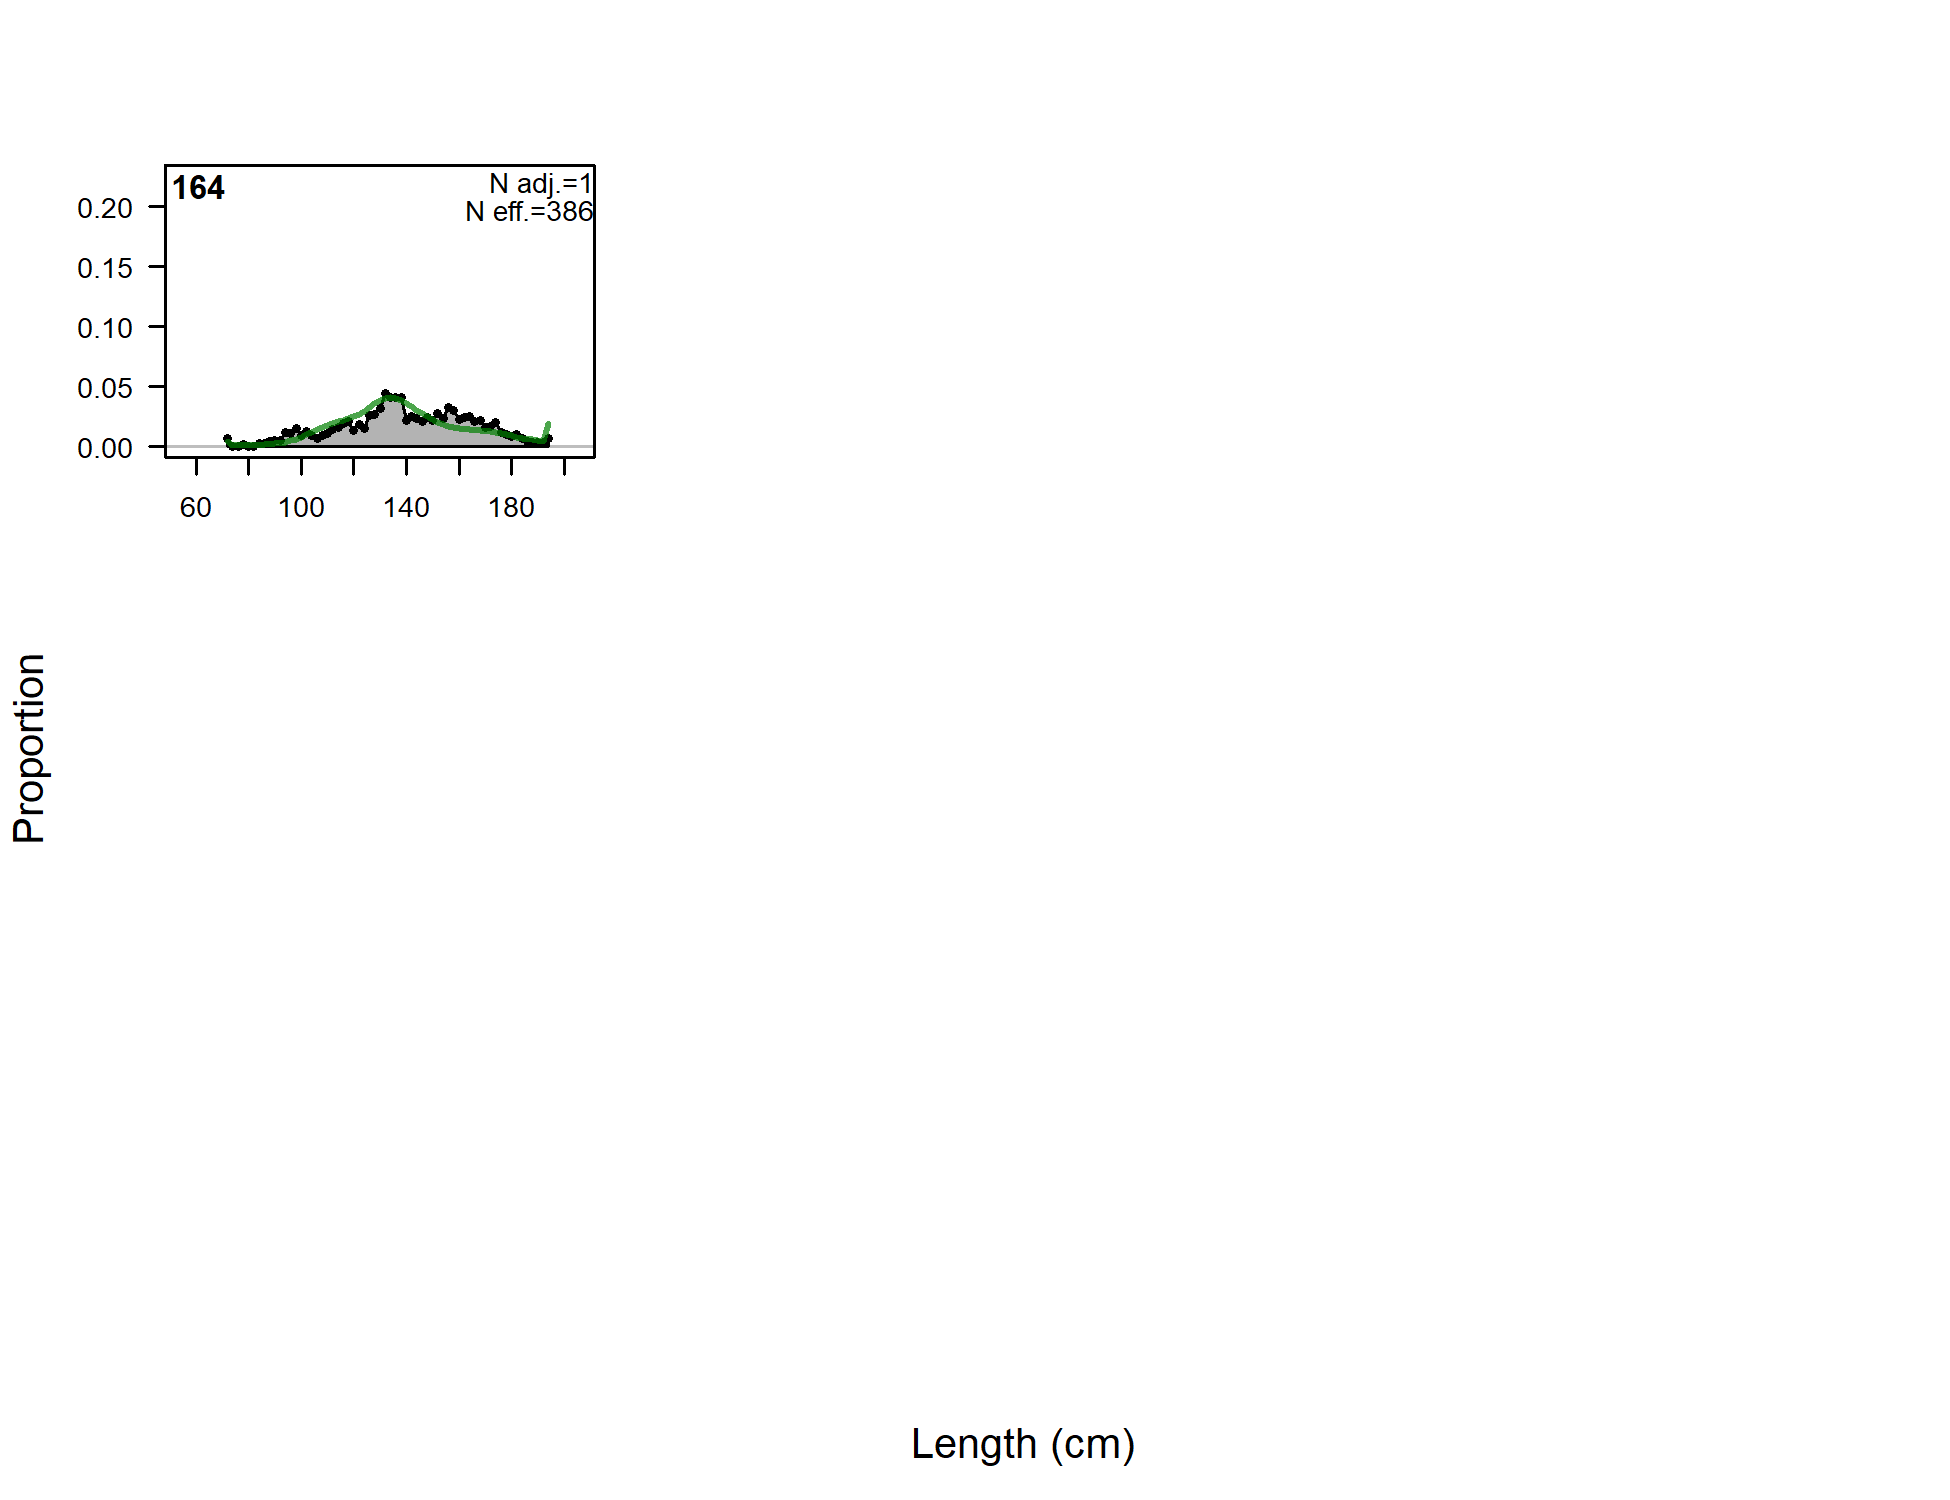
Length comps, whole catch, F7-NOA-DEL_late (plot 4 of 4)
file: comp_lenfit_flt7mkt0_page4.png
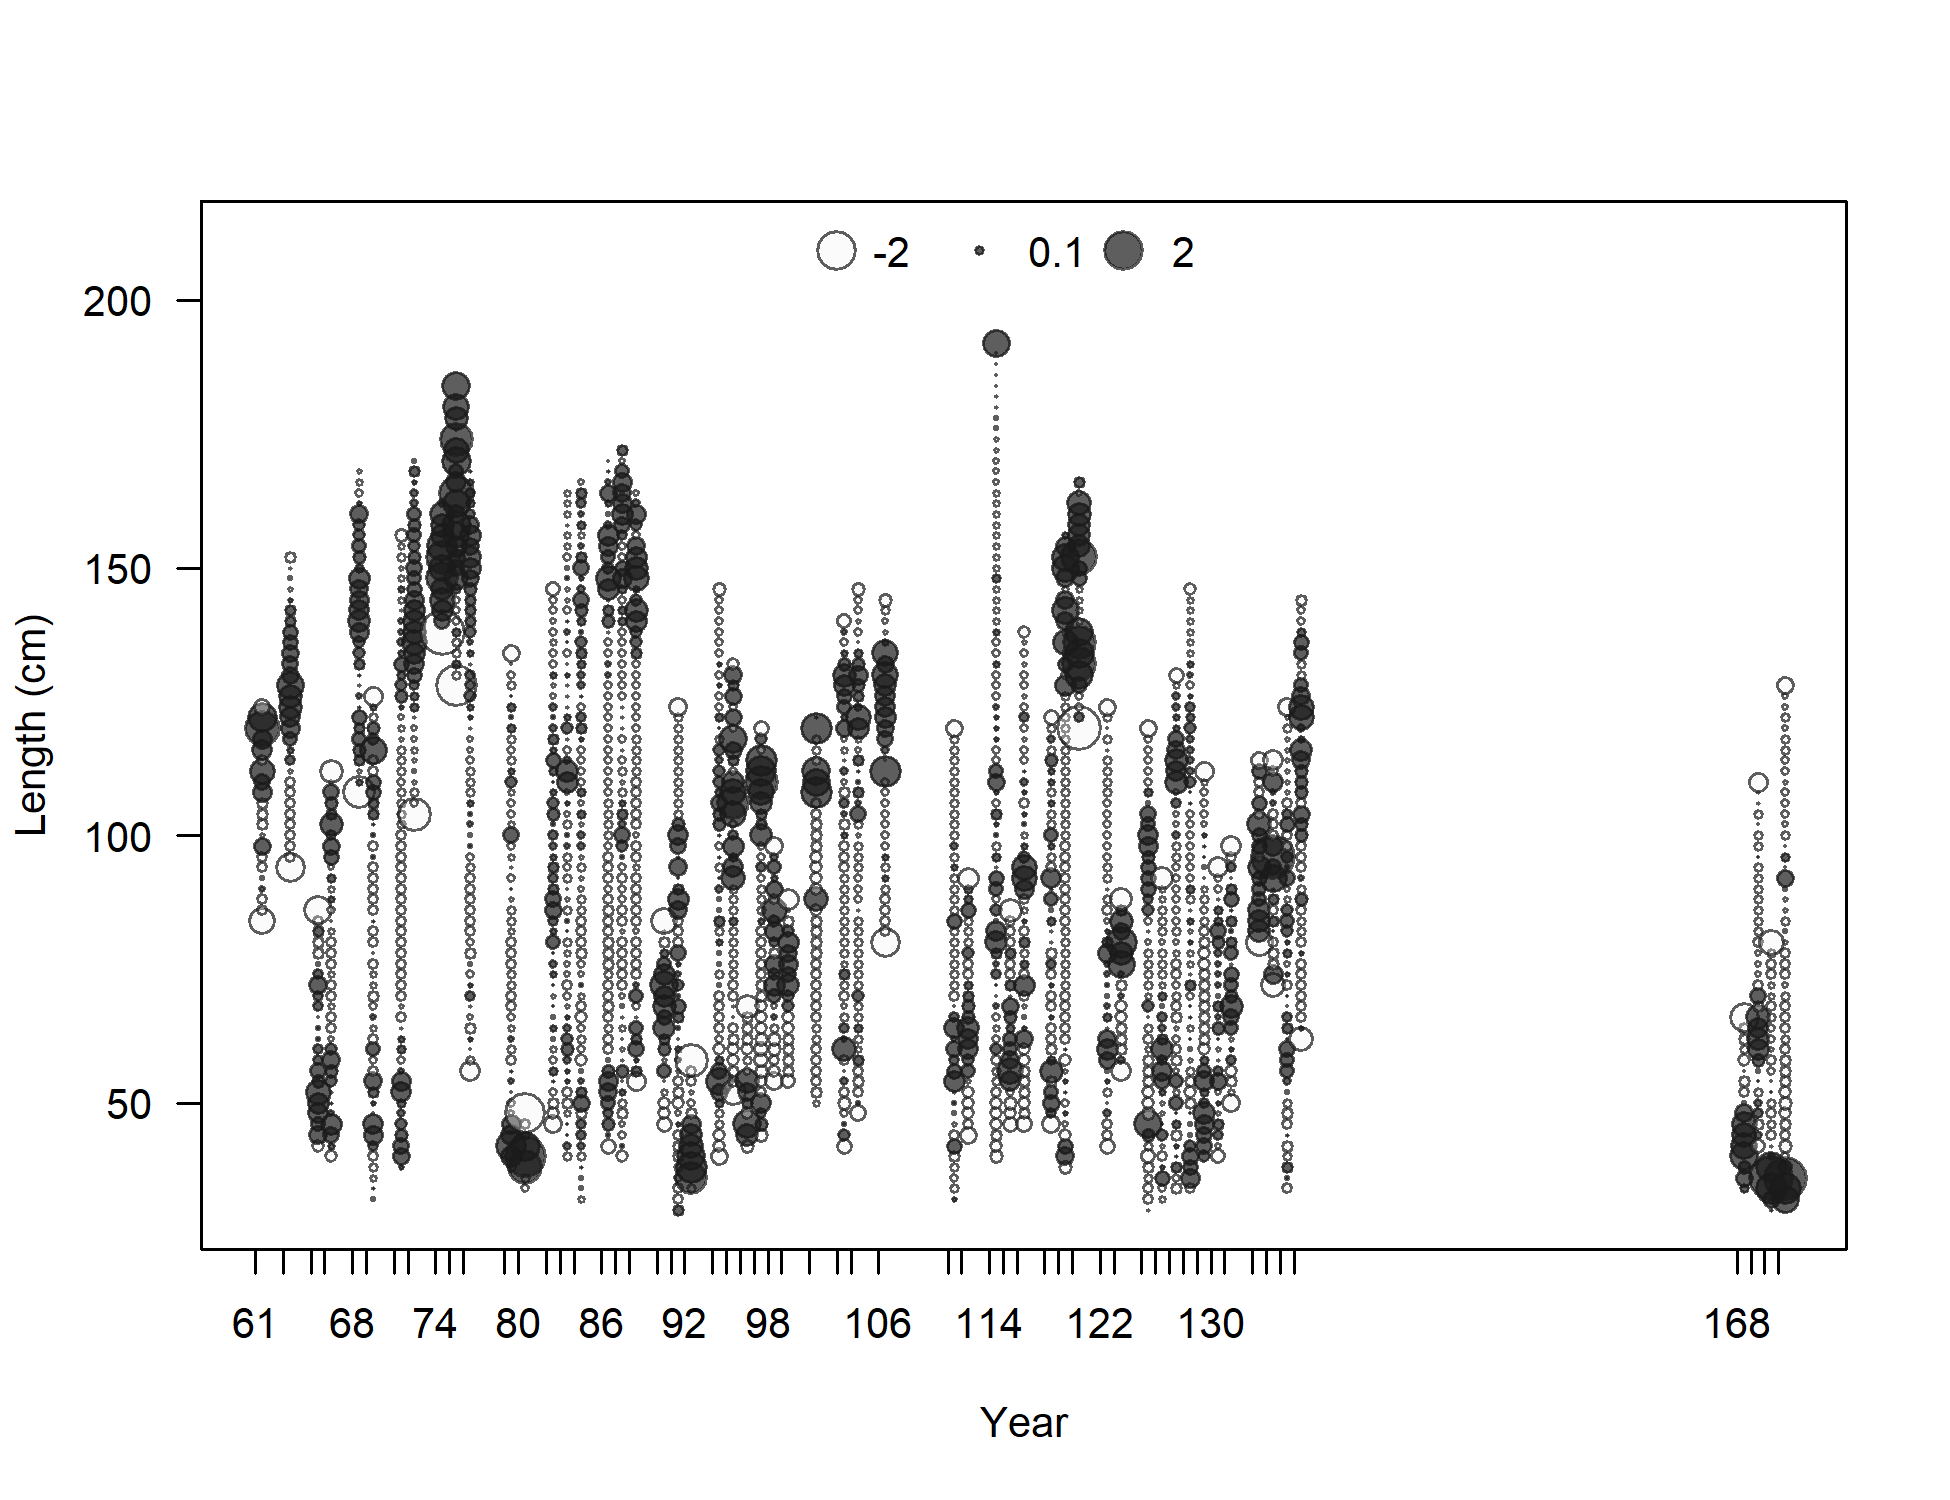
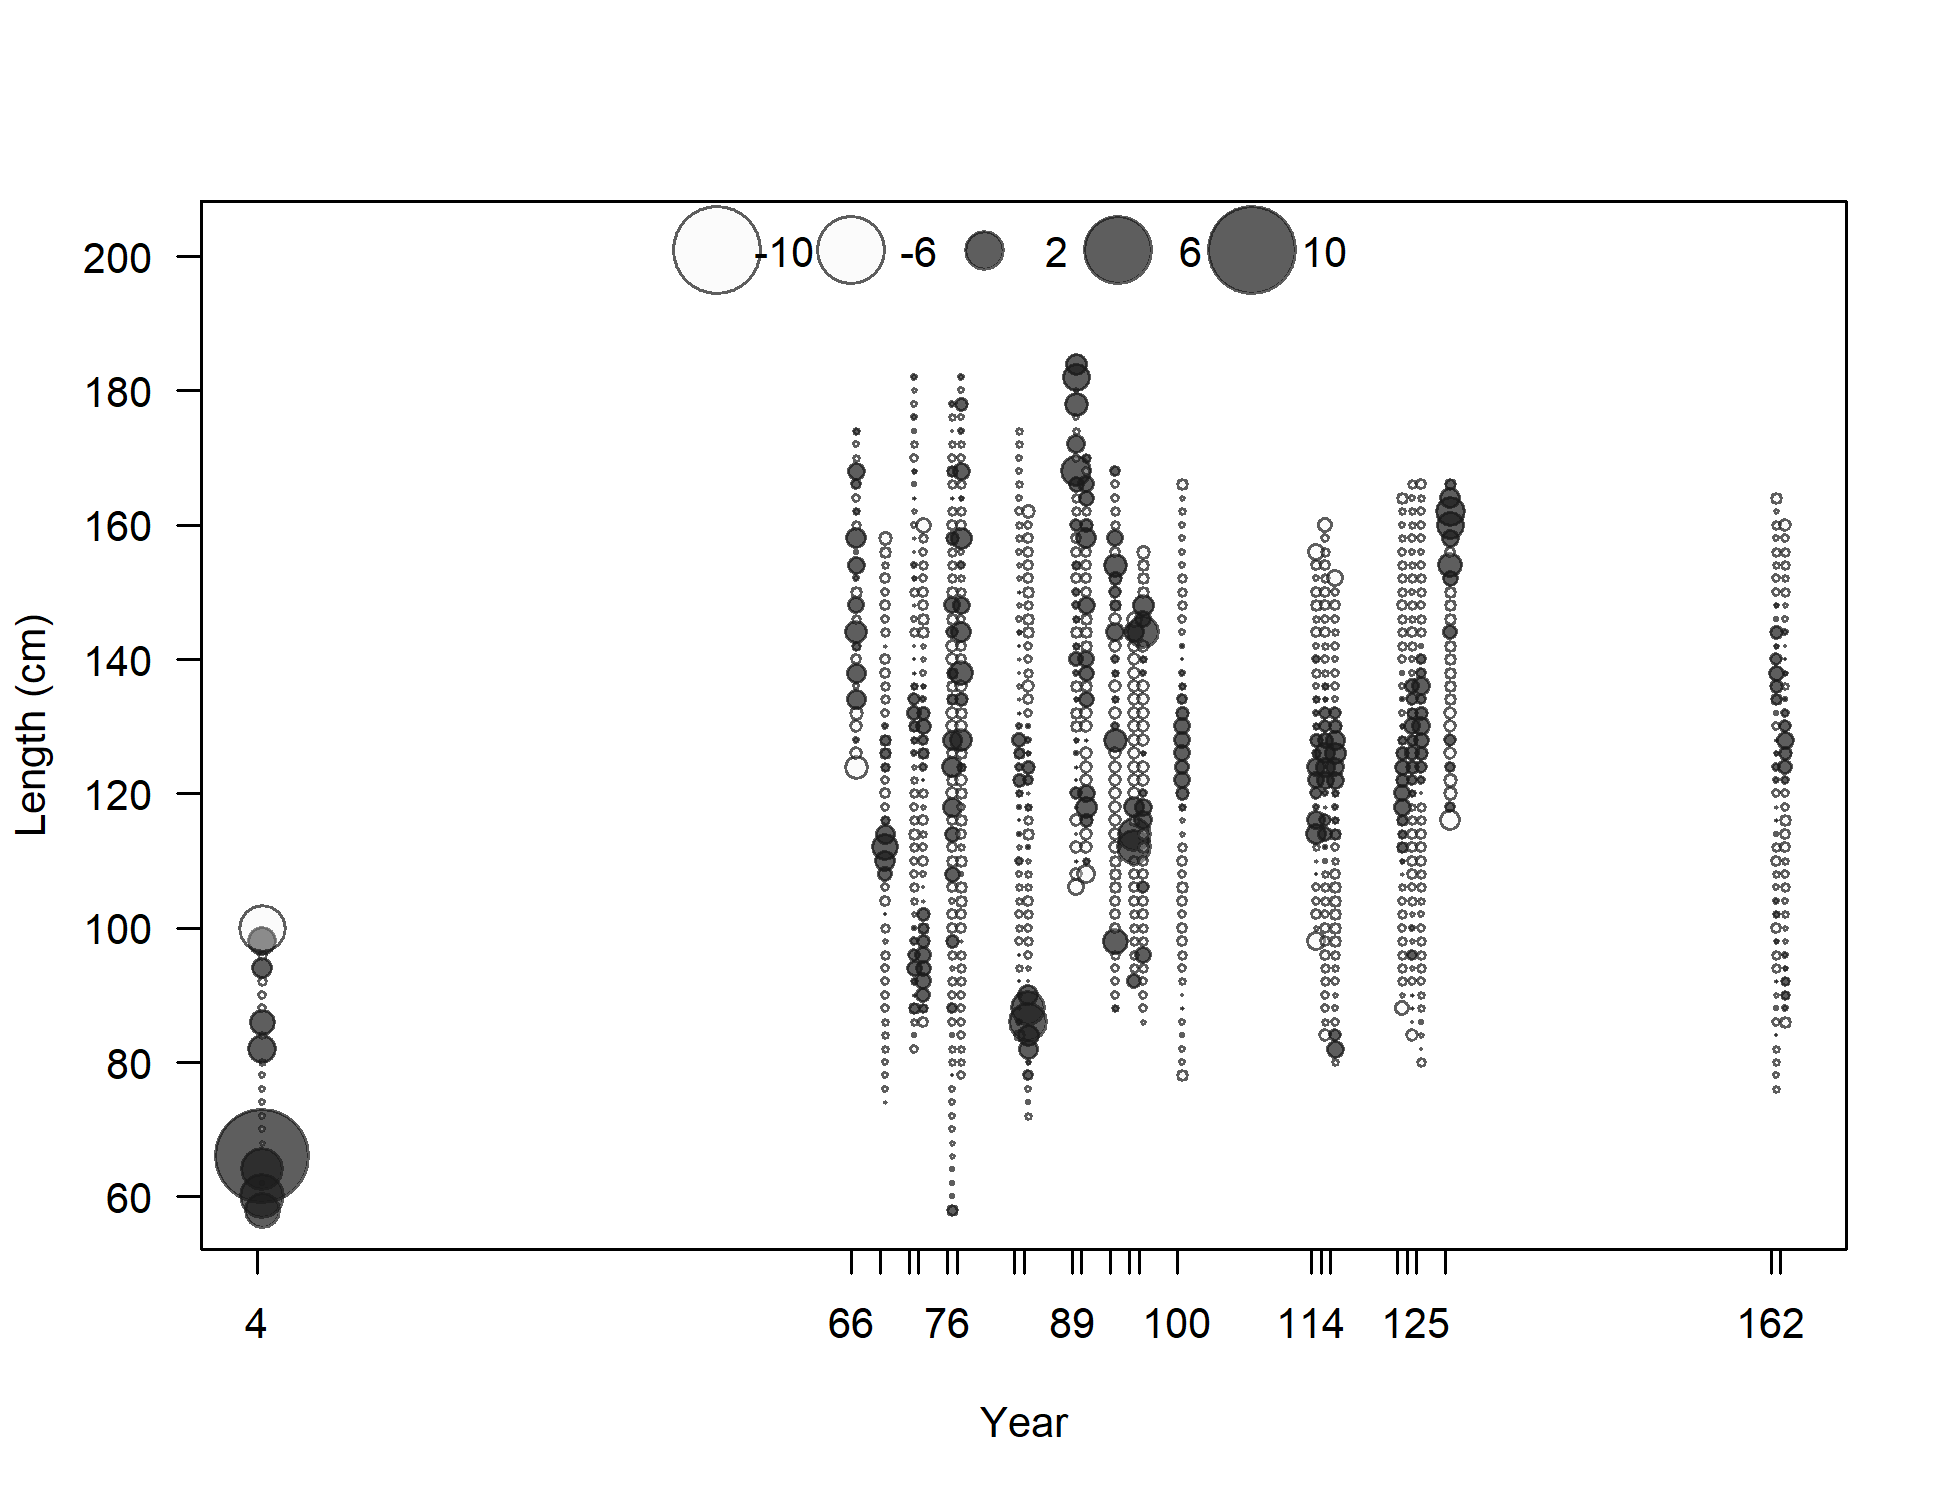
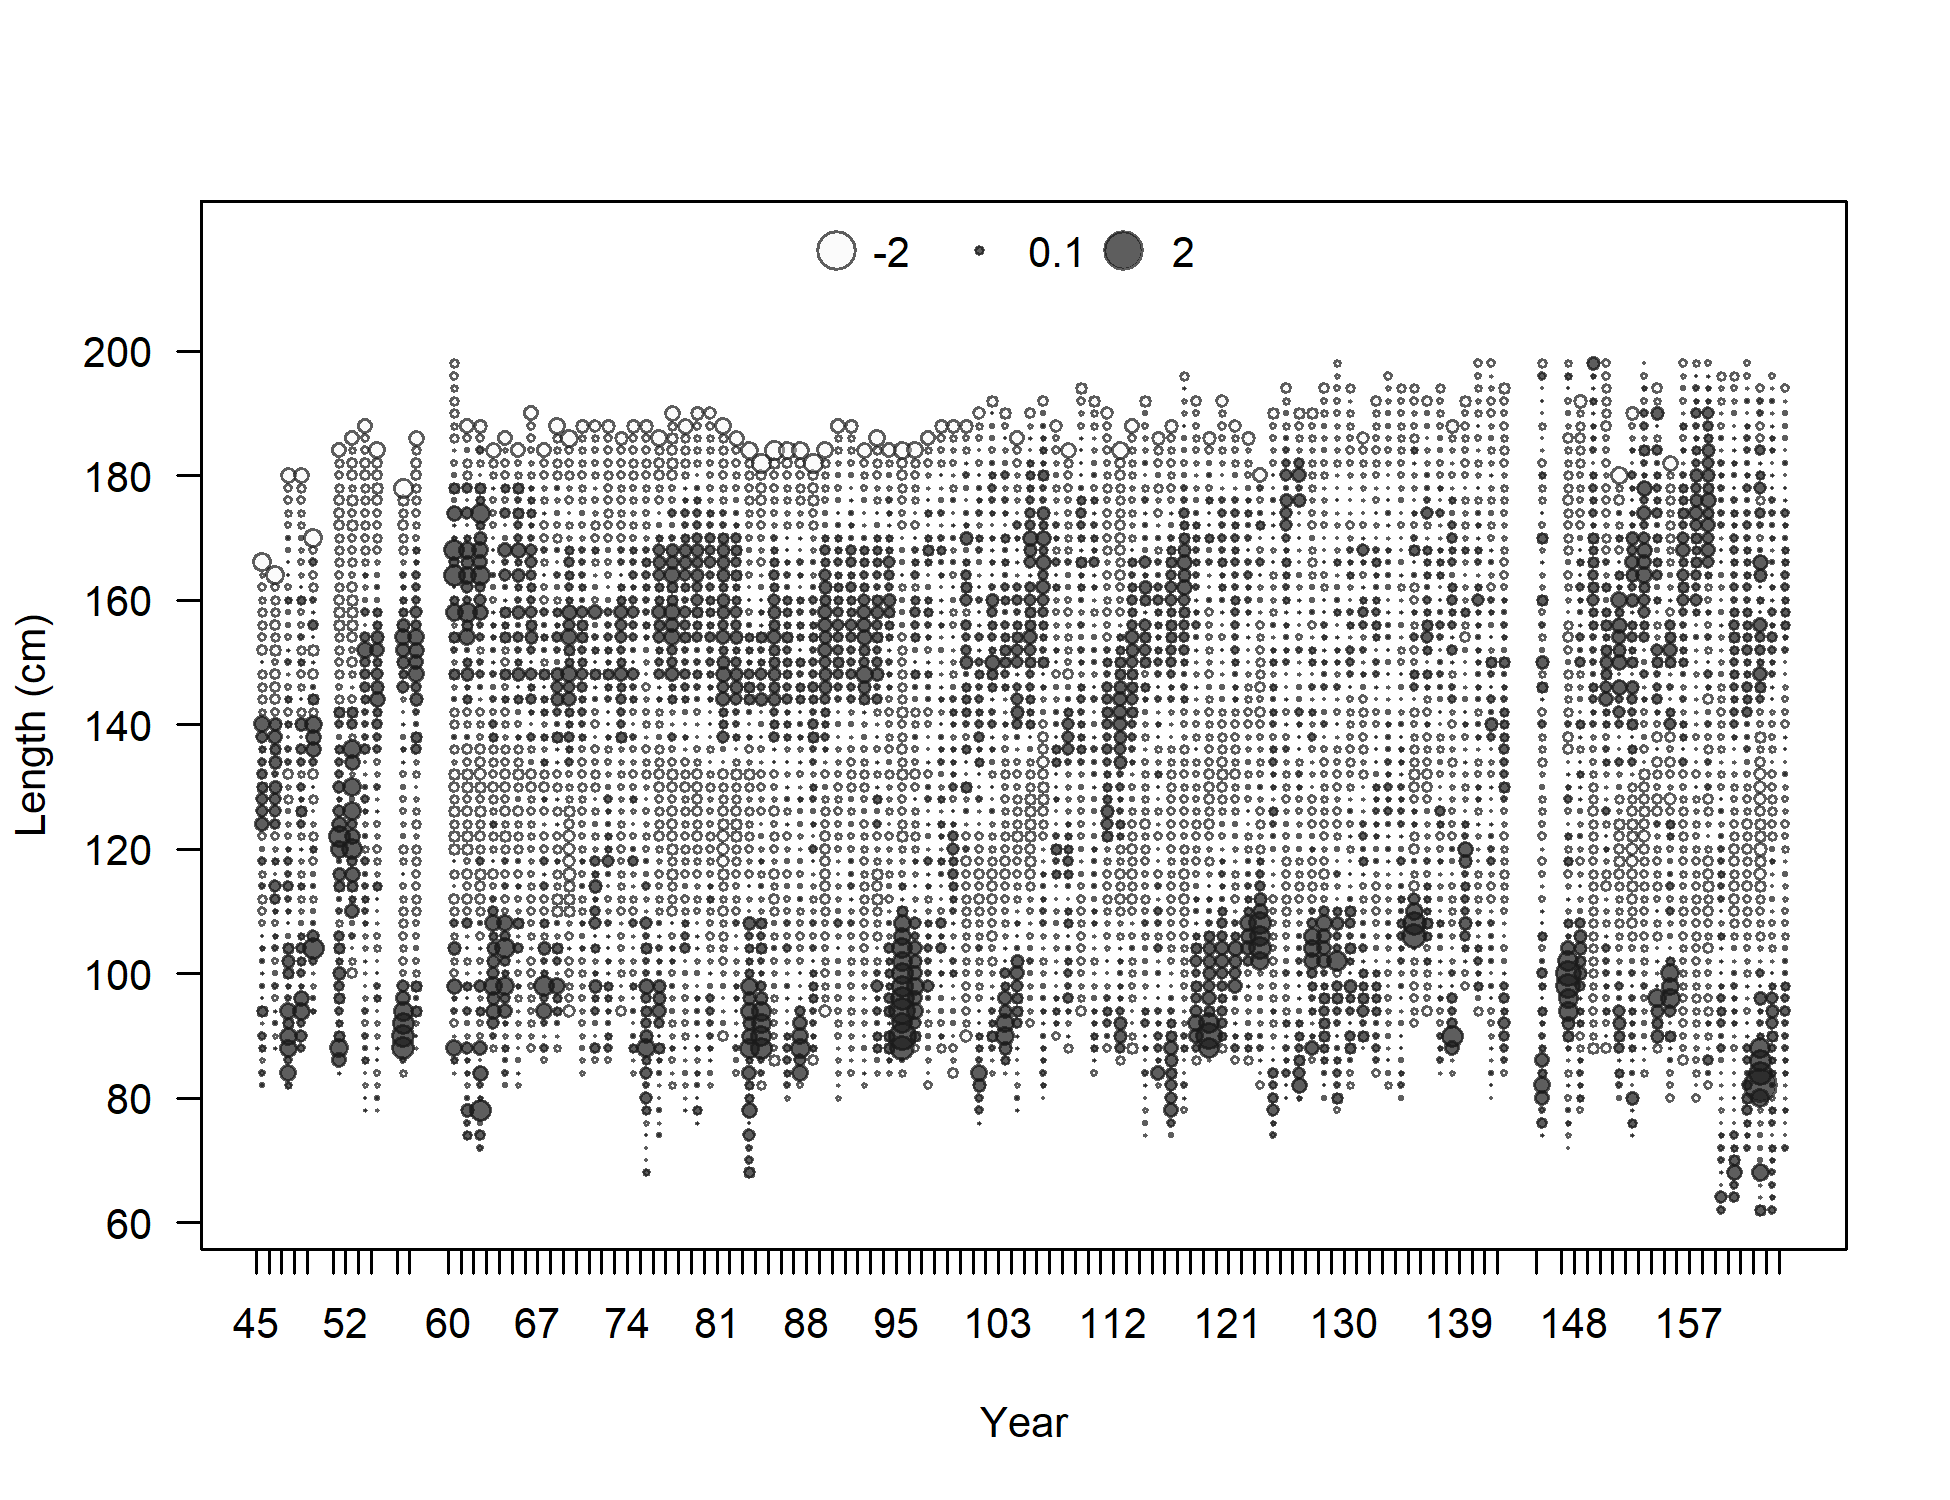
Pearson residuals, whole catch, F7-NOA-DEL_late (max=2.5) (plot 4 of 4)
Closed bubbles are positive residuals (observed > expected) and open bubbles are negative residuals (observed < expected).
file: comp_lenfit_residsflt7mkt0_page4.png
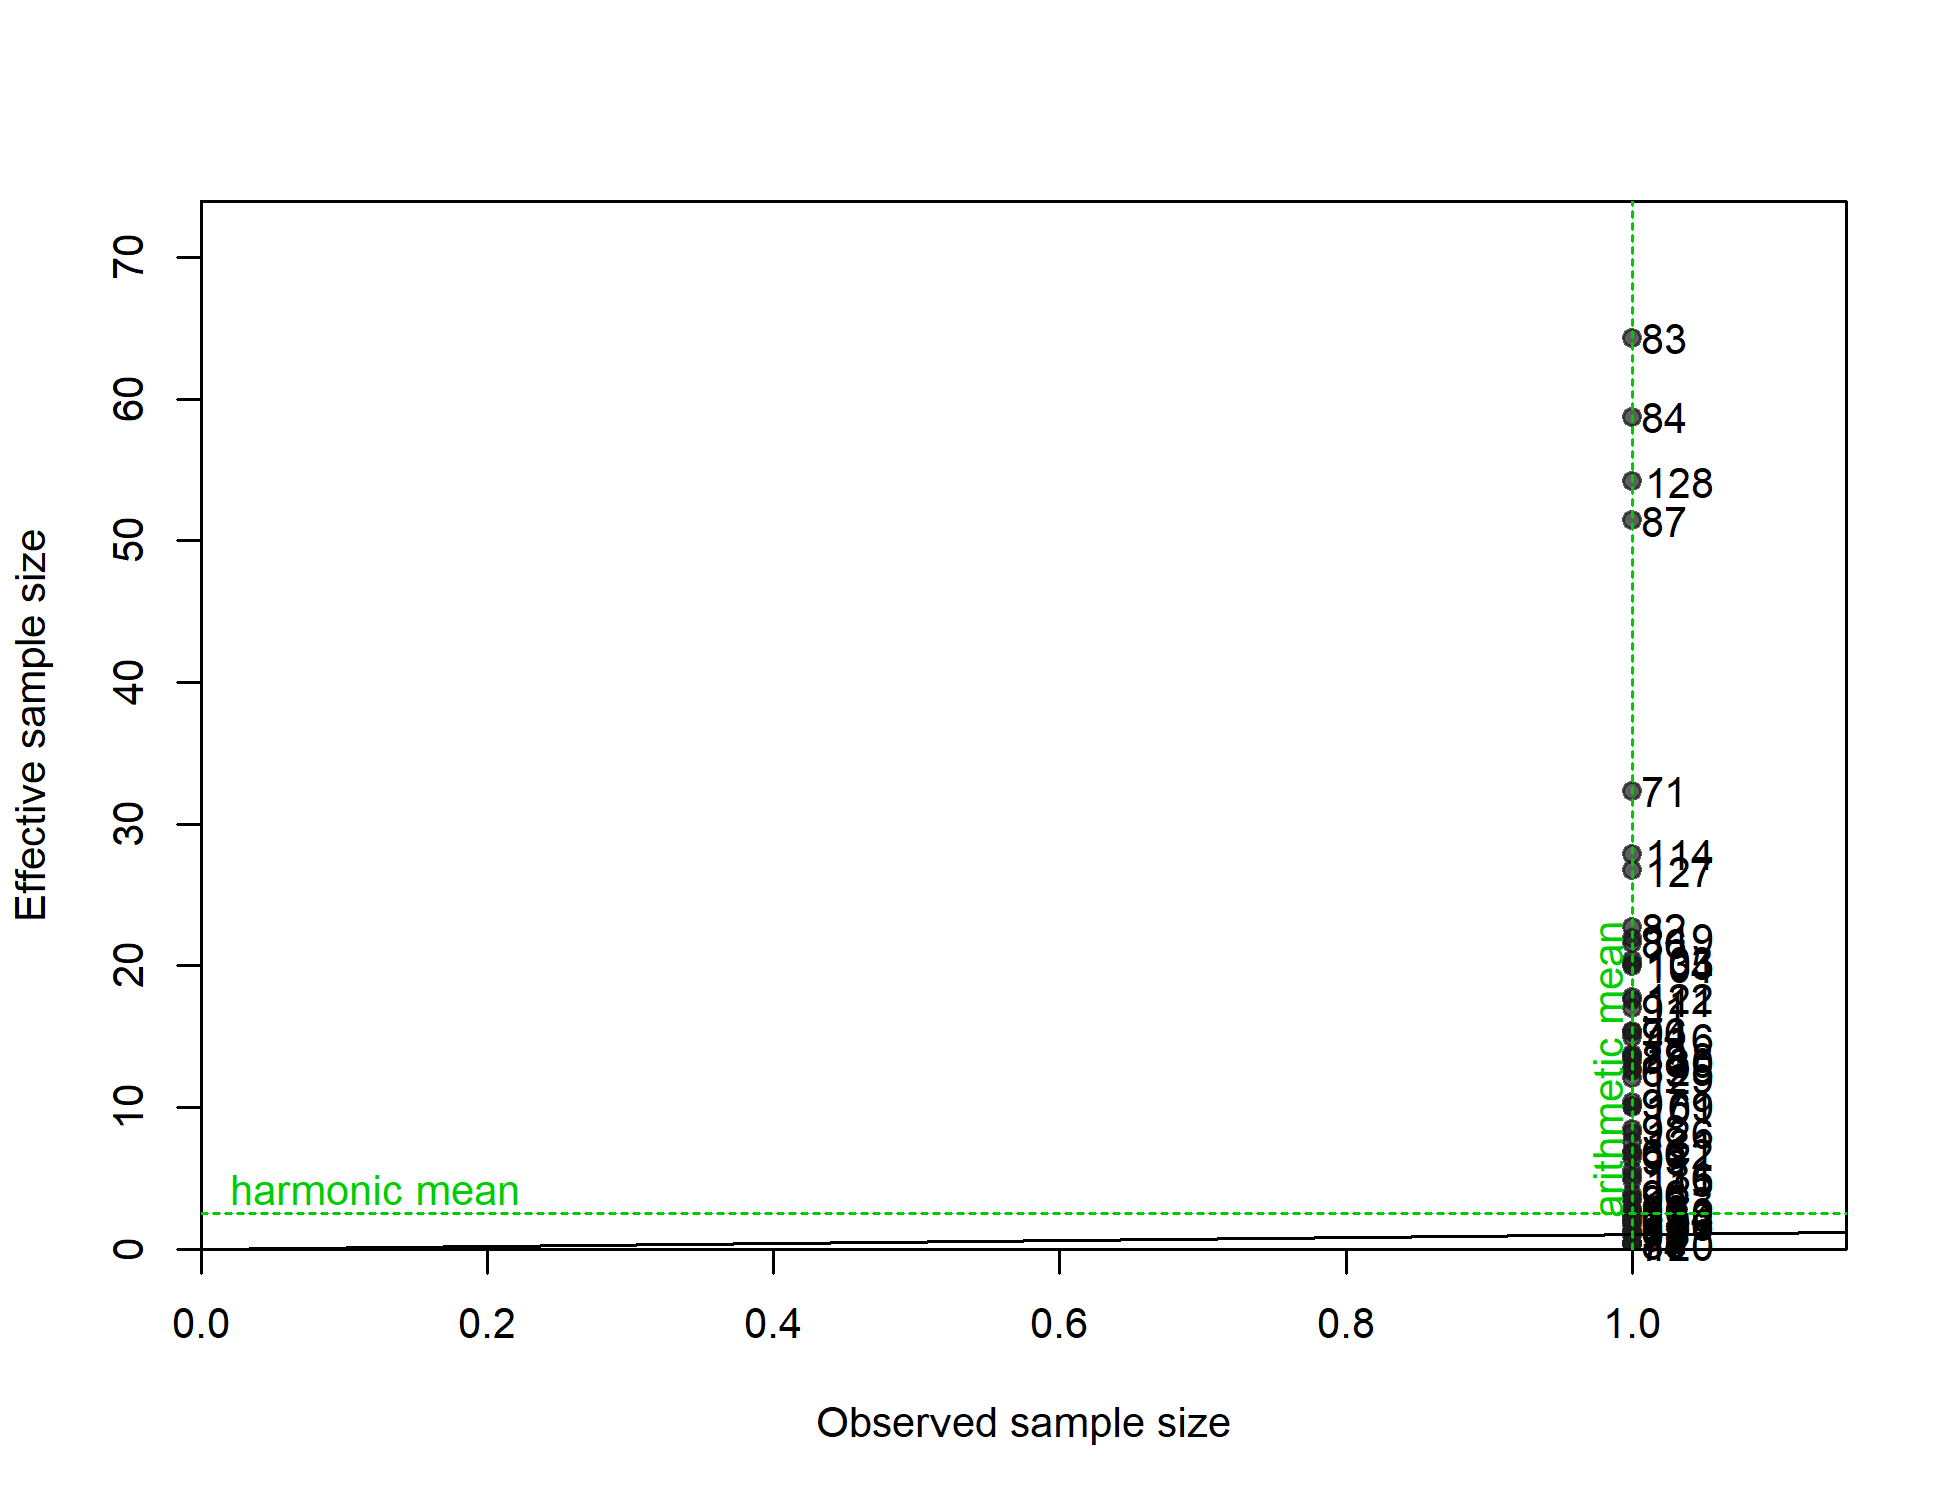
N-EffN comparison, Length comps, whole catch, F7-NOA-DEL_late
file: comp_lenfit_sampsize_flt7mkt0.png
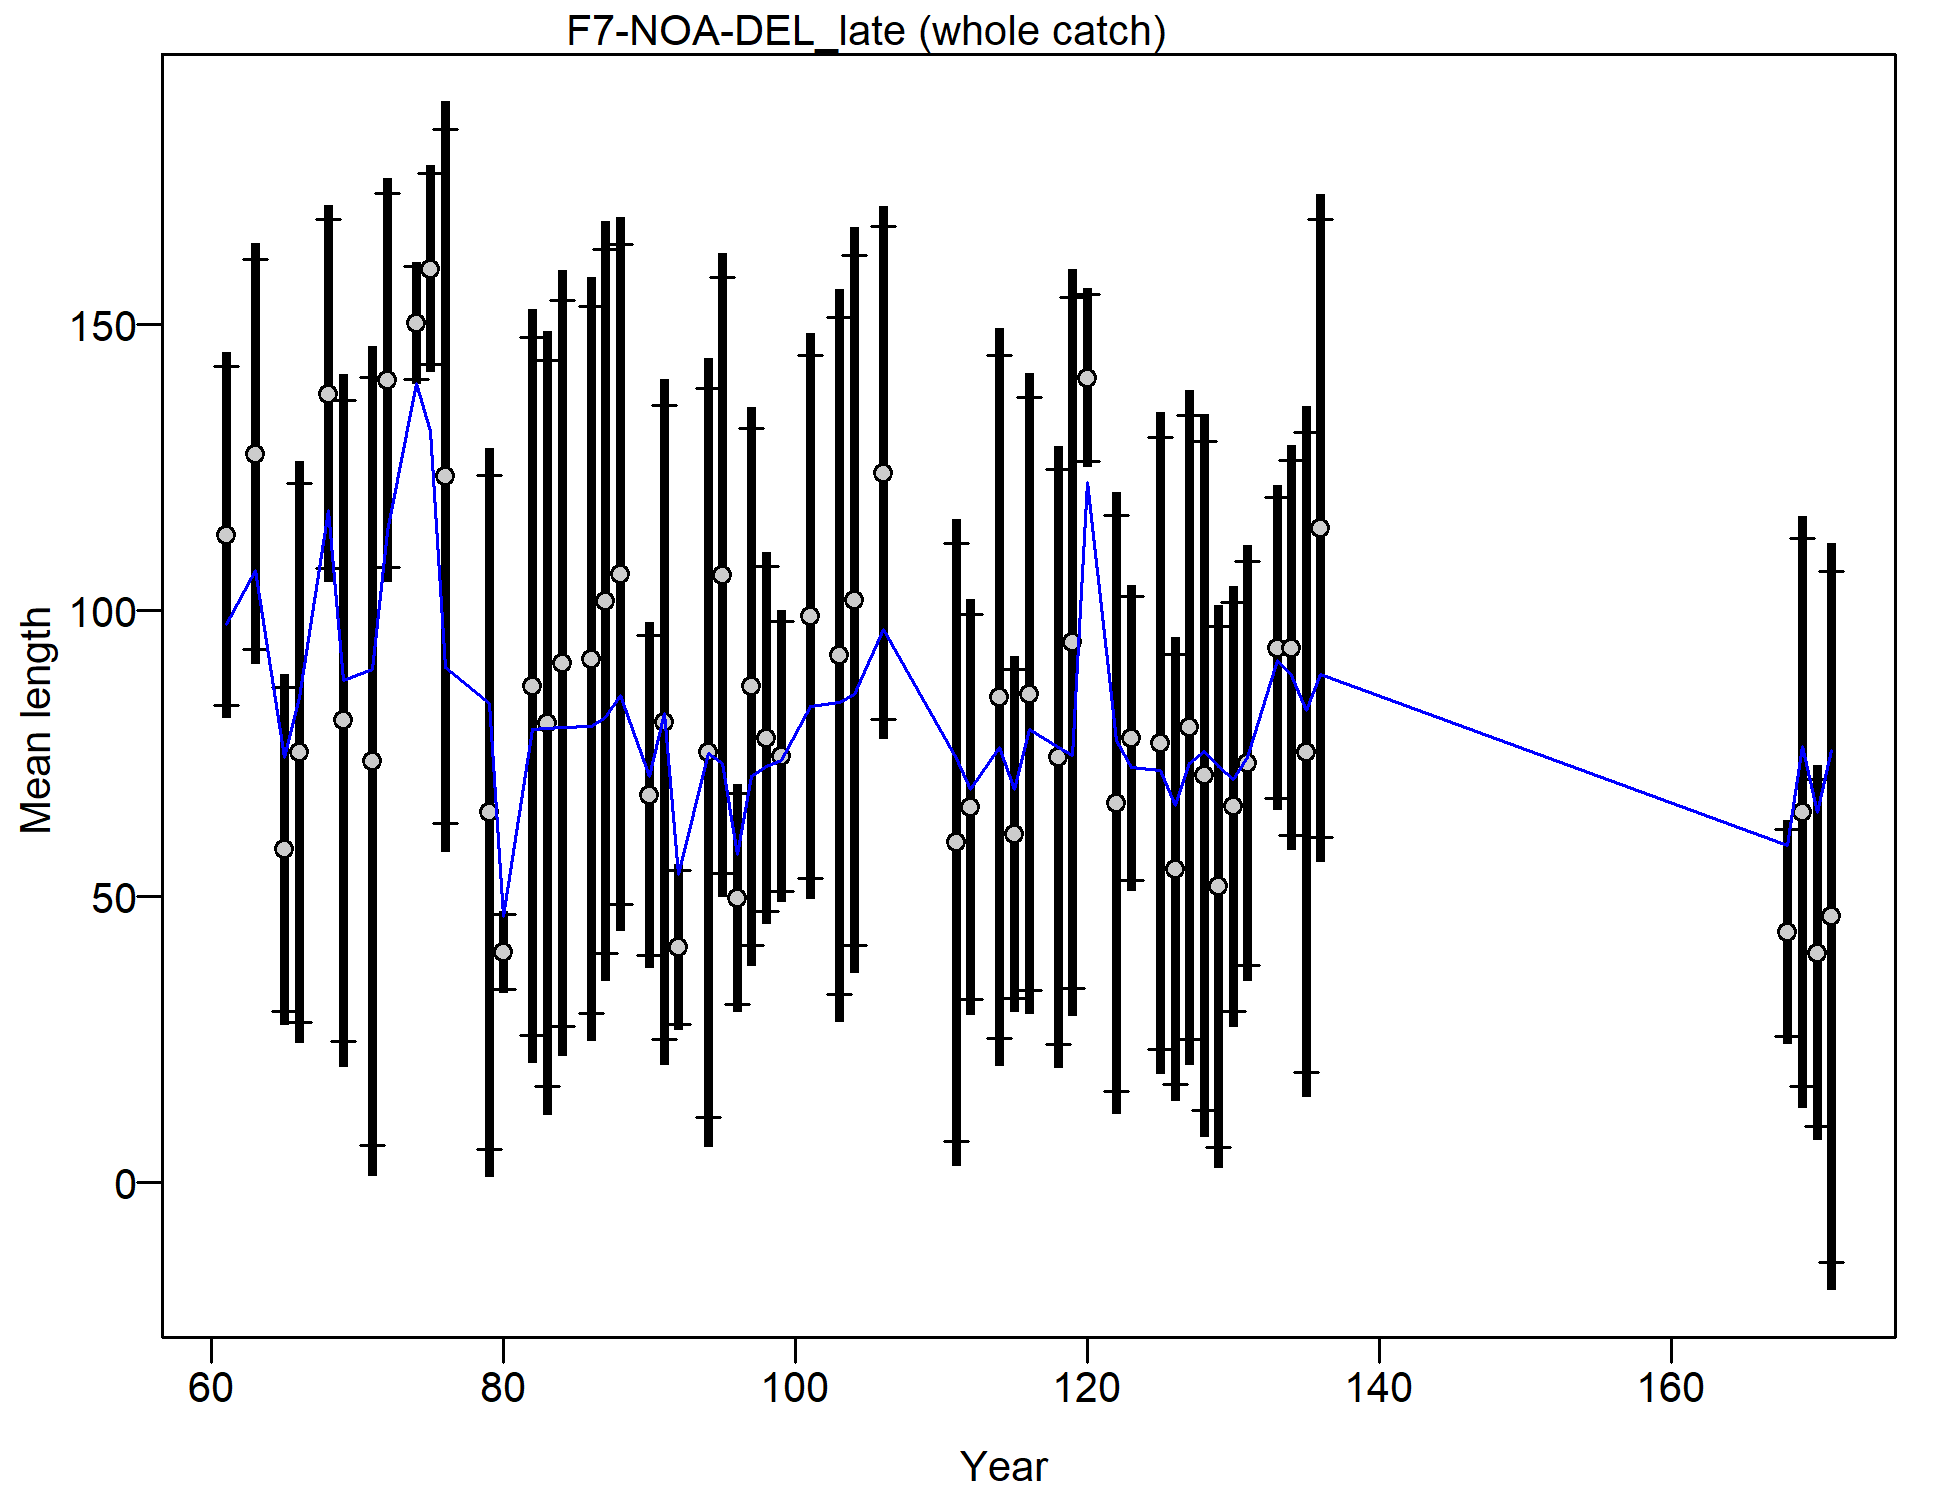
Mean length for F7-NOA-DEL_late with 95% confidence intervals based on current samples sizes.
Francis data weighting method TA1.8: thinner intervals (with capped ends) show result of further adjusting sample sizes based on suggested multiplier (with 95% interval) for len data from F7-NOA-DEL_late:
1.1682 (0.7762-2.0403)
For more info, see
Francis, R.I.C.C. (2011). Data weighting in statistical fisheries stock assessment models. Can. J. Fish. Aquat. Sci. 68: 1124-1138. https://doi.org/10.1139/f2011-025
file: comp_lenfit_data_weighting_TA1.8_F7-NOA-DEL_late.png
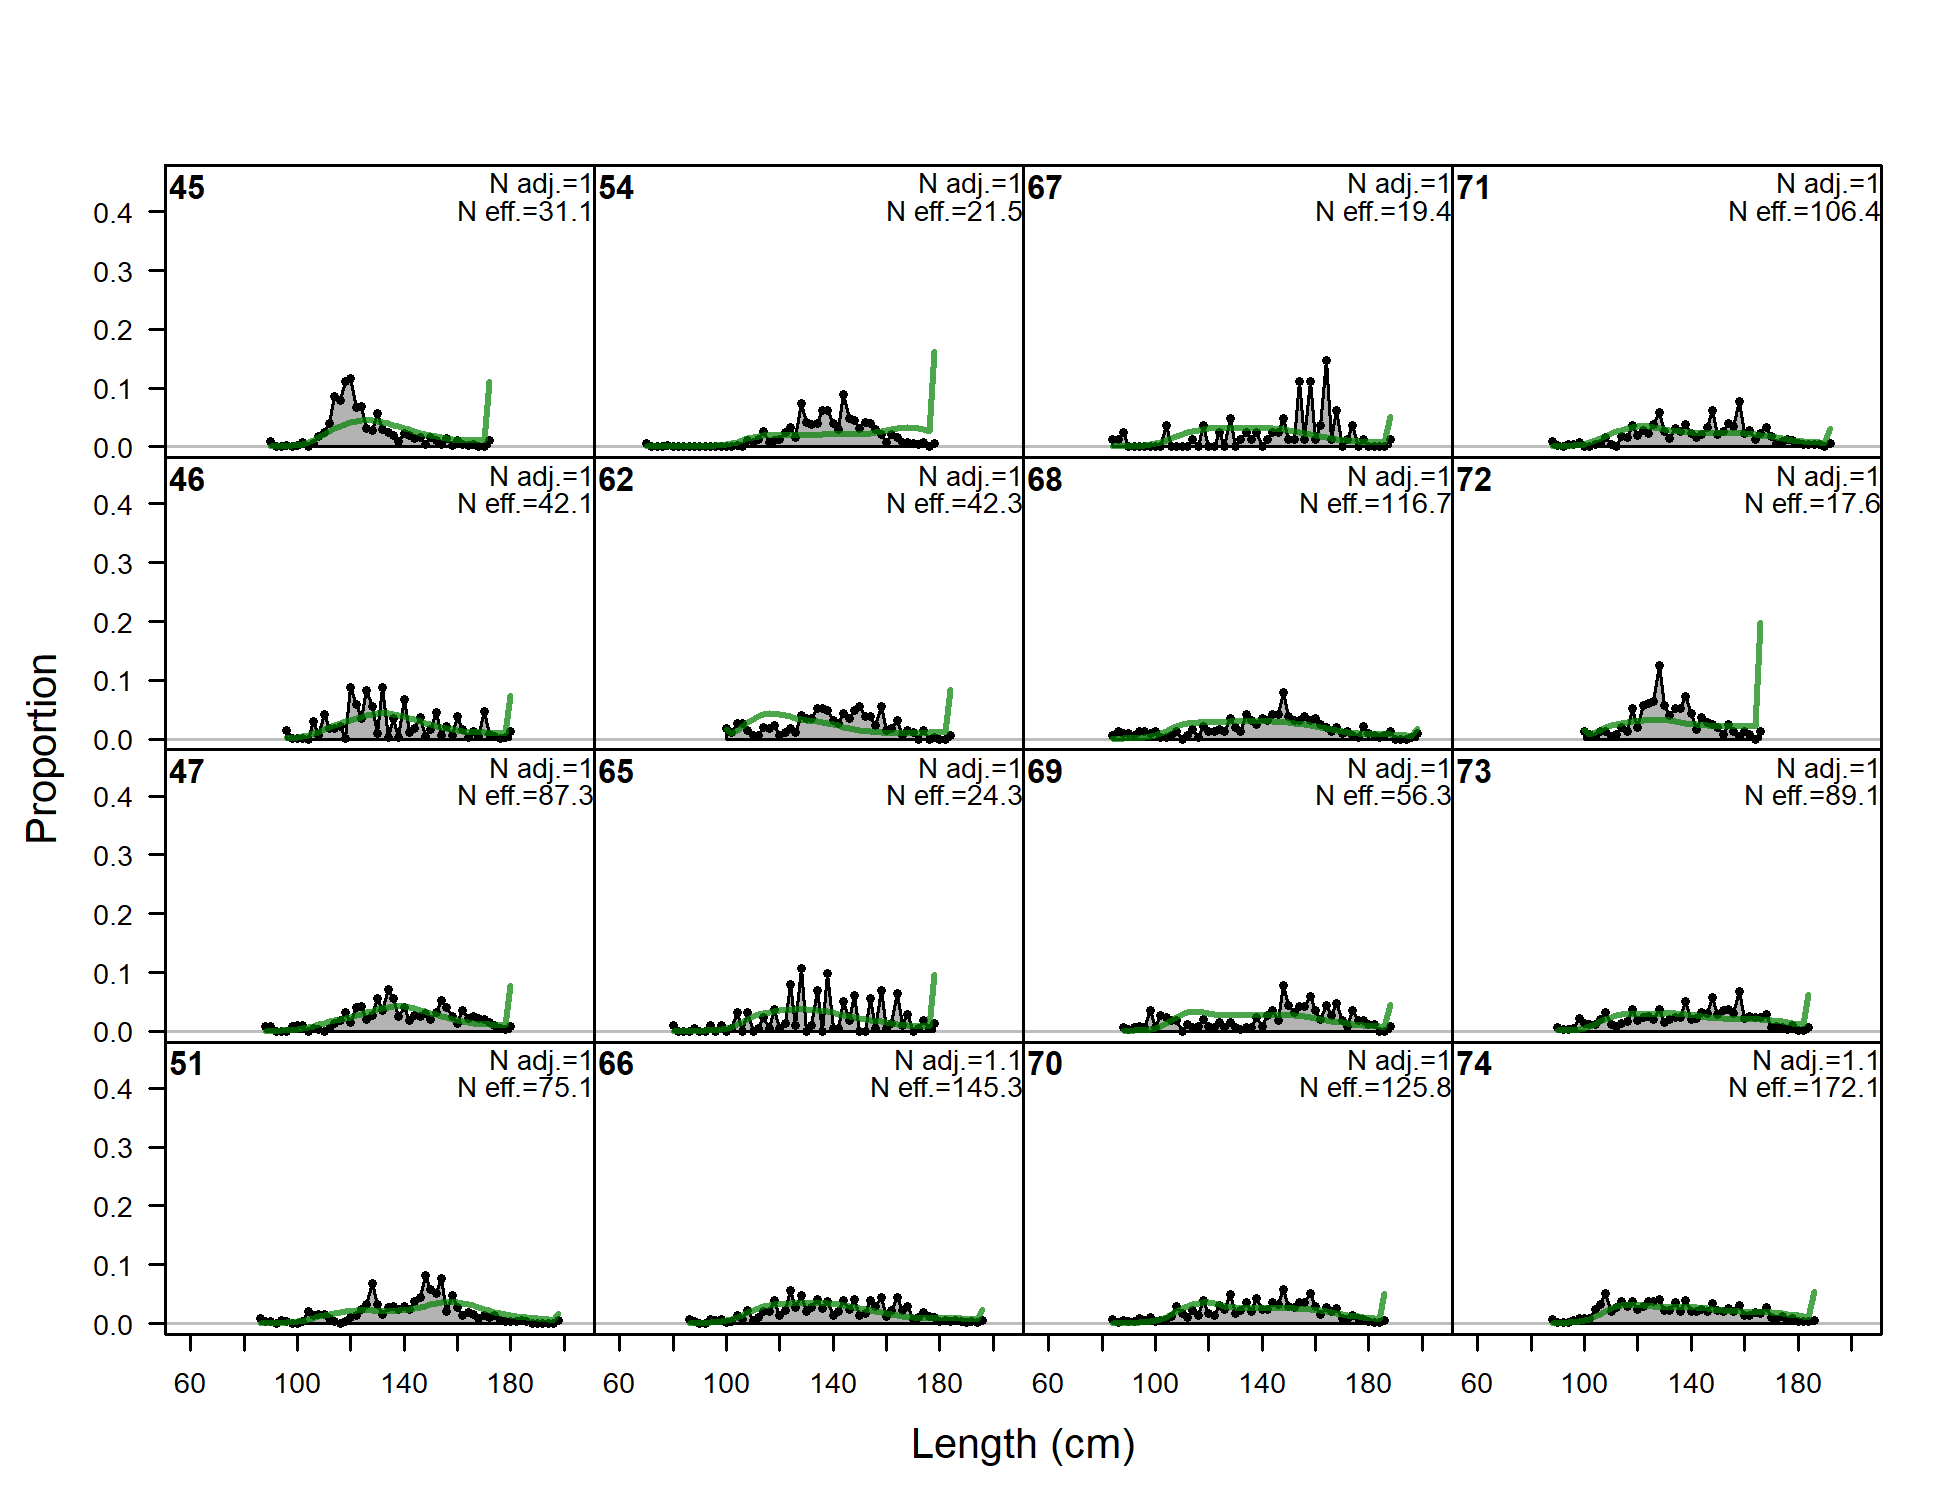
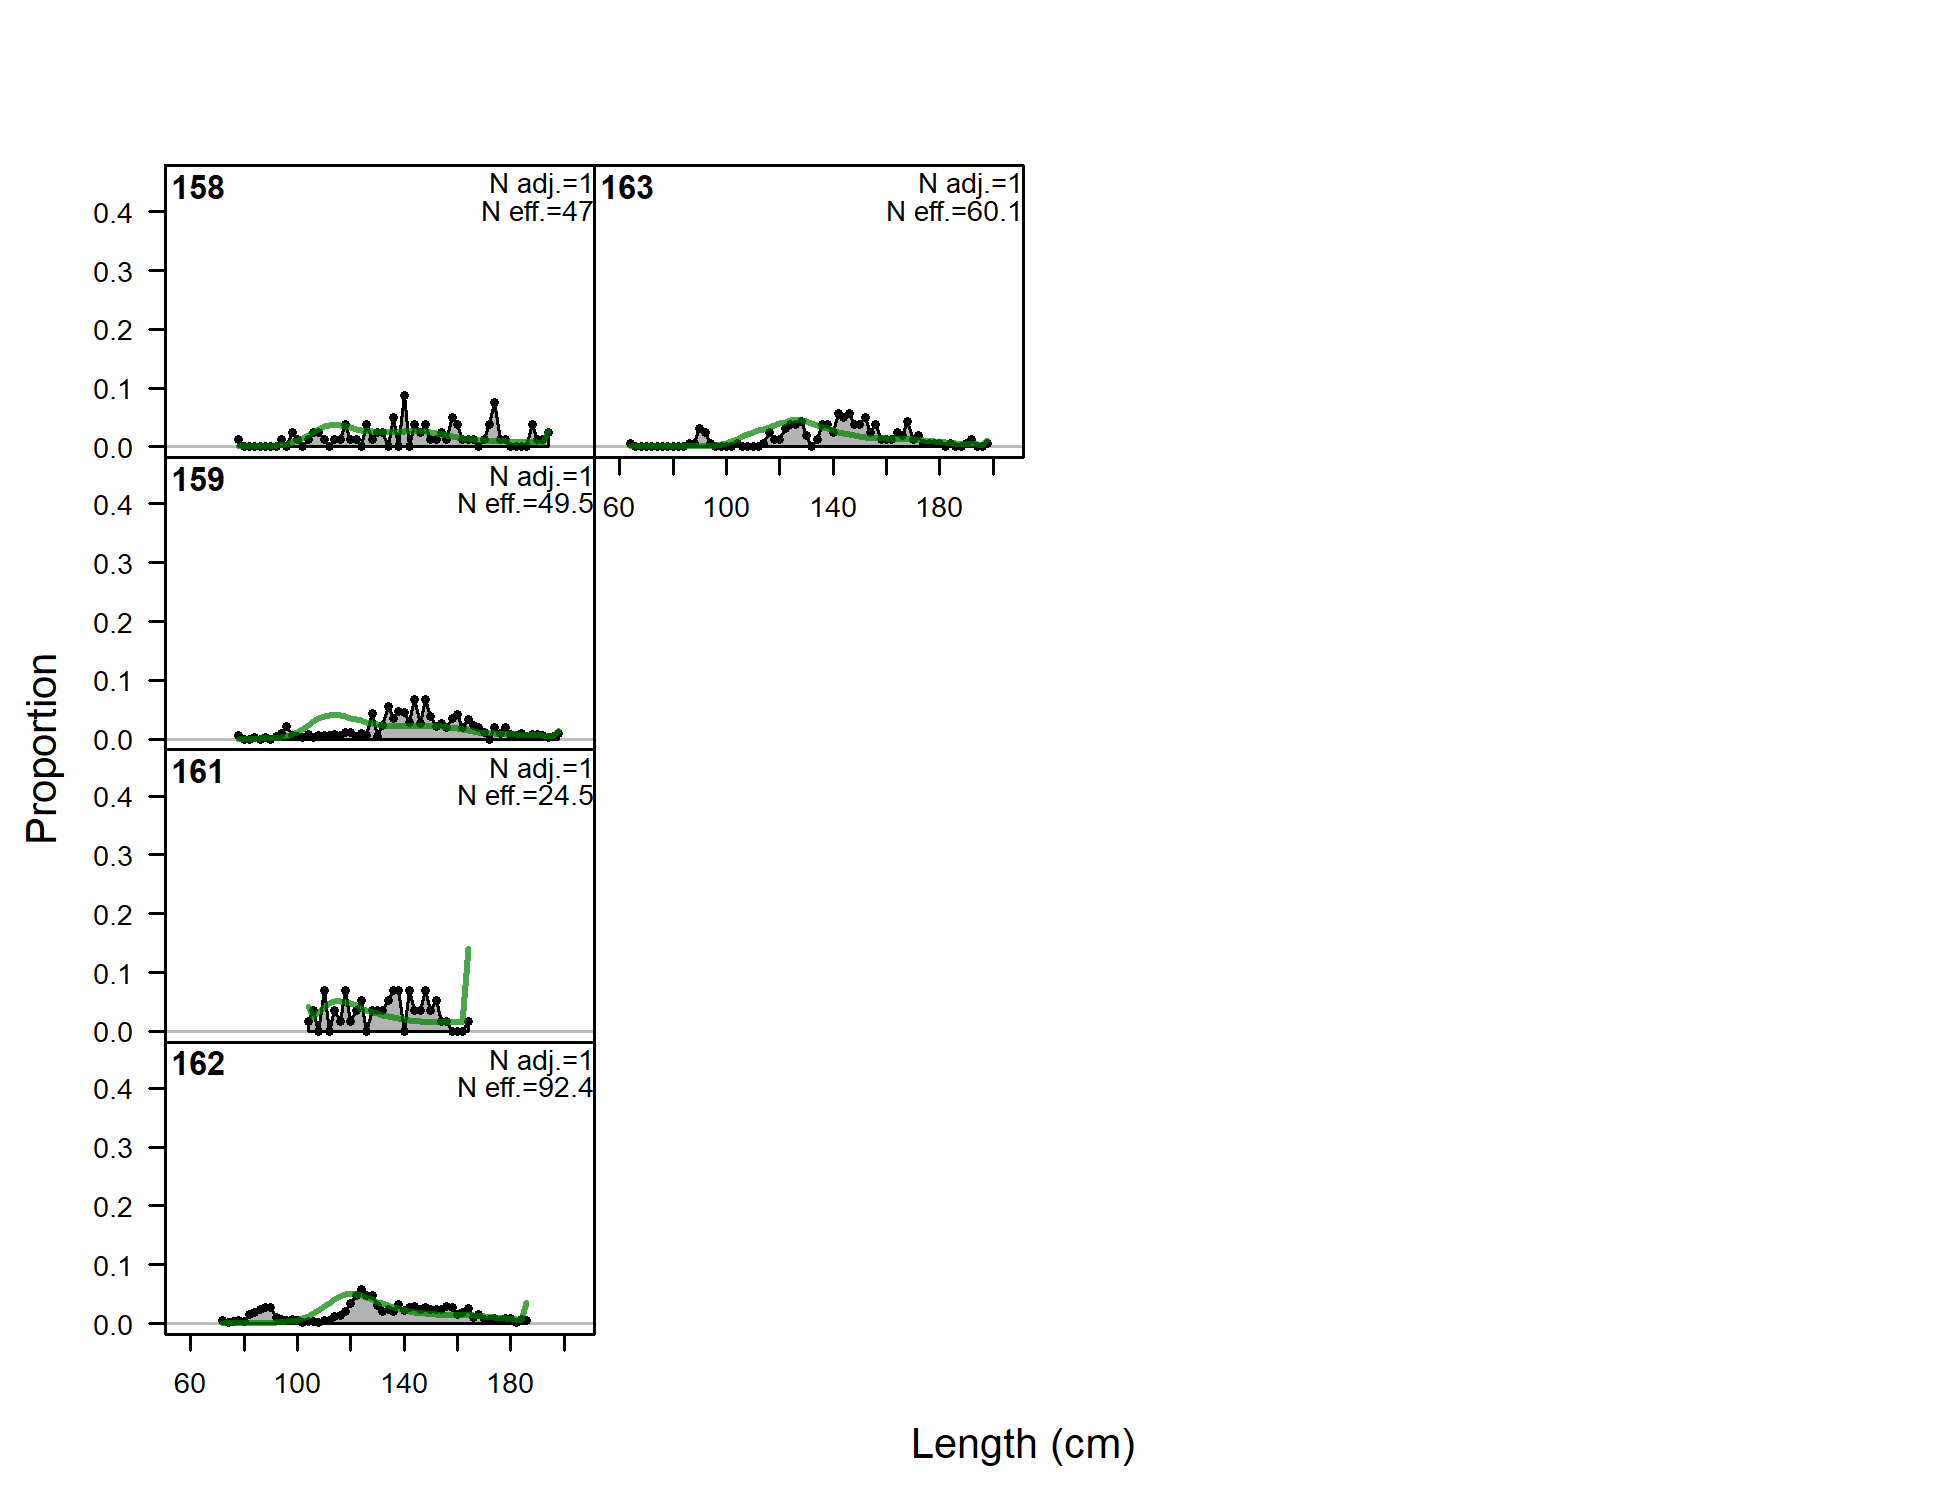
Length comps, whole catch, F12-LL_N_num (plot 1 of 2).
'N adj.' is the input sample size after data-weighting adjustment.N eff. is the calculated effective sample size used in the McAllister-Iannelli tuning method.
file: comp_lenfit_flt12mkt0_page1.png
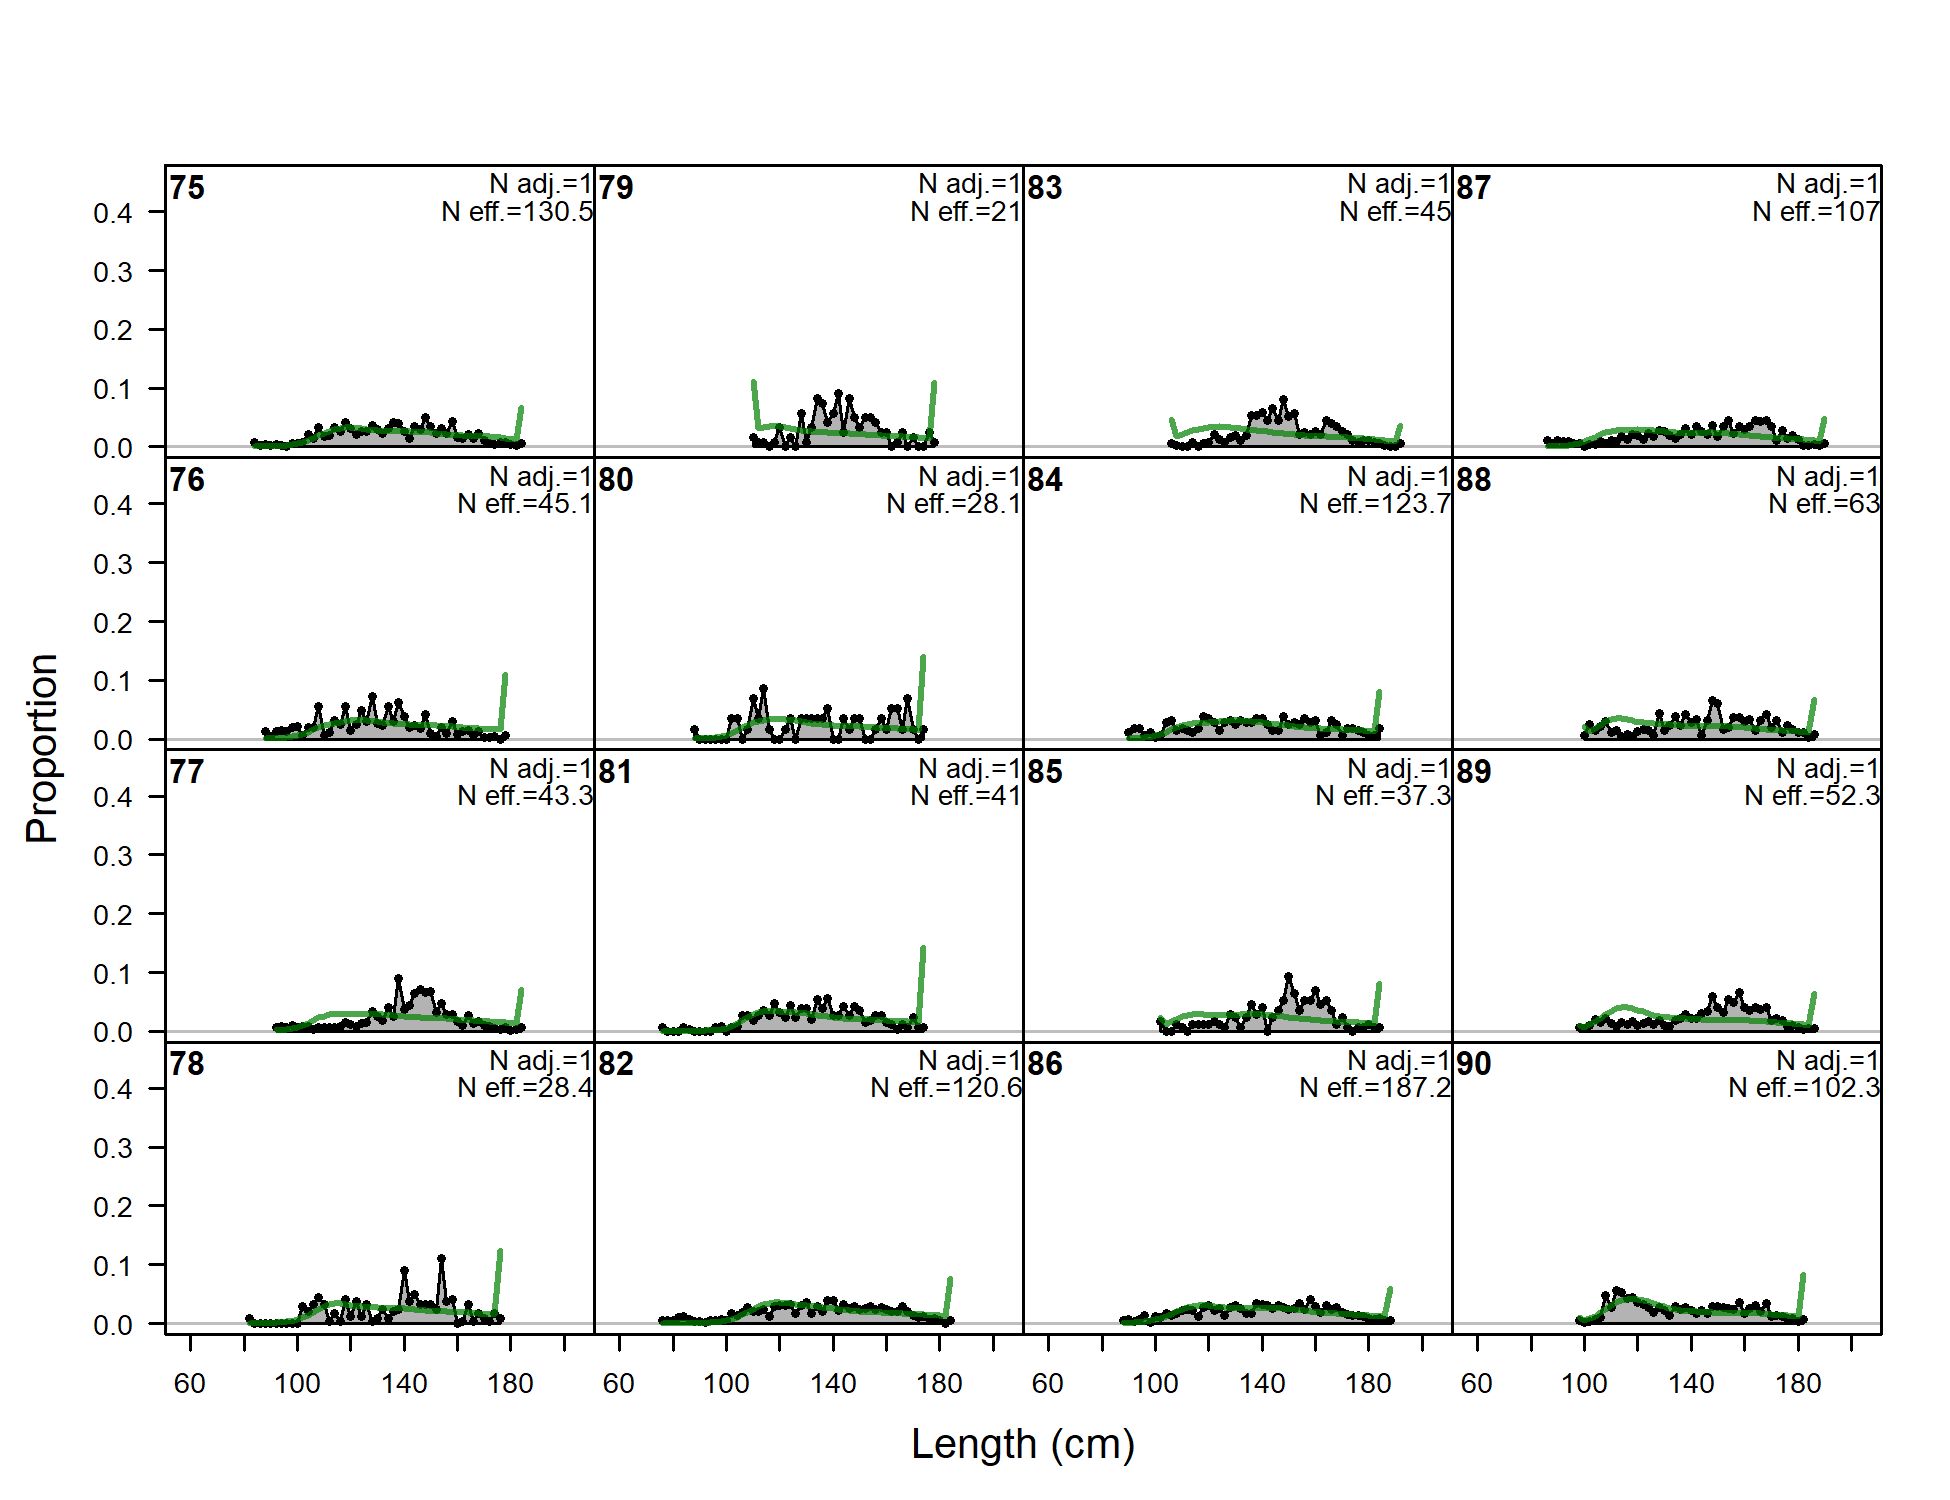
Length comps, whole catch, F12-LL_N_num (plot 2 of 2)
file: comp_lenfit_flt12mkt0_page2.png
Pearson residuals, whole catch, F12-LL_N_num (max=11.5) (plot 2 of 2)
Closed bubbles are positive residuals (observed > expected) and open bubbles are negative residuals (observed < expected).
file: comp_lenfit_residsflt12mkt0_page2.png
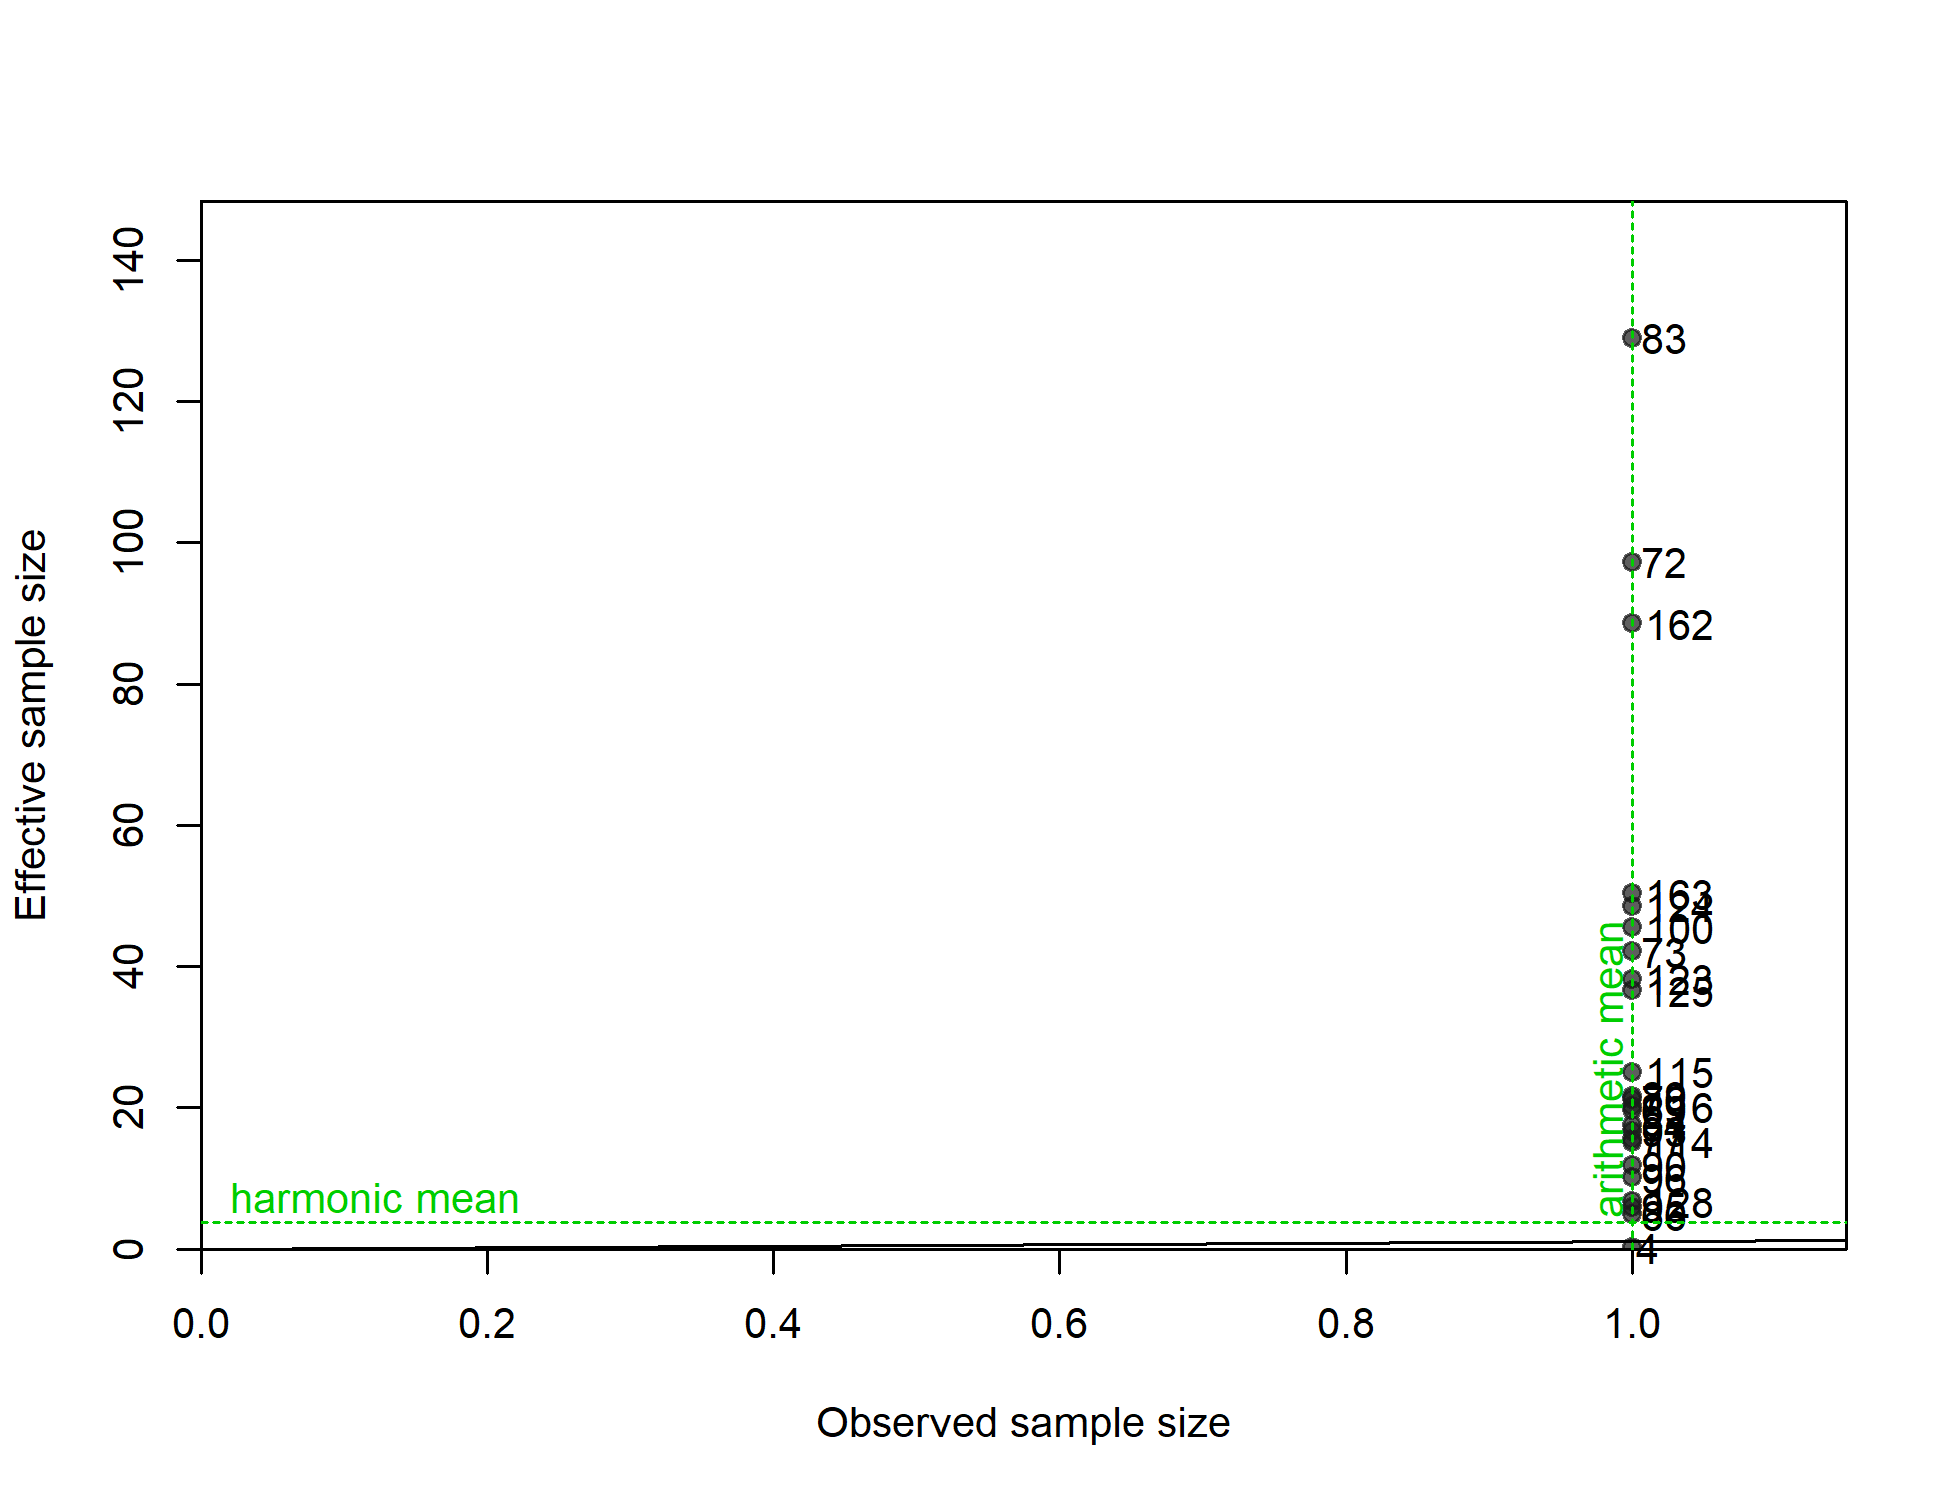
N-EffN comparison, Length comps, whole catch, F12-LL_N_num
file: comp_lenfit_sampsize_flt12mkt0.png
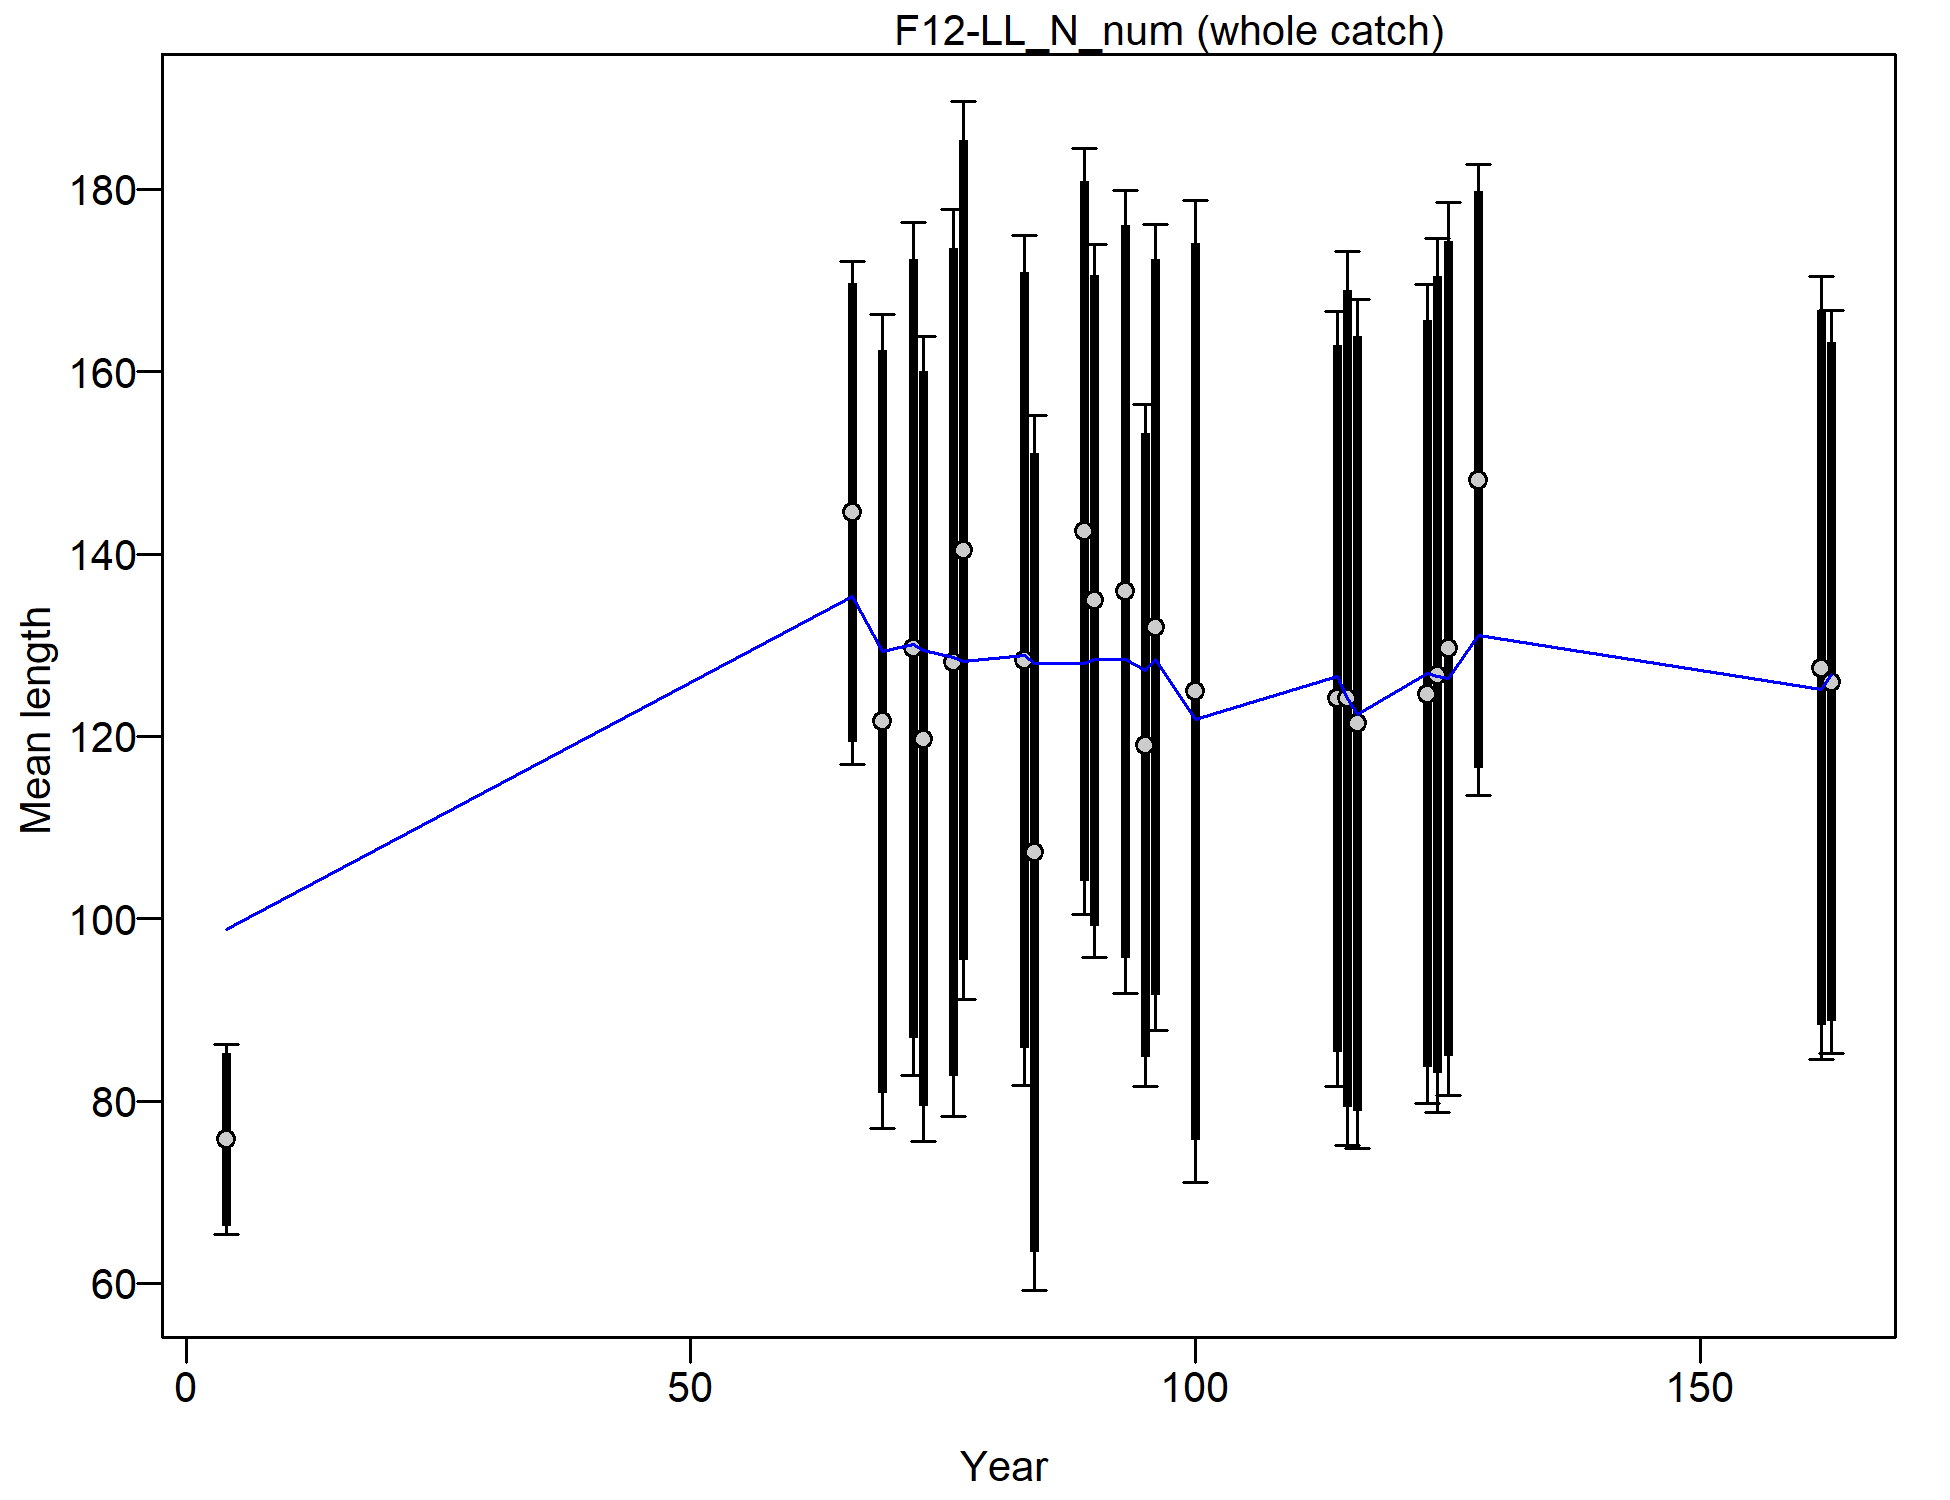
Mean length for F12-LL_N_num with 95% confidence intervals based on current samples sizes.
Francis data weighting method TA1.8: thinner intervals (with capped ends) show result of further adjusting sample sizes based on suggested multiplier (with 95% interval) for len data from F12-LL_N_num:
0.8334 (0.3144-9.7028)
For more info, see
Francis, R.I.C.C. (2011). Data weighting in statistical fisheries stock assessment models. Can. J. Fish. Aquat. Sci. 68: 1124-1138. https://doi.org/10.1139/f2011-025
file: comp_lenfit_data_weighting_TA1.8_F12-LL_N_num.png
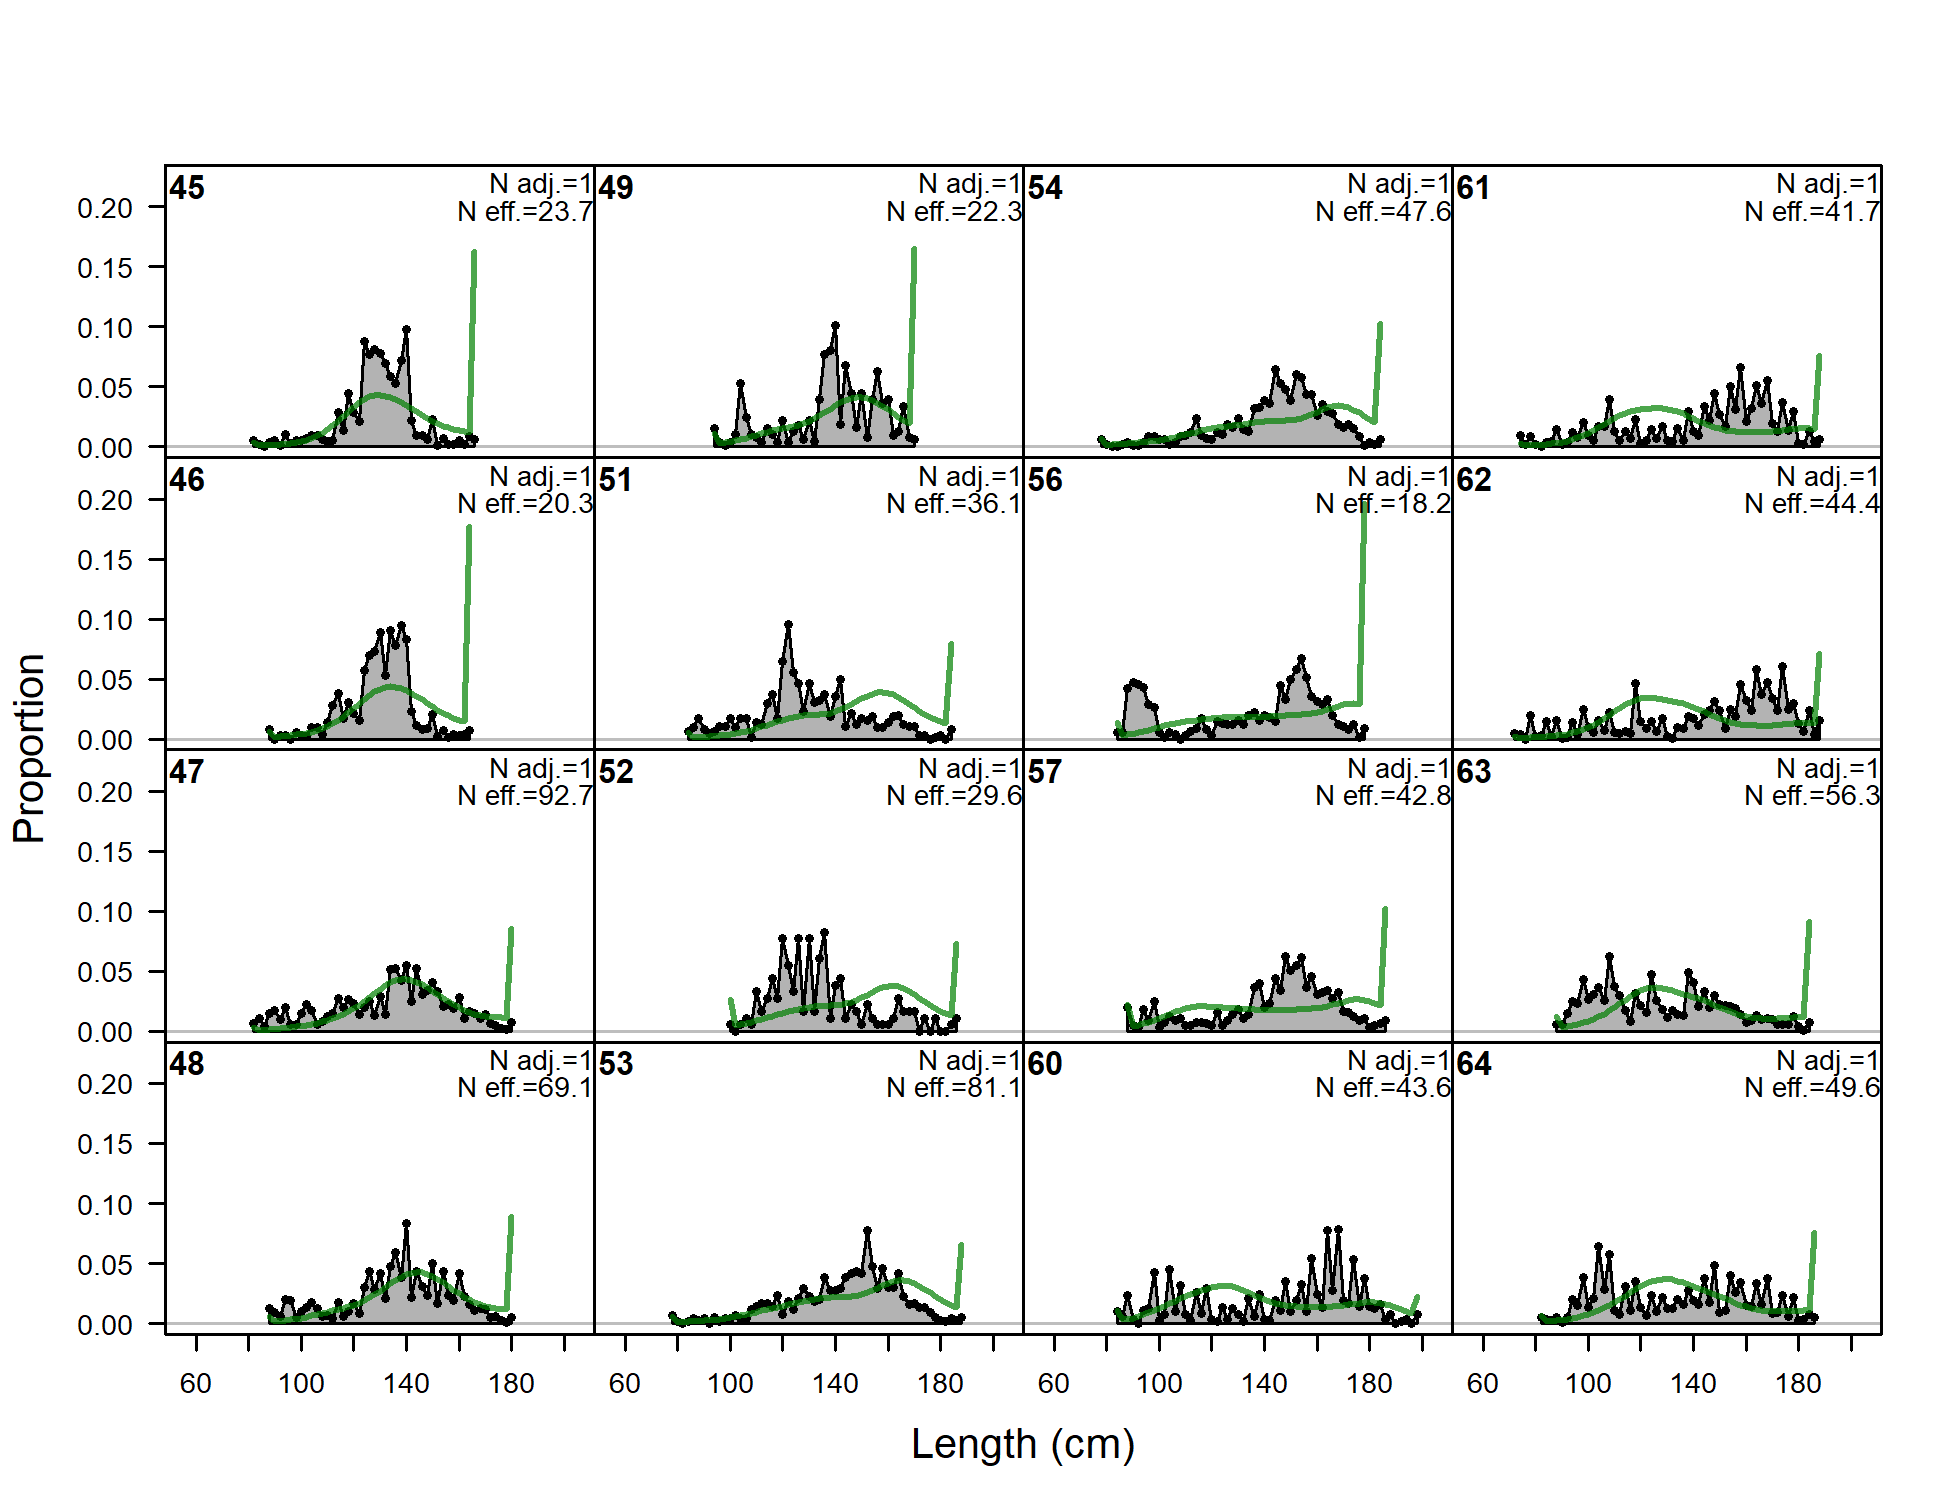
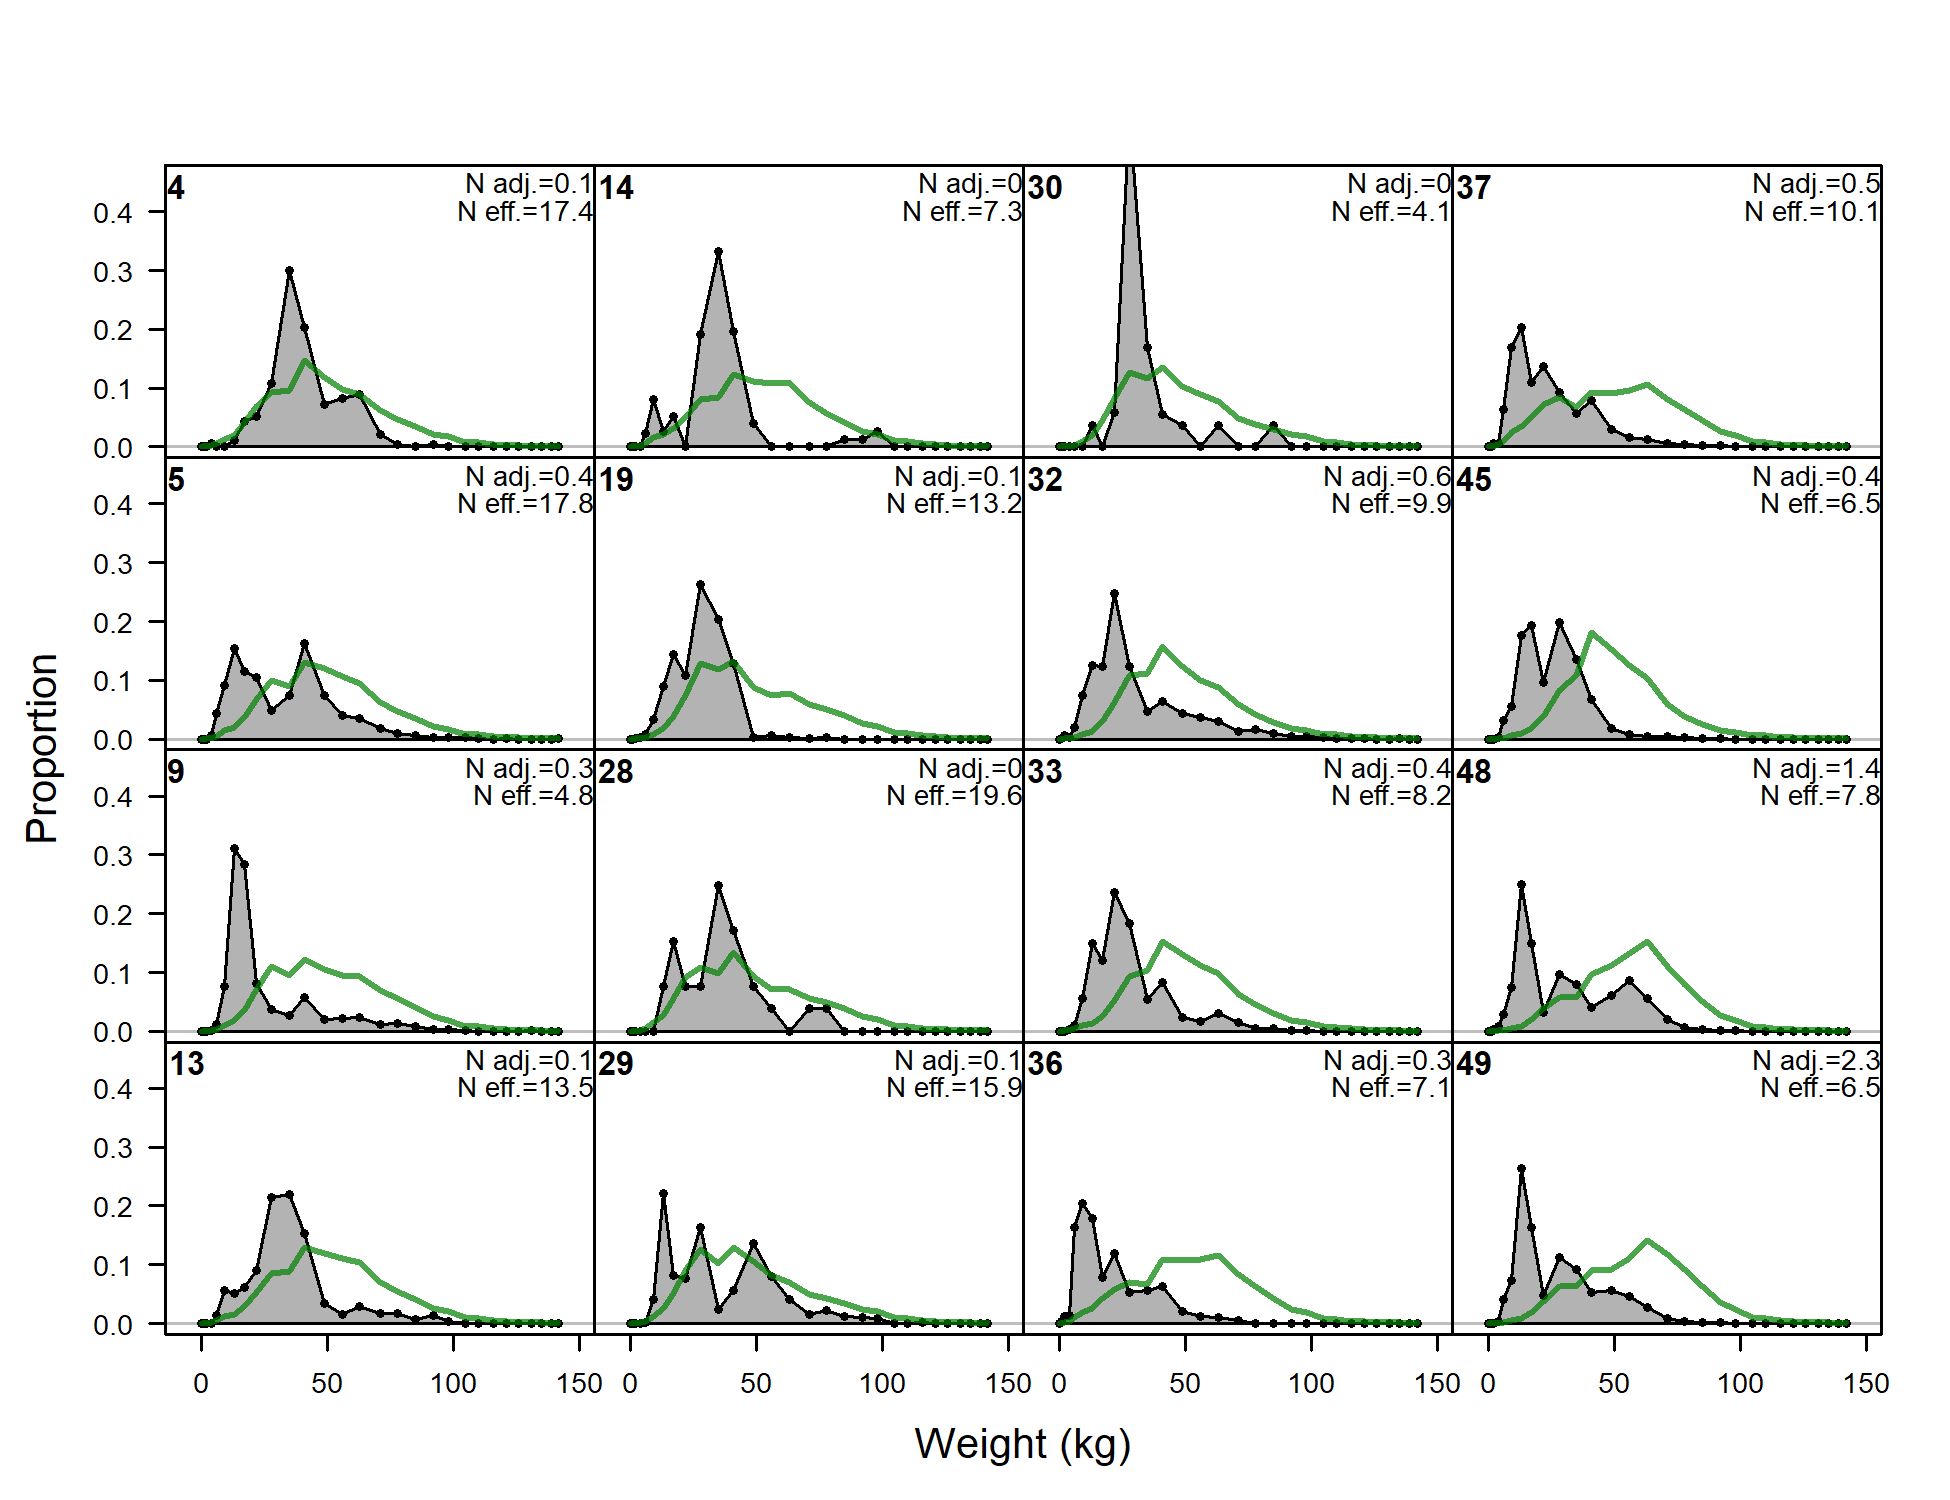
Length comps, whole catch, F13-LL_C_num (plot 1 of 6).
'N adj.' is the input sample size after data-weighting adjustment.N eff. is the calculated effective sample size used in the McAllister-Iannelli tuning method.
file: comp_lenfit_flt13mkt0_page1.png
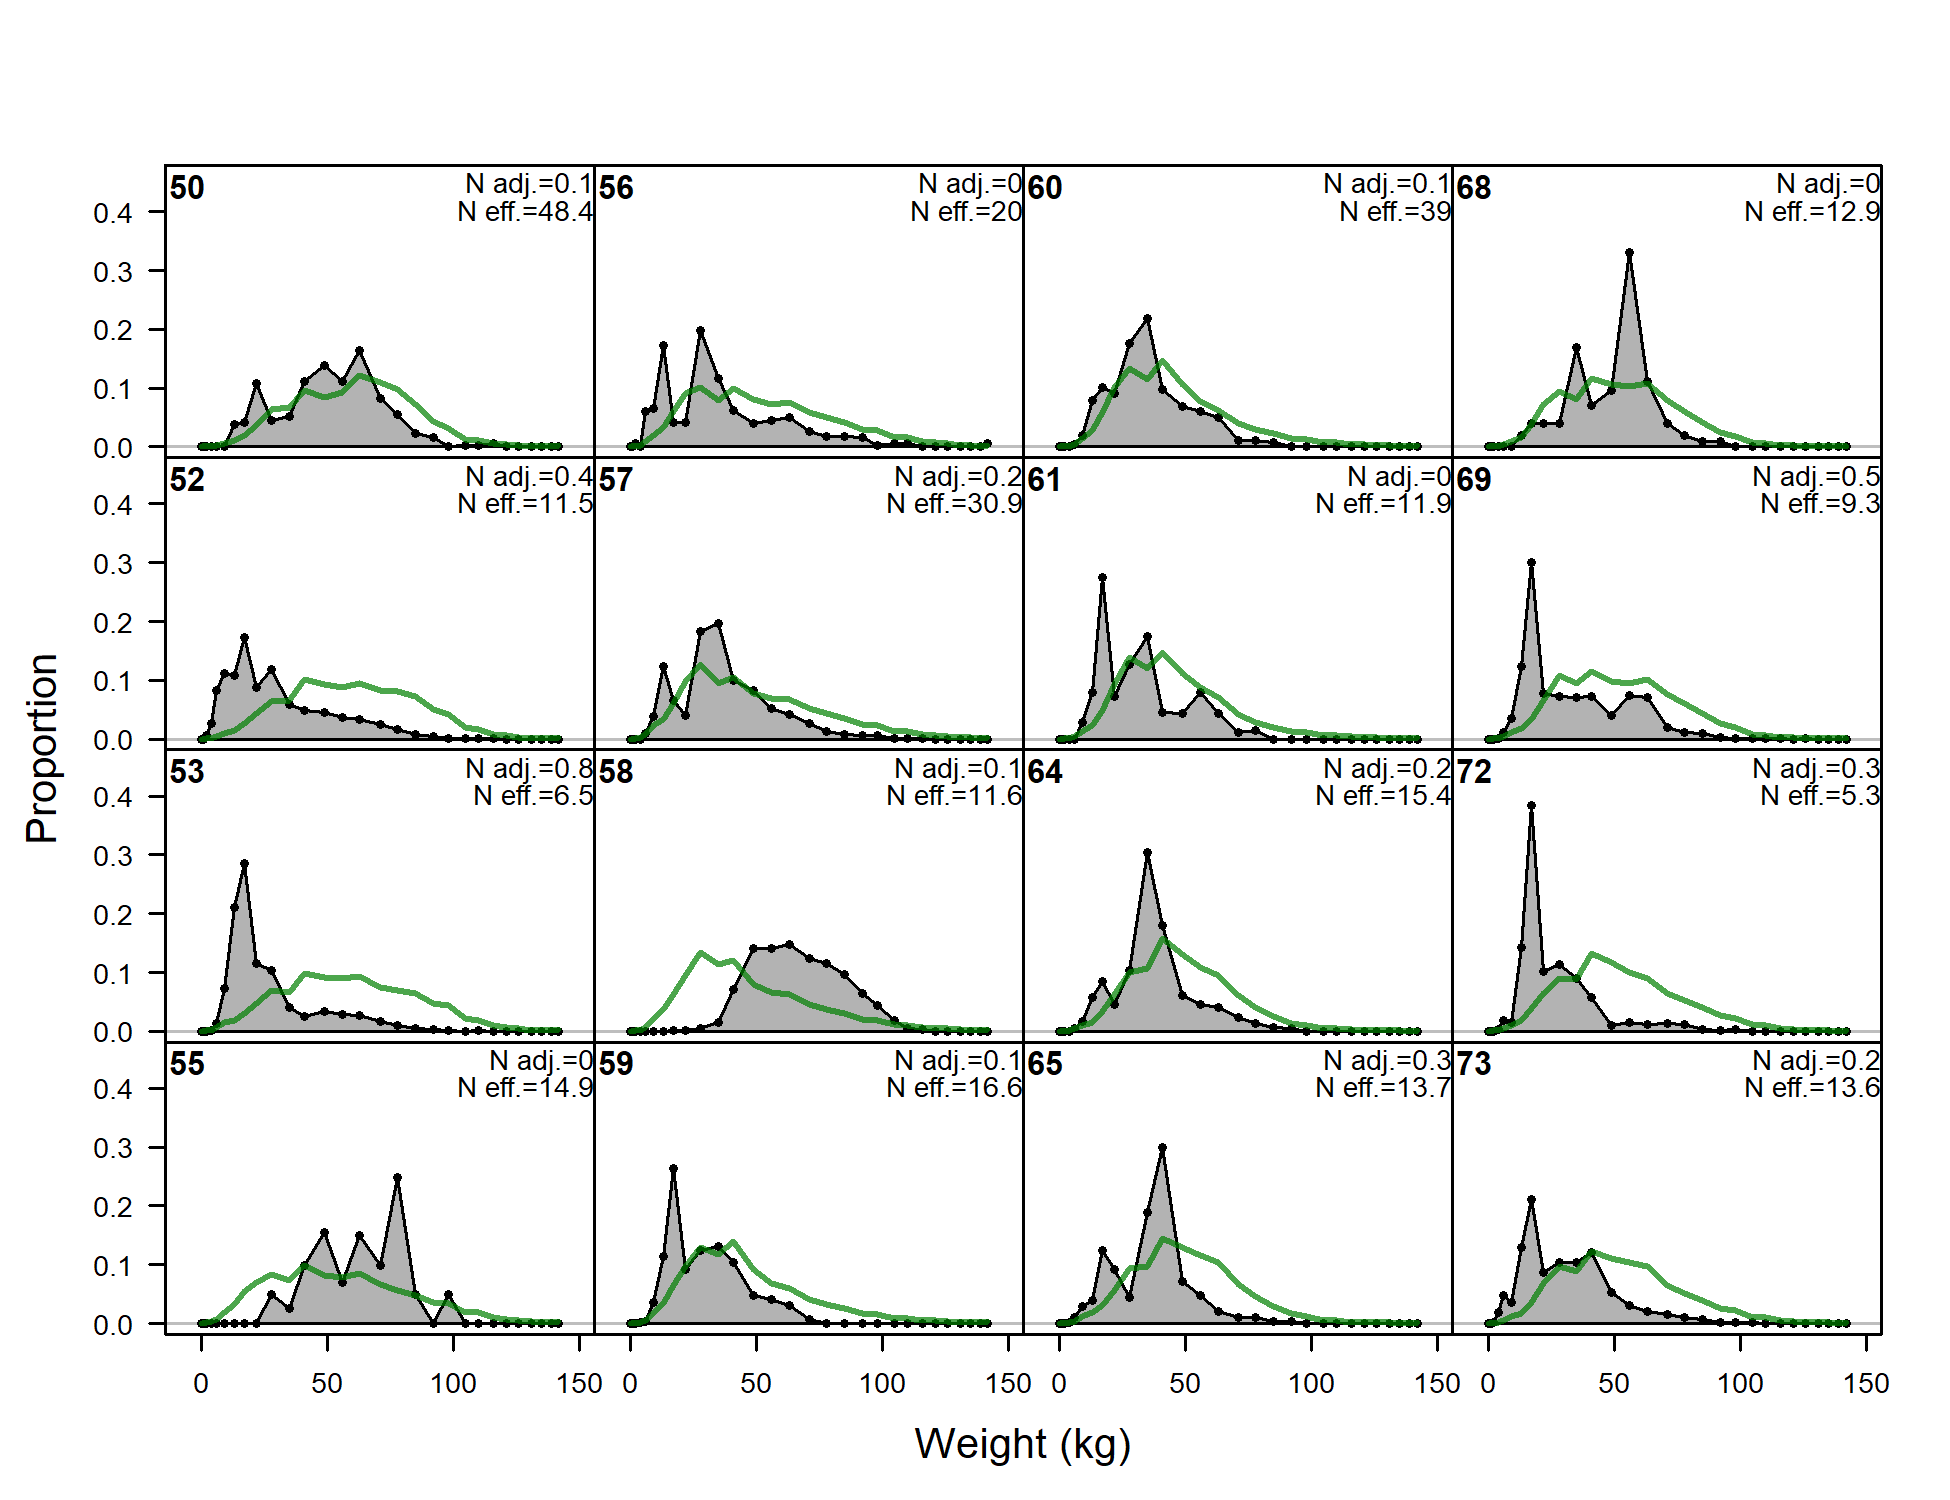
Length comps, whole catch, F13-LL_C_num (plot 2 of 6)
file: comp_lenfit_flt13mkt0_page2.png
Length comps, whole catch, F13-LL_C_num (plot 3 of 6)
file: comp_lenfit_flt13mkt0_page3.png
Length comps, whole catch, F13-LL_C_num (plot 4 of 6)
file: comp_lenfit_flt13mkt0_page4.png
Length comps, whole catch, F13-LL_C_num (plot 5 of 6)
file: comp_lenfit_flt13mkt0_page5.png
Length comps, whole catch, F13-LL_C_num (plot 6 of 6)
file: comp_lenfit_flt13mkt0_page6.png
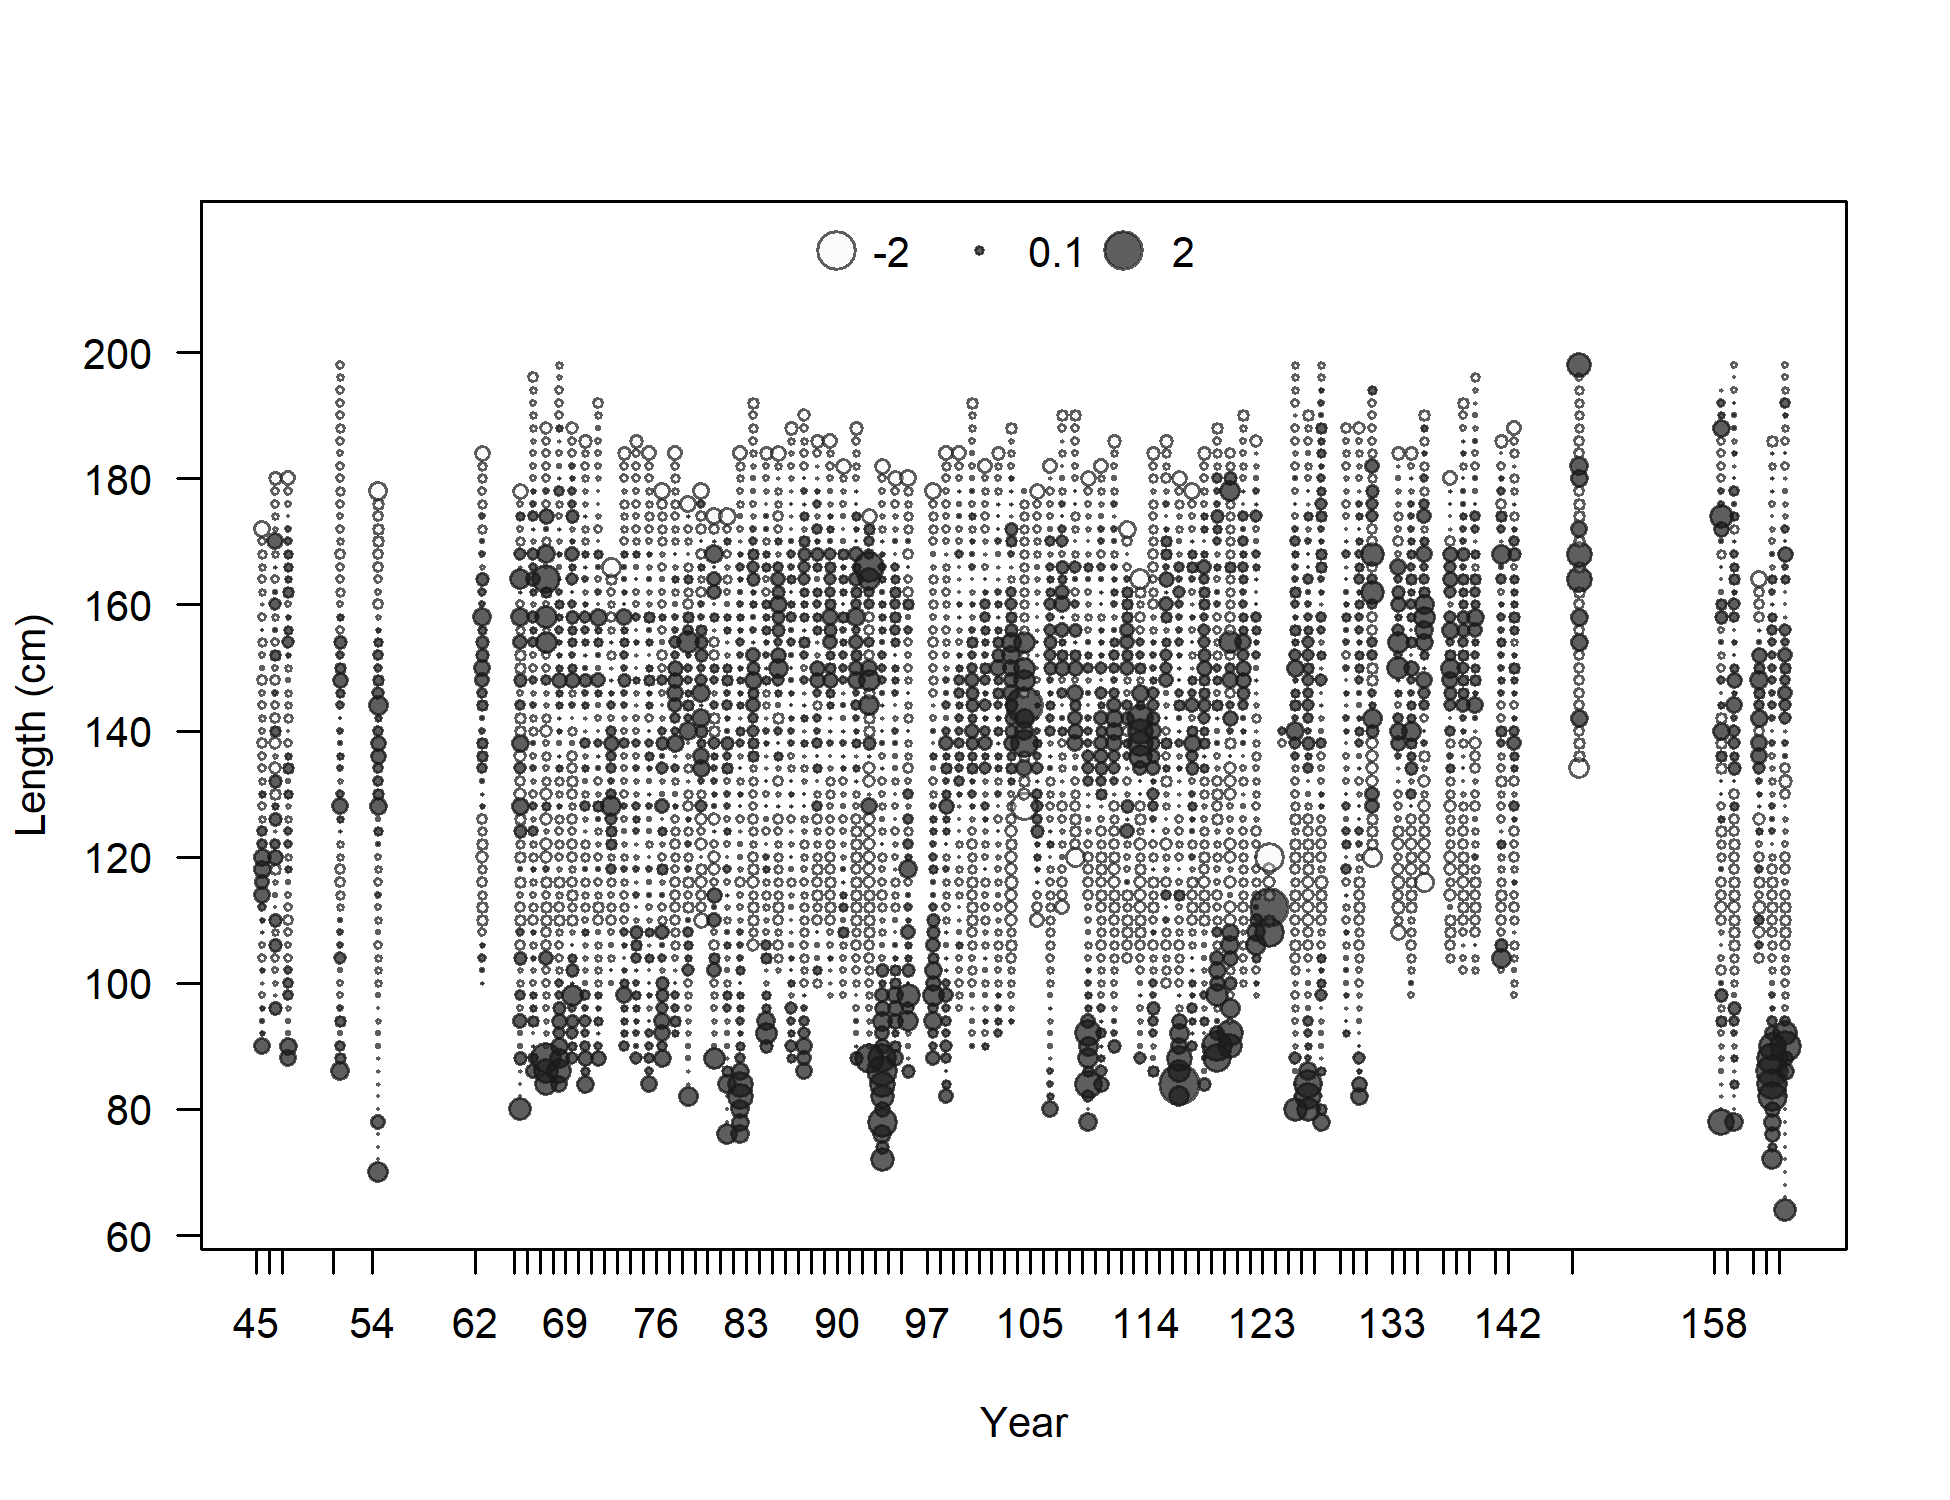
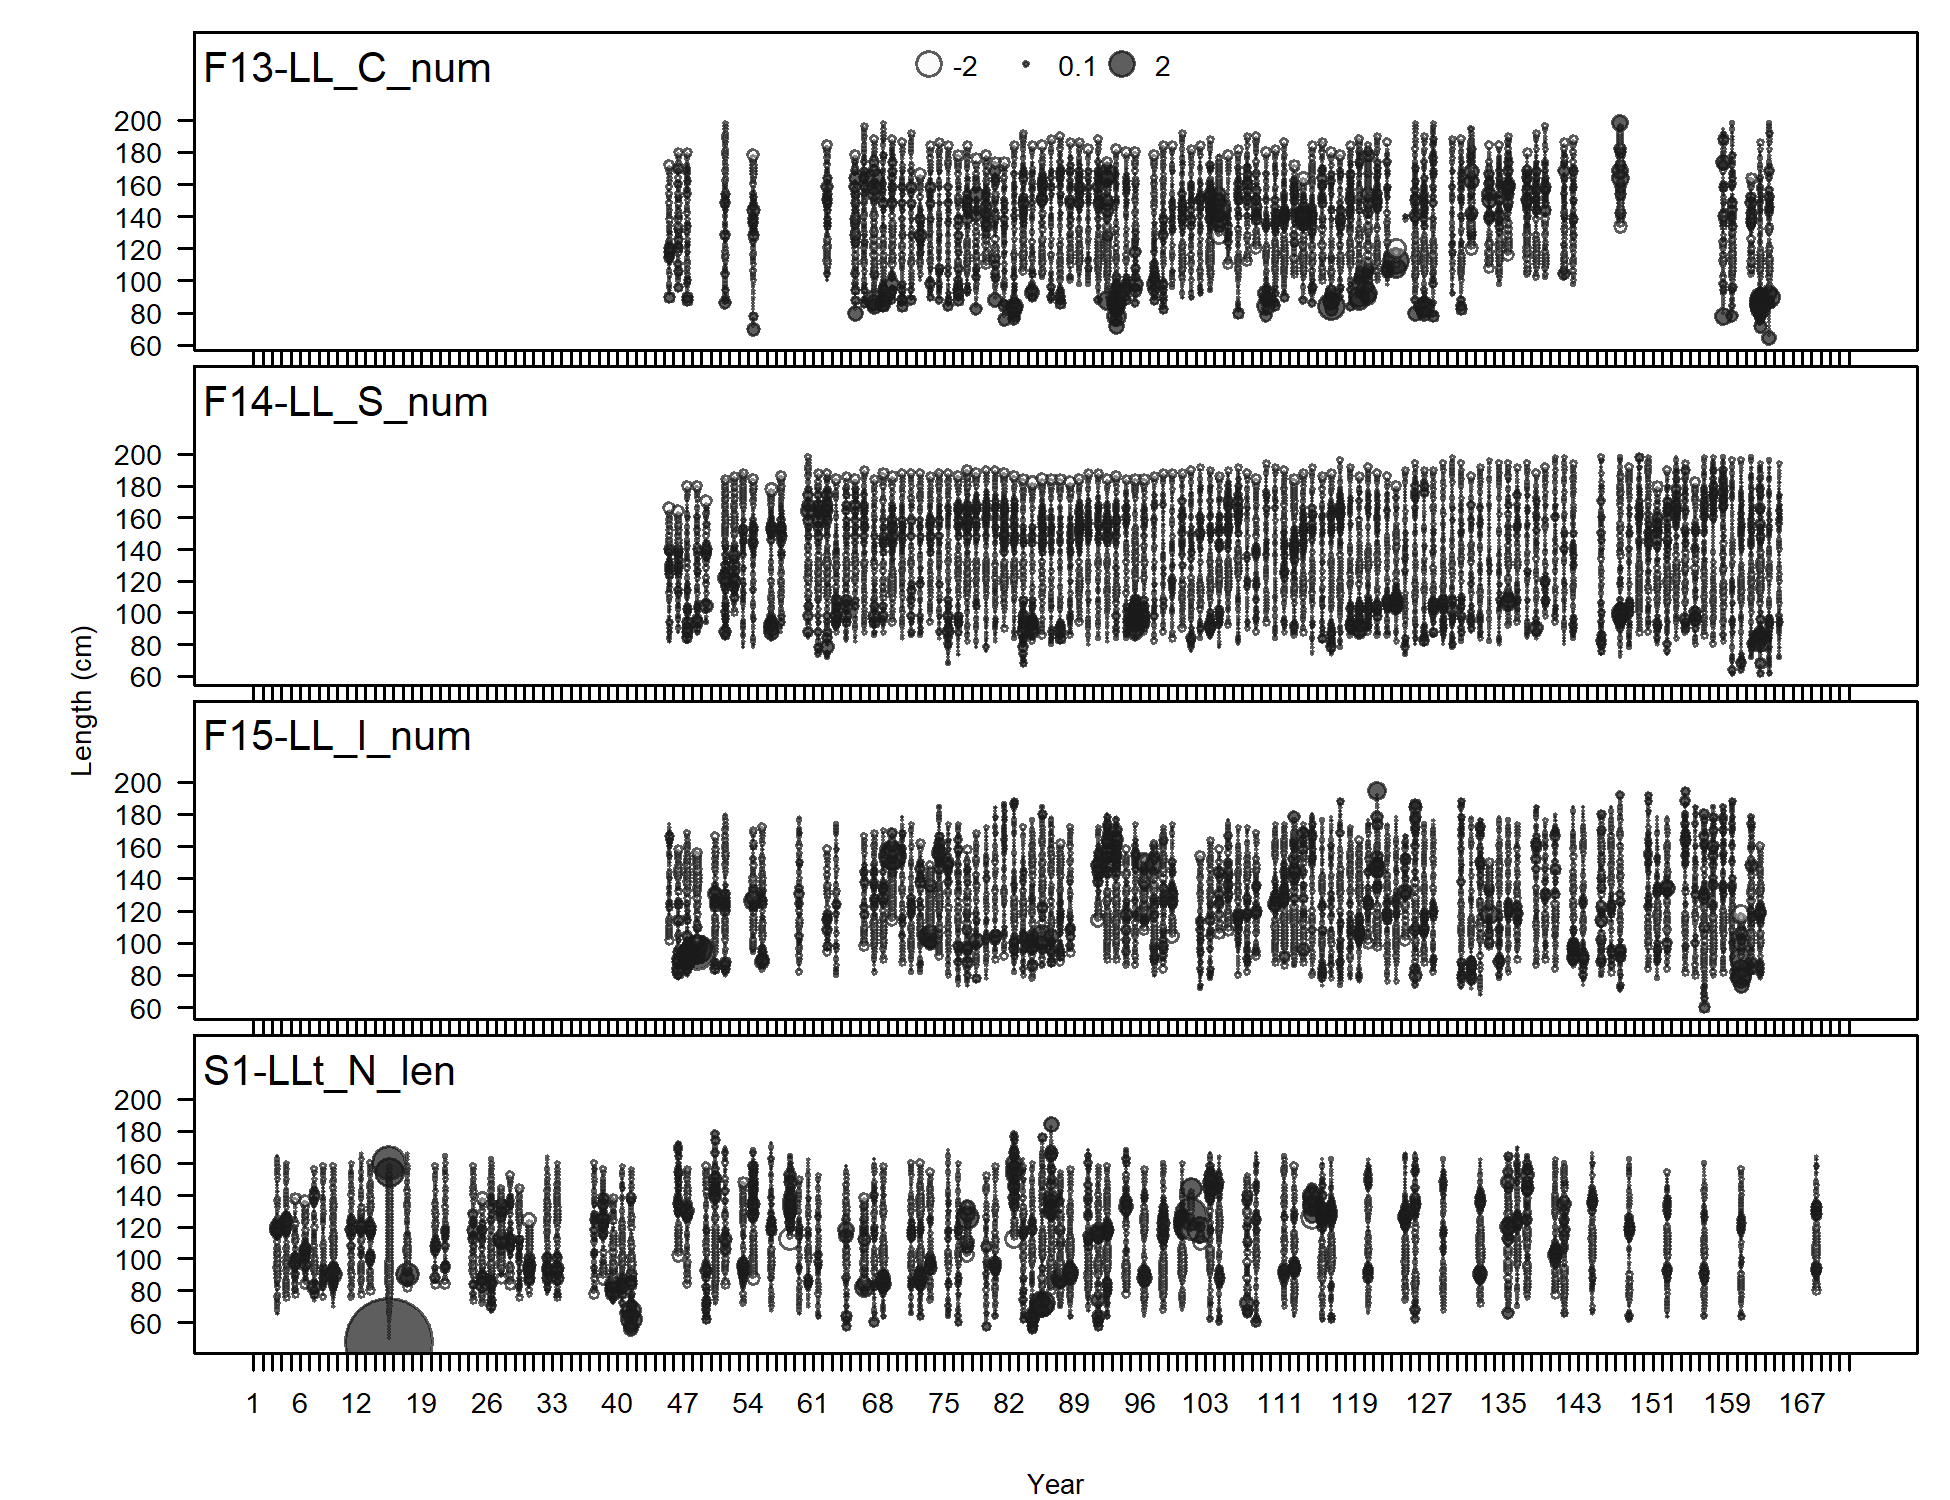
Pearson residuals, whole catch, F13-LL_C_num (max=2.18) (plot 6 of 6)
Closed bubbles are positive residuals (observed > expected) and open bubbles are negative residuals (observed < expected).
file: comp_lenfit_residsflt13mkt0_page6.png
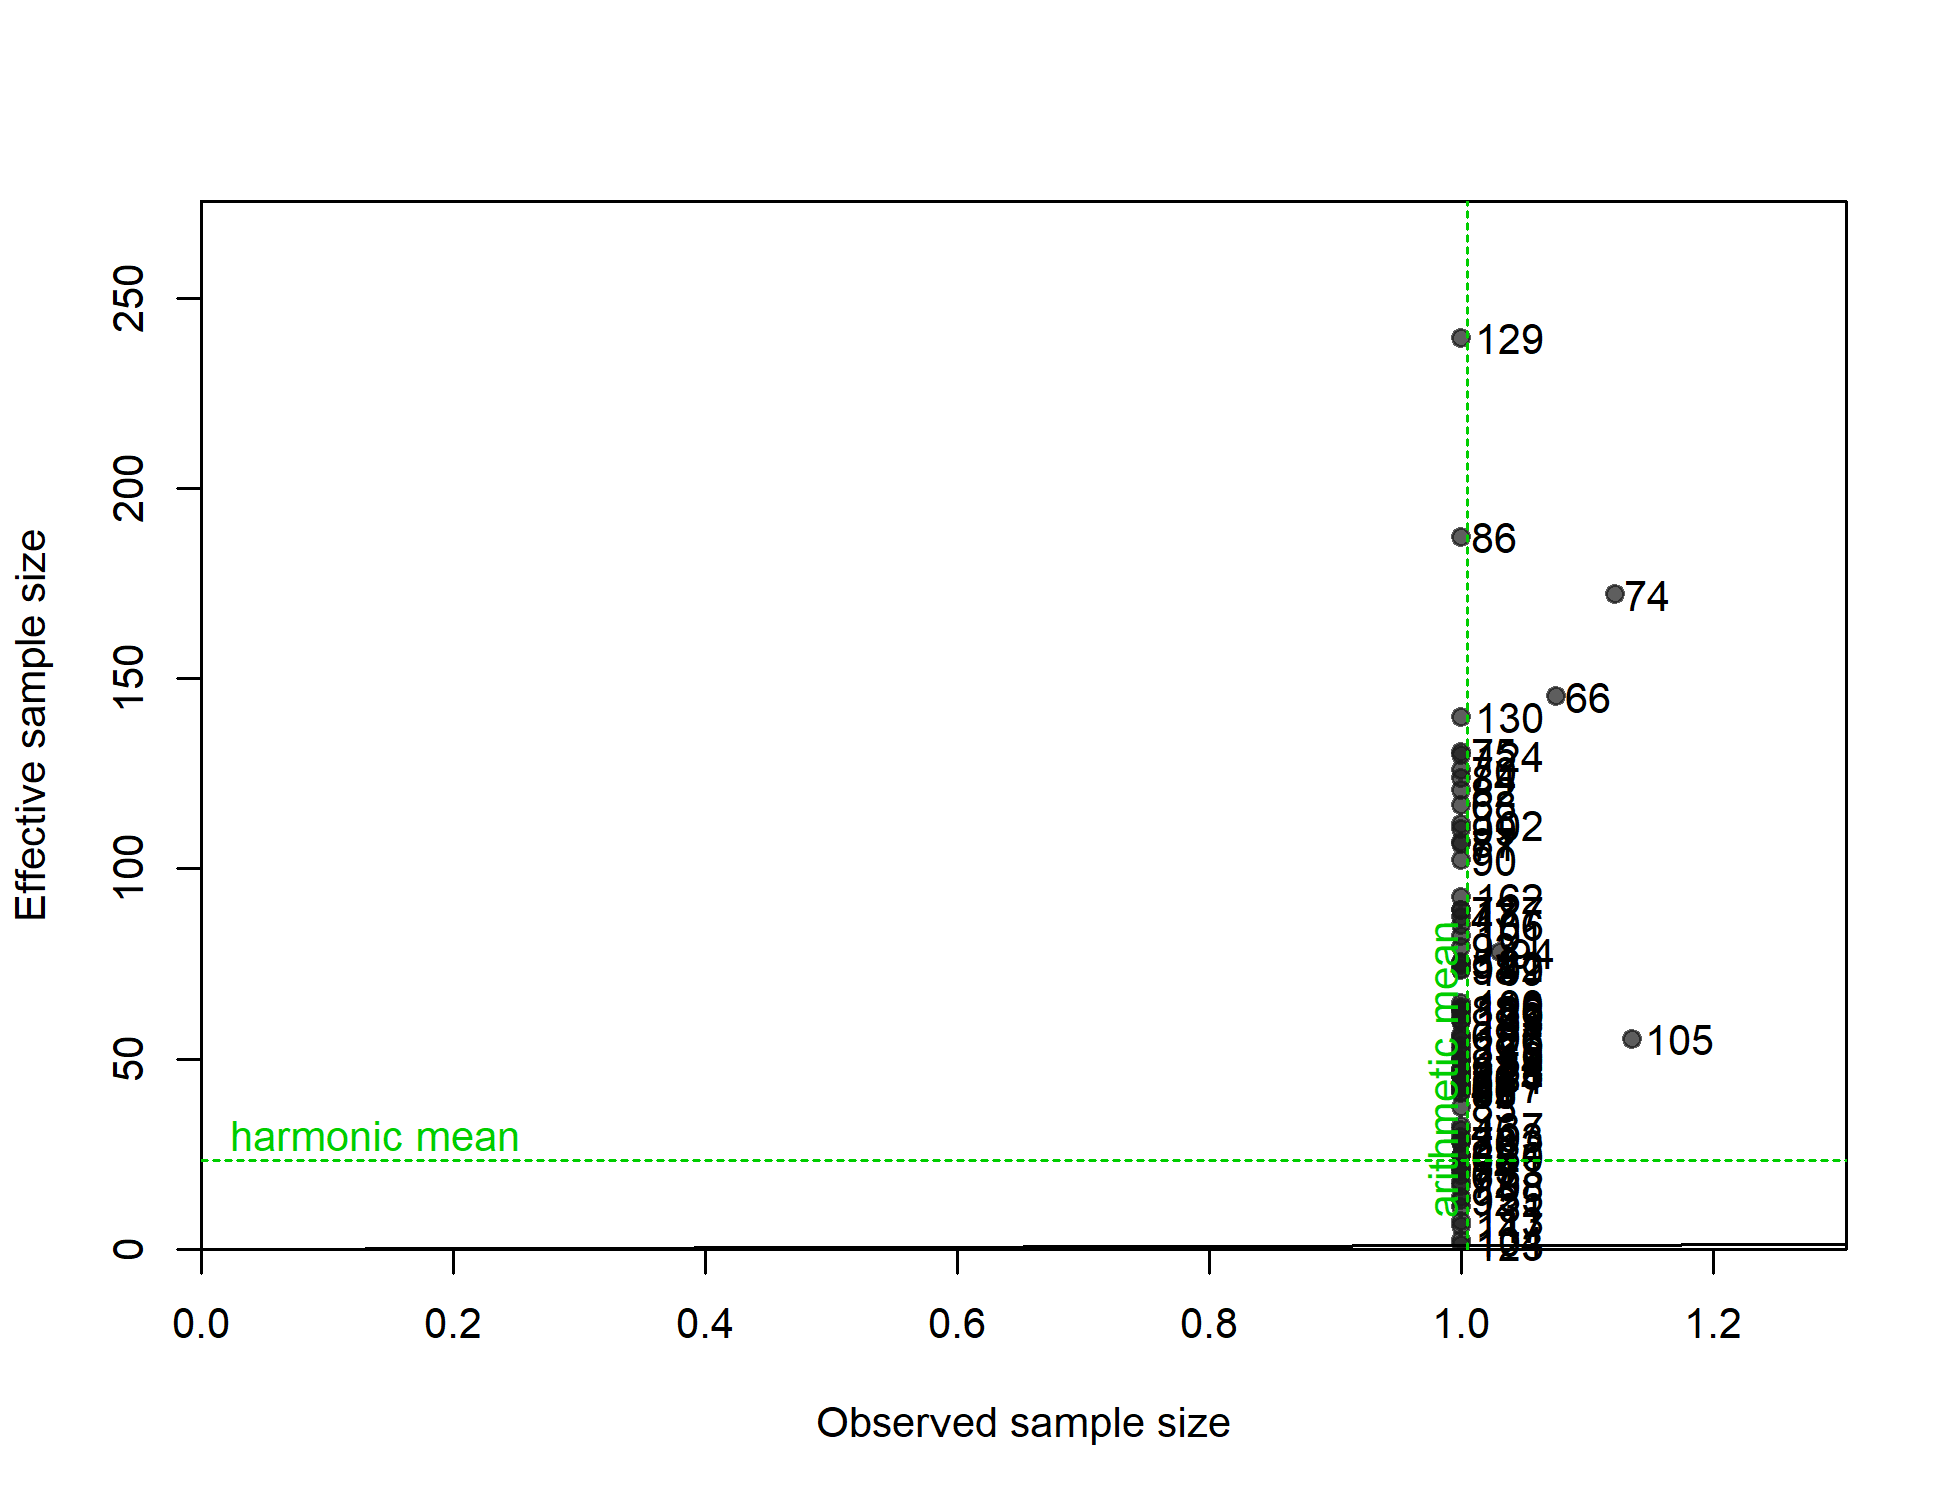
N-EffN comparison, Length comps, whole catch, F13-LL_C_num
file: comp_lenfit_sampsize_flt13mkt0.png
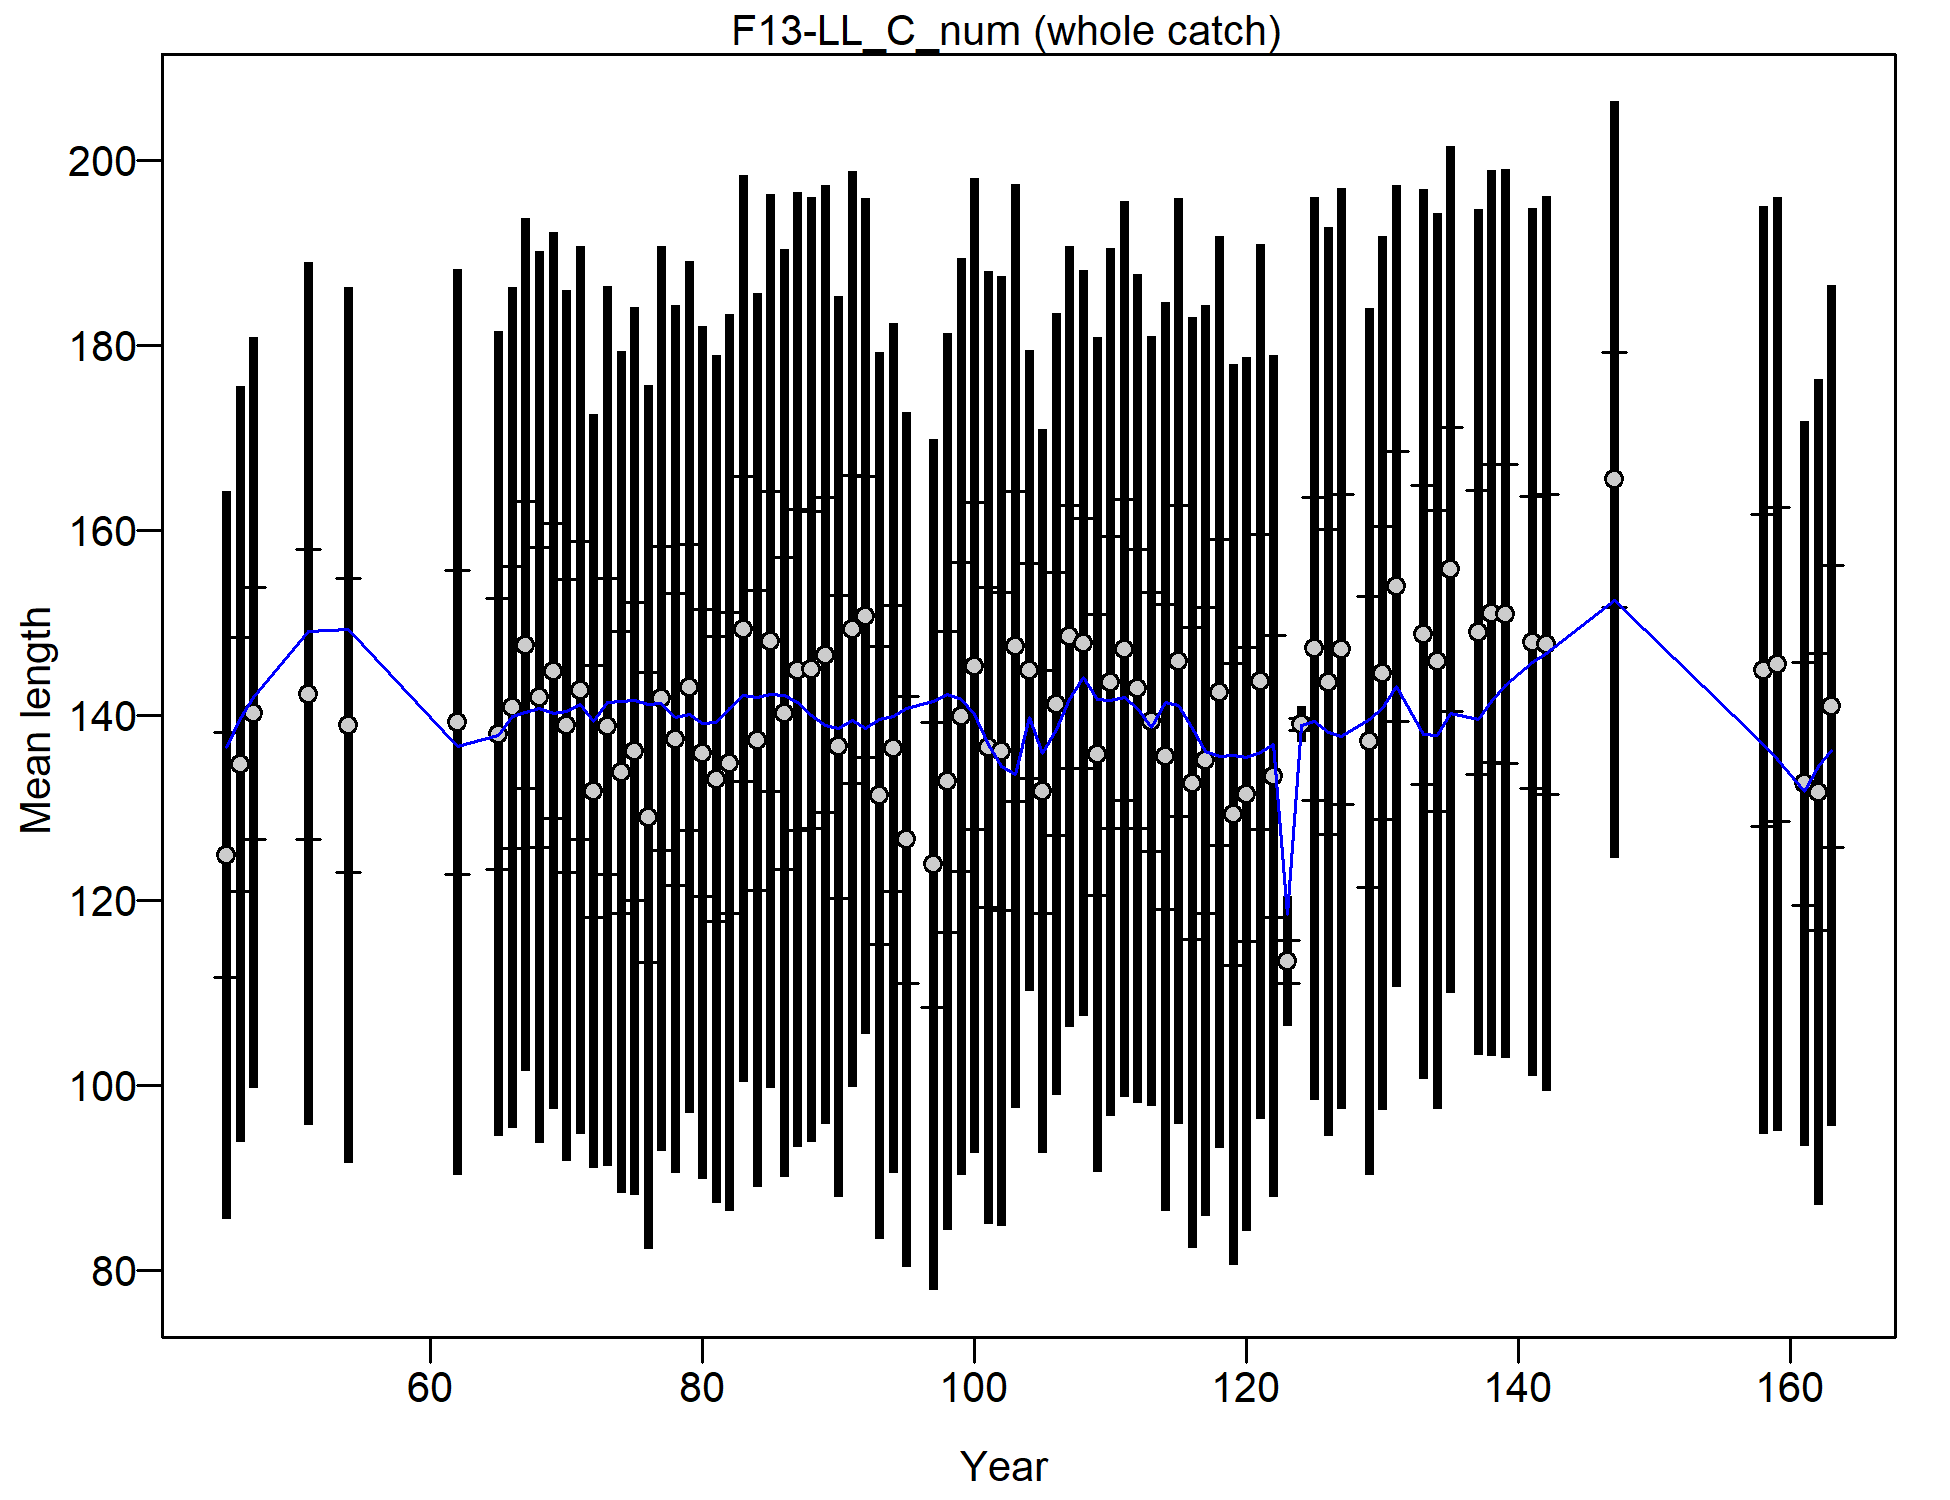
Mean length for F13-LL_C_num with 95% confidence intervals based on current samples sizes.
Francis data weighting method TA1.8: thinner intervals (with capped ends) show result of further adjusting sample sizes based on suggested multiplier (with 95% interval) for len data from F13-LL_C_num:
8.8643 (5.7951-14.8666)
For more info, see
Francis, R.I.C.C. (2011). Data weighting in statistical fisheries stock assessment models. Can. J. Fish. Aquat. Sci. 68: 1124-1138. https://doi.org/10.1139/f2011-025
file: comp_lenfit_data_weighting_TA1.8_F13-LL_C_num.png
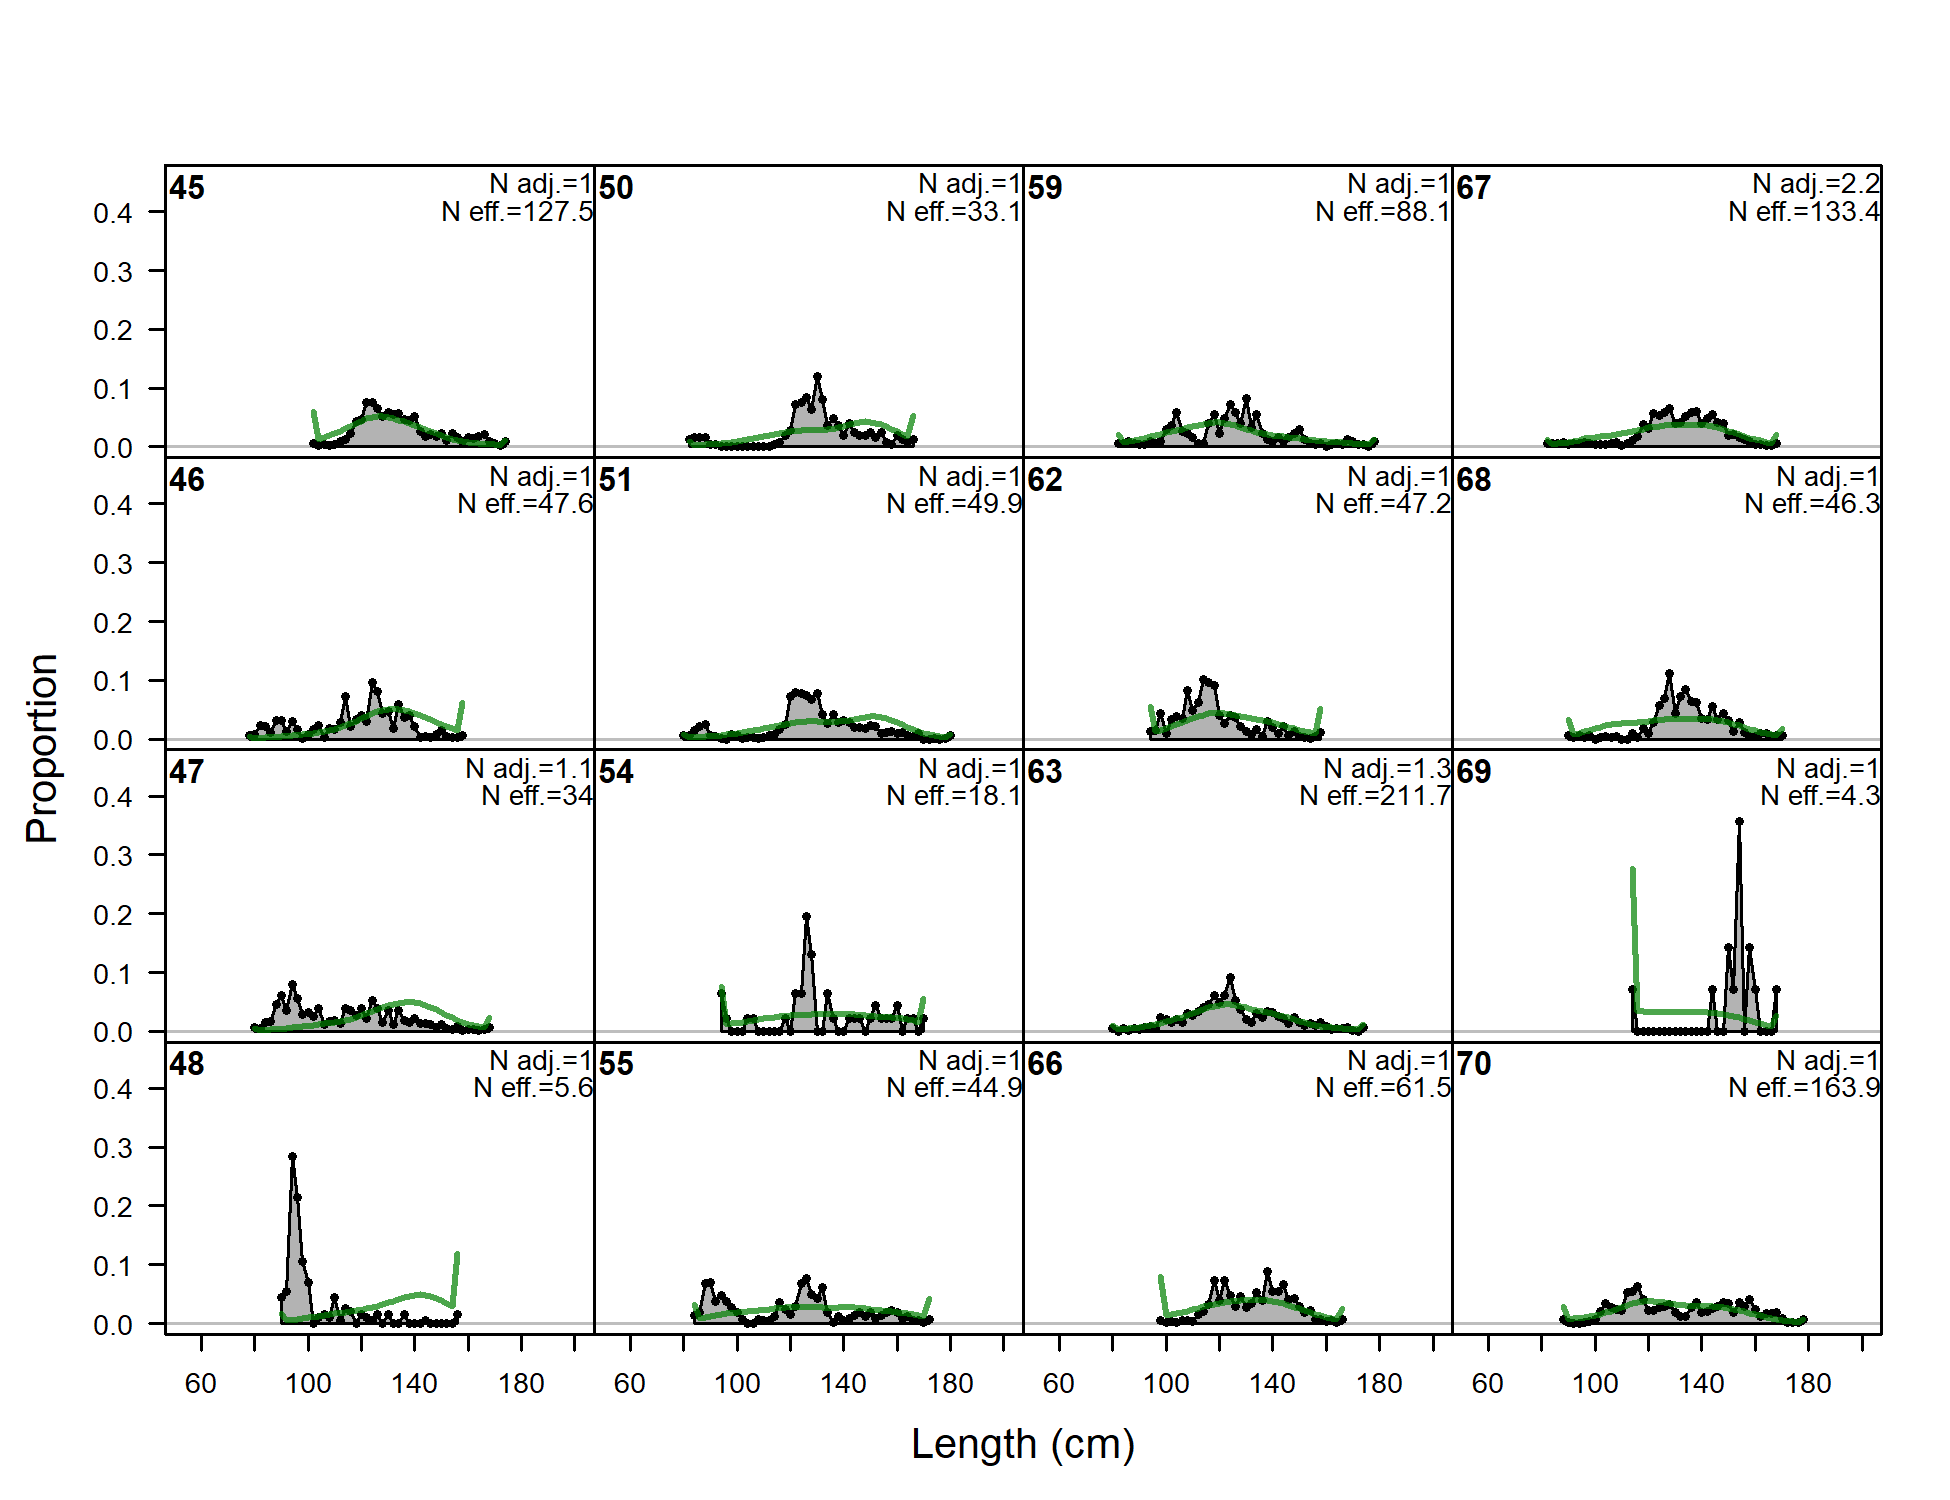
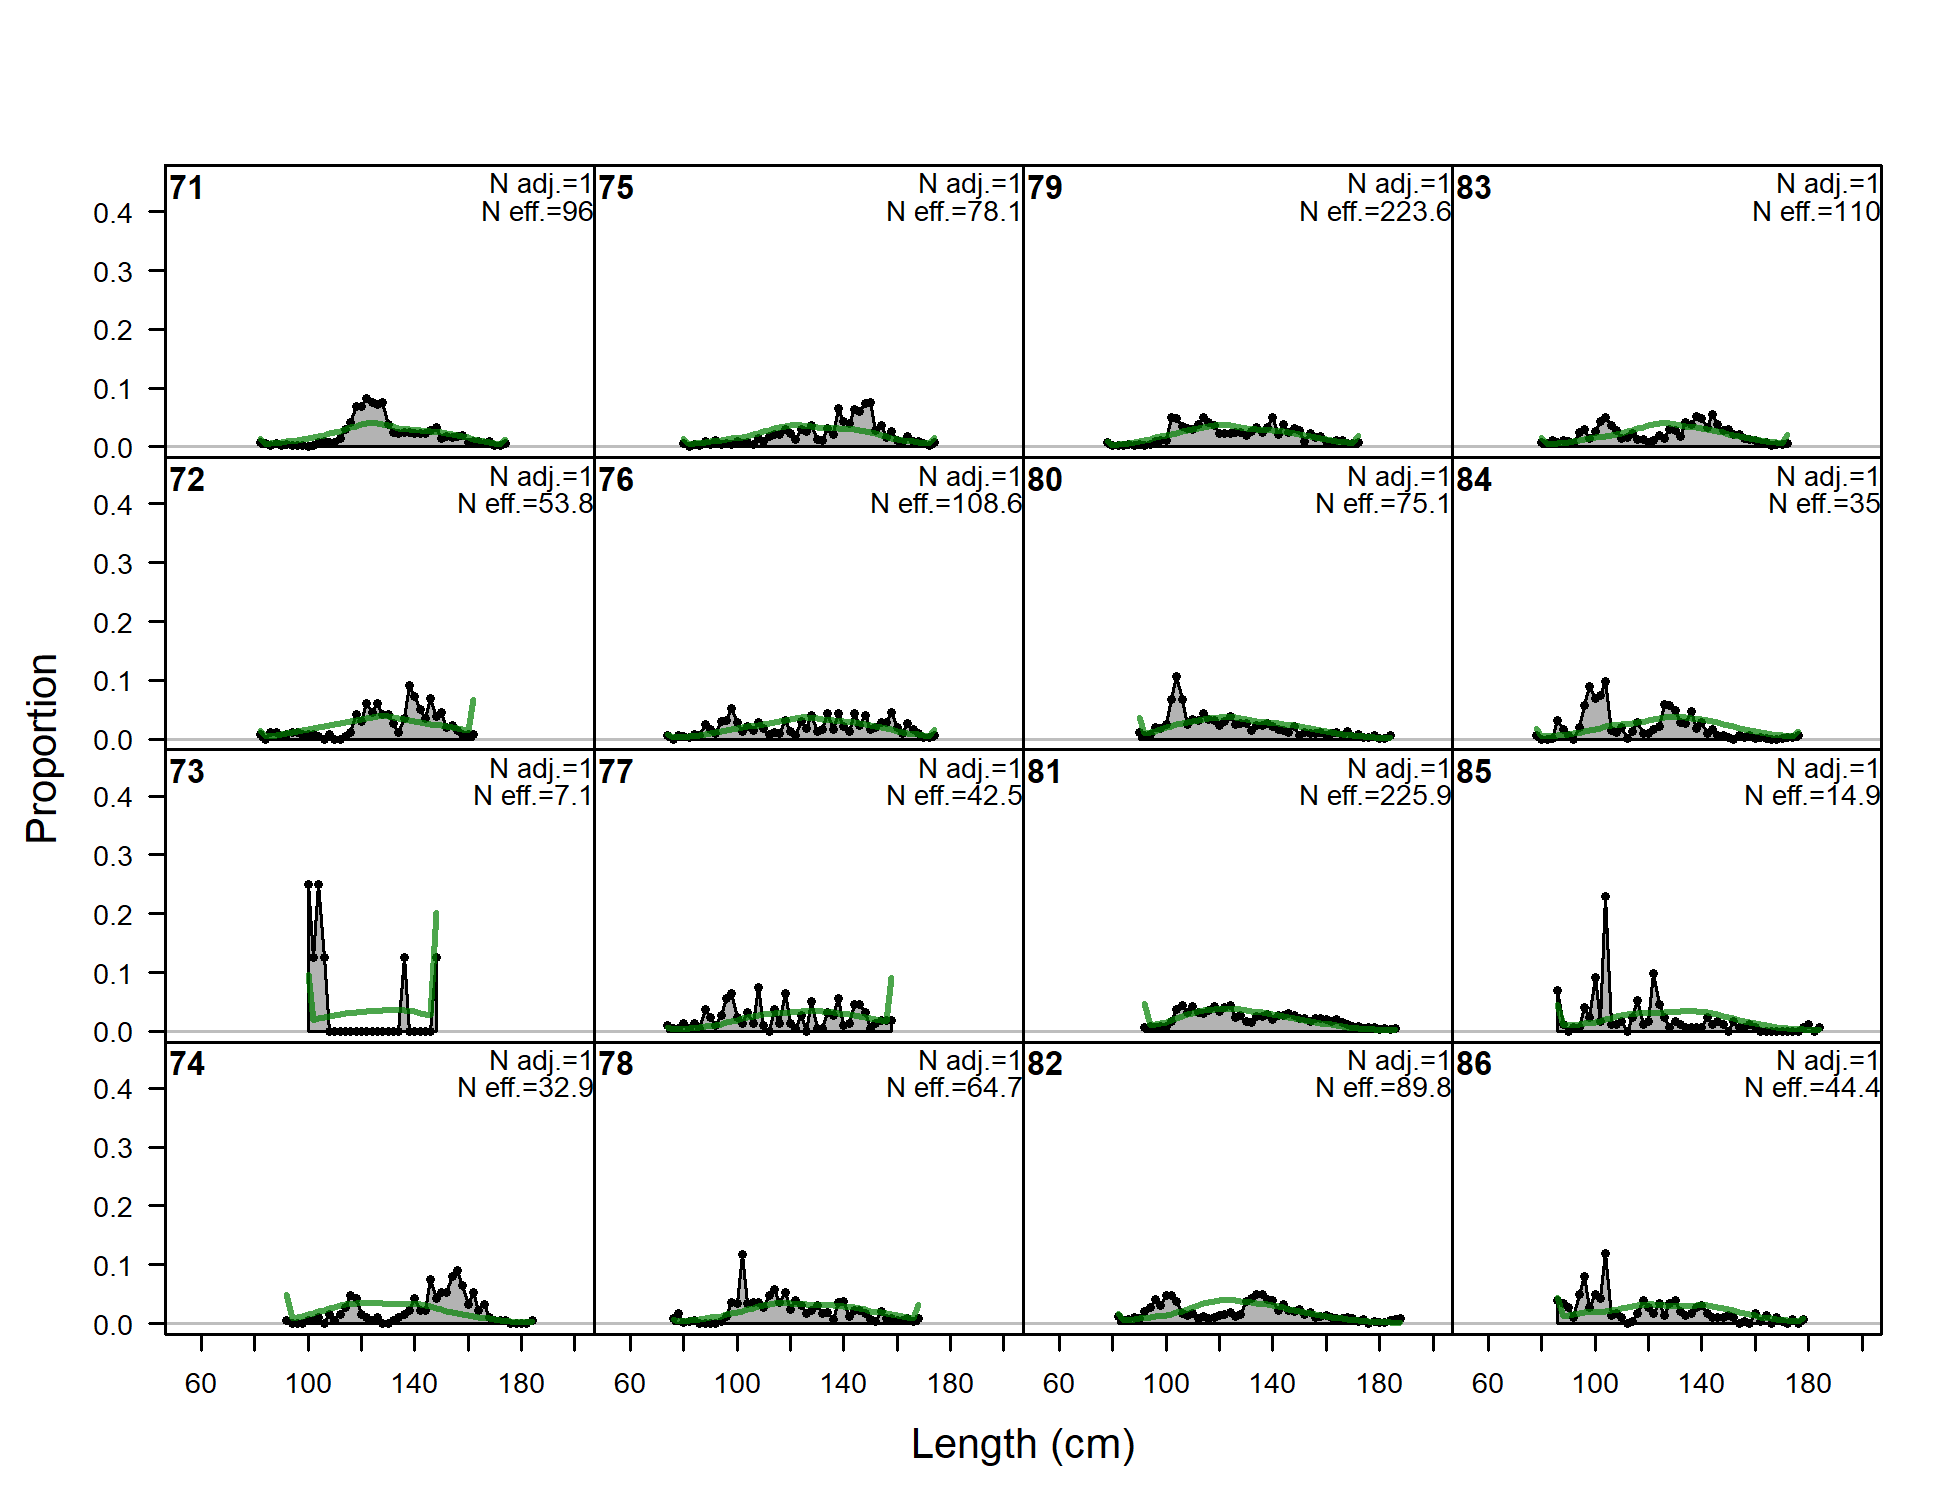
Length comps, whole catch, F14-LL_S_num (plot 1 of 8).
'N adj.' is the input sample size after data-weighting adjustment.N eff. is the calculated effective sample size used in the McAllister-Iannelli tuning method.
file: comp_lenfit_flt14mkt0_page1.png
Length comps, whole catch, F14-LL_S_num (plot 2 of 8)
file: comp_lenfit_flt14mkt0_page2.png
Length comps, whole catch, F14-LL_S_num (plot 3 of 8)
file: comp_lenfit_flt14mkt0_page3.png
Length comps, whole catch, F14-LL_S_num (plot 4 of 8)
file: comp_lenfit_flt14mkt0_page4.png
Length comps, whole catch, F14-LL_S_num (plot 5 of 8)
file: comp_lenfit_flt14mkt0_page5.png
Length comps, whole catch, F14-LL_S_num (plot 6 of 8)
file: comp_lenfit_flt14mkt0_page6.png
Length comps, whole catch, F14-LL_S_num (plot 7 of 8)
file: comp_lenfit_flt14mkt0_page7.png
Length comps, whole catch, F14-LL_S_num (plot 8 of 8)
file: comp_lenfit_flt14mkt0_page8.png
Pearson residuals, whole catch, F14-LL_S_num (max=1.38) (plot 8 of 8)
Closed bubbles are positive residuals (observed > expected) and open bubbles are negative residuals (observed < expected).
file: comp_lenfit_residsflt14mkt0_page8.png
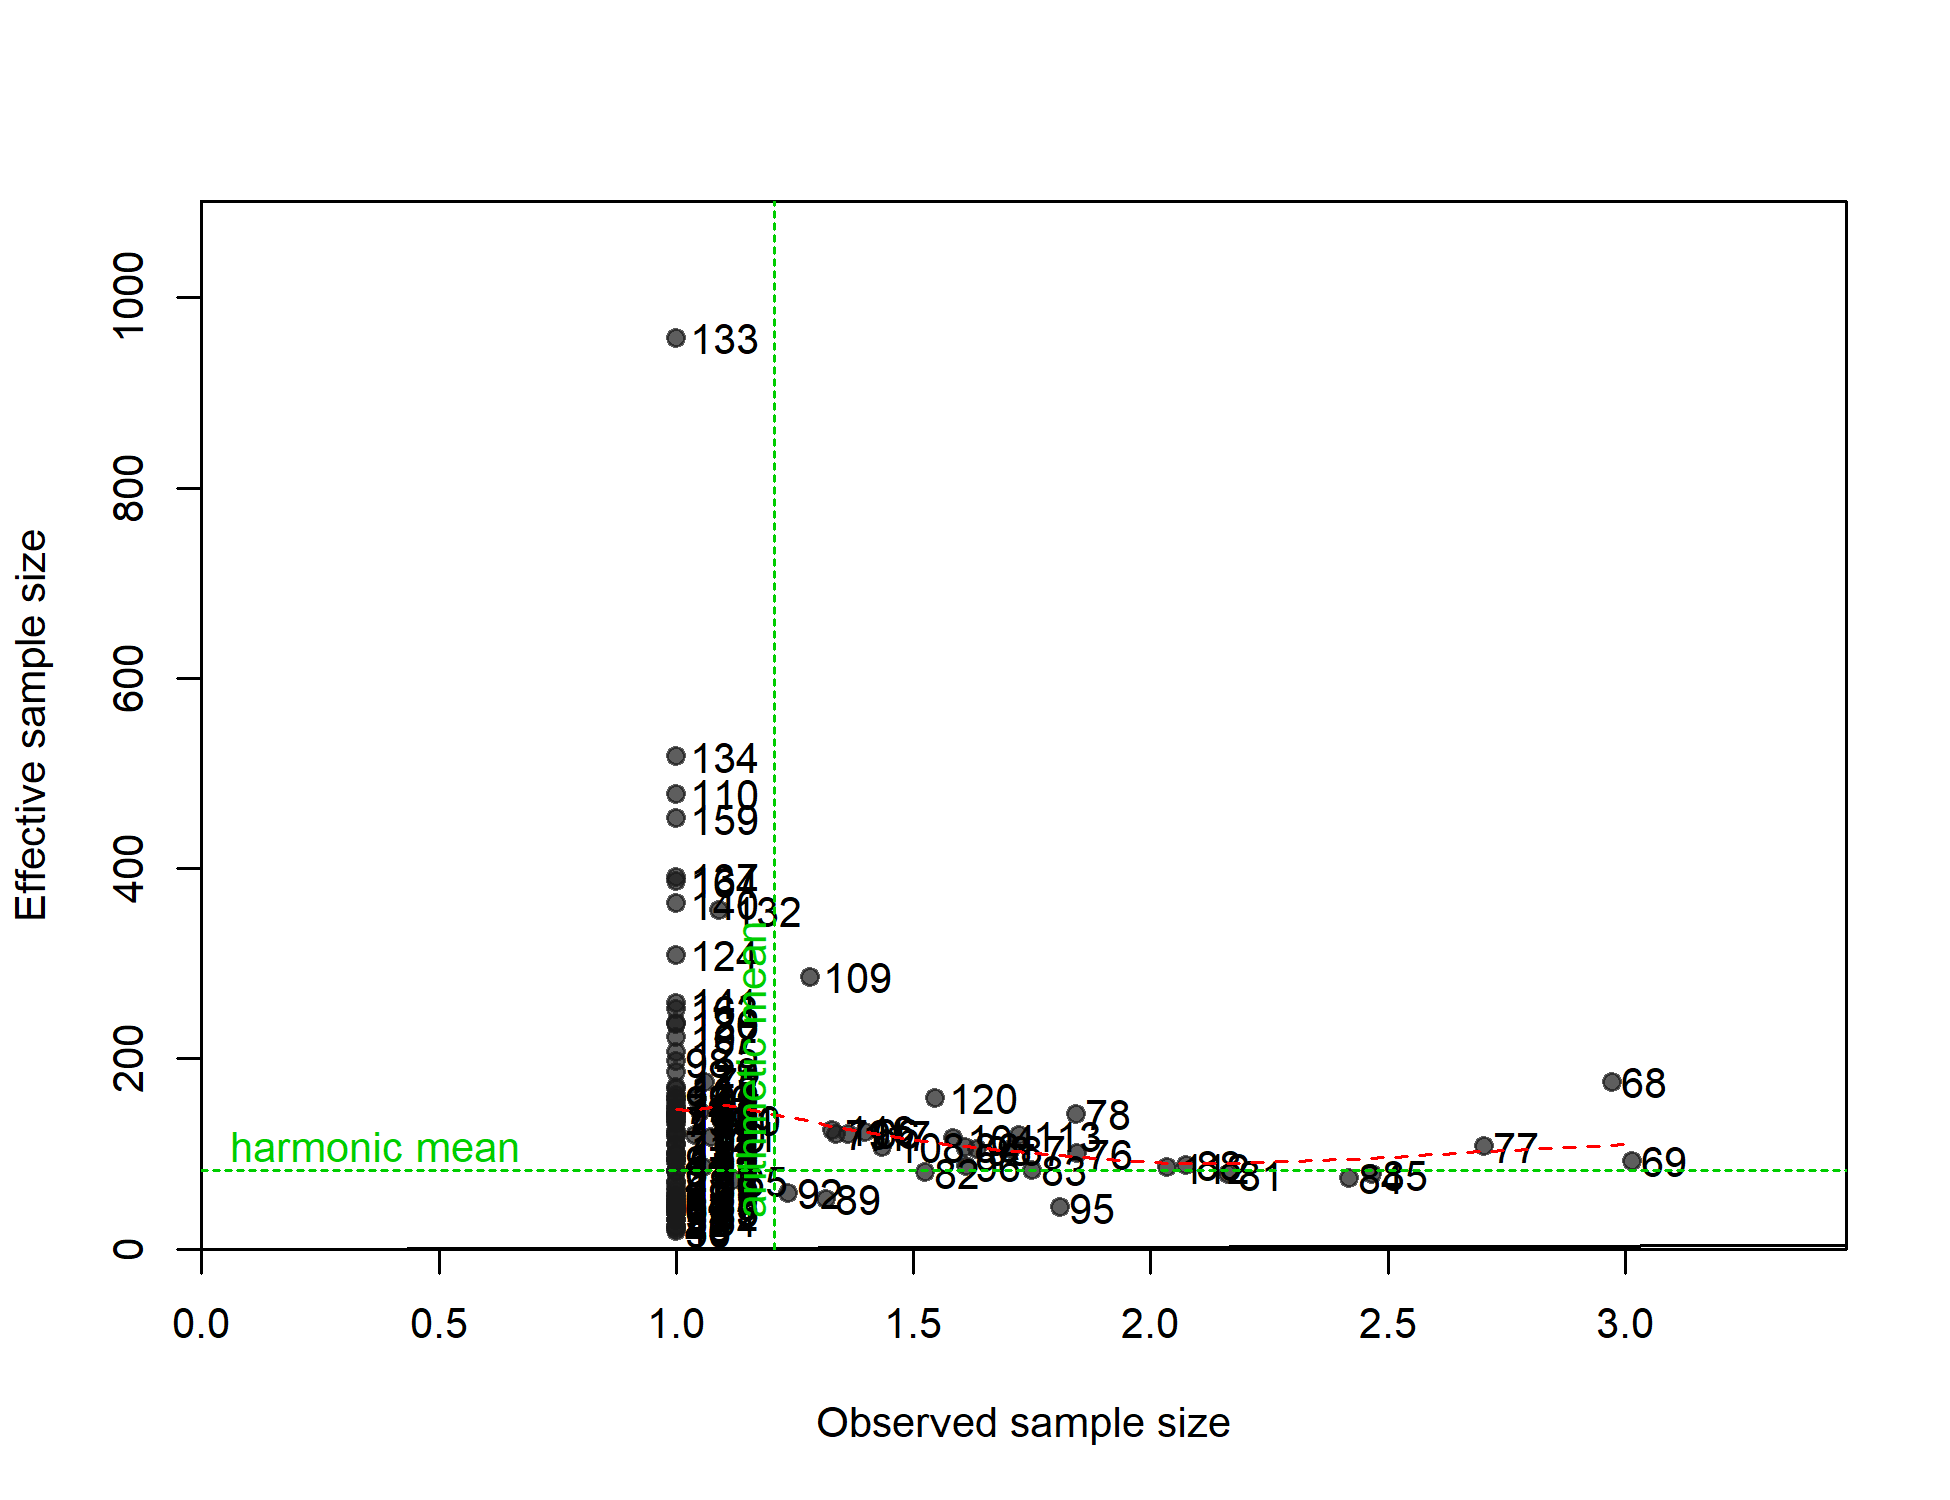
N-EffN comparison, Length comps, whole catch, F14-LL_S_num
file: comp_lenfit_sampsize_flt14mkt0.png
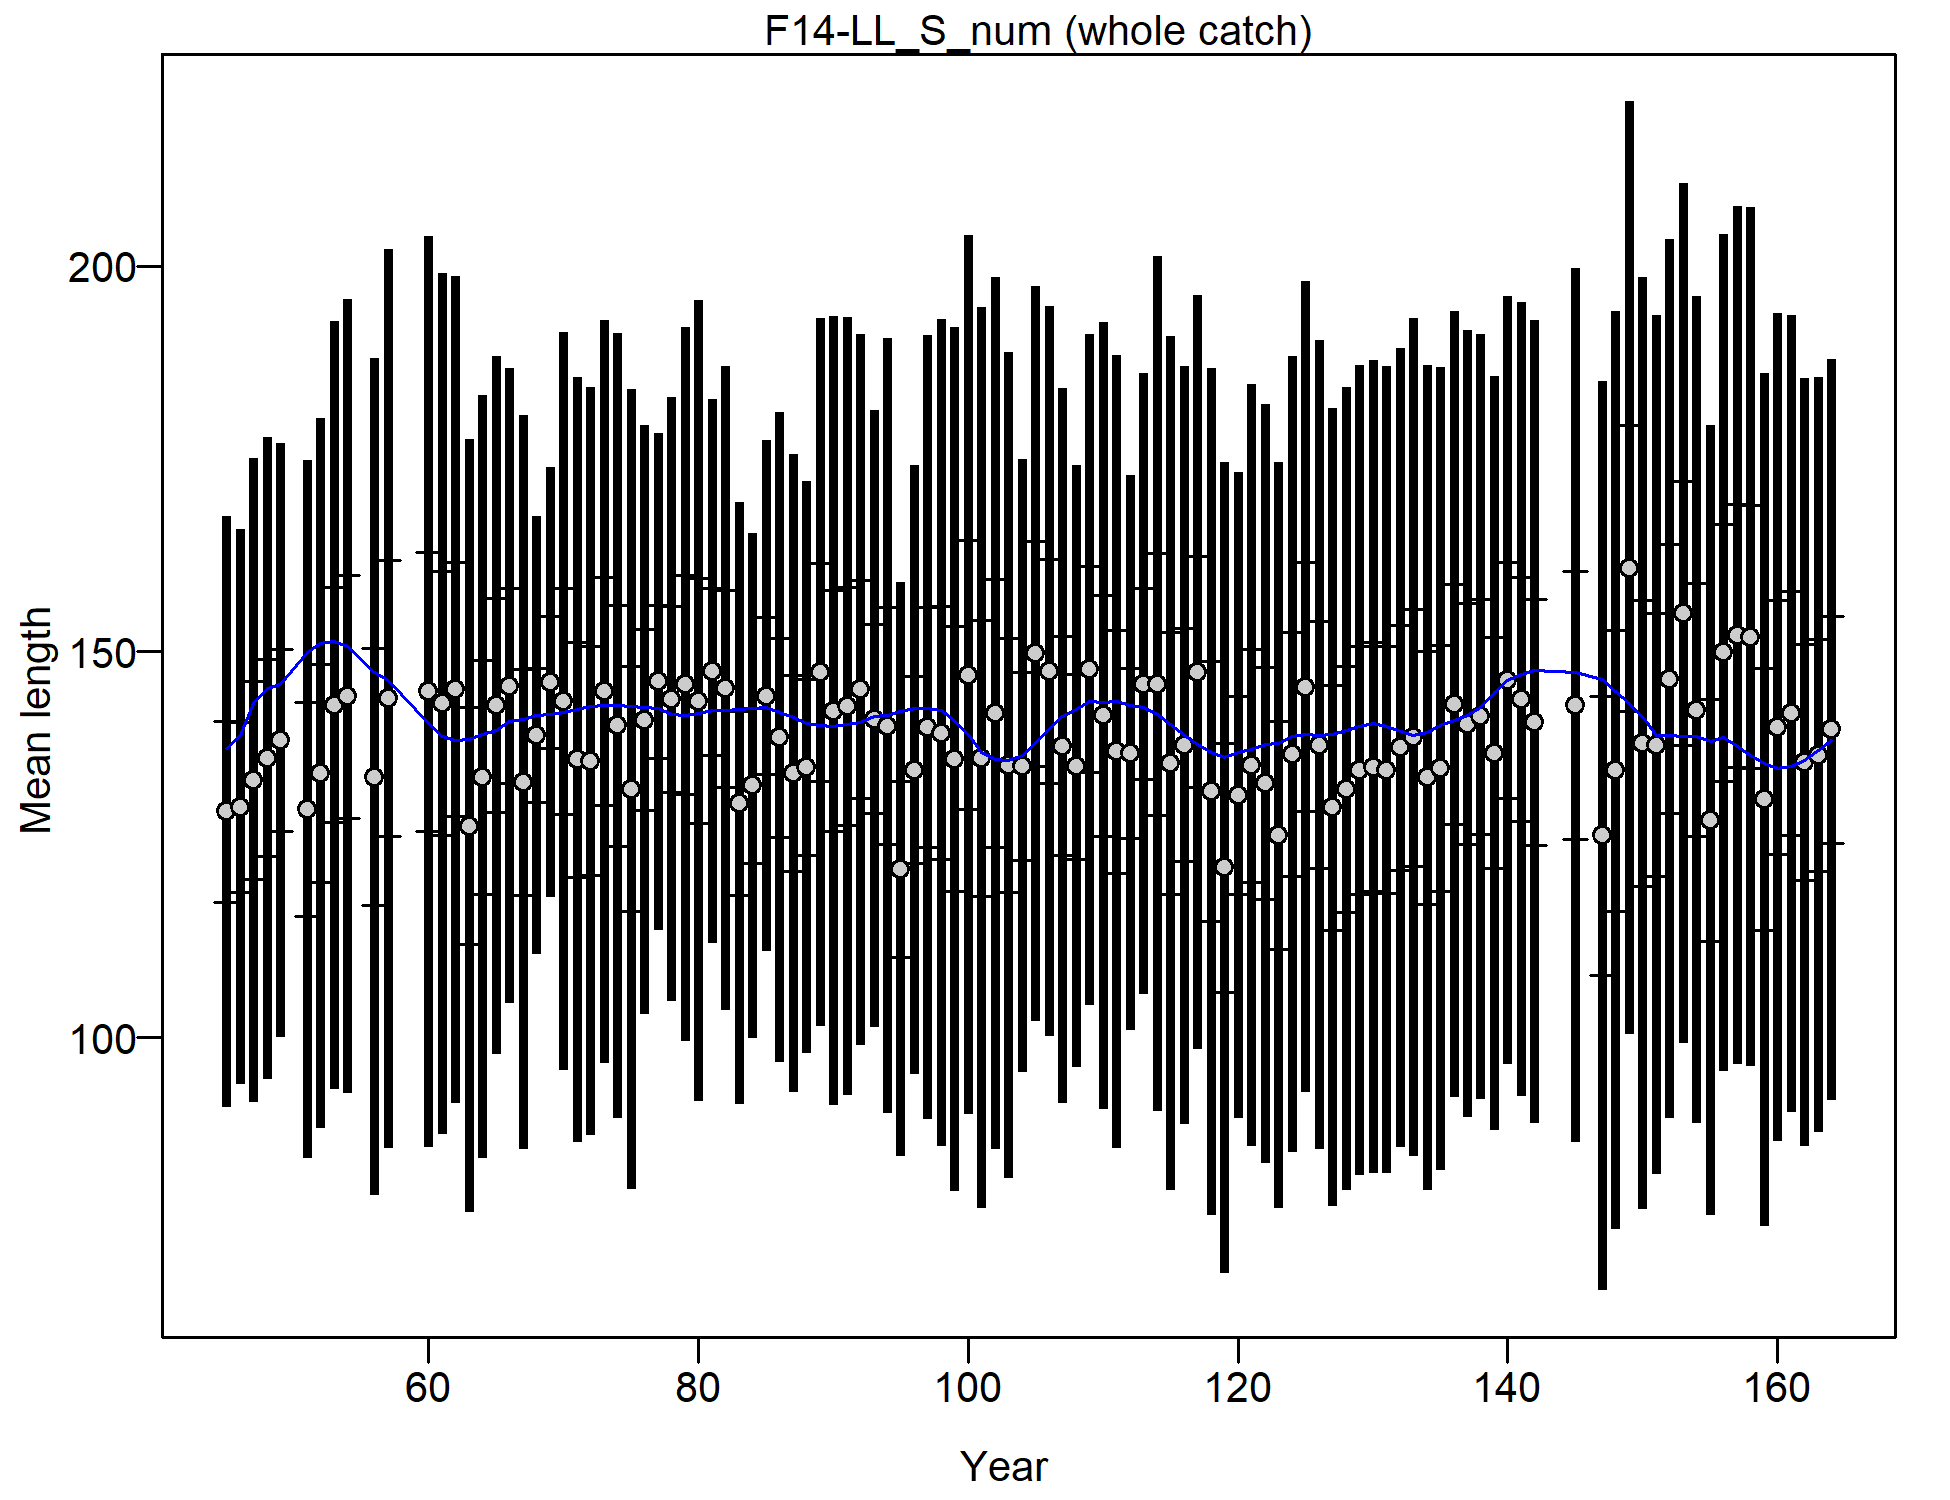
Mean length for F14-LL_S_num with 95% confidence intervals based on current samples sizes.
Francis data weighting method TA1.8: thinner intervals (with capped ends) show result of further adjusting sample sizes based on suggested multiplier (with 95% interval) for len data from F14-LL_S_num:
10.6439 (8.2045-14.6754)
For more info, see
Francis, R.I.C.C. (2011). Data weighting in statistical fisheries stock assessment models. Can. J. Fish. Aquat. Sci. 68: 1124-1138. https://doi.org/10.1139/f2011-025
file: comp_lenfit_data_weighting_TA1.8_F14-LL_S_num.png
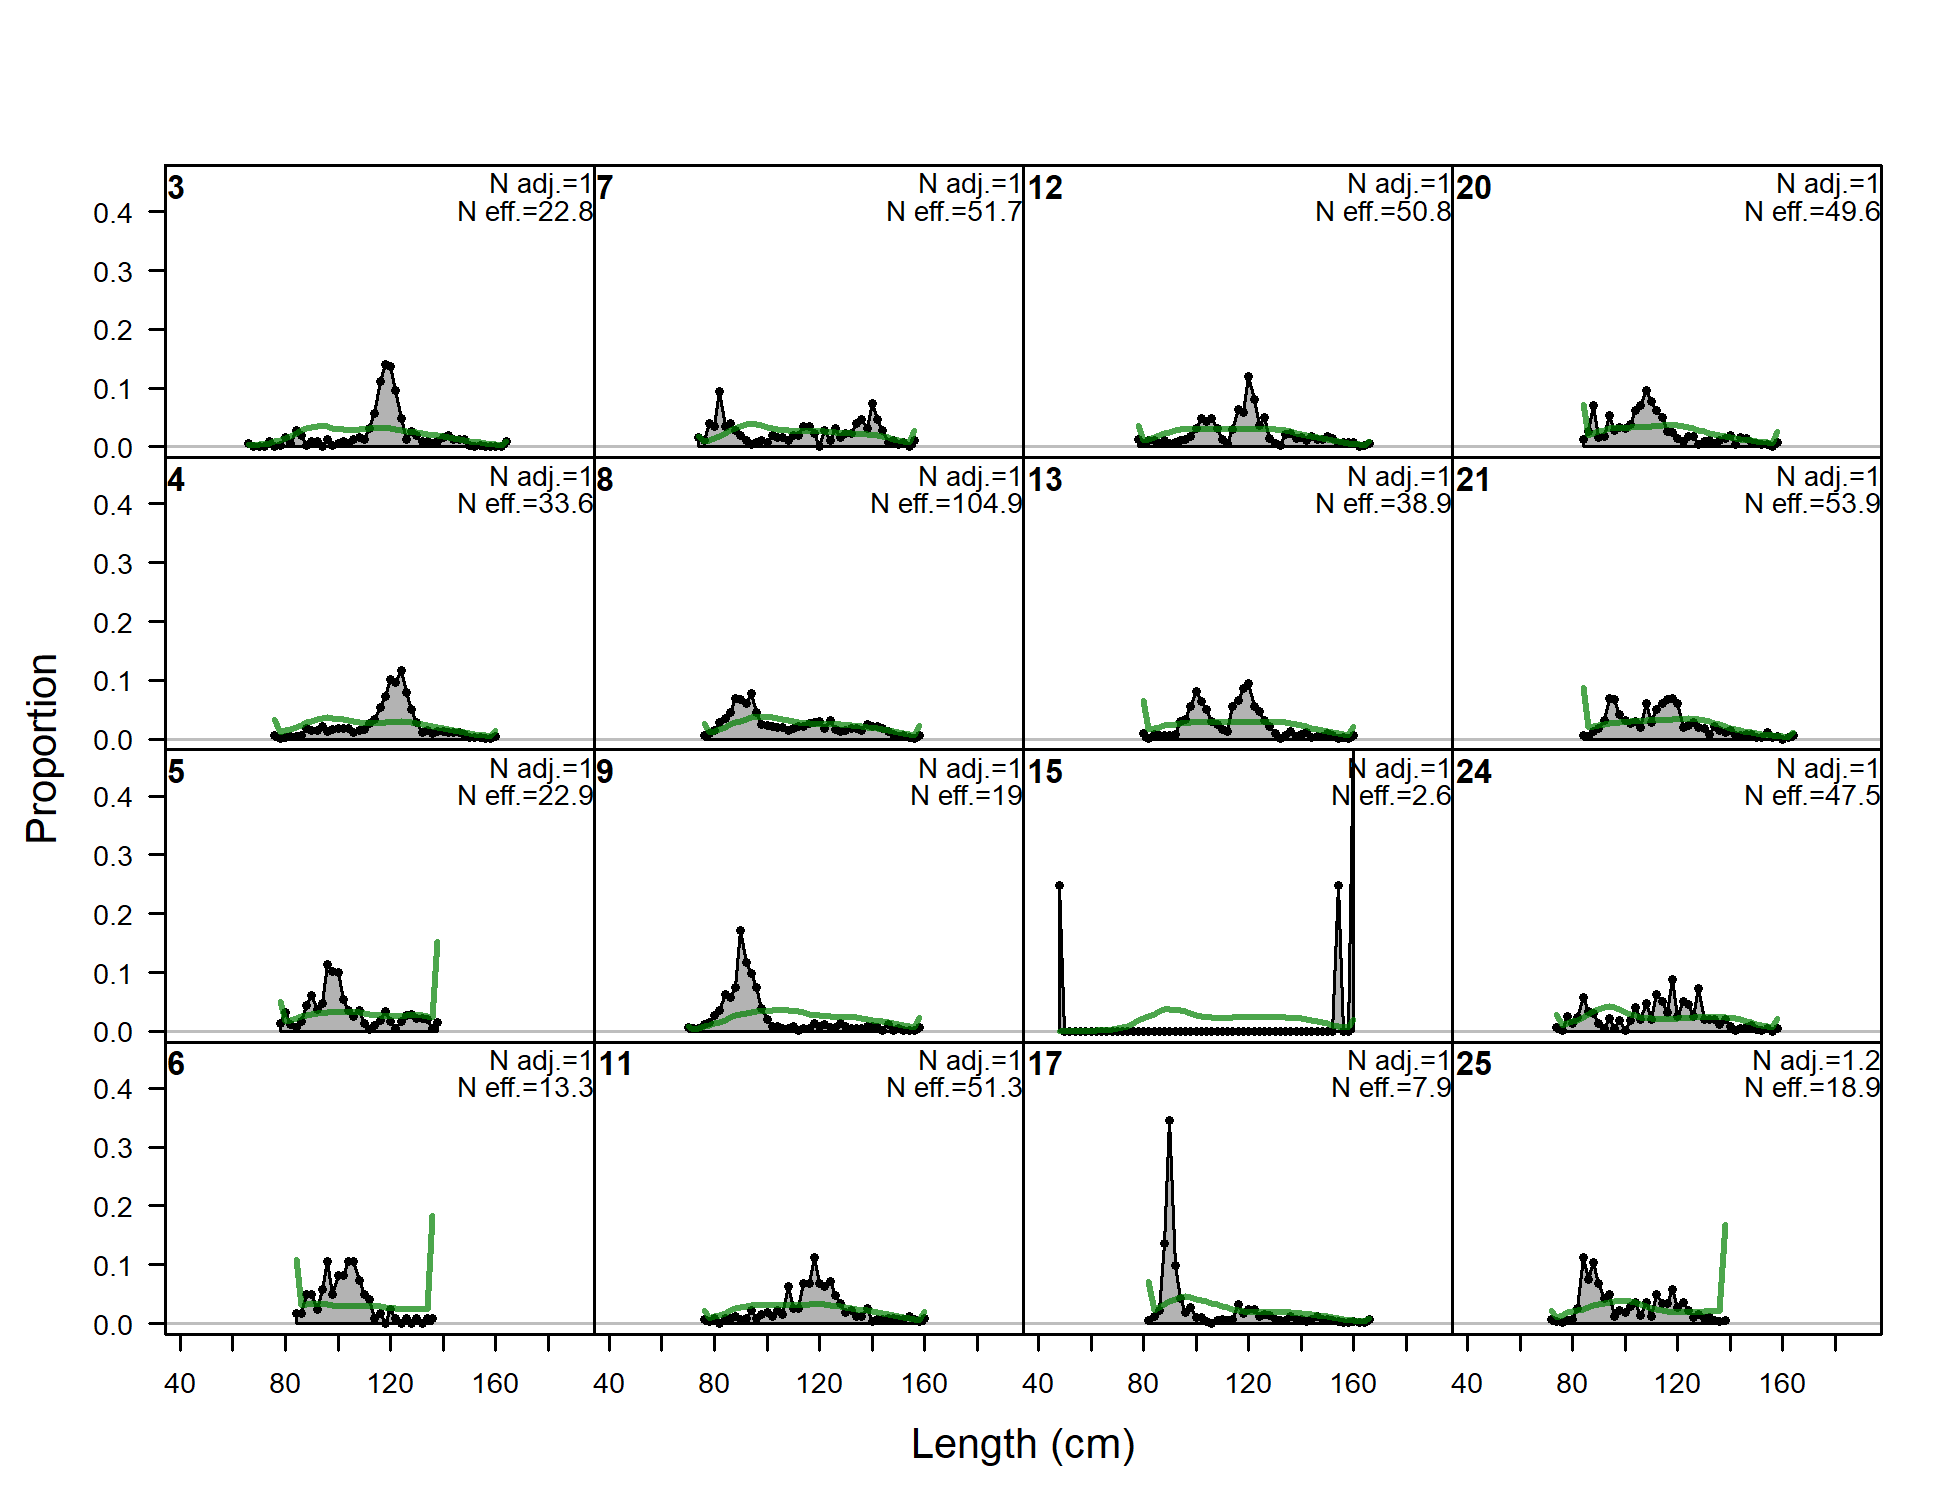
Length comps, whole catch, F15-LL_I_num (plot 1 of 6).
'N adj.' is the input sample size after data-weighting adjustment.N eff. is the calculated effective sample size used in the McAllister-Iannelli tuning method.
file: comp_lenfit_flt15mkt0_page1.png
Length comps, whole catch, F15-LL_I_num (plot 2 of 6)
file: comp_lenfit_flt15mkt0_page2.png
Length comps, whole catch, F15-LL_I_num (plot 3 of 6)
file: comp_lenfit_flt15mkt0_page3.png
Length comps, whole catch, F15-LL_I_num (plot 4 of 6)
file: comp_lenfit_flt15mkt0_page4.png
Length comps, whole catch, F15-LL_I_num (plot 5 of 6)
file: comp_lenfit_flt15mkt0_page5.png
Length comps, whole catch, F15-LL_I_num (plot 6 of 6)
file: comp_lenfit_flt15mkt0_page6.png
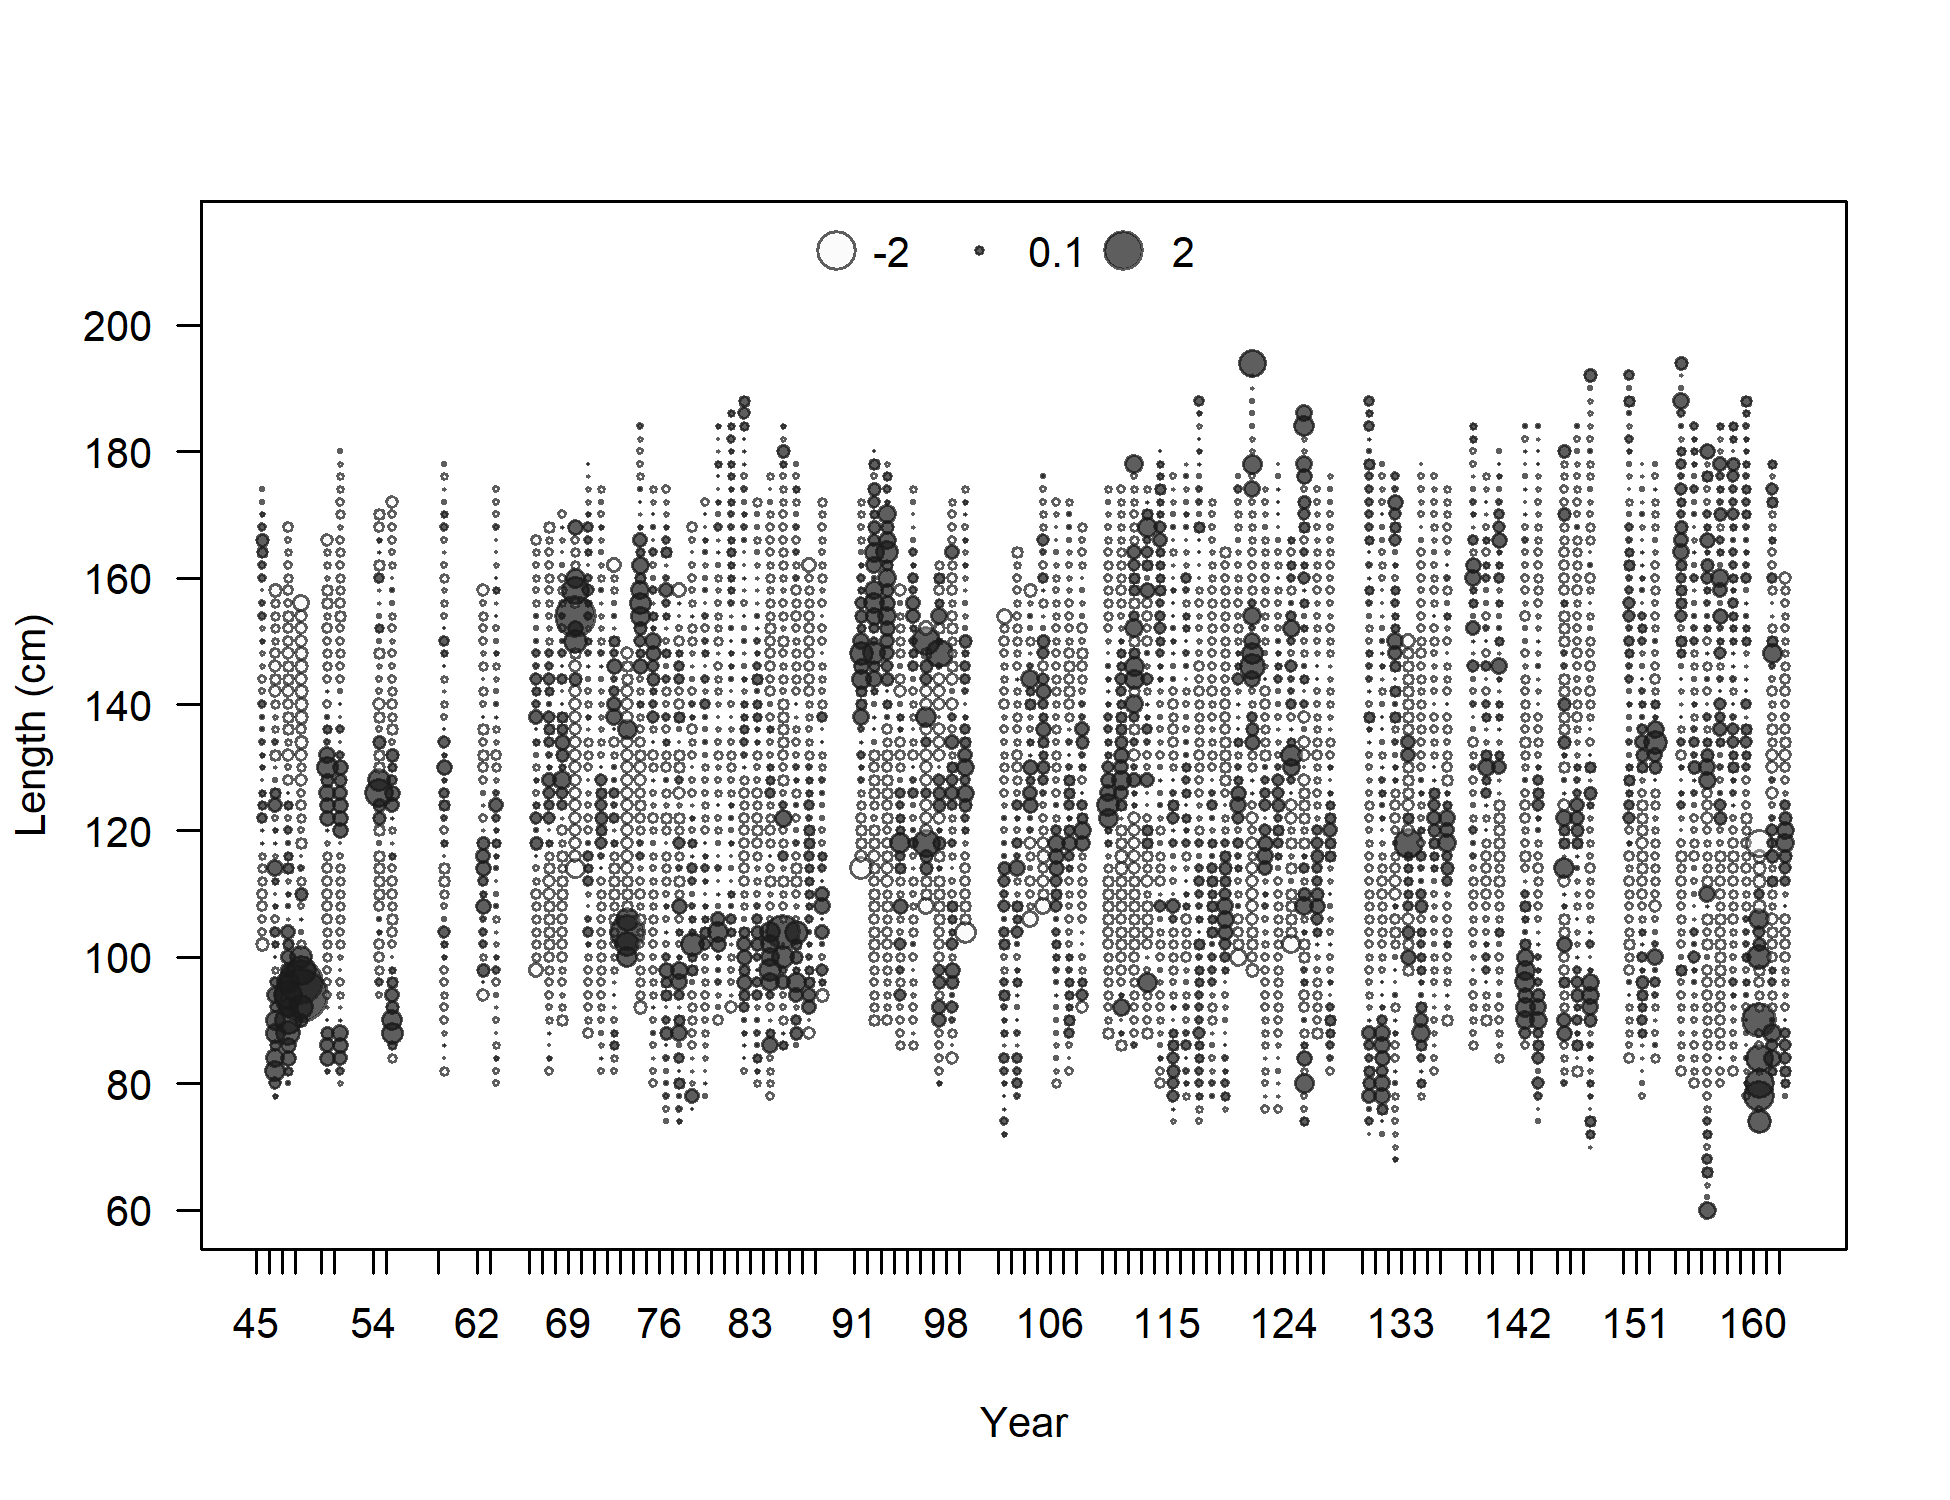
Pearson residuals, whole catch, F15-LL_I_num (max=3.68) (plot 6 of 6)
Closed bubbles are positive residuals (observed > expected) and open bubbles are negative residuals (observed < expected).
file: comp_lenfit_residsflt15mkt0_page6.png
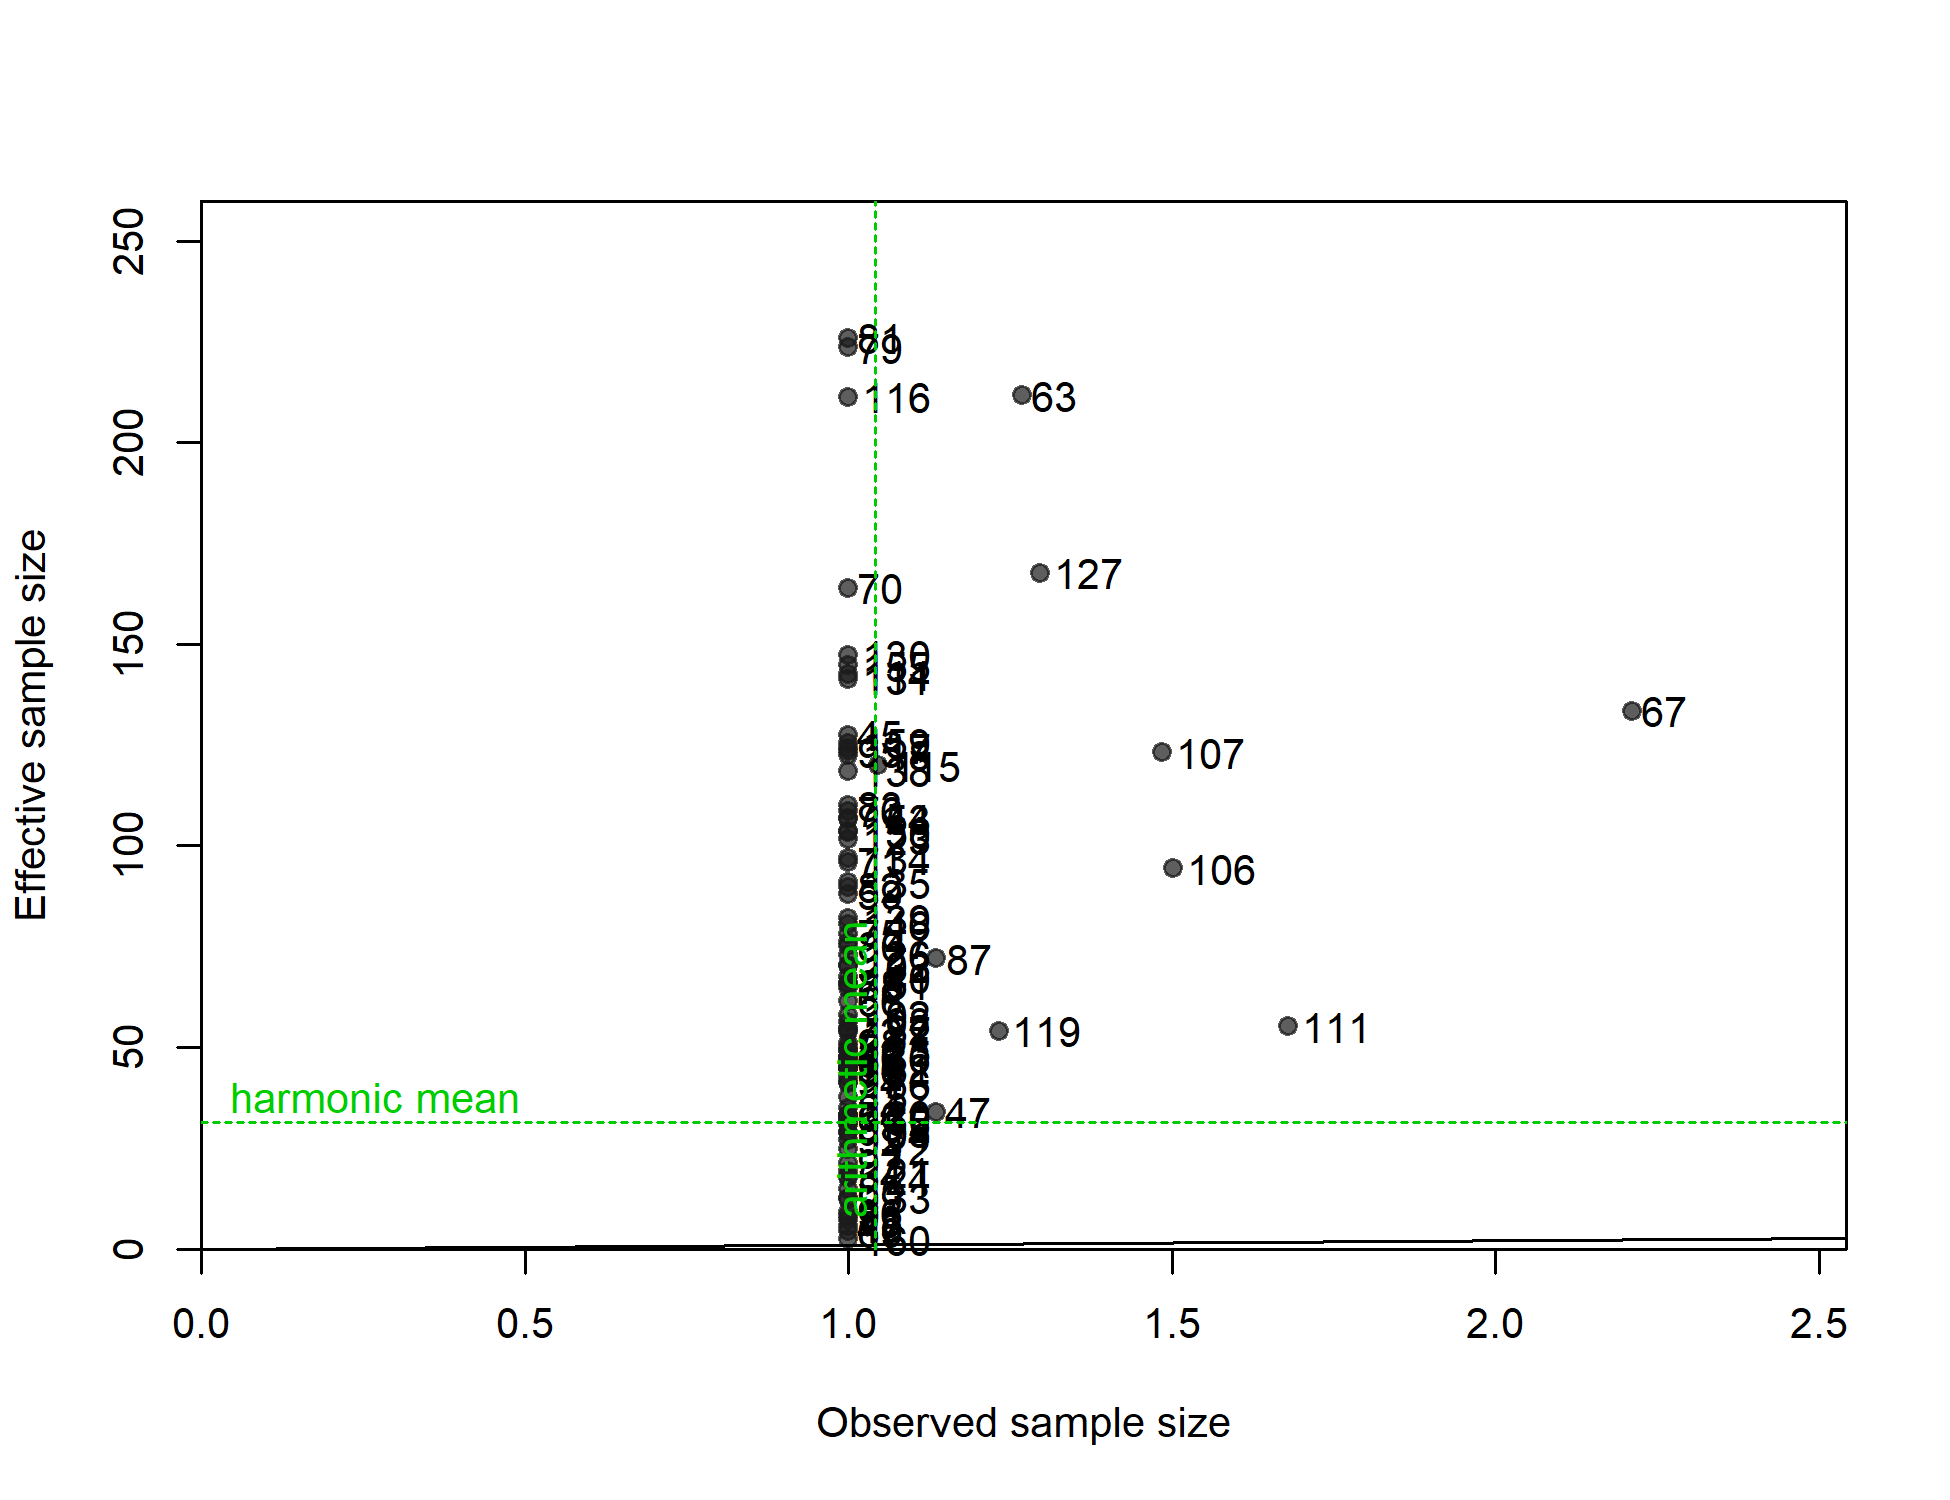
N-EffN comparison, Length comps, whole catch, F15-LL_I_num
file: comp_lenfit_sampsize_flt15mkt0.png
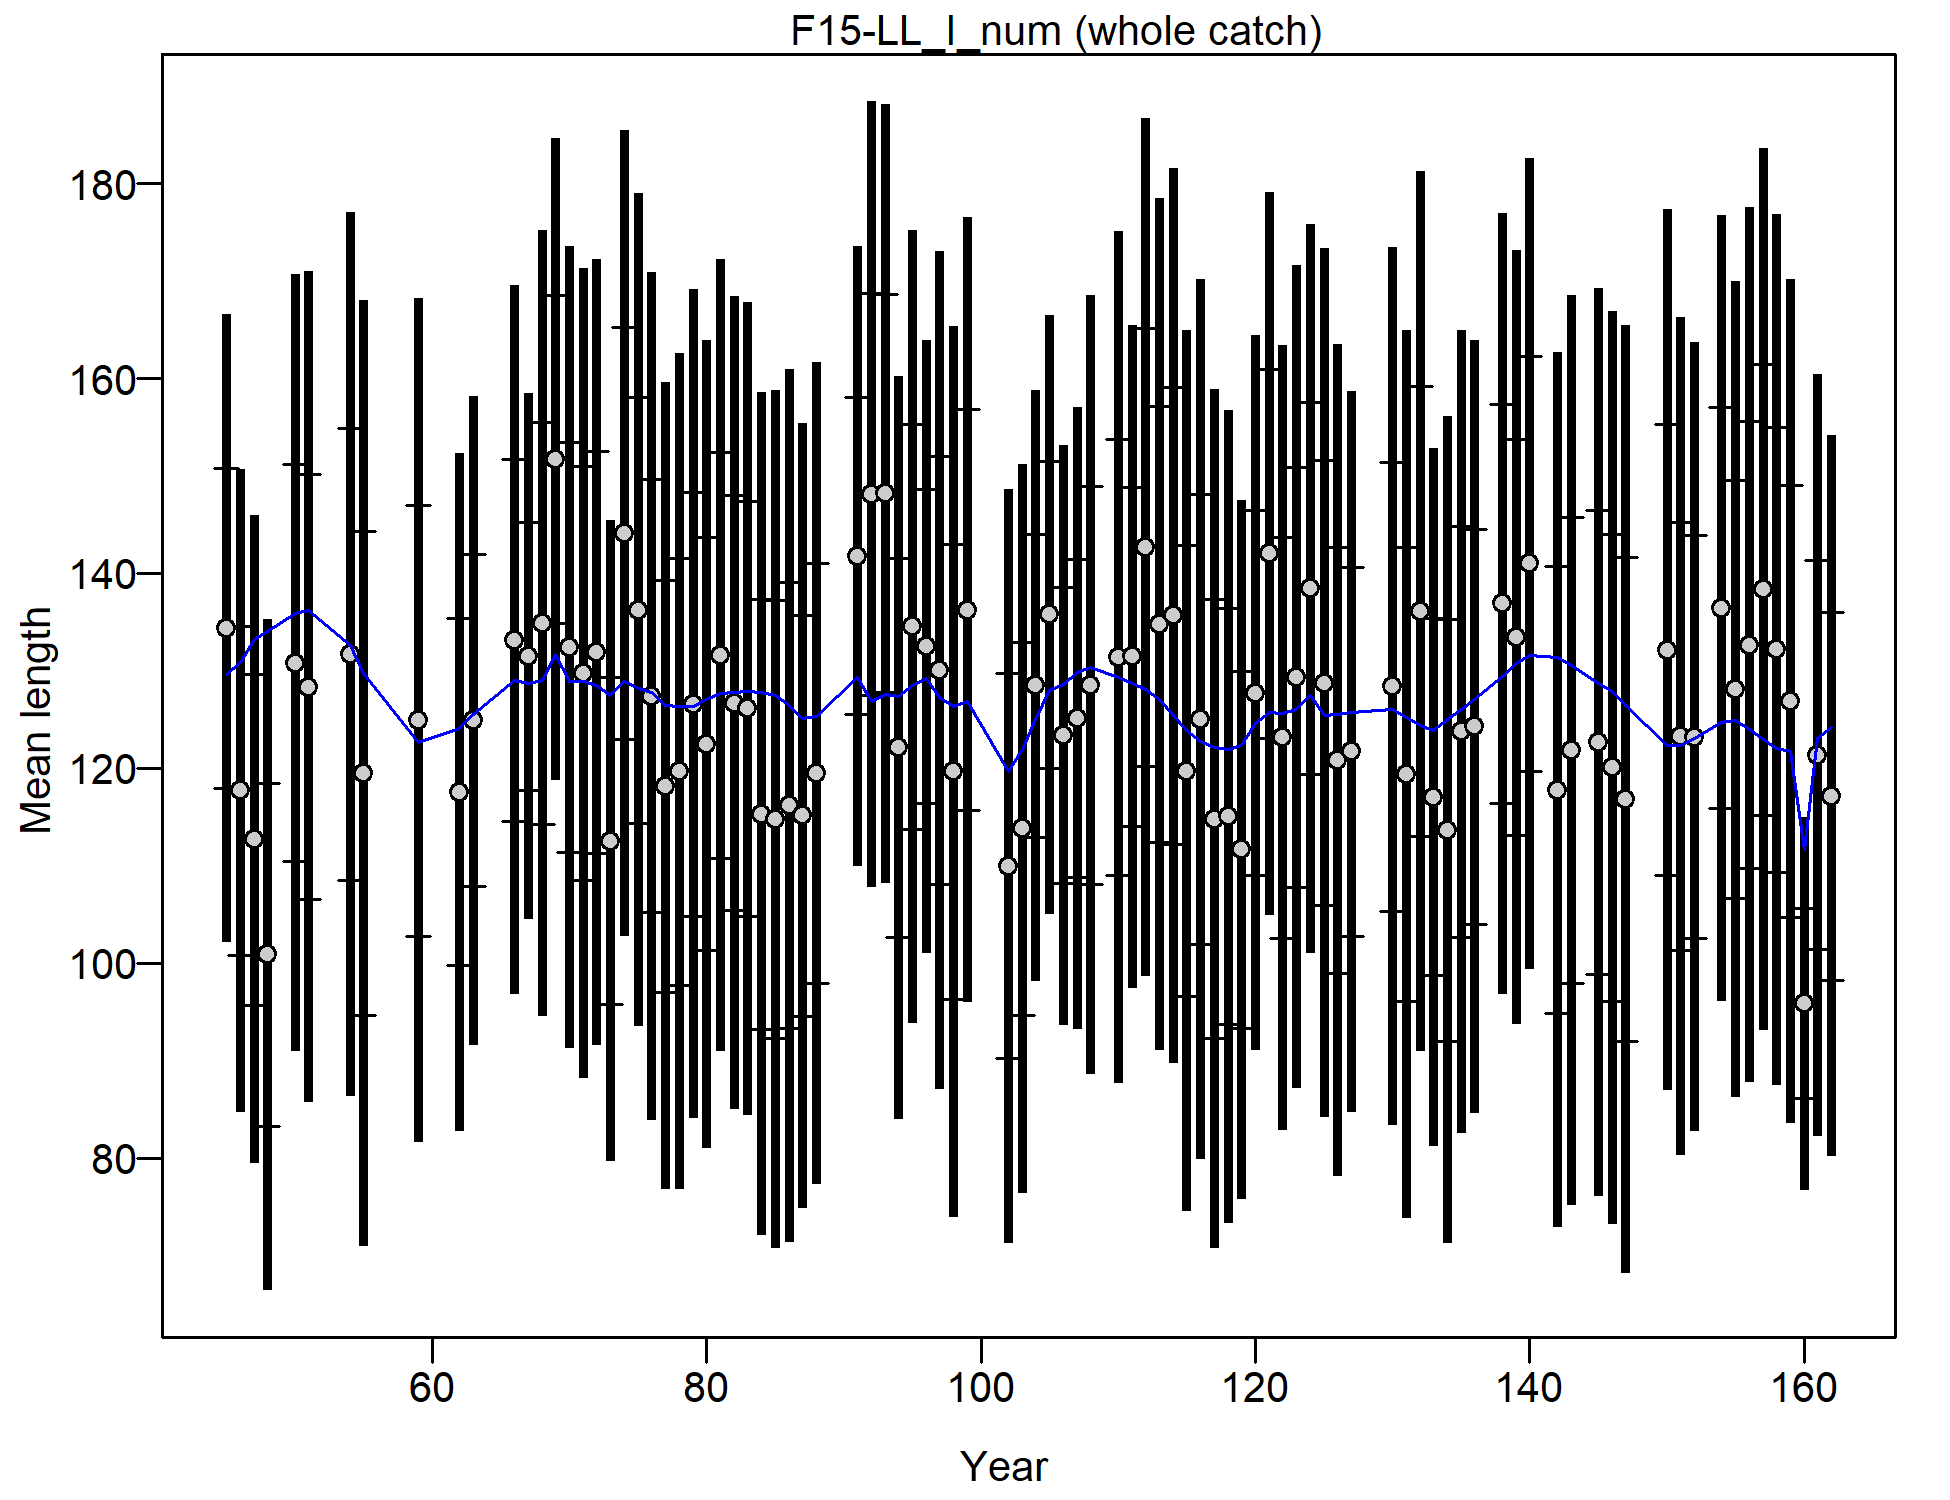
Mean length for F15-LL_I_num with 95% confidence intervals based on current samples sizes.
Francis data weighting method TA1.8: thinner intervals (with capped ends) show result of further adjusting sample sizes based on suggested multiplier (with 95% interval) for len data from F15-LL_I_num:
3.8296 (2.6504-6.2158)
For more info, see
Francis, R.I.C.C. (2011). Data weighting in statistical fisheries stock assessment models. Can. J. Fish. Aquat. Sci. 68: 1124-1138. https://doi.org/10.1139/f2011-025
file: comp_lenfit_data_weighting_TA1.8_F15-LL_I_num.png
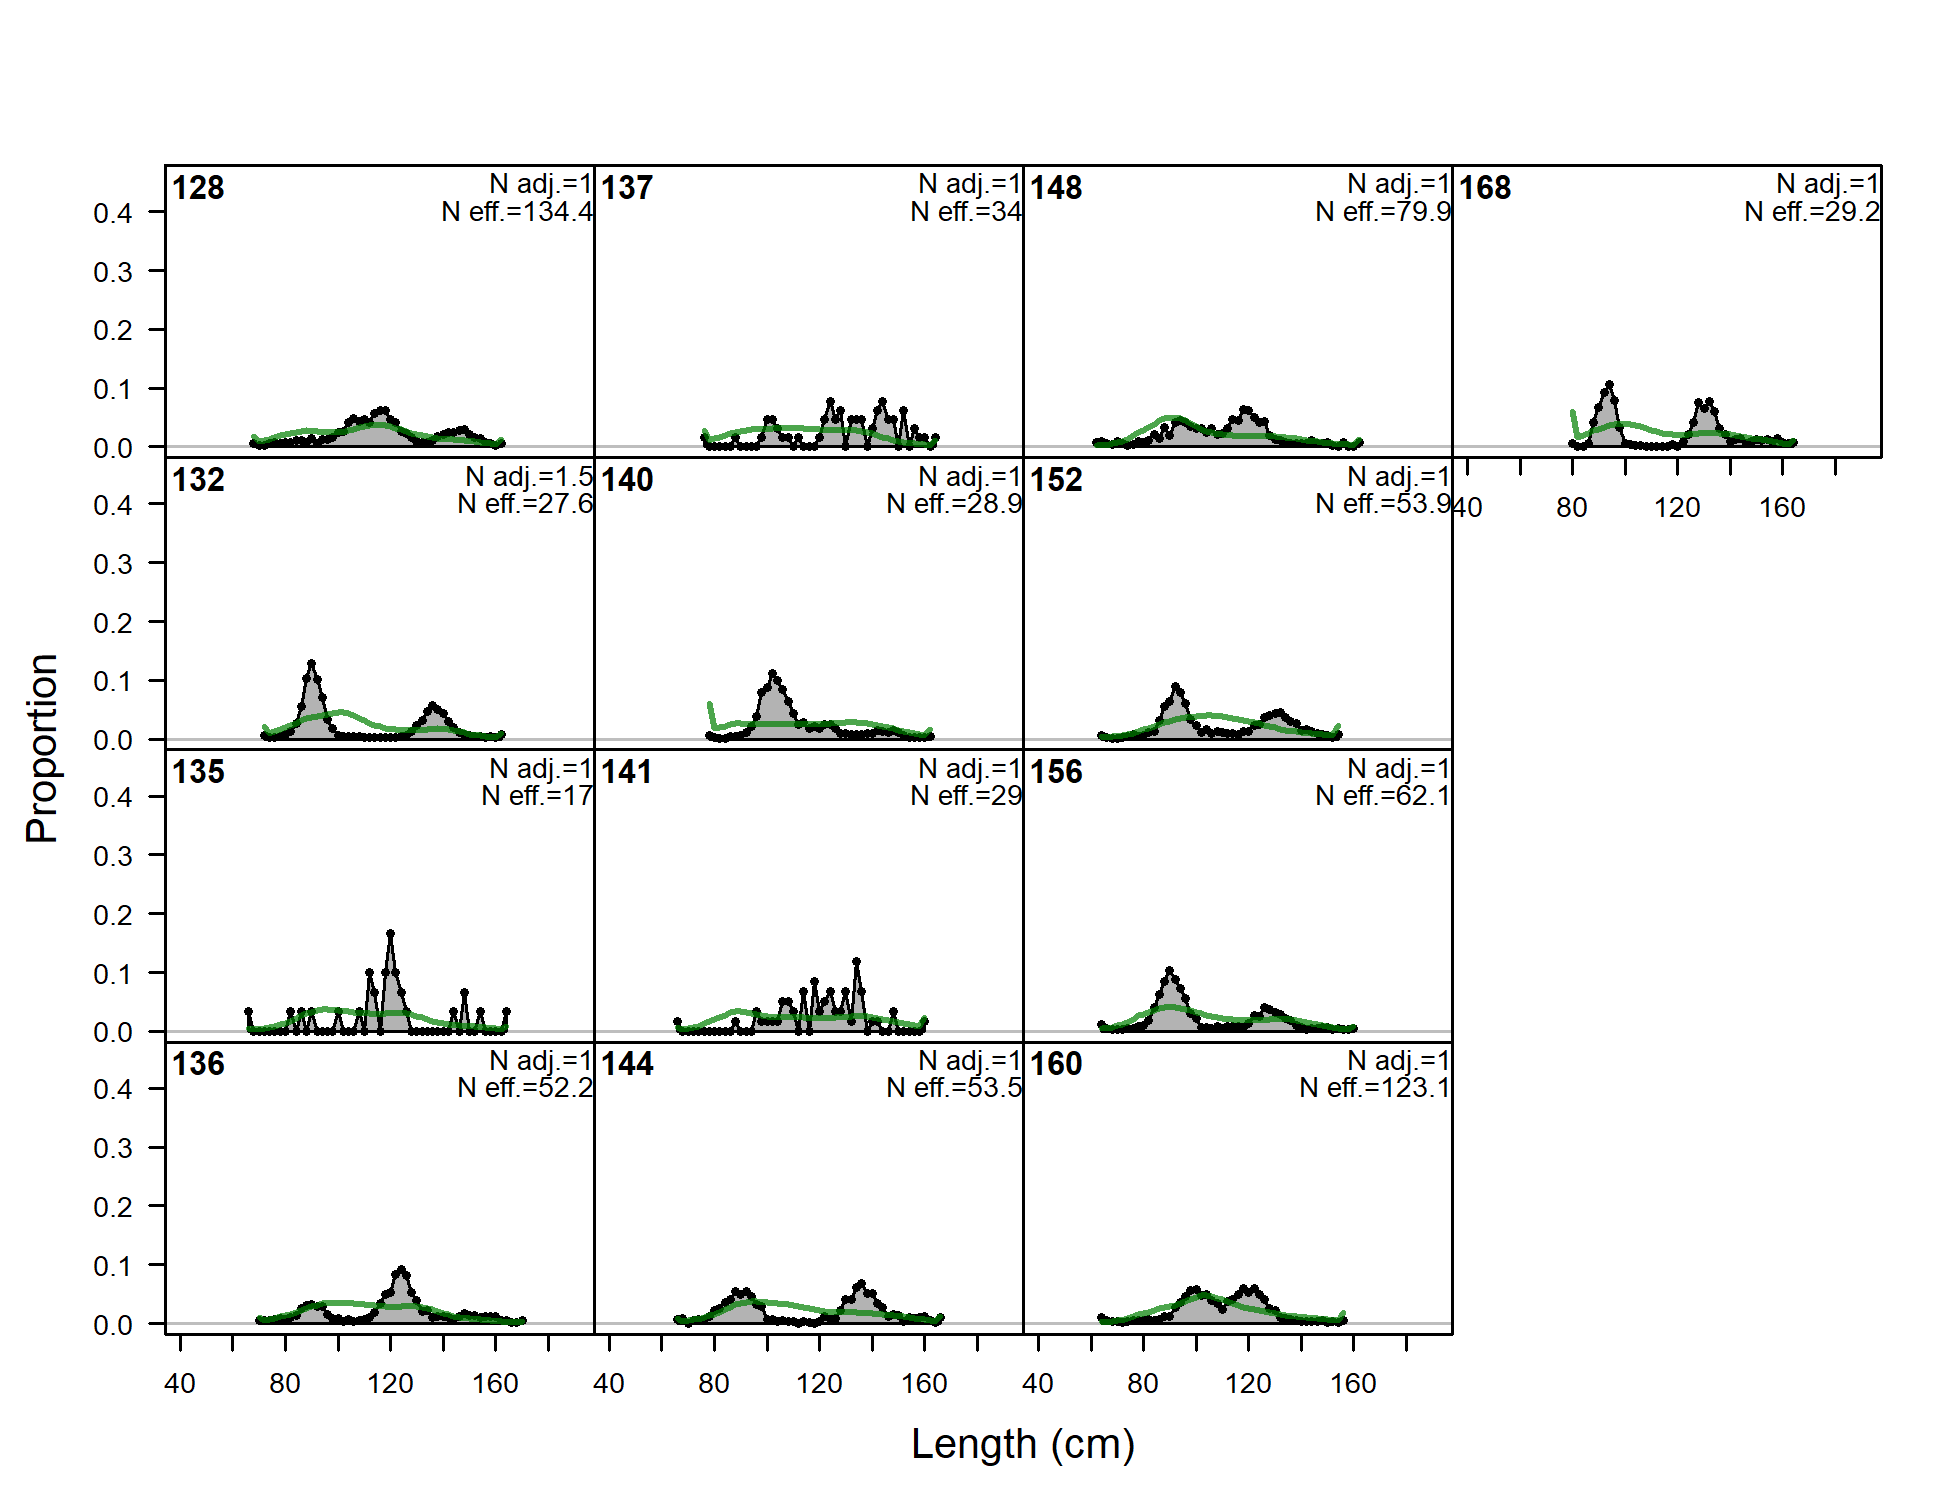
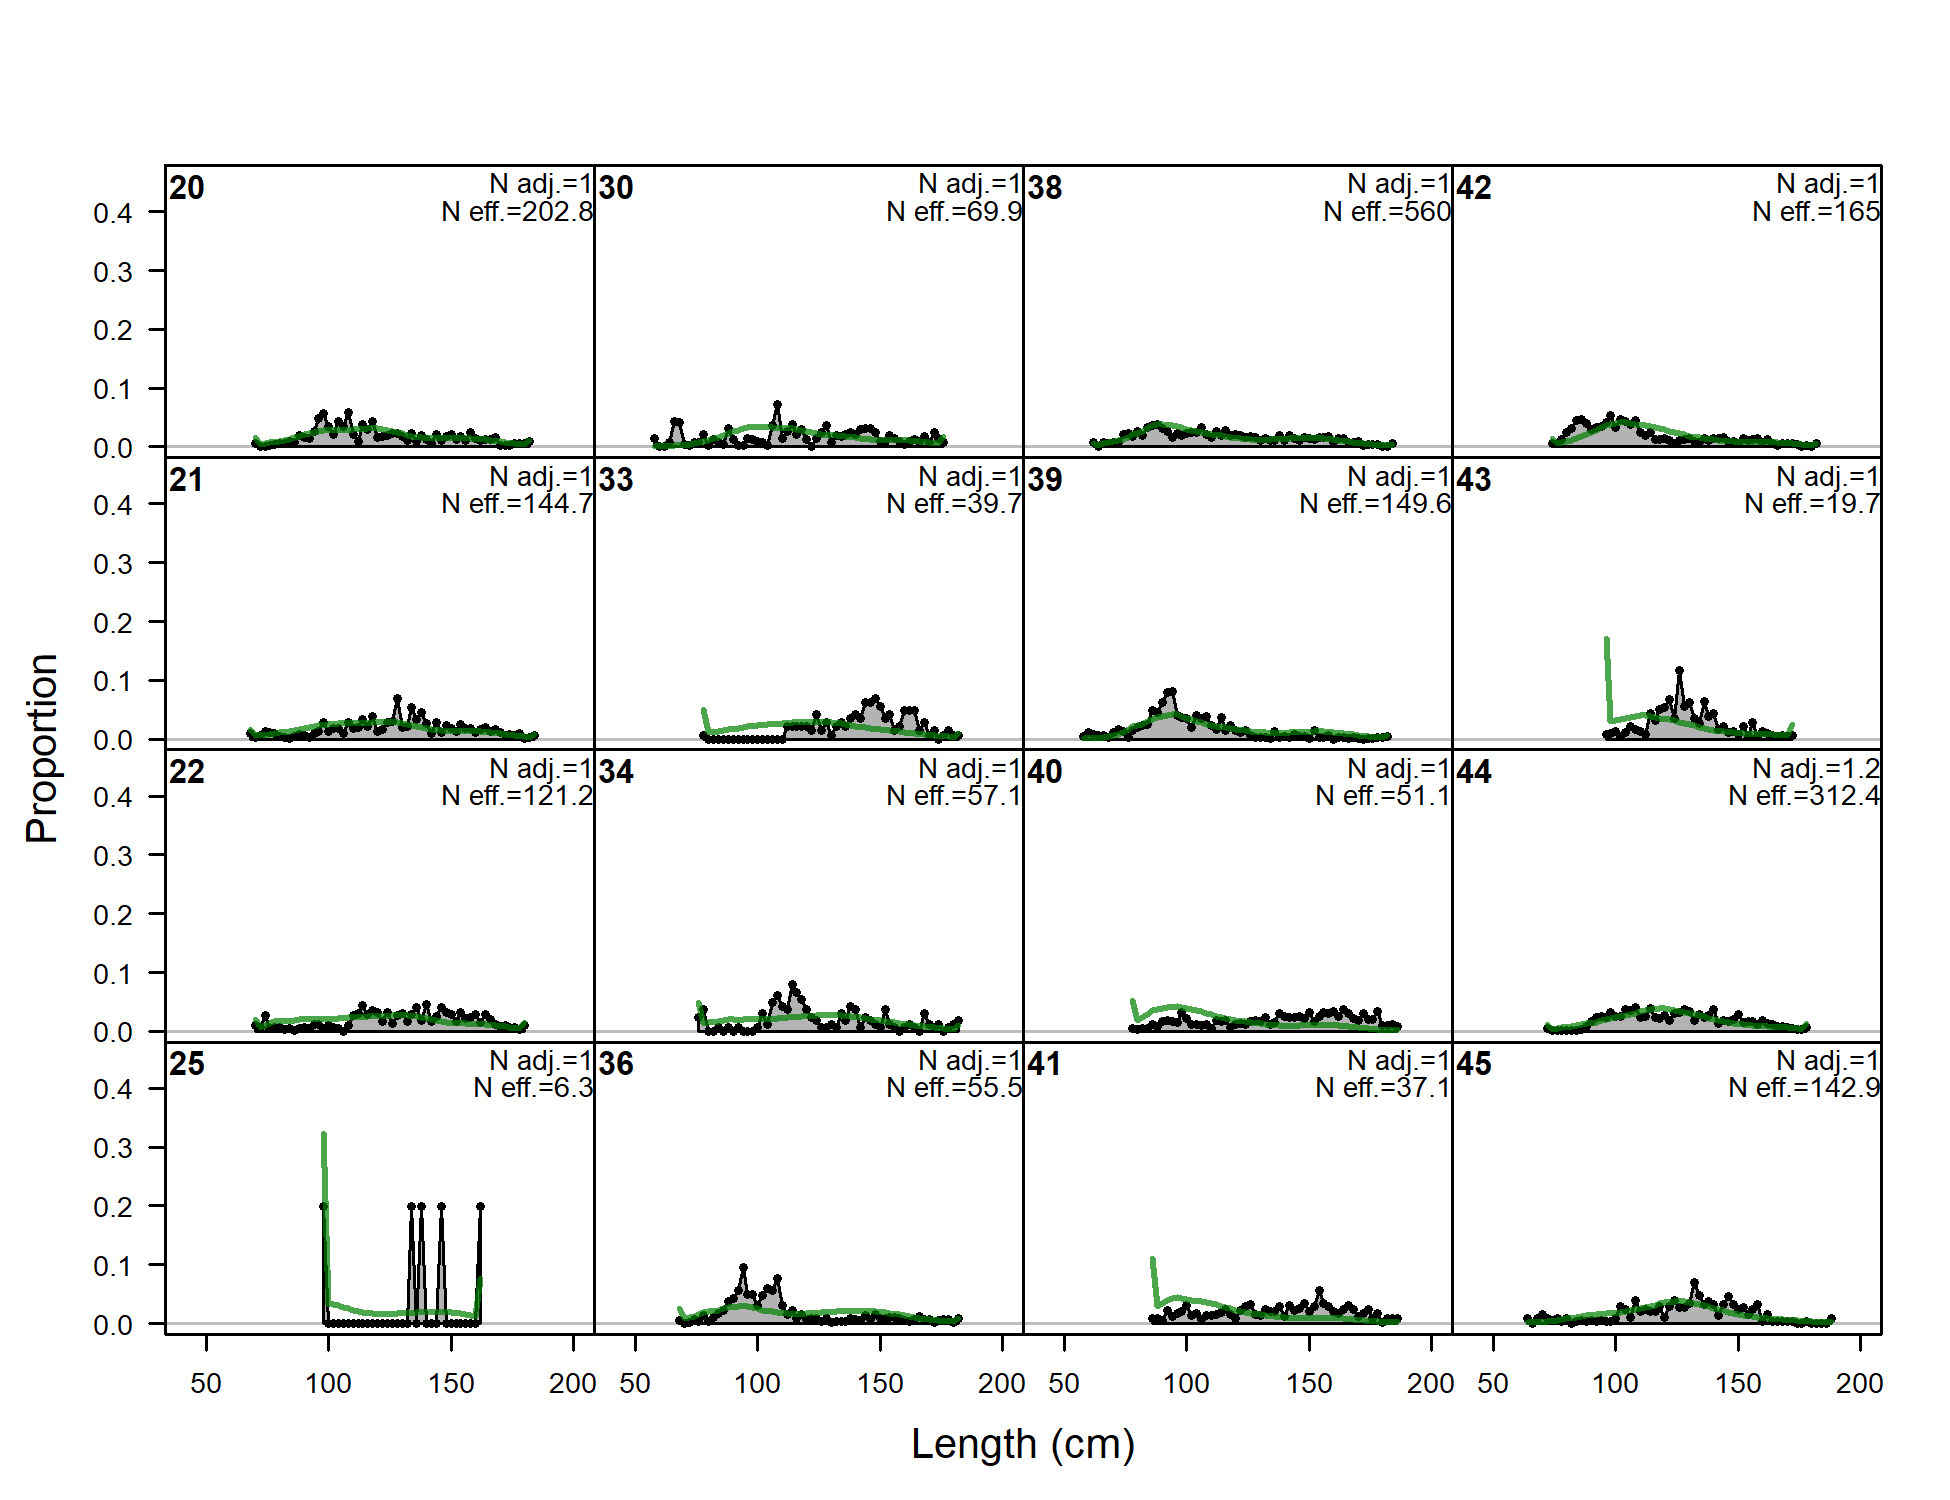
Length comps, whole catch, S1-LLt_N_len (plot 1 of 6).
'N adj.' is the input sample size after data-weighting adjustment.N eff. is the calculated effective sample size used in the McAllister-Iannelli tuning method.
file: comp_lenfit_flt20mkt0_page1.png
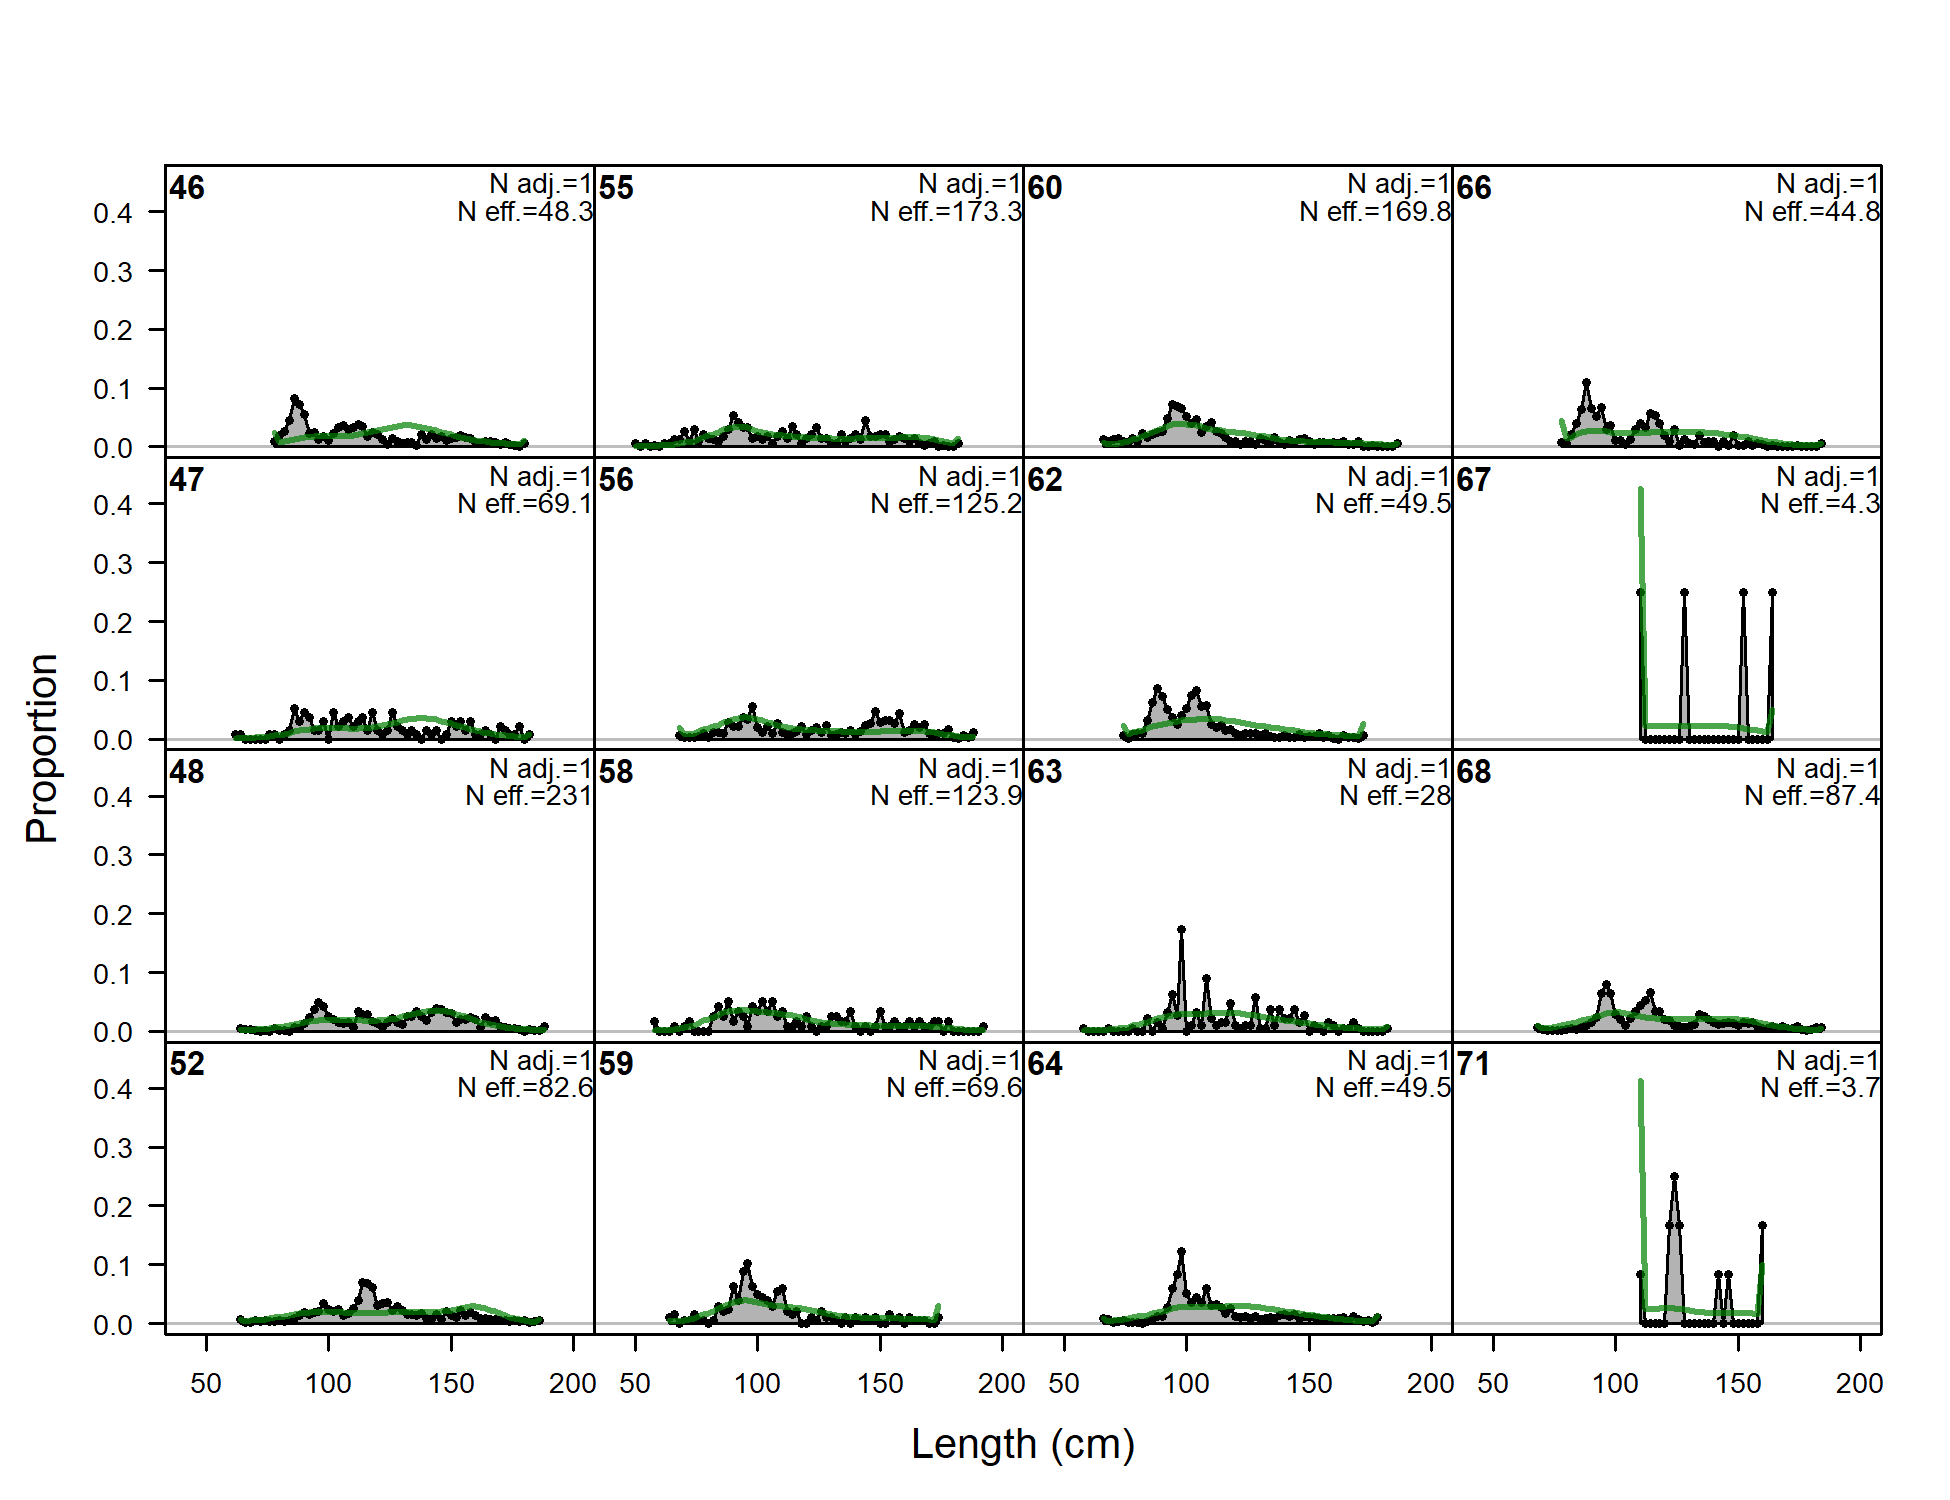
Length comps, whole catch, S1-LLt_N_len (plot 2 of 6)
file: comp_lenfit_flt20mkt0_page2.png
Length comps, whole catch, S1-LLt_N_len (plot 3 of 6)
file: comp_lenfit_flt20mkt0_page3.png
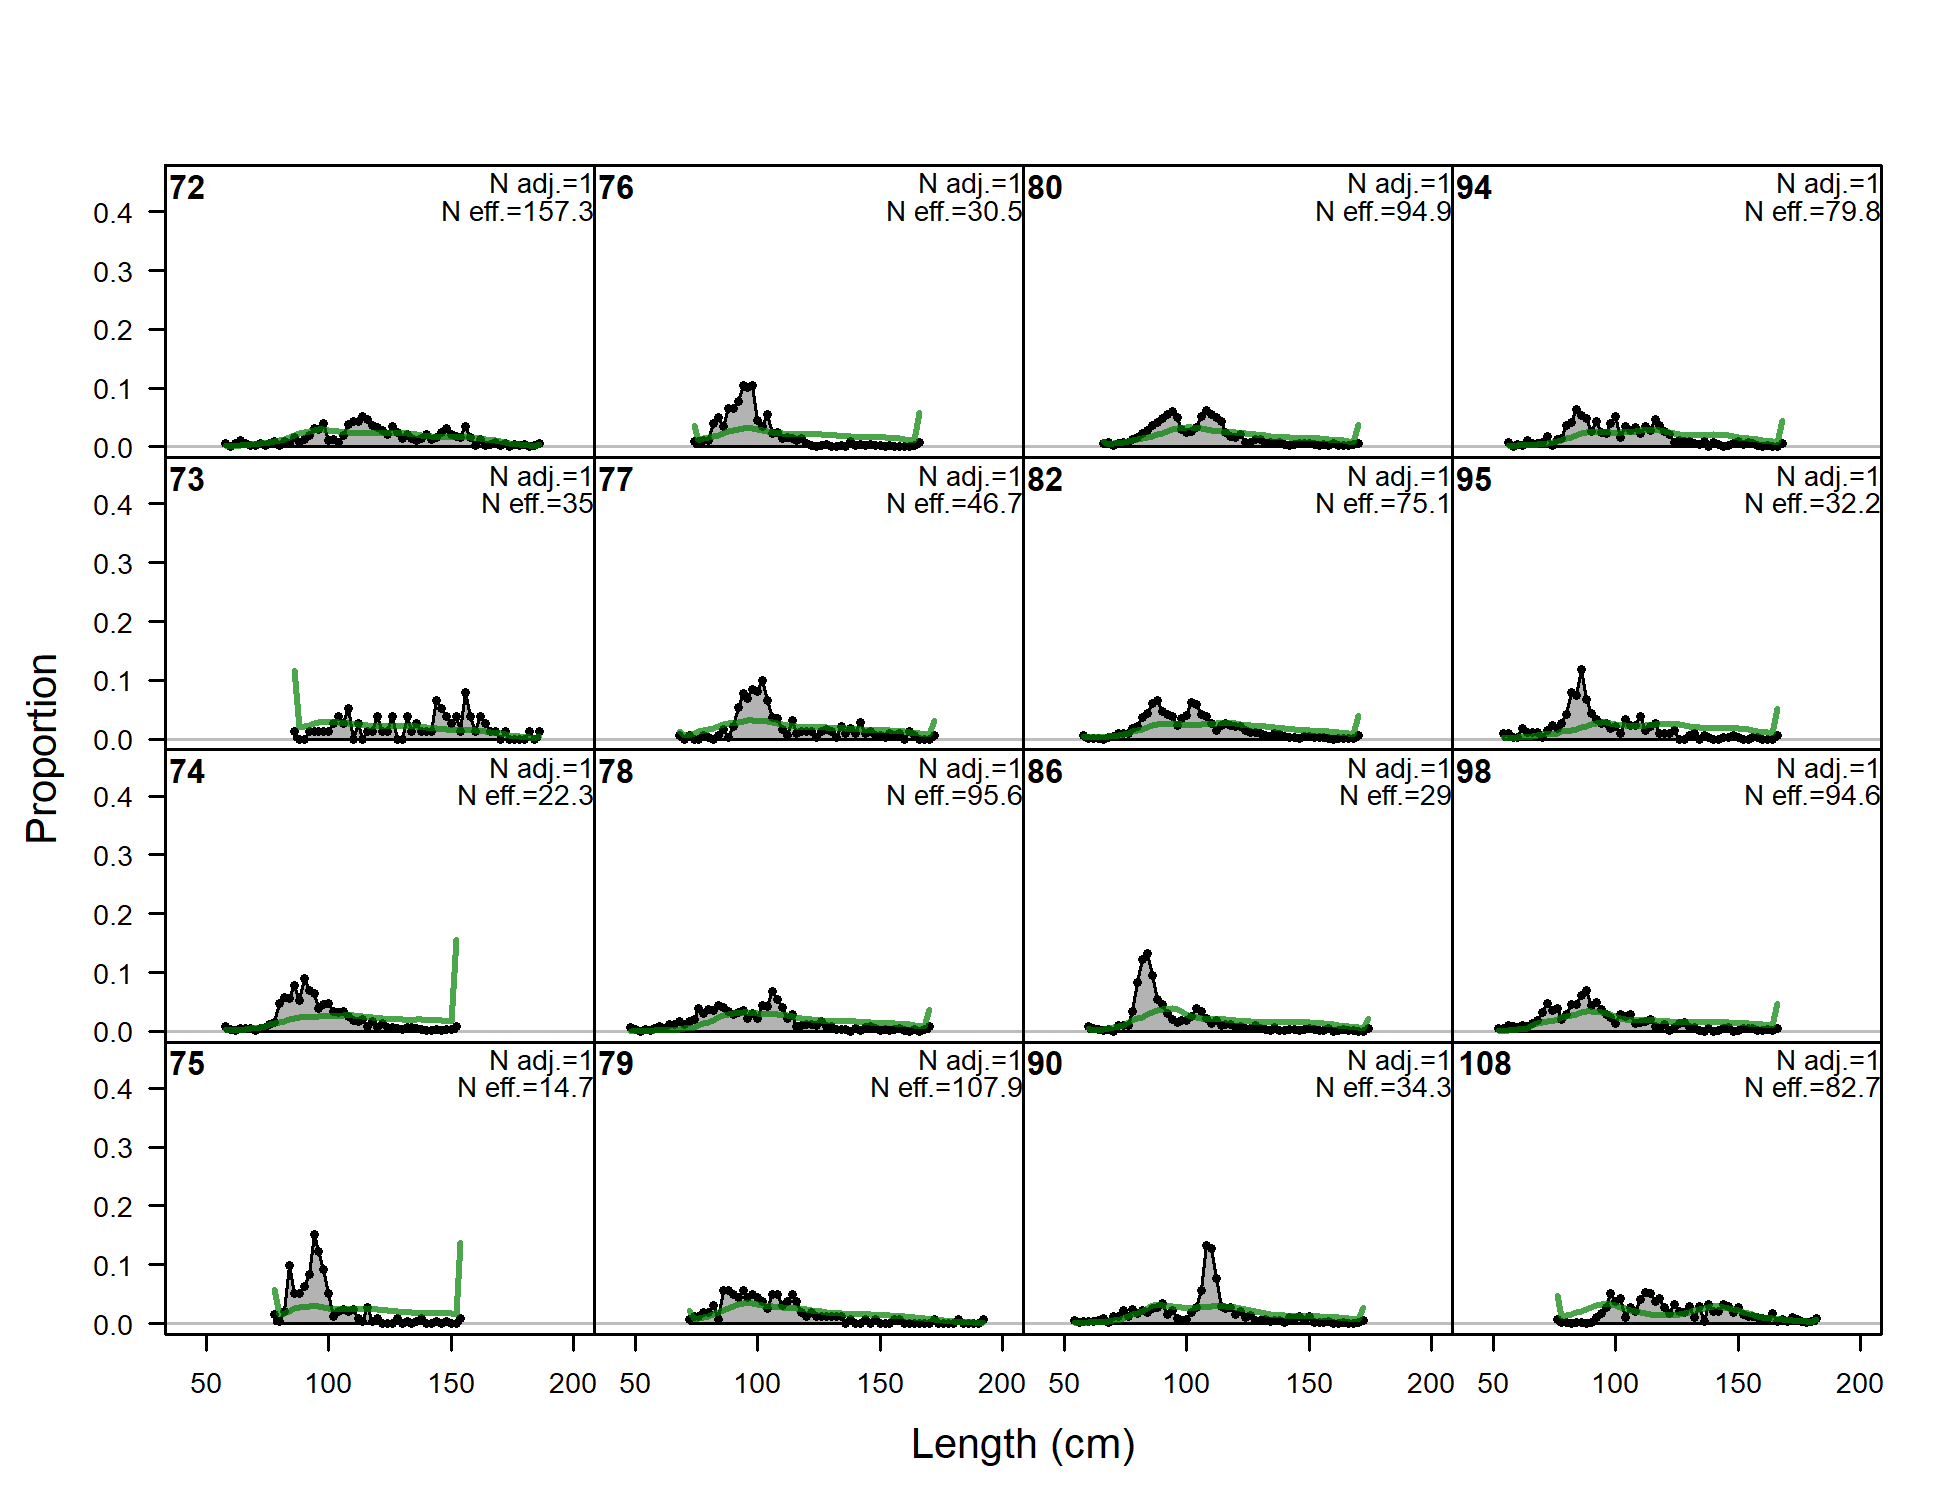
Length comps, whole catch, S1-LLt_N_len (plot 4 of 6)
file: comp_lenfit_flt20mkt0_page4.png
Length comps, whole catch, S1-LLt_N_len (plot 5 of 6)
file: comp_lenfit_flt20mkt0_page5.png
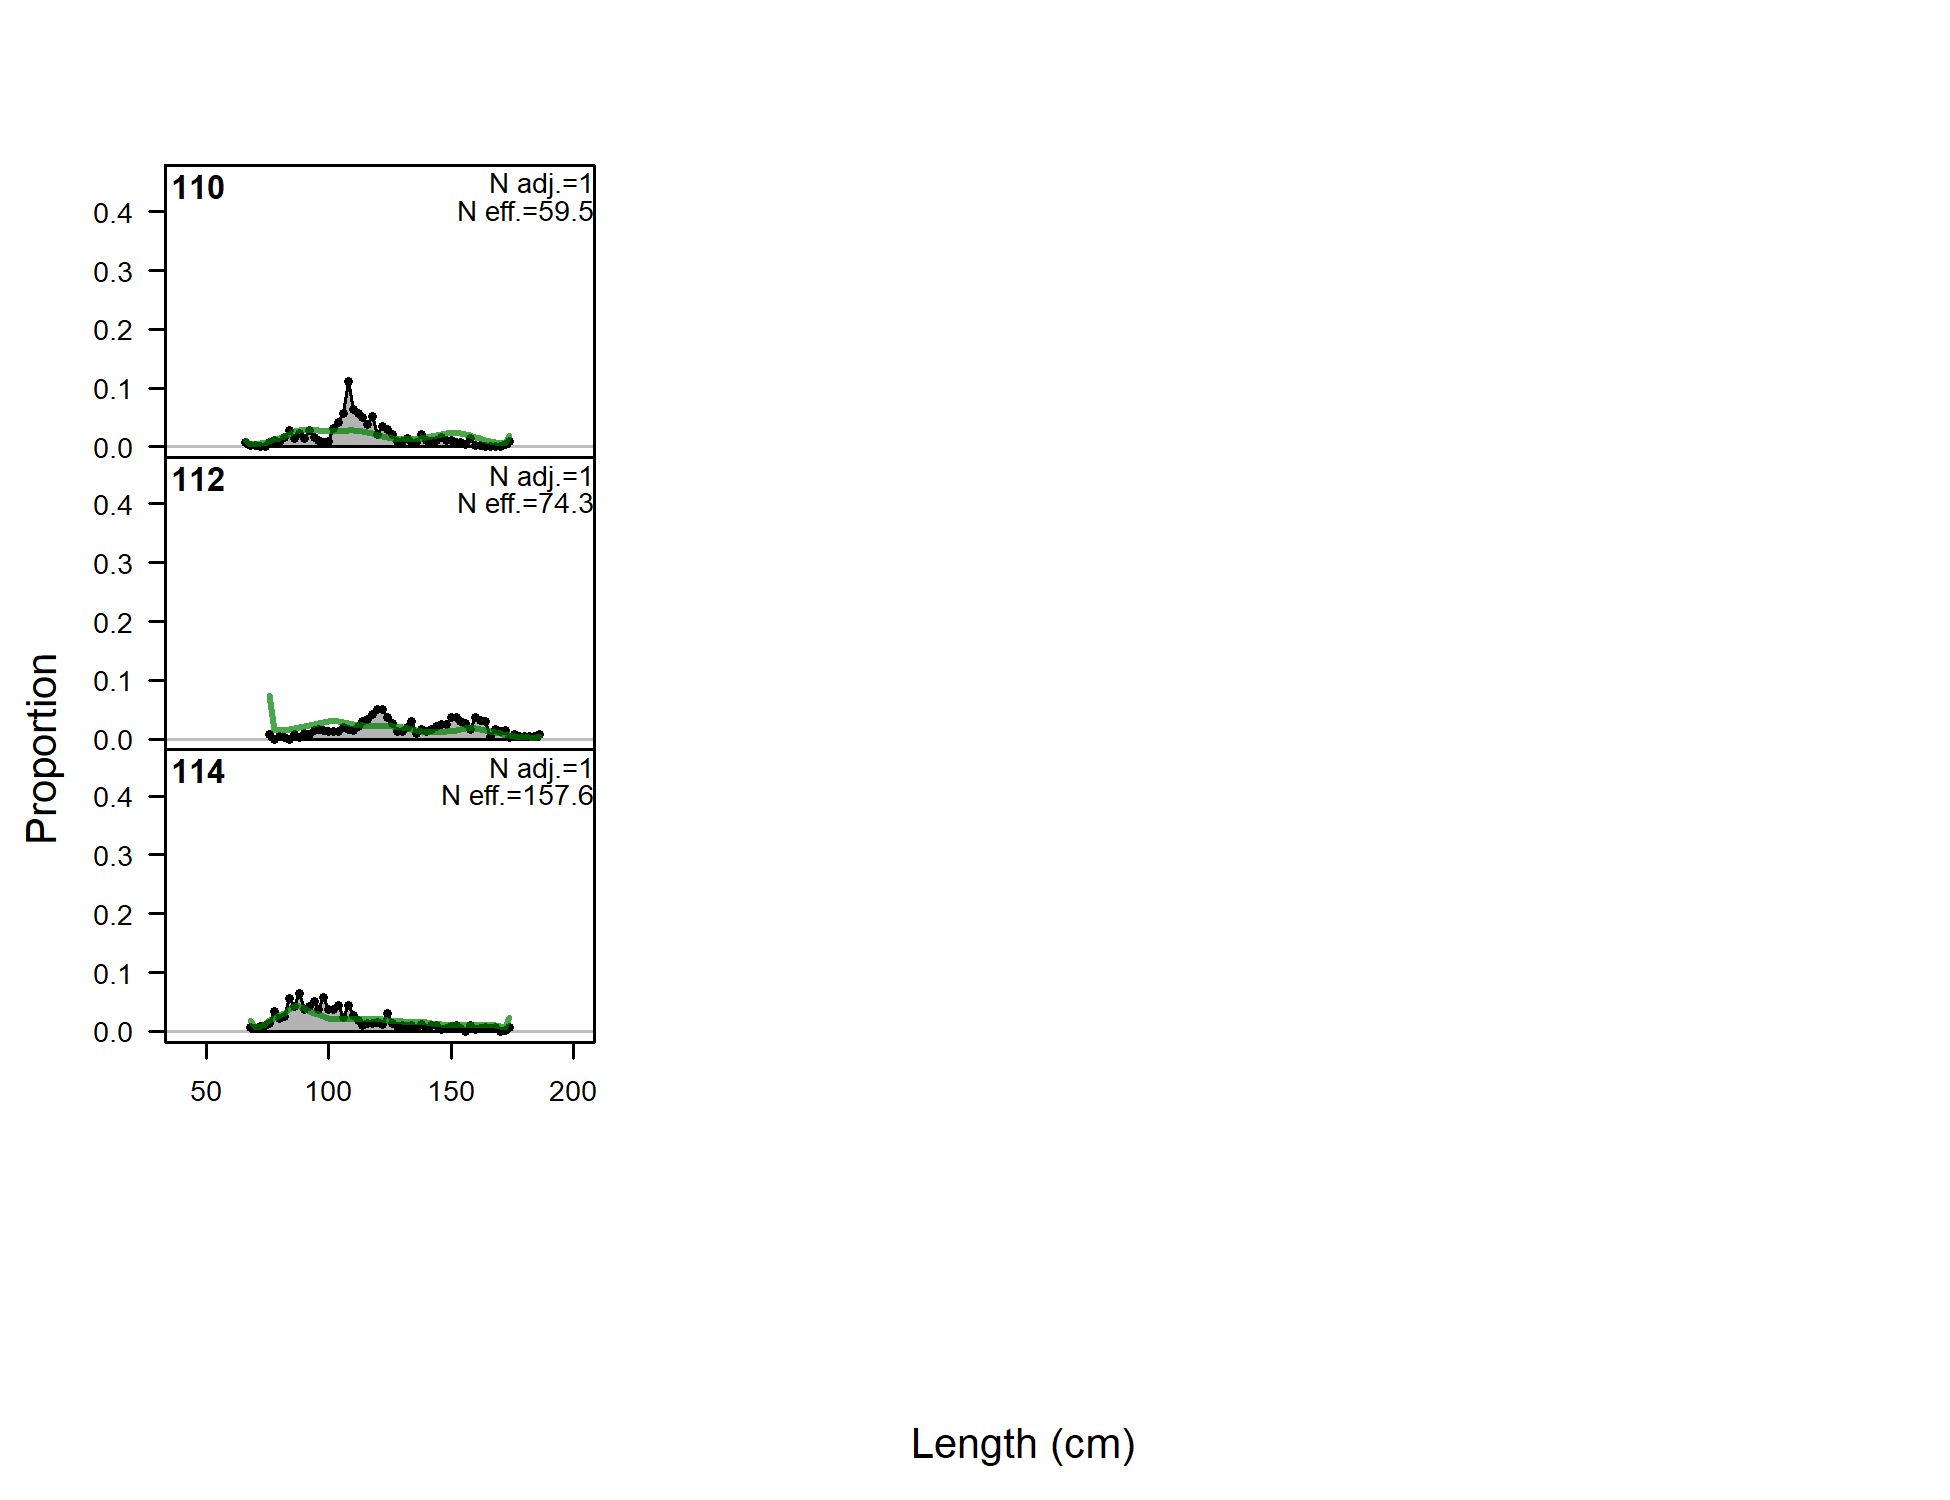
Length comps, whole catch, S1-LLt_N_len (plot 6 of 6)
file: comp_lenfit_flt20mkt0_page6.png
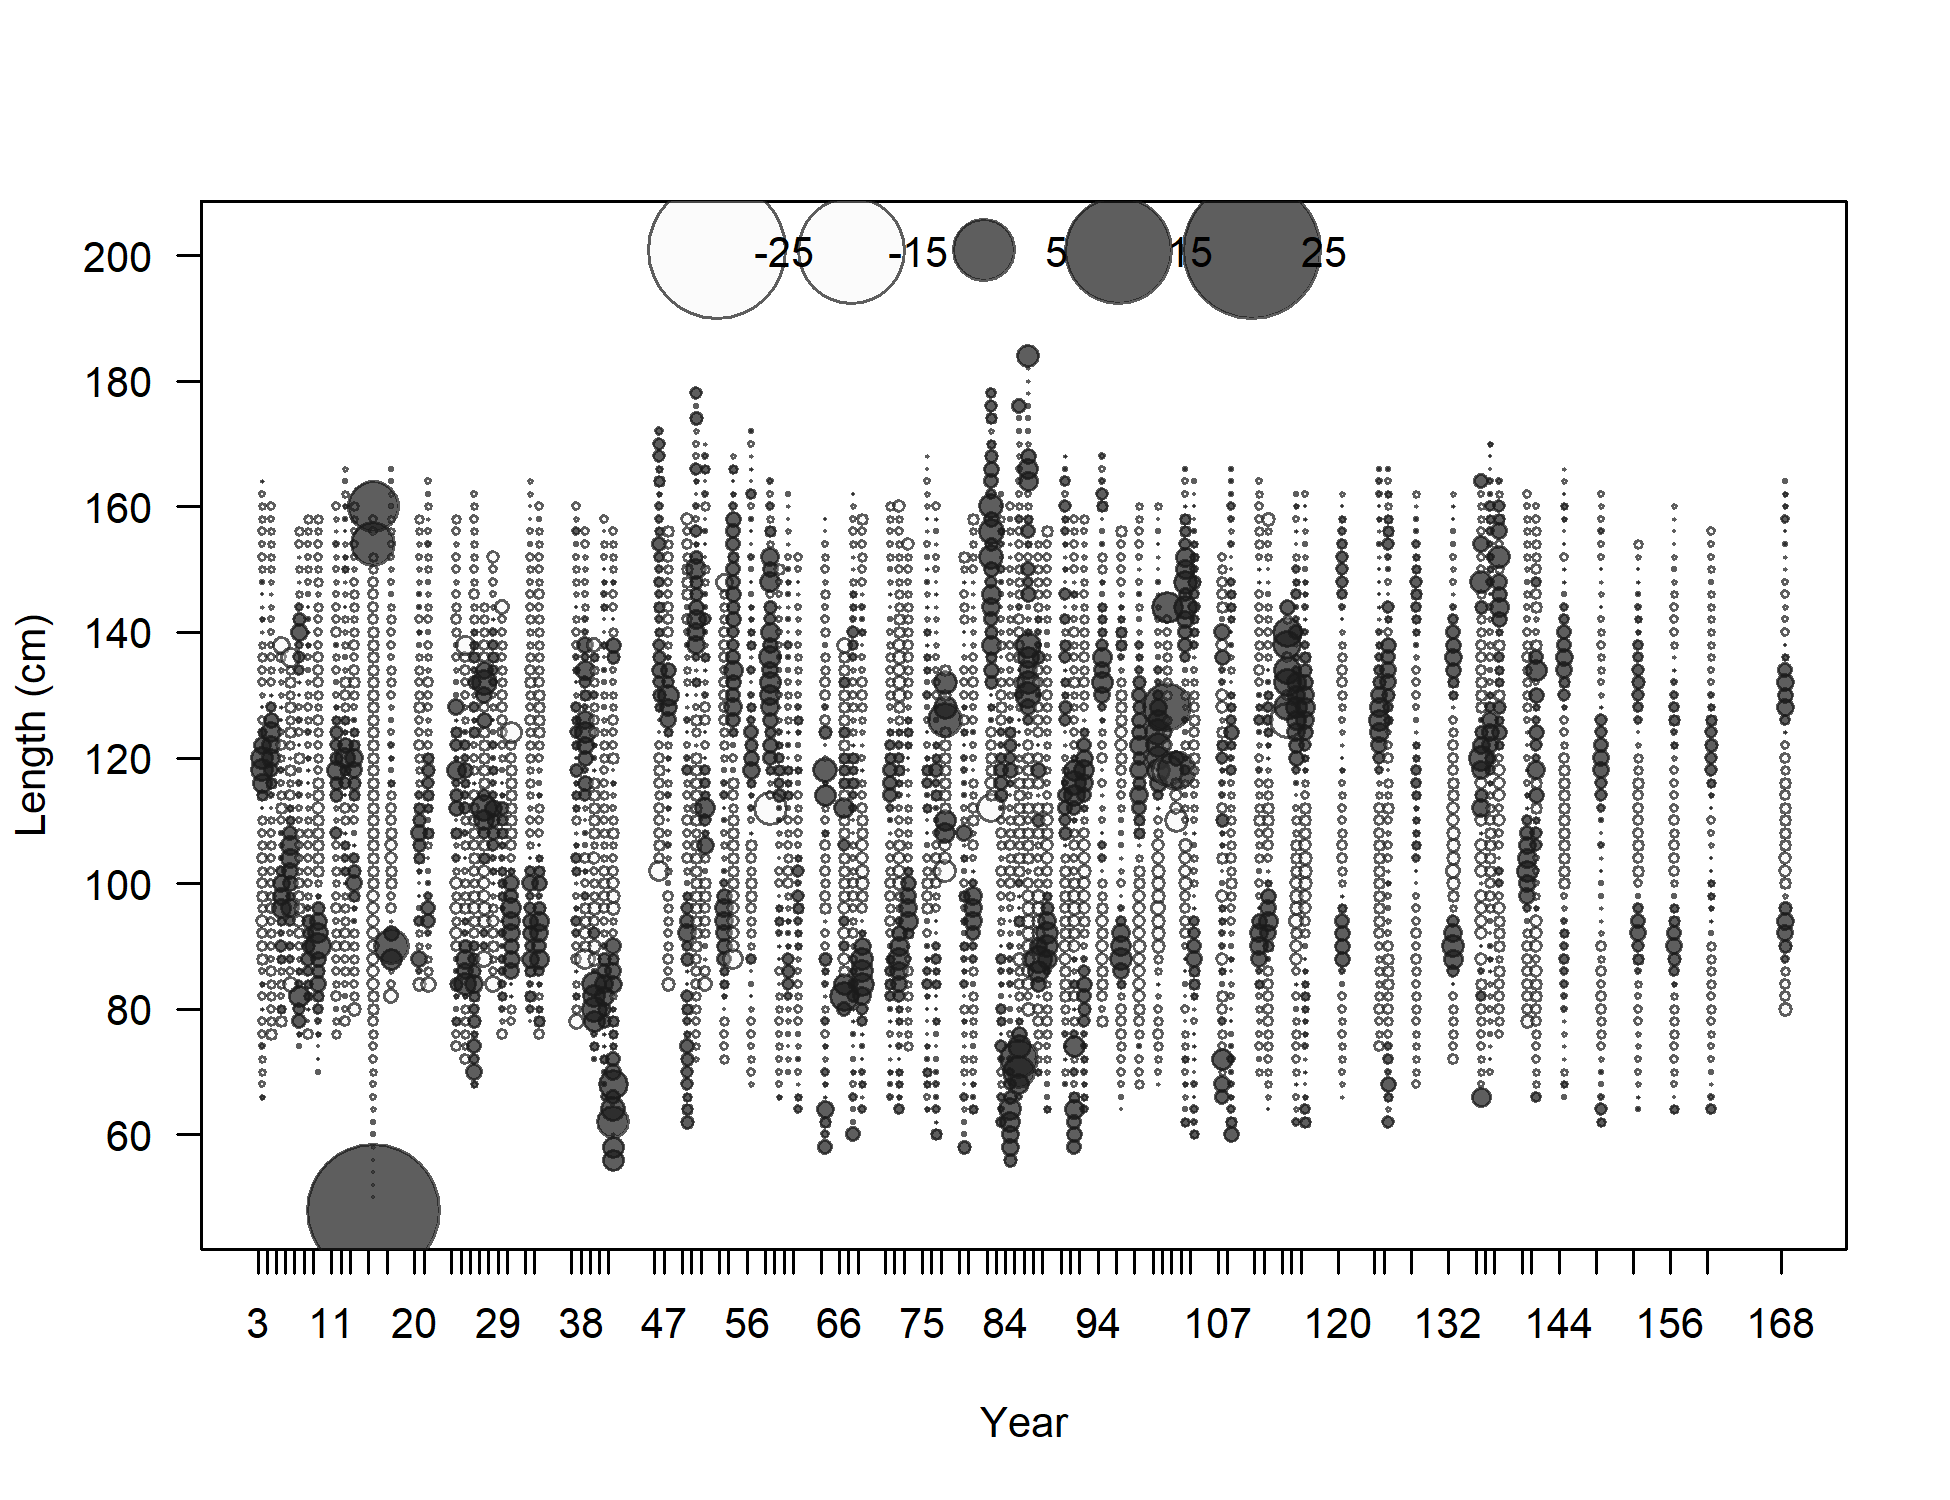
Pearson residuals, whole catch, S1-LLt_N_len (max=23) (plot 6 of 6)
Closed bubbles are positive residuals (observed > expected) and open bubbles are negative residuals (observed < expected).
file: comp_lenfit_residsflt20mkt0_page6.png
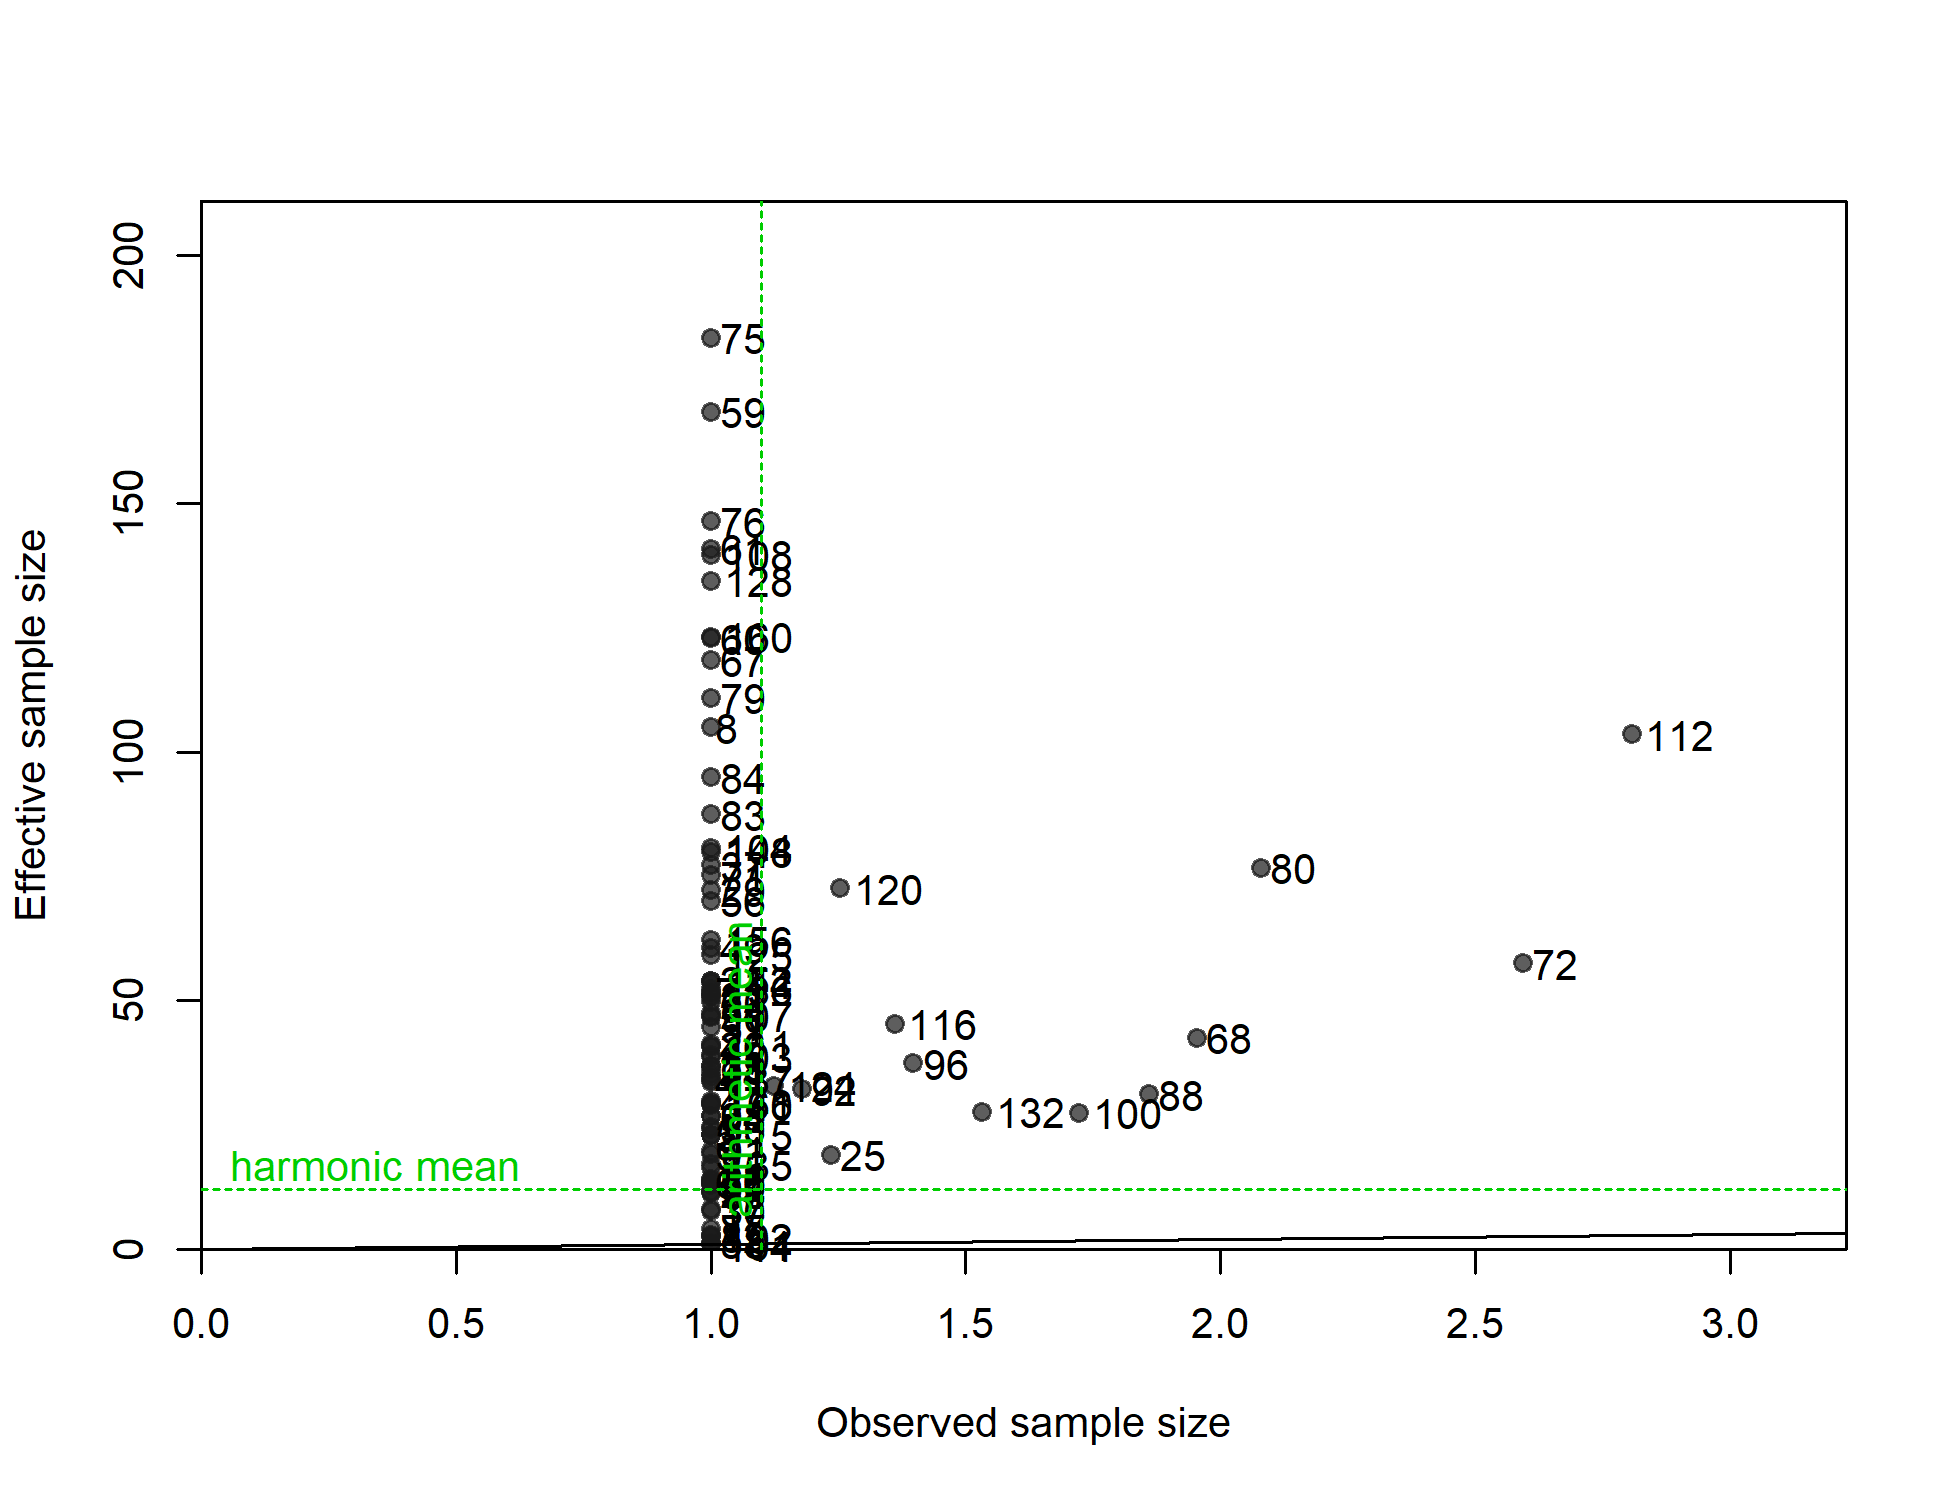
N-EffN comparison, Length comps, whole catch, S1-LLt_N_len
file: comp_lenfit_sampsize_flt20mkt0.png
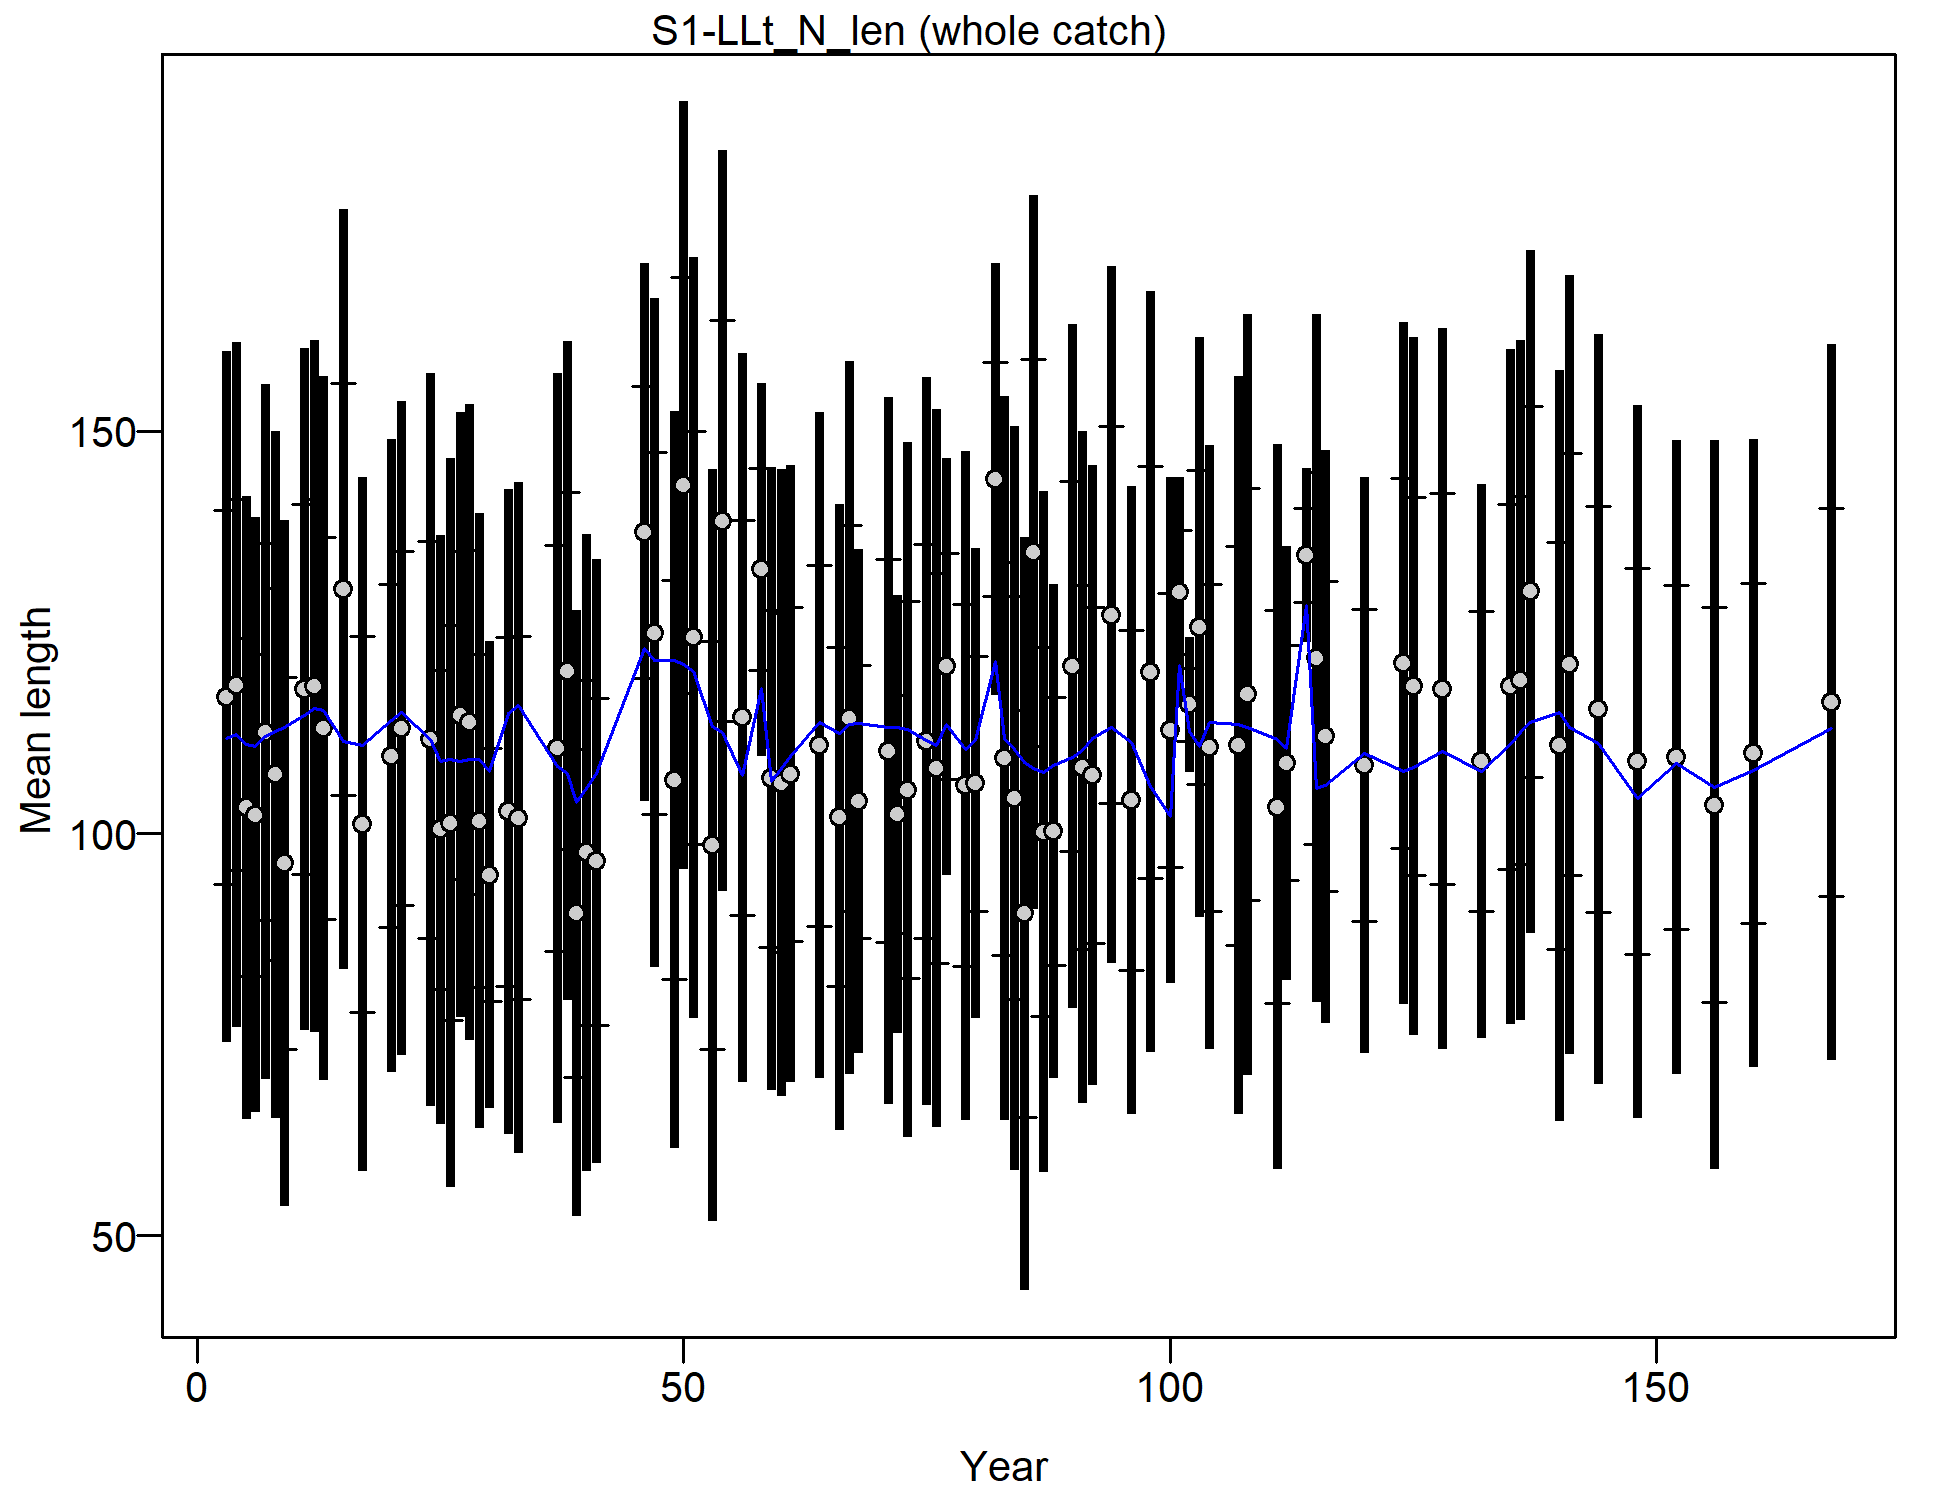
Mean length for S1-LLt_N_len with 95% confidence intervals based on current samples sizes.
Francis data weighting method TA1.8: thinner intervals (with capped ends) show result of further adjusting sample sizes based on suggested multiplier (with 95% interval) for len data from S1-LLt_N_len:
3.407 (2.6726-4.731)
For more info, see
Francis, R.I.C.C. (2011). Data weighting in statistical fisheries stock assessment models. Can. J. Fish. Aquat. Sci. 68: 1124-1138. https://doi.org/10.1139/f2011-025
file: comp_lenfit_data_weighting_TA1.8_S1-LLt_N_len.png
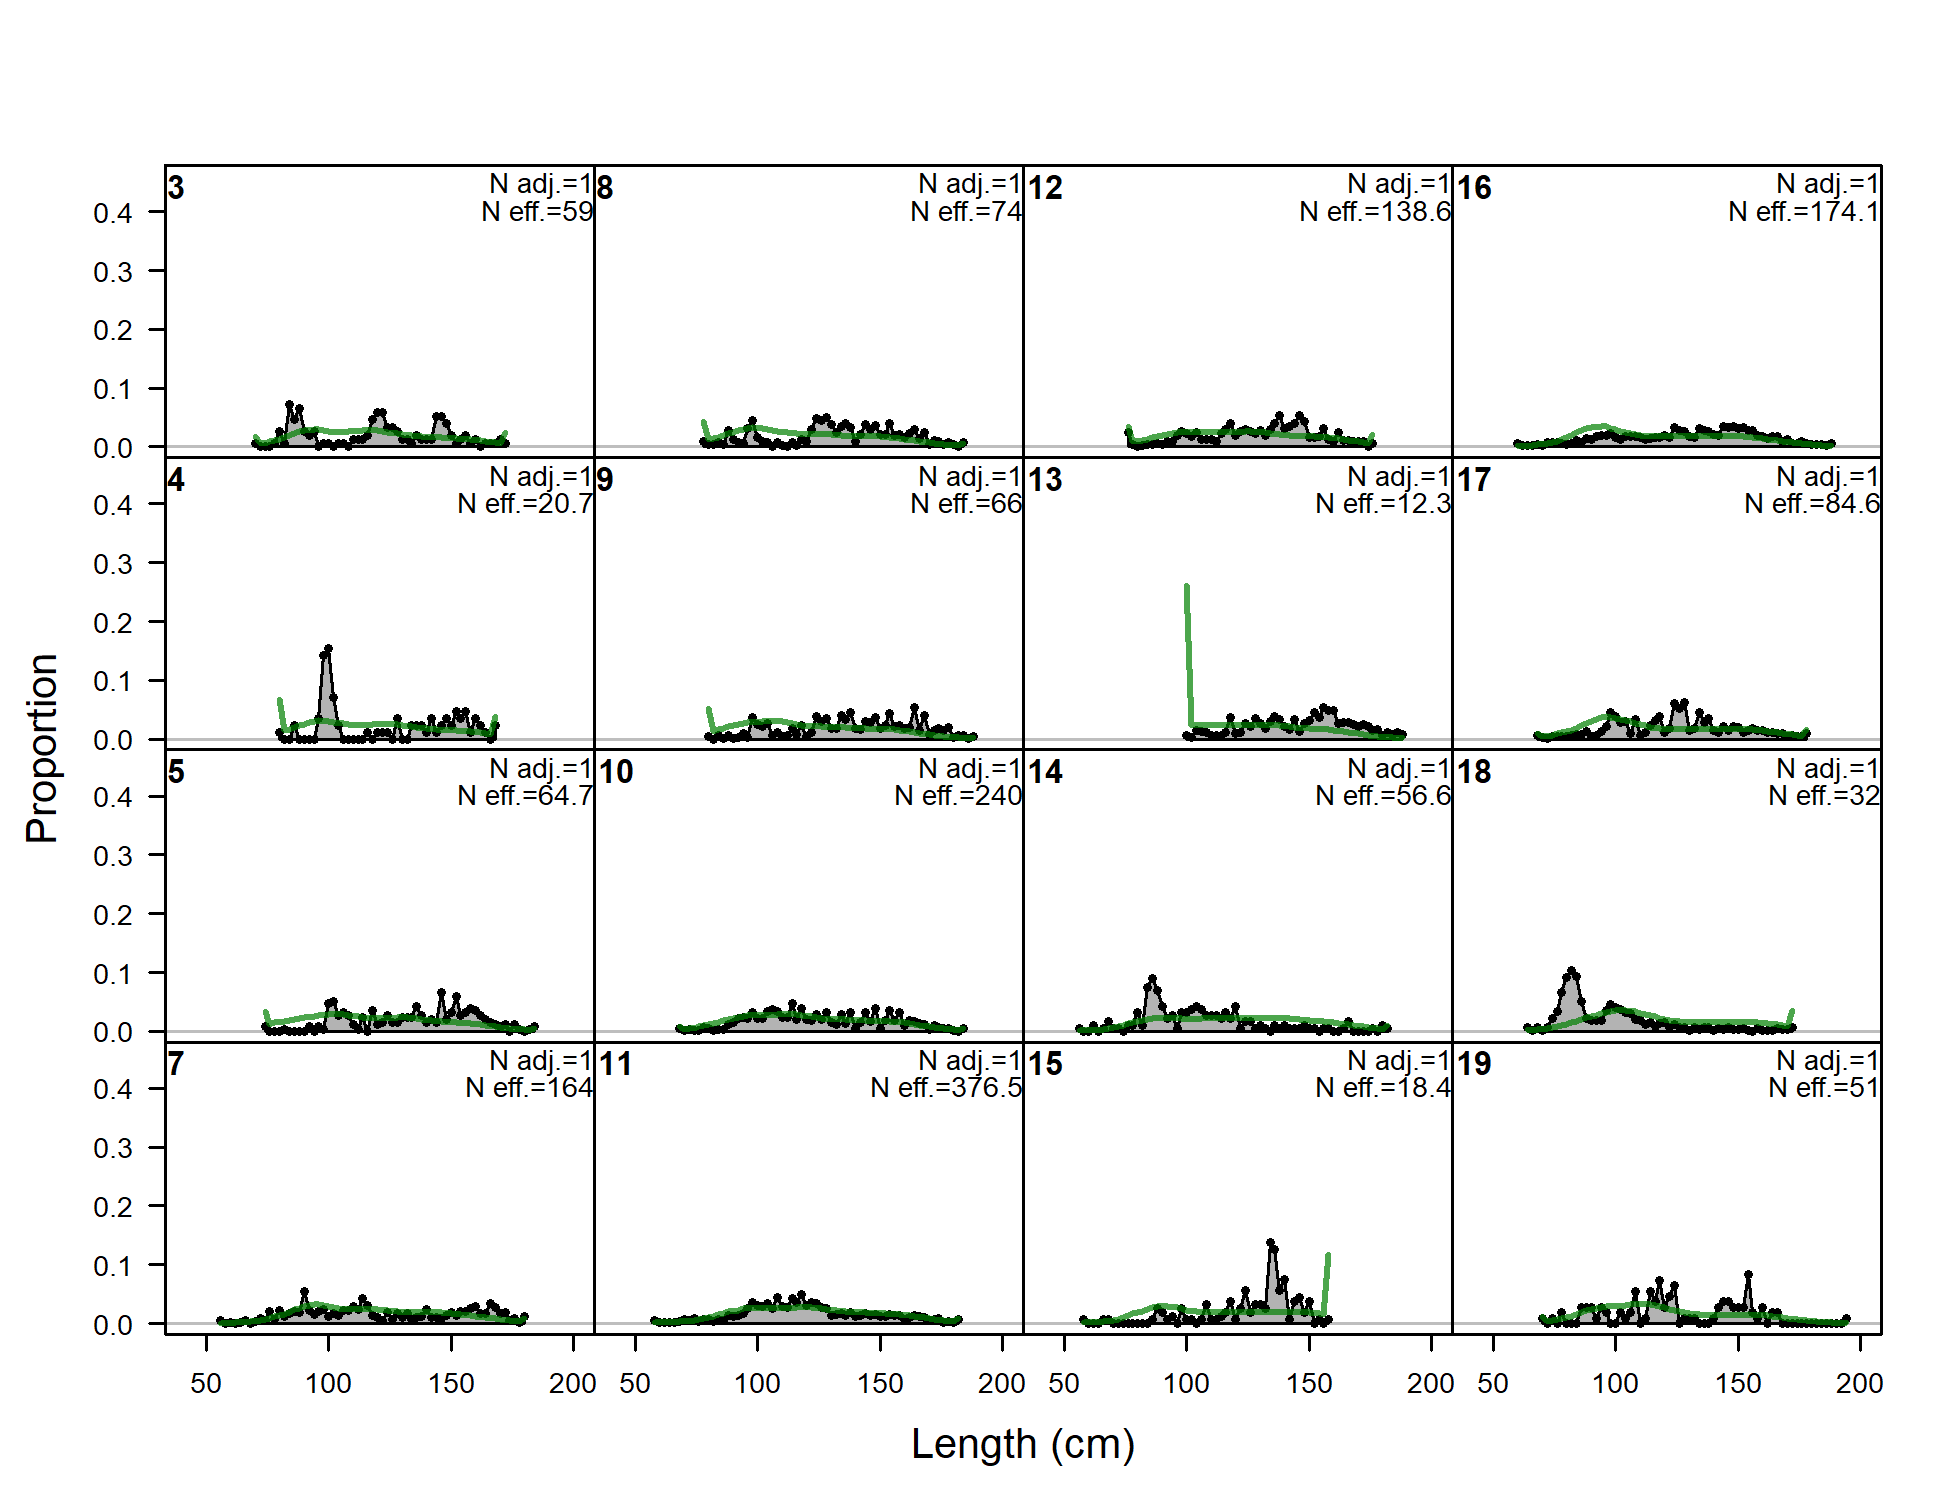
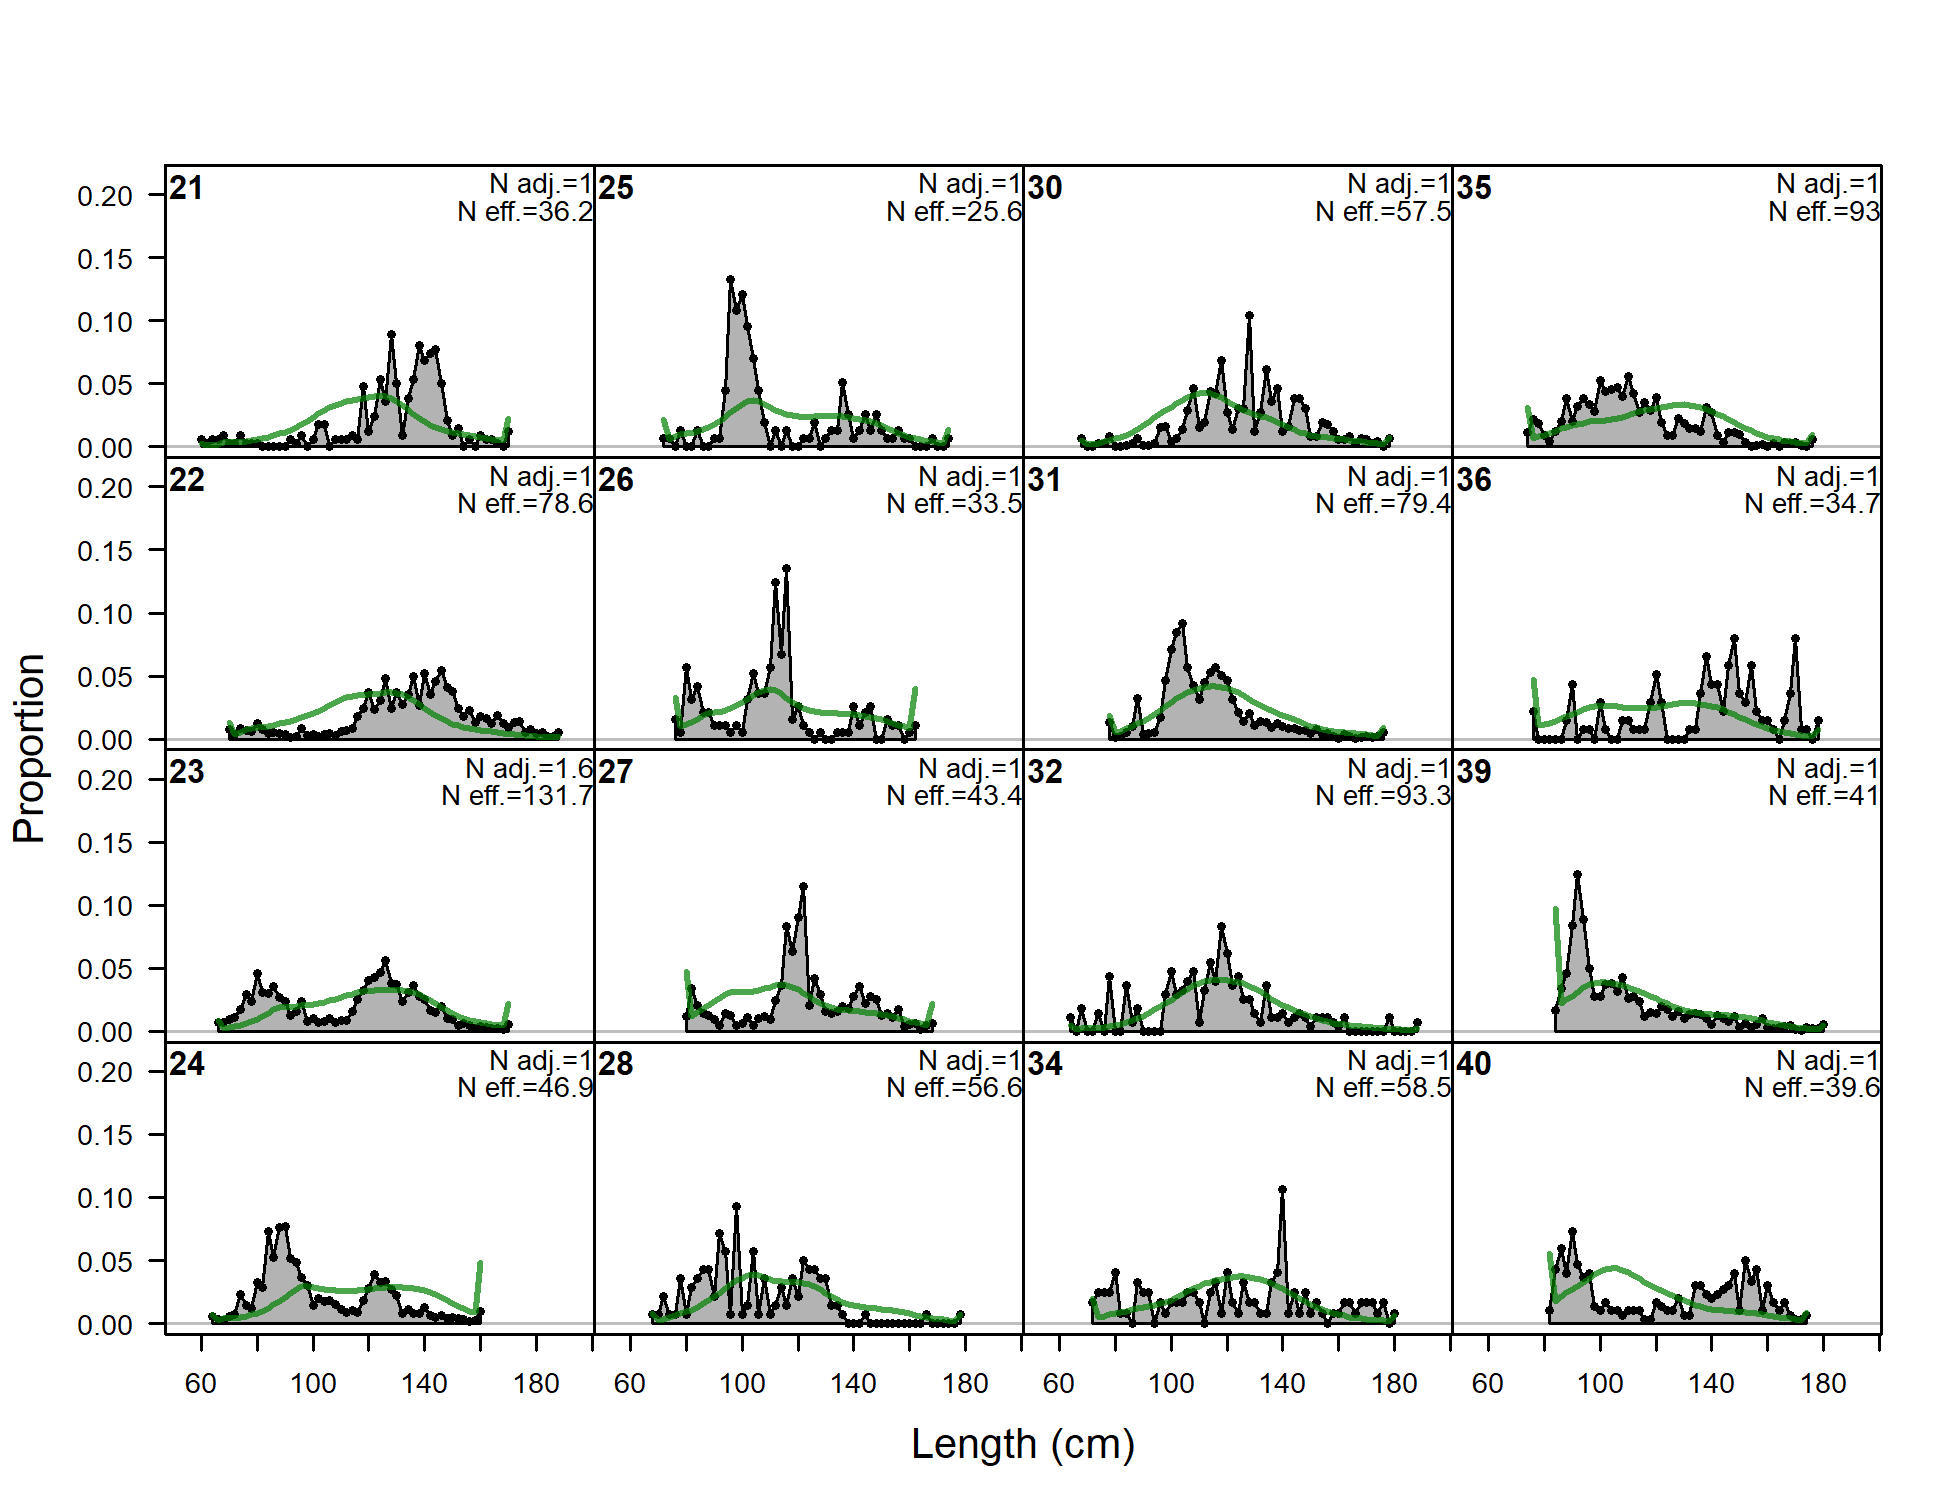
Length comps, whole catch, S2-LLt_C_len (plot 1 of 4).
'N adj.' is the input sample size after data-weighting adjustment.N eff. is the calculated effective sample size used in the McAllister-Iannelli tuning method.
file: comp_lenfit_flt21mkt0_page1.png
Length comps, whole catch, S2-LLt_C_len (plot 2 of 4)
file: comp_lenfit_flt21mkt0_page2.png
Length comps, whole catch, S2-LLt_C_len (plot 3 of 4)
file: comp_lenfit_flt21mkt0_page3.png
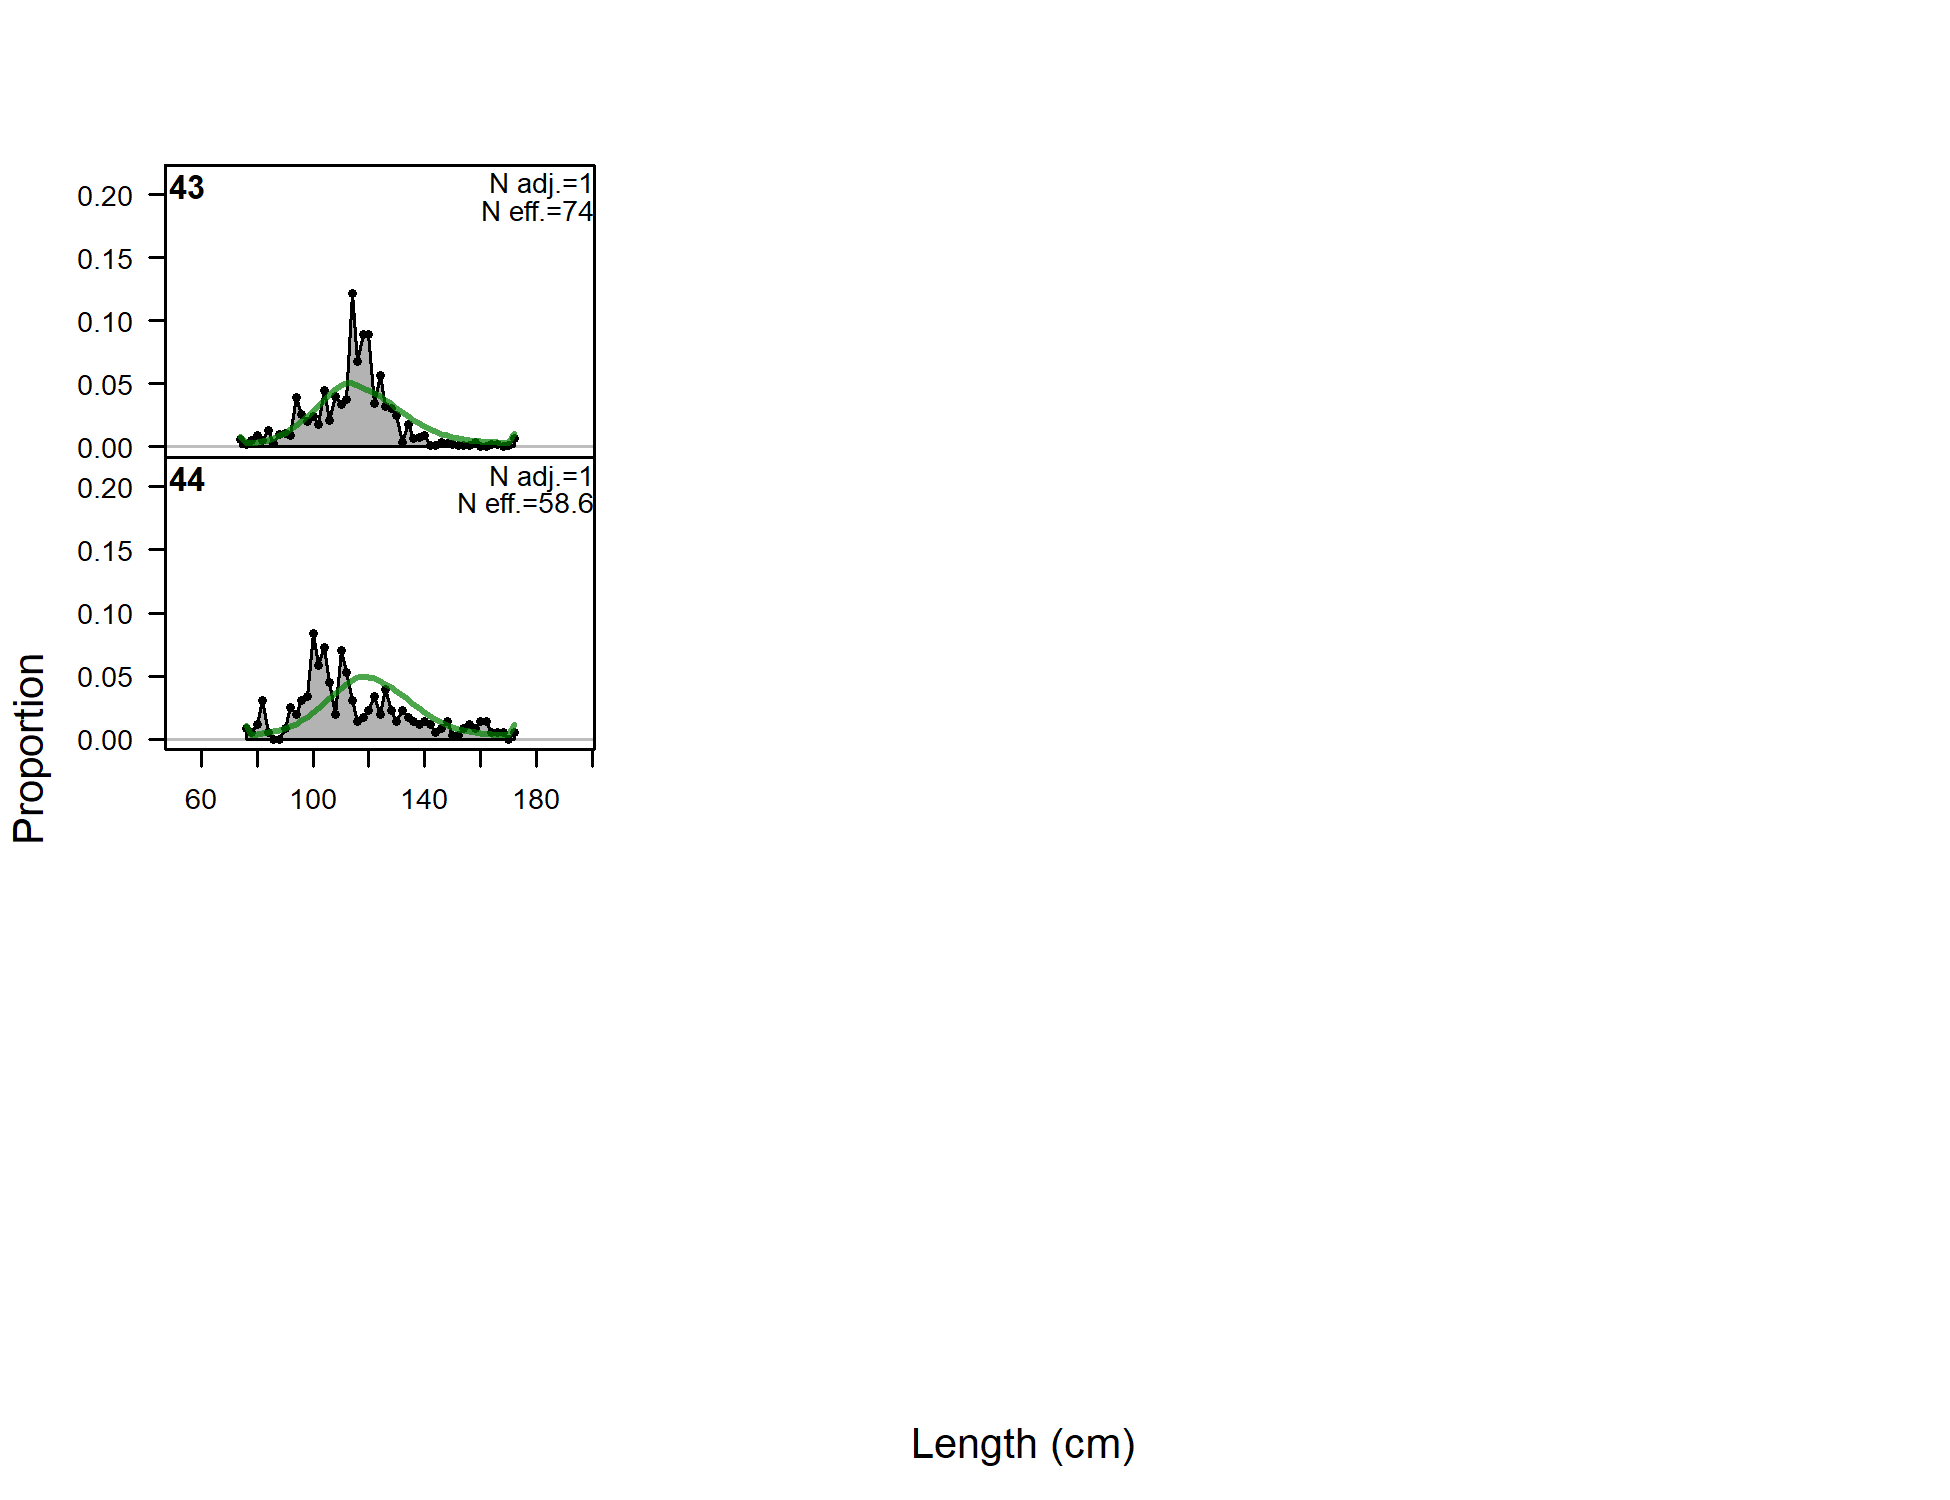
Length comps, whole catch, S2-LLt_C_len (plot 4 of 4)
file: comp_lenfit_flt21mkt0_page4.png
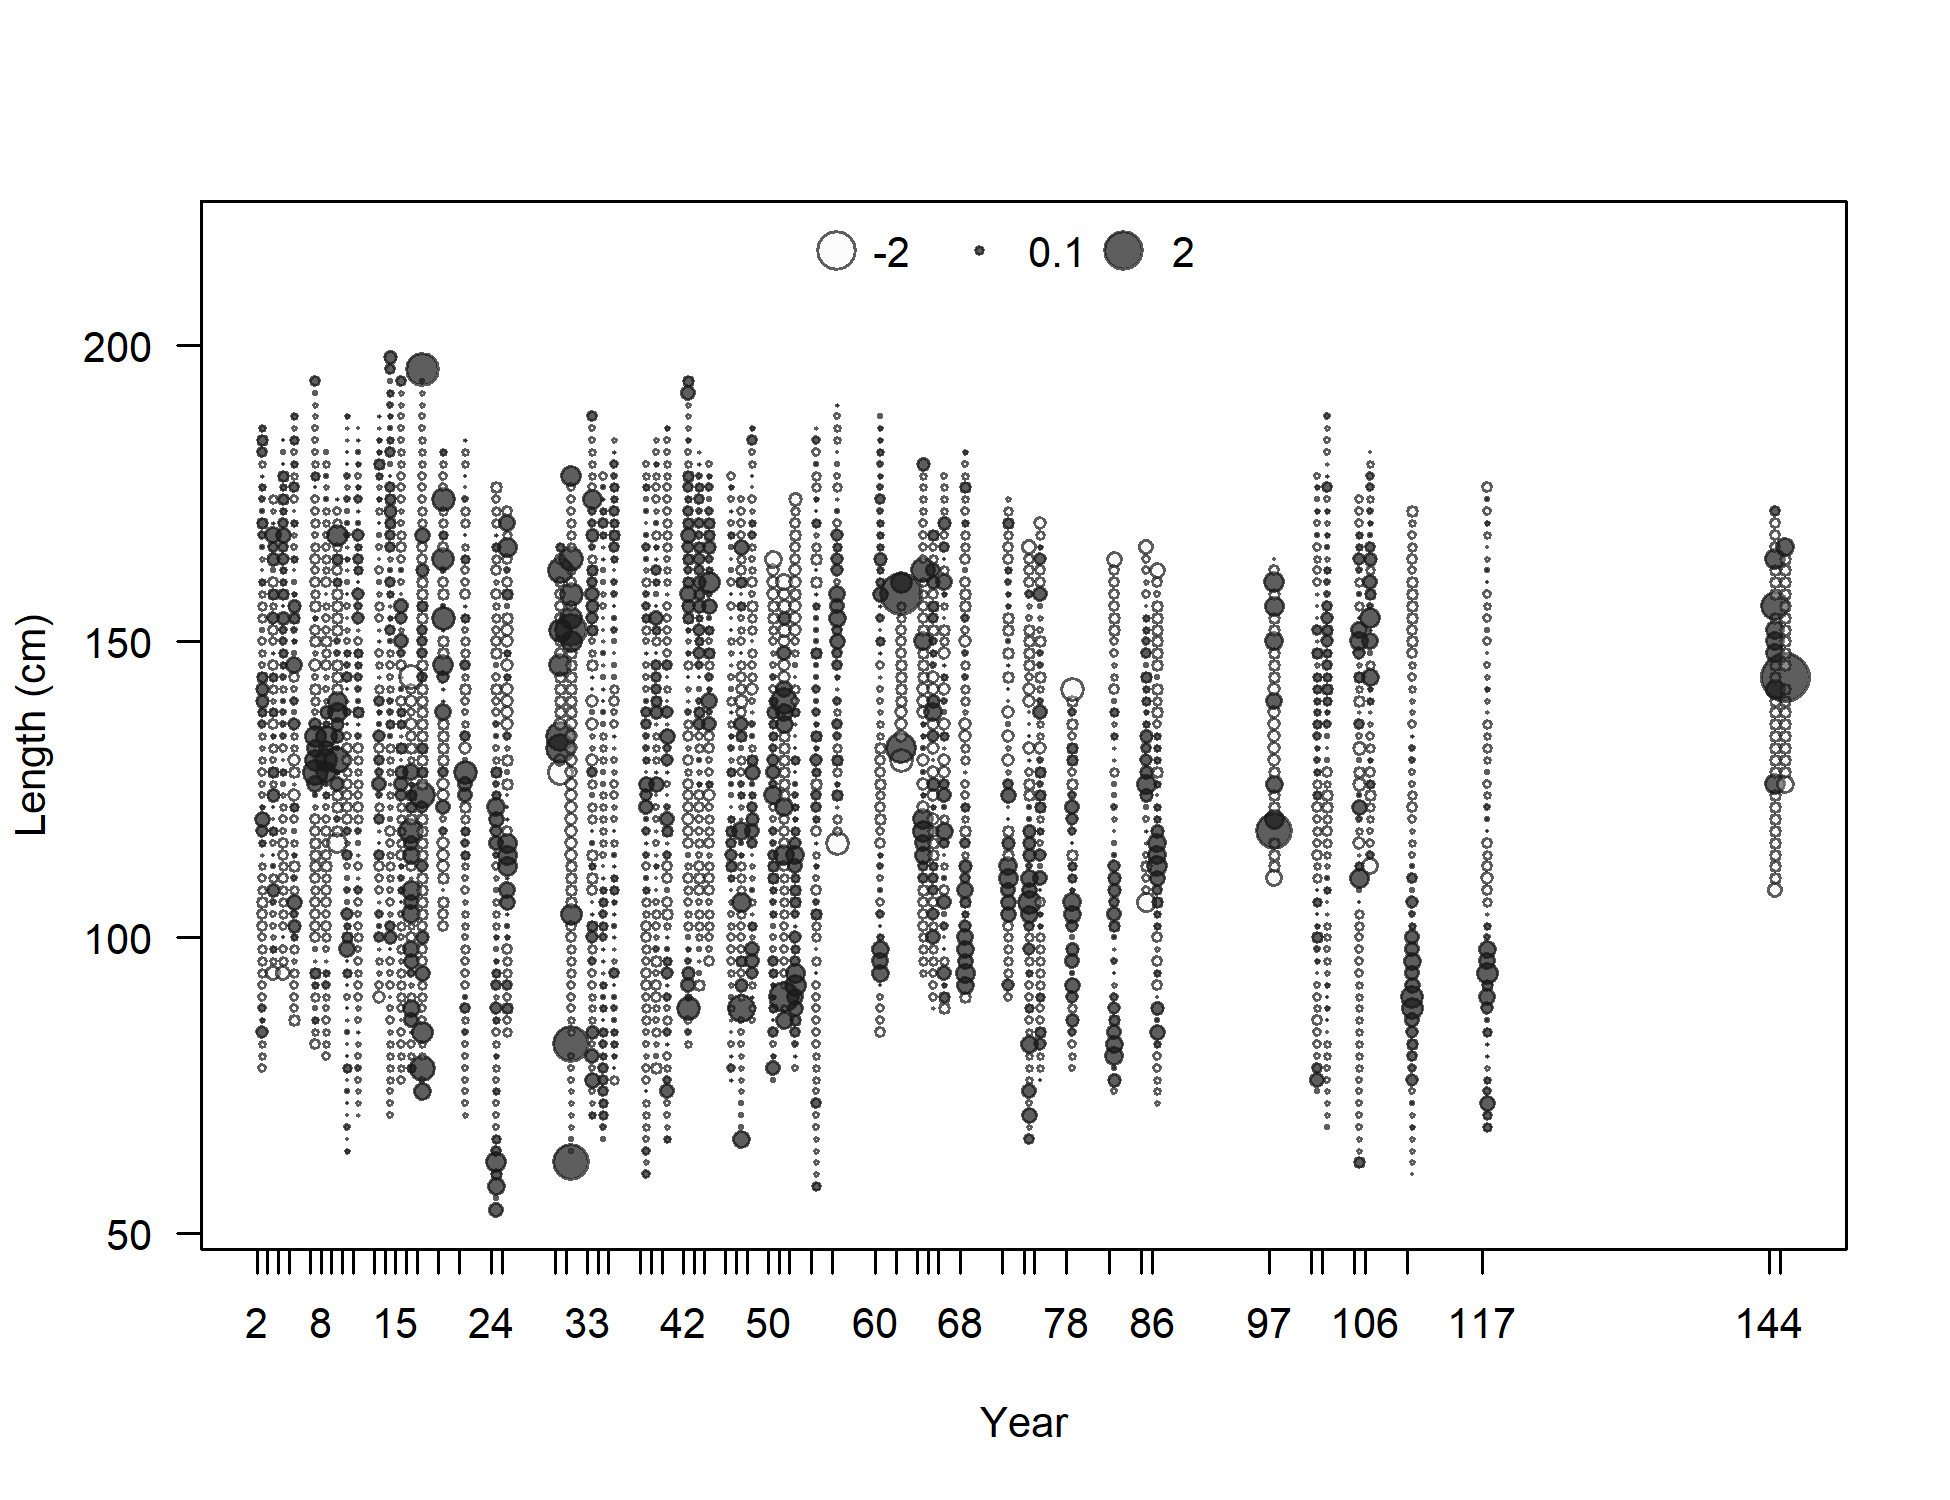
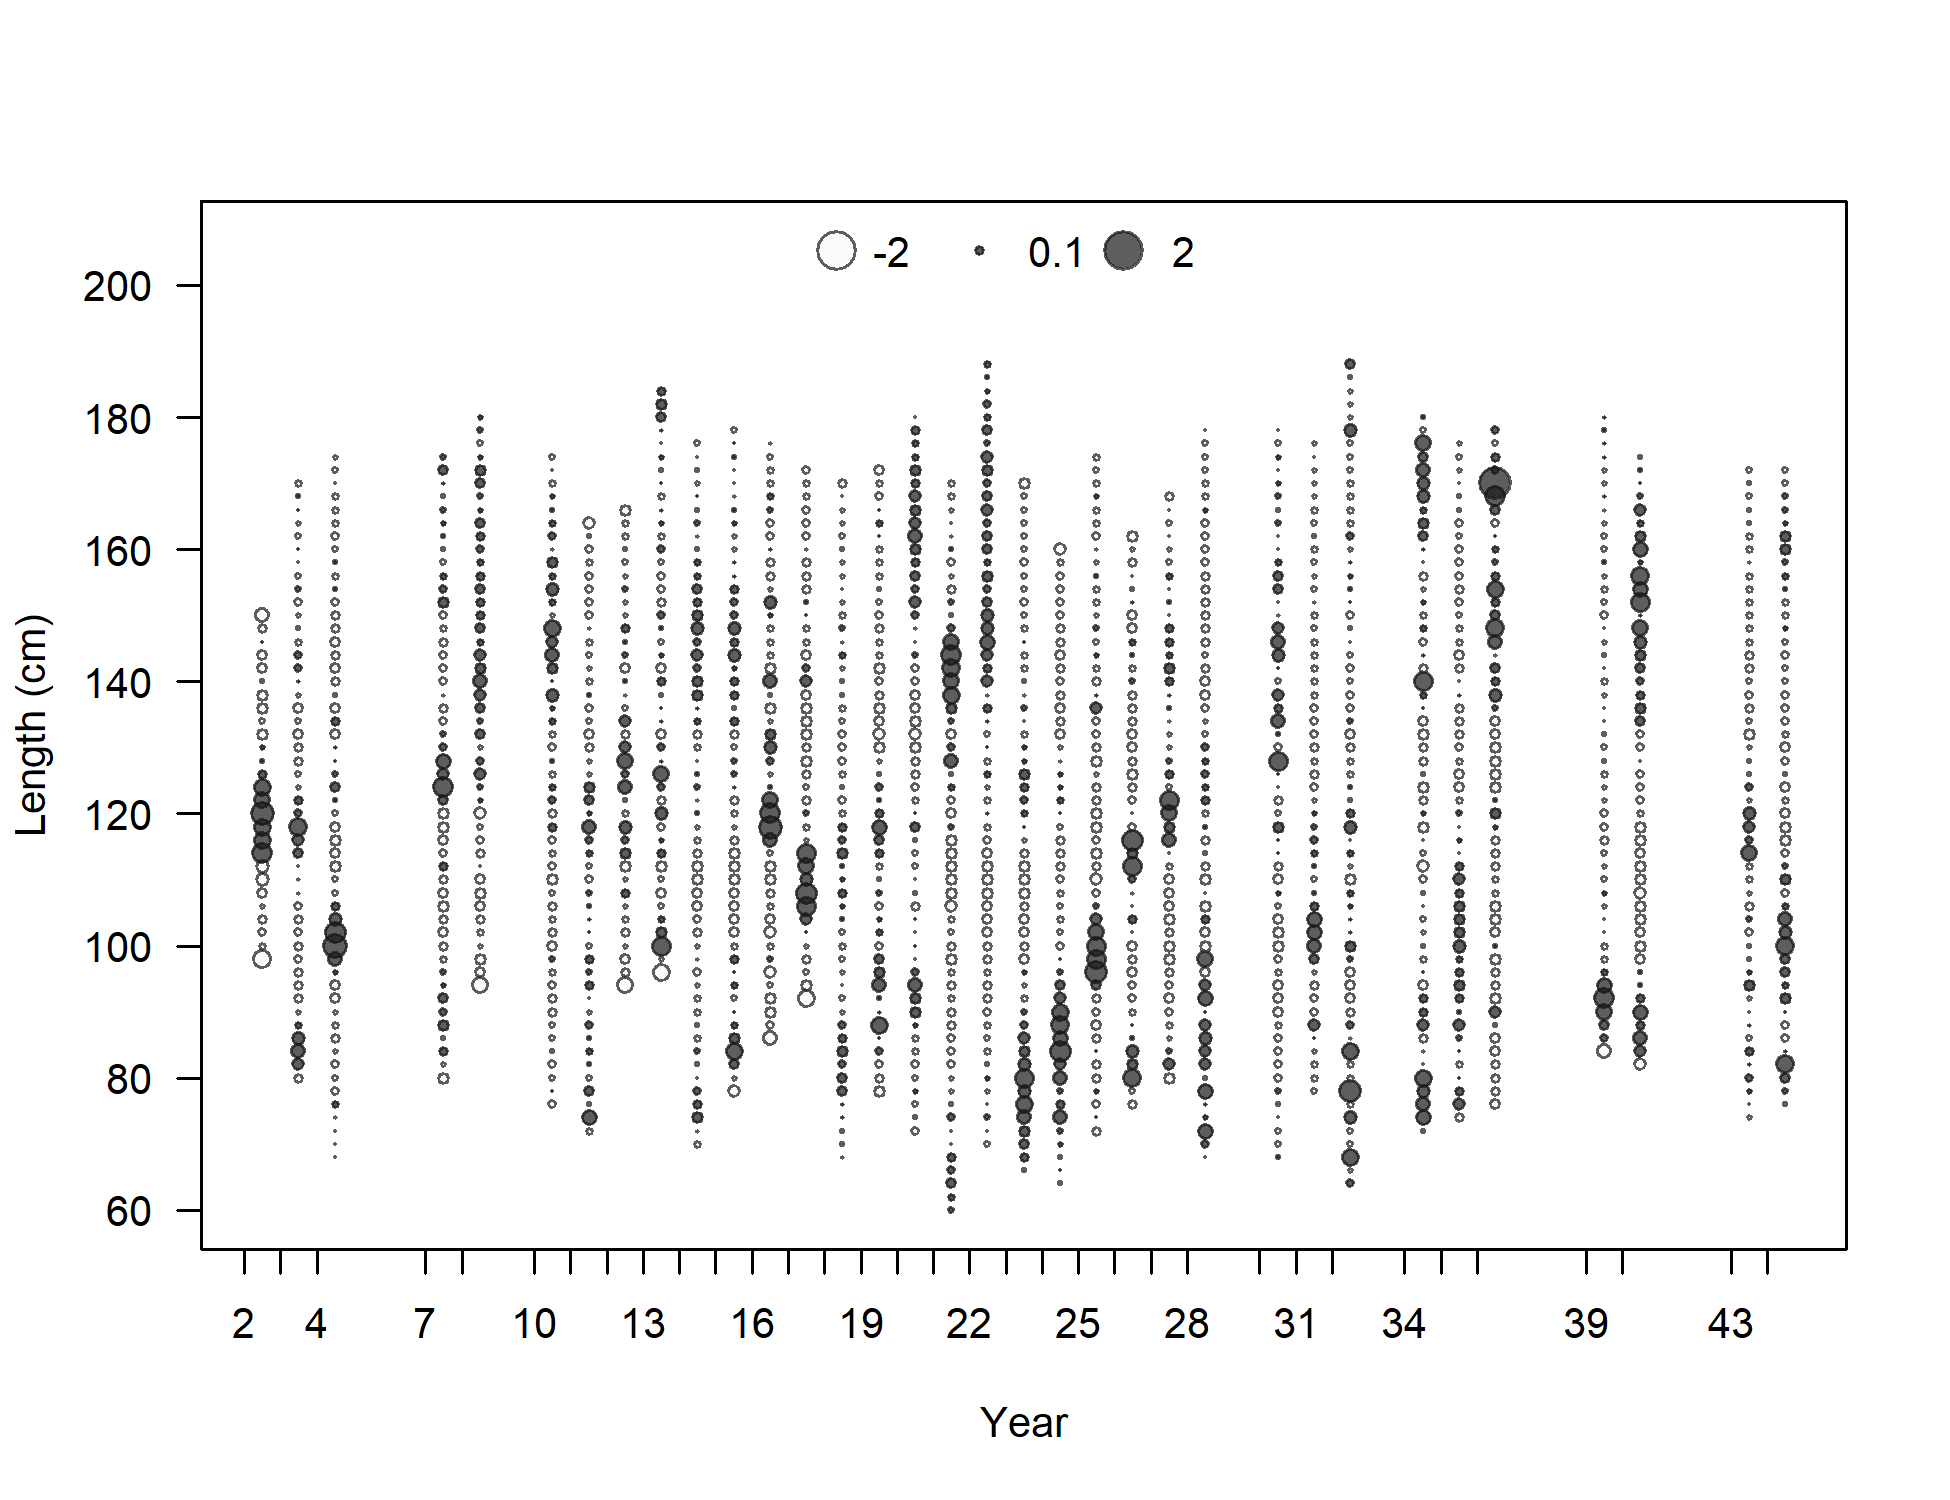
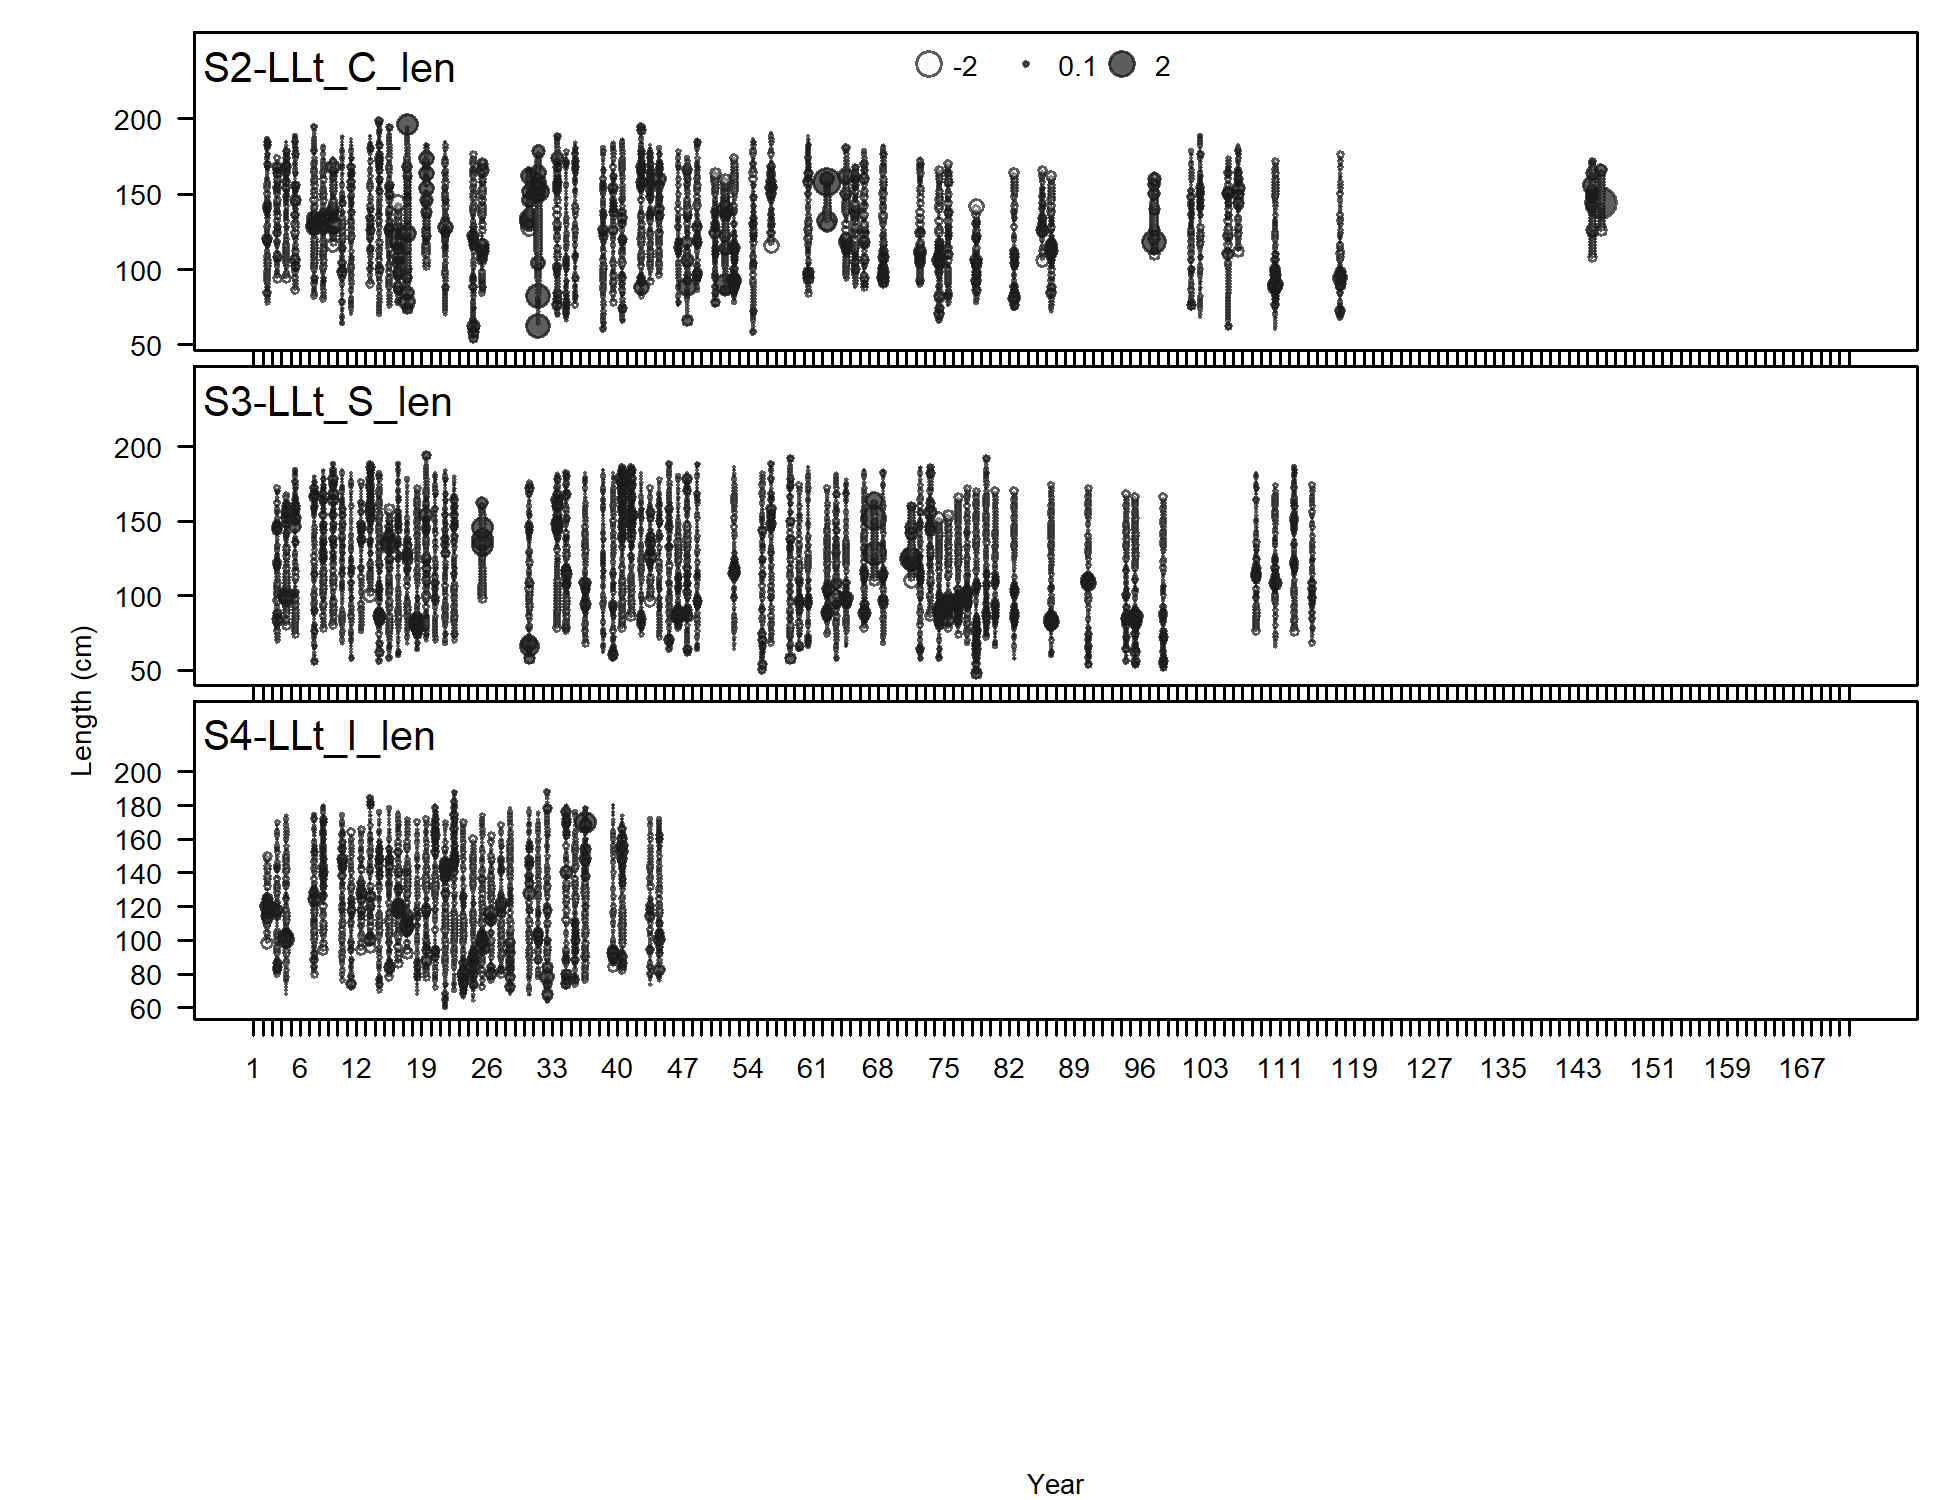
Pearson residuals, whole catch, S2-LLt_C_len (max=3.12) (plot 4 of 4)
Closed bubbles are positive residuals (observed > expected) and open bubbles are negative residuals (observed < expected).
file: comp_lenfit_residsflt21mkt0_page4.png
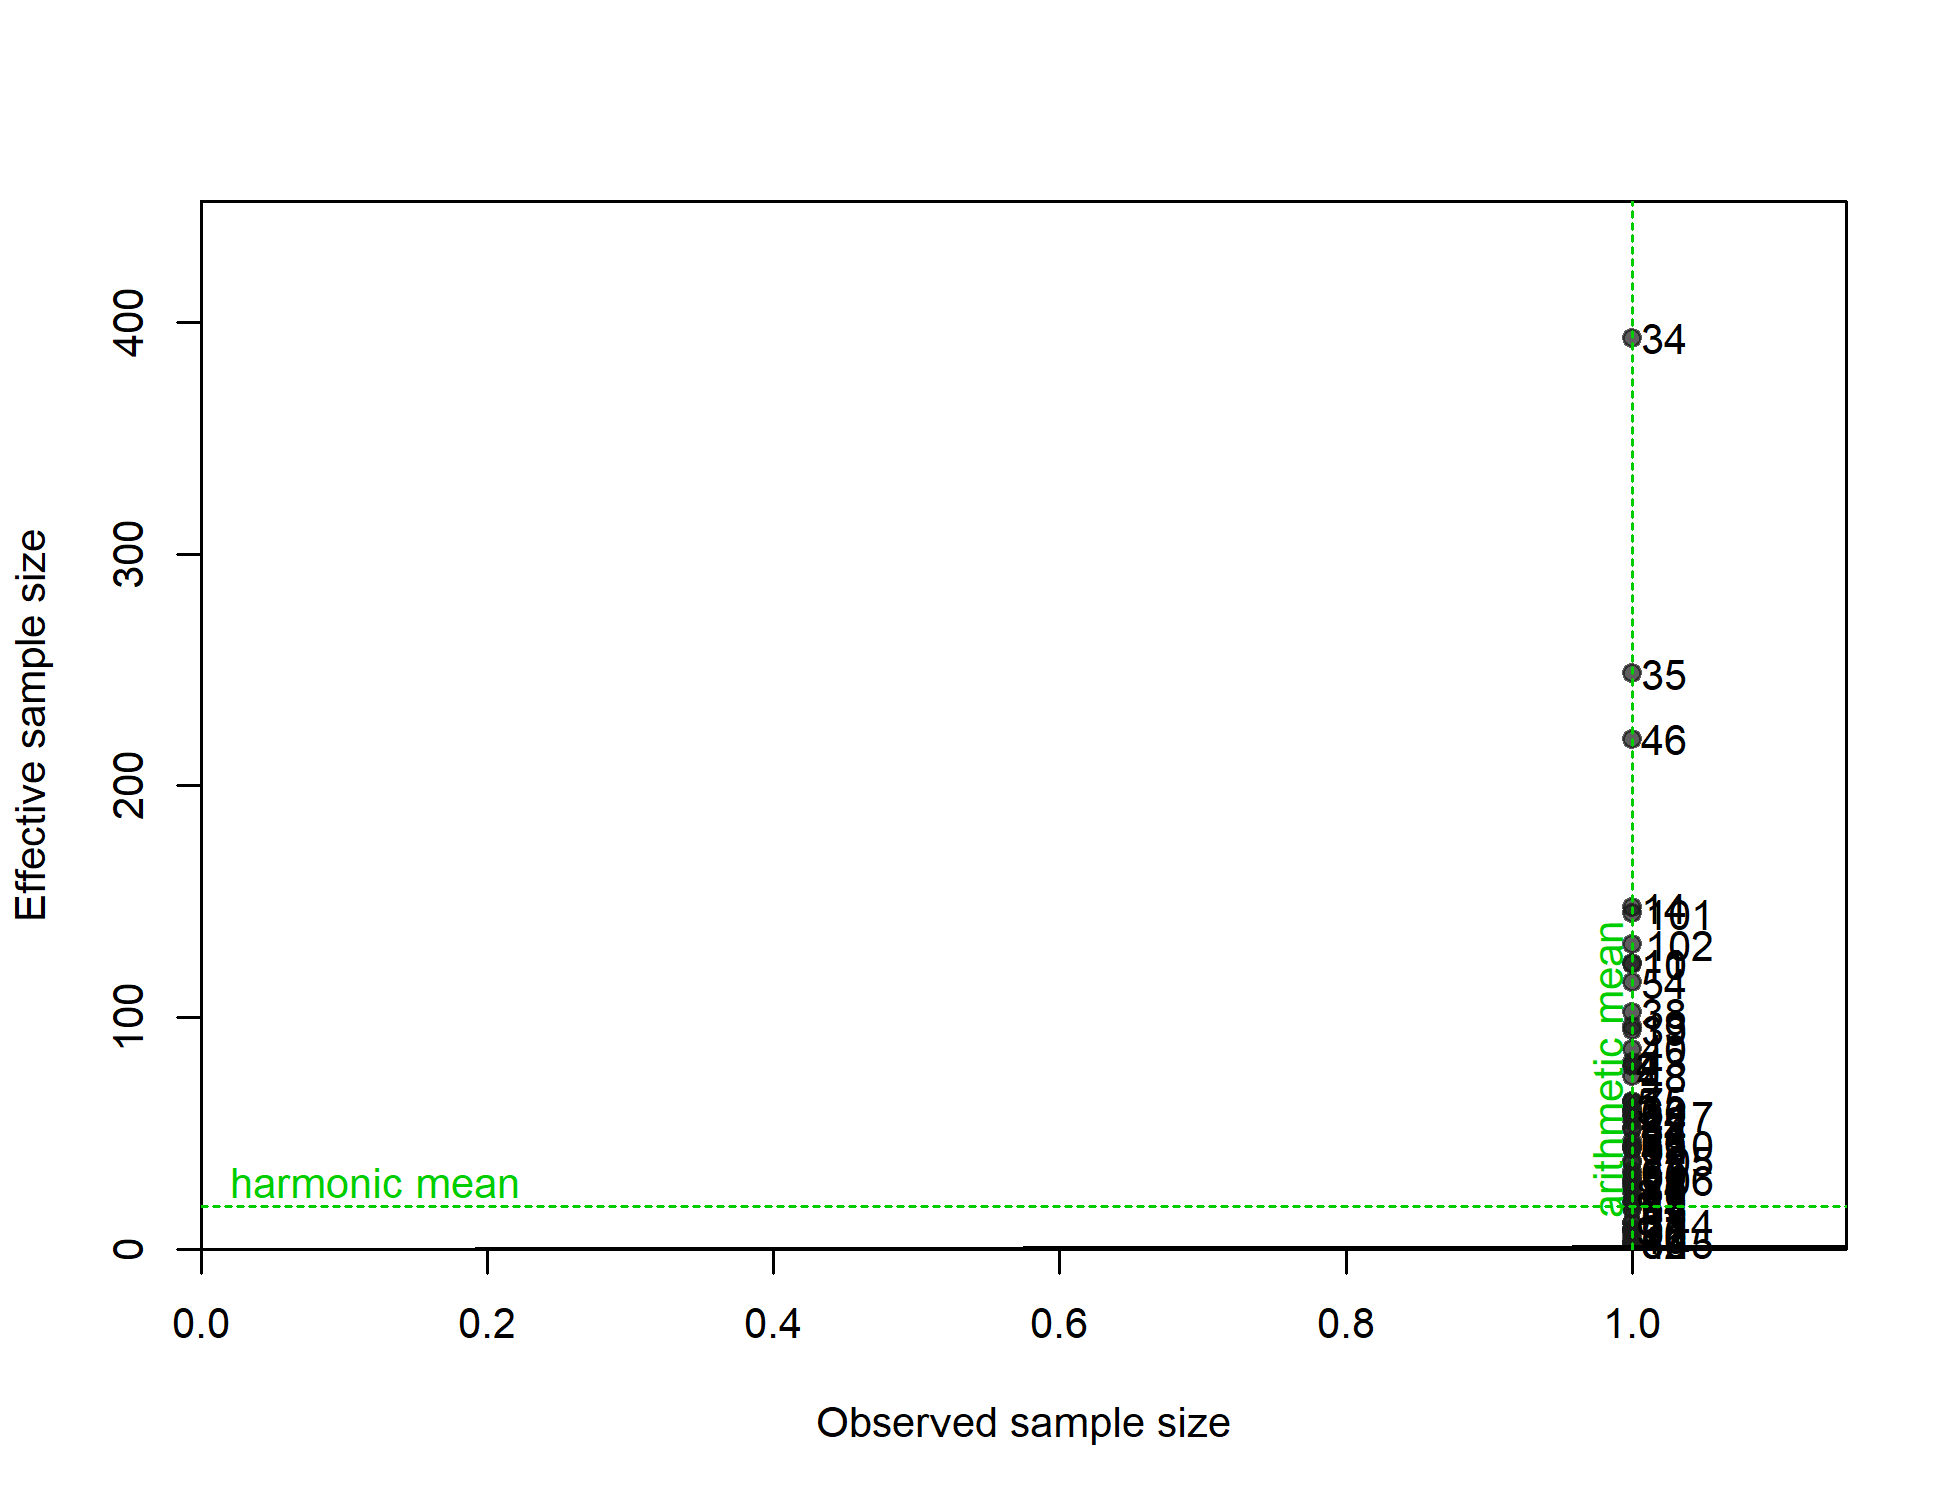
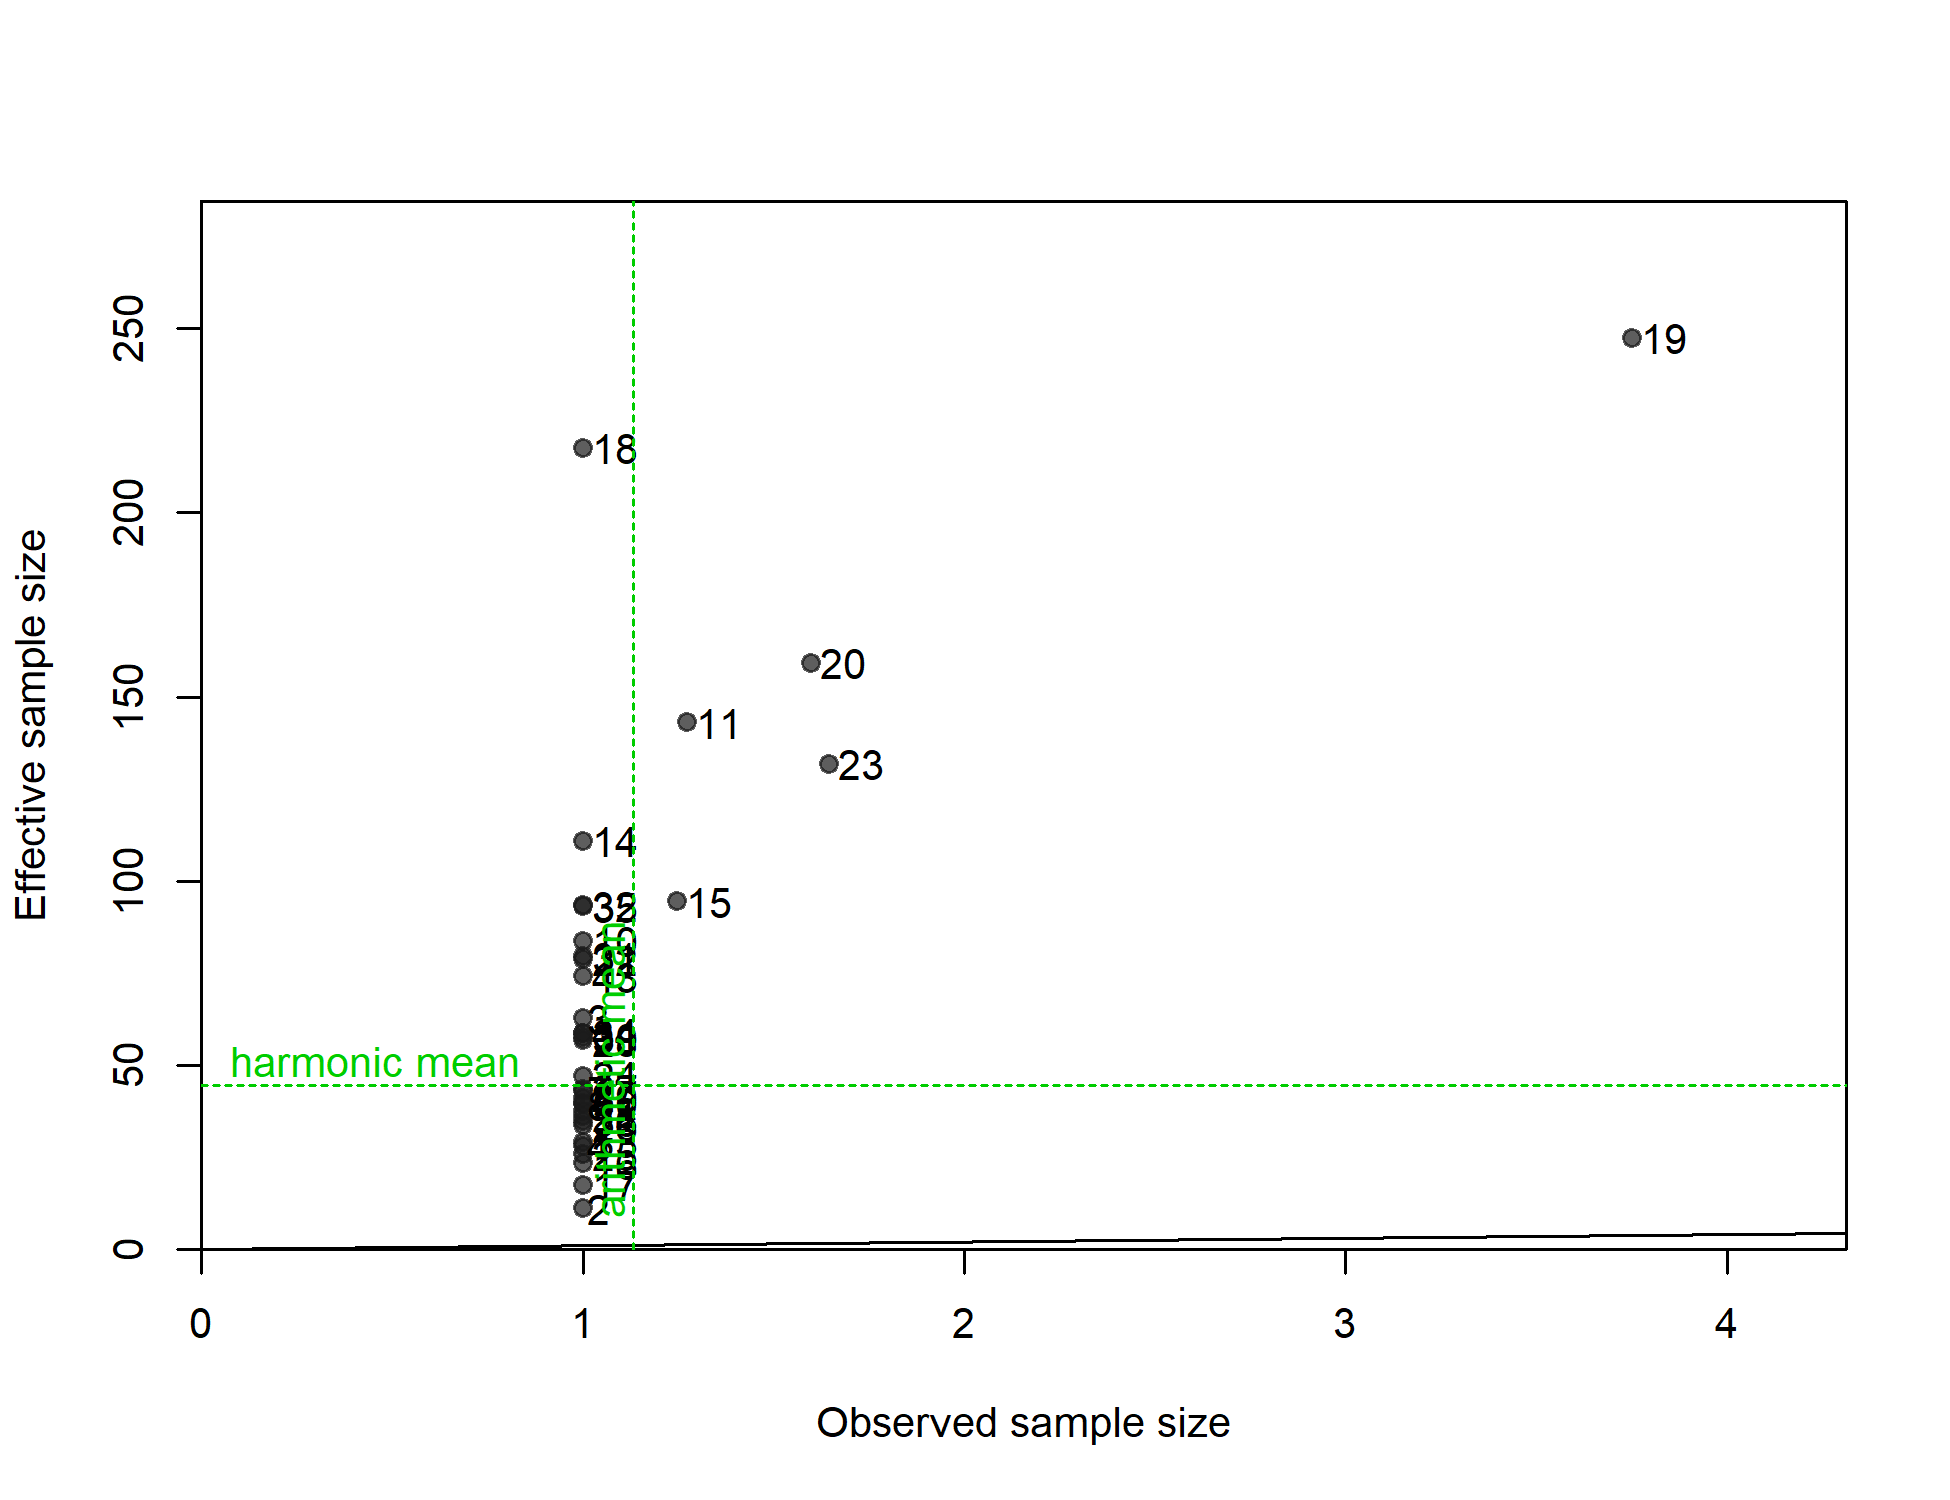
N-EffN comparison, Length comps, whole catch, S2-LLt_C_len
file: comp_lenfit_sampsize_flt21mkt0.png
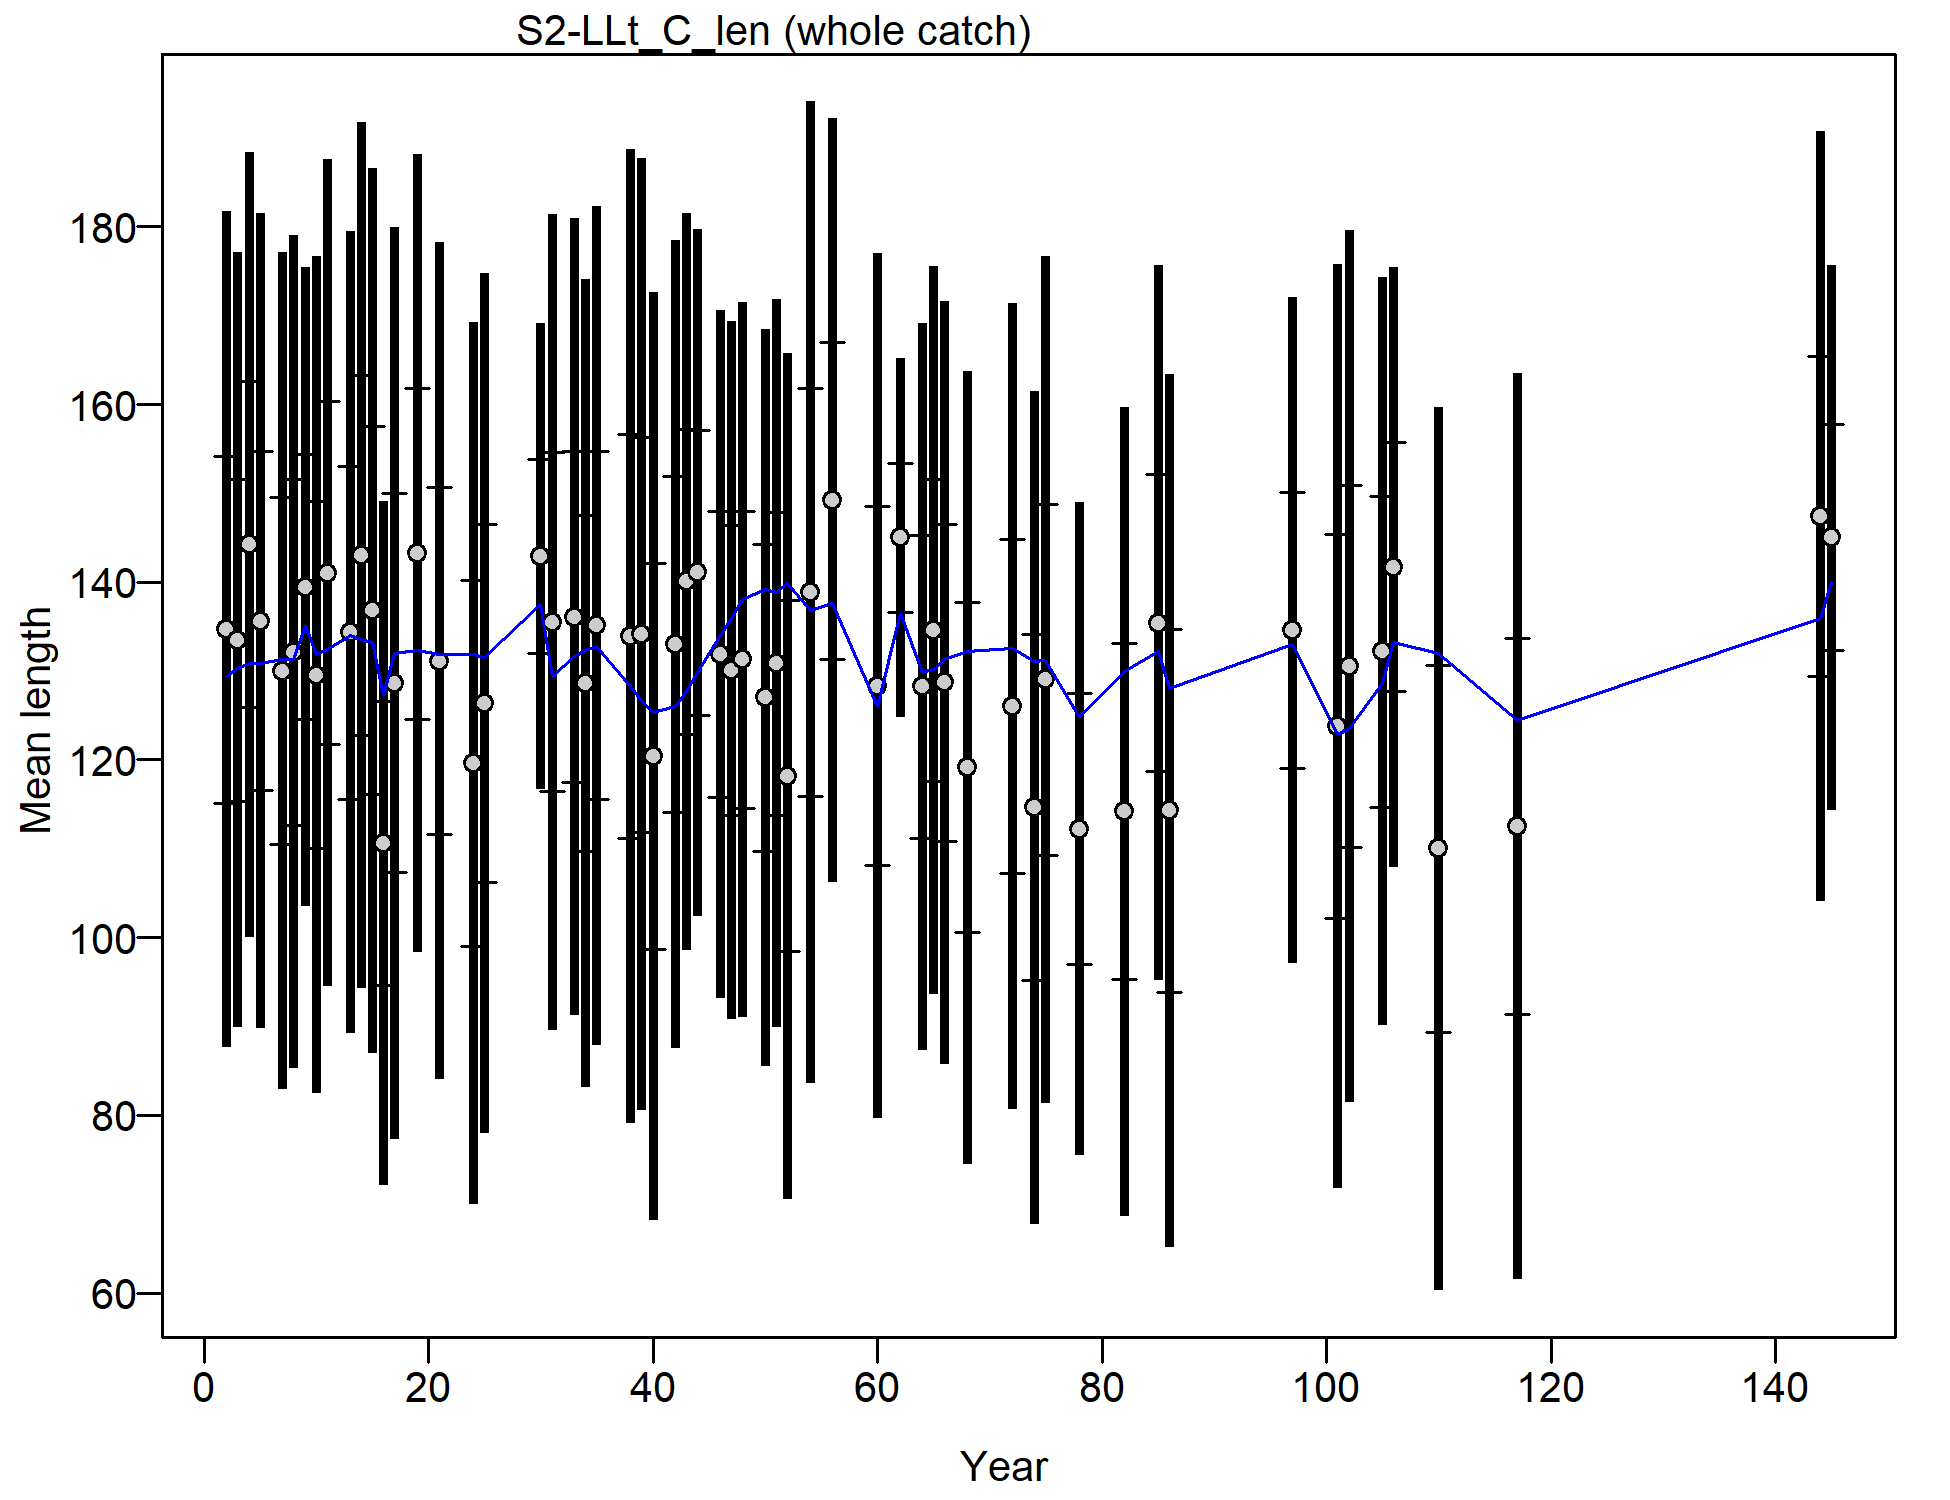
Mean length for S2-LLt_C_len with 95% confidence intervals based on current samples sizes.
Francis data weighting method TA1.8: thinner intervals (with capped ends) show result of further adjusting sample sizes based on suggested multiplier (with 95% interval) for len data from S2-LLt_C_len:
5.7972 (4.4726-8.5221)
For more info, see
Francis, R.I.C.C. (2011). Data weighting in statistical fisheries stock assessment models. Can. J. Fish. Aquat. Sci. 68: 1124-1138. https://doi.org/10.1139/f2011-025
file: comp_lenfit_data_weighting_TA1.8_S2-LLt_C_len.png
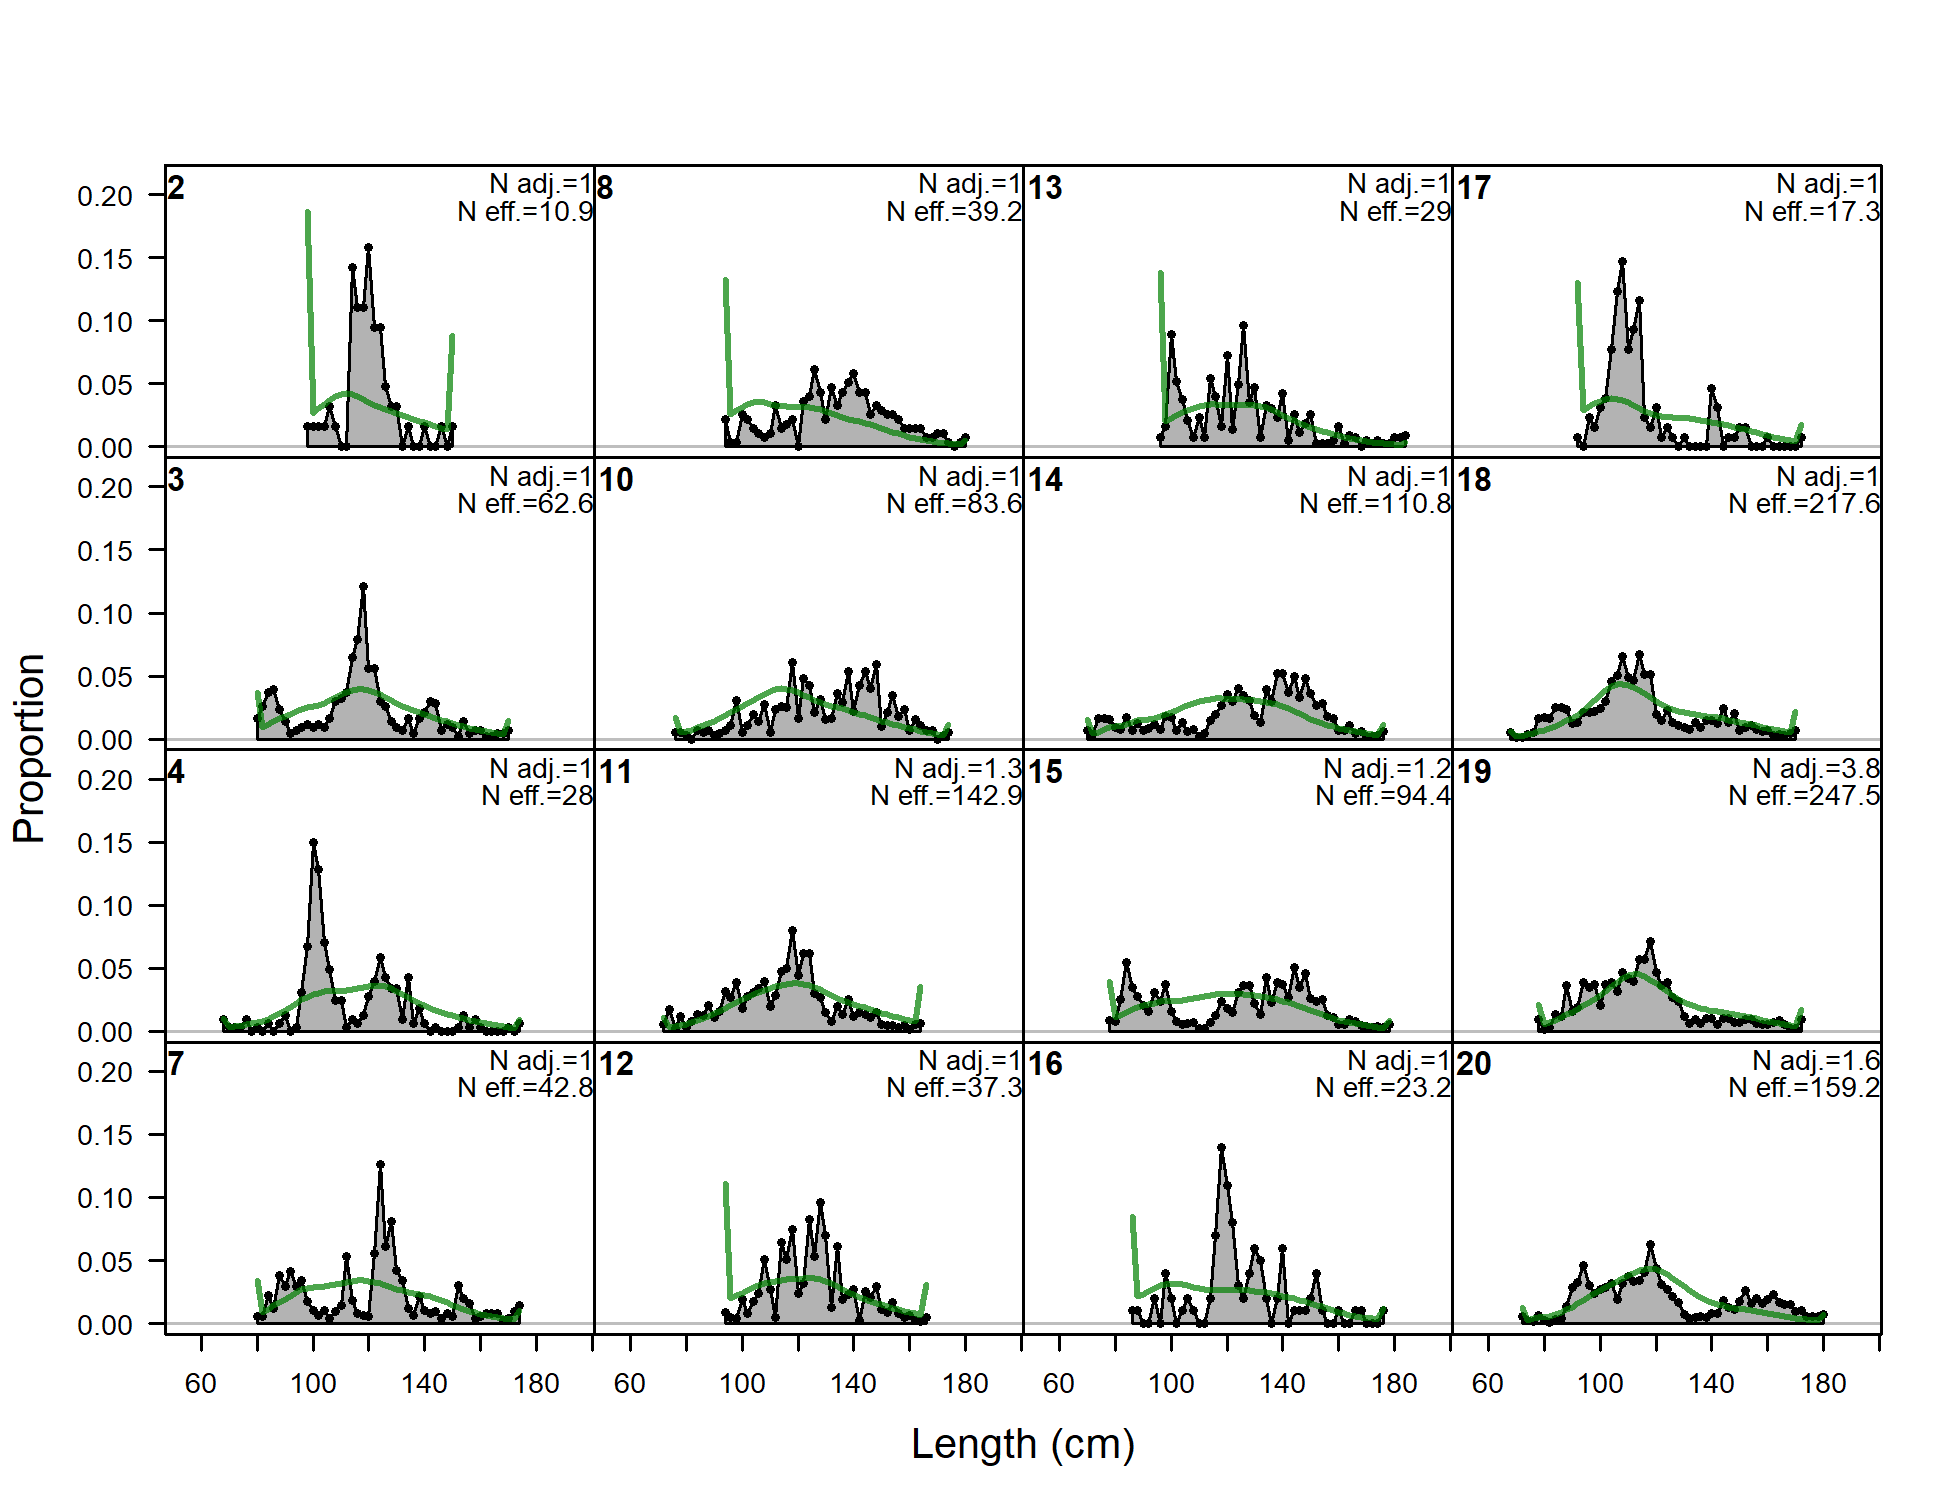
Length comps, whole catch, S3-LLt_S_len (plot 1 of 5).
'N adj.' is the input sample size after data-weighting adjustment.N eff. is the calculated effective sample size used in the McAllister-Iannelli tuning method.
file: comp_lenfit_flt22mkt0_page1.png
Length comps, whole catch, S3-LLt_S_len (plot 2 of 5)
file: comp_lenfit_flt22mkt0_page2.png
Length comps, whole catch, S3-LLt_S_len (plot 3 of 5)
file: comp_lenfit_flt22mkt0_page3.png
Length comps, whole catch, S3-LLt_S_len (plot 4 of 5)
file: comp_lenfit_flt22mkt0_page4.png
Length comps, whole catch, S3-LLt_S_len (plot 5 of 5)
file: comp_lenfit_flt22mkt0_page5.png
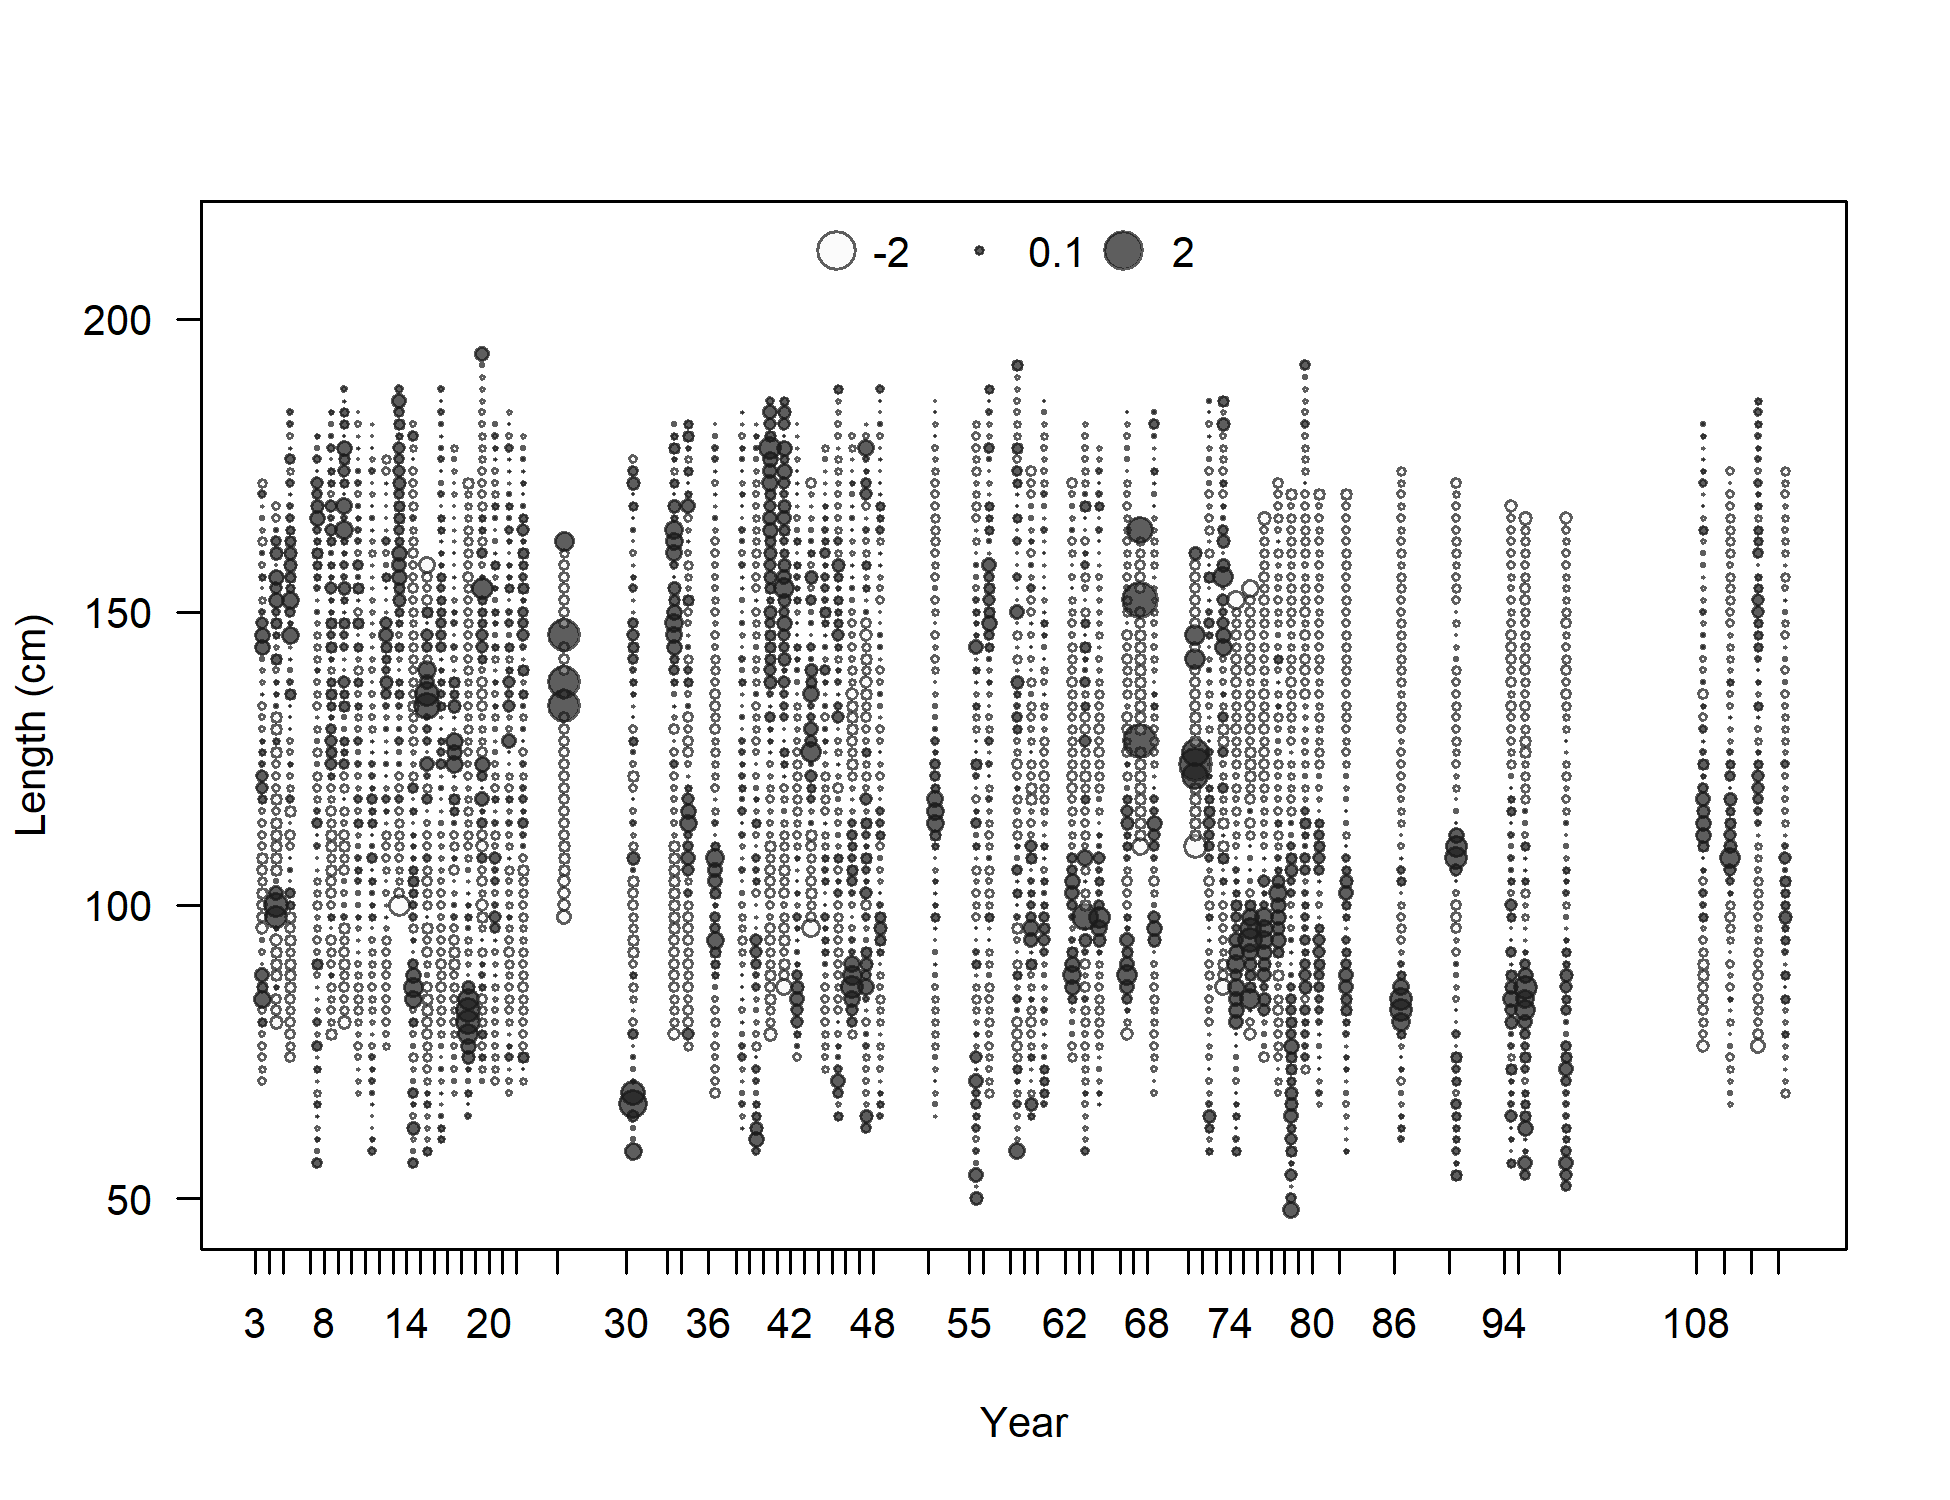
Pearson residuals, whole catch, S3-LLt_S_len (max=1.74) (plot 5 of 5)
Closed bubbles are positive residuals (observed > expected) and open bubbles are negative residuals (observed < expected).
file: comp_lenfit_residsflt22mkt0_page5.png
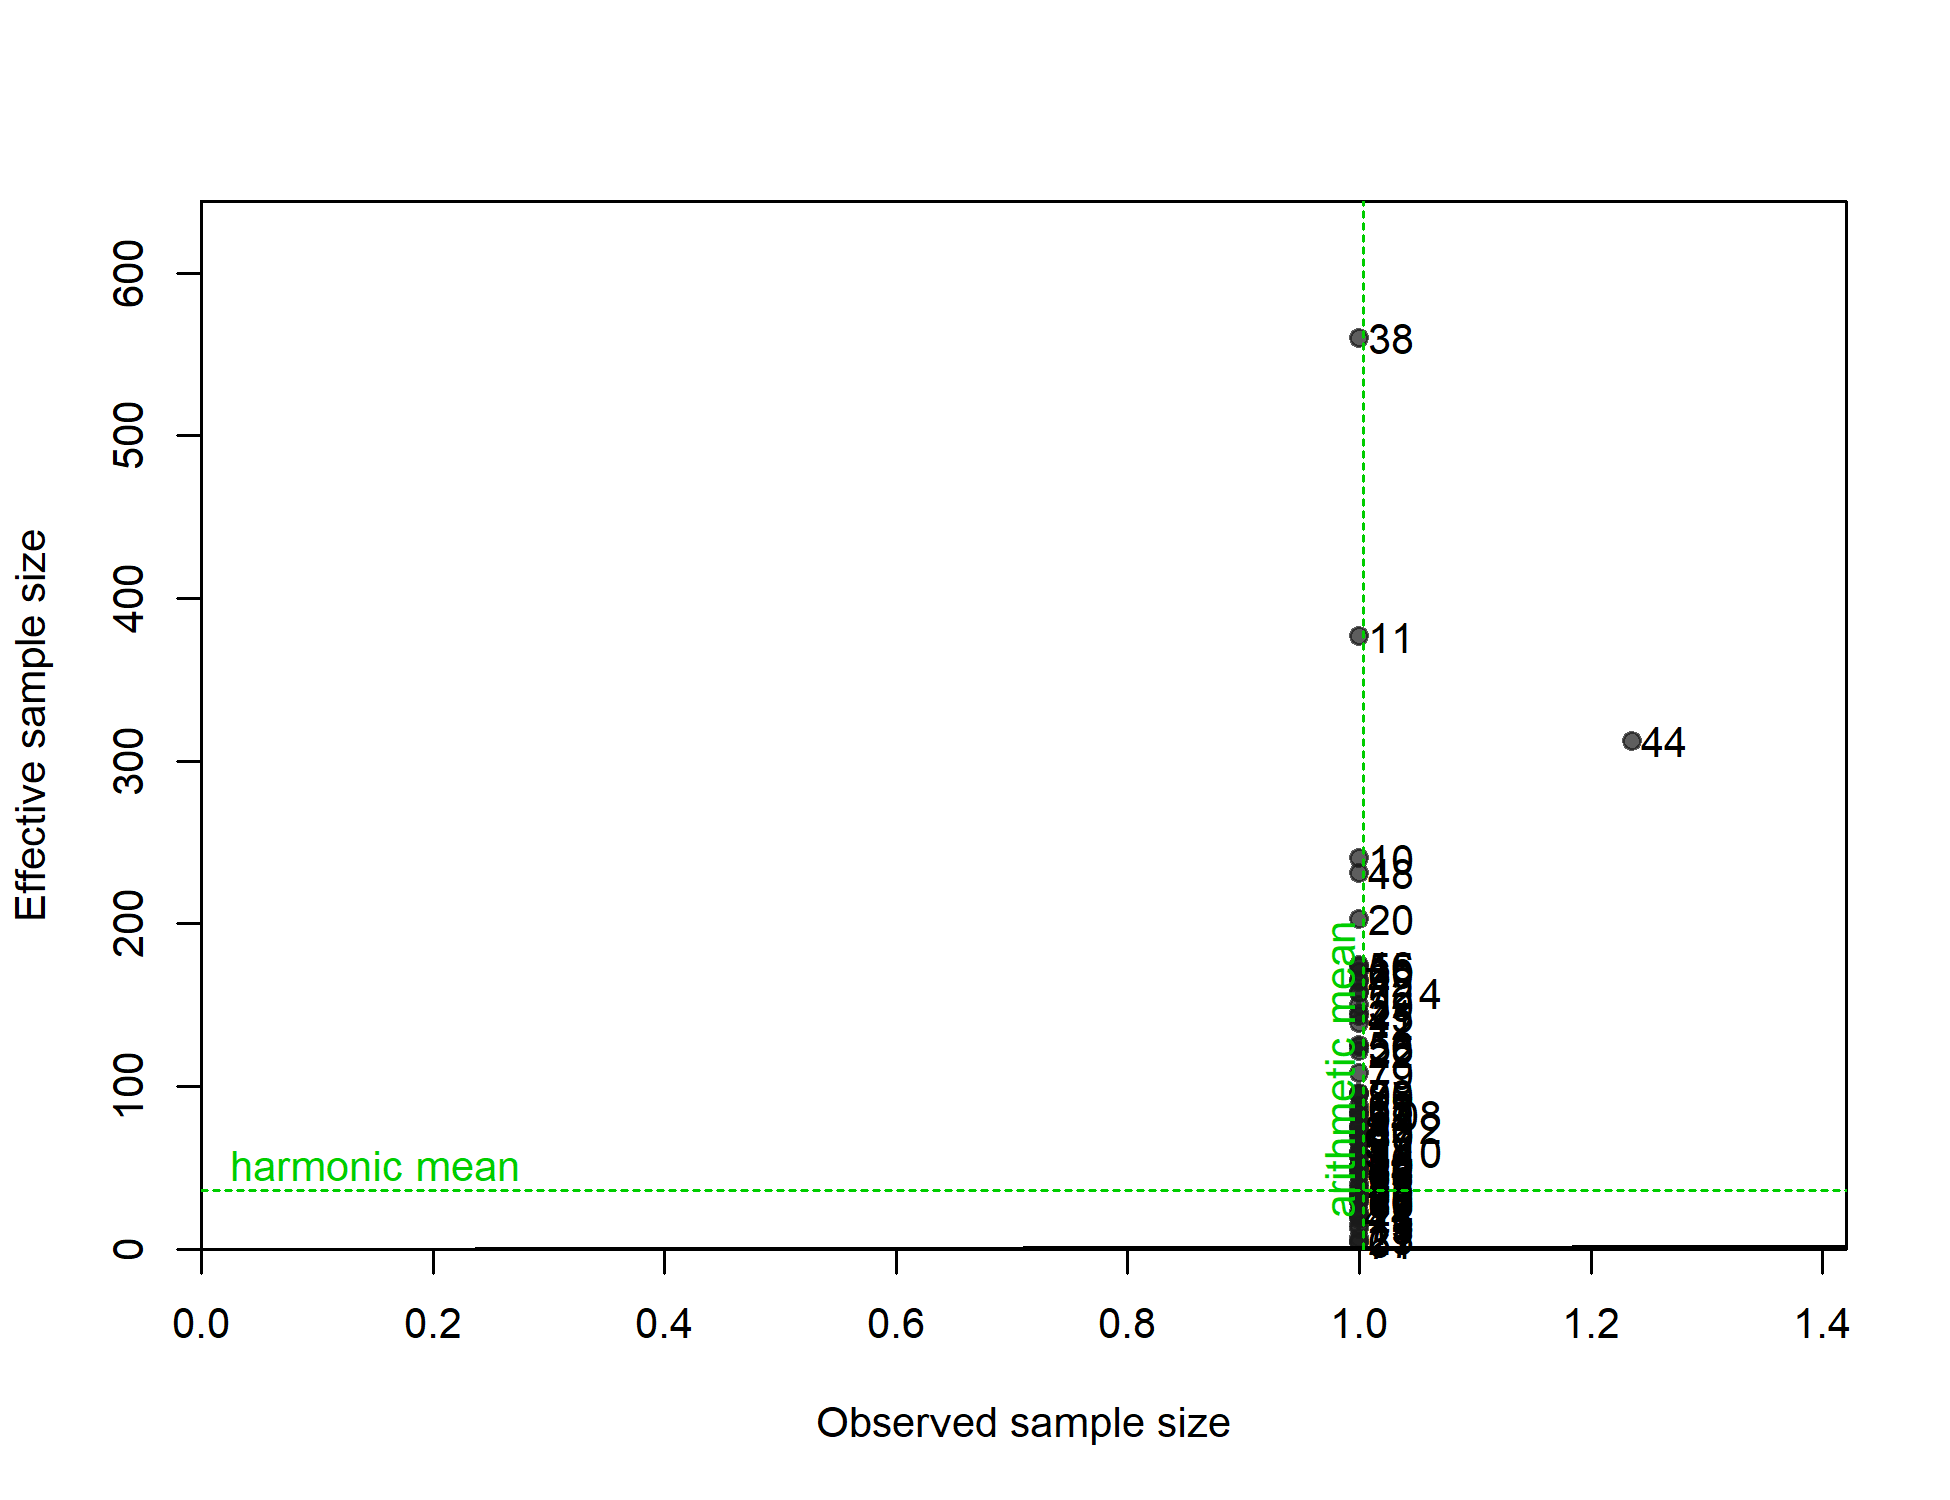
N-EffN comparison, Length comps, whole catch, S3-LLt_S_len
file: comp_lenfit_sampsize_flt22mkt0.png
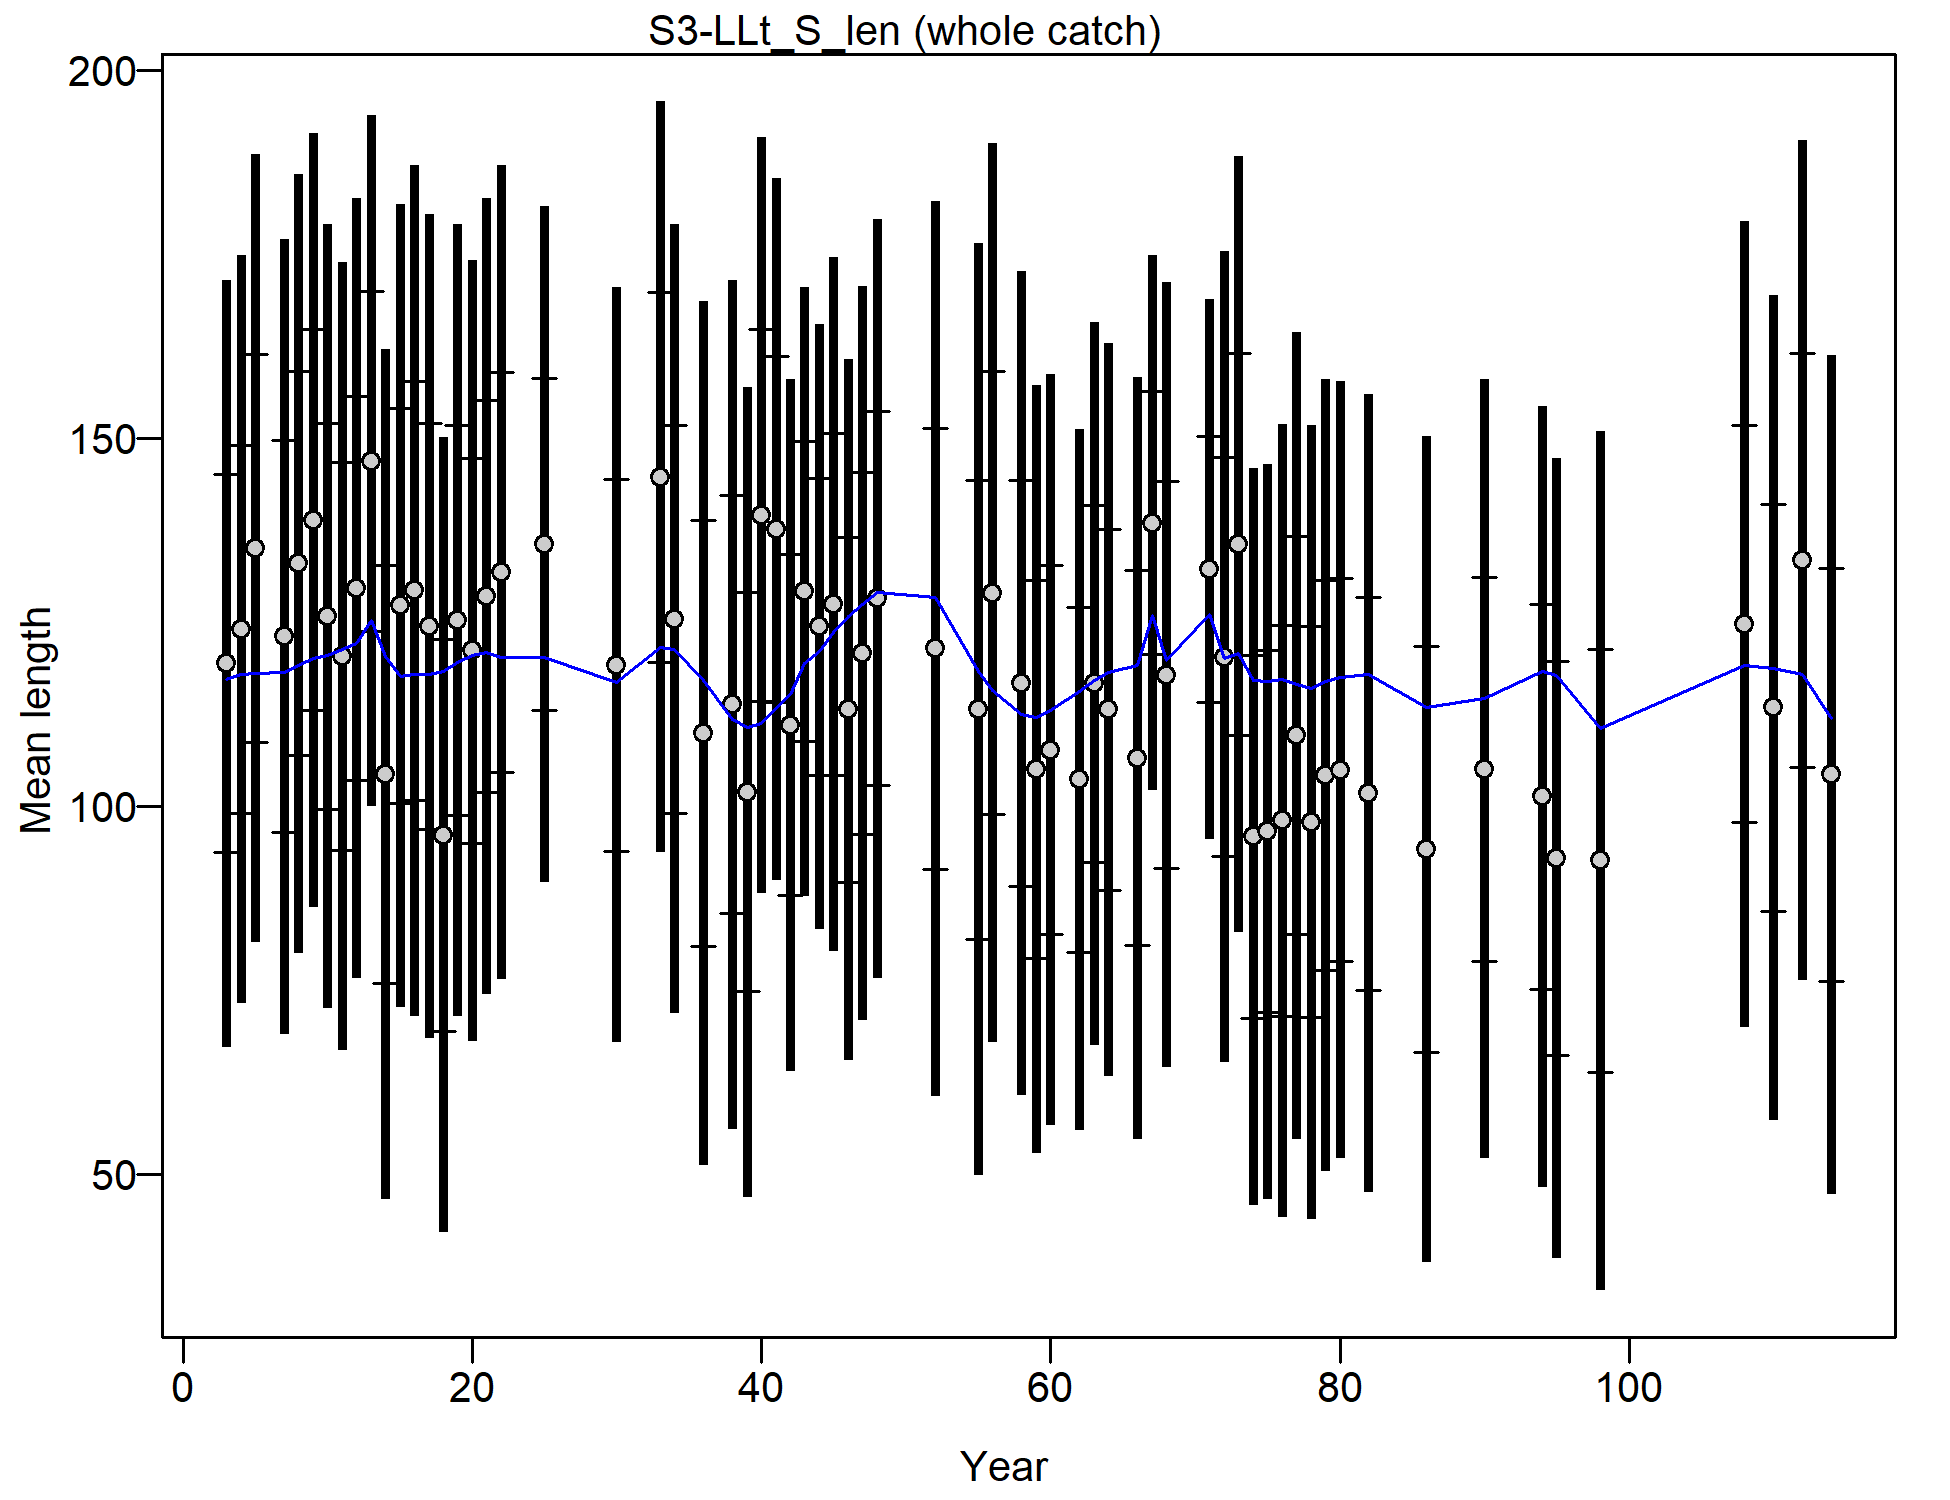
Mean length for S3-LLt_S_len with 95% confidence intervals based on current samples sizes.
Francis data weighting method TA1.8: thinner intervals (with capped ends) show result of further adjusting sample sizes based on suggested multiplier (with 95% interval) for len data from S3-LLt_S_len:
4.1212 (3.2575-5.7288)
For more info, see
Francis, R.I.C.C. (2011). Data weighting in statistical fisheries stock assessment models. Can. J. Fish. Aquat. Sci. 68: 1124-1138. https://doi.org/10.1139/f2011-025
file: comp_lenfit_data_weighting_TA1.8_S3-LLt_S_len.png
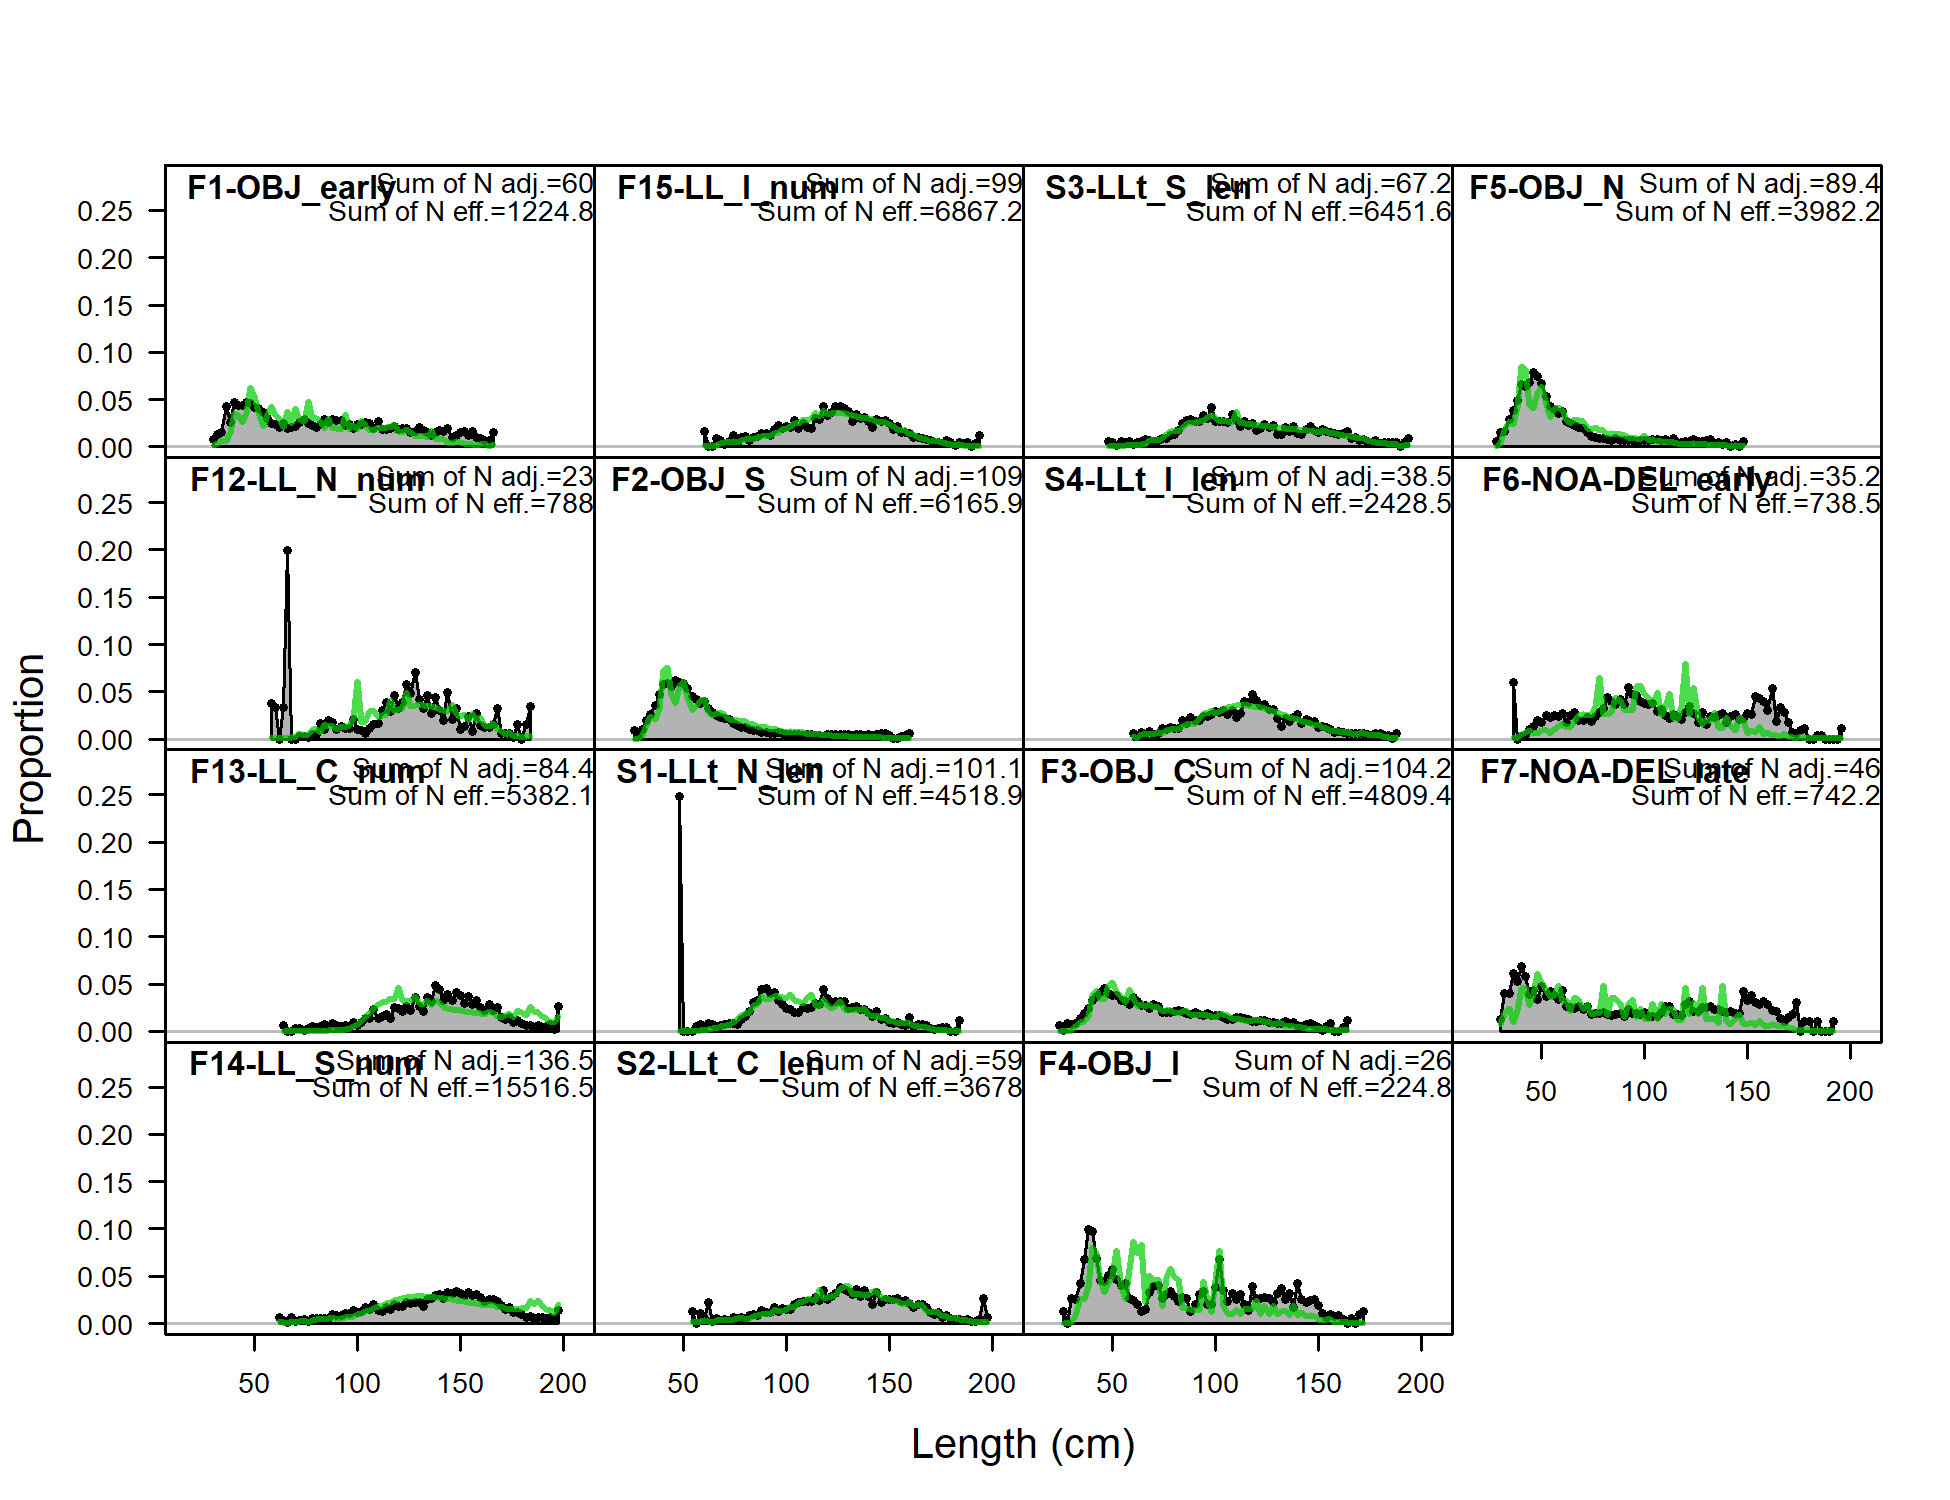
Length comps, whole catch, S4-LLt_I_len (plot 1 of 3).
'N adj.' is the input sample size after data-weighting adjustment.N eff. is the calculated effective sample size used in the McAllister-Iannelli tuning method.
file: comp_lenfit_flt23mkt0_page1.png
Length comps, whole catch, S4-LLt_I_len (plot 2 of 3)
file: comp_lenfit_flt23mkt0_page2.png
Length comps, whole catch, S4-LLt_I_len (plot 3 of 3)
file: comp_lenfit_flt23mkt0_page3.png
Pearson residuals, whole catch, S4-LLt_I_len (max=1.31) (plot 3 of 3)
Closed bubbles are positive residuals (observed > expected) and open bubbles are negative residuals (observed < expected).
file: comp_lenfit_residsflt23mkt0_page3.png
N-EffN comparison, Length comps, whole catch, S4-LLt_I_len
file: comp_lenfit_sampsize_flt23mkt0.png
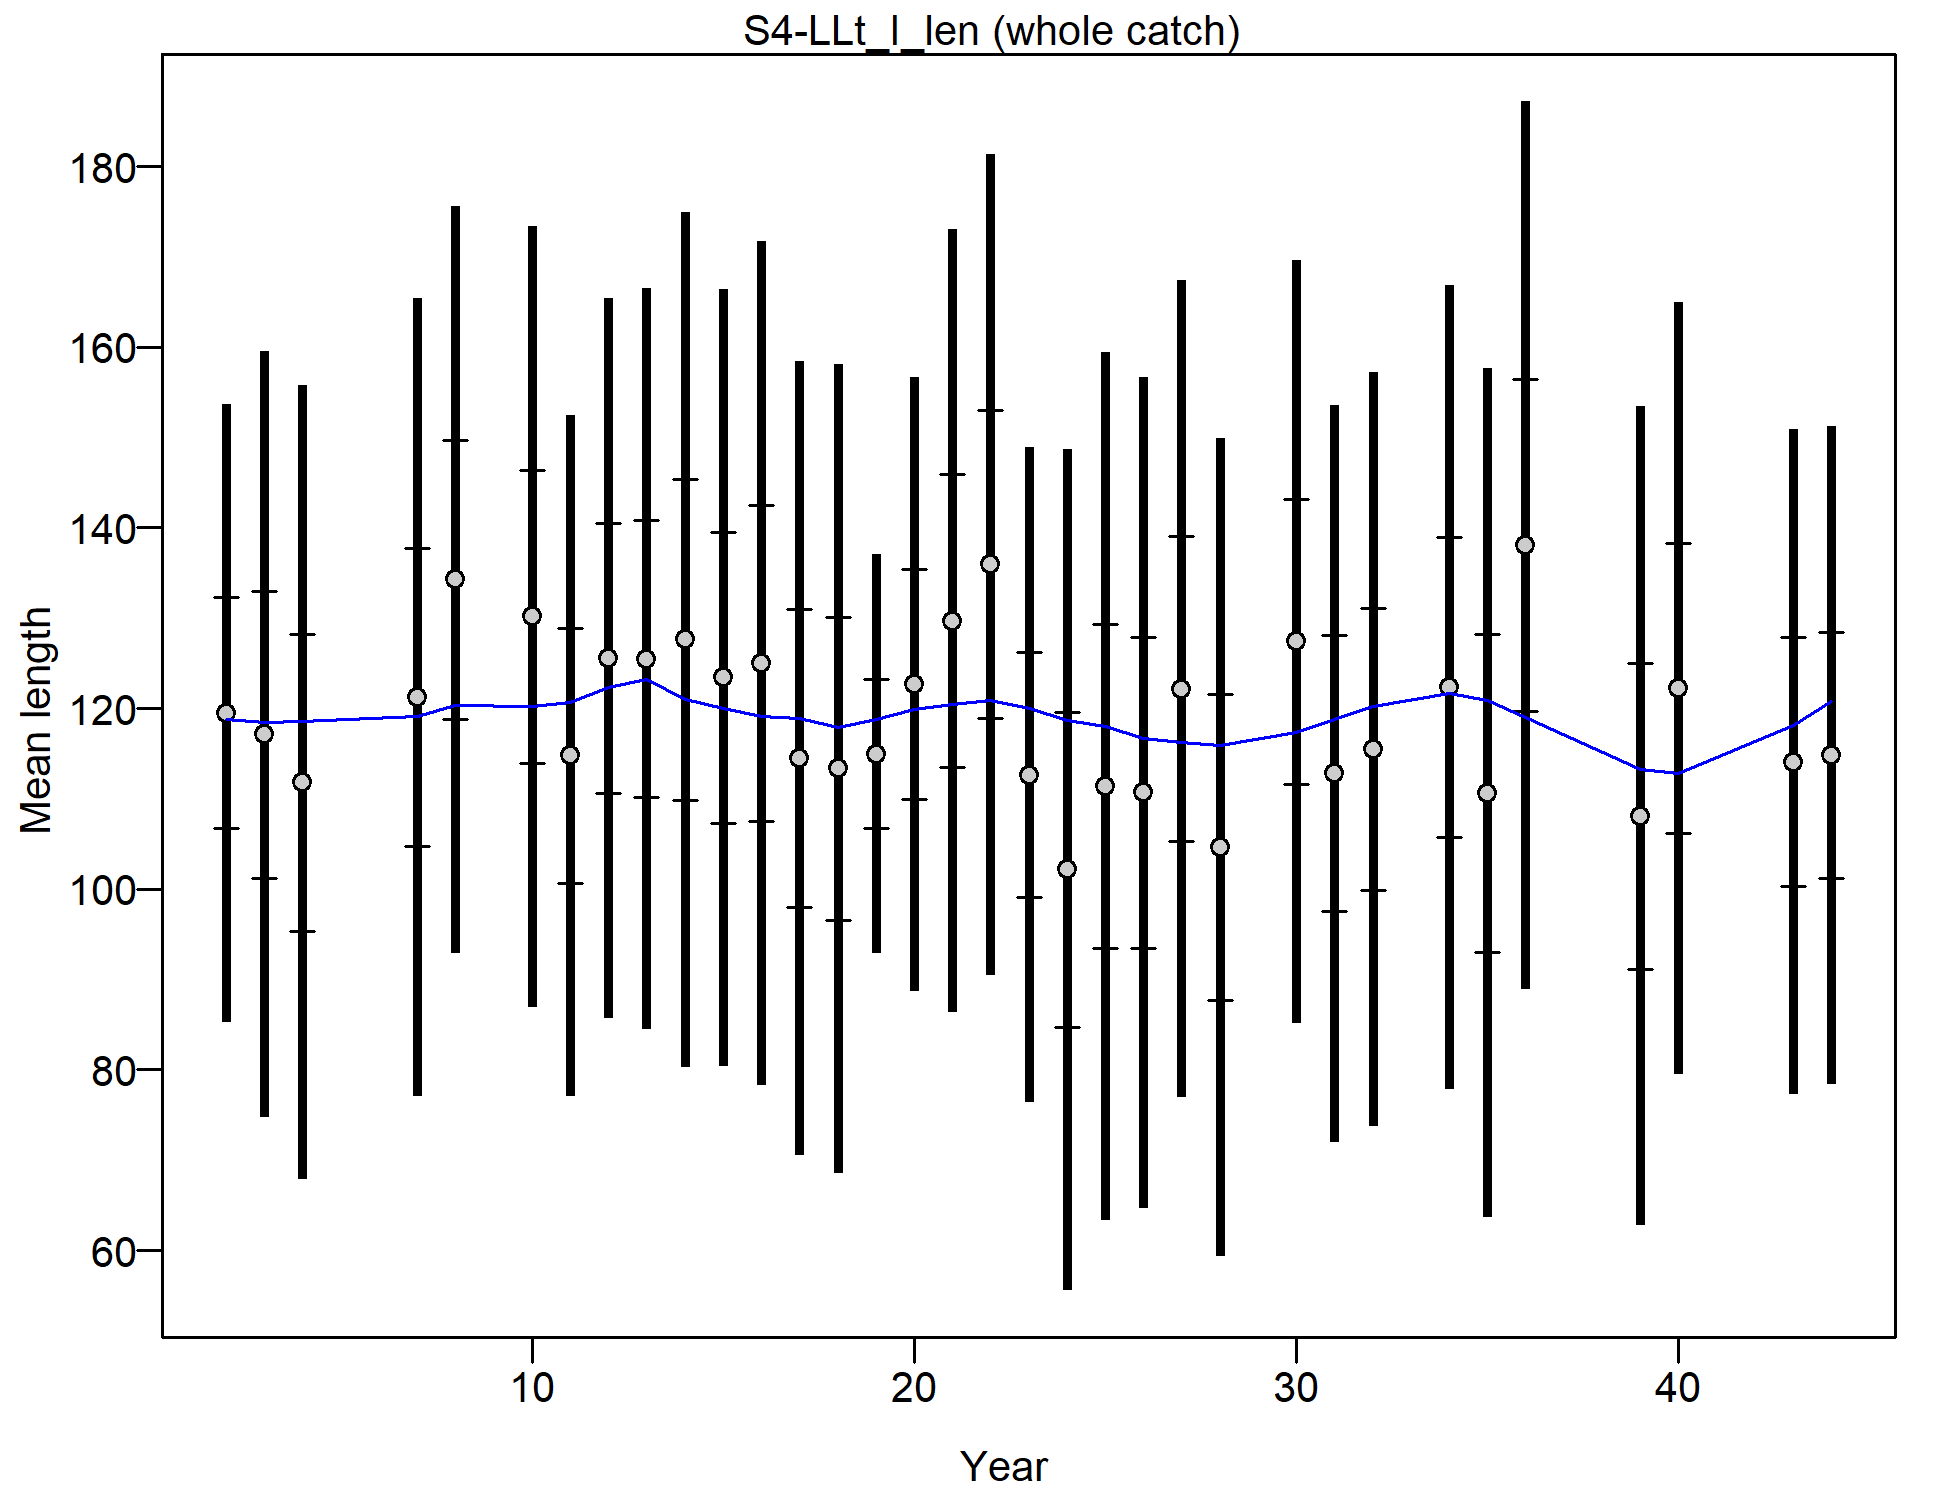
Mean length for S4-LLt_I_len with 95% confidence intervals based on current samples sizes.
Francis data weighting method TA1.8: thinner intervals (with capped ends) show result of further adjusting sample sizes based on suggested multiplier (with 95% interval) for len data from S4-LLt_I_len:
7.1348 (5.4061-11.282)
For more info, see
Francis, R.I.C.C. (2011). Data weighting in statistical fisheries stock assessment models. Can. J. Fish. Aquat. Sci. 68: 1124-1138. https://doi.org/10.1139/f2011-025
file: comp_lenfit_data_weighting_TA1.8_S4-LLt_I_len.png
Length comps, aggregated across time by fleet.
Labels 'retained' and 'discard' indicate discarded or retained sampled for each fleet. Panels without this designation represent the whole catch.
file: comp_lenfit__aggregated_across_time.png
Pearson residuals, comparing across fleets (plot 1 of 4)
Closed bubbles are positive residuals (observed > expected) and open bubbles are negative residuals (observed < expected).
file: comp_lenfit__page1_multi-fleet_comparison.png
Pearson residuals, comparing across fleets (plot 2 of 4)
file: comp_lenfit__page2_multi-fleet_comparison.png
Pearson residuals, comparing across fleets (plot 3 of 4)
file: comp_lenfit__page3_multi-fleet_comparison.png
Pearson residuals, comparing across fleets (plot 4 of 4)
file: comp_lenfit__page4_multi-fleet_comparison.png
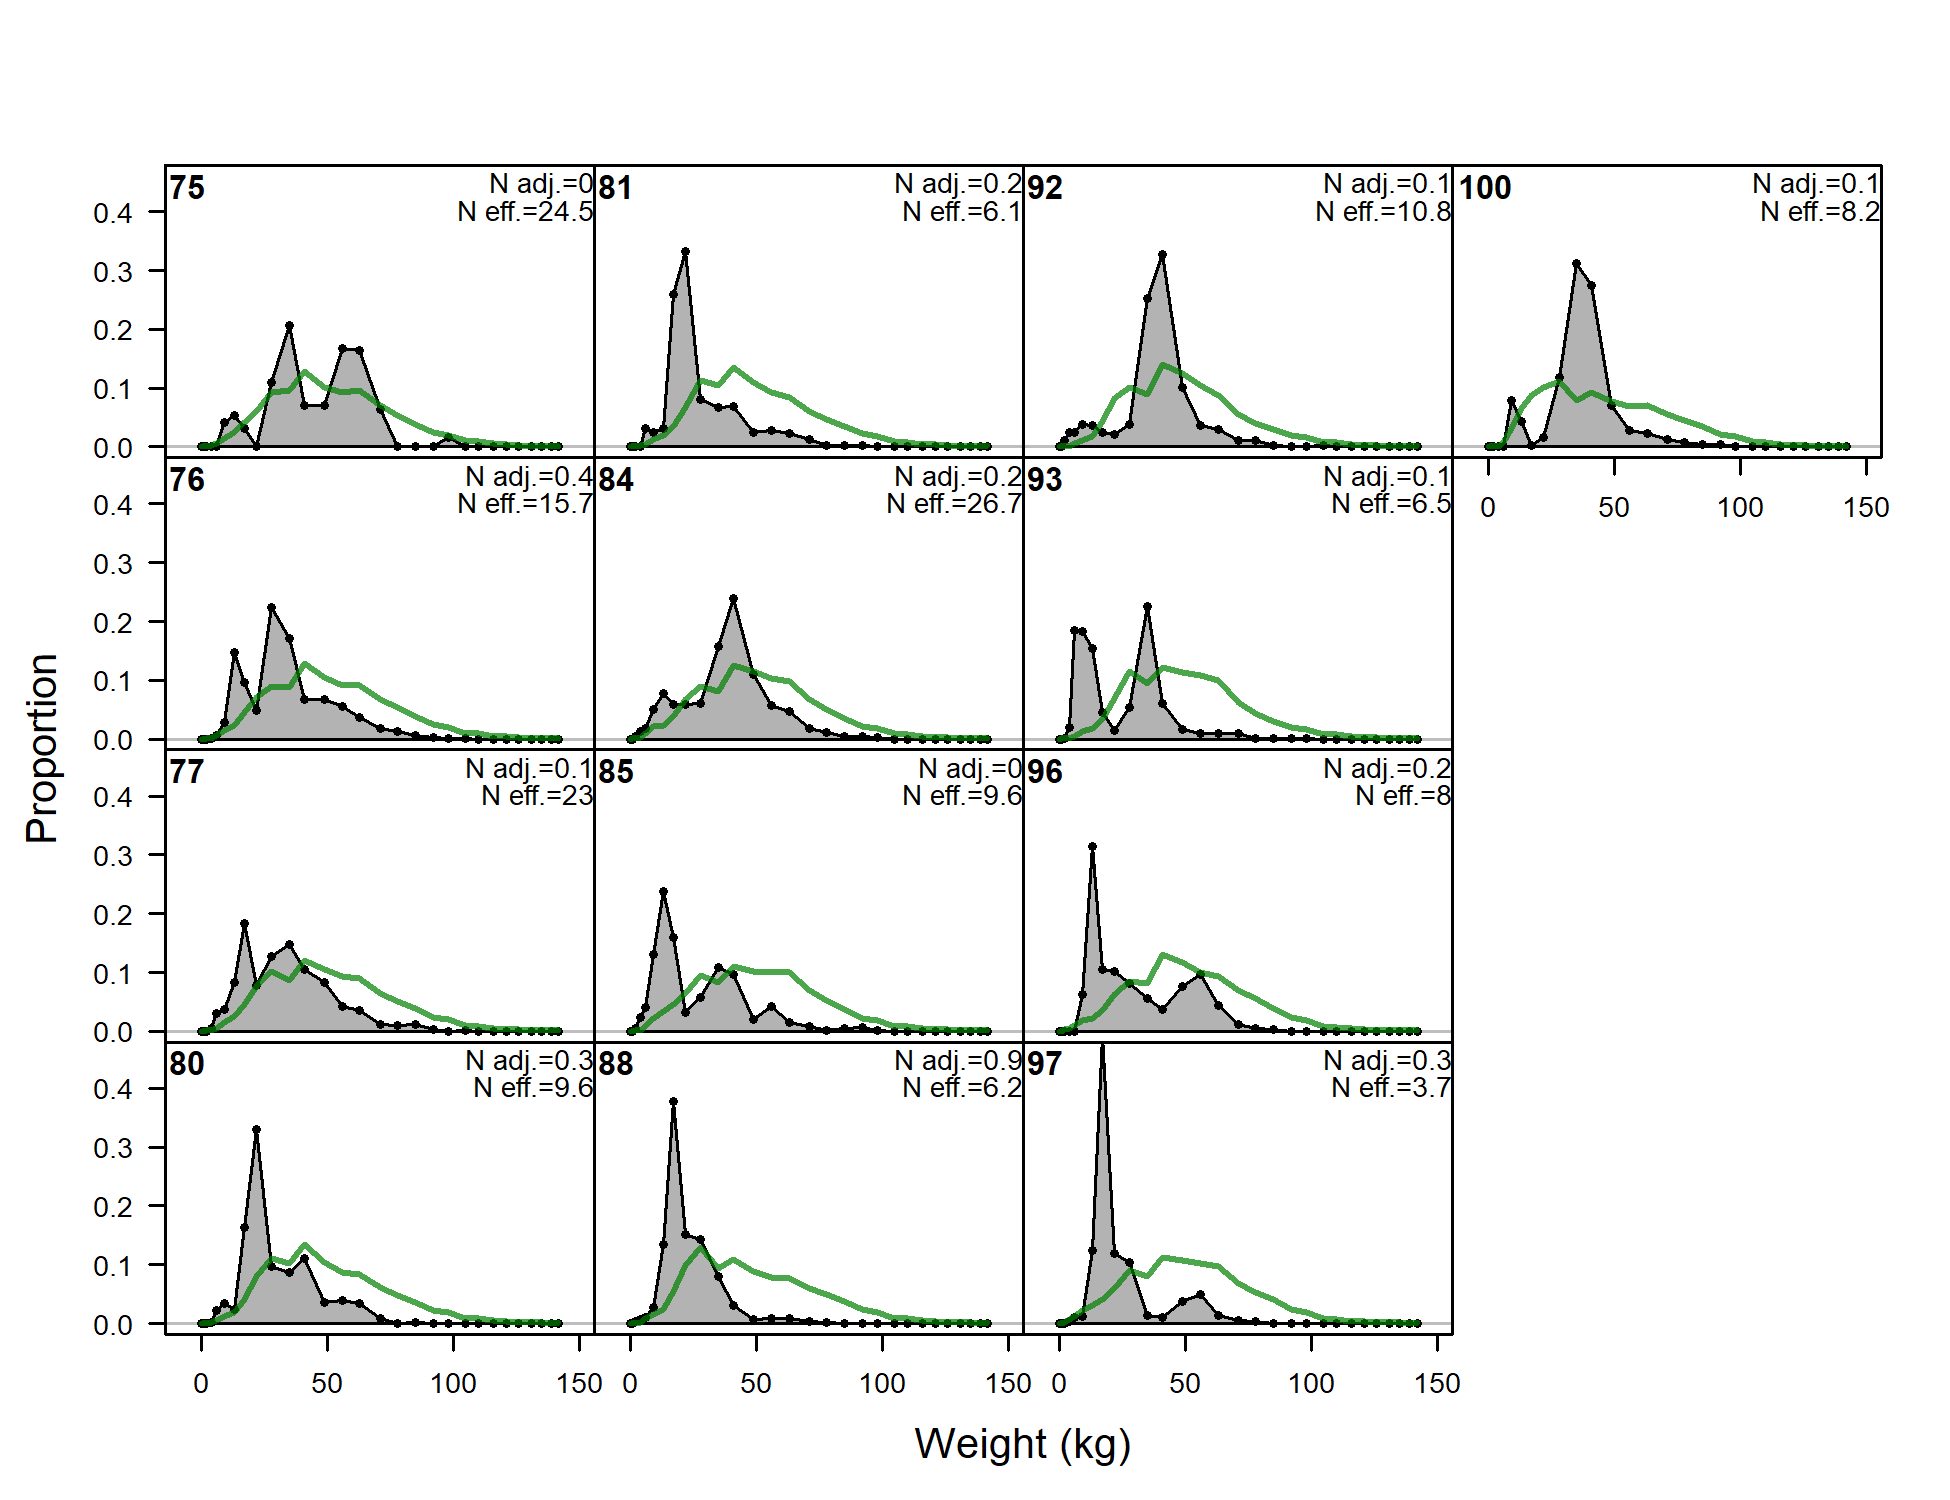
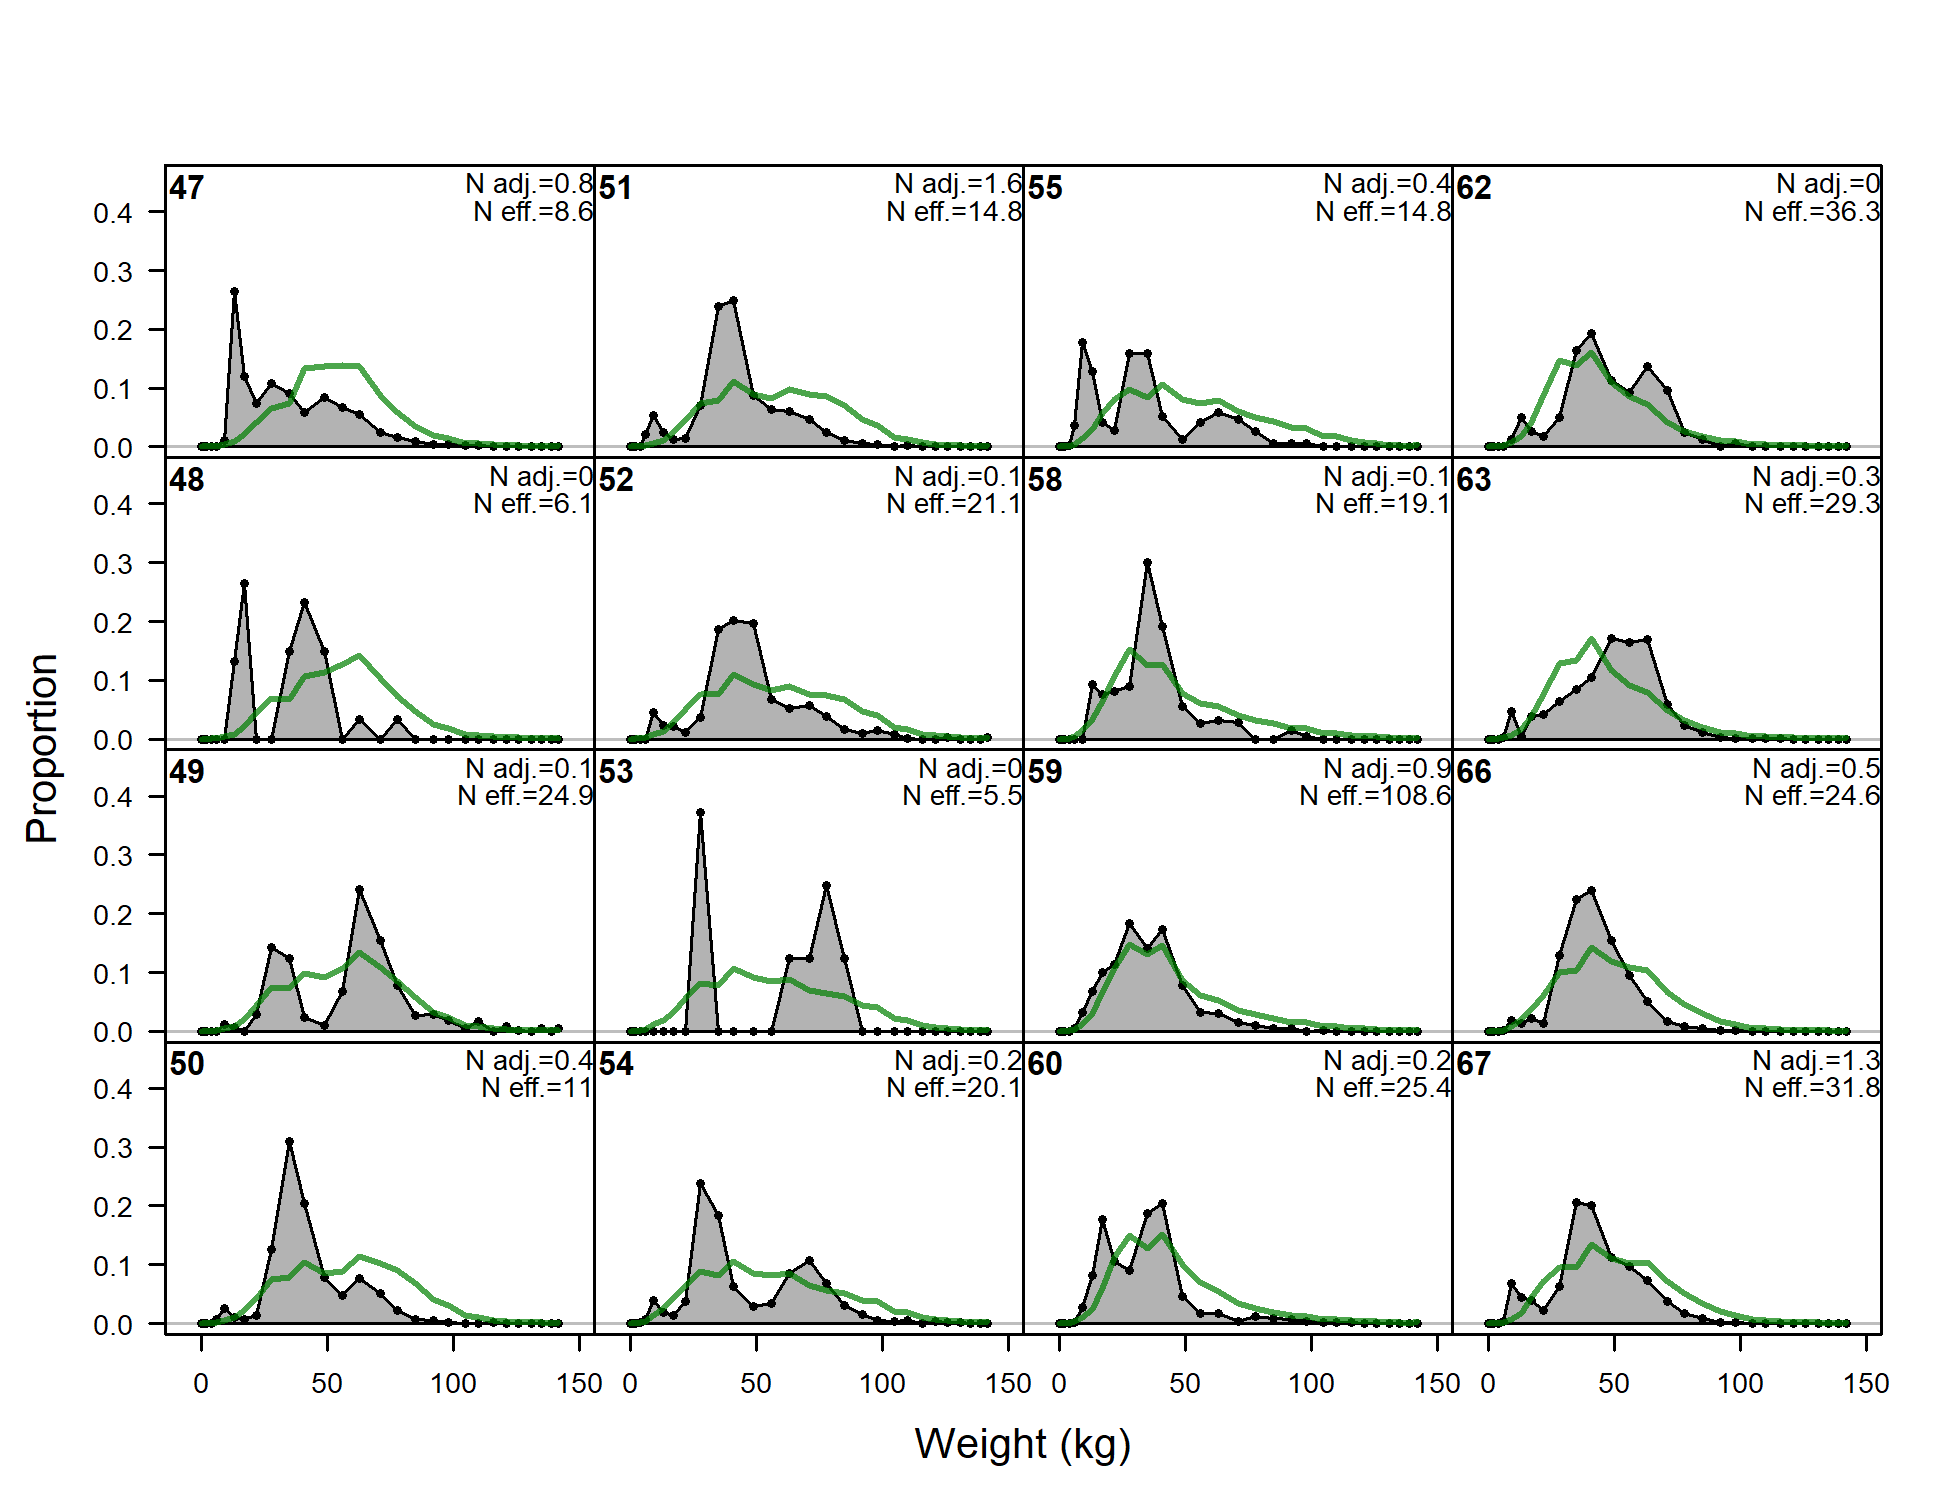
Size comps, whole catch, S5-LLc_N_w (plot 1 of 3).
'N adj.' is the input sample size after data-weighting adjustment.N eff. is the calculated effective sample size used in the McAllister-Iannelli tuning method.
file: comp_sizefit_flt24mkt0_page1.png
Size comps, whole catch, S5-LLc_N_w (plot 2 of 3)
file: comp_sizefit_flt24mkt0_page2.png
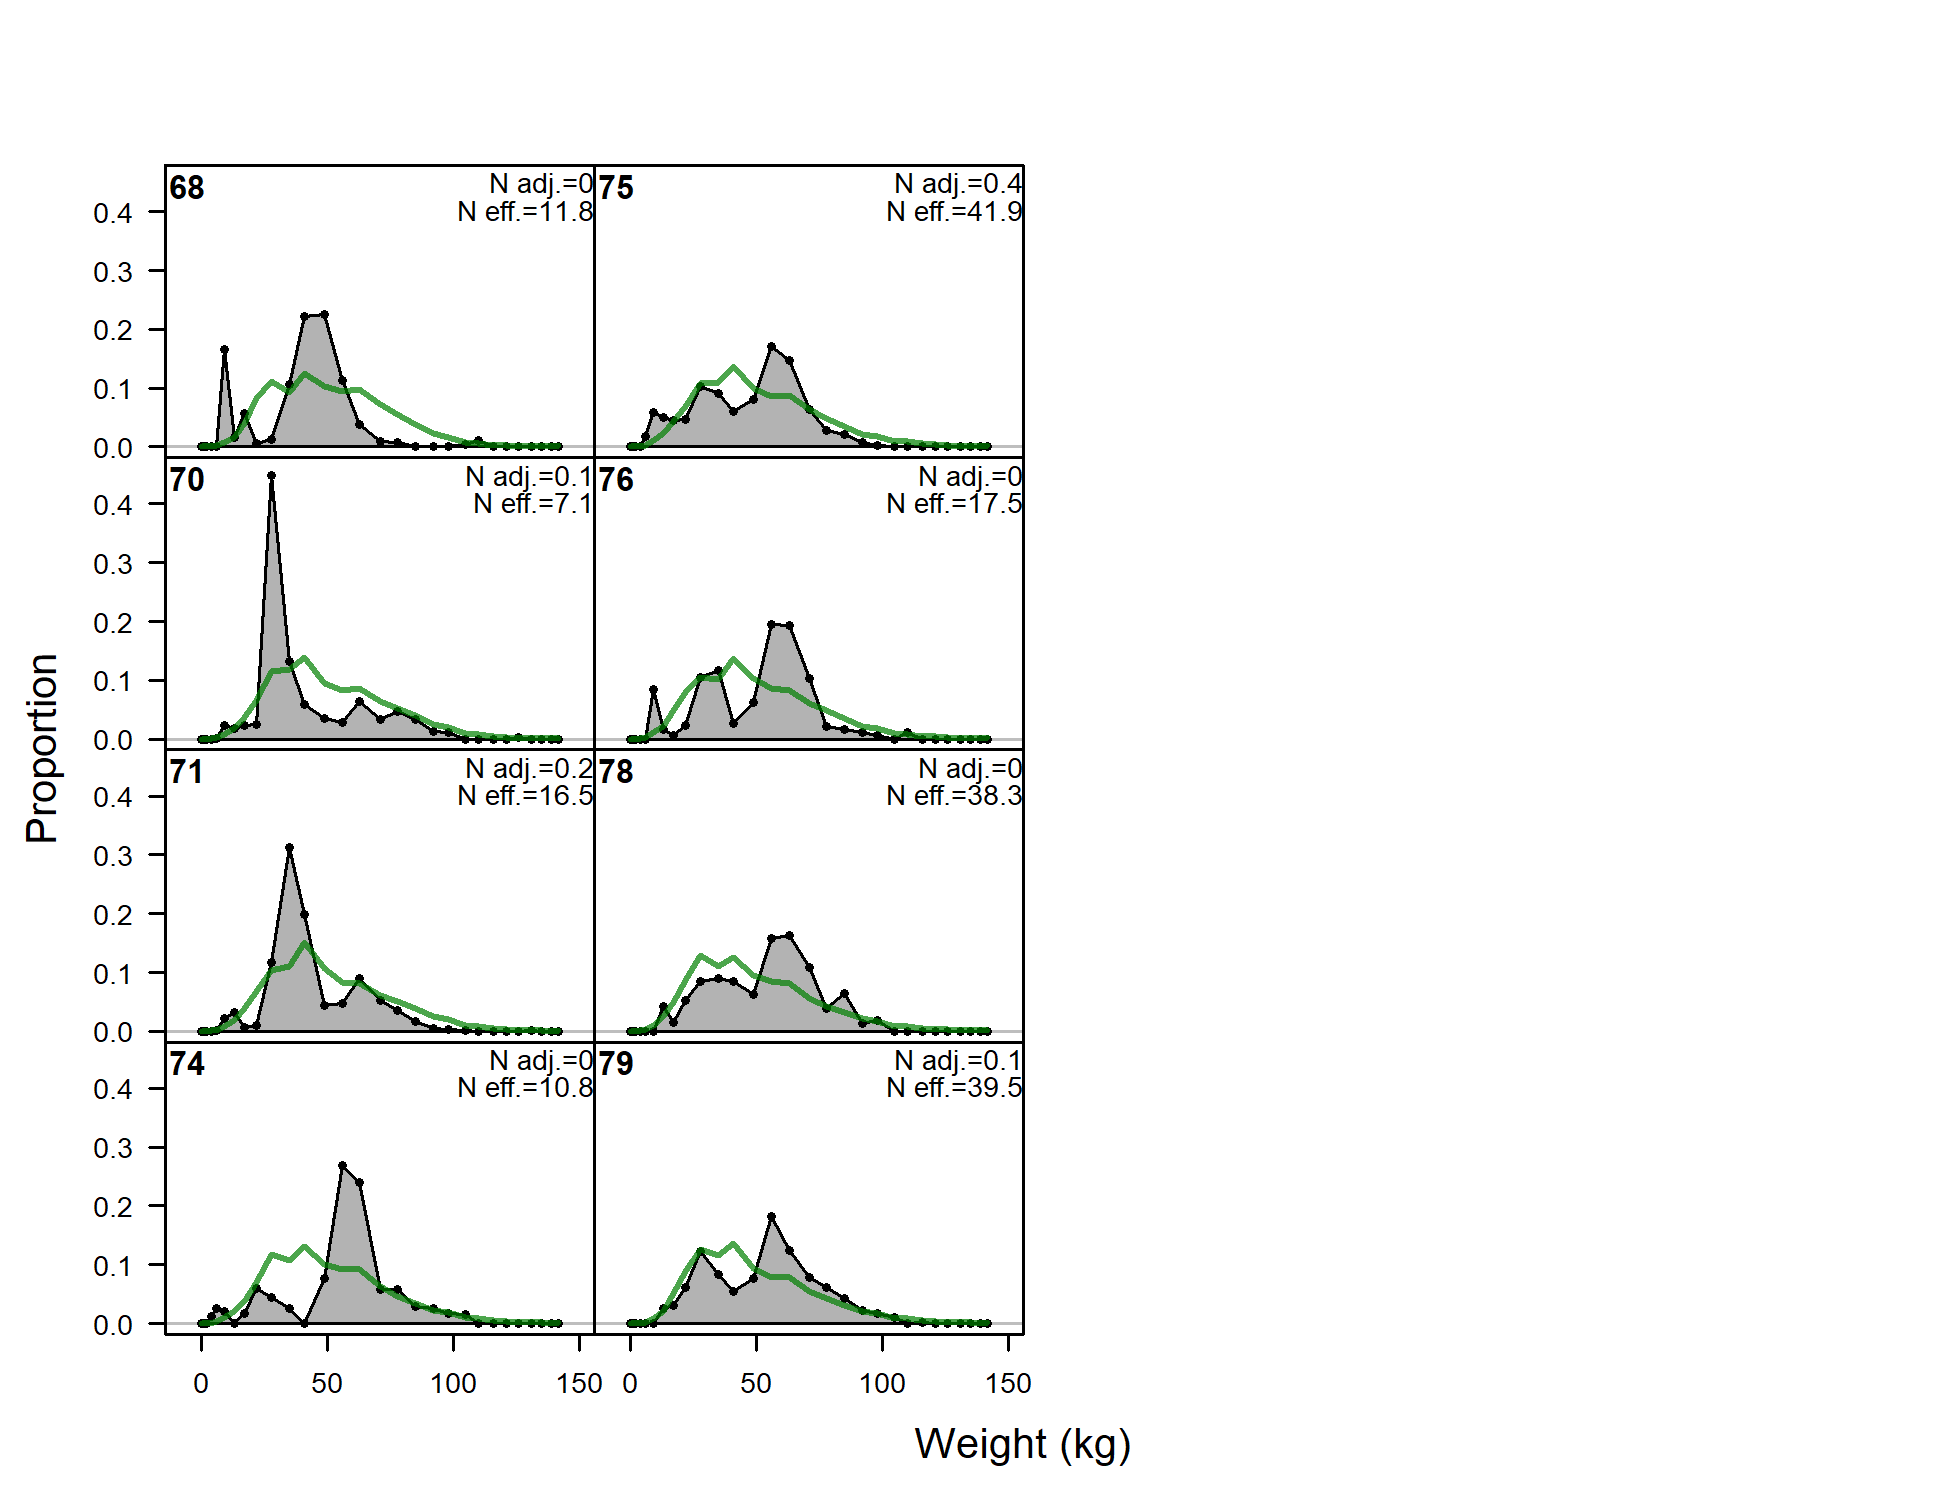
Size comps, whole catch, S5-LLc_N_w (plot 3 of 3)
file: comp_sizefit_flt24mkt0_page3.png
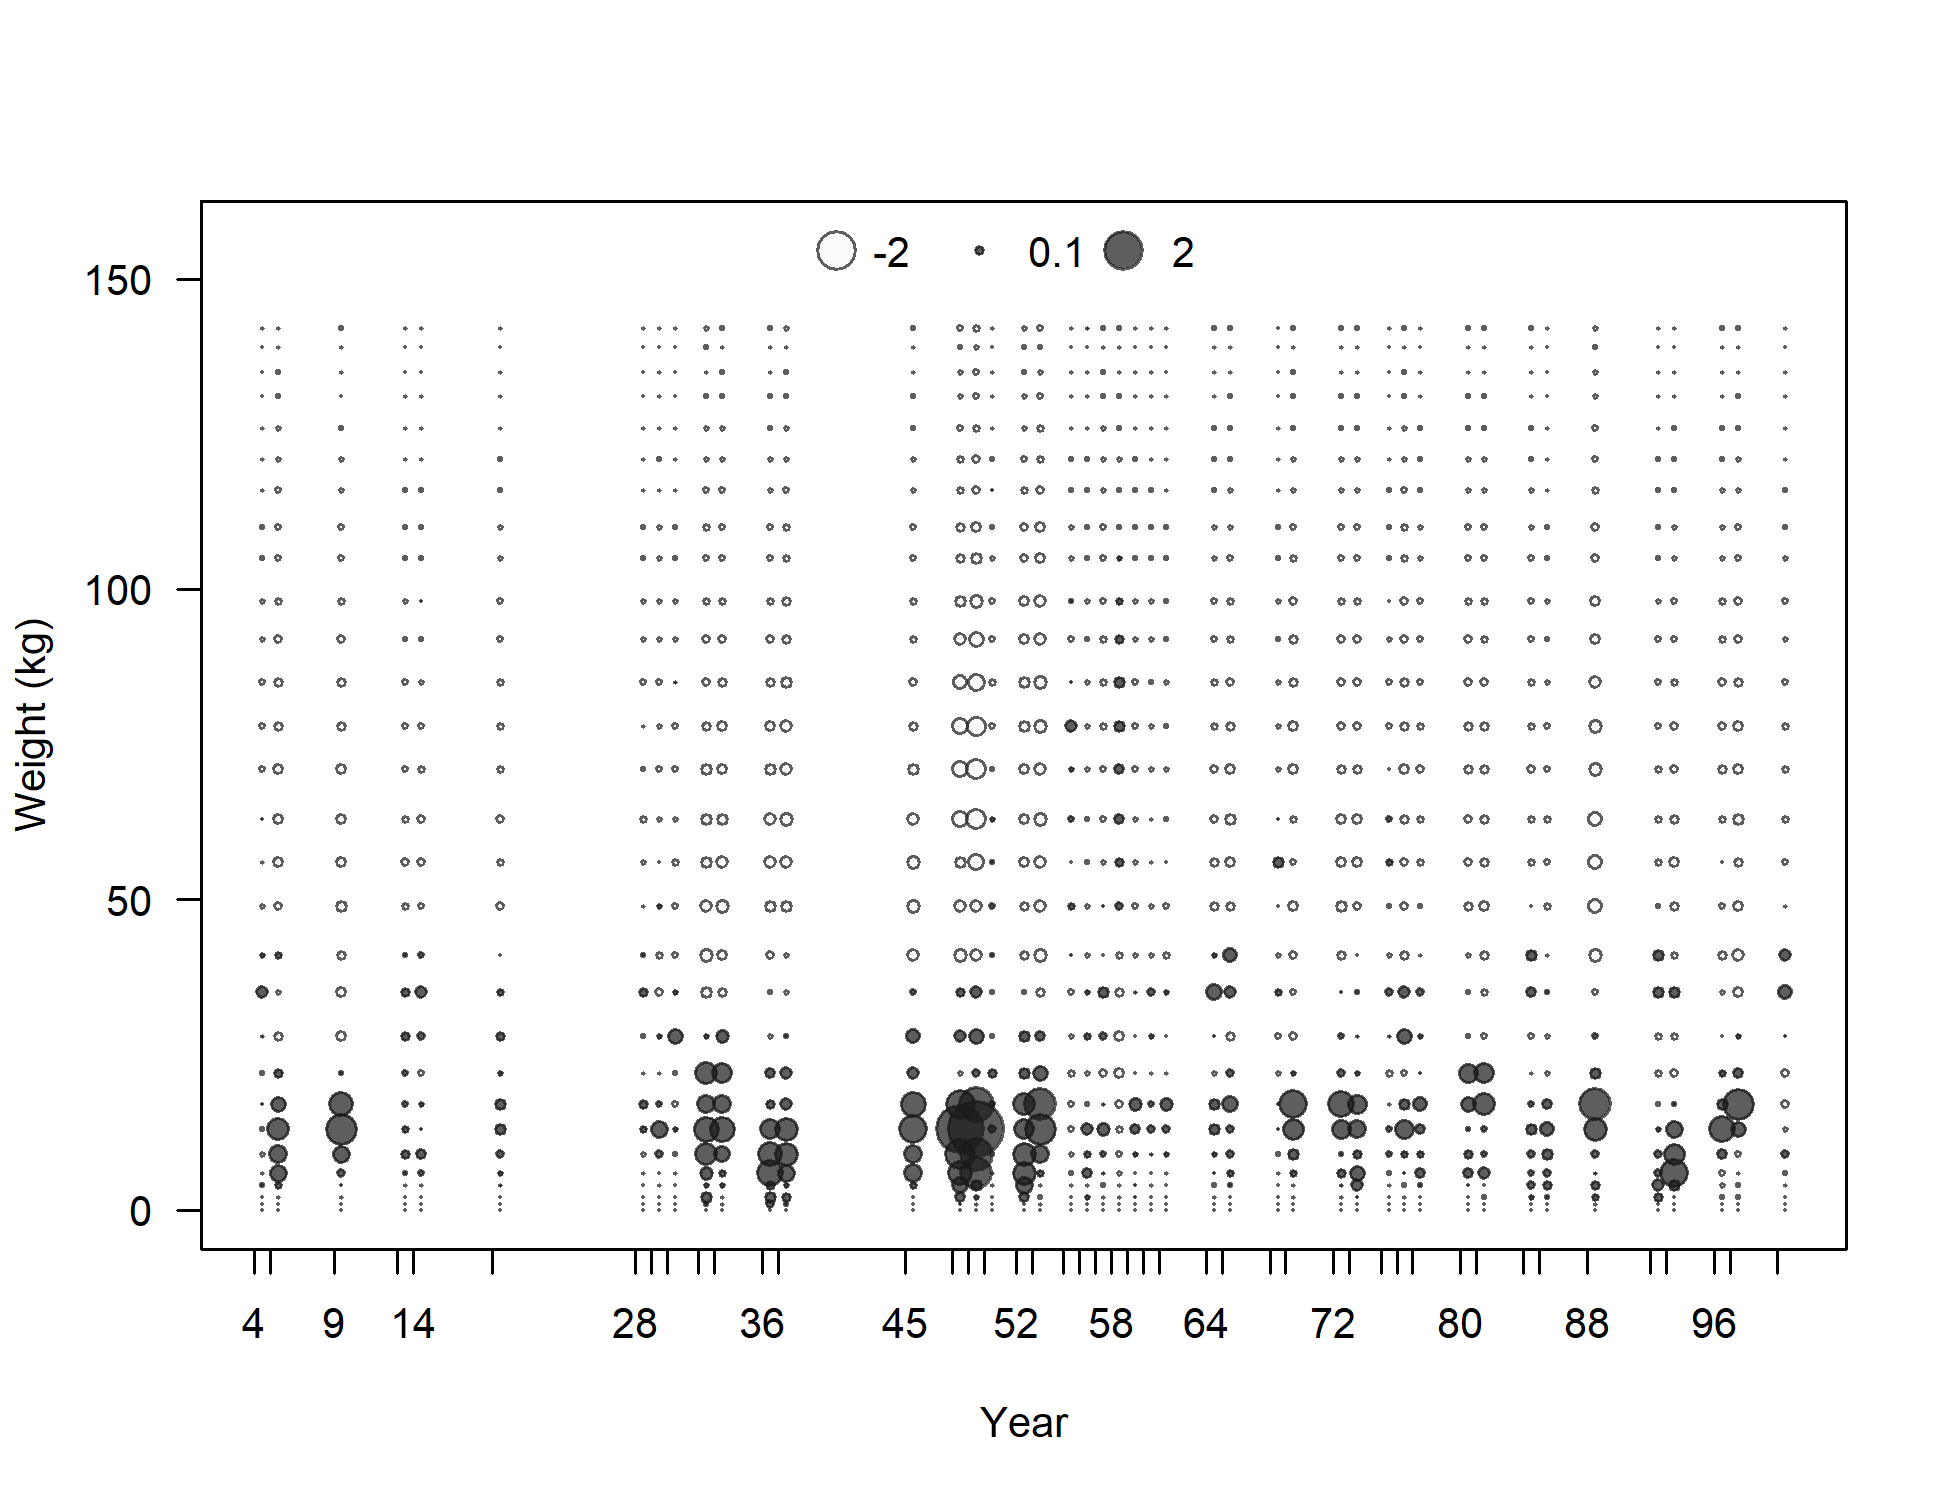
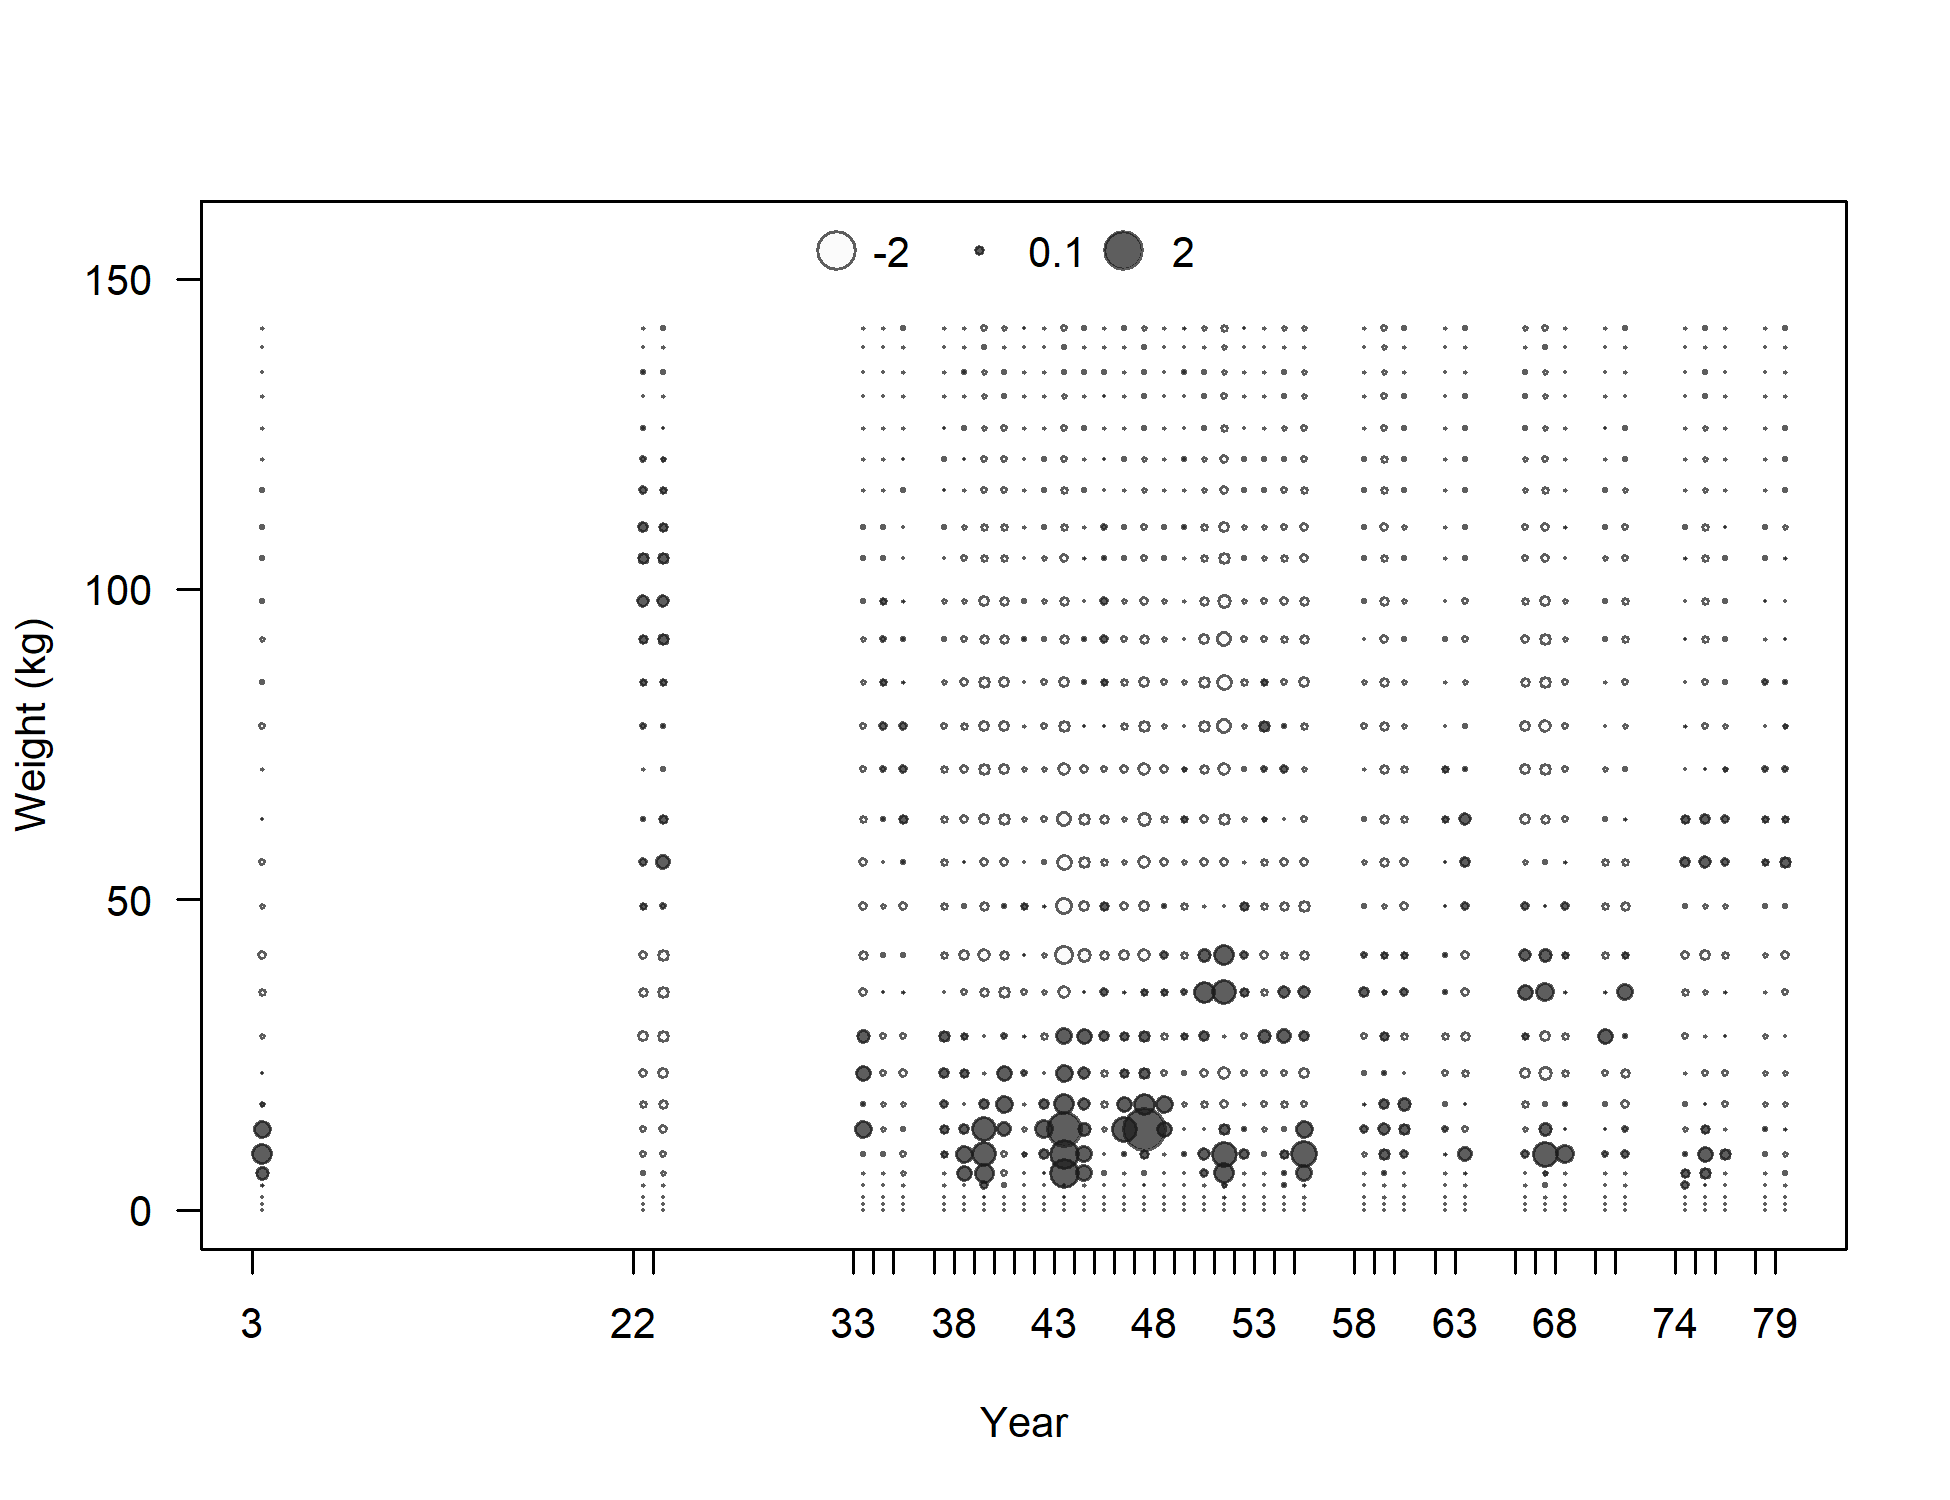
Pearson residuals, whole catch, S5-LLc_N_w (max=4.03) (plot 3 of 3)
Closed bubbles are positive residuals (observed > expected) and open bubbles are negative residuals (observed < expected).
file: comp_sizefit_residsflt24mkt0_page3.png
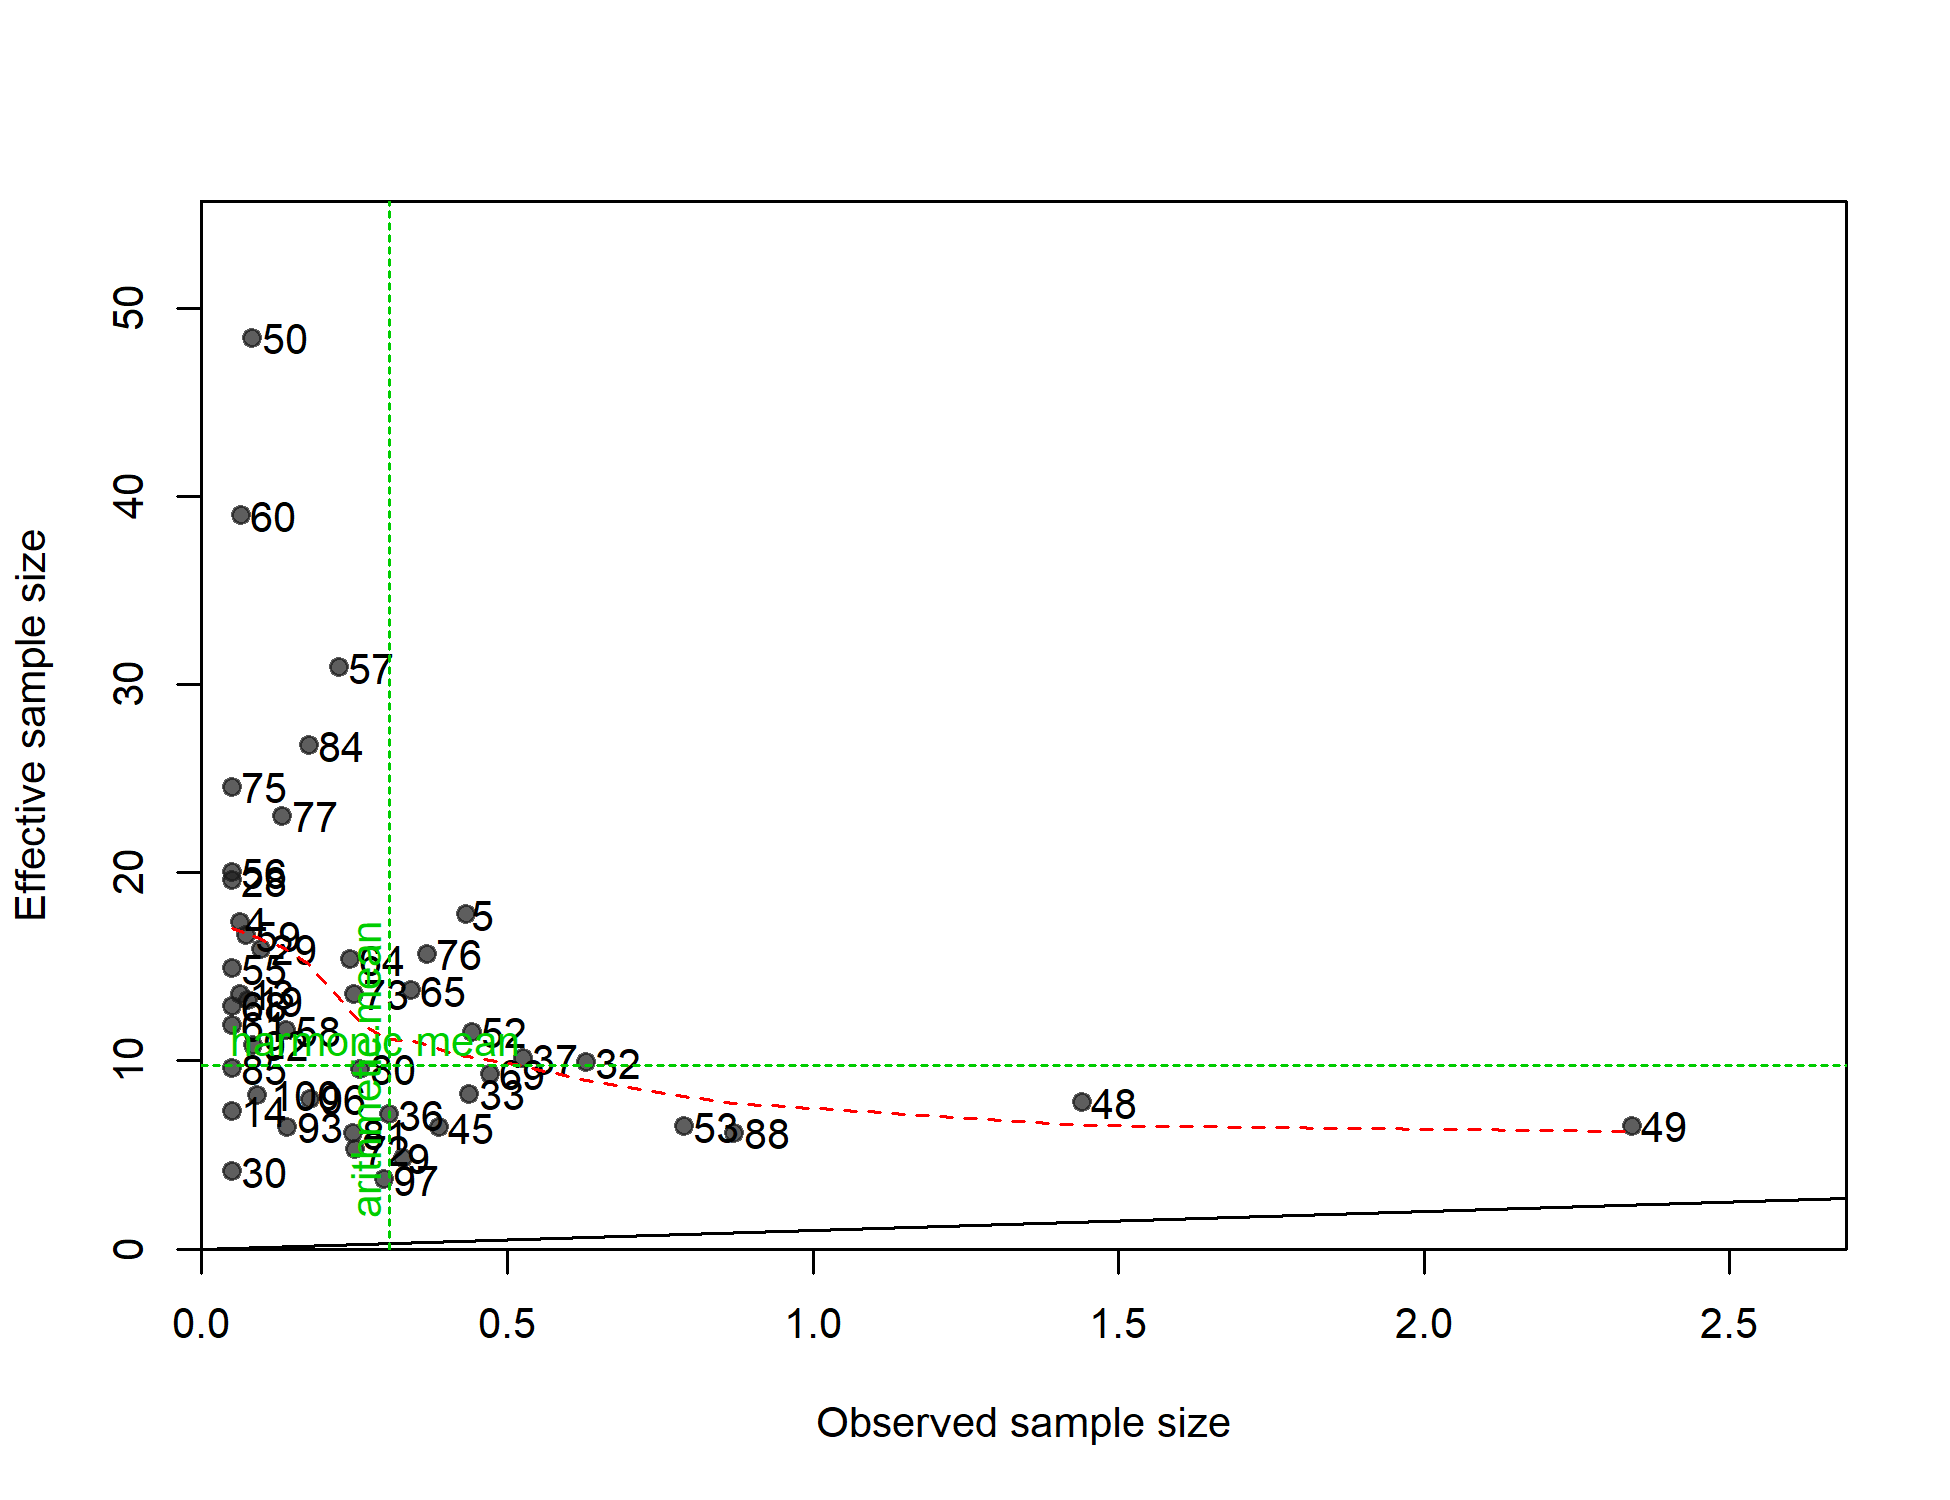
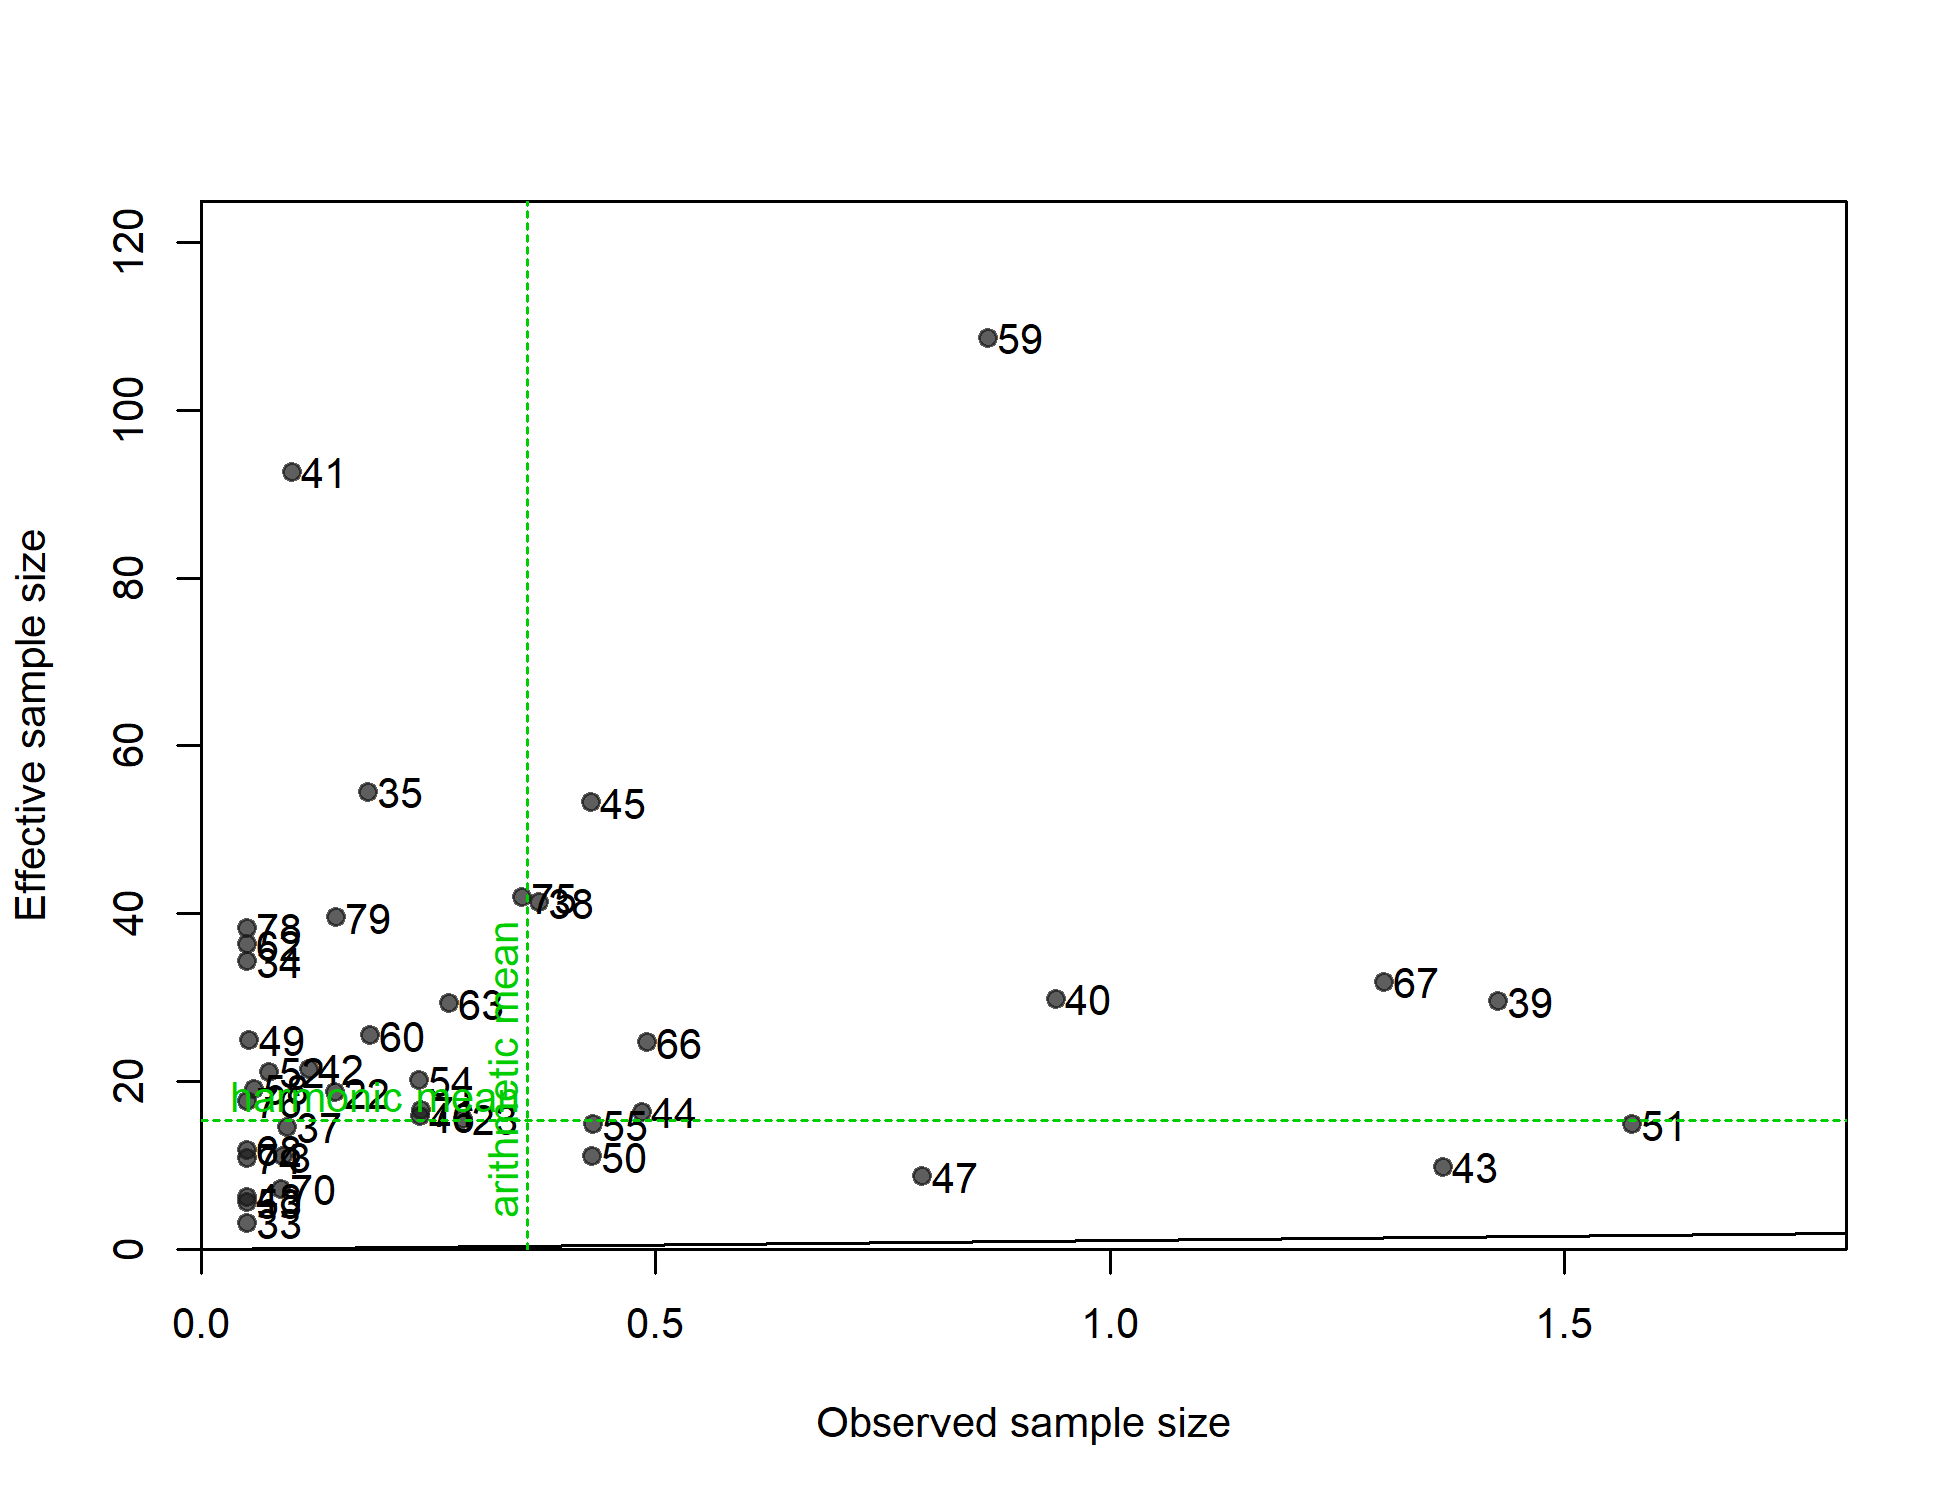
N-EffN comparison, Size comps, whole catch, S5-LLc_N_w
file: comp_sizefit_sampsize_flt24mkt0.png
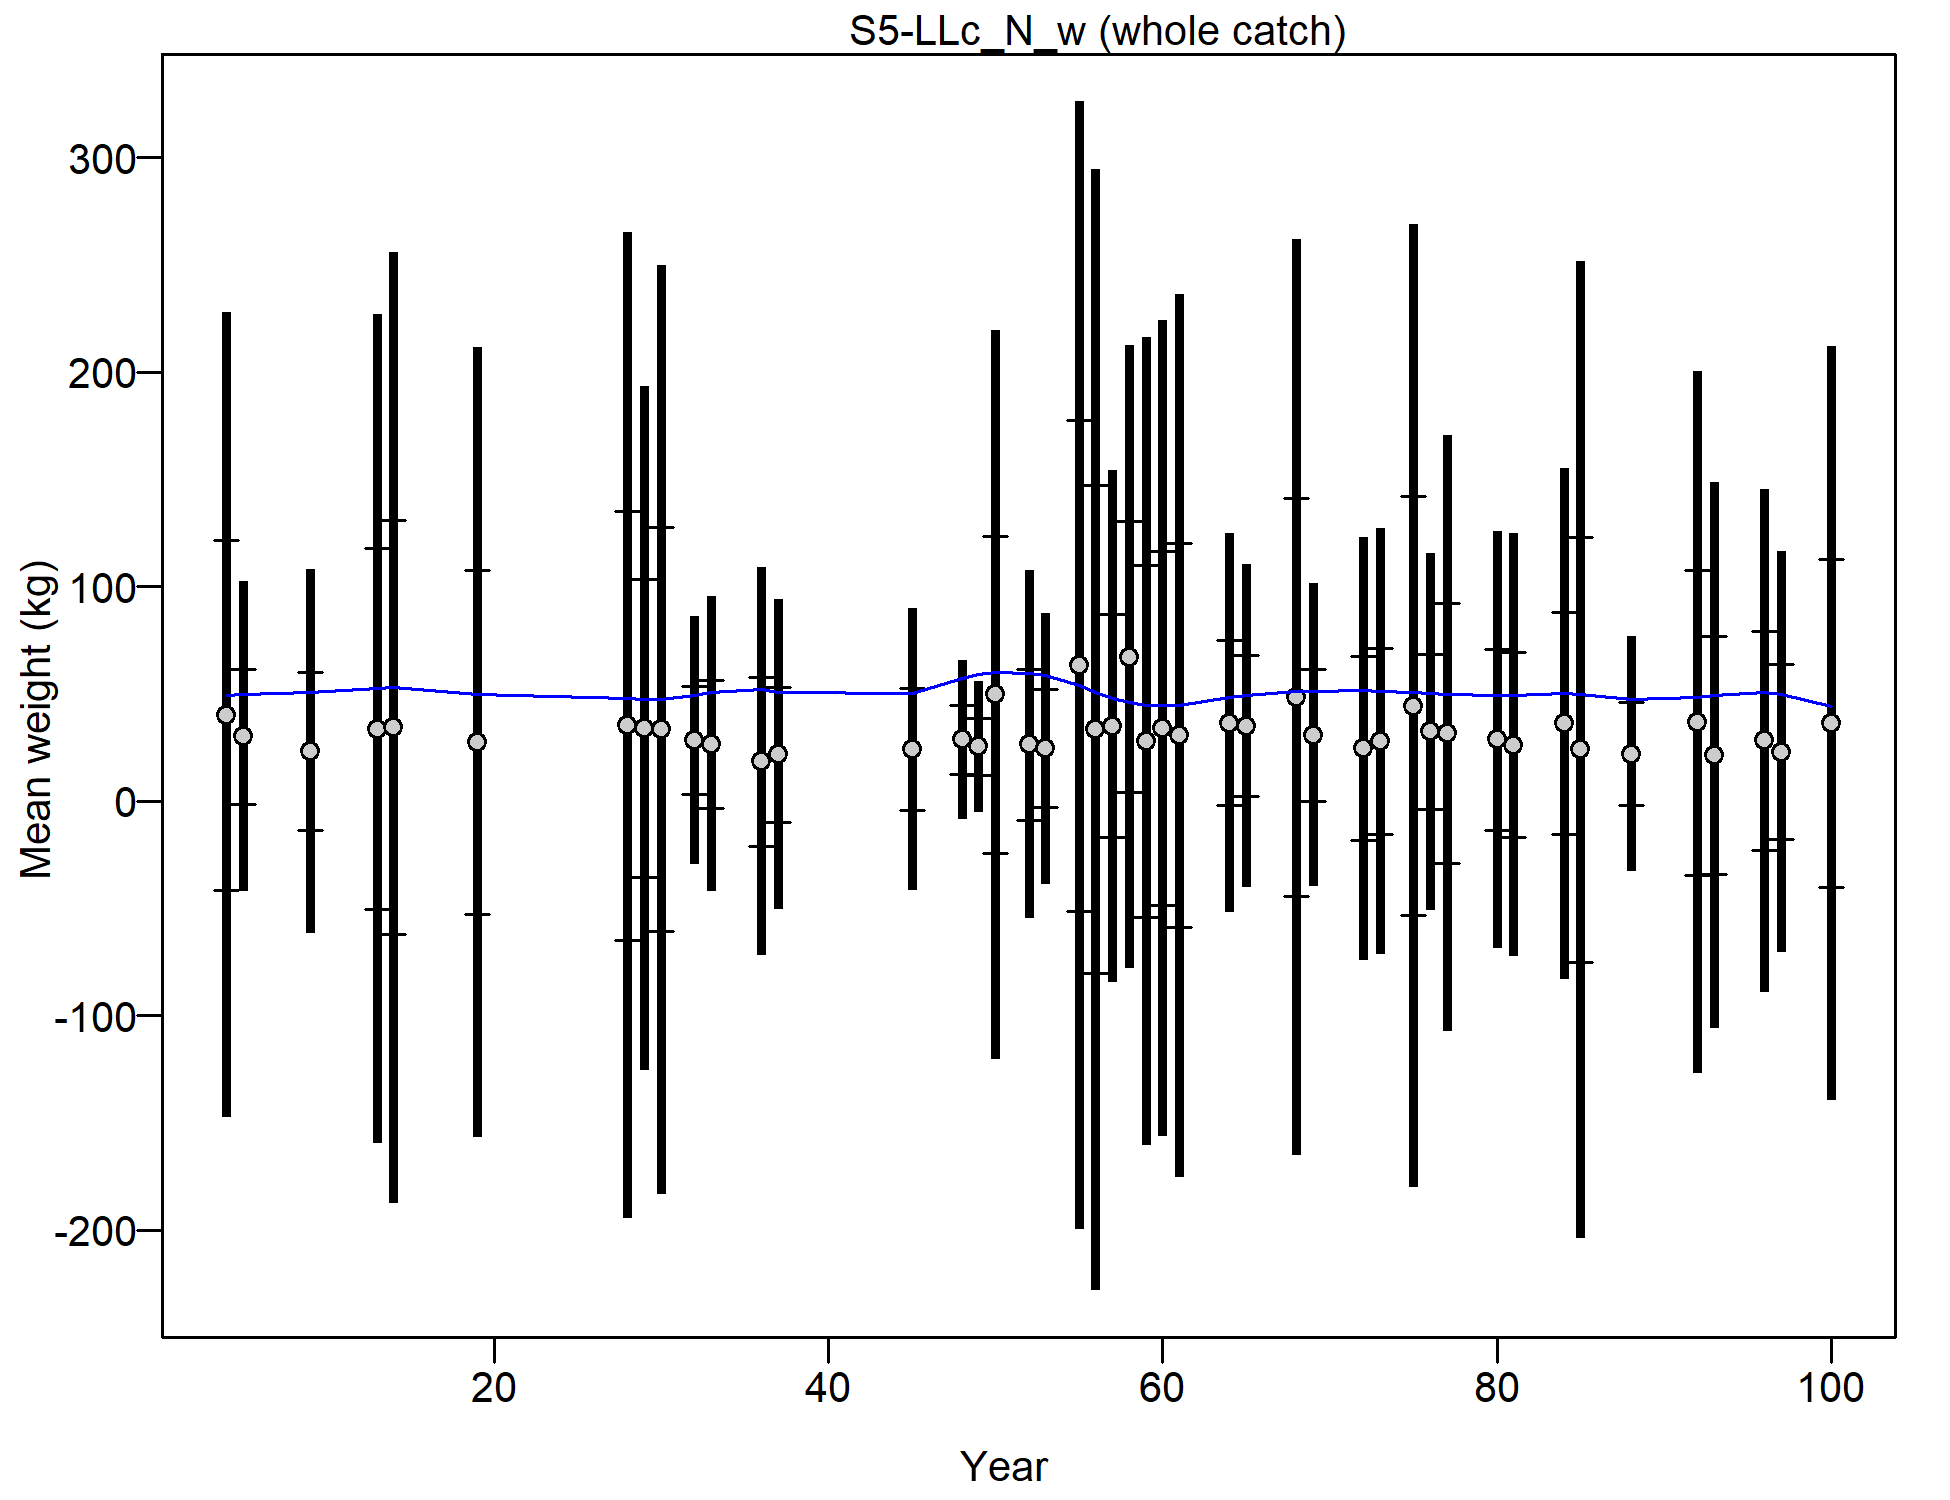
Mean size for S5-LLc_N_w with 95% confidence intervals based on current samples sizes.
Francis data weighting method TA1.8: thinner intervals (with capped ends) show result of further adjusting sample sizes based on suggested multiplier (with 95% interval) for size data from S5-LLc_N_w:
5.2874 (2.8428-14.0528)
For more info, see
Francis, R.I.C.C. (2011). Data weighting in statistical fisheries stock assessment models. Can. J. Fish. Aquat. Sci. 68: 1124-1138. https://doi.org/10.1139/f2011-025
file: comp_sizefit_data_weighting_TA1.8_S5-LLc_N_w.png
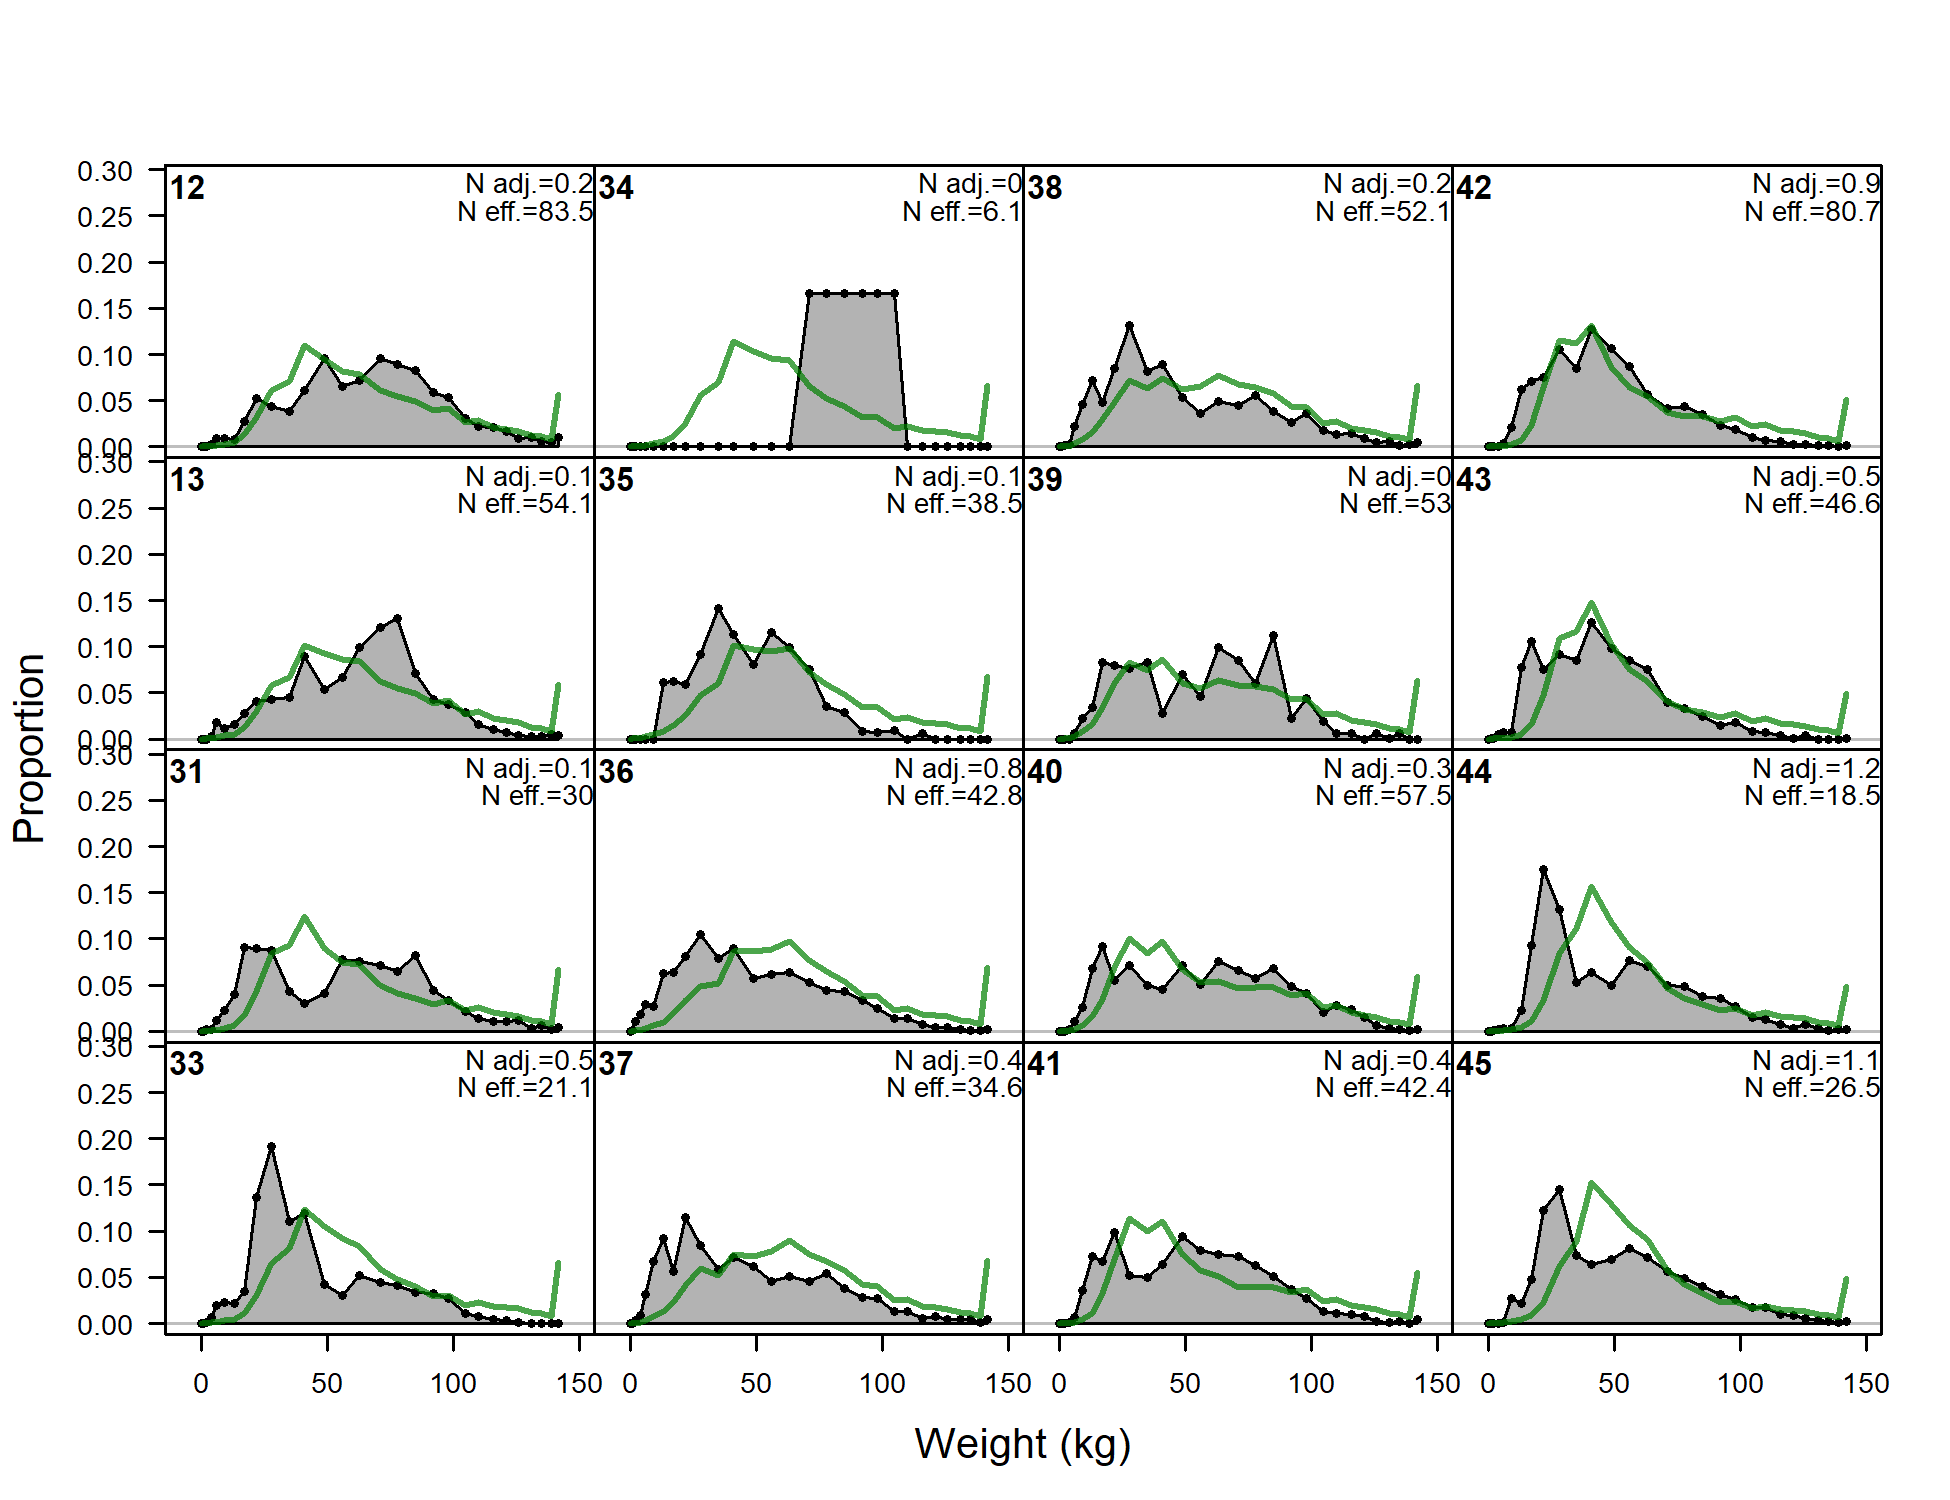
Size comps, whole catch, S6-LLc_C_w (plot 1 of 4).
'N adj.' is the input sample size after data-weighting adjustment.N eff. is the calculated effective sample size used in the McAllister-Iannelli tuning method.
file: comp_sizefit_flt25mkt0_page1.png
Size comps, whole catch, S6-LLc_C_w (plot 2 of 4)
file: comp_sizefit_flt25mkt0_page2.png
Size comps, whole catch, S6-LLc_C_w (plot 3 of 4)
file: comp_sizefit_flt25mkt0_page3.png
Size comps, whole catch, S6-LLc_C_w (plot 4 of 4)
file: comp_sizefit_flt25mkt0_page4.png
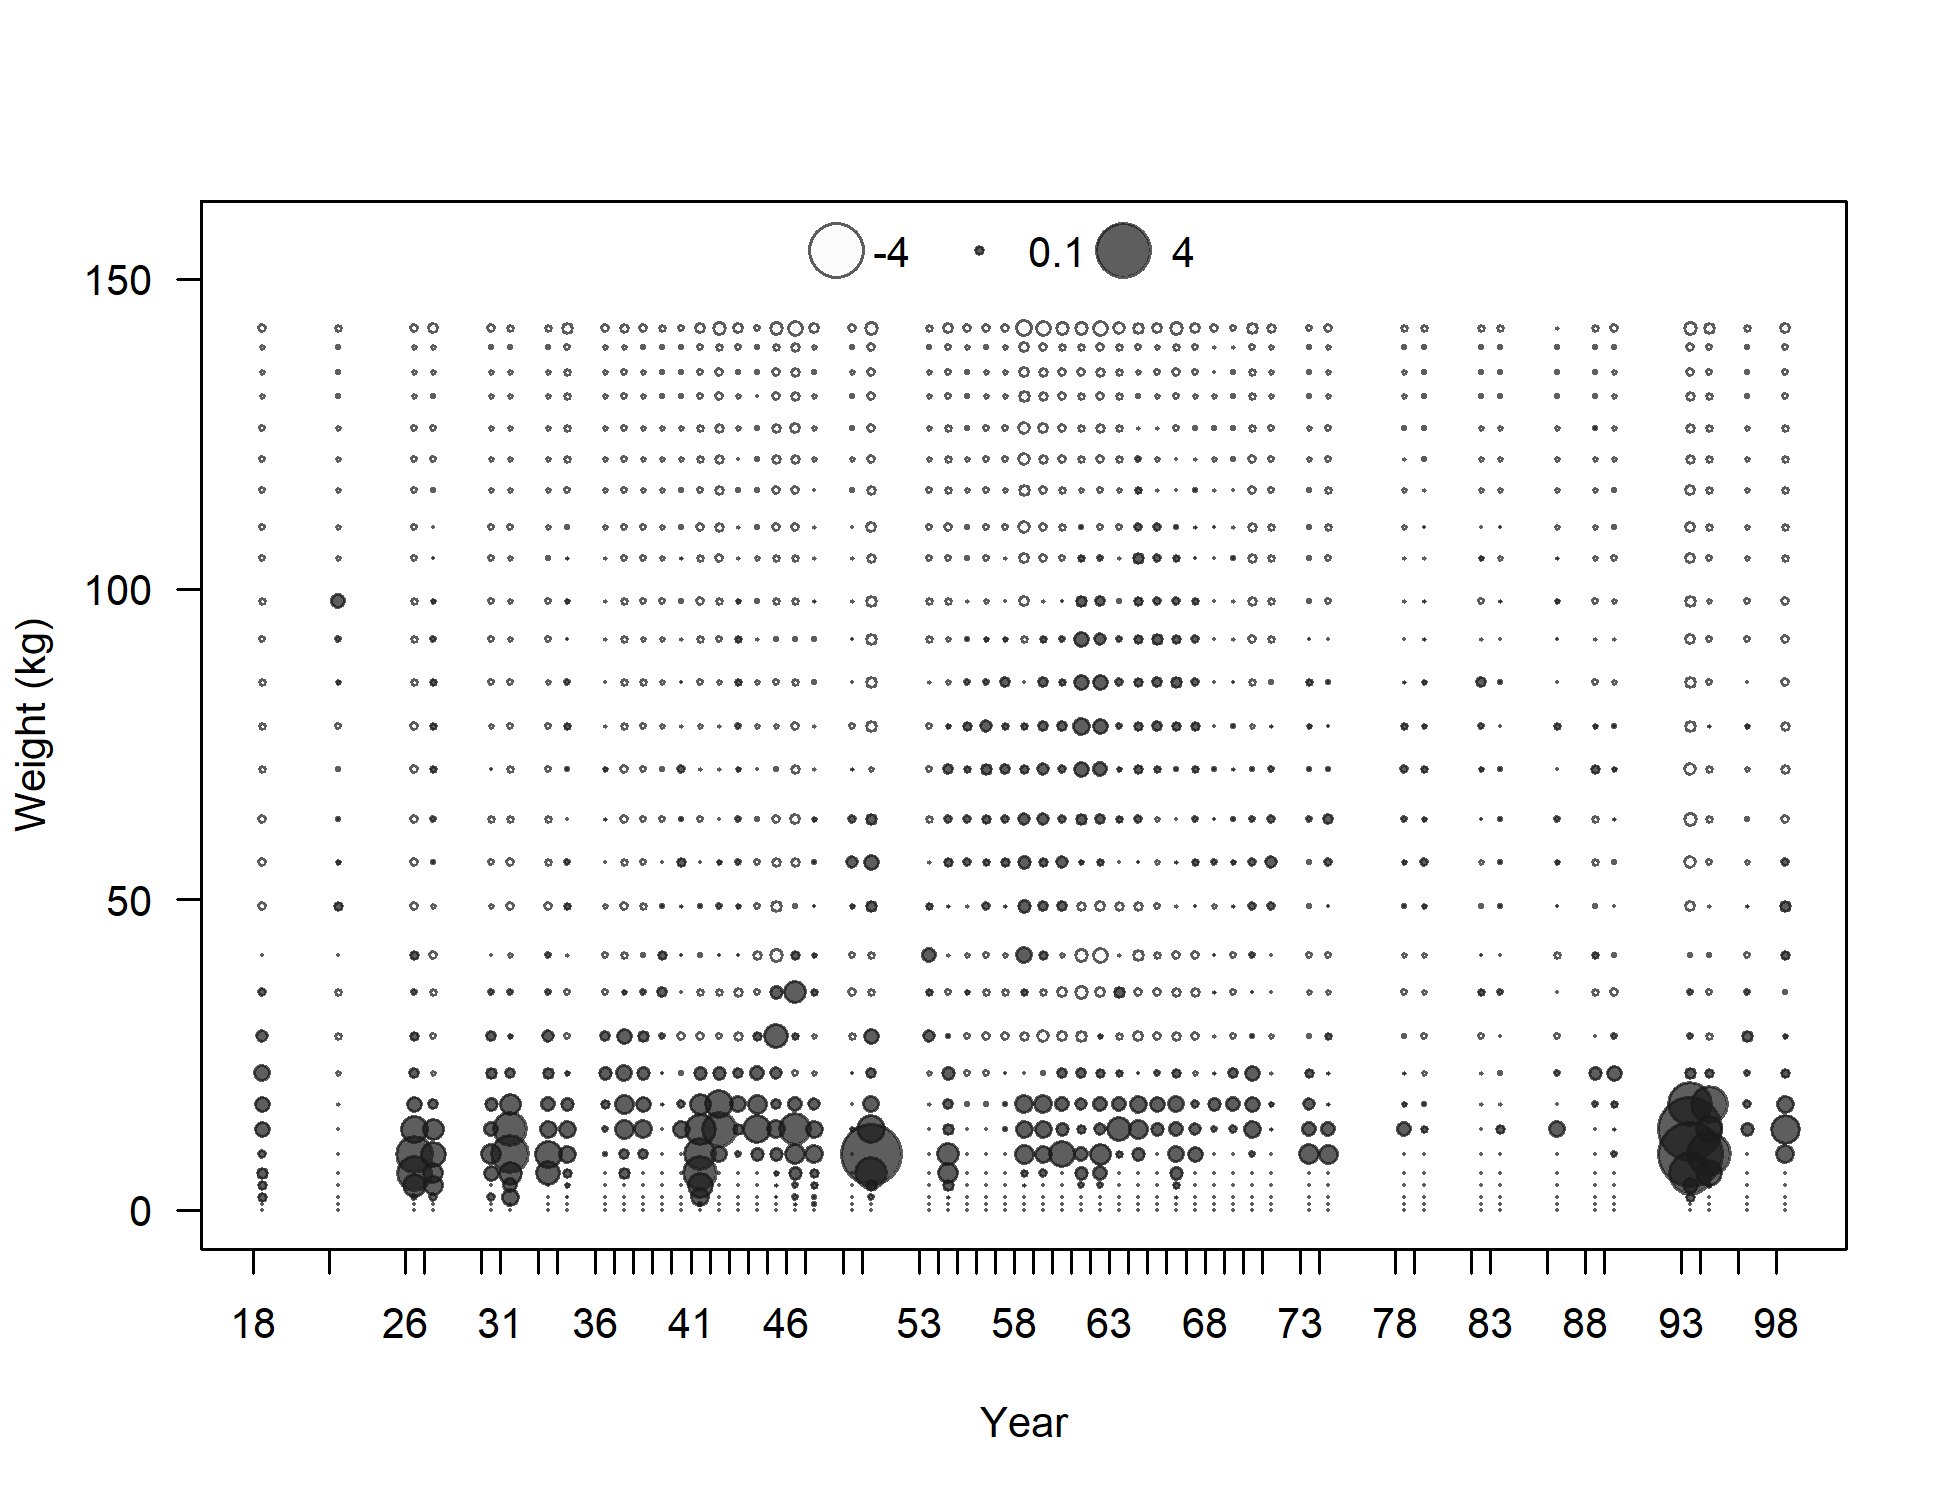
Pearson residuals, whole catch, S6-LLc_C_w (max=5.51) (plot 4 of 4)
Closed bubbles are positive residuals (observed > expected) and open bubbles are negative residuals (observed < expected).
file: comp_sizefit_residsflt25mkt0_page4.png
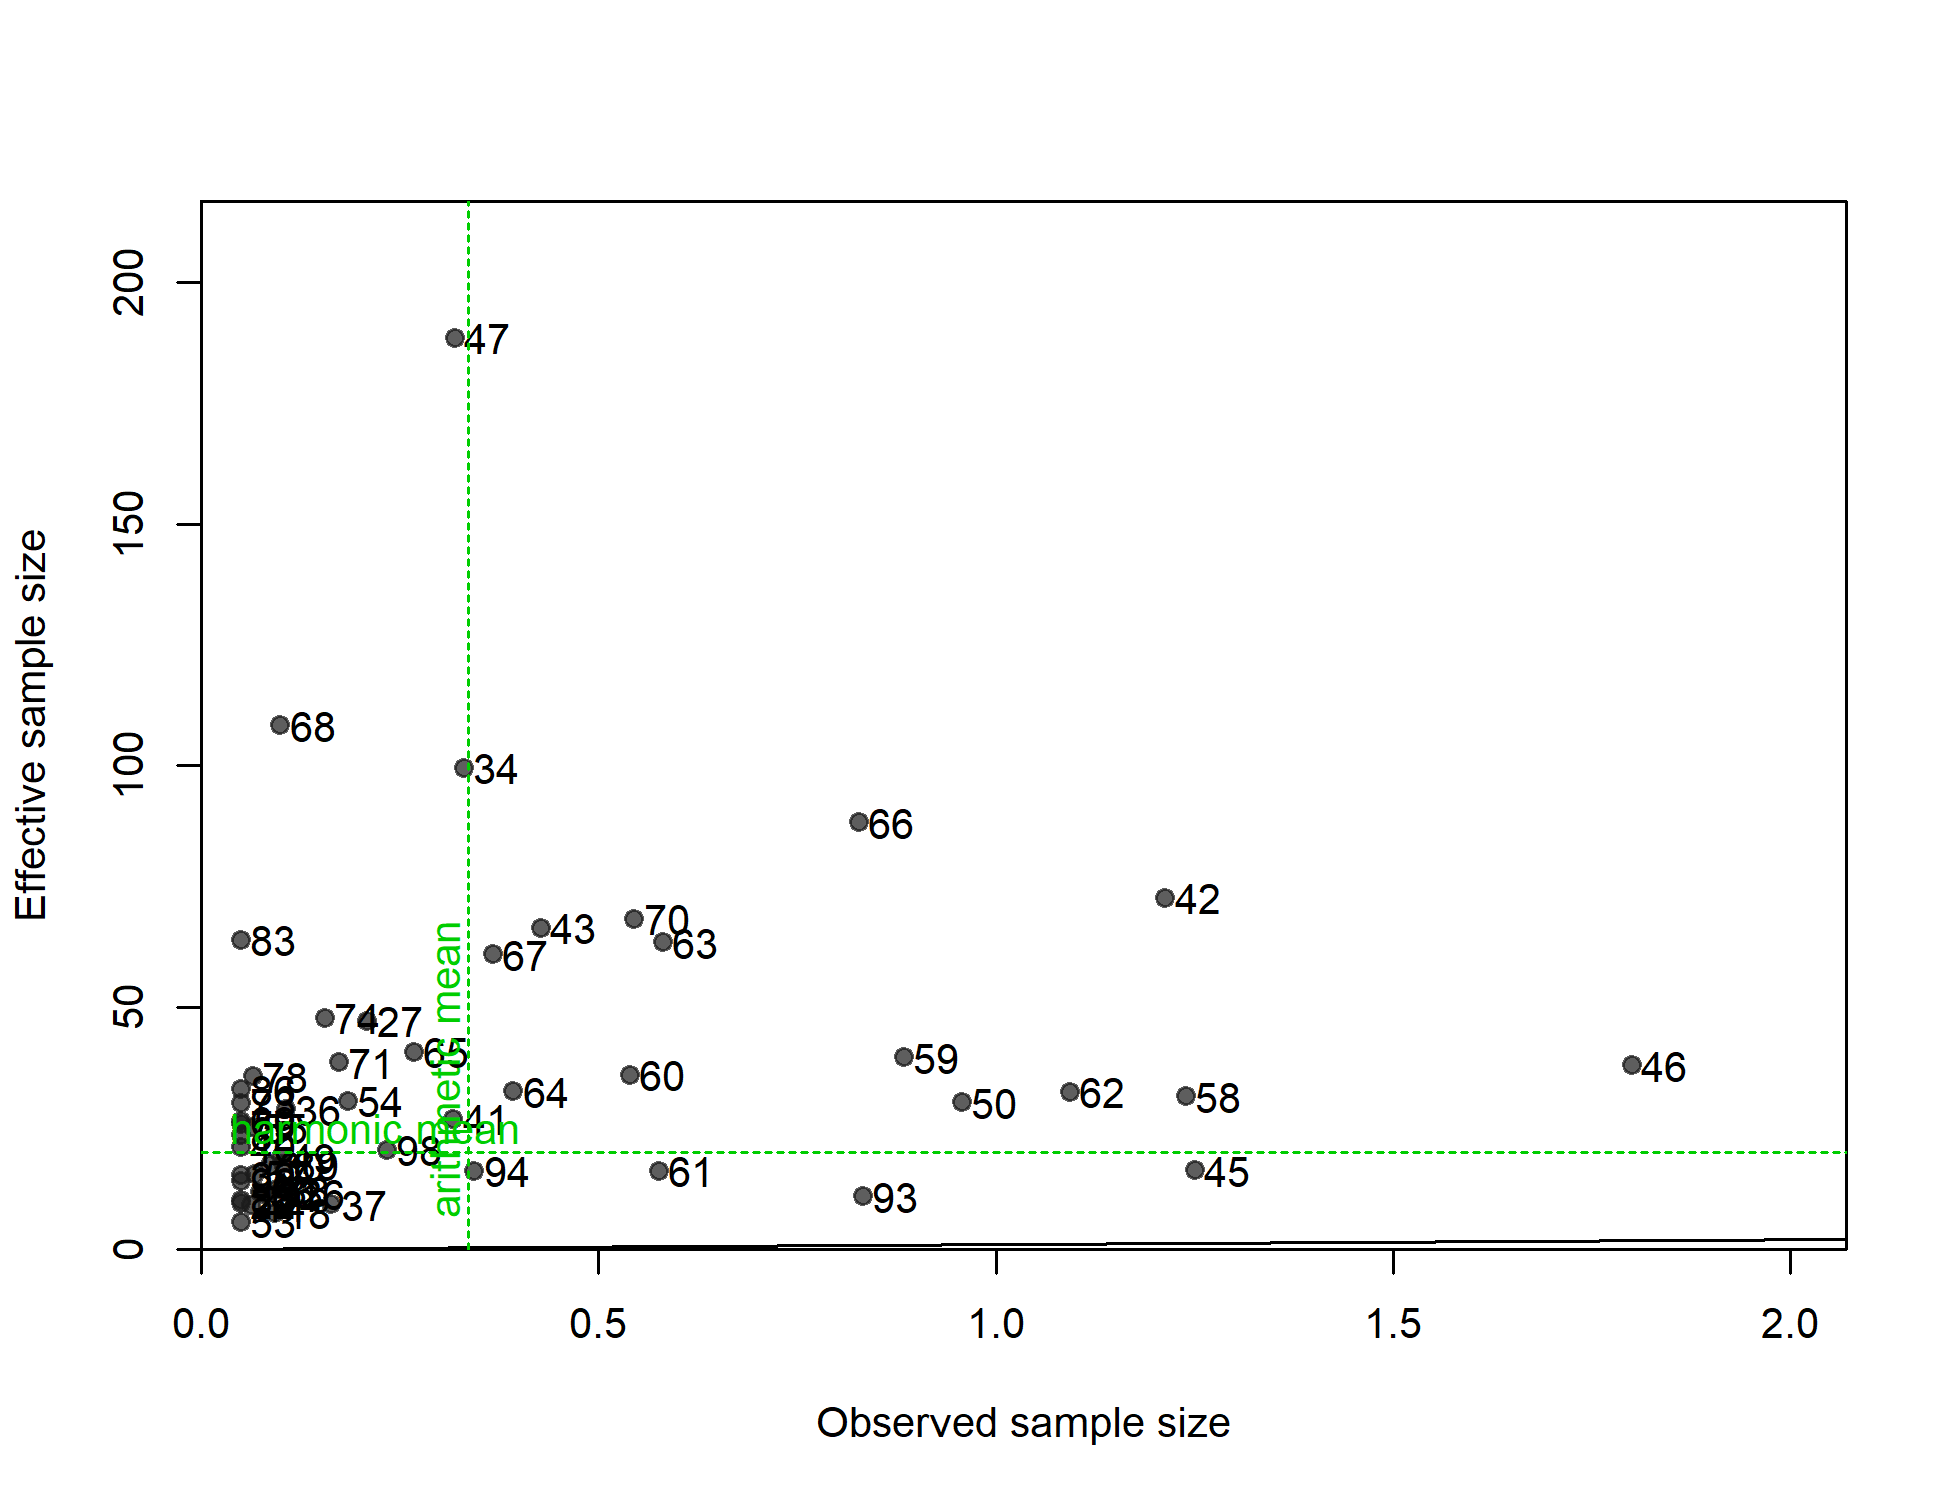
N-EffN comparison, Size comps, whole catch, S6-LLc_C_w
file: comp_sizefit_sampsize_flt25mkt0.png
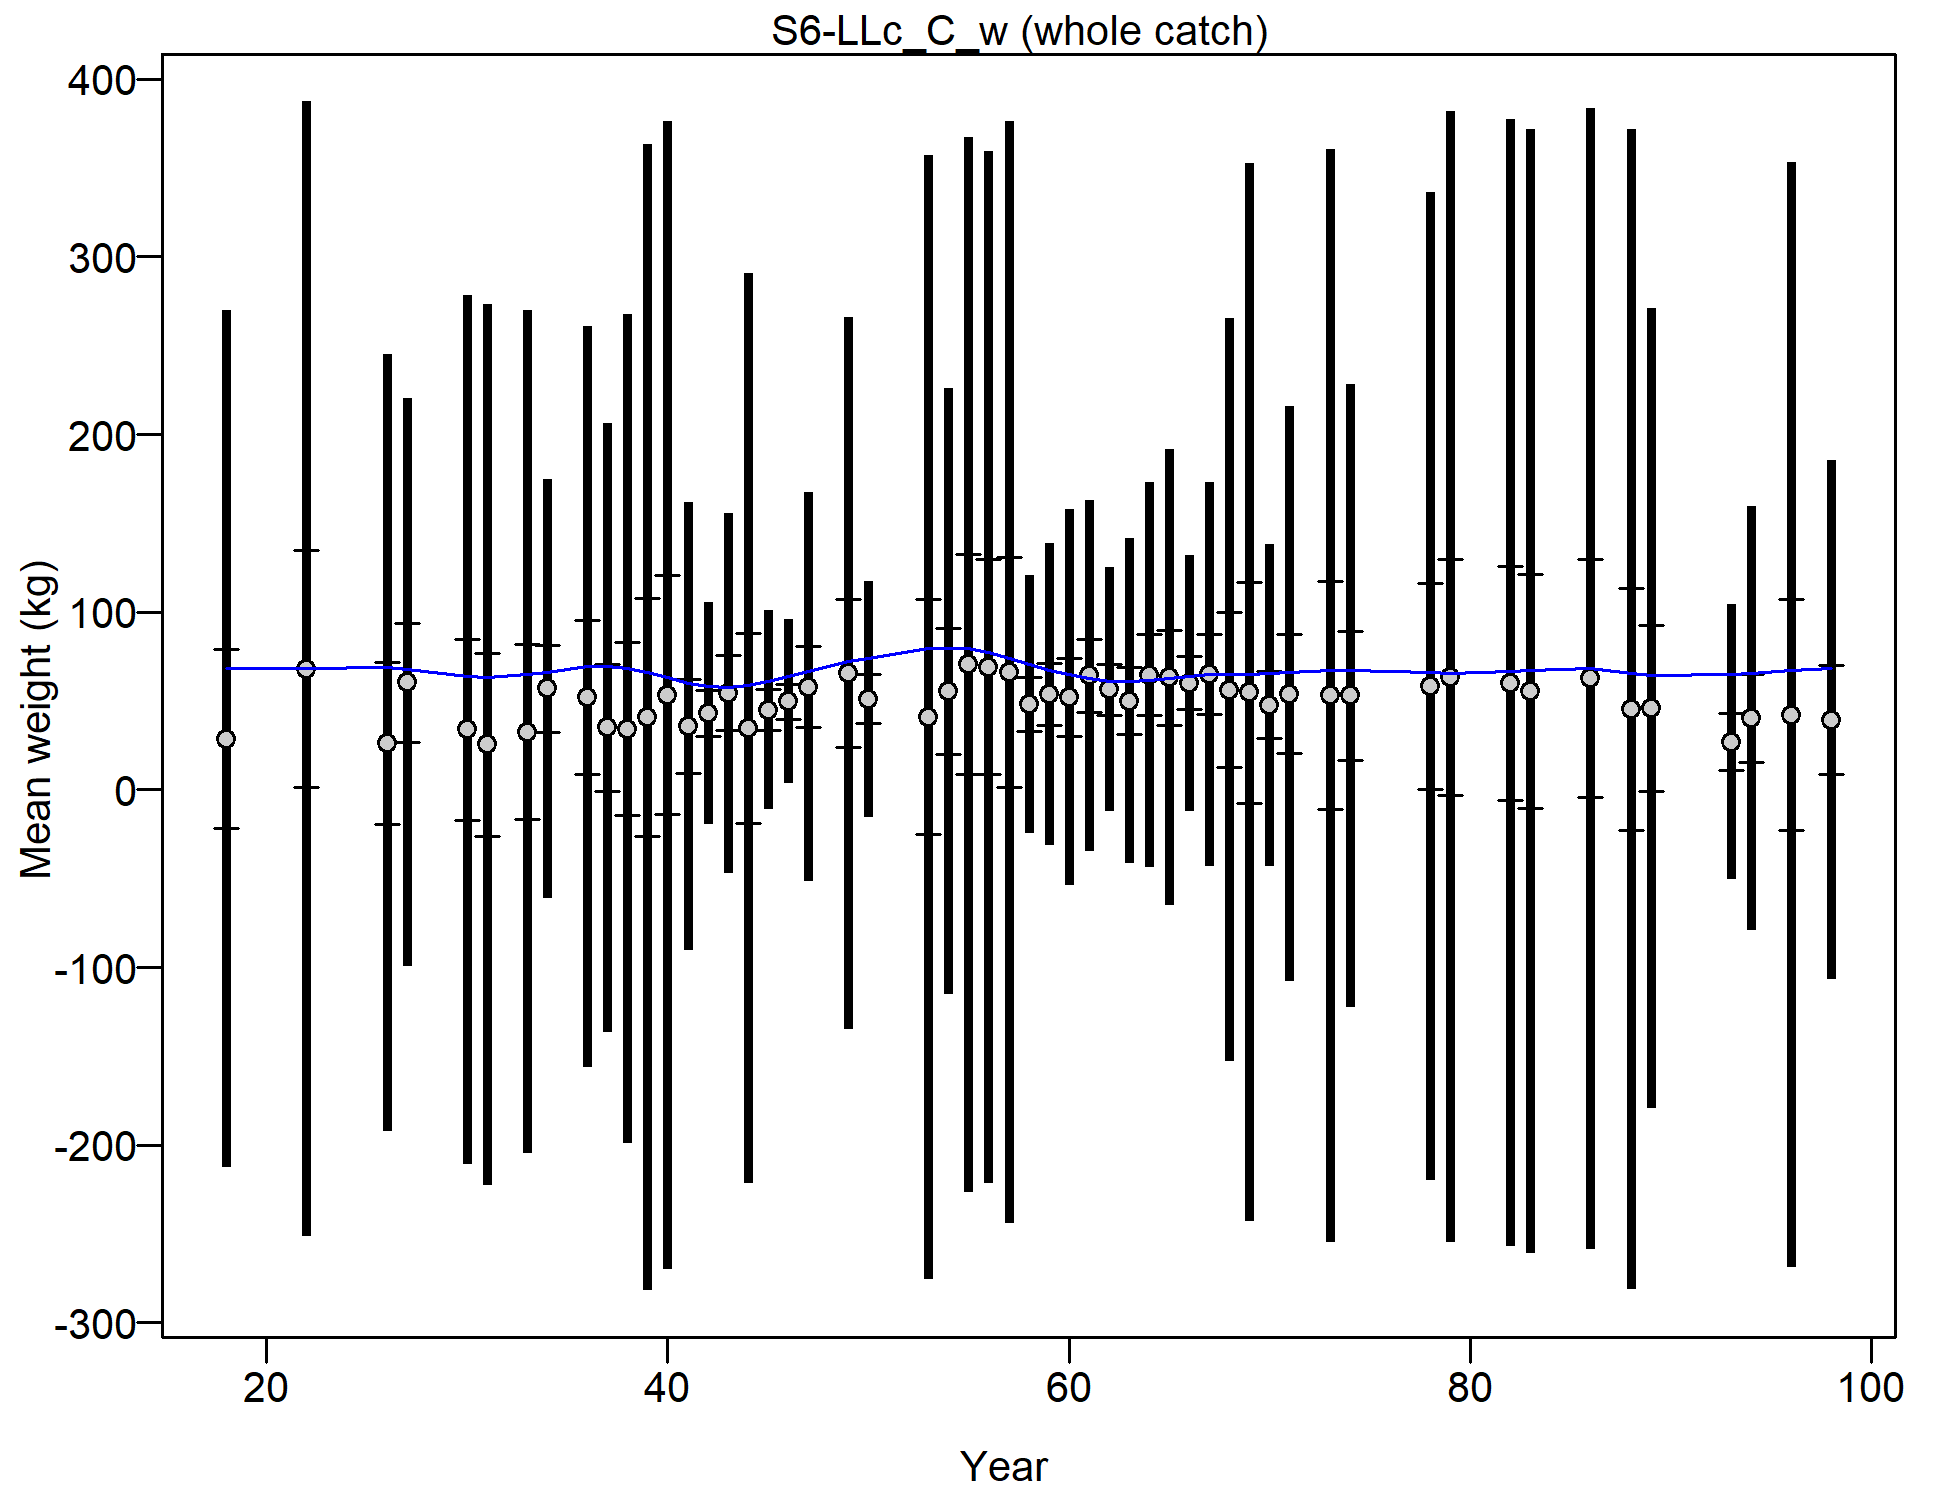
Mean size for S6-LLc_C_w with 95% confidence intervals based on current samples sizes.
Francis data weighting method TA1.8: thinner intervals (with capped ends) show result of further adjusting sample sizes based on suggested multiplier (with 95% interval) for size data from S6-LLc_C_w:
23.0263 (14.5092-43.6505)
For more info, see
Francis, R.I.C.C. (2011). Data weighting in statistical fisheries stock assessment models. Can. J. Fish. Aquat. Sci. 68: 1124-1138. https://doi.org/10.1139/f2011-025
file: comp_sizefit_data_weighting_TA1.8_S6-LLc_C_w.png
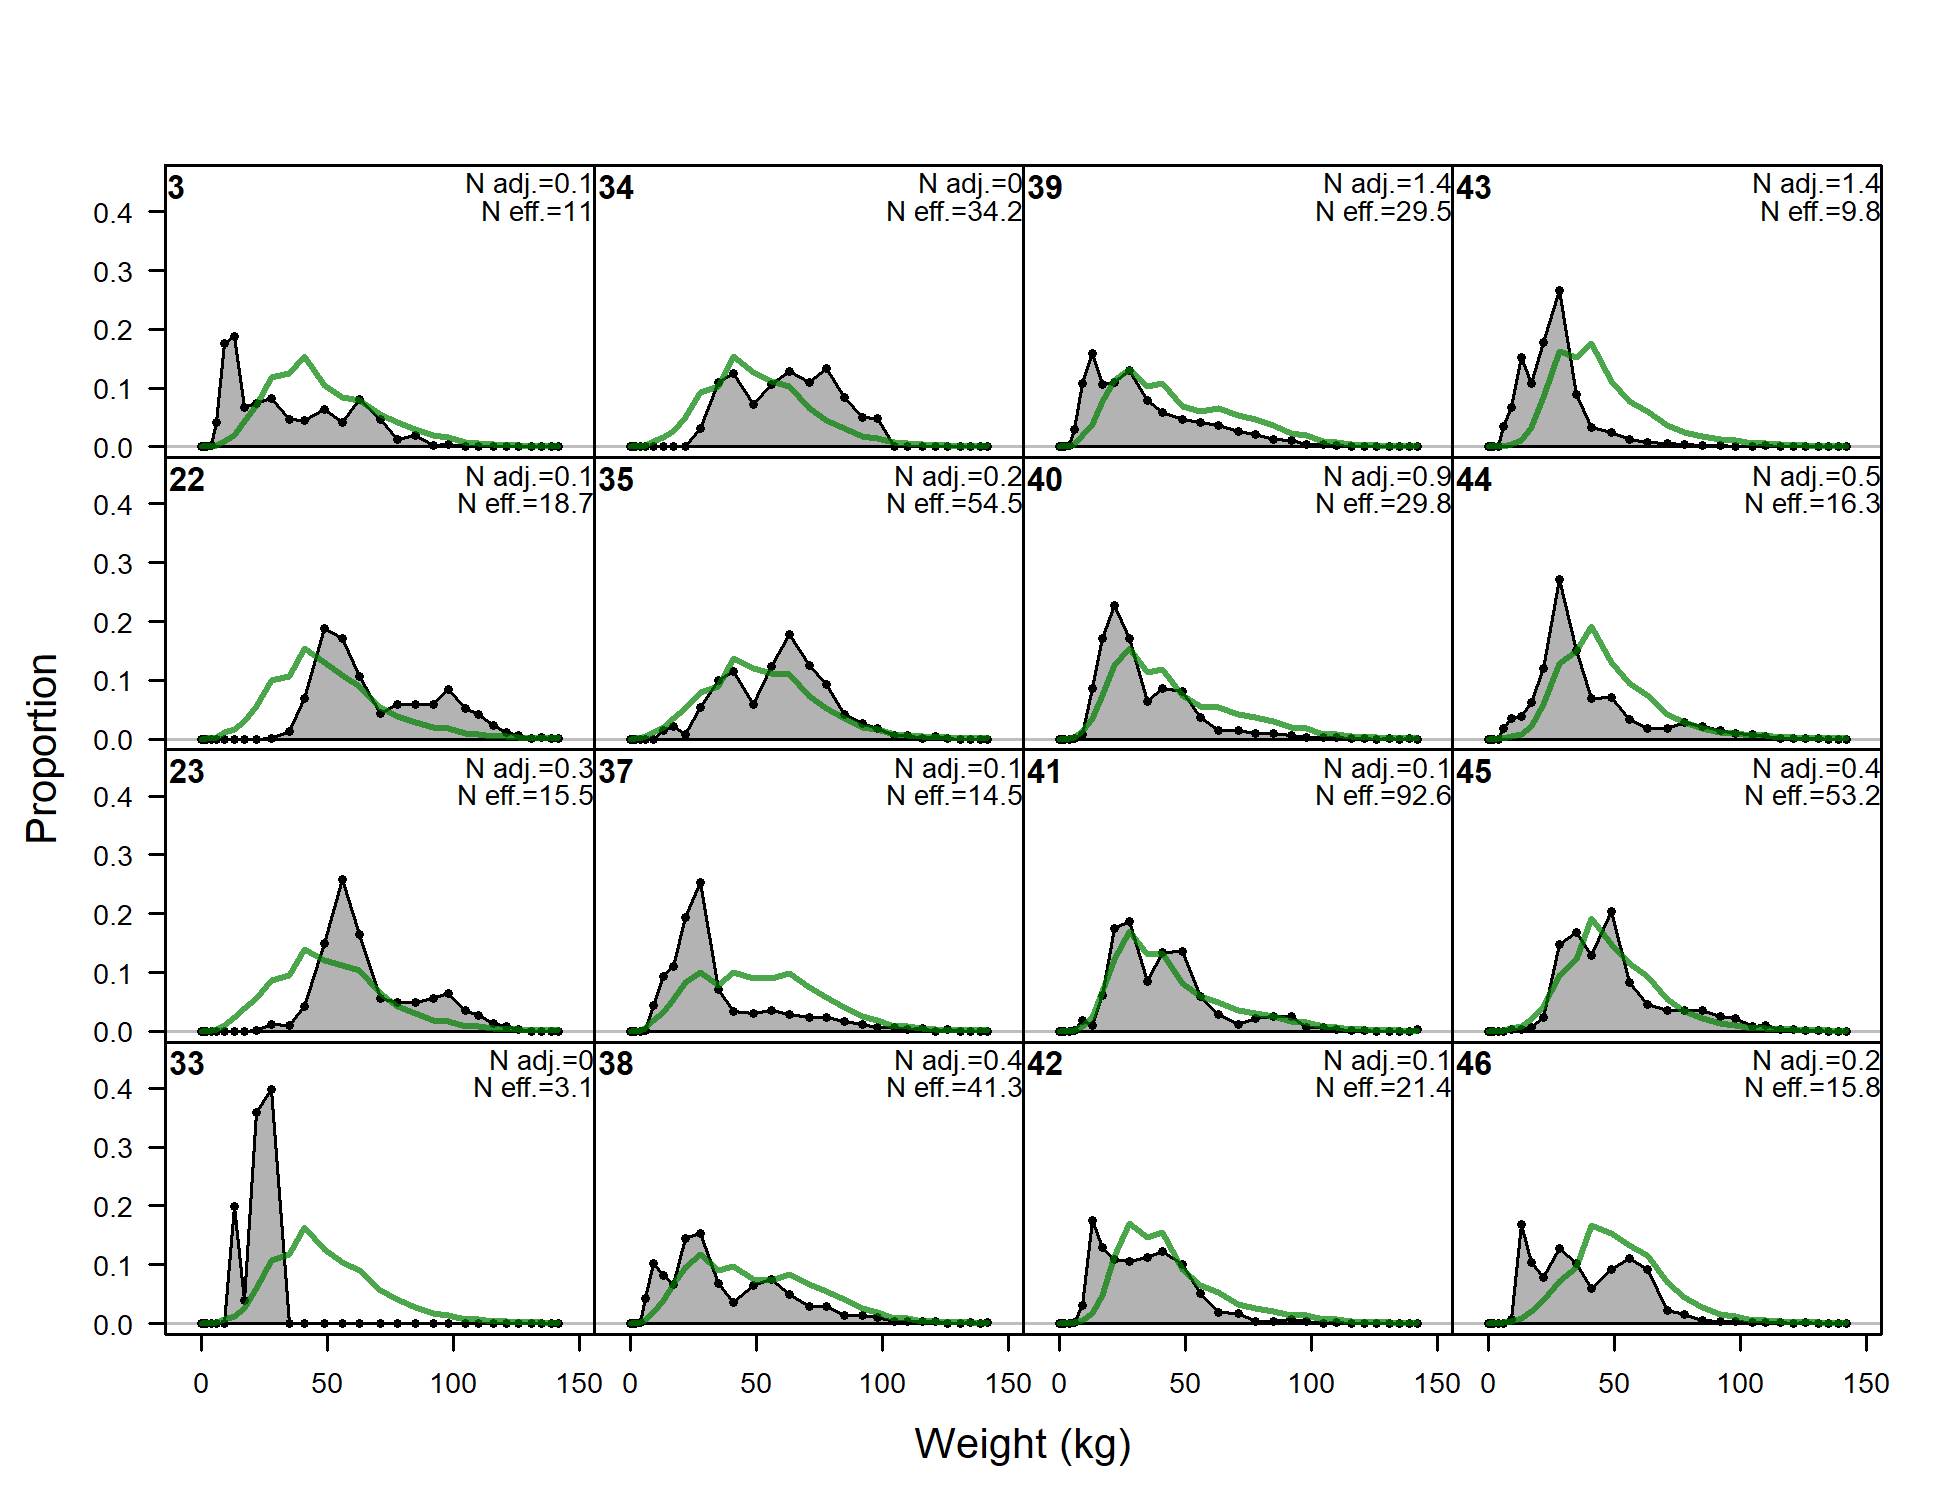
Size comps, whole catch, S7-LLc_S_w (plot 1 of 5).
'N adj.' is the input sample size after data-weighting adjustment.N eff. is the calculated effective sample size used in the McAllister-Iannelli tuning method.
file: comp_sizefit_flt26mkt0_page1.png
Size comps, whole catch, S7-LLc_S_w (plot 2 of 5)
file: comp_sizefit_flt26mkt0_page2.png
Size comps, whole catch, S7-LLc_S_w (plot 3 of 5)
file: comp_sizefit_flt26mkt0_page3.png
Size comps, whole catch, S7-LLc_S_w (plot 4 of 5)
file: comp_sizefit_flt26mkt0_page4.png
Size comps, whole catch, S7-LLc_S_w (plot 5 of 5)
file: comp_sizefit_flt26mkt0_page5.png
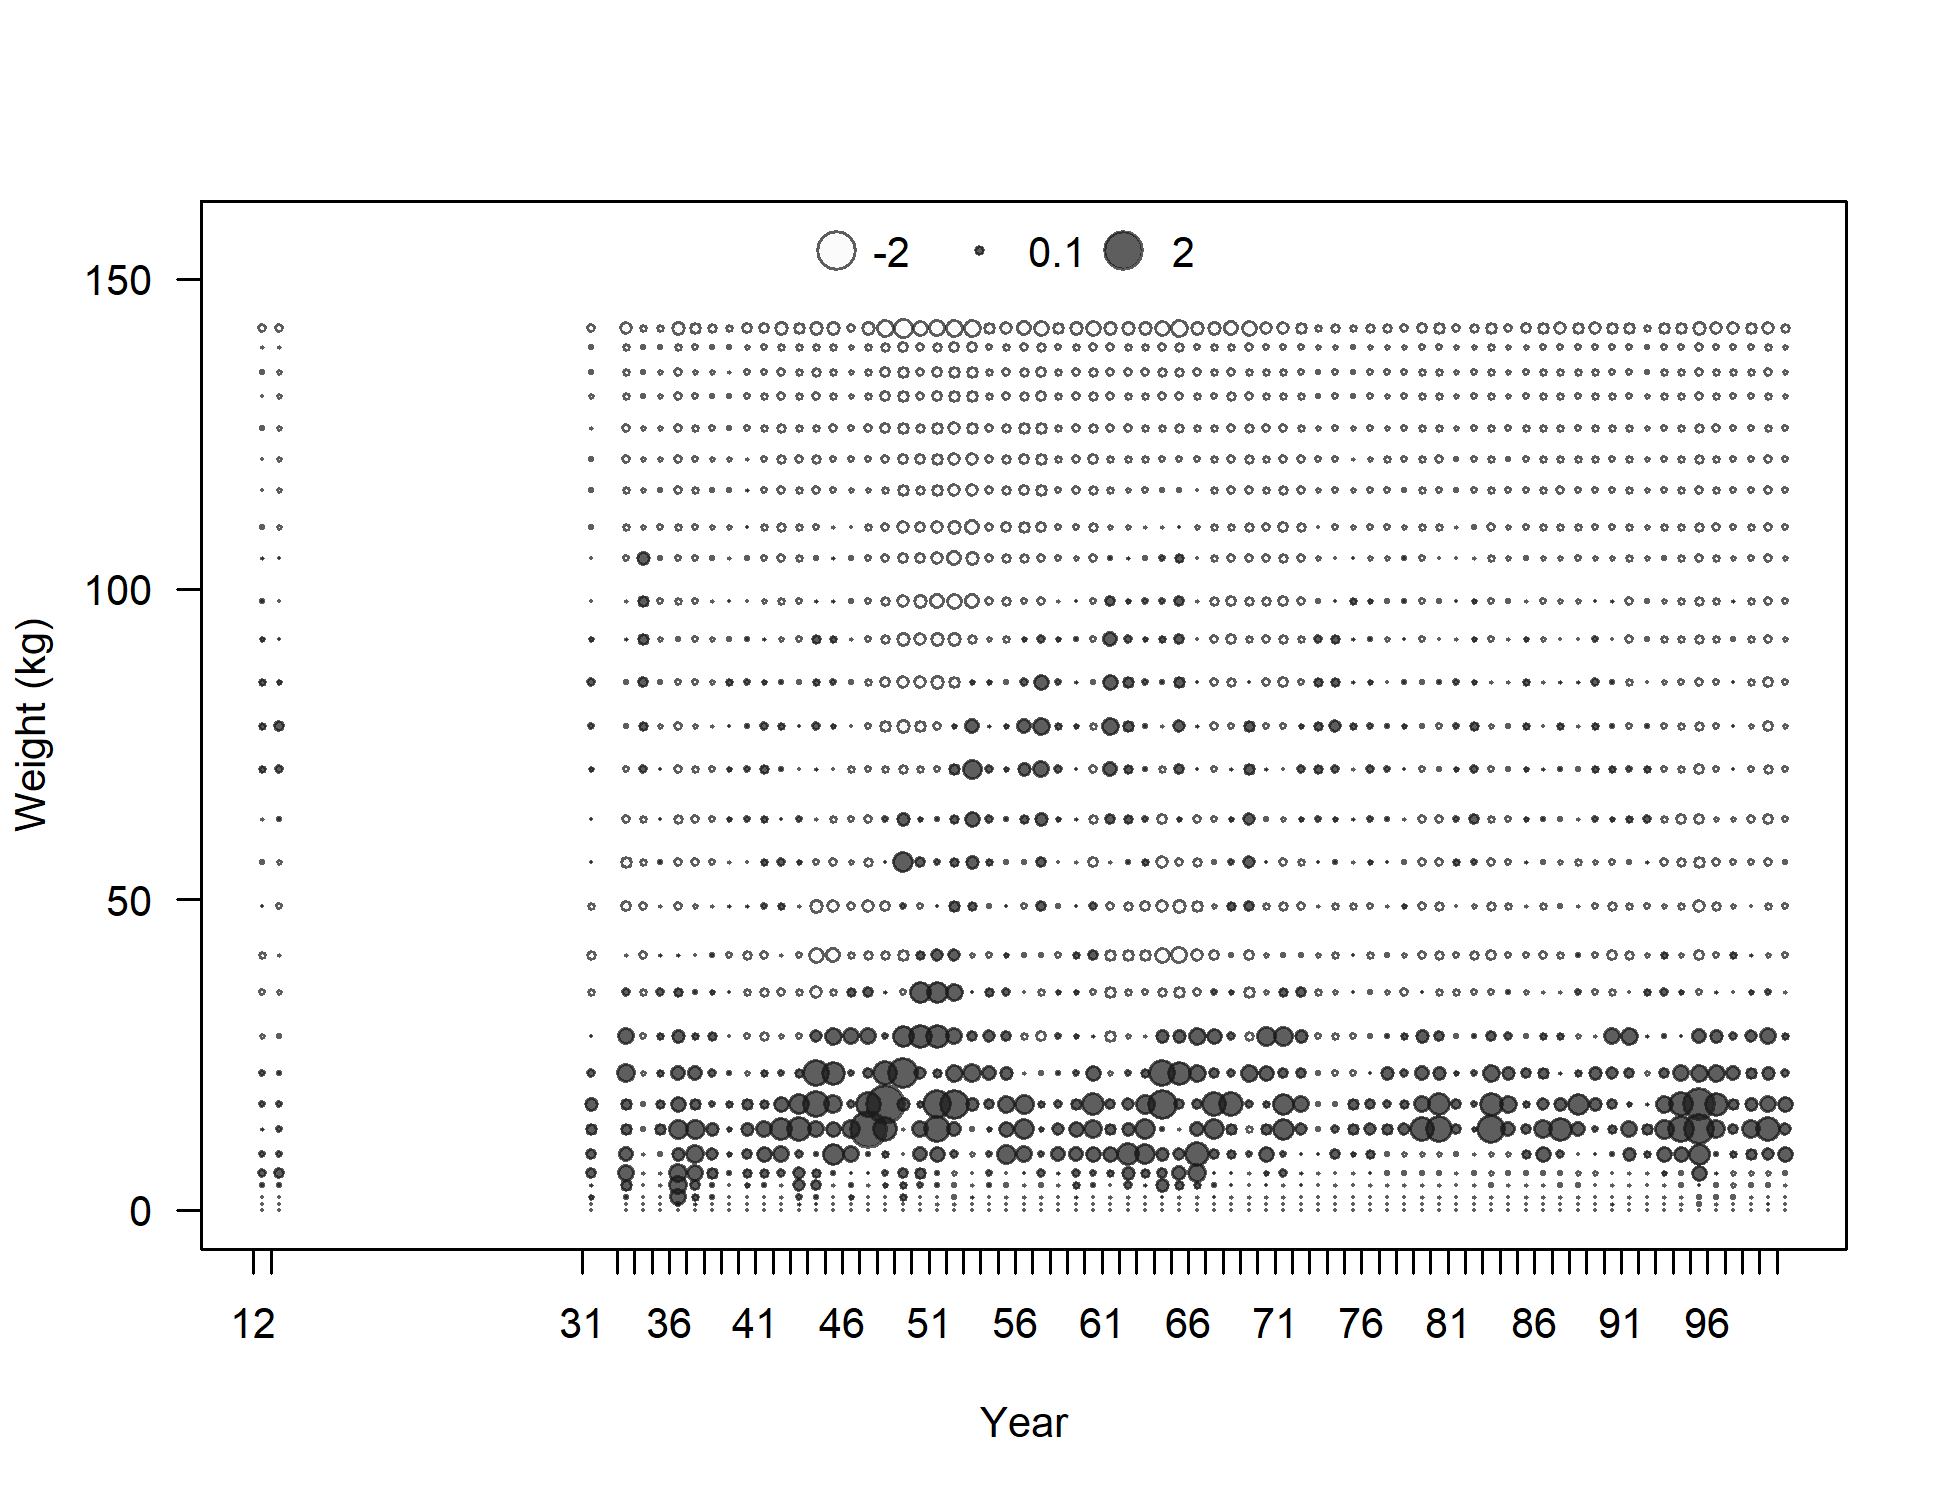
Pearson residuals, whole catch, S7-LLc_S_w (max=2.03) (plot 5 of 5)
Closed bubbles are positive residuals (observed > expected) and open bubbles are negative residuals (observed < expected).
file: comp_sizefit_residsflt26mkt0_page5.png
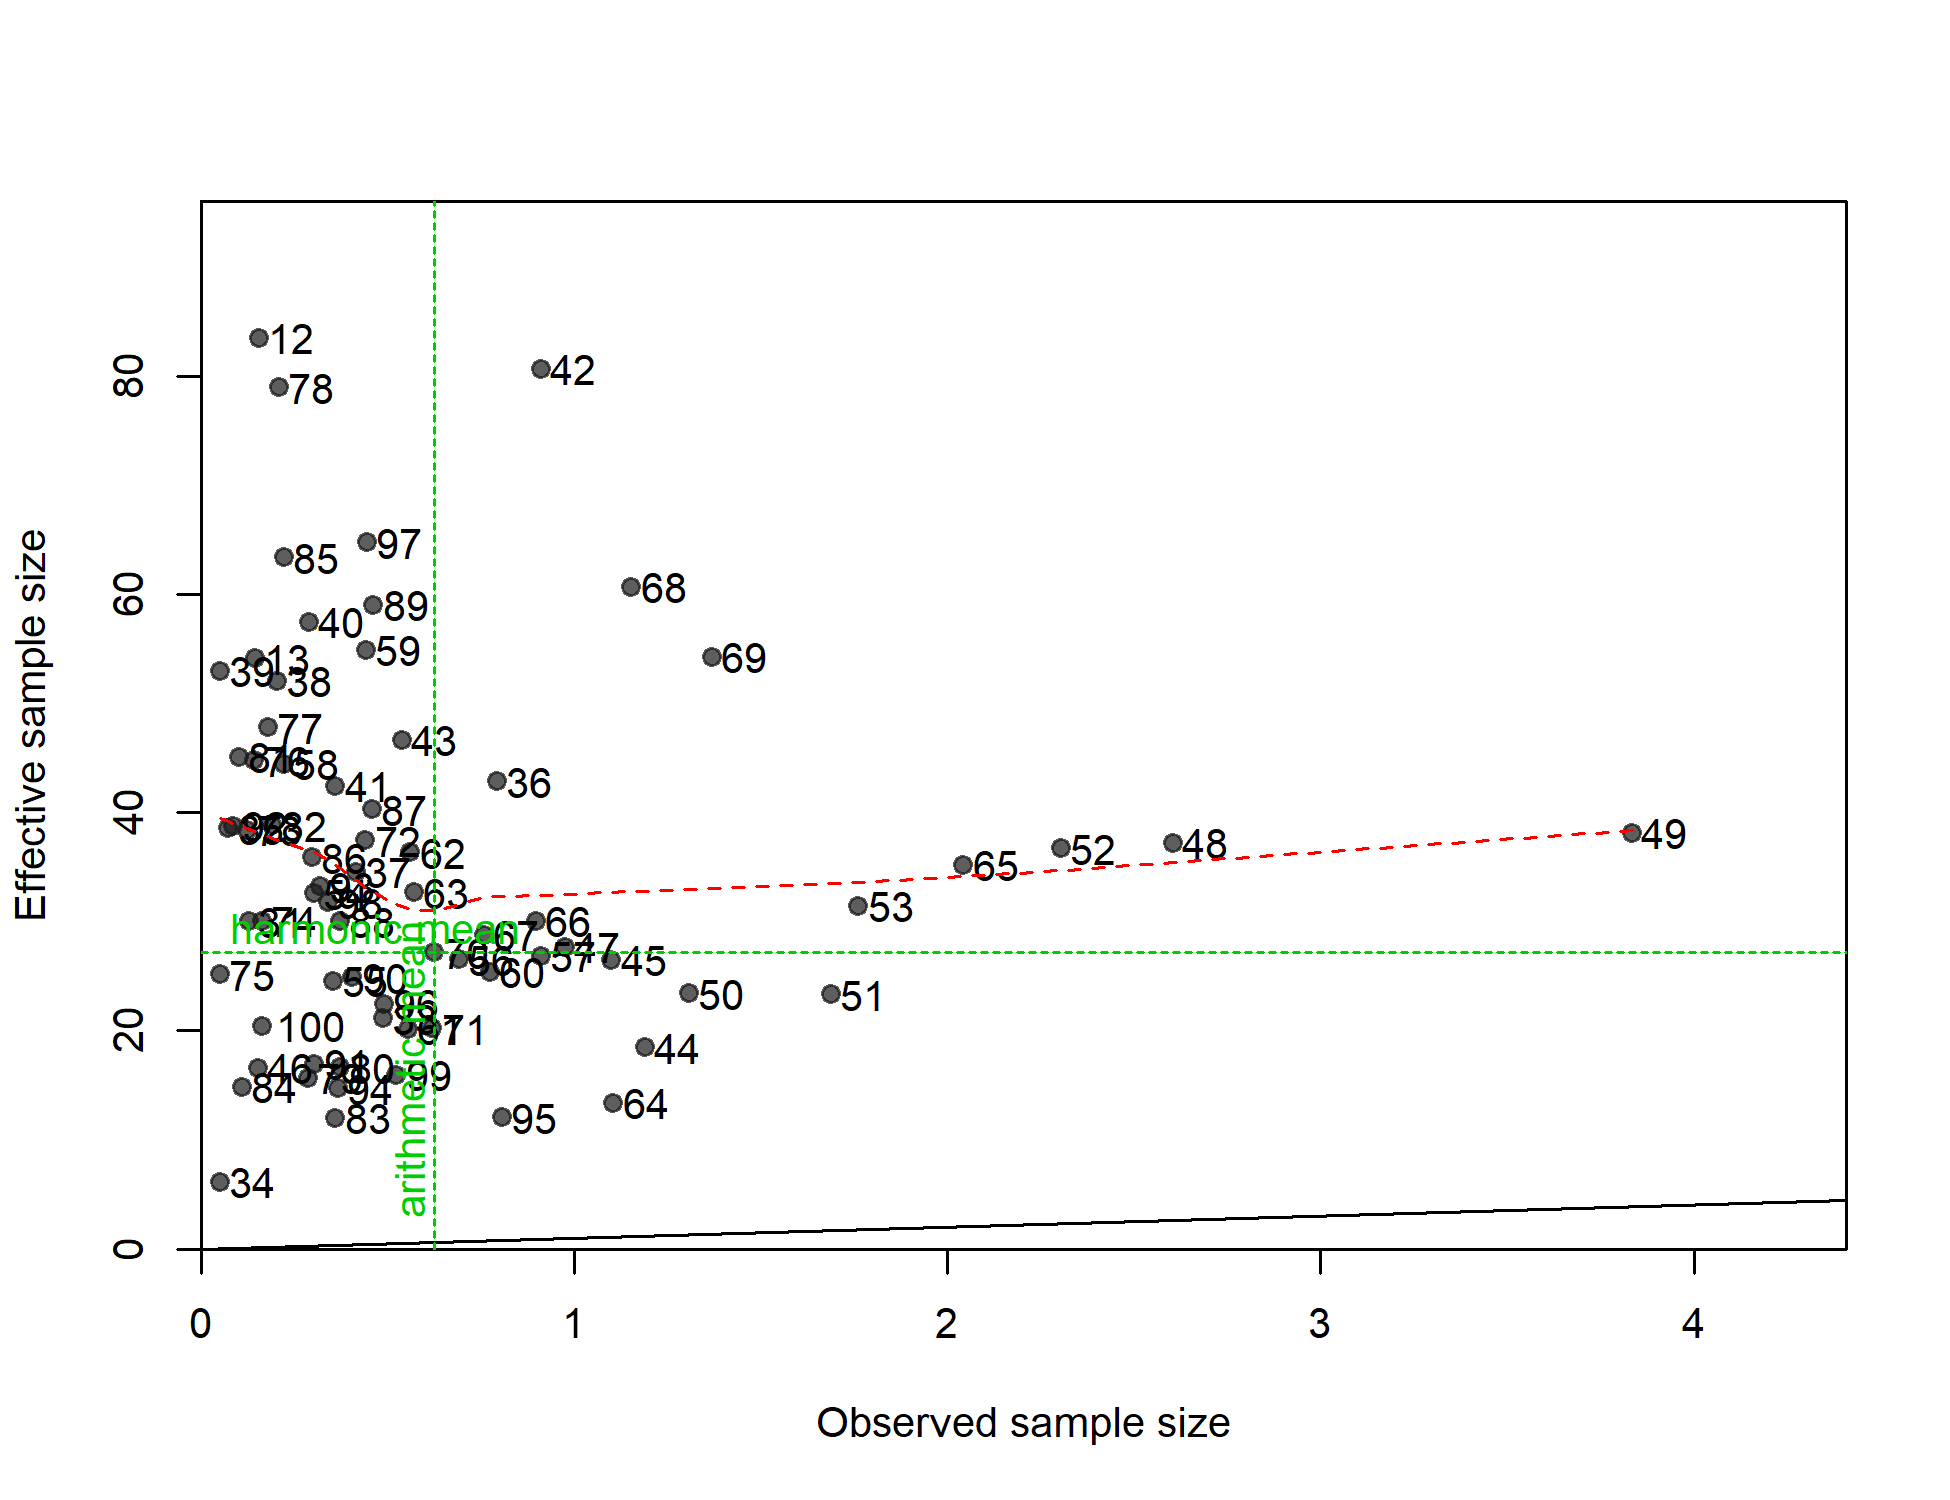
N-EffN comparison, Size comps, whole catch, S7-LLc_S_w
file: comp_sizefit_sampsize_flt26mkt0.png
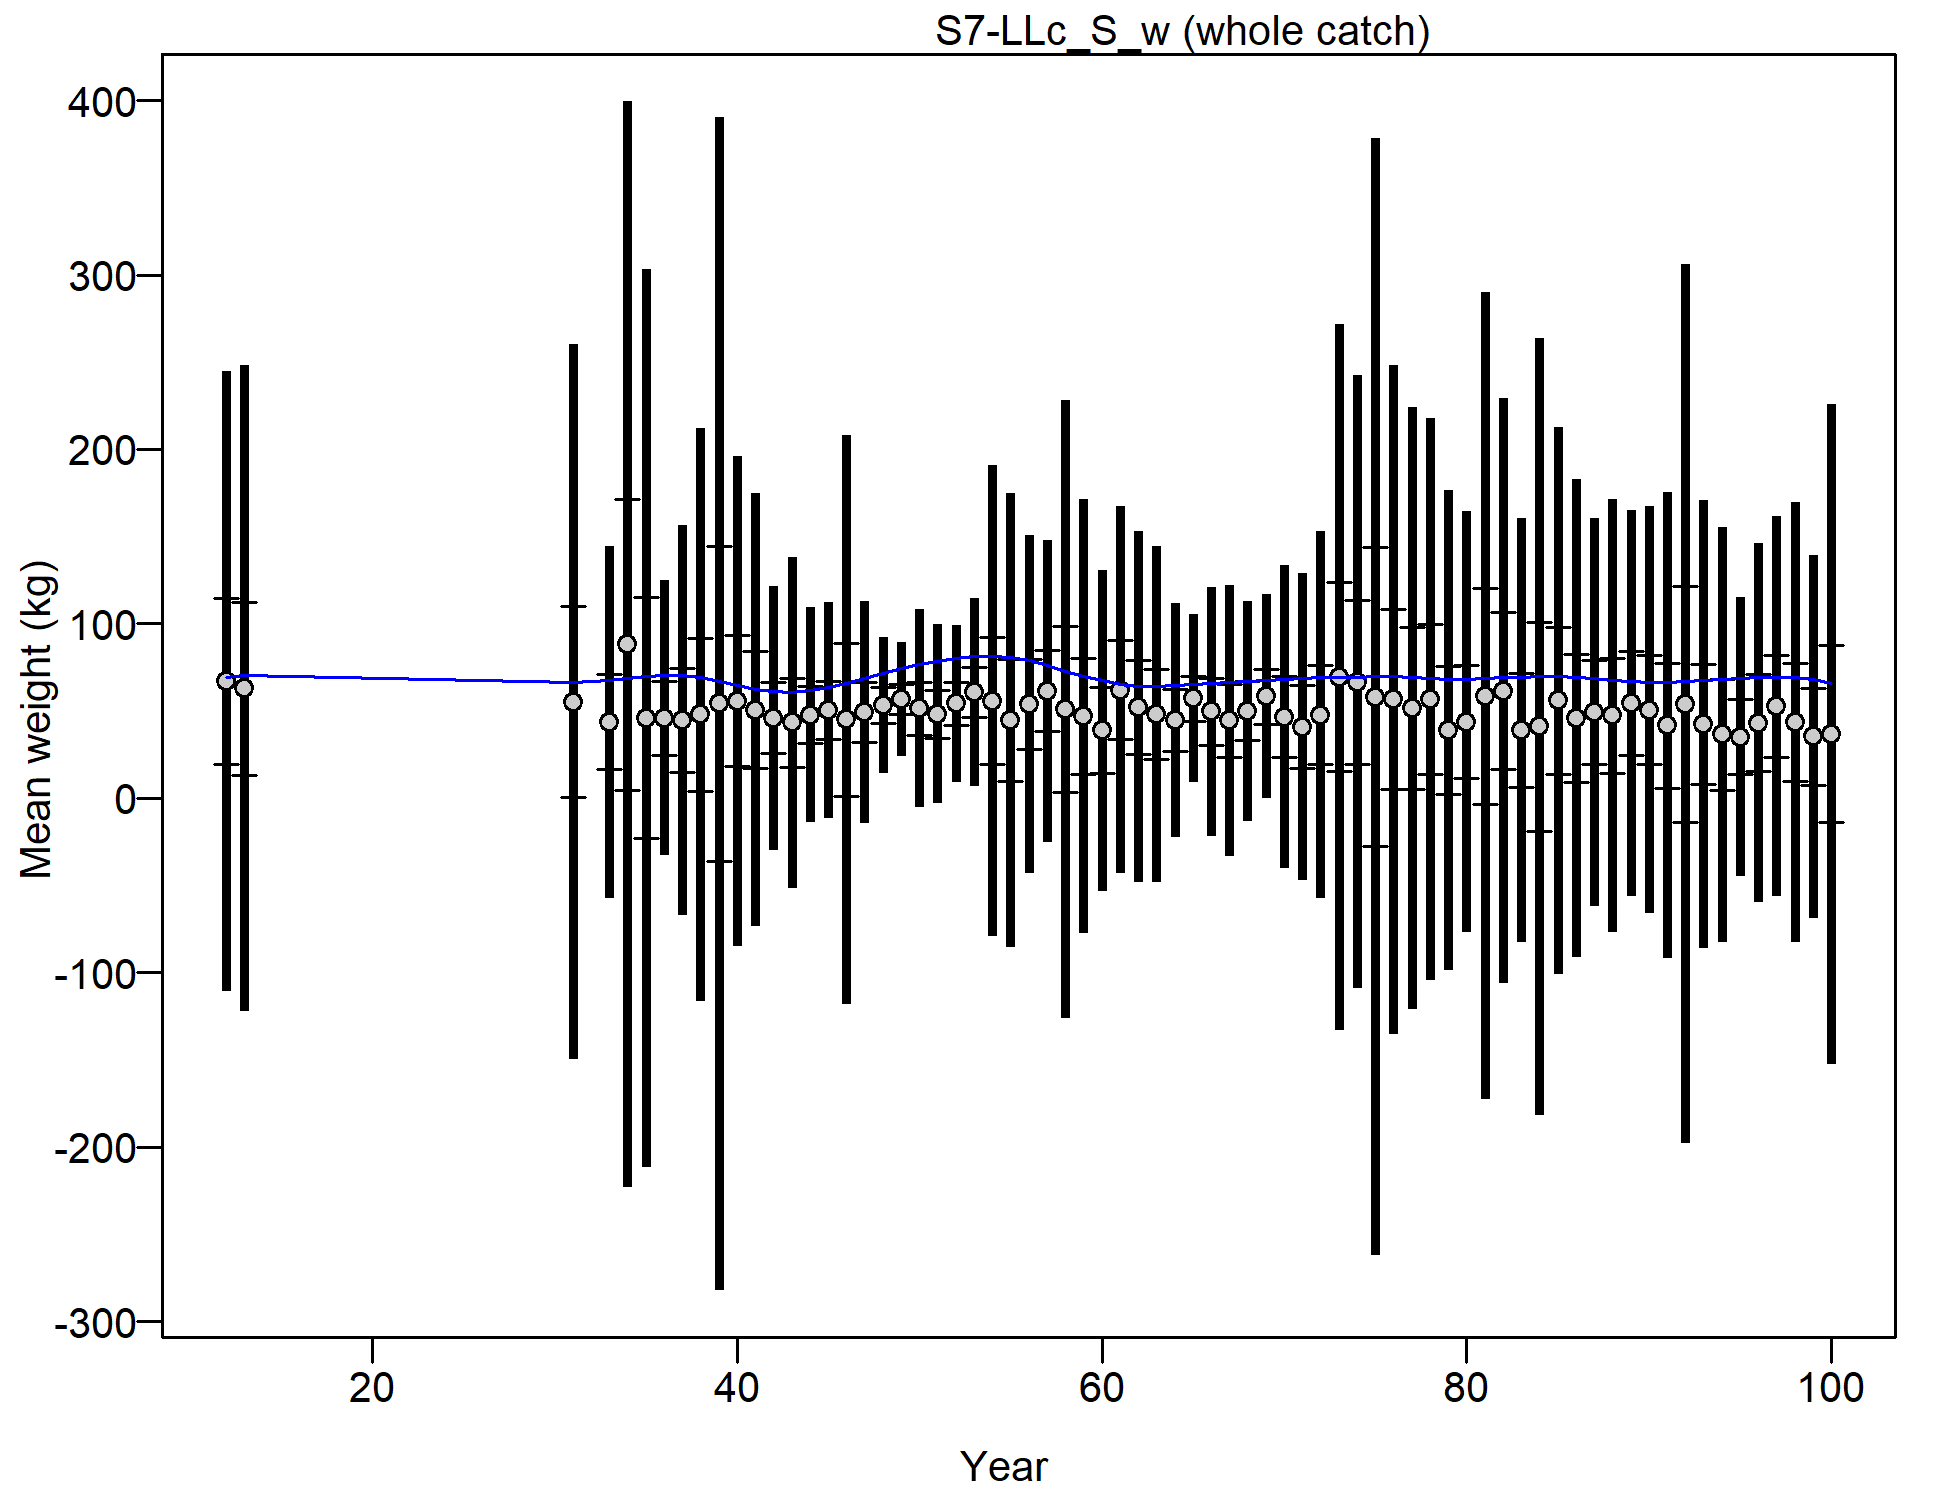
Mean size for S7-LLc_S_w with 95% confidence intervals based on current samples sizes.
Francis data weighting method TA1.8: thinner intervals (with capped ends) show result of further adjusting sample sizes based on suggested multiplier (with 95% interval) for size data from S7-LLc_S_w:
13.8938 (9.9795-22.3718)
For more info, see
Francis, R.I.C.C. (2011). Data weighting in statistical fisheries stock assessment models. Can. J. Fish. Aquat. Sci. 68: 1124-1138. https://doi.org/10.1139/f2011-025
file: comp_sizefit_data_weighting_TA1.8_S7-LLc_S_w.png
Size comps, whole catch, S8-LLc_I_w (plot 1 of 3).
'N adj.' is the input sample size after data-weighting adjustment.N eff. is the calculated effective sample size used in the McAllister-Iannelli tuning method.
file: comp_sizefit_flt27mkt0_page1.png
Size comps, whole catch, S8-LLc_I_w (plot 2 of 3)
file: comp_sizefit_flt27mkt0_page2.png
Size comps, whole catch, S8-LLc_I_w (plot 3 of 3)
file: comp_sizefit_flt27mkt0_page3.png
Pearson residuals, whole catch, S8-LLc_I_w (max=2.39) (plot 3 of 3)
Closed bubbles are positive residuals (observed > expected) and open bubbles are negative residuals (observed < expected).
file: comp_sizefit_residsflt27mkt0_page3.png
N-EffN comparison, Size comps, whole catch, S8-LLc_I_w
file: comp_sizefit_sampsize_flt27mkt0.png
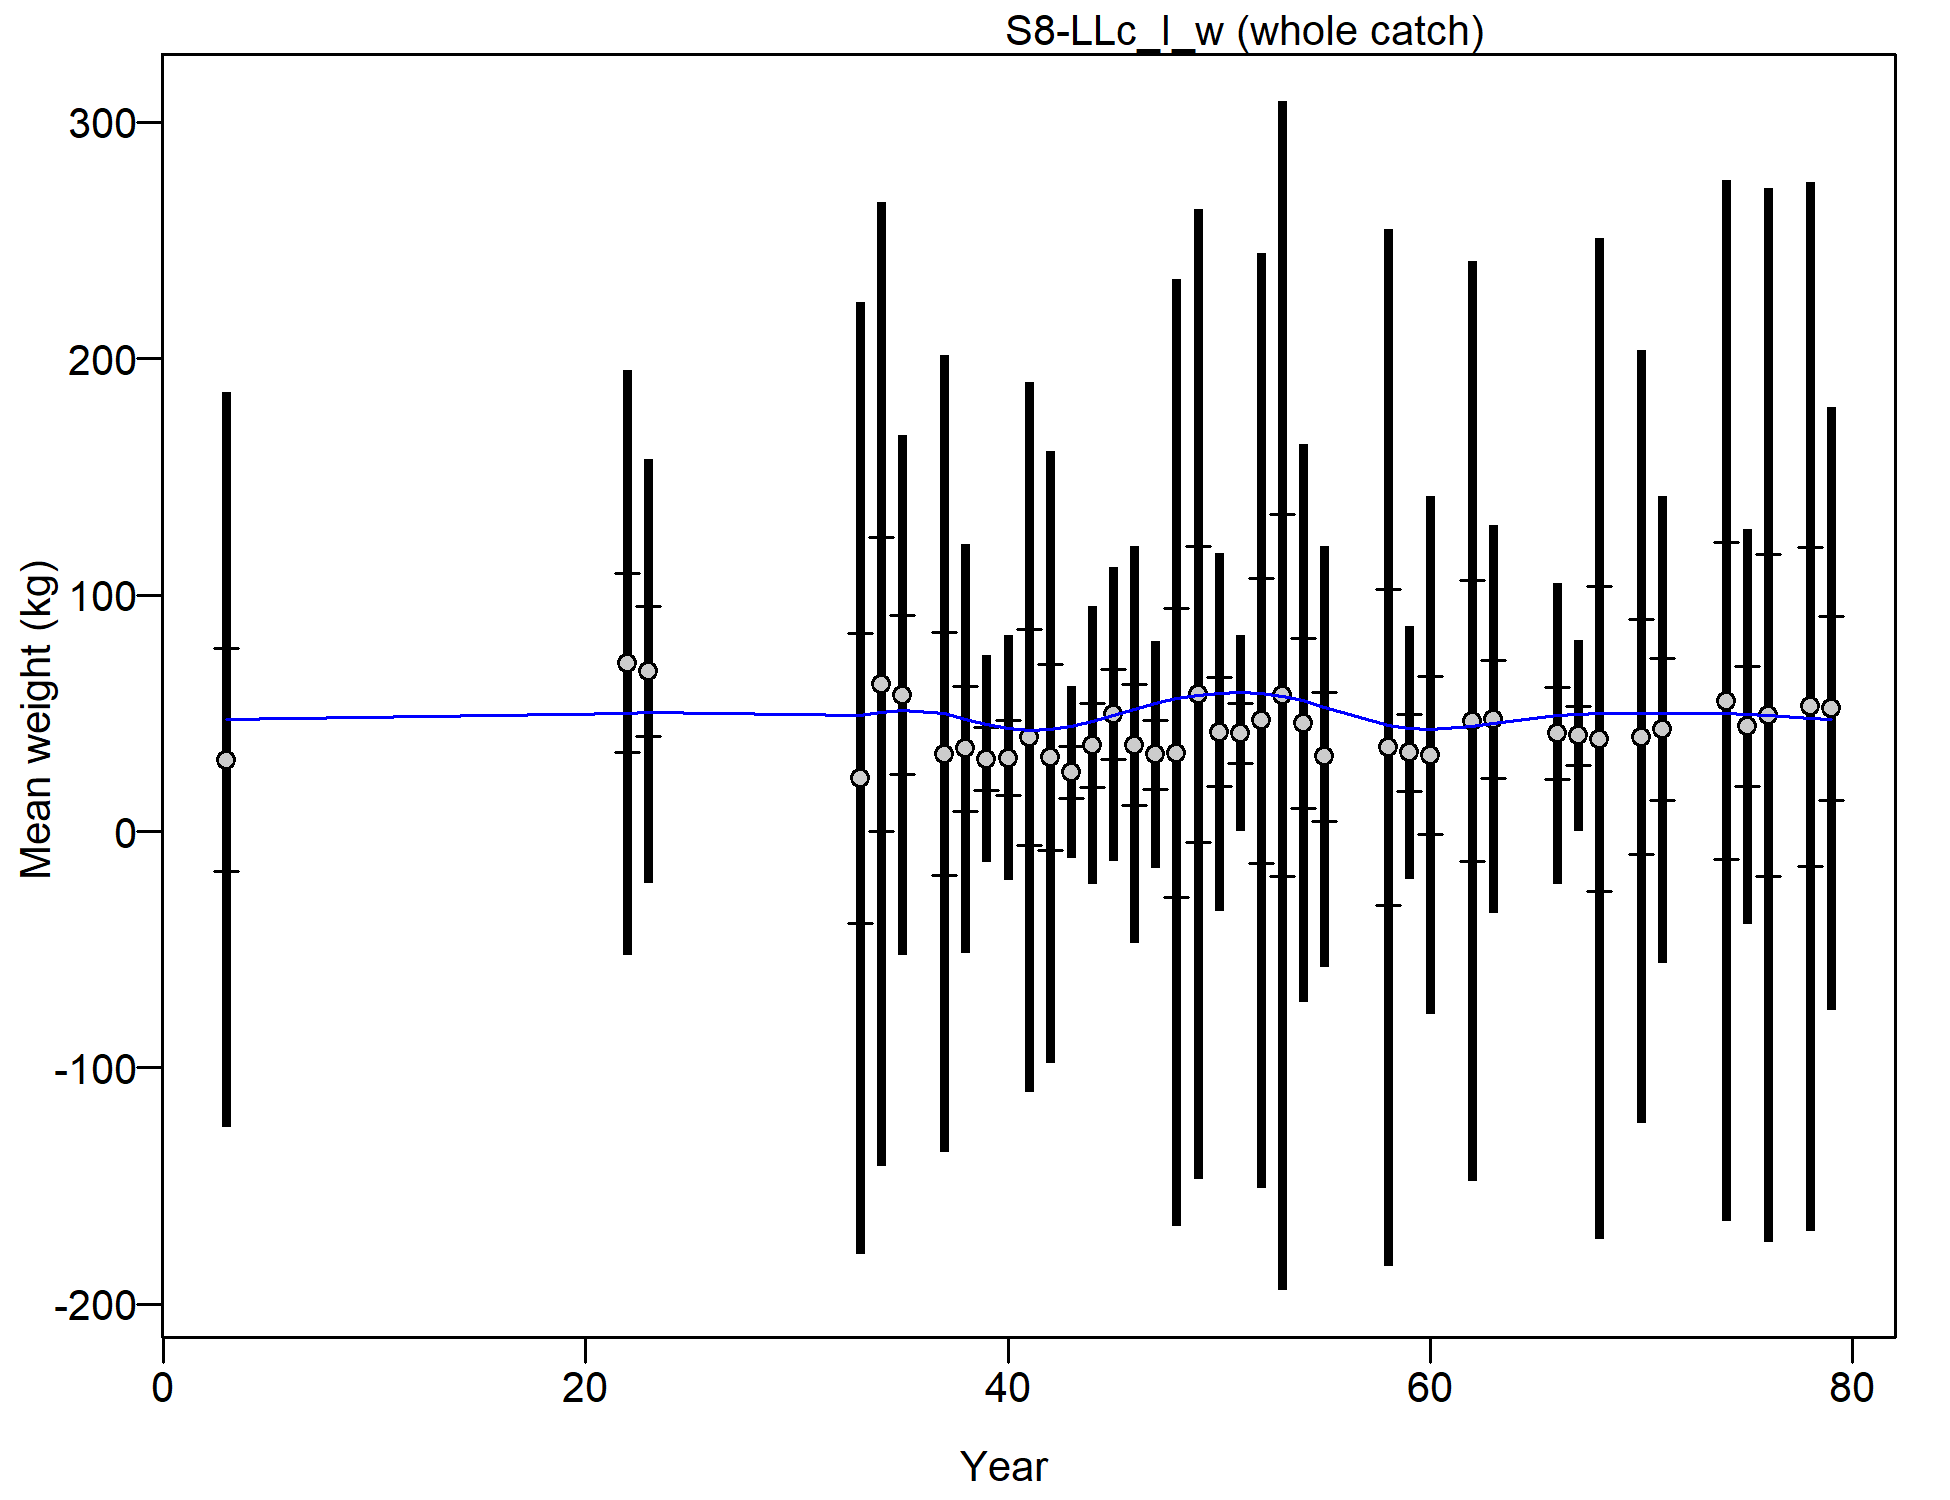
Mean size for S8-LLc_I_w with 95% confidence intervals based on current samples sizes.
Francis data weighting method TA1.8: thinner intervals (with capped ends) show result of further adjusting sample sizes based on suggested multiplier (with 95% interval) for size data from S8-LLc_I_w:
10.7694 (6.9198-20.3115)
For more info, see
Francis, R.I.C.C. (2011). Data weighting in statistical fisheries stock assessment models. Can. J. Fish. Aquat. Sci. 68: 1124-1138. https://doi.org/10.1139/f2011-025
file: comp_sizefit_data_weighting_TA1.8_S8-LLc_I_w.png
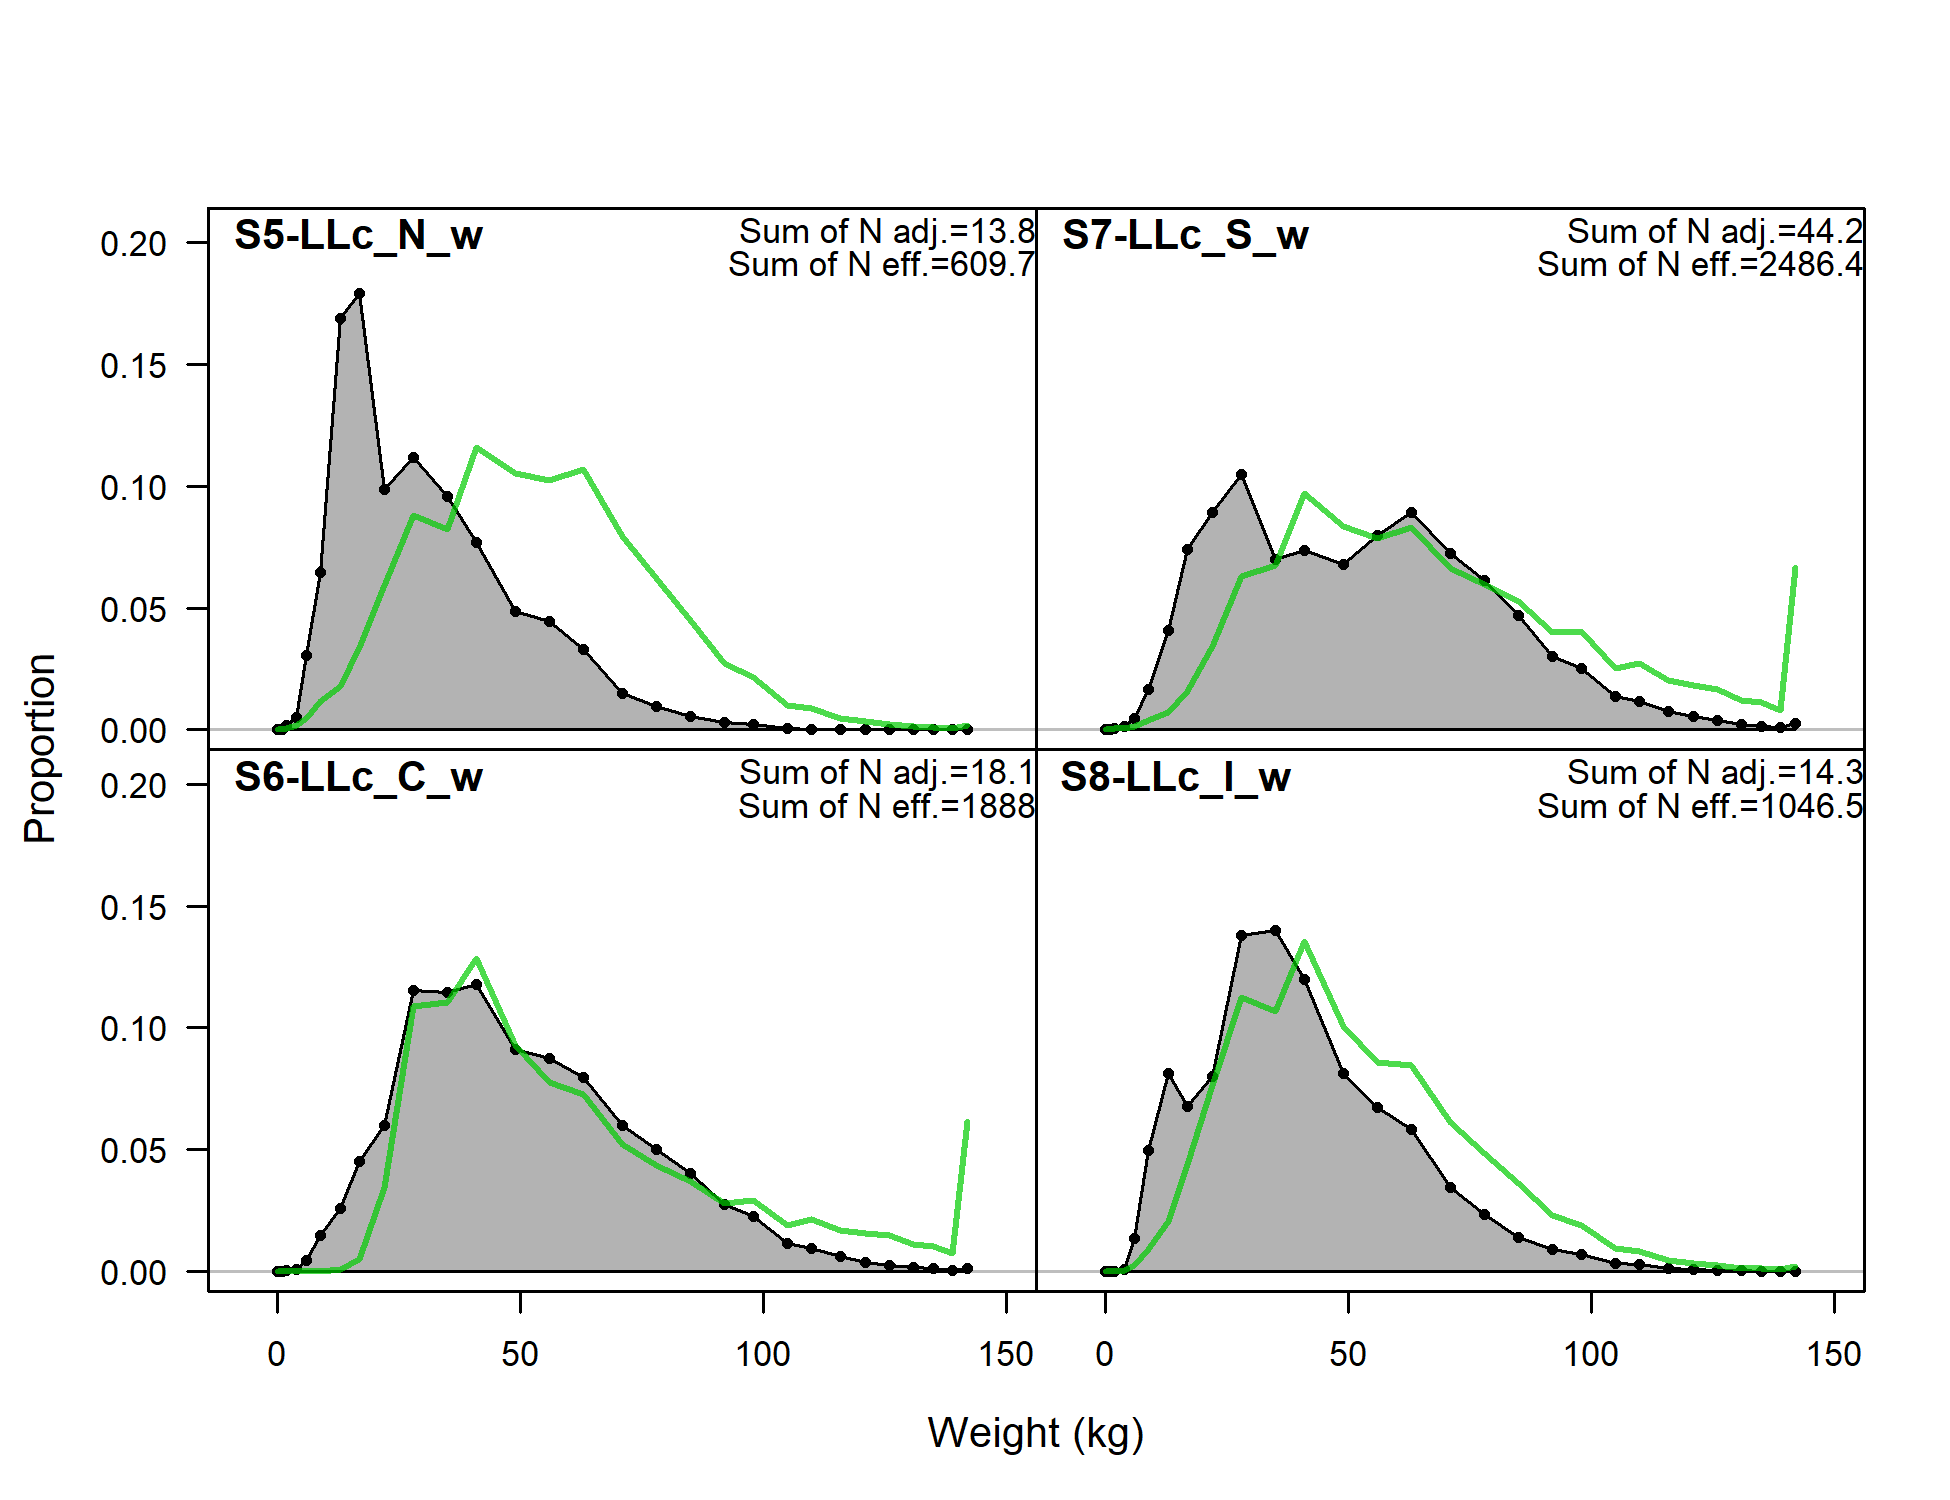
Size comps, aggregated across time by fleet.
Labels 'retained' and 'discard' indicate discarded or retained sampled for each fleet. Panels without this designation represent the whole catch.
file: comp_sizefit__aggregated_across_time.png