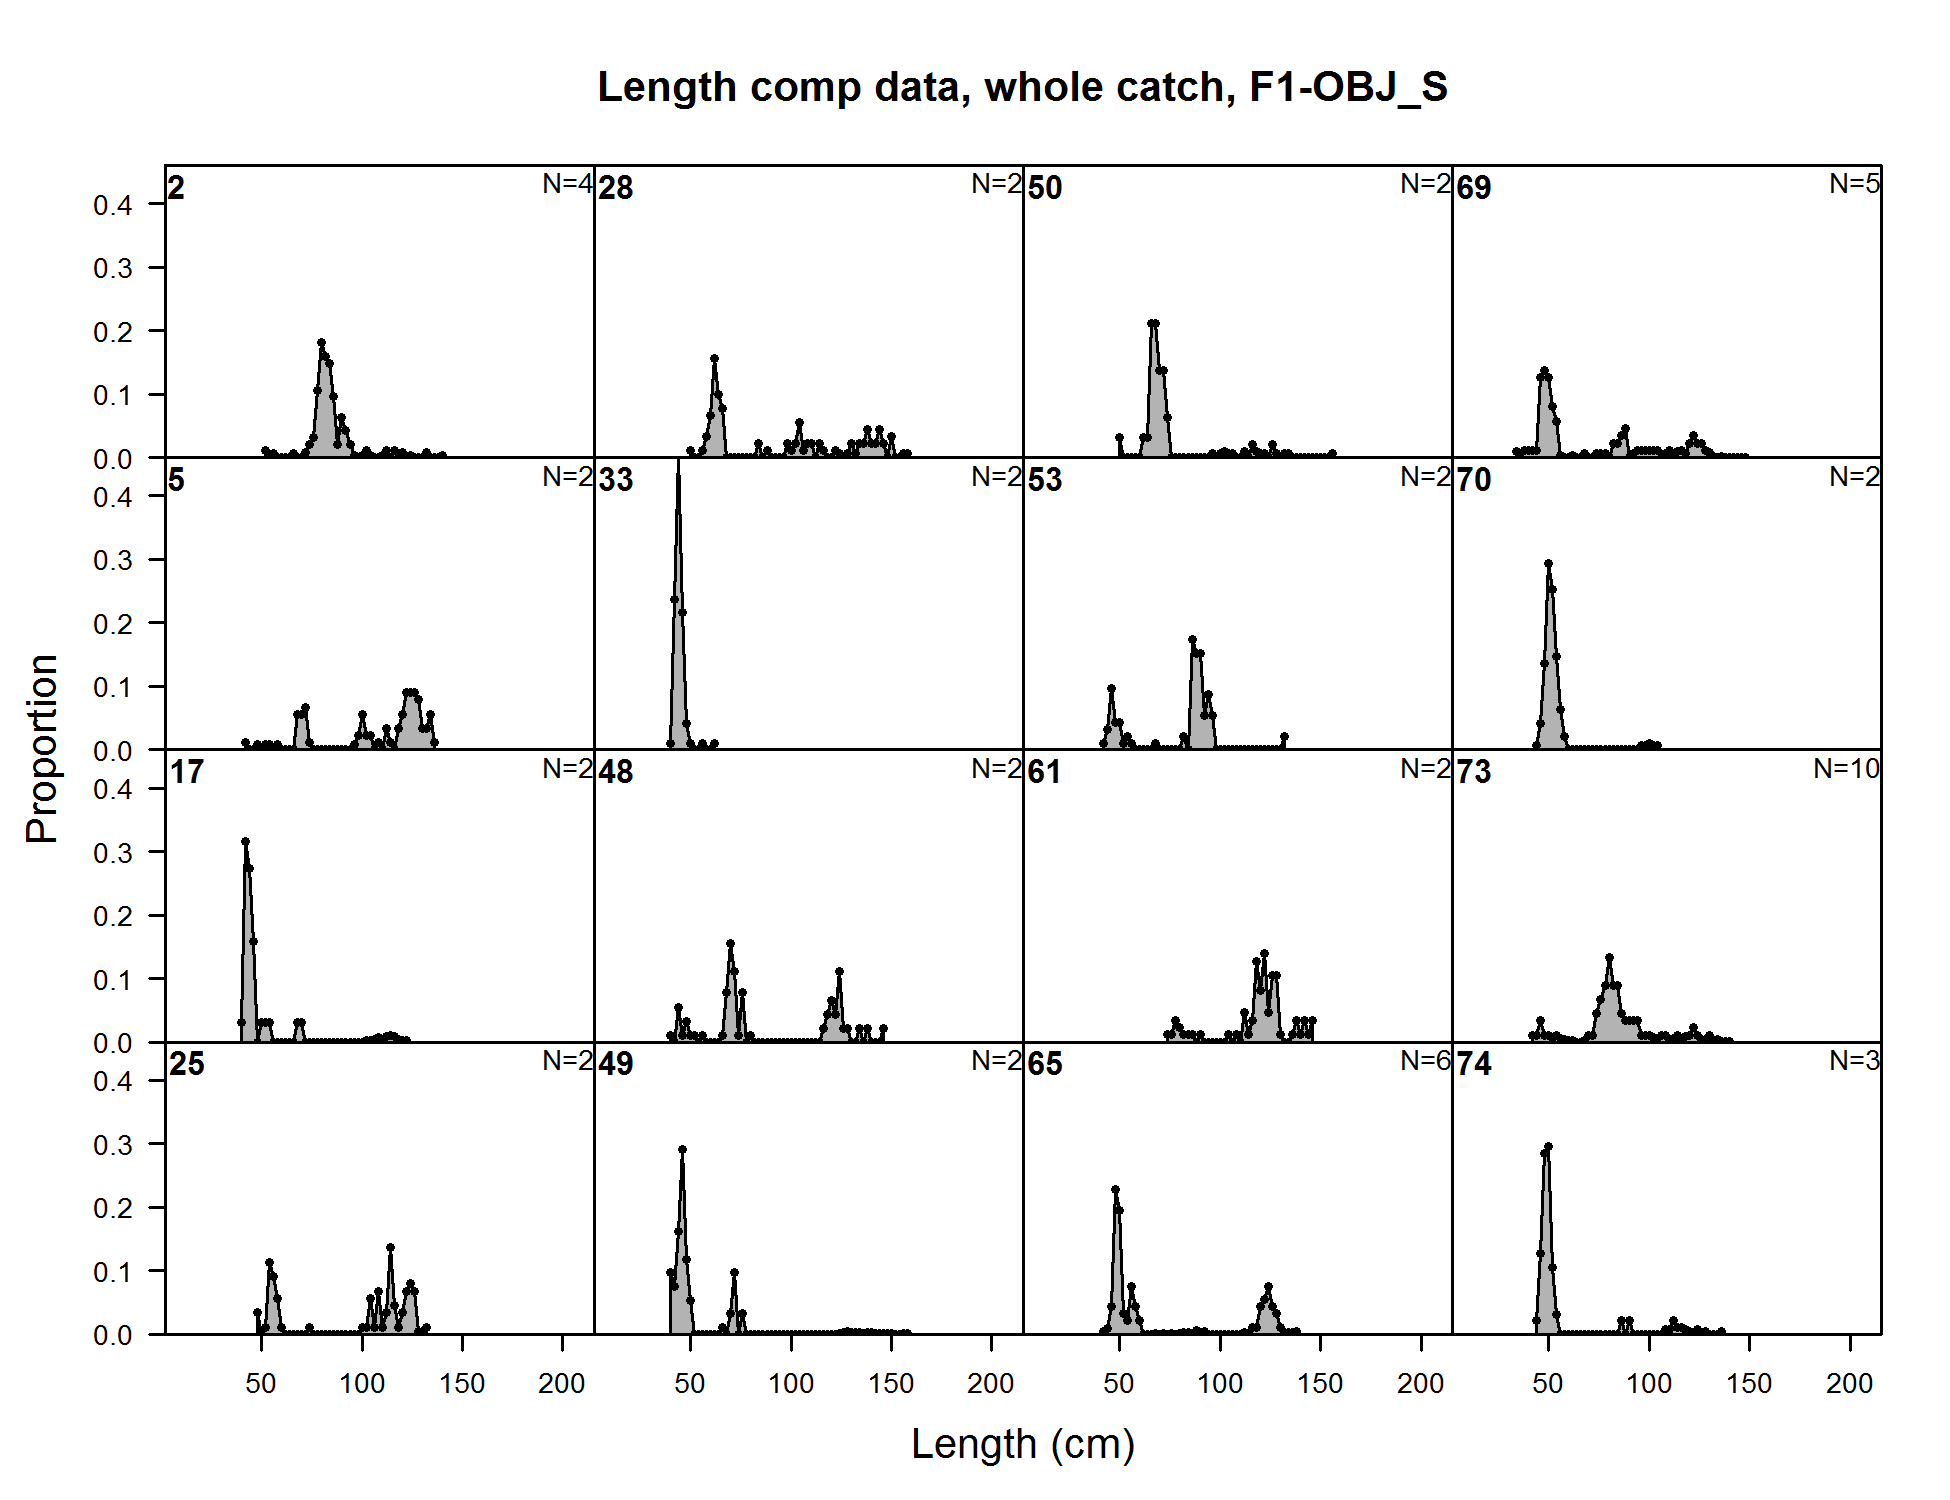
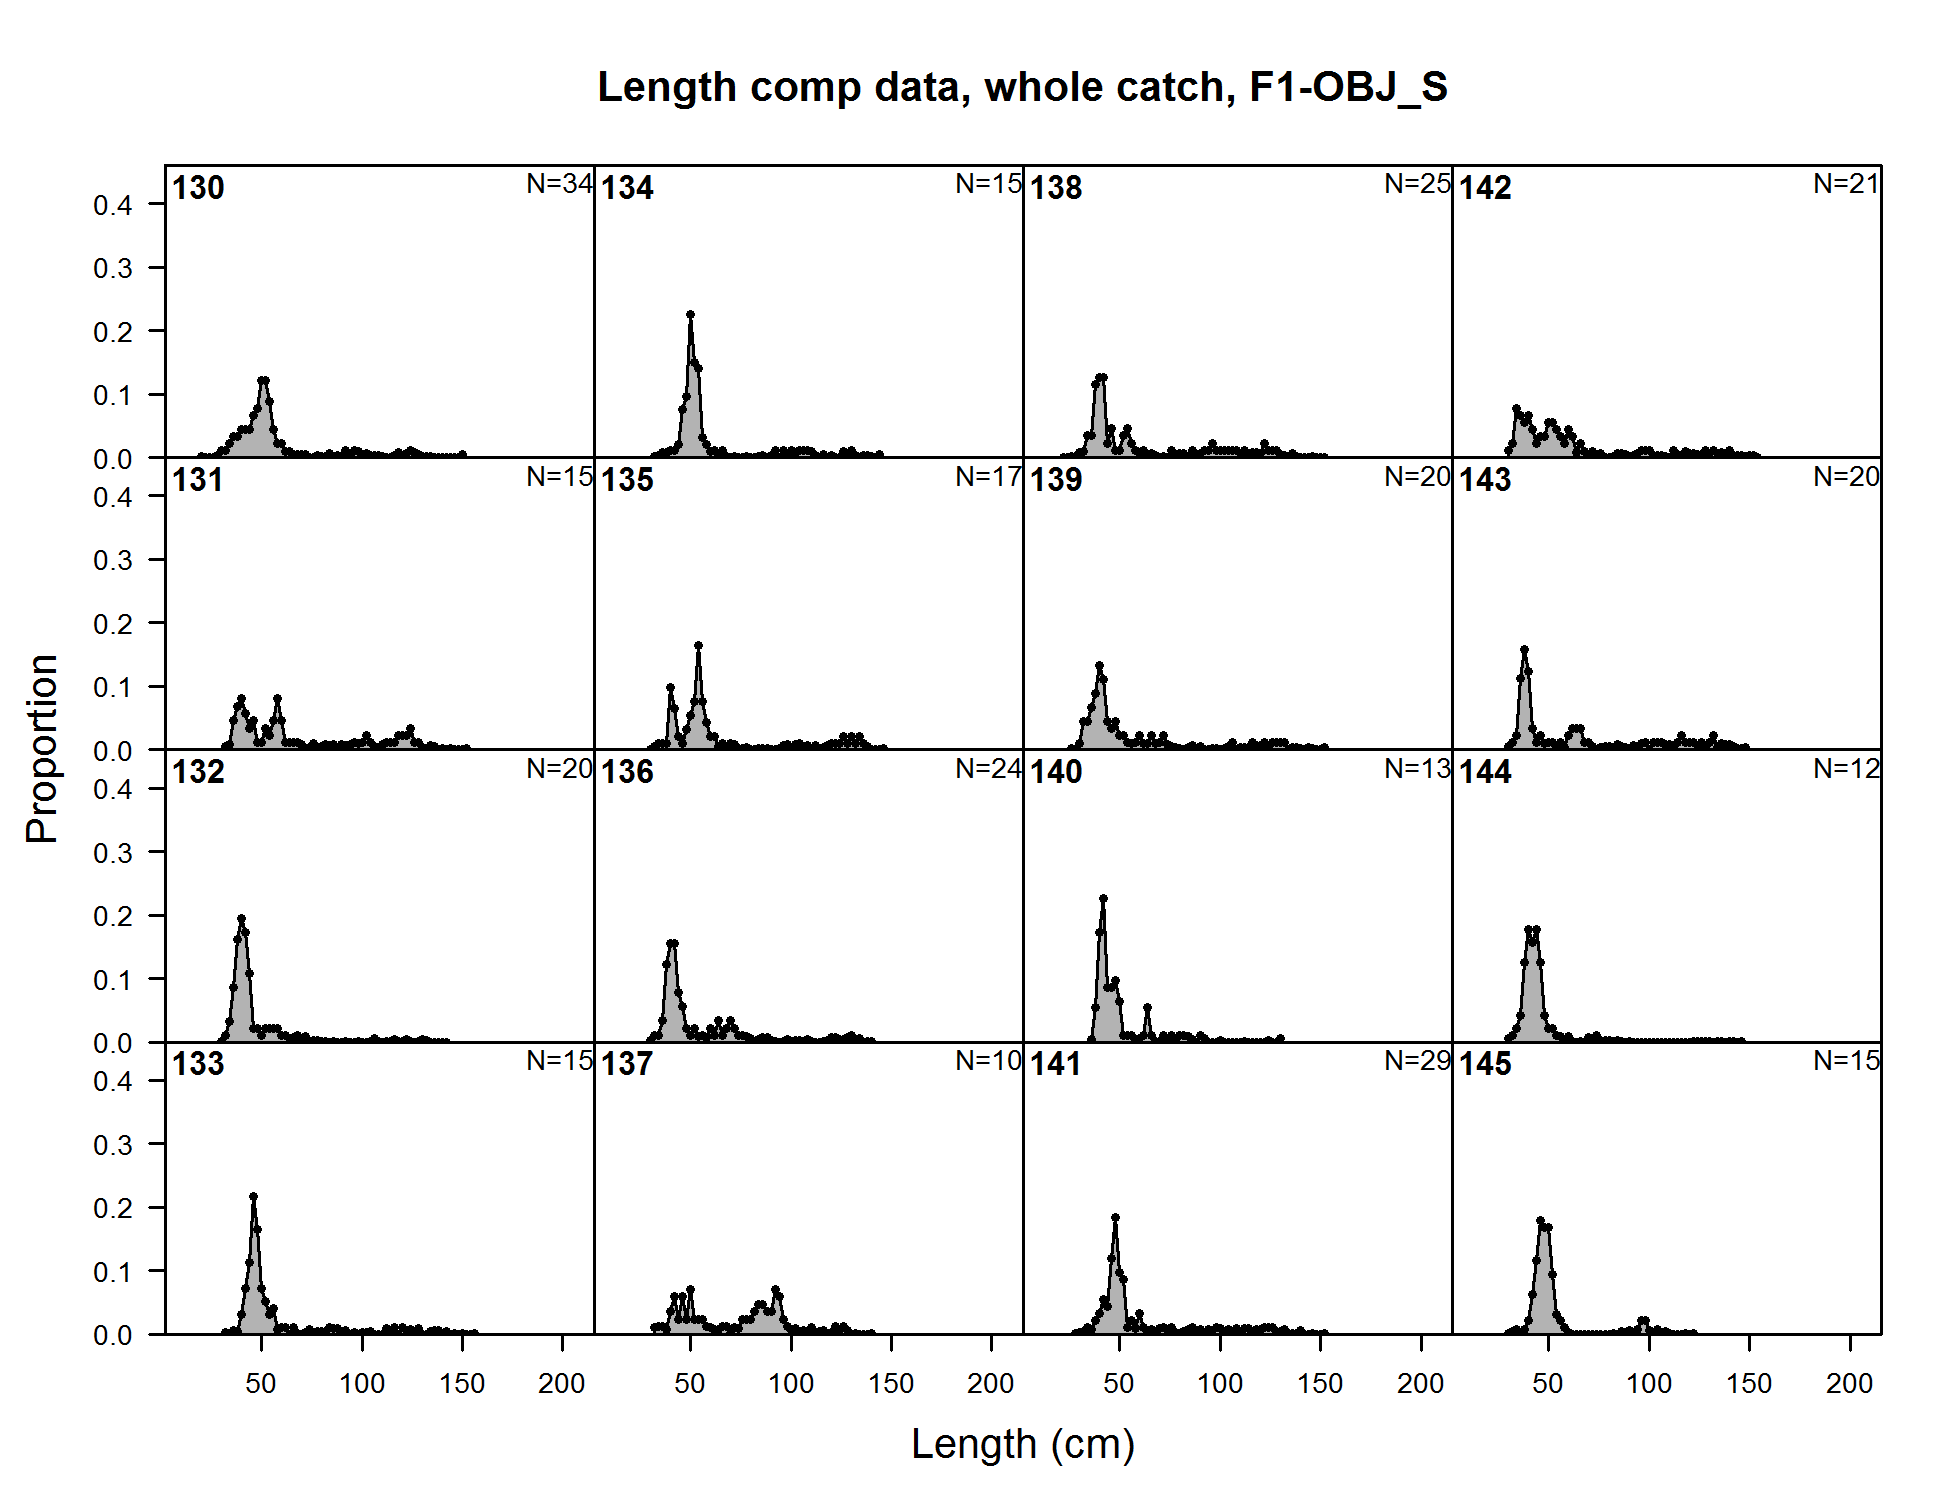
Length comp data, whole catch, F1-OBJ_S (plot 1 of 7)
file: comp_lendat_flt1mkt0_page1.png
Length comp data, whole catch, F1-OBJ_S (plot 1 of 7)
file: comp_lendat_flt1mkt0_page1.png
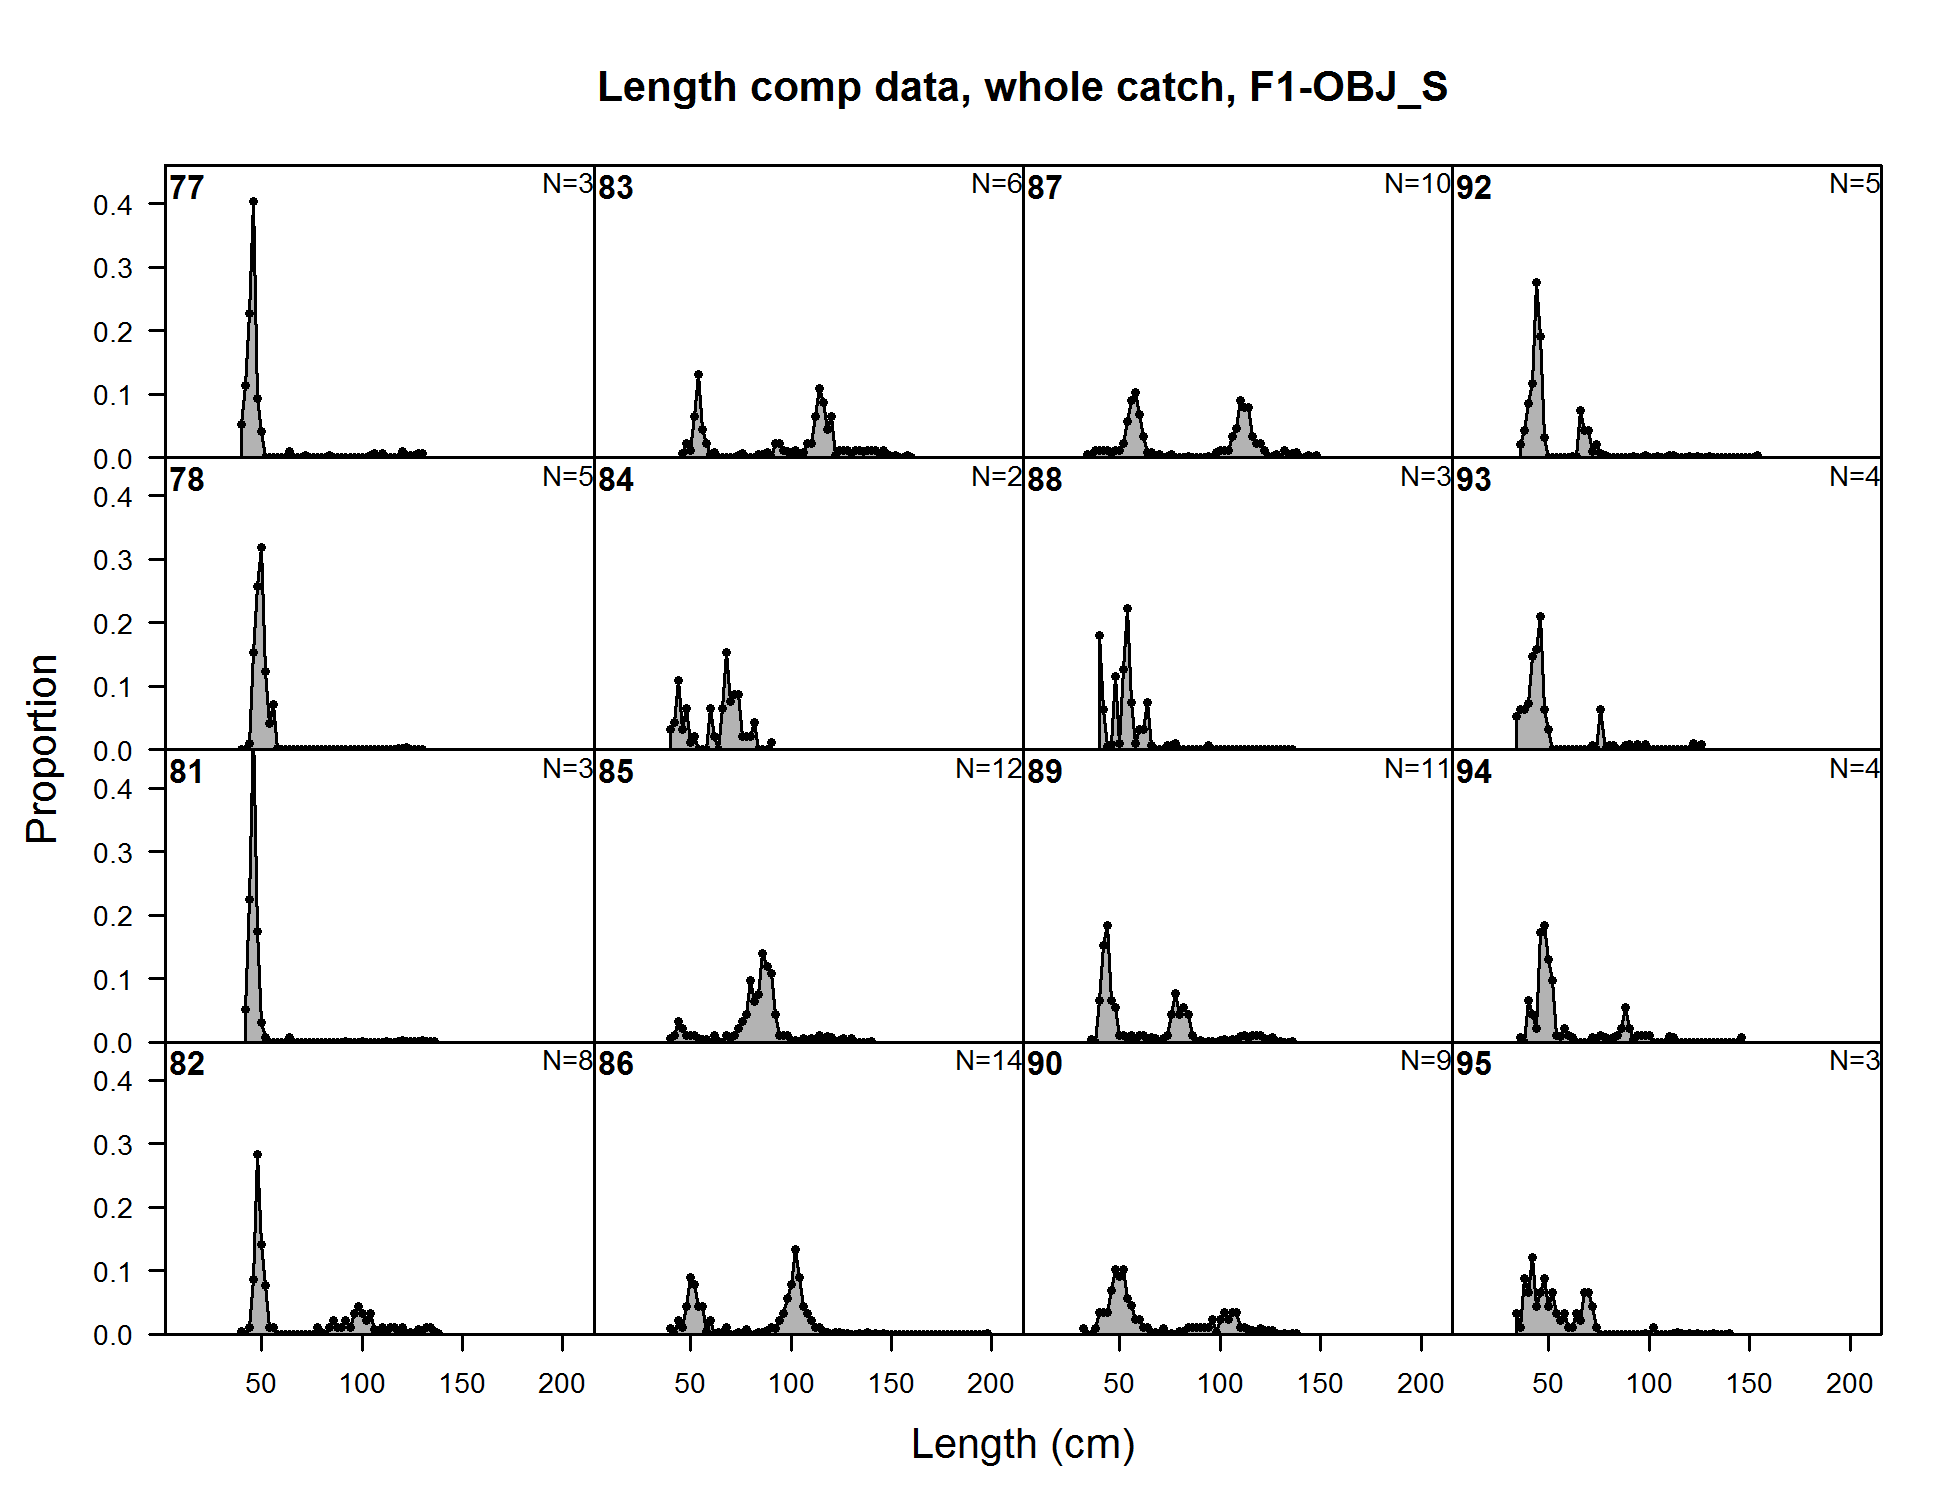
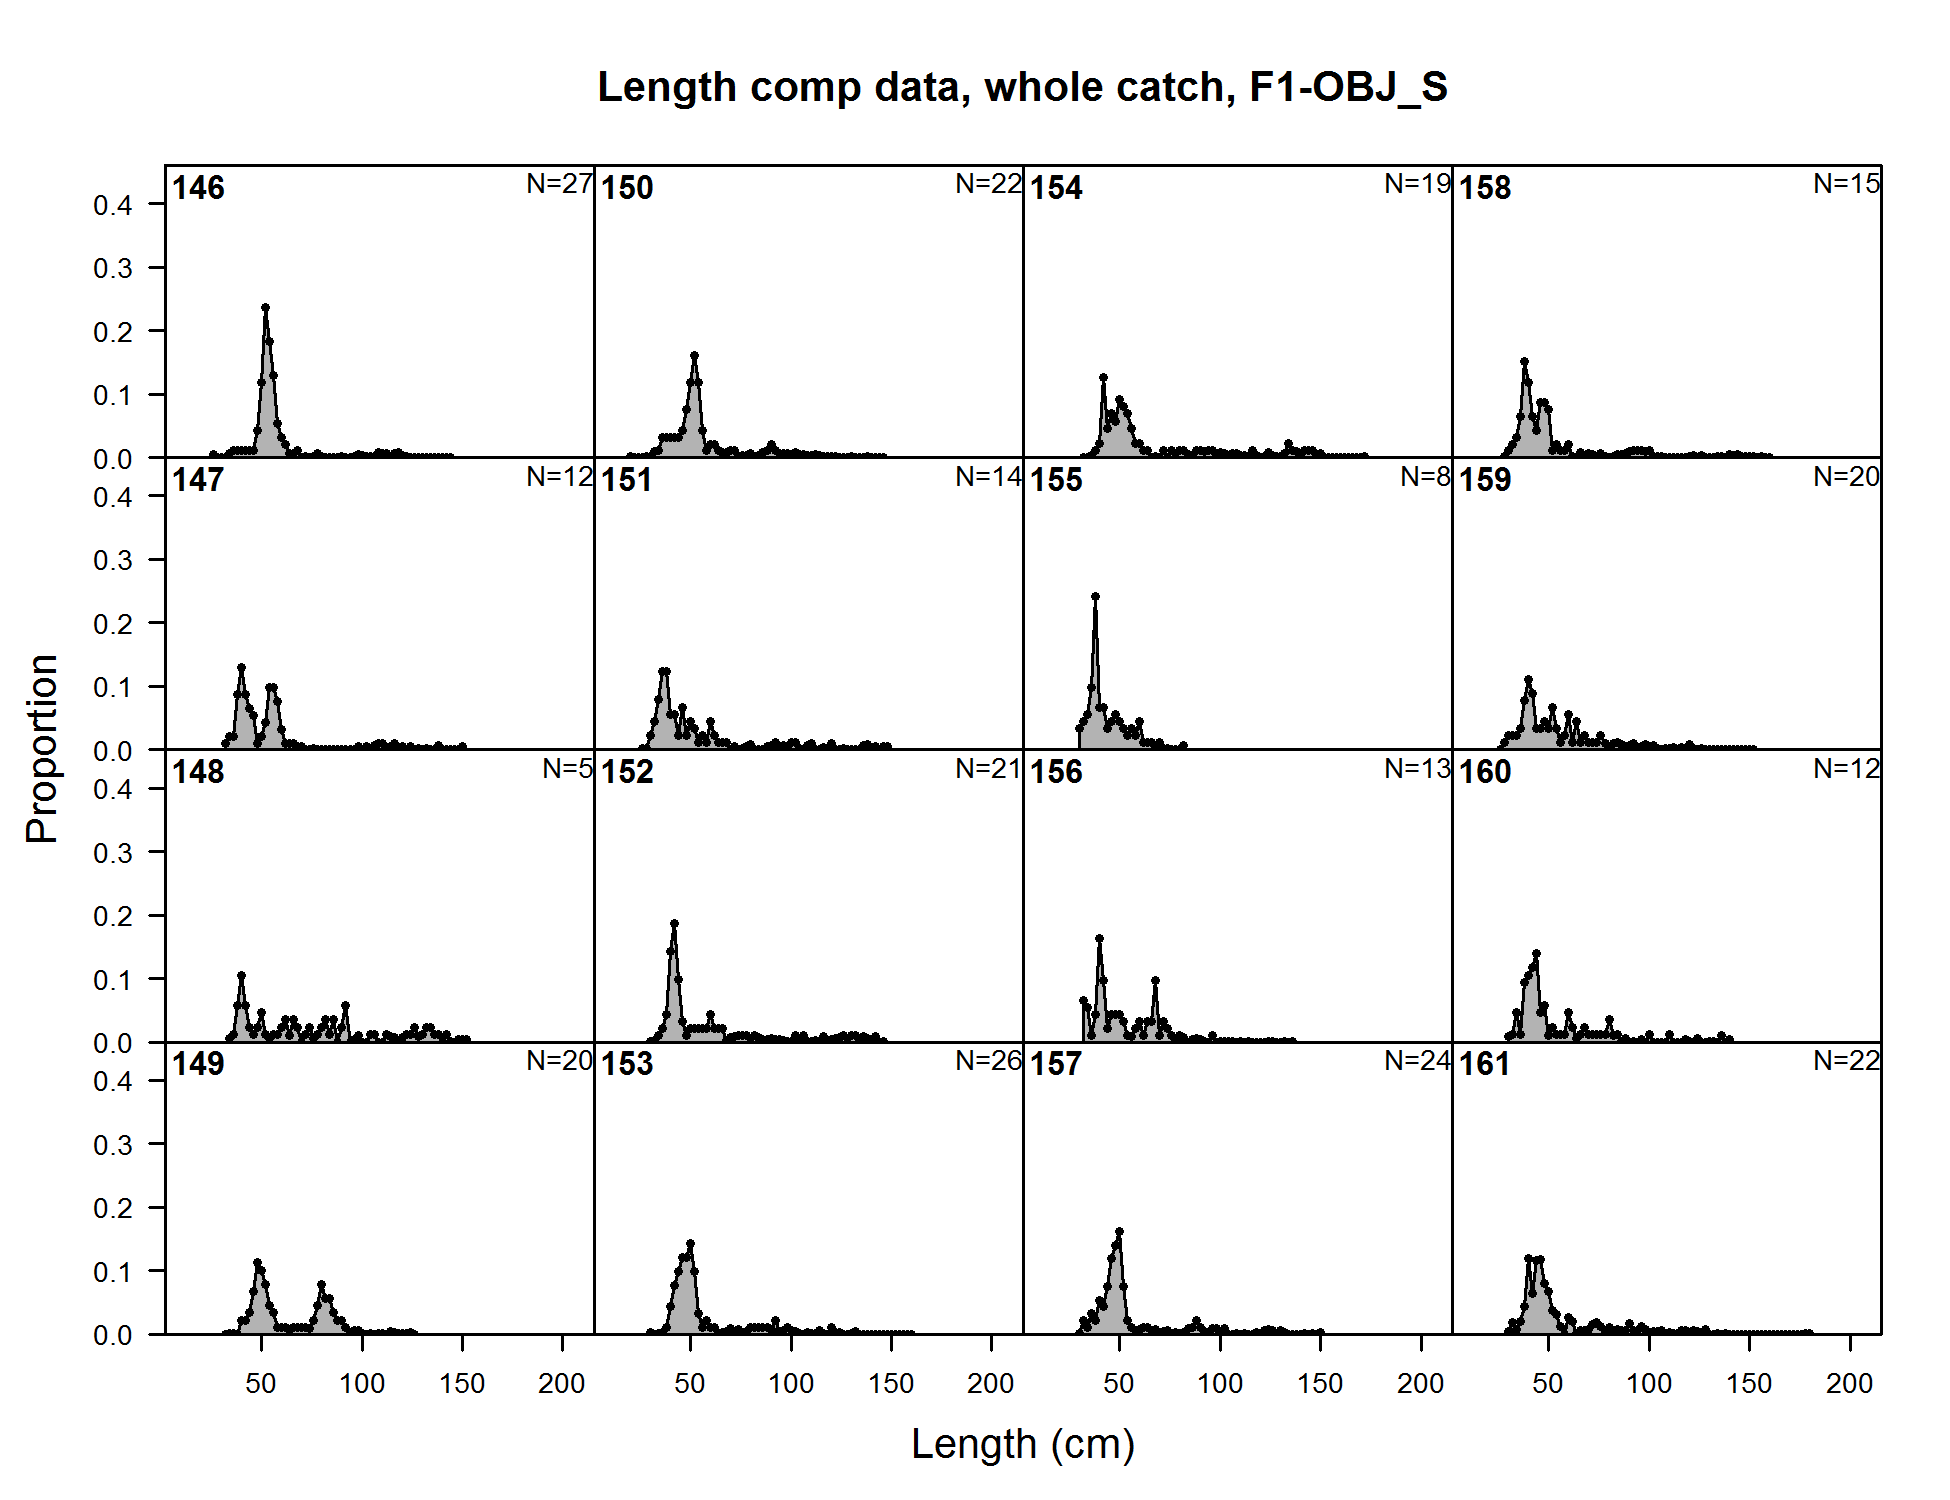
Length comp data, whole catch, F1-OBJ_S (plot 1 of 7) (plot 2 of 7)
file: comp_lendat_flt1mkt0_page2.png
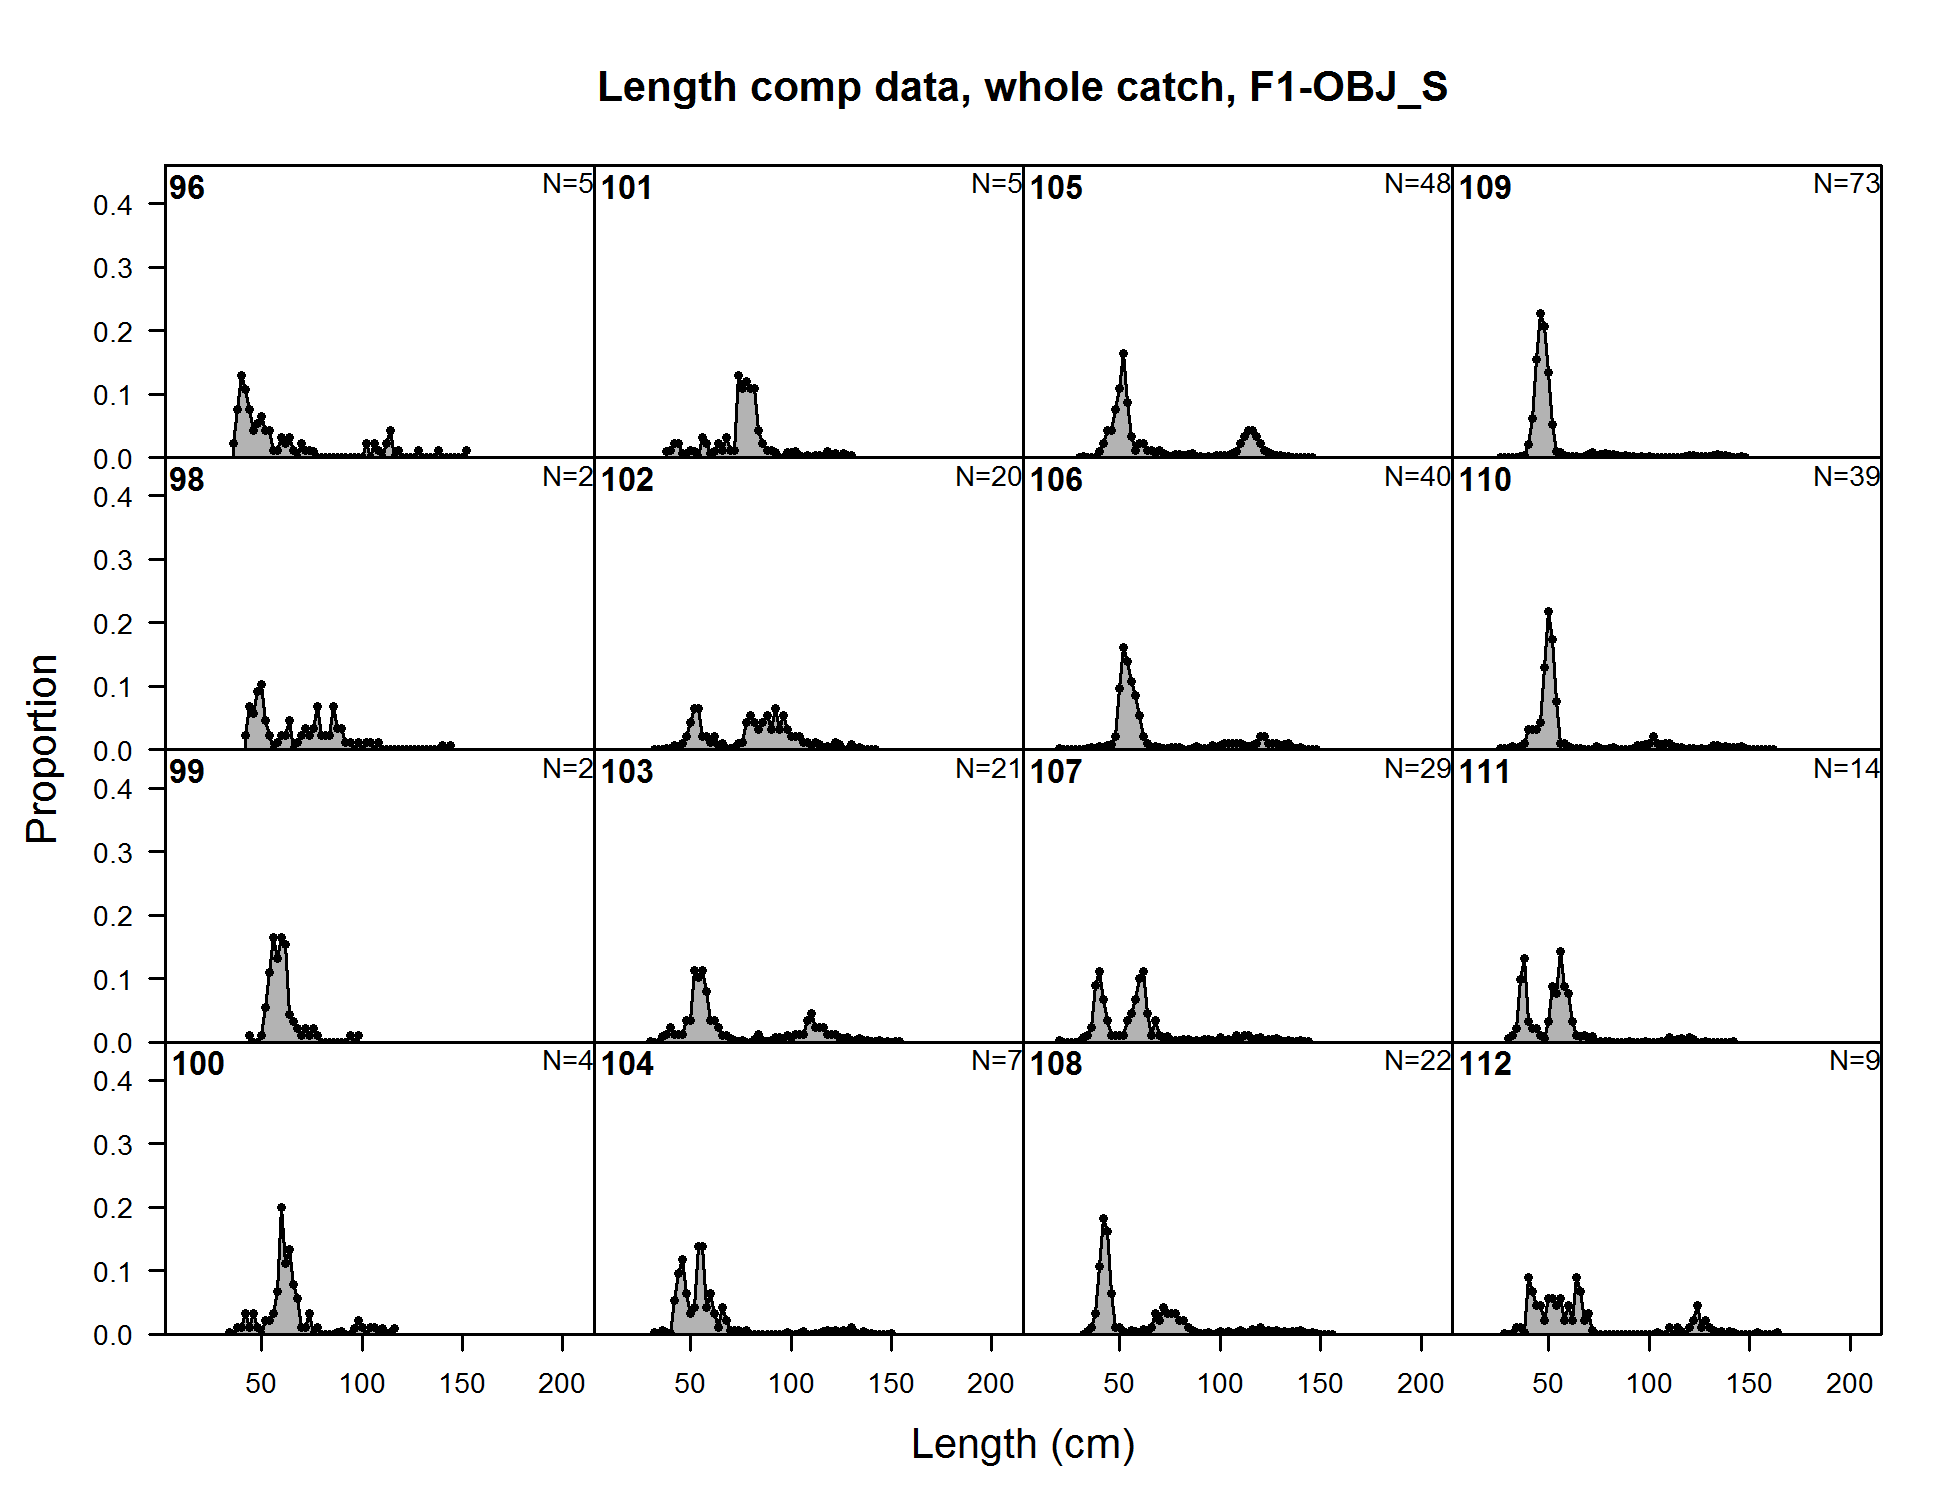
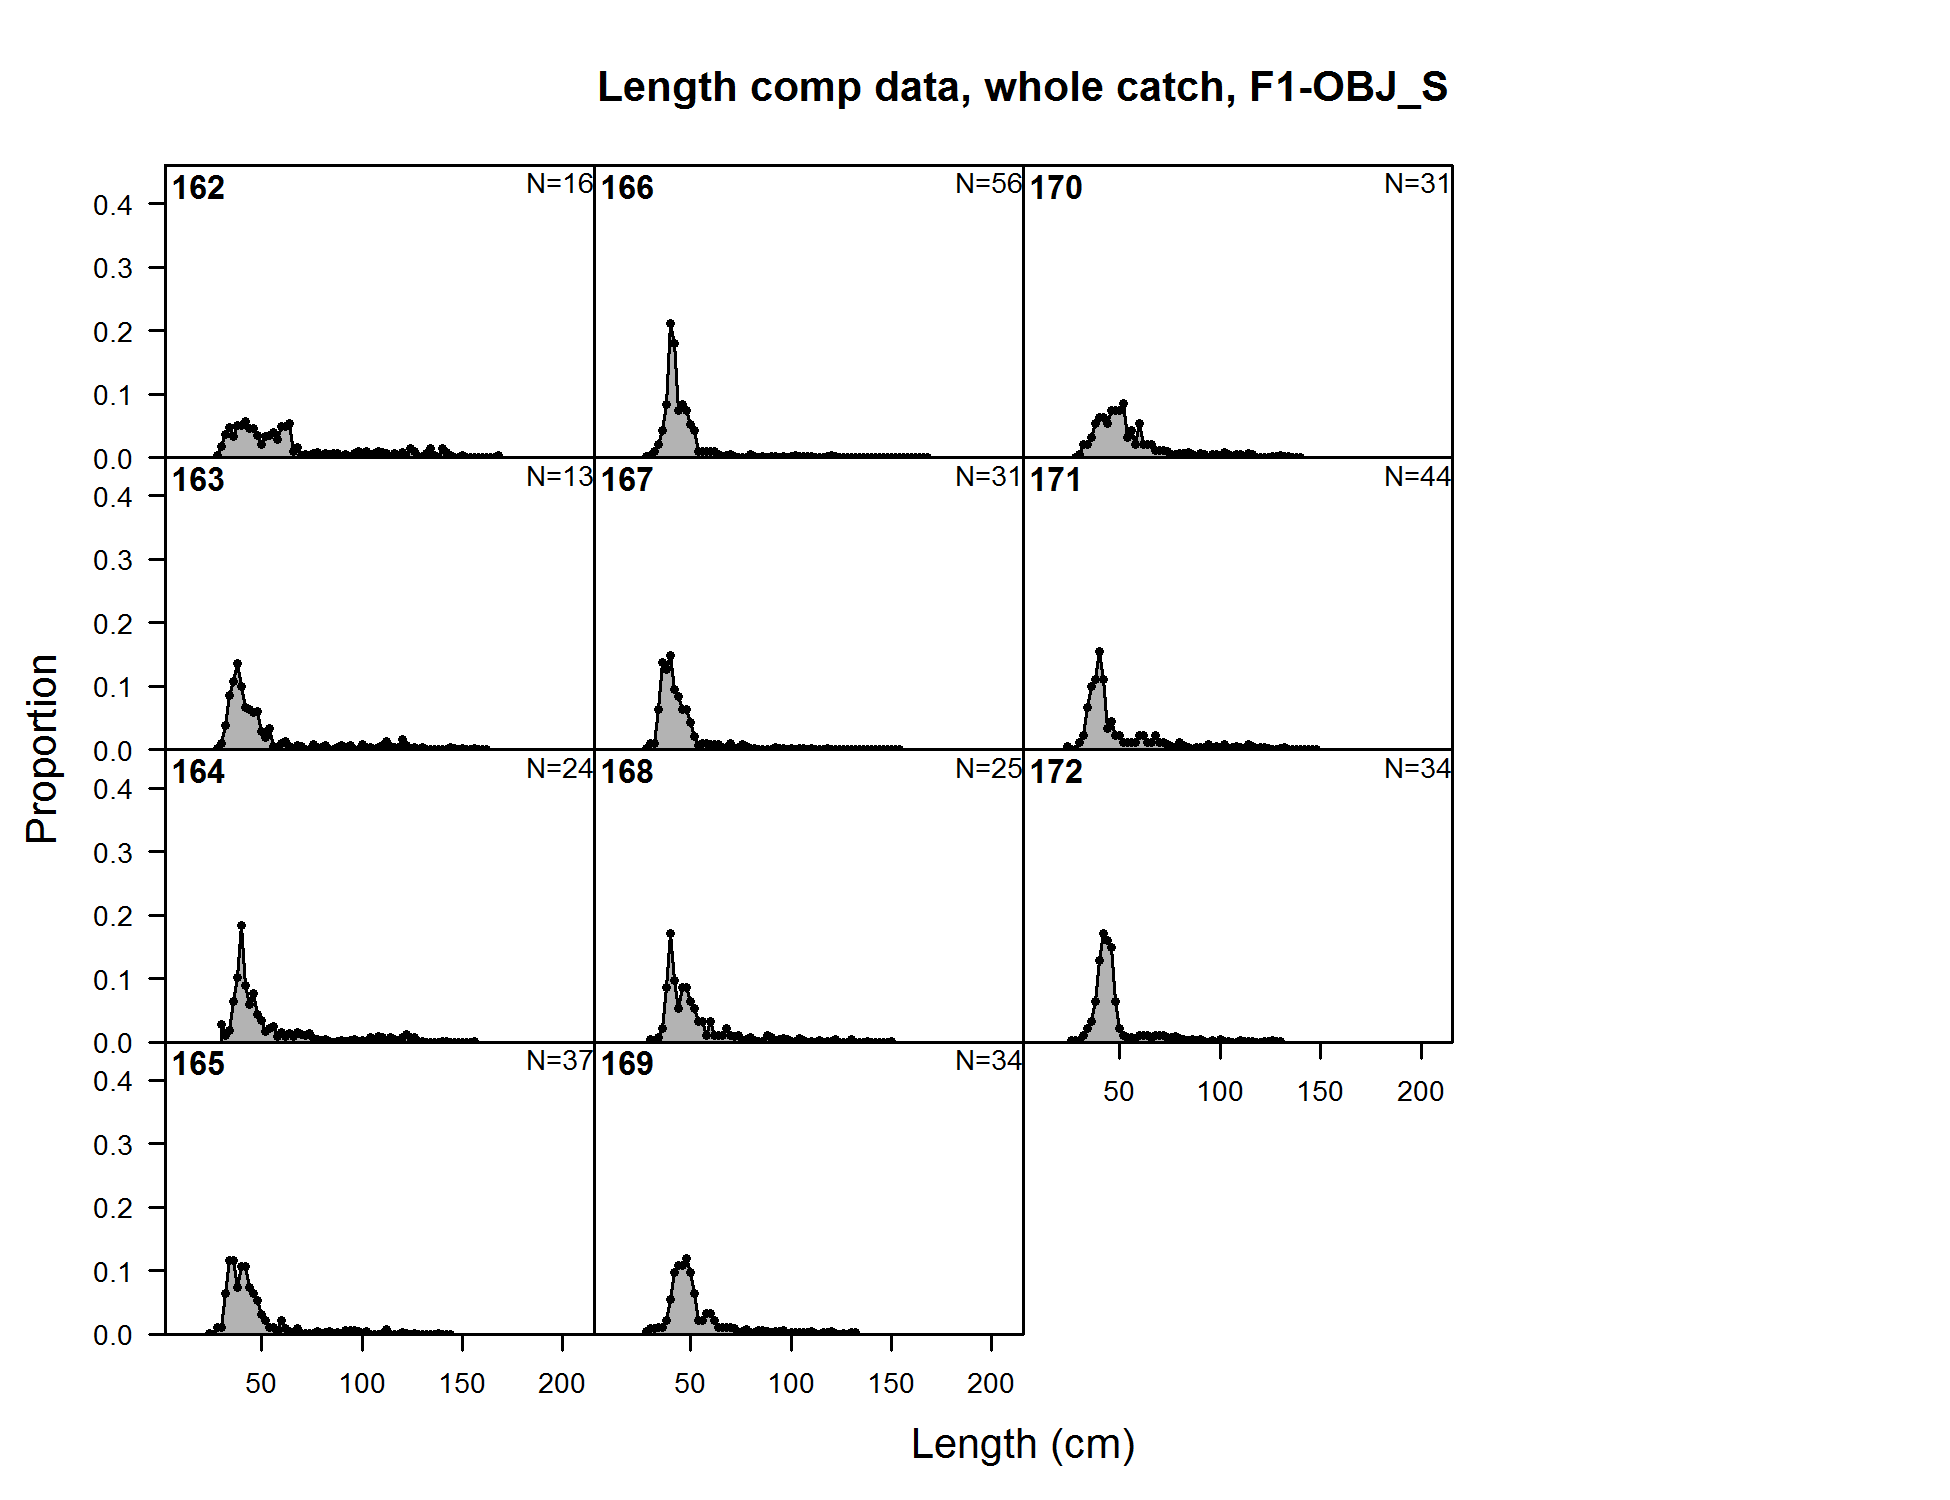
Length comp data, whole catch, F1-OBJ_S (plot 1 of 7) (plot 2 of 7) (plot 3 of 7)
file: comp_lendat_flt1mkt0_page3.png
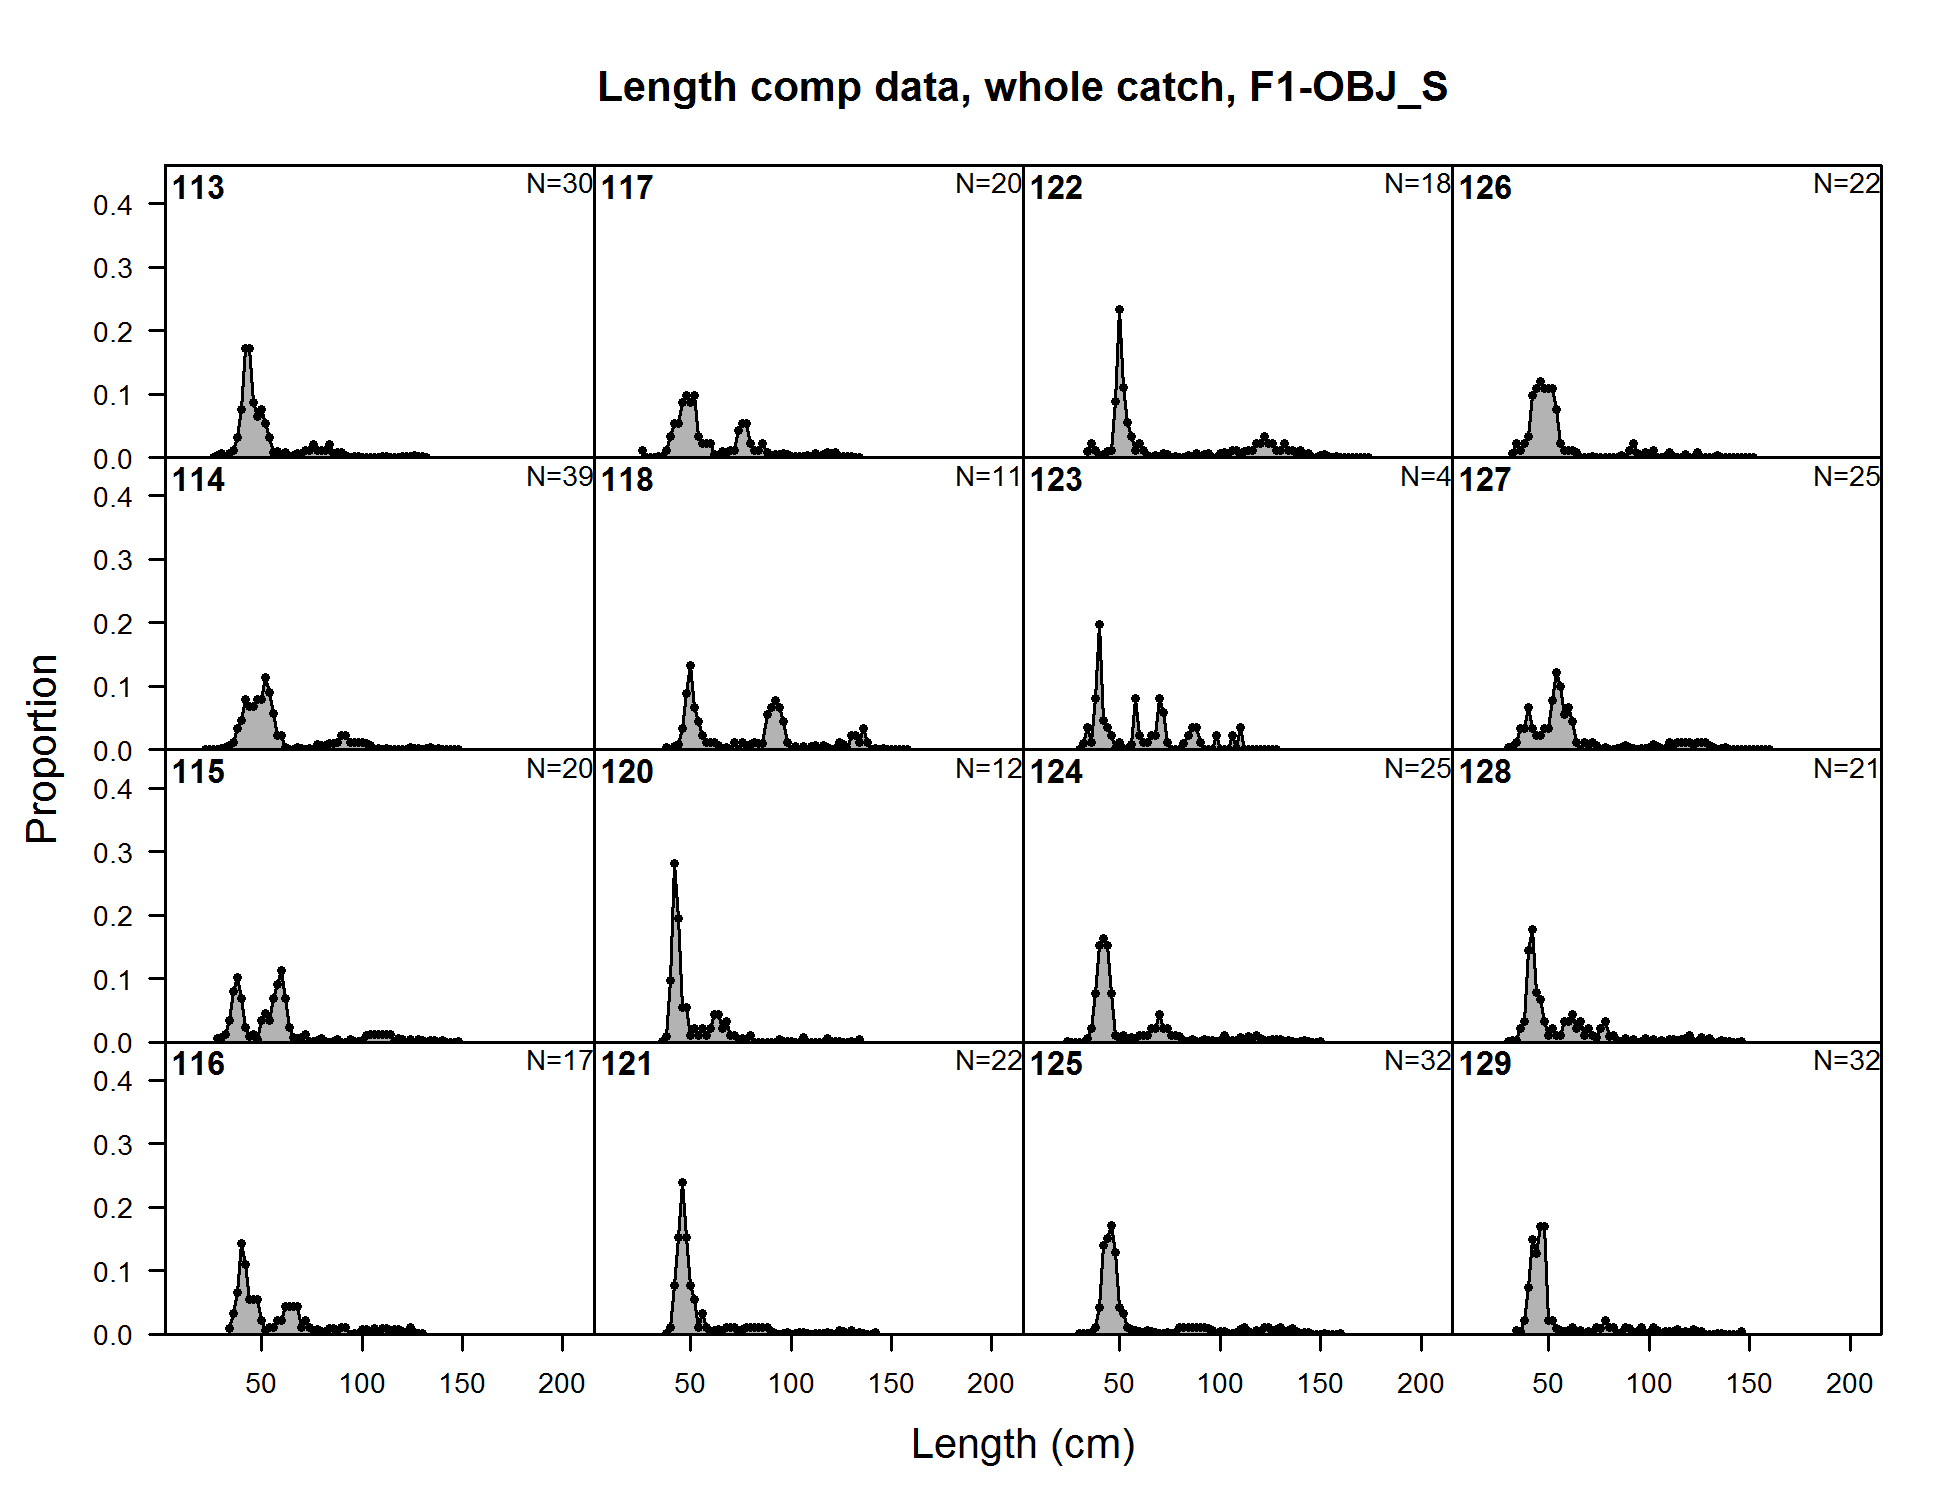
Length comp data, whole catch, F1-OBJ_S (plot 1 of 7) (plot 2 of 7) (plot 3 of 7) (plot 4 of 7)
file: comp_lendat_flt1mkt0_page4.png
Length comp data, whole catch, F1-OBJ_S (plot 1 of 7) (plot 2 of 7) (plot 3 of 7) (plot 4 of 7) (plot 5 of 7)
file: comp_lendat_flt1mkt0_page5.png
Length comp data, whole catch, F1-OBJ_S (plot 1 of 7) (plot 2 of 7) (plot 3 of 7) (plot 4 of 7) (plot 5 of 7) (plot 6 of 7)
file: comp_lendat_flt1mkt0_page6.png
Length comp data, whole catch, F1-OBJ_S (plot 1 of 7) (plot 2 of 7) (plot 3 of 7) (plot 4 of 7) (plot 5 of 7) (plot 6 of 7) (plot 7 of 7)
file: comp_lendat_flt1mkt0_page7.png
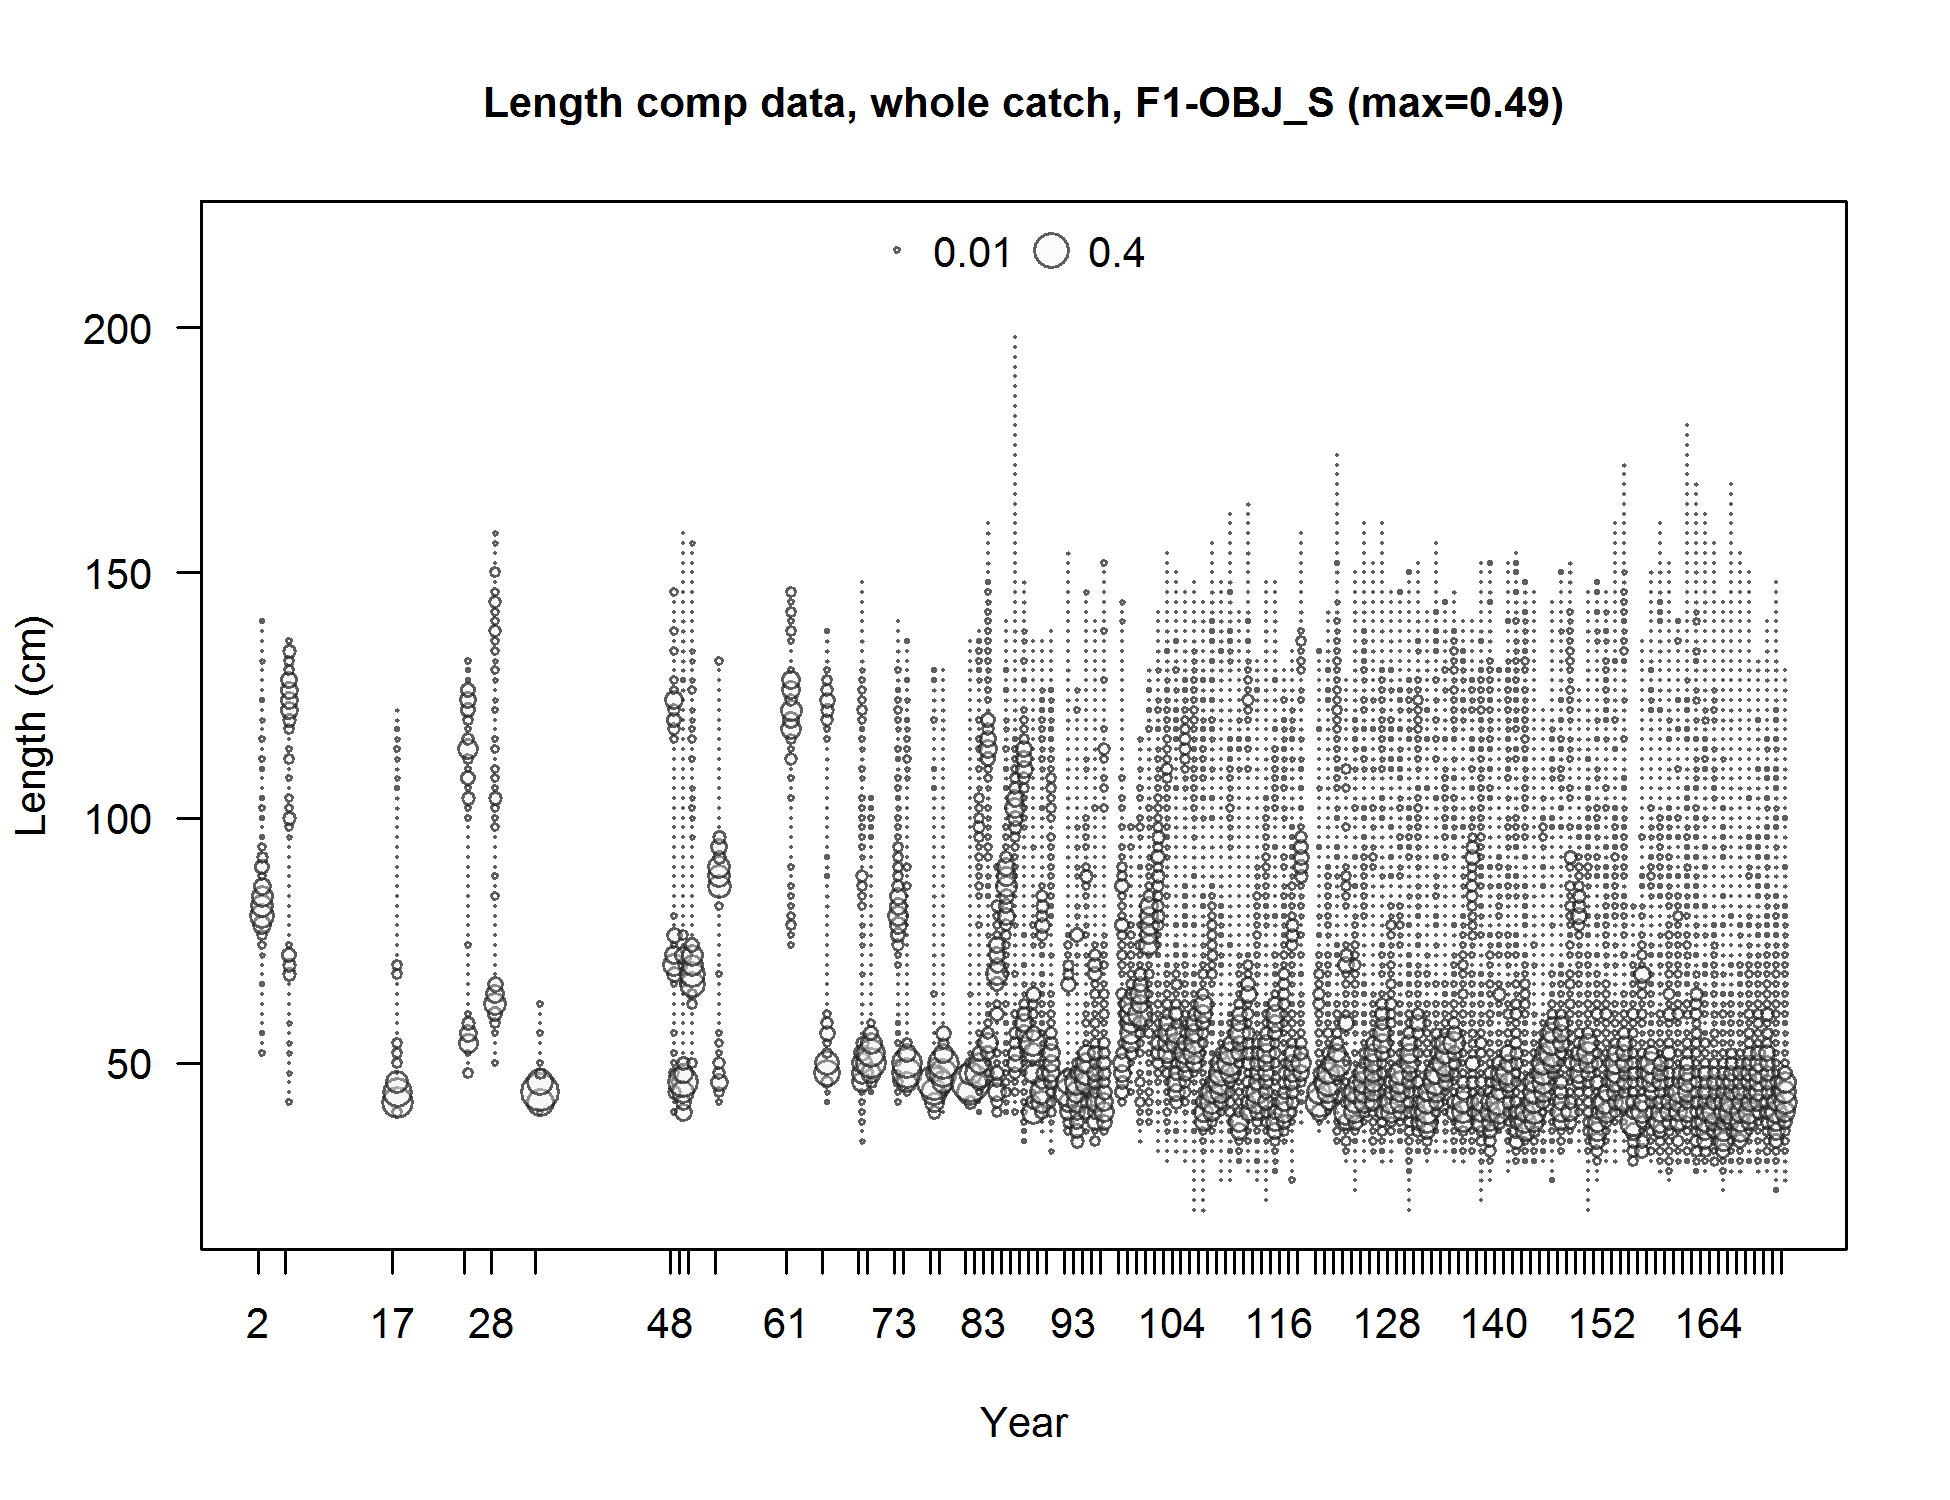
Length comp data, whole catch, F1-OBJ_S (max=0.49) (plot 7 of 7)
file: comp_lendat_bubflt1mkt0_page7.png
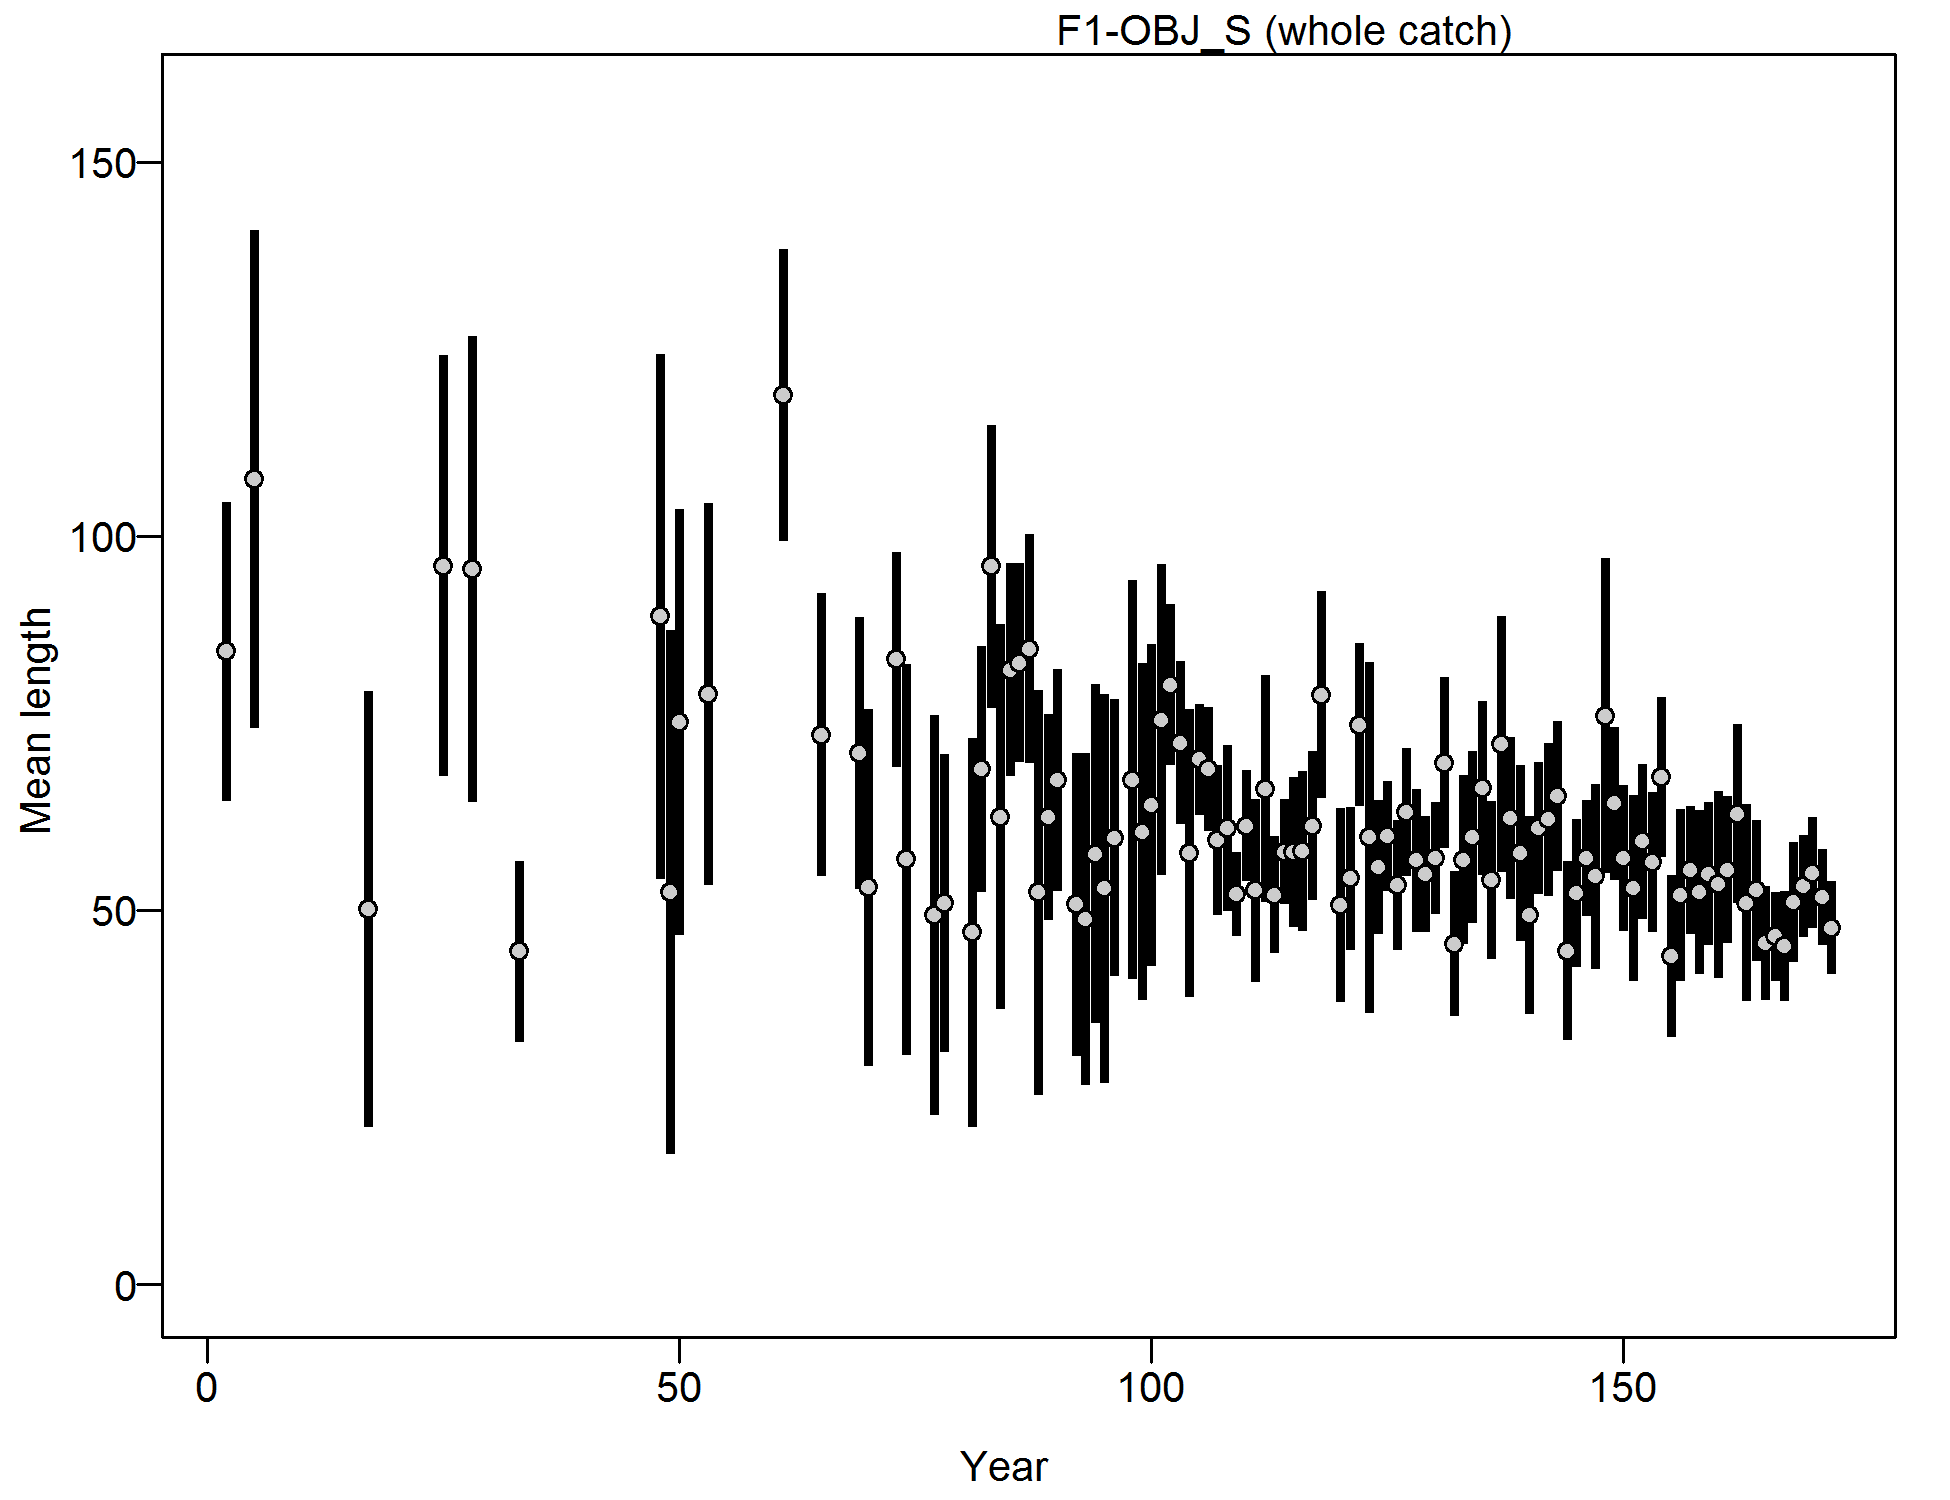
Mean length for F1-OBJ_S with 95% confidence intervals based on current samples sizes.
file: comp_lendat_data_weighting_TA1.8_F1-OBJ_S.png
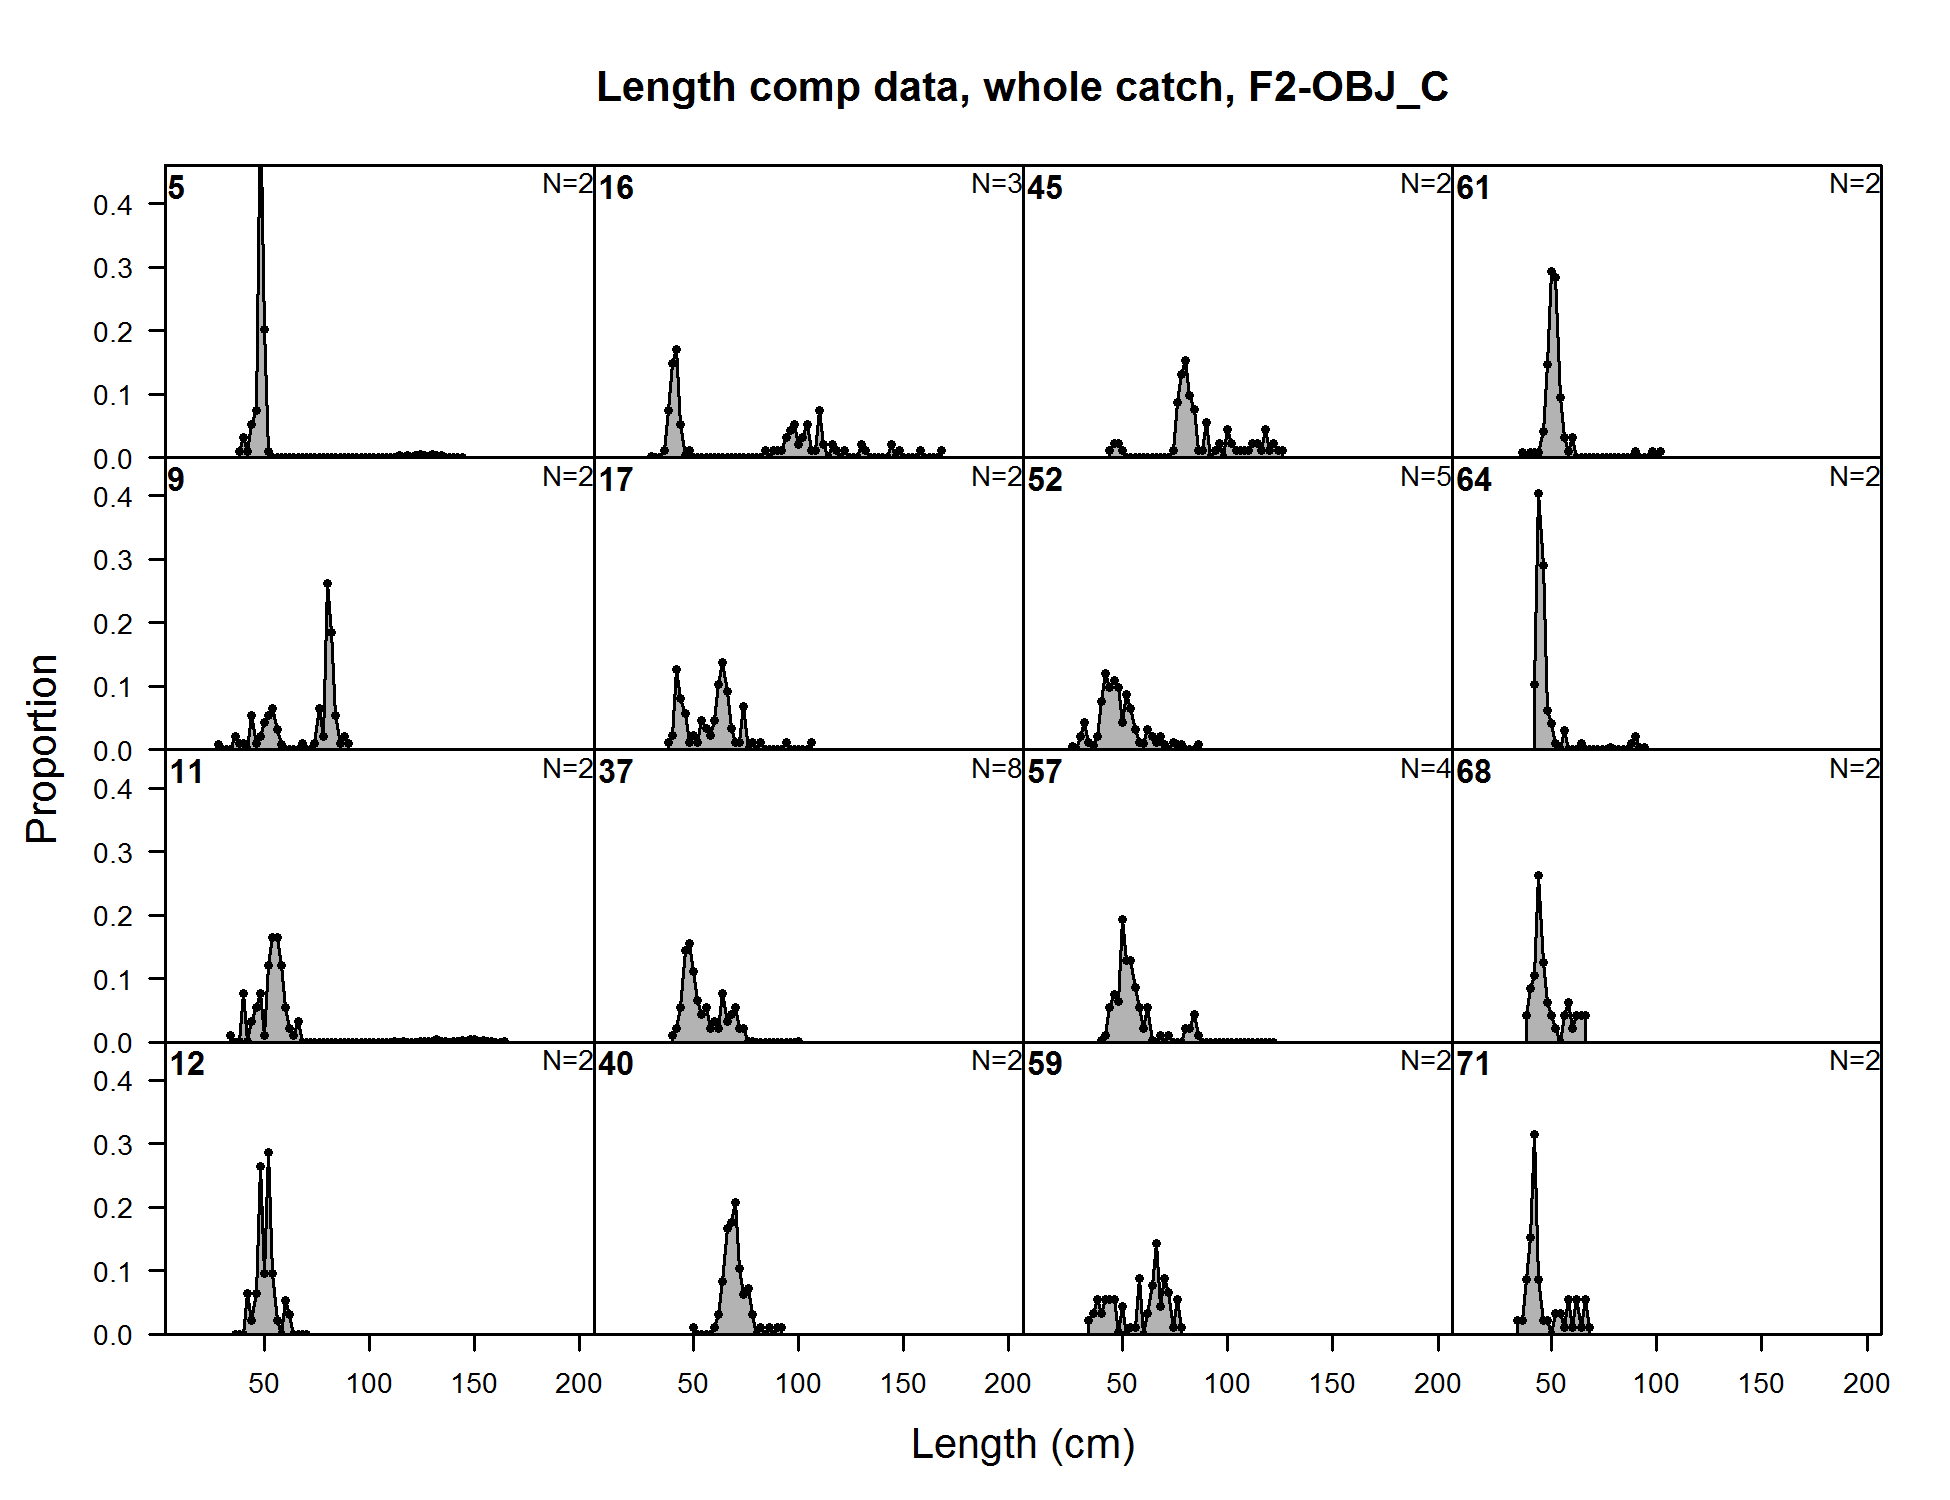
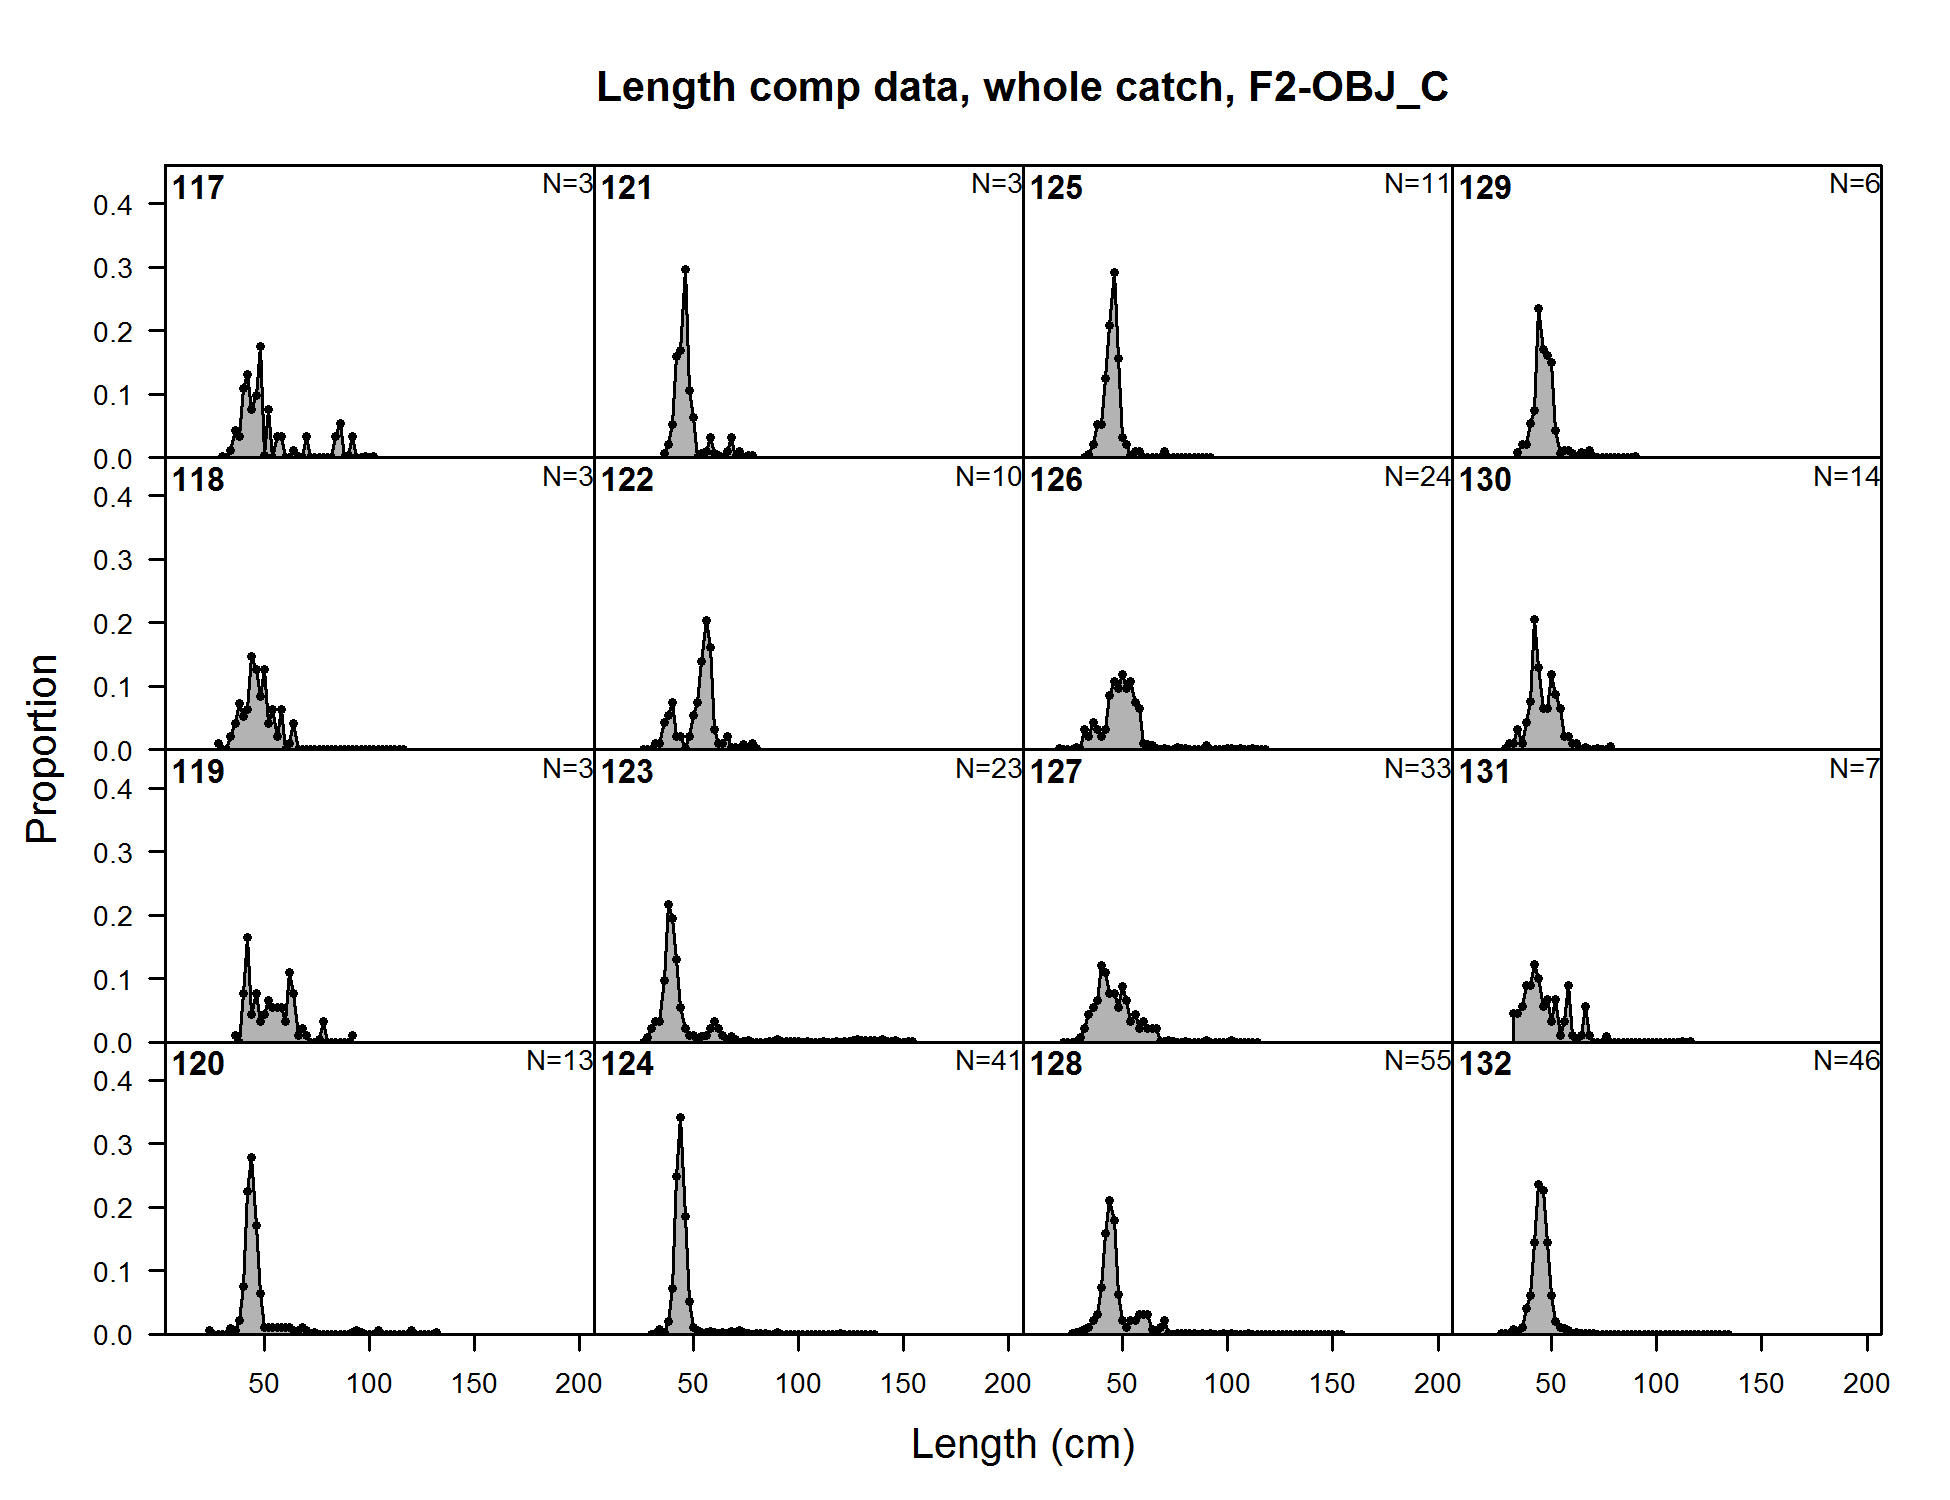
Length comp data, whole catch, F2-OBJ_C (plot 1 of 7)
file: comp_lendat_flt2mkt0_page1.png
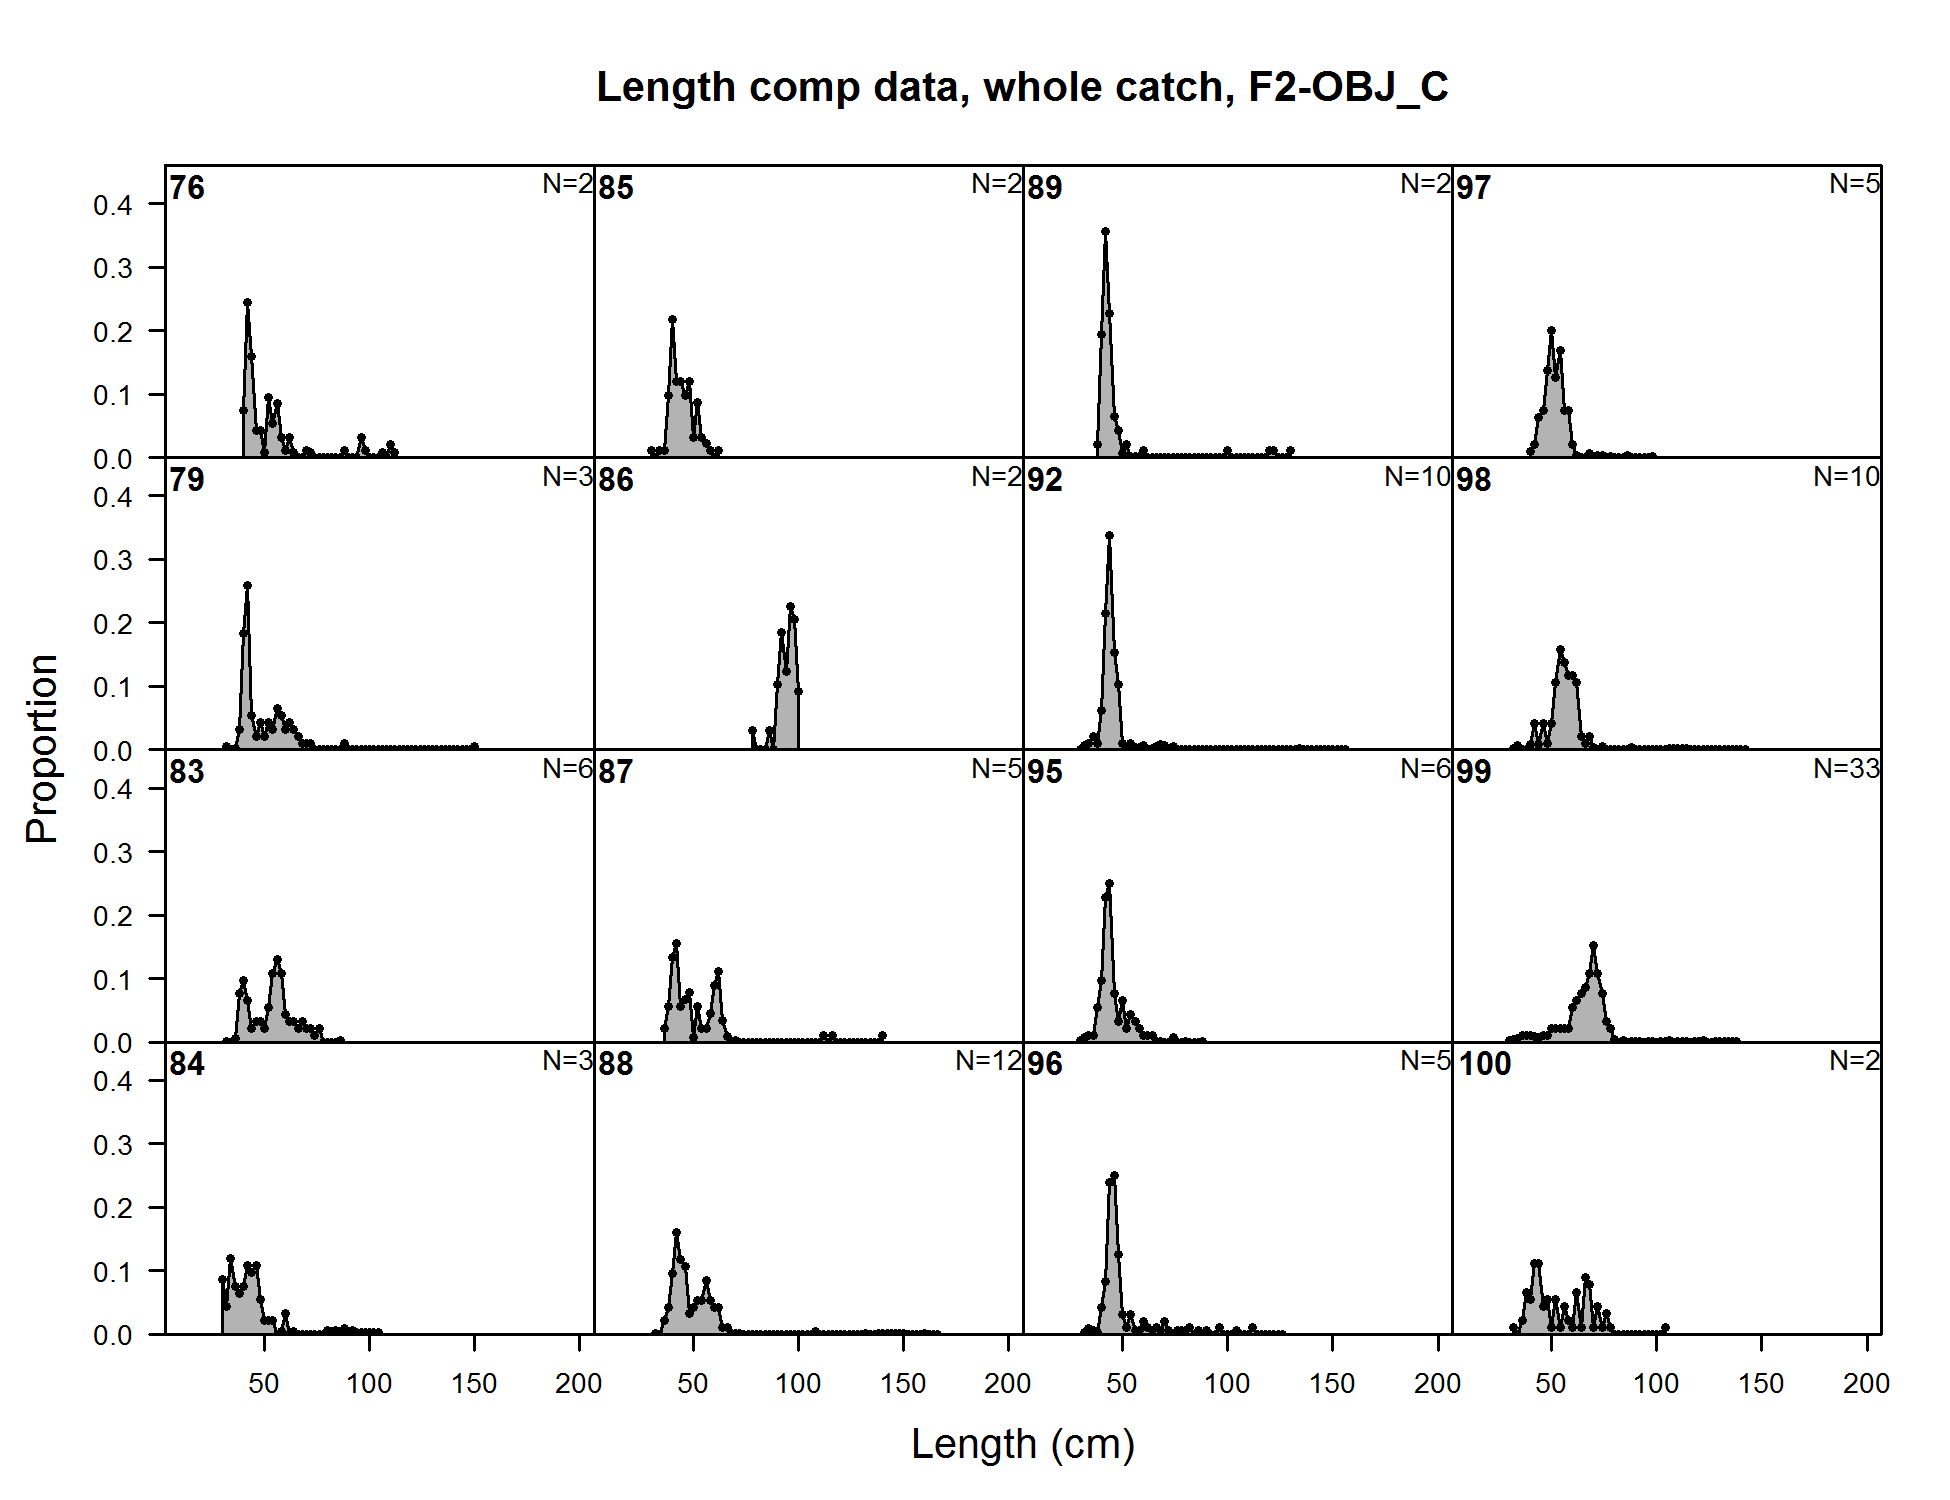
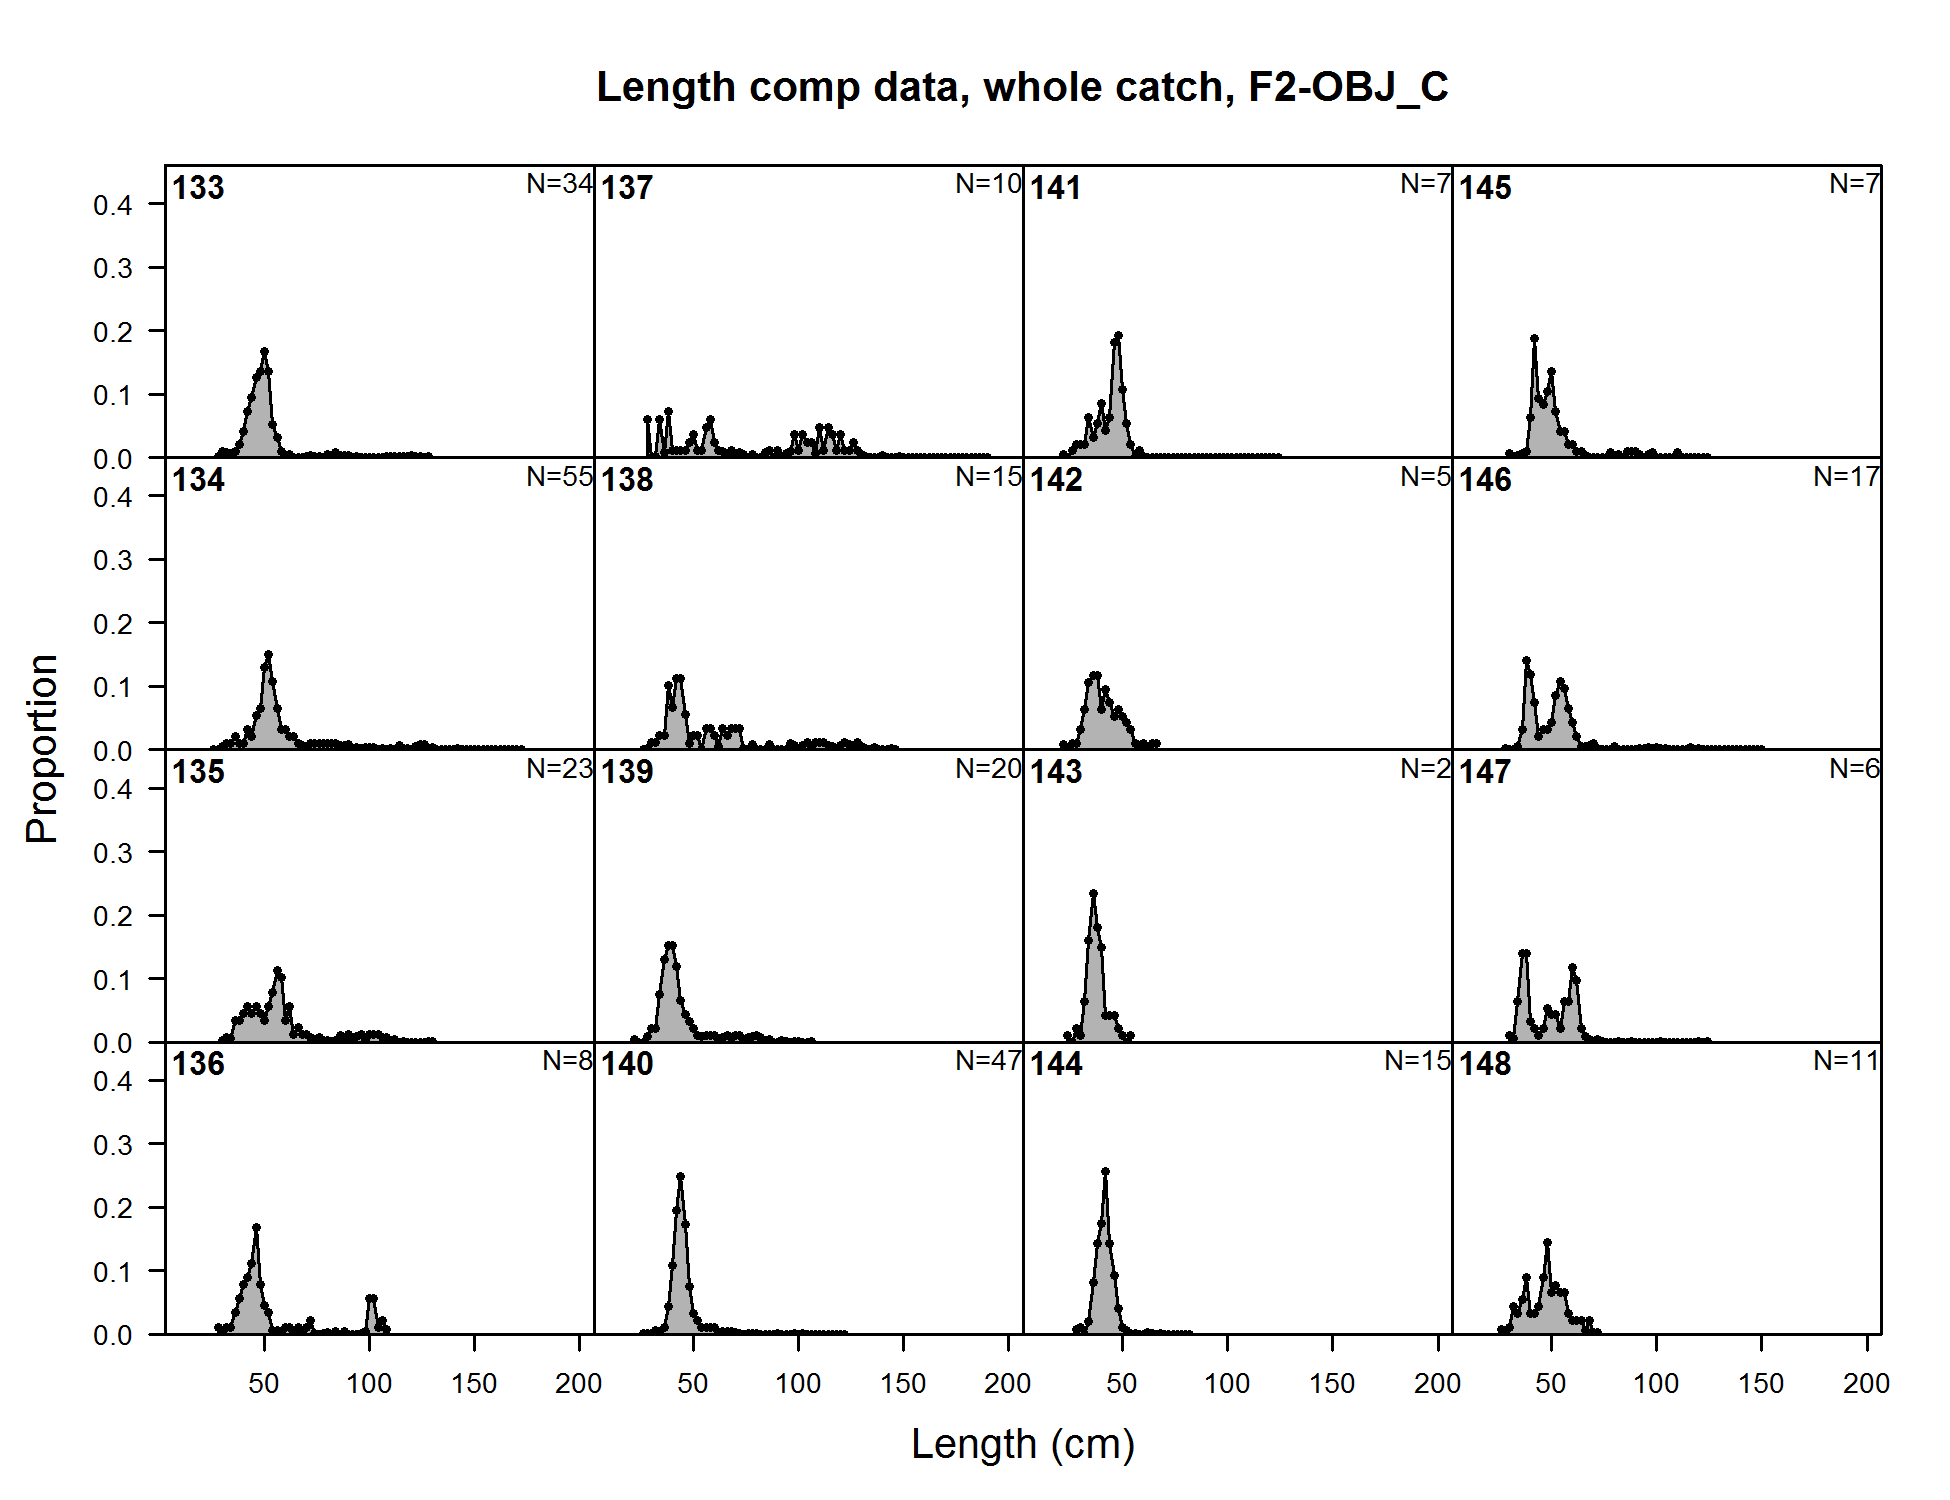
Length comp data, whole catch, F2-OBJ_C (plot 1 of 7) (plot 2 of 7)
file: comp_lendat_flt2mkt0_page2.png
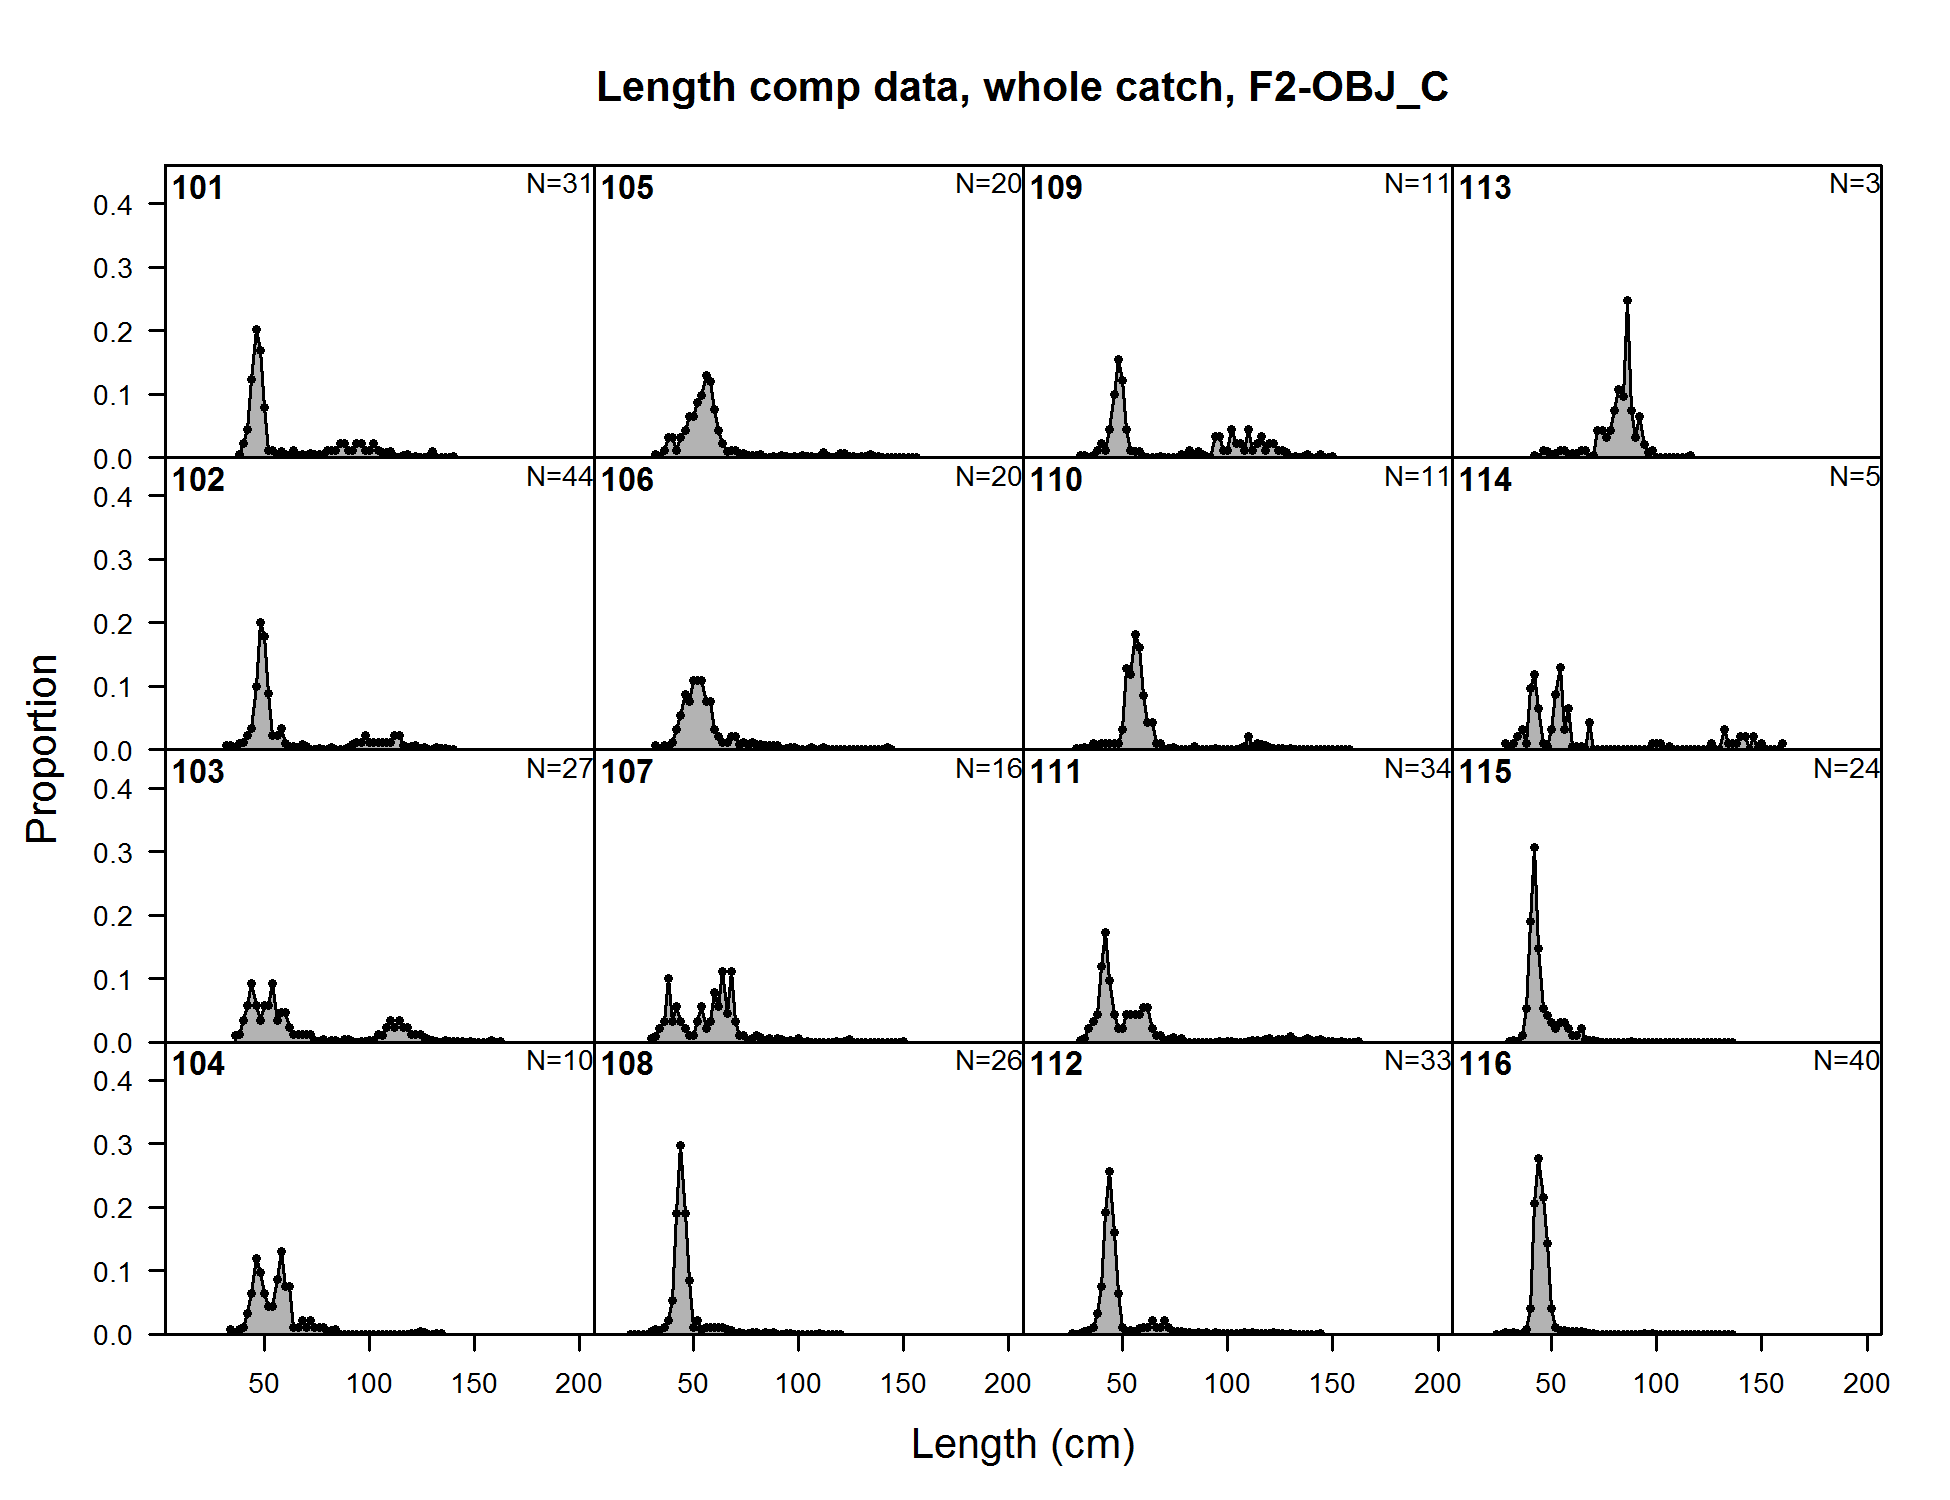
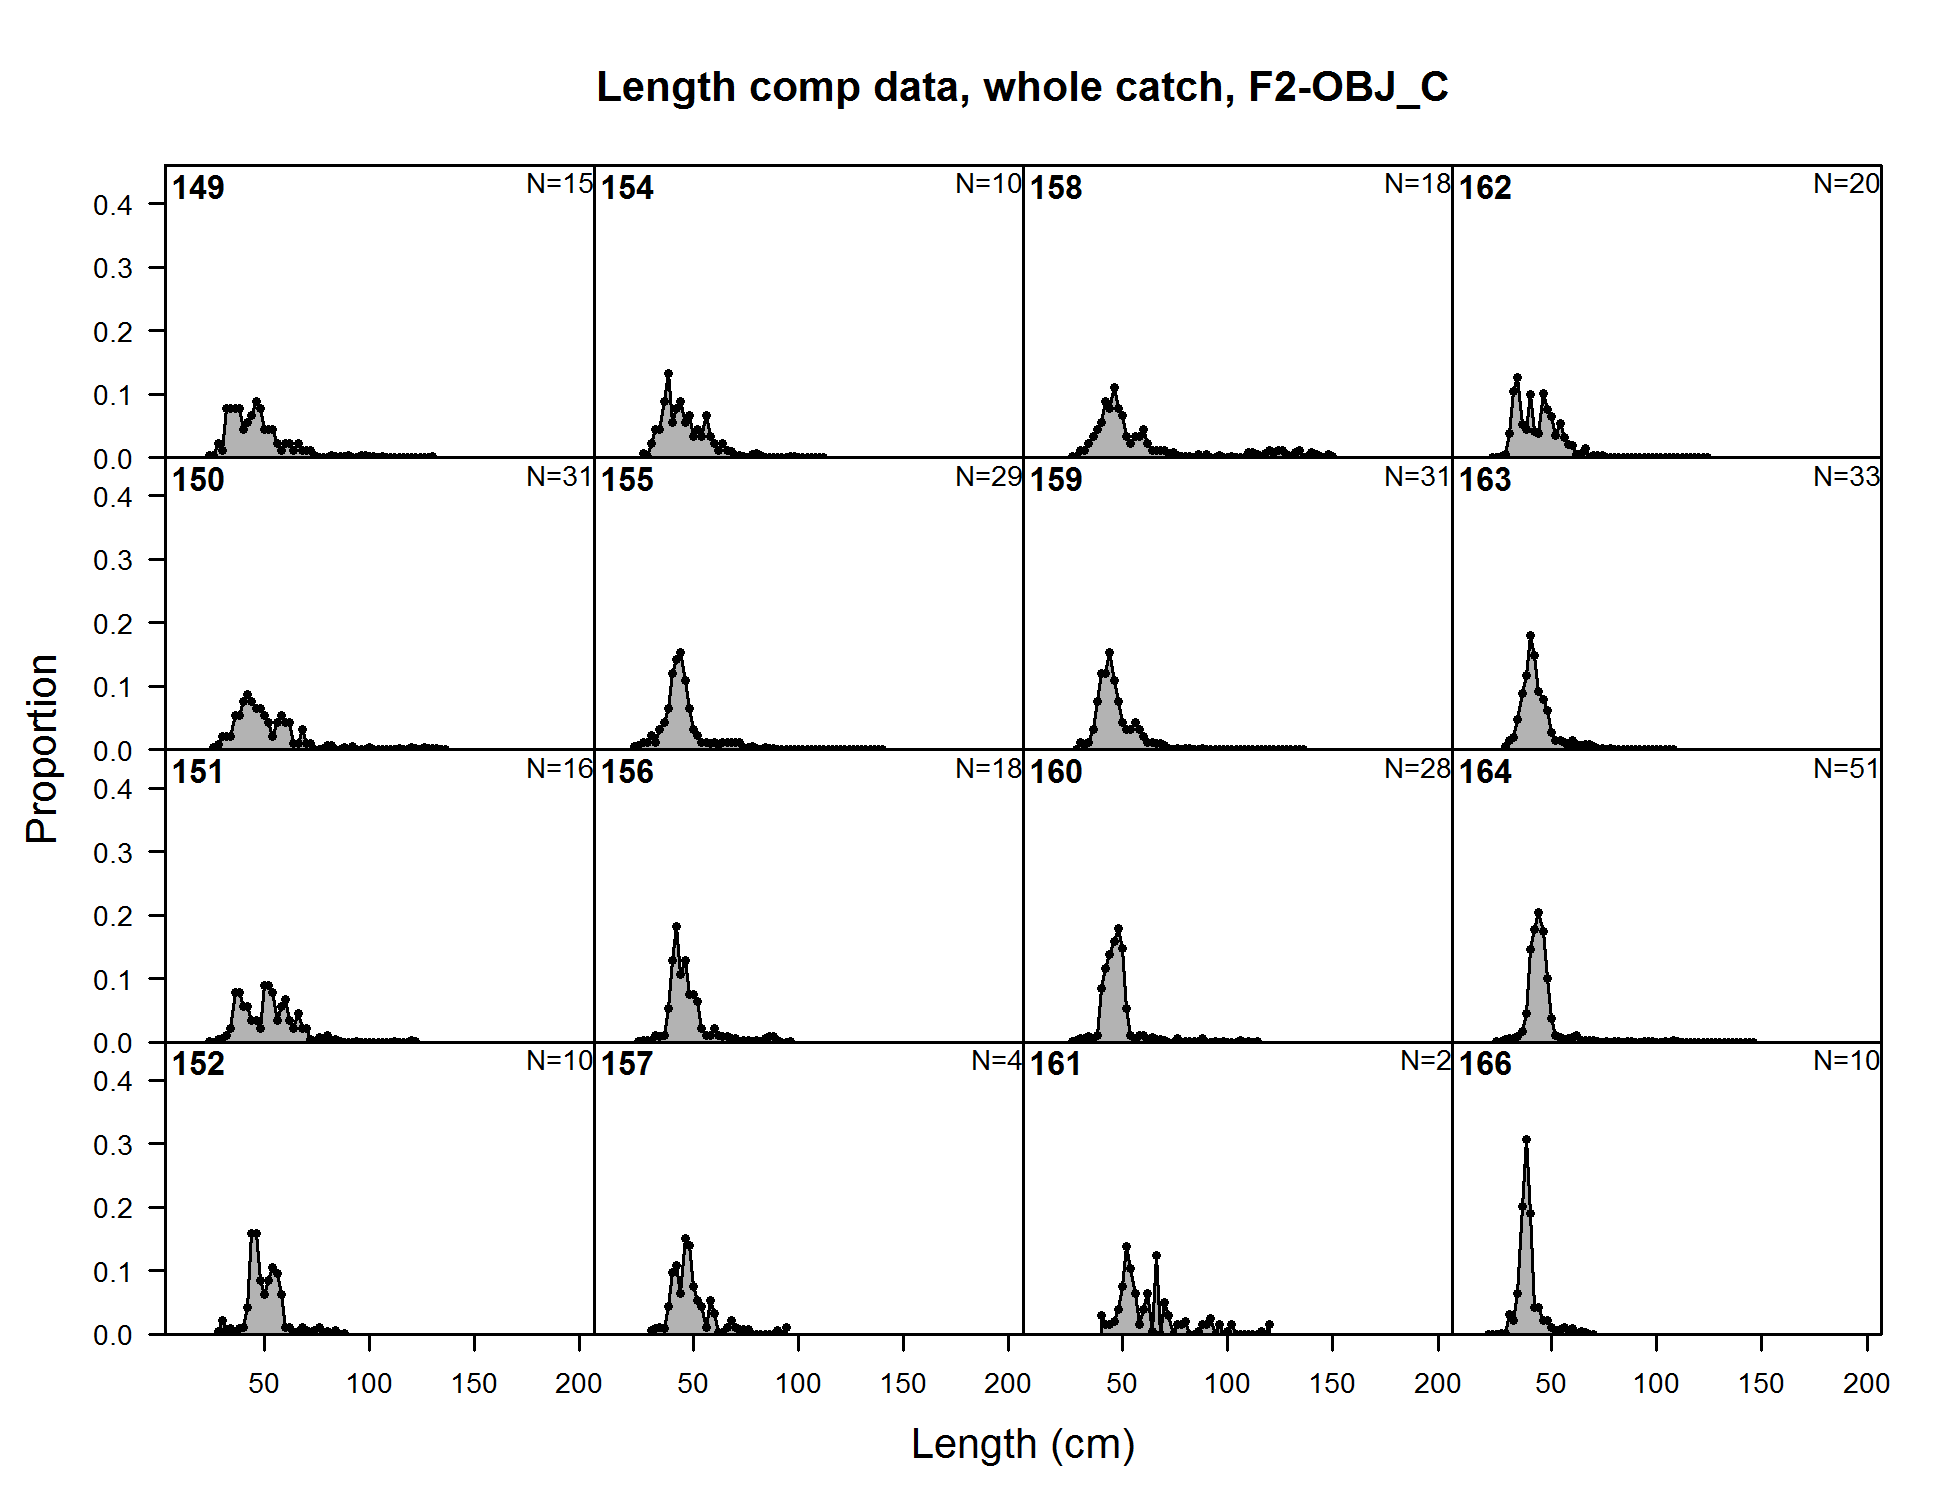
Length comp data, whole catch, F2-OBJ_C (plot 1 of 7) (plot 2 of 7) (plot 3 of 7)
file: comp_lendat_flt2mkt0_page3.png
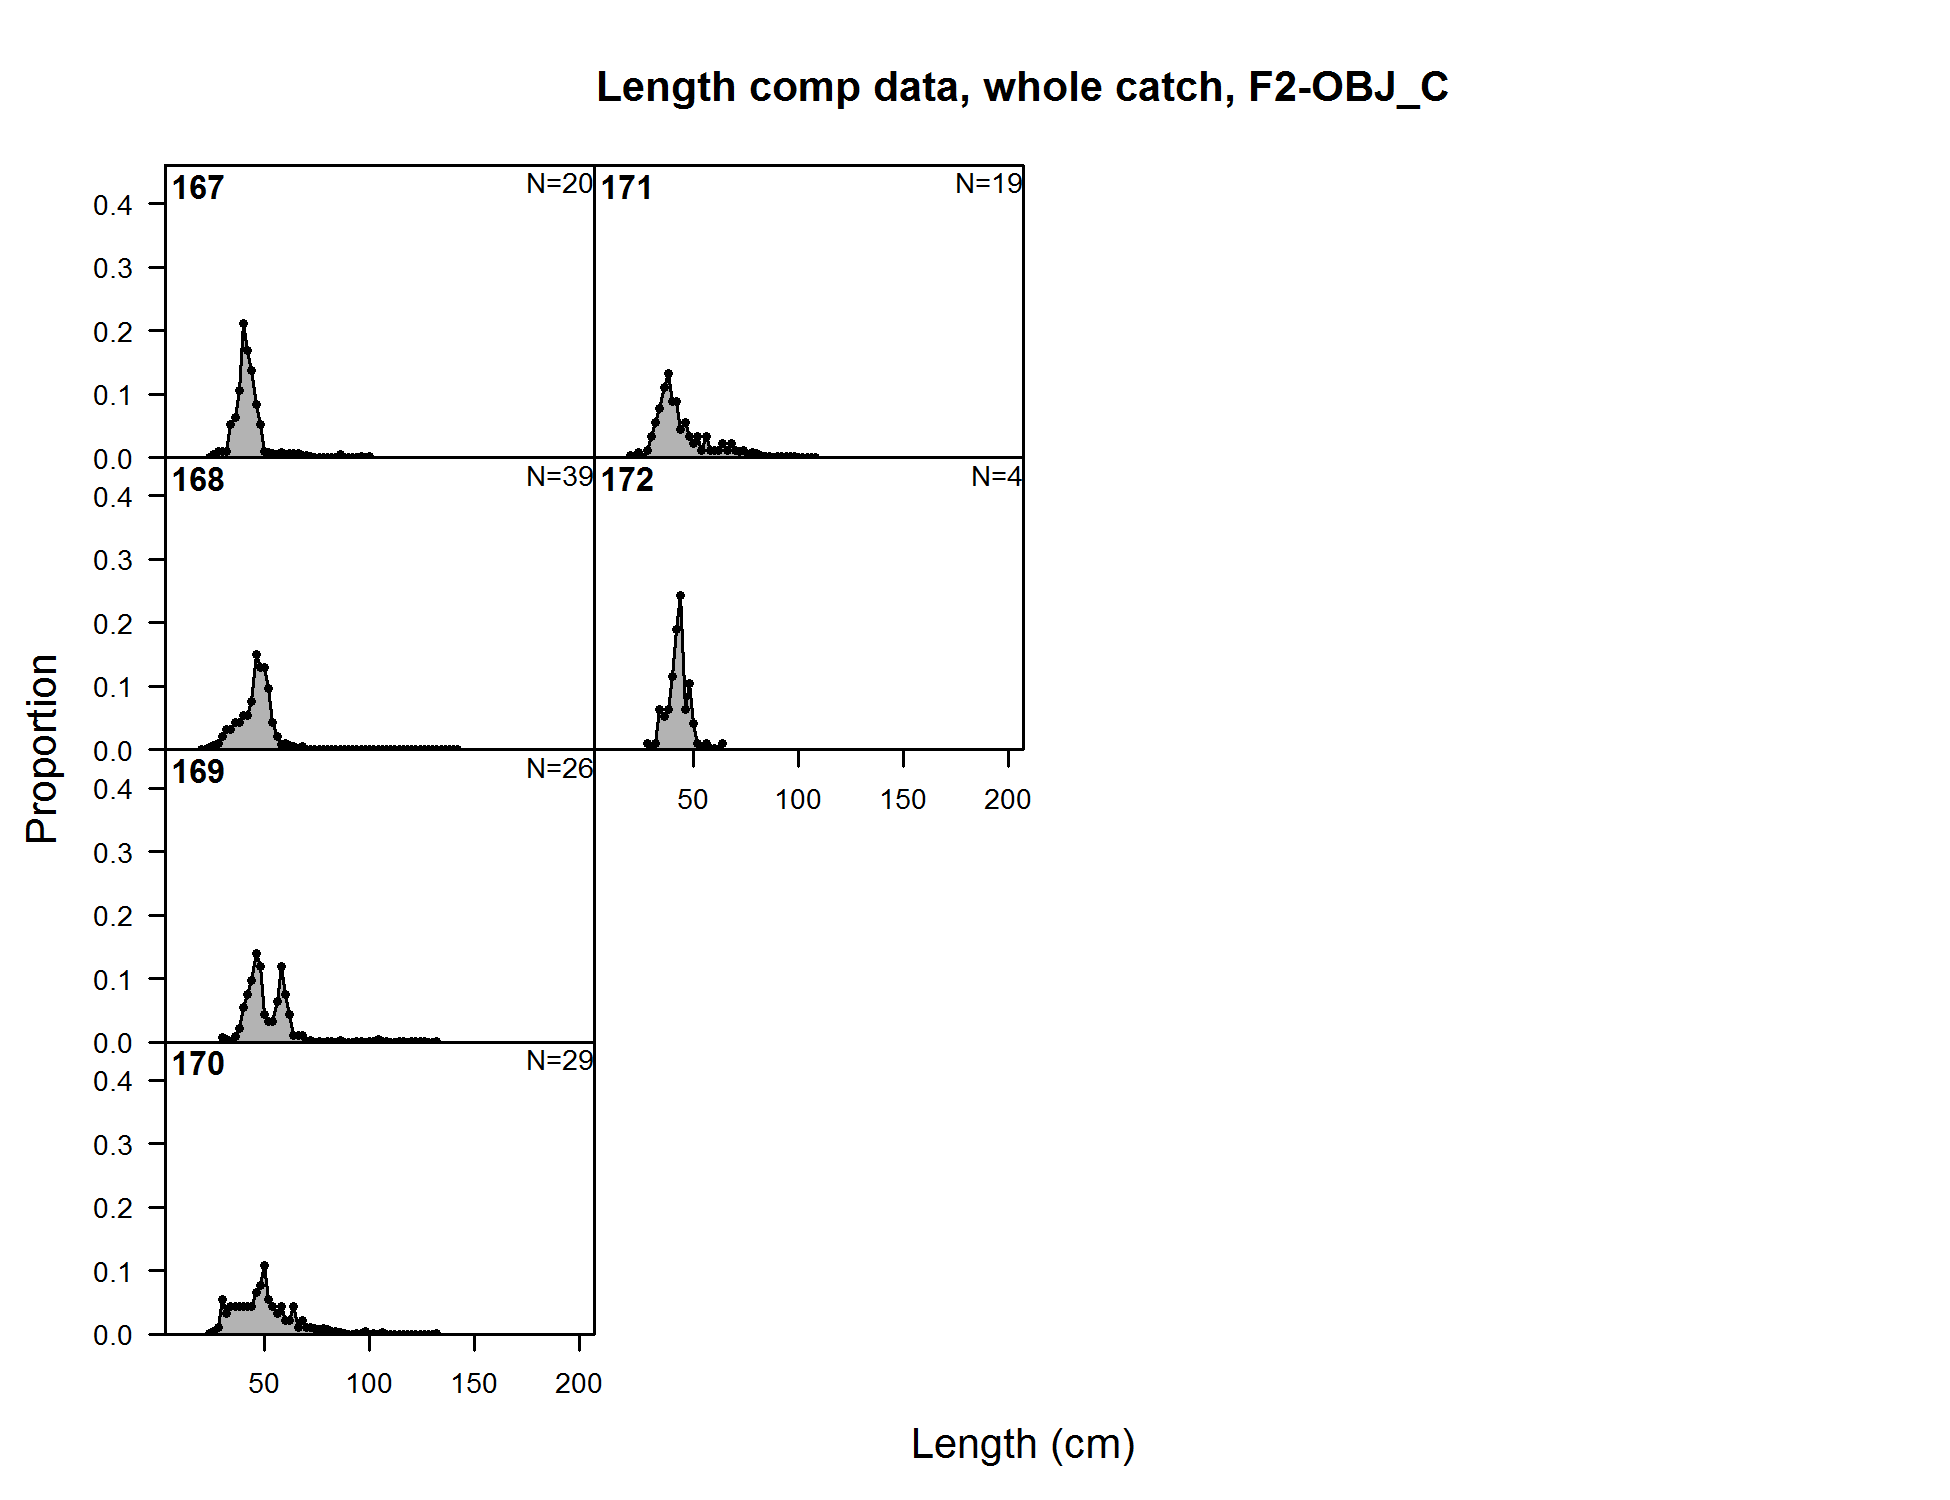
Length comp data, whole catch, F2-OBJ_C (plot 1 of 7) (plot 2 of 7) (plot 3 of 7) (plot 4 of 7)
file: comp_lendat_flt2mkt0_page4.png
Length comp data, whole catch, F2-OBJ_C (plot 1 of 7) (plot 2 of 7) (plot 3 of 7) (plot 4 of 7) (plot 5 of 7)
file: comp_lendat_flt2mkt0_page5.png
Length comp data, whole catch, F2-OBJ_C (plot 1 of 7) (plot 2 of 7) (plot 3 of 7) (plot 4 of 7) (plot 5 of 7) (plot 6 of 7)
file: comp_lendat_flt2mkt0_page6.png
Length comp data, whole catch, F2-OBJ_C (plot 1 of 7) (plot 2 of 7) (plot 3 of 7) (plot 4 of 7) (plot 5 of 7) (plot 6 of 7) (plot 7 of 7)
file: comp_lendat_flt2mkt0_page7.png
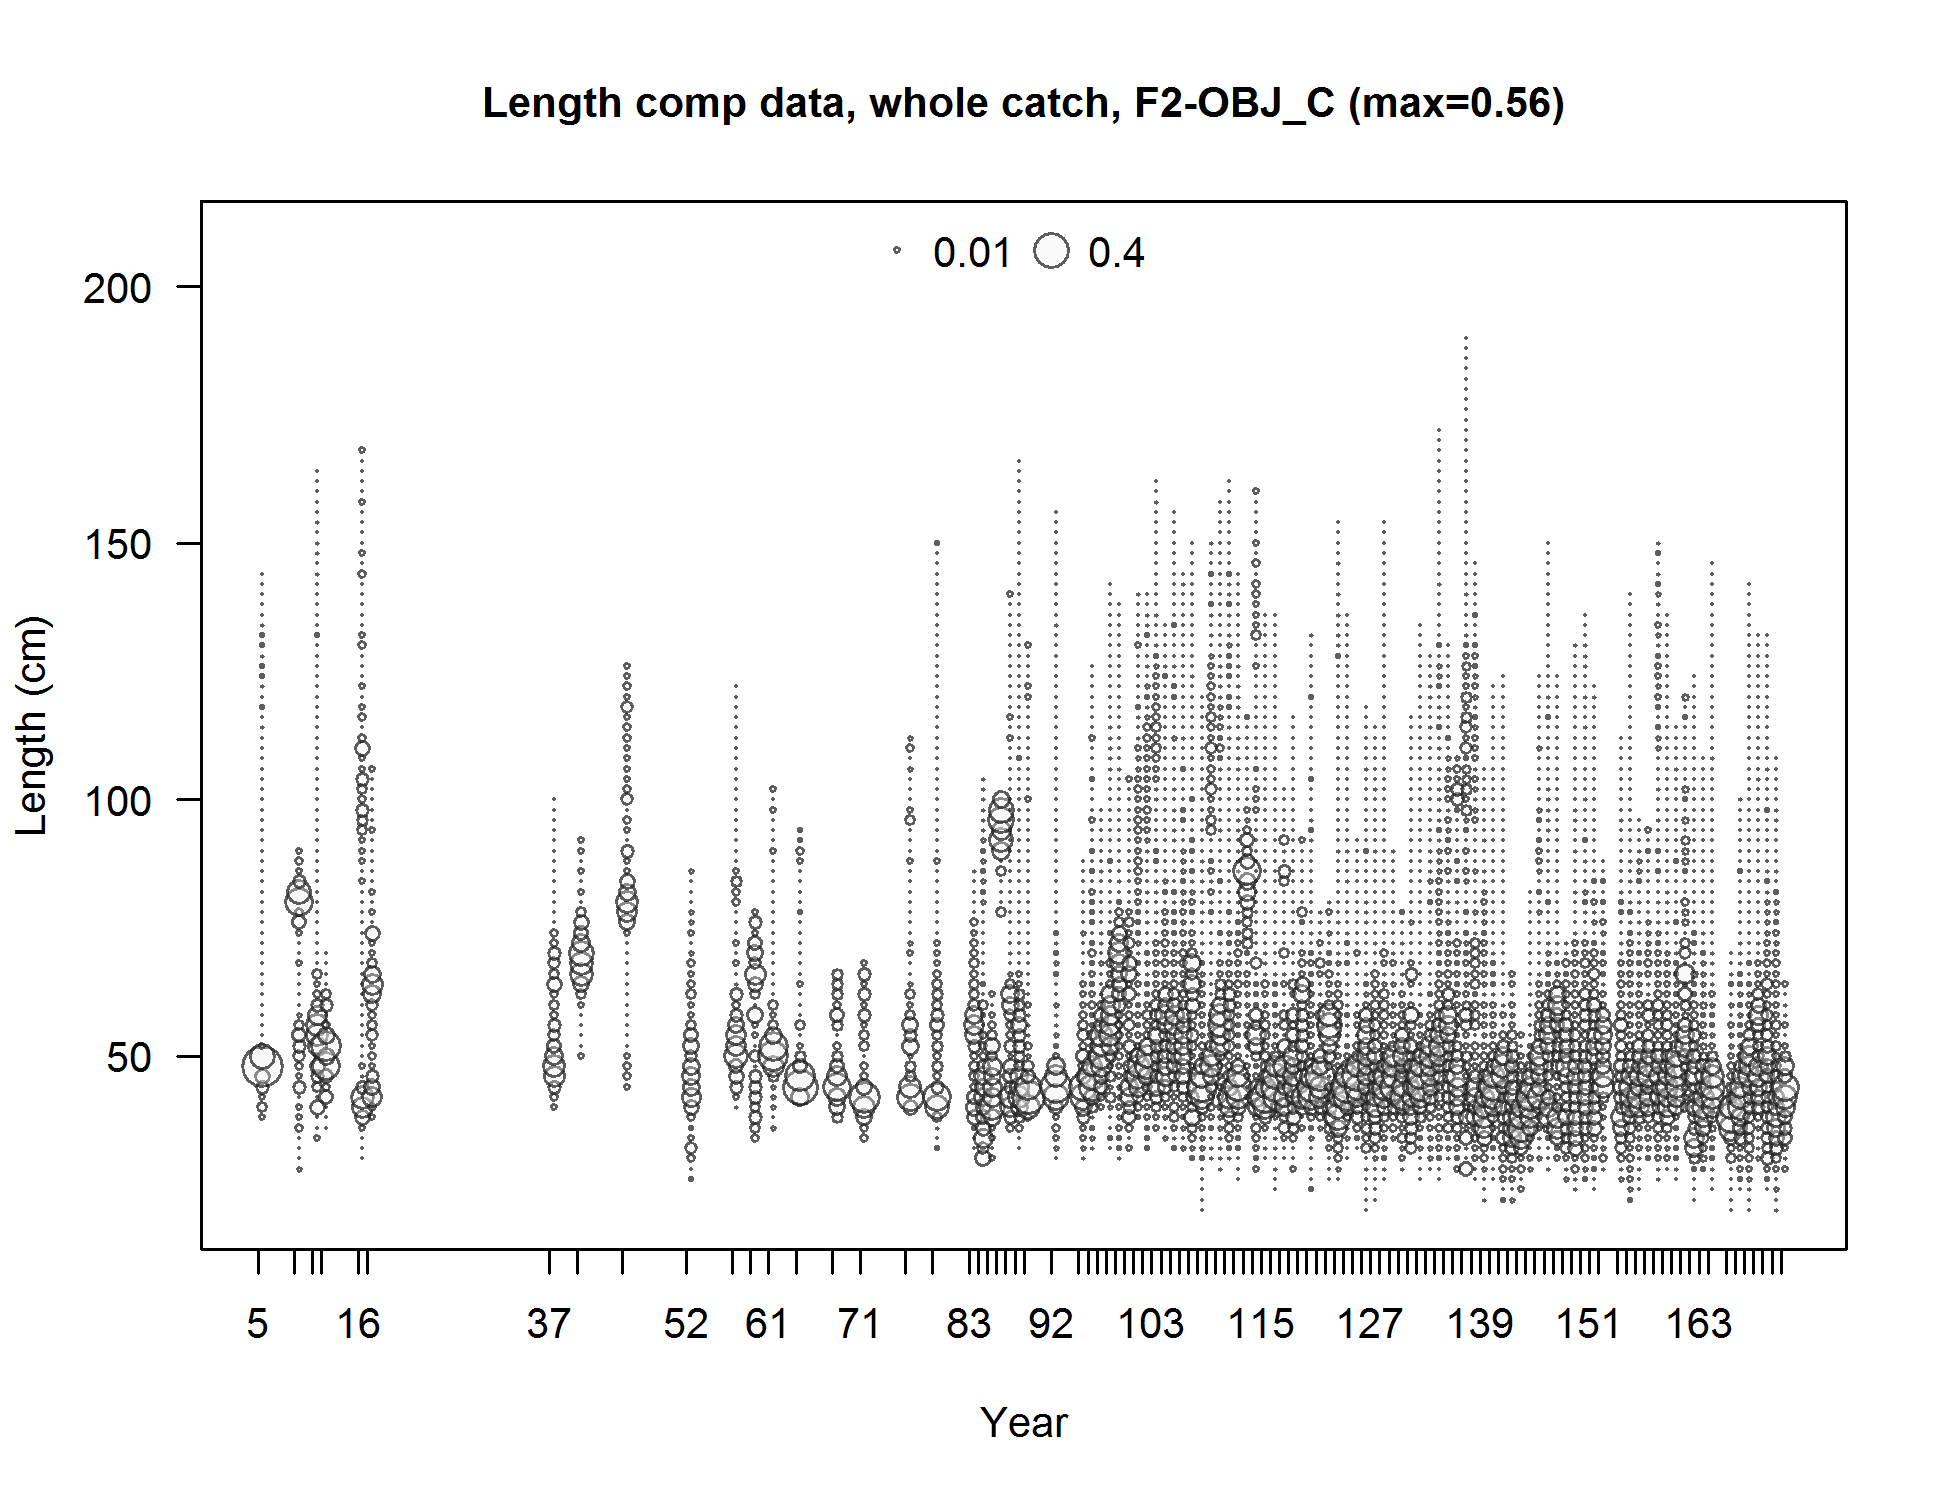
Length comp data, whole catch, F2-OBJ_C (max=0.56) (plot 7 of 7)
file: comp_lendat_bubflt2mkt0_page7.png
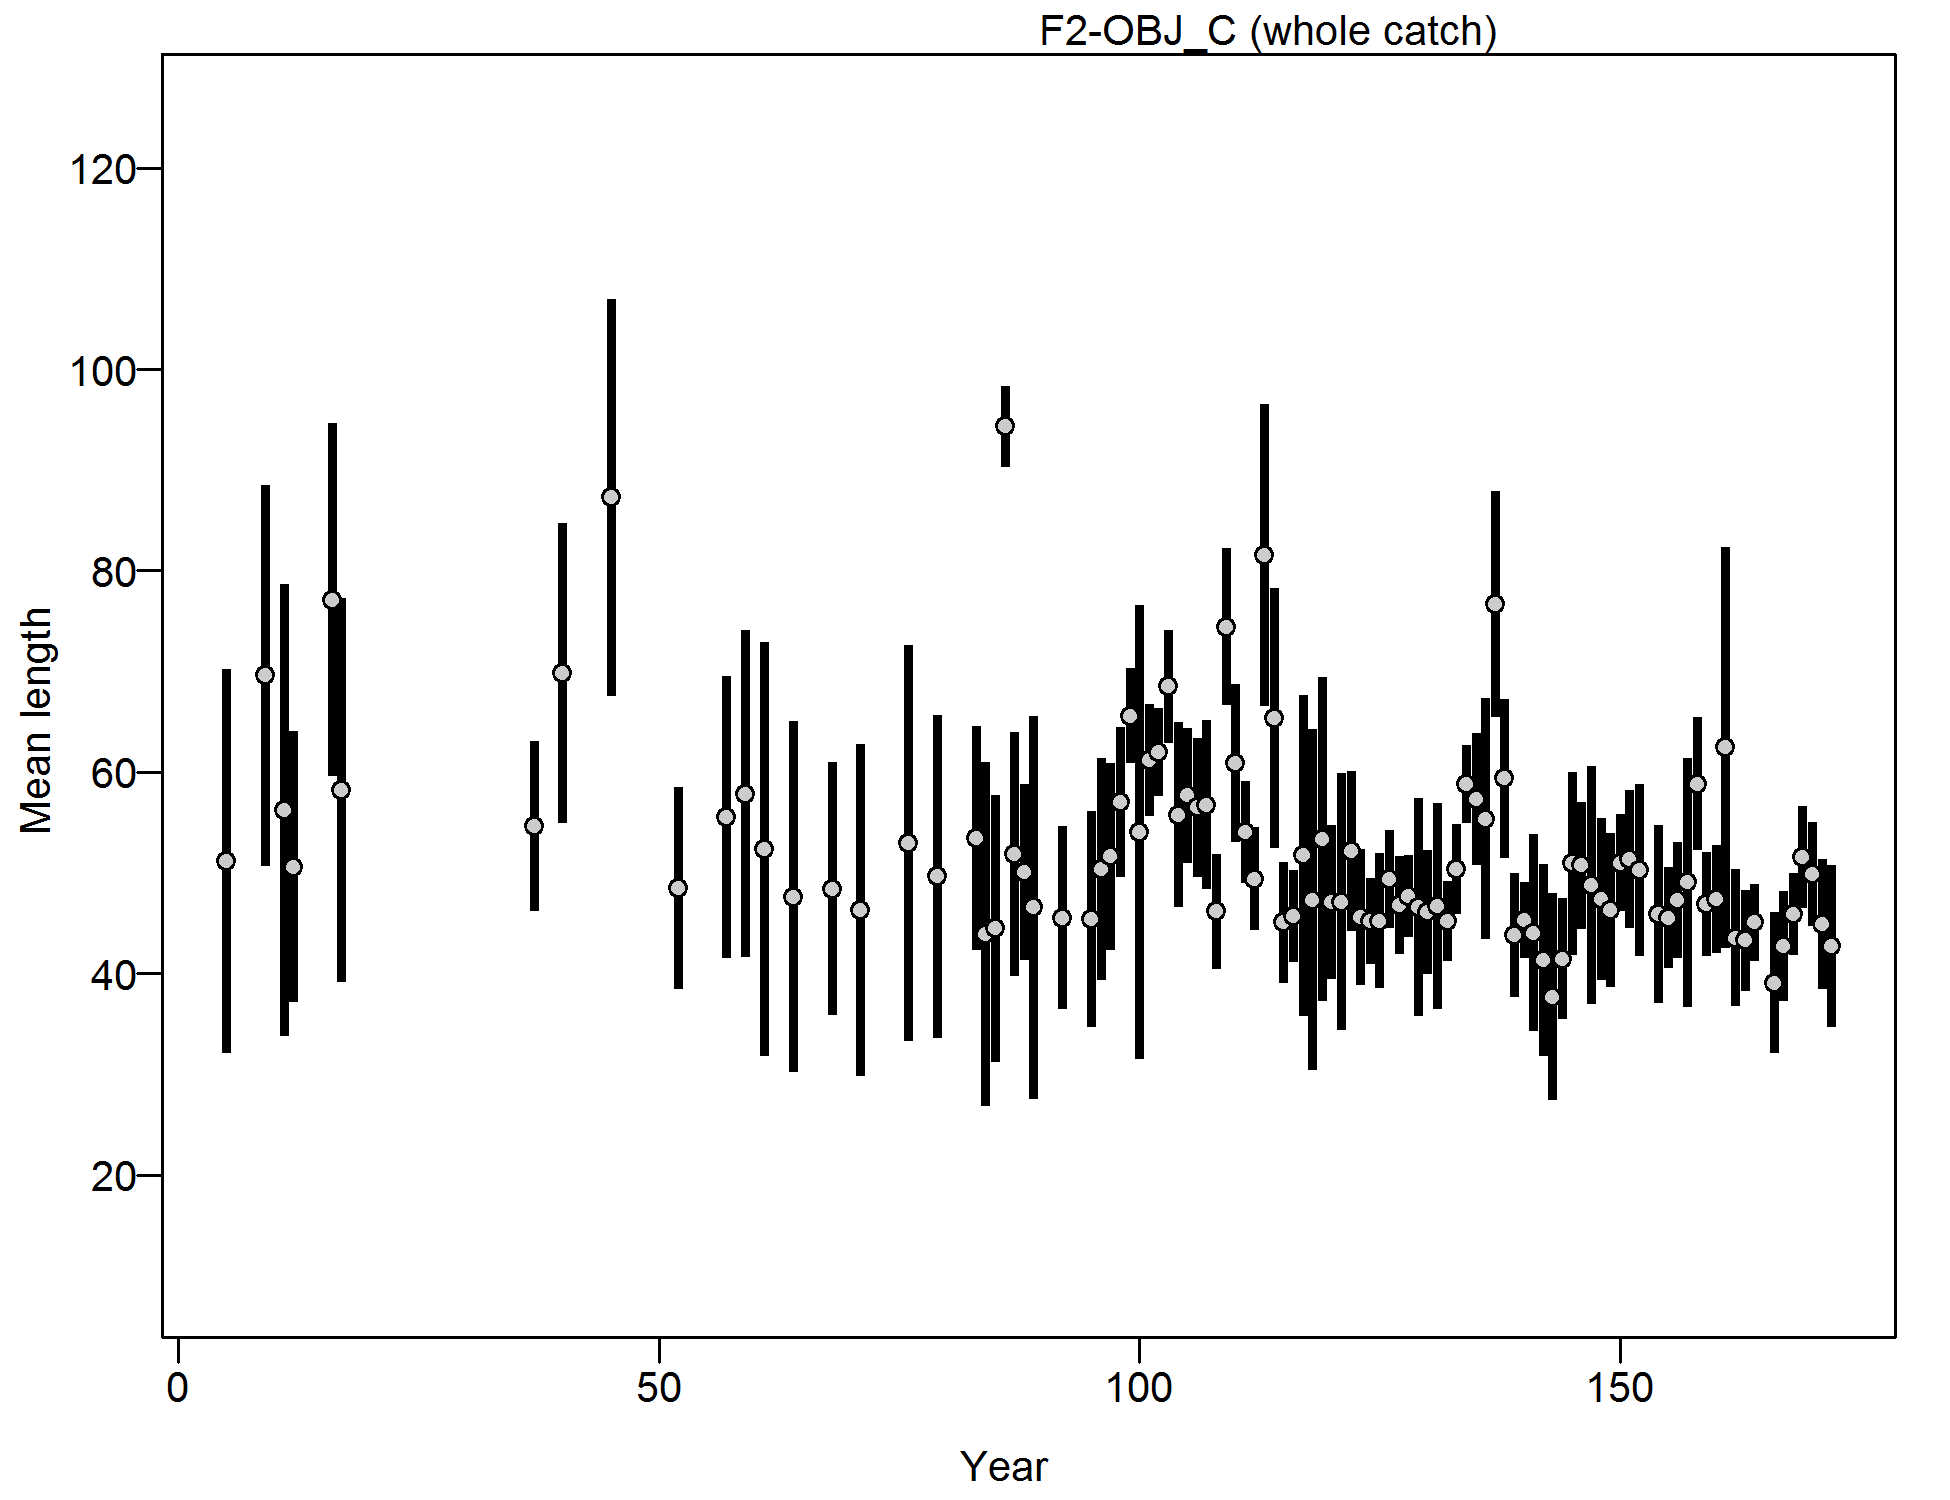
Mean length for F2-OBJ_C with 95% confidence intervals based on current samples sizes.
file: comp_lendat_data_weighting_TA1.8_F2-OBJ_C.png
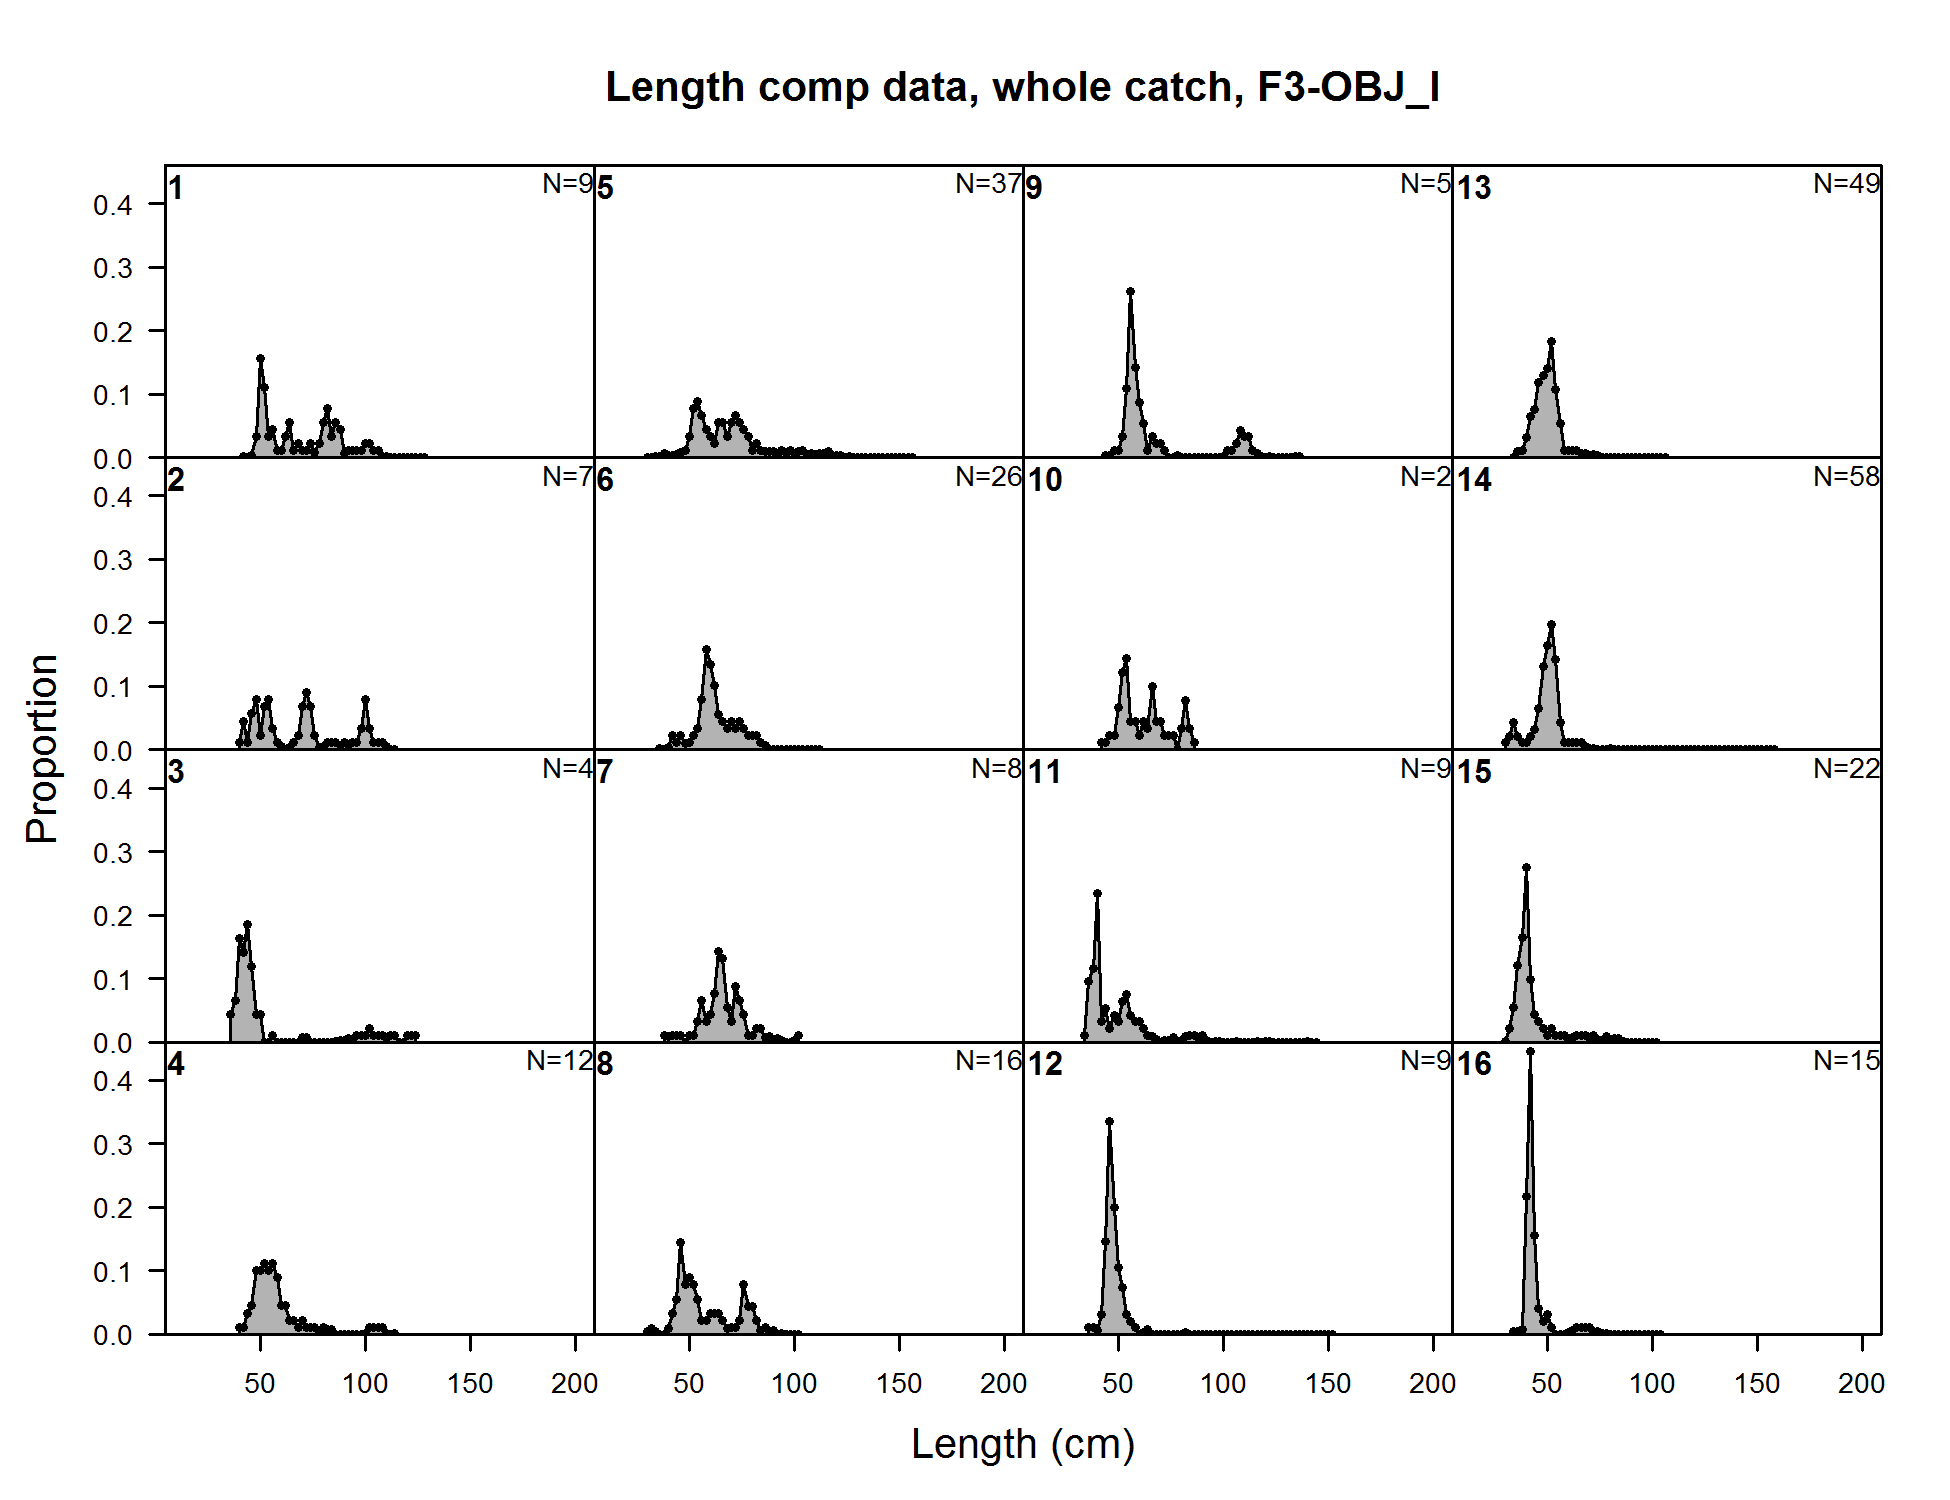
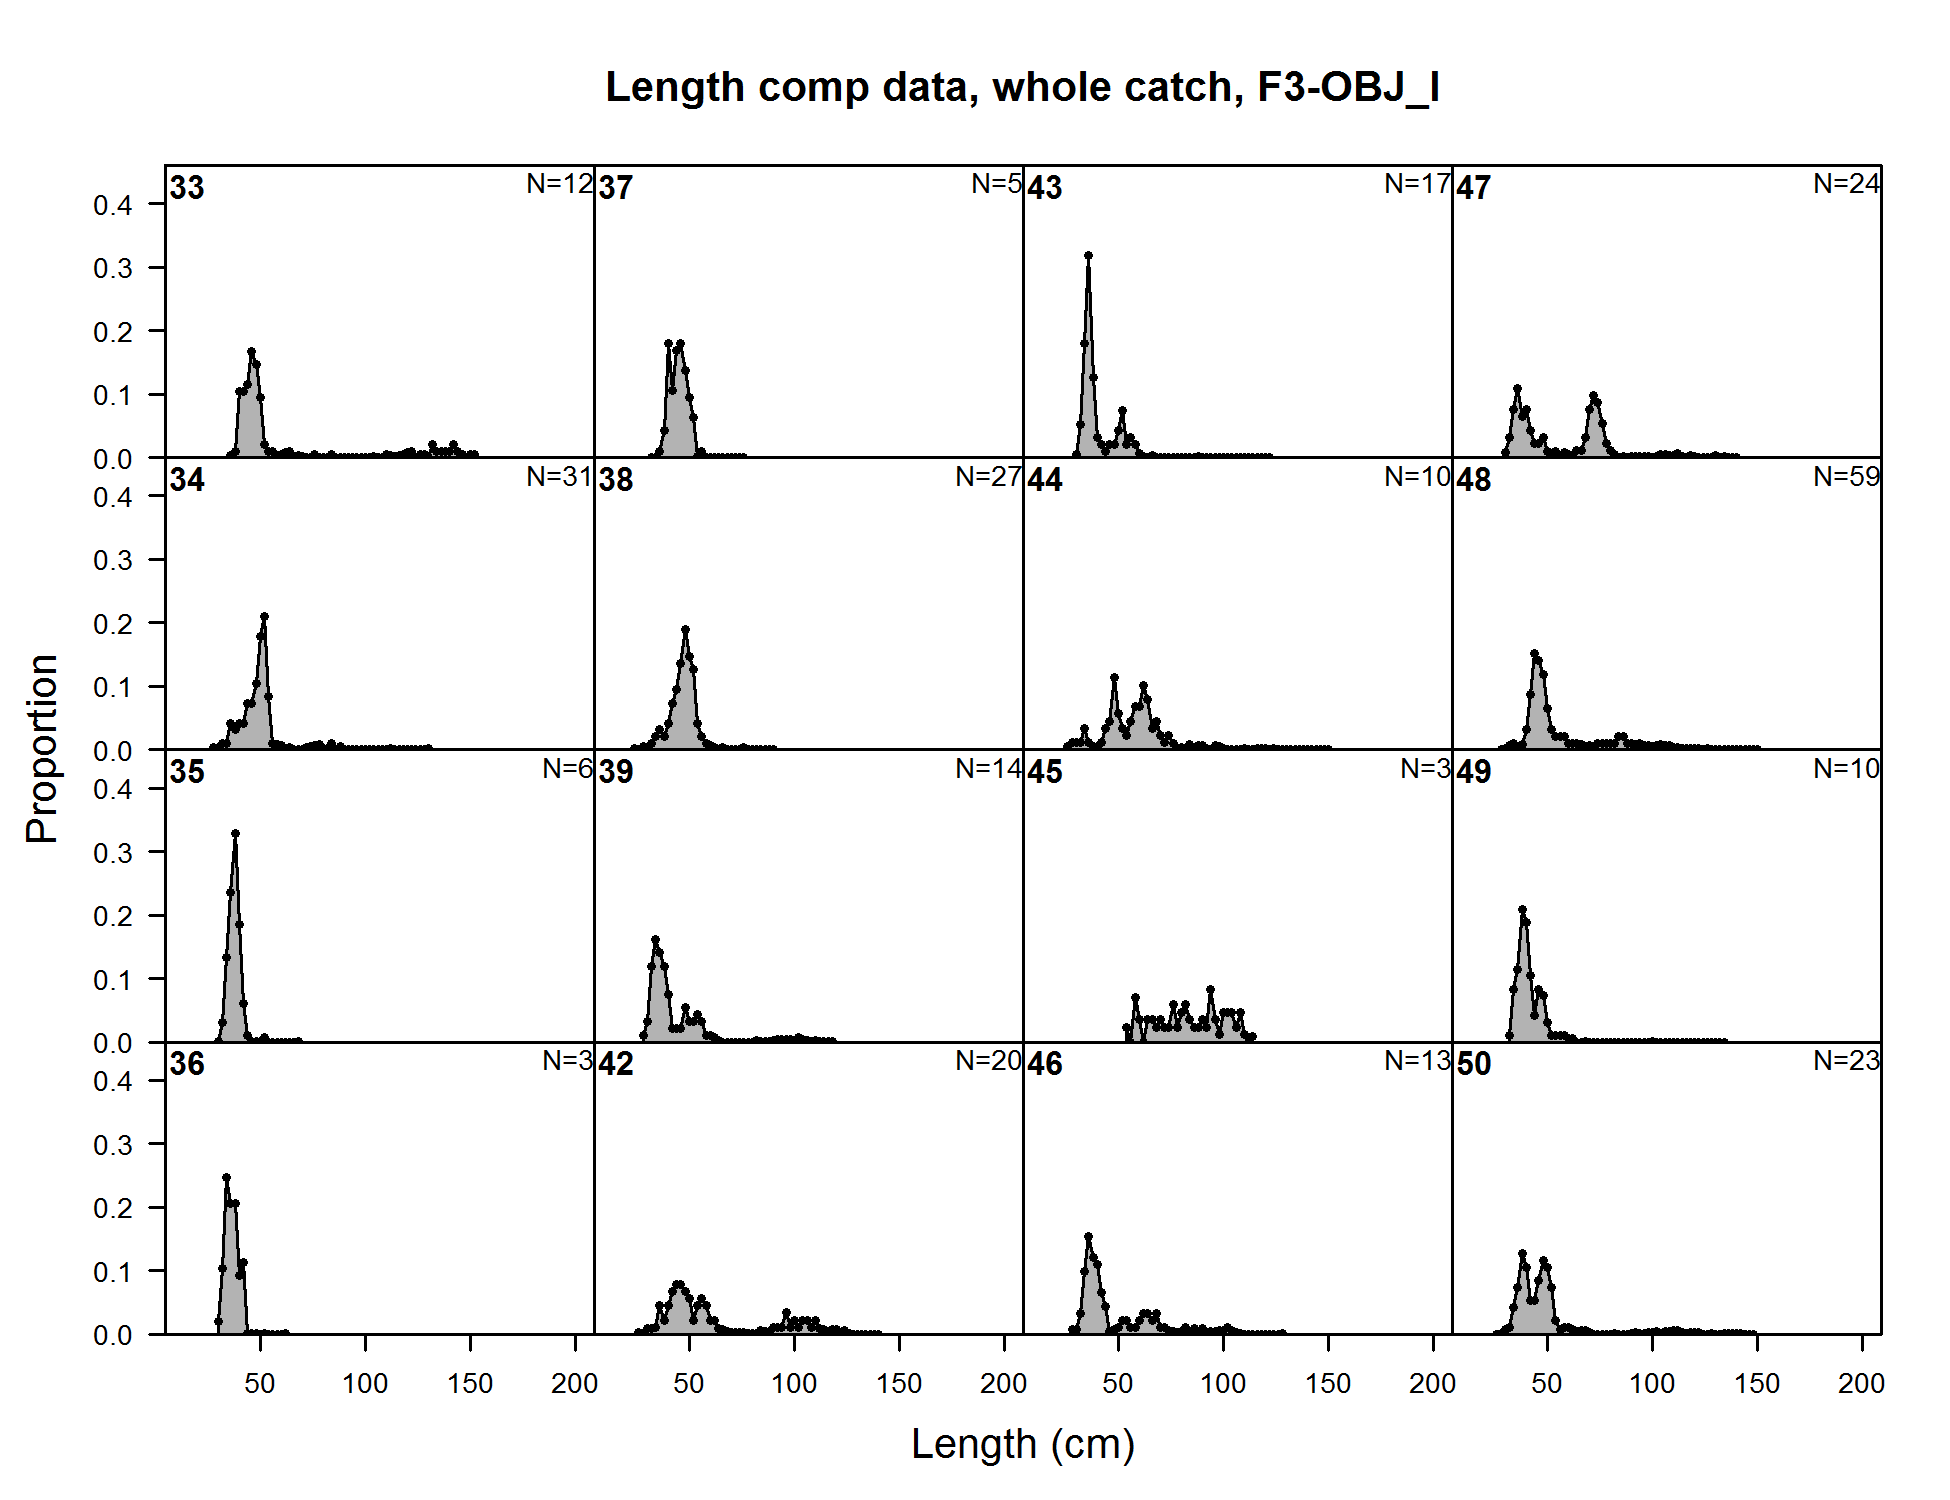
Length comp data, whole catch, F3-OBJ_I (plot 1 of 9)
file: comp_lendat_flt3mkt0_page1.png
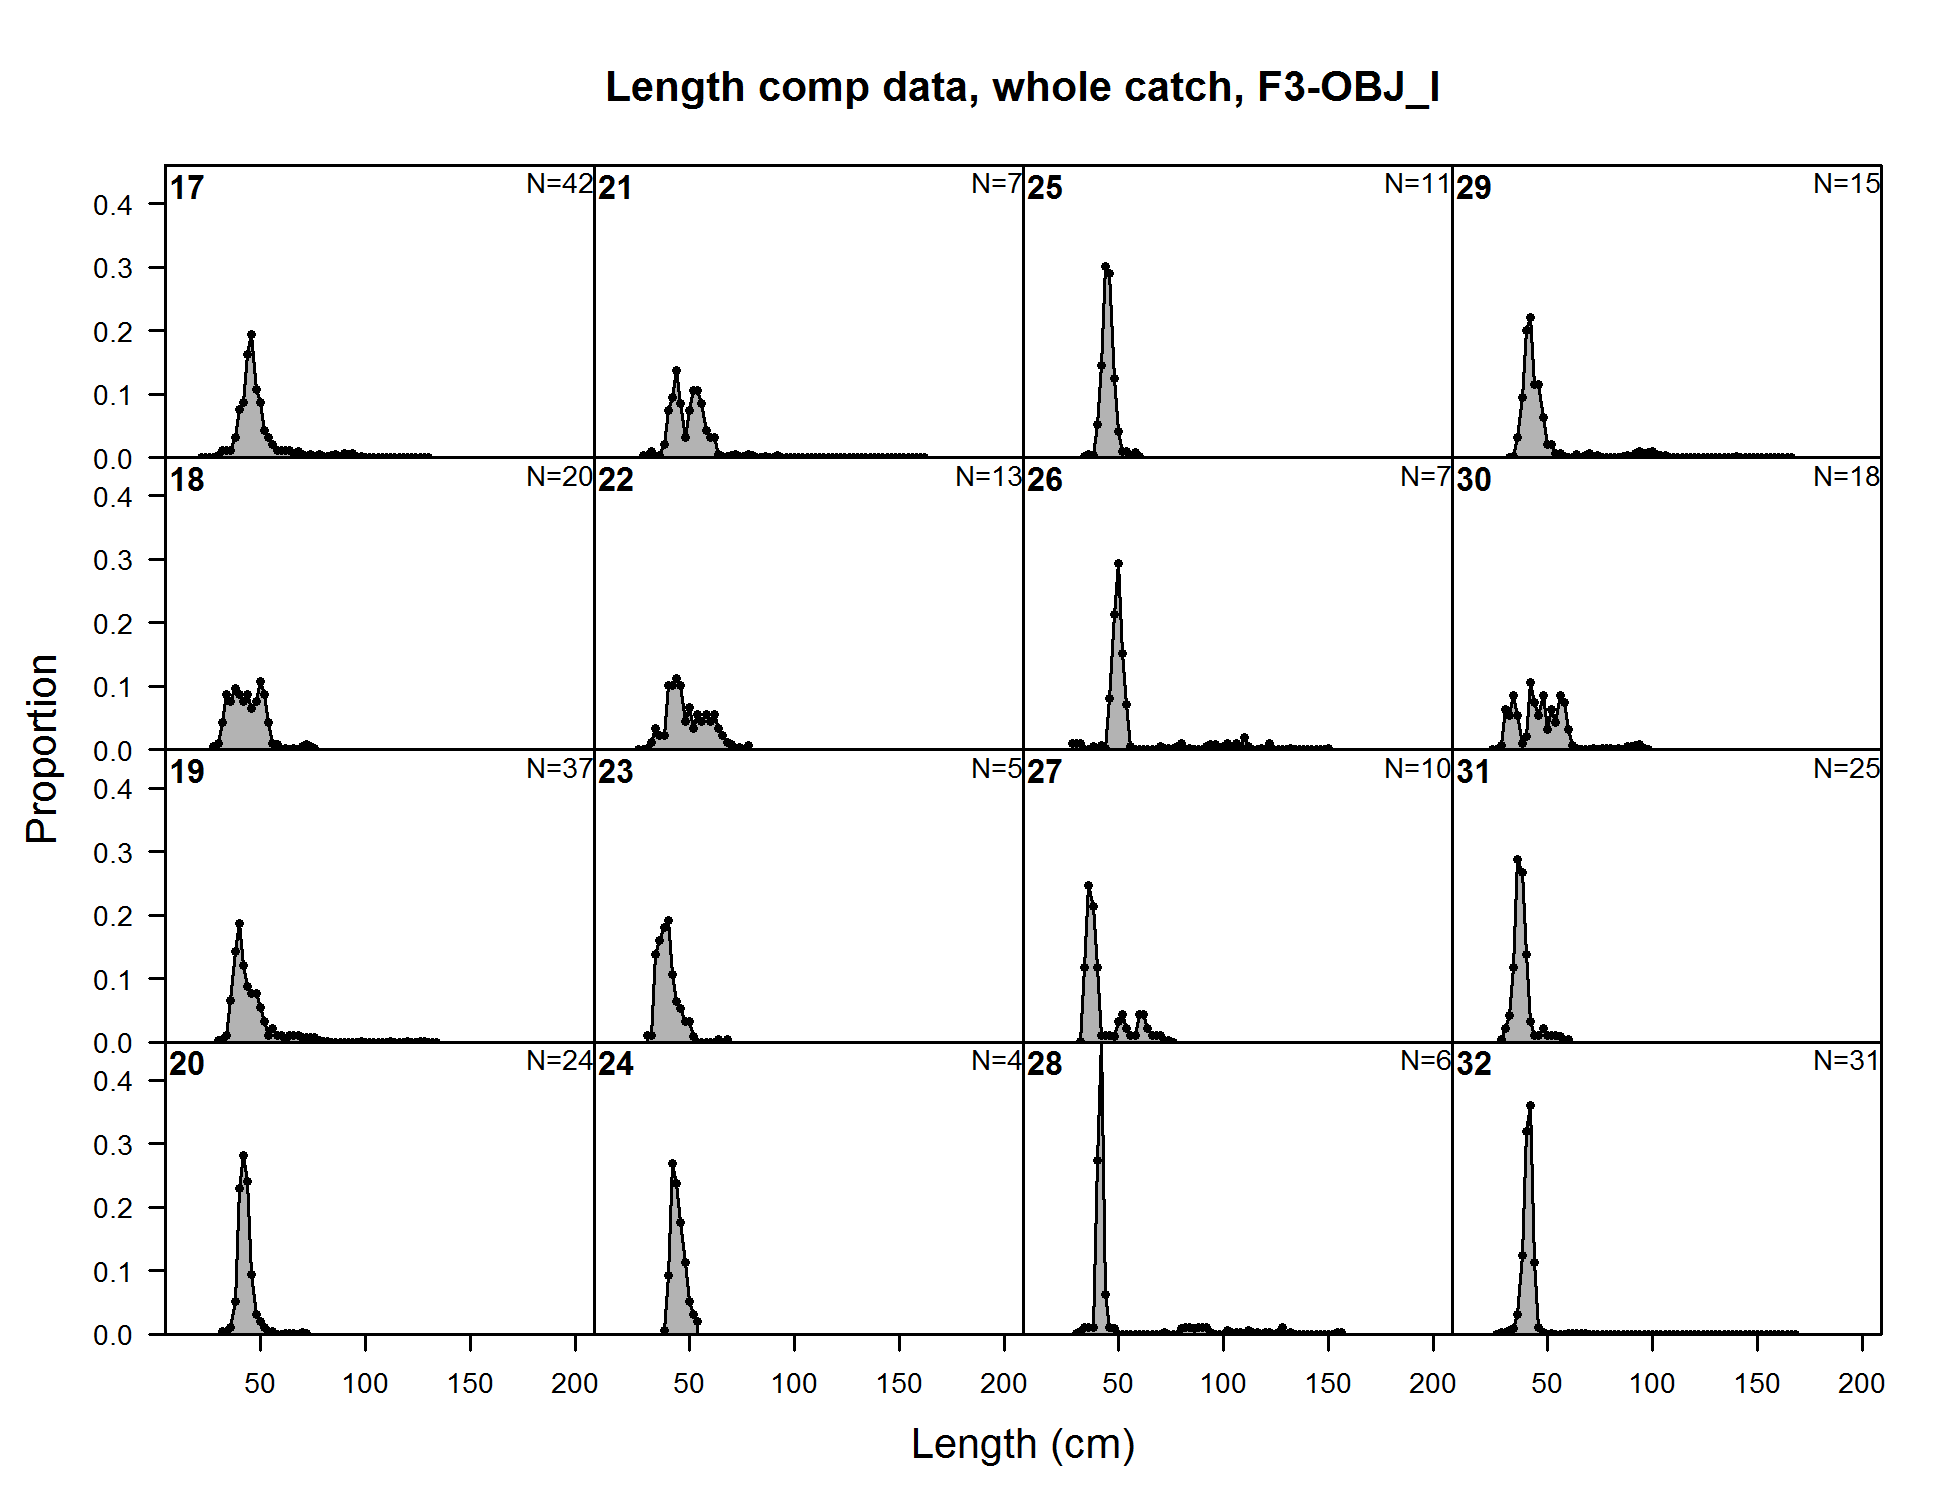
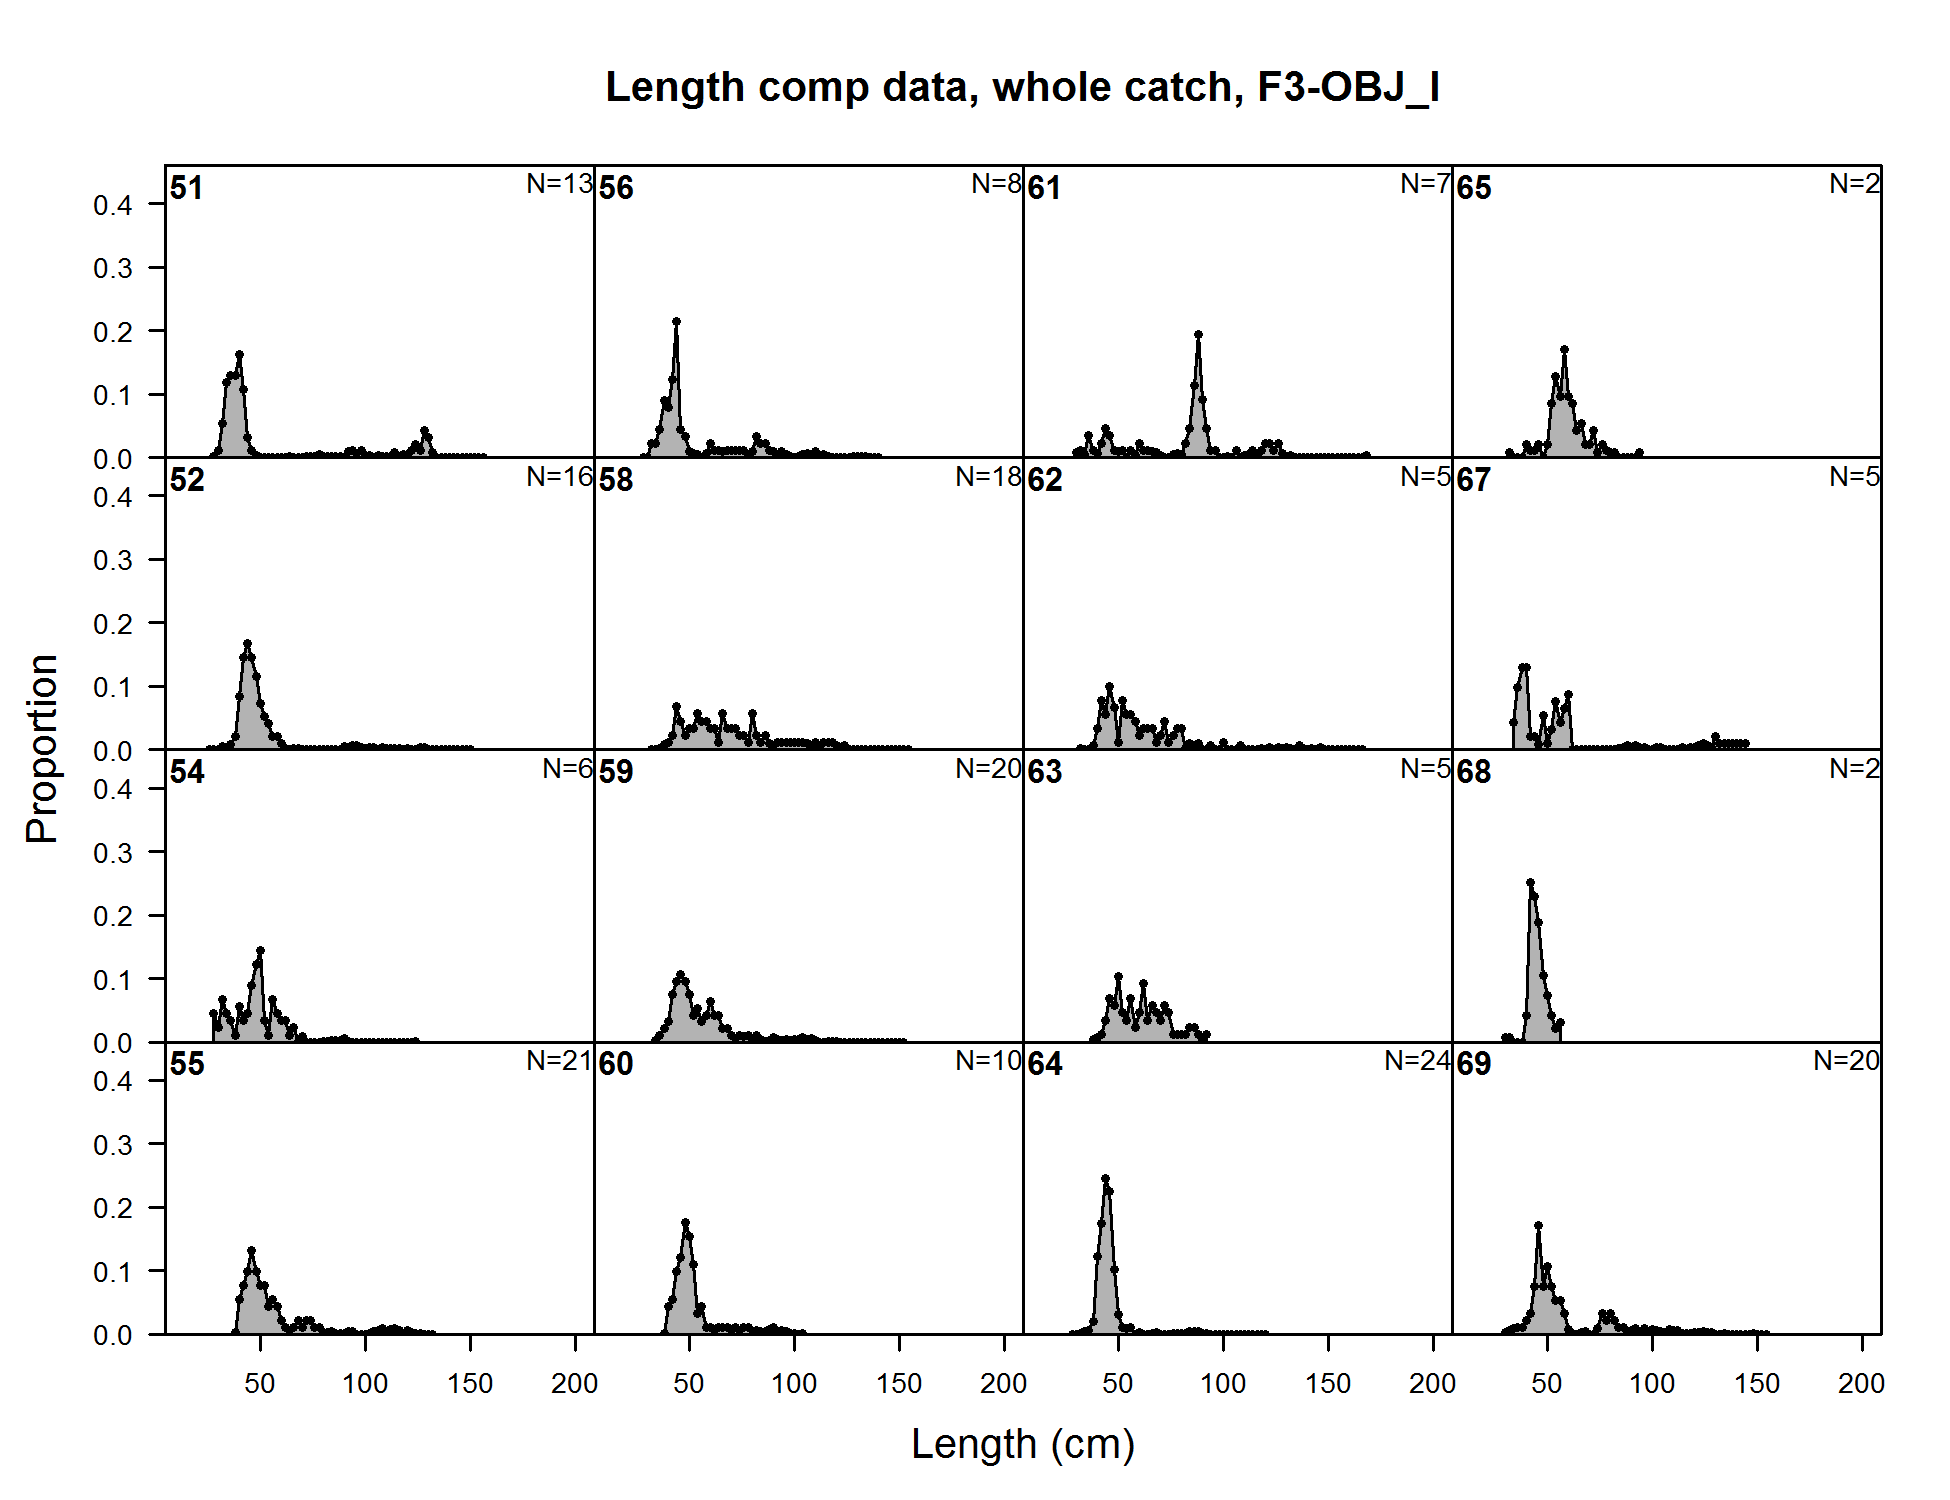
Length comp data, whole catch, F3-OBJ_I (plot 1 of 9) (plot 2 of 9)
file: comp_lendat_flt3mkt0_page2.png
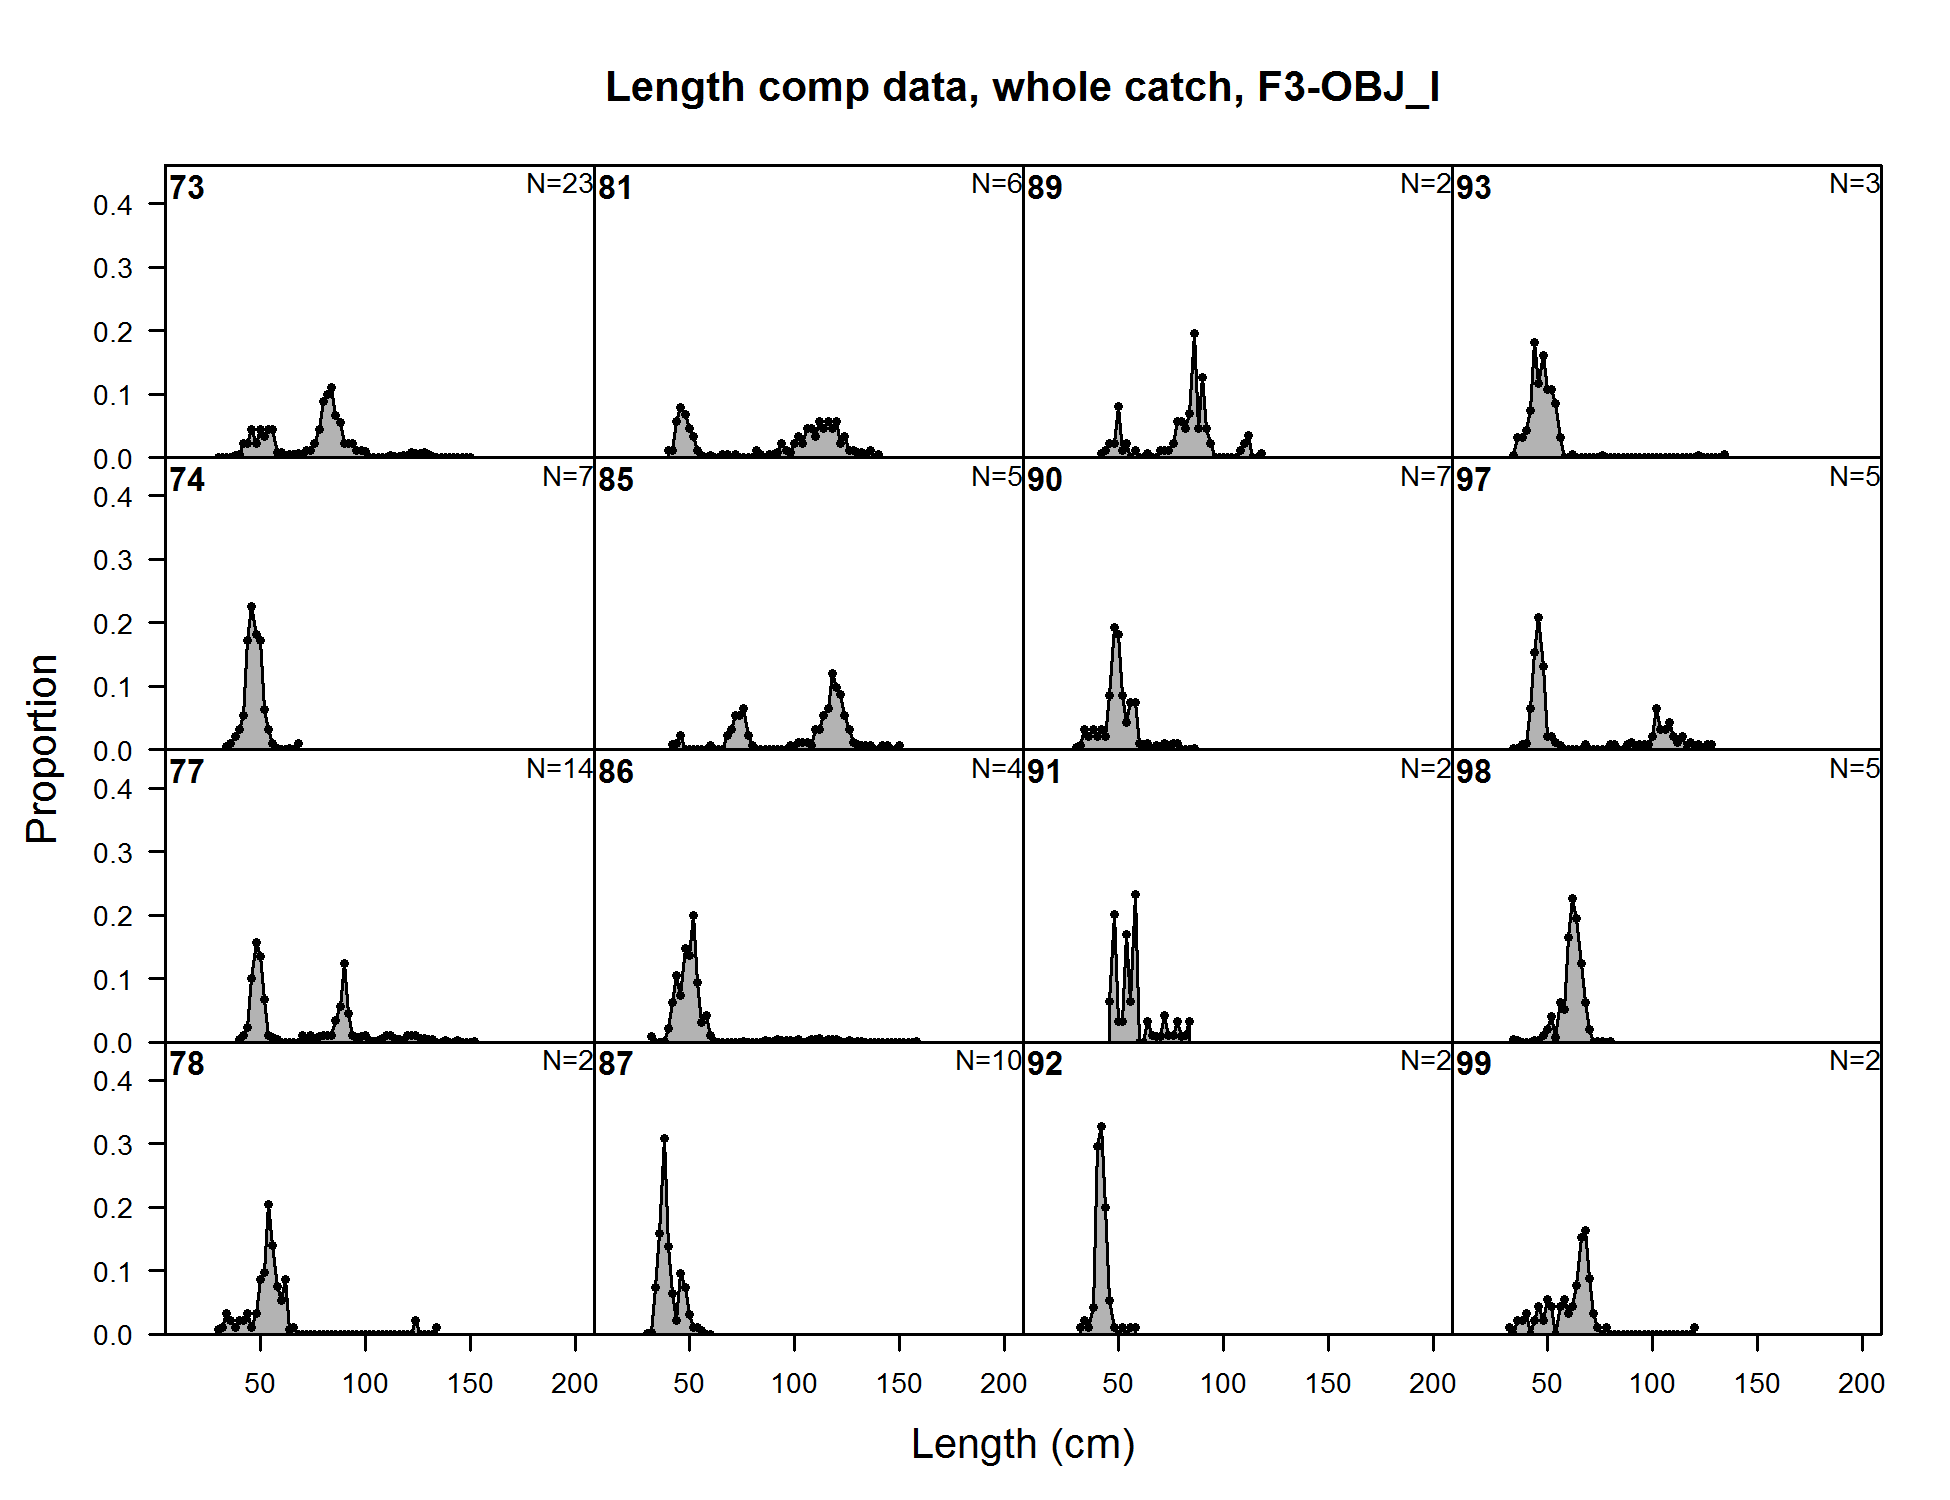
Length comp data, whole catch, F3-OBJ_I (plot 1 of 9) (plot 2 of 9) (plot 3 of 9)
file: comp_lendat_flt3mkt0_page3.png
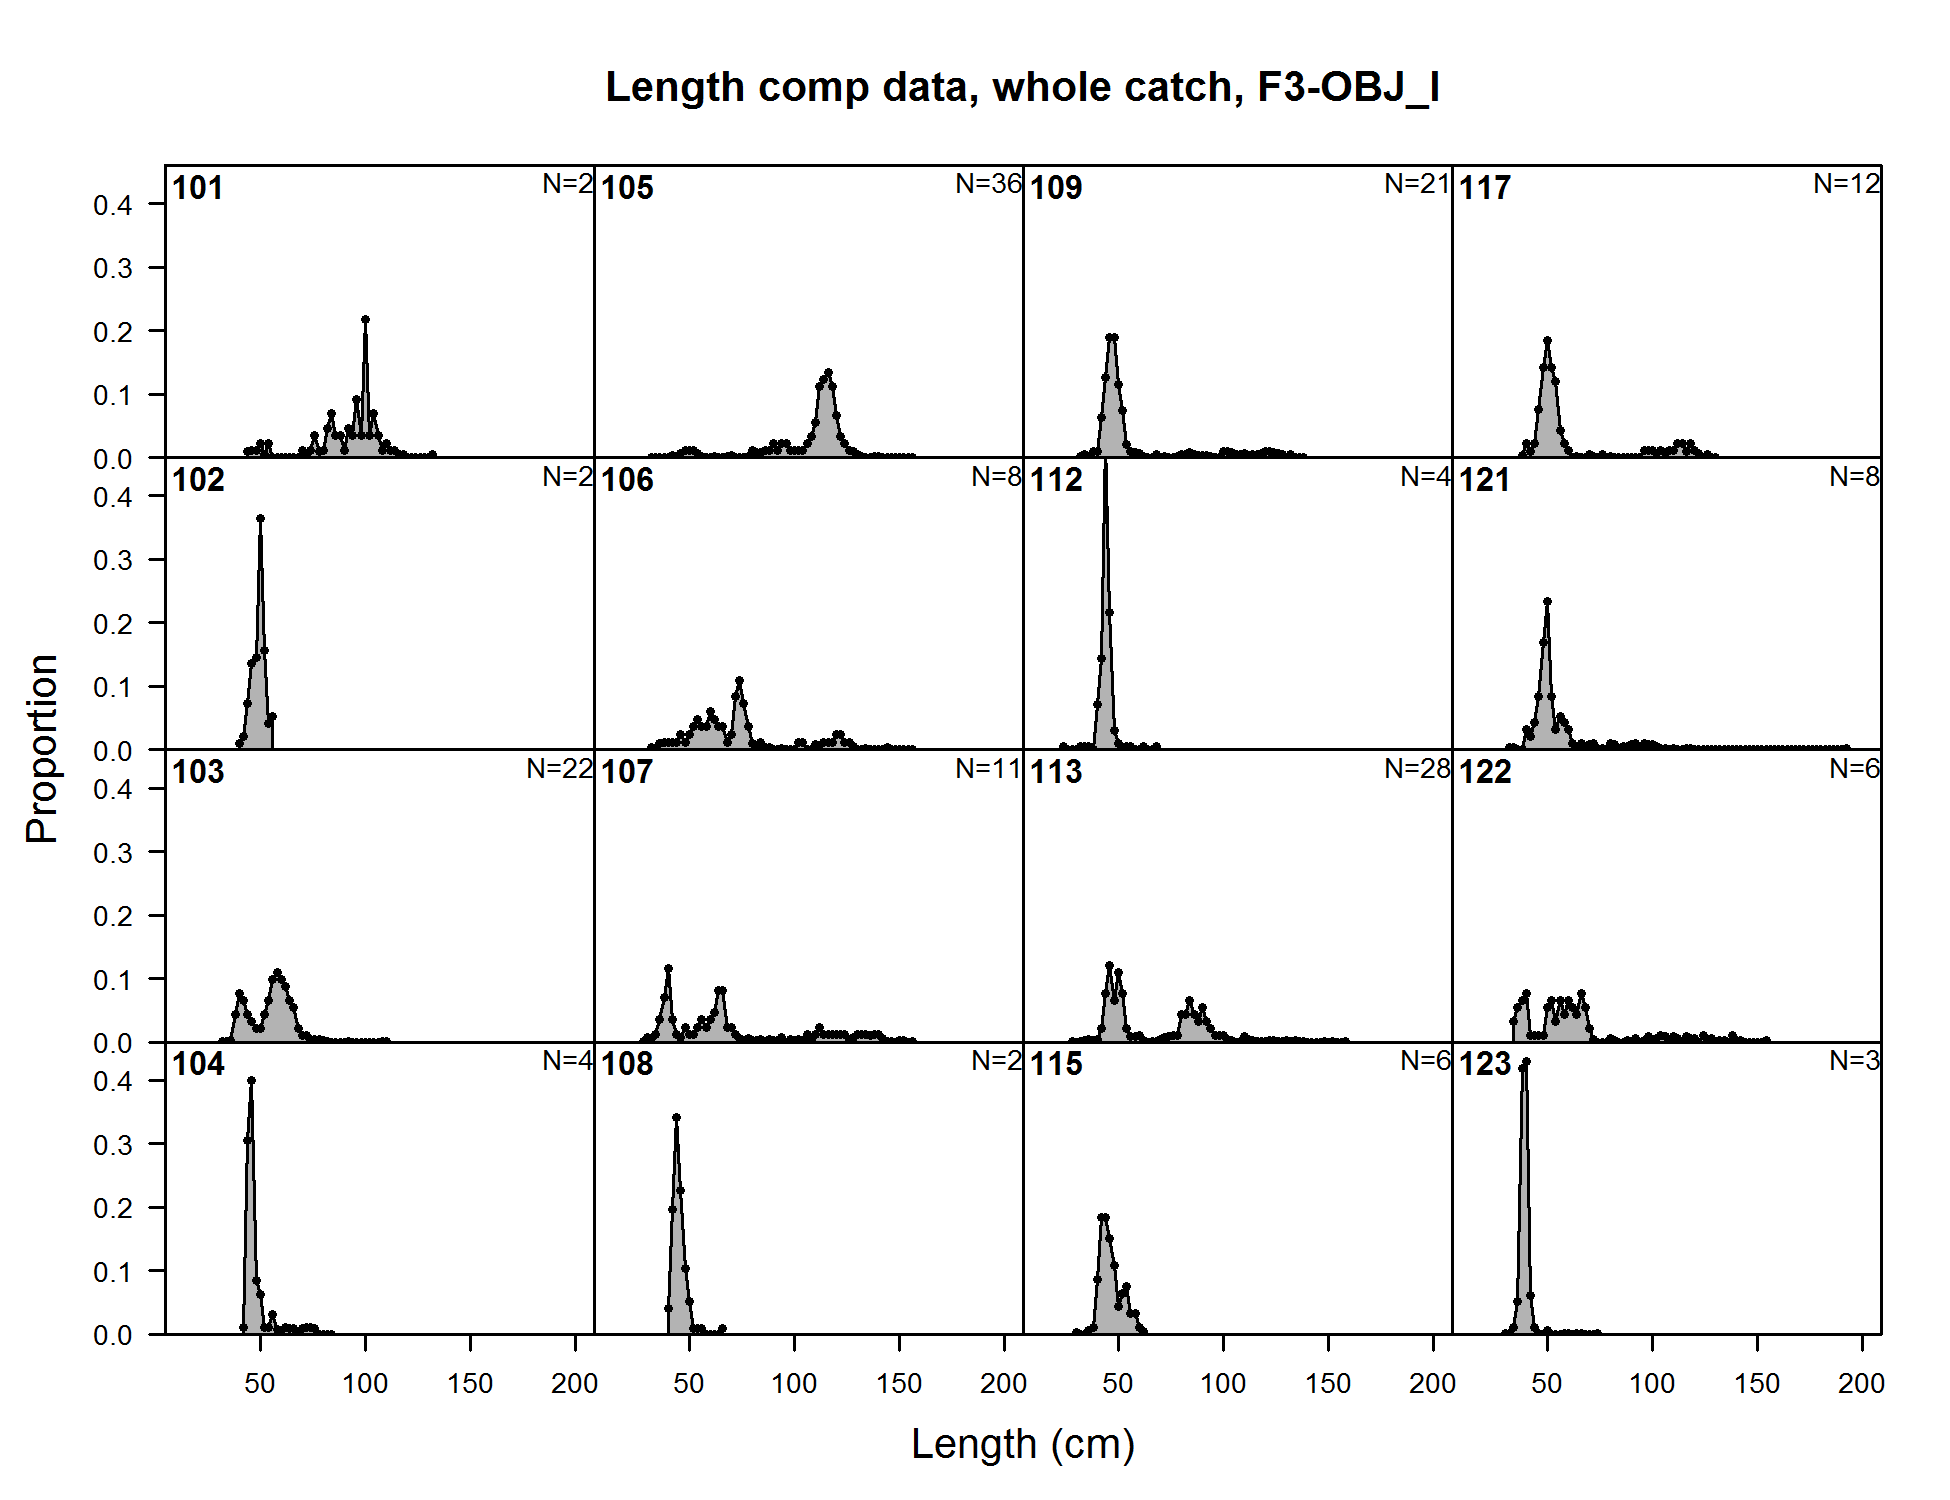
Length comp data, whole catch, F3-OBJ_I (plot 1 of 9) (plot 2 of 9) (plot 3 of 9) (plot 4 of 9)
file: comp_lendat_flt3mkt0_page4.png
Length comp data, whole catch, F3-OBJ_I (plot 1 of 9) (plot 2 of 9) (plot 3 of 9) (plot 4 of 9) (plot 5 of 9)
file: comp_lendat_flt3mkt0_page5.png
Length comp data, whole catch, F3-OBJ_I (plot 1 of 9) (plot 2 of 9) (plot 3 of 9) (plot 4 of 9) (plot 5 of 9) (plot 6 of 9)
file: comp_lendat_flt3mkt0_page6.png
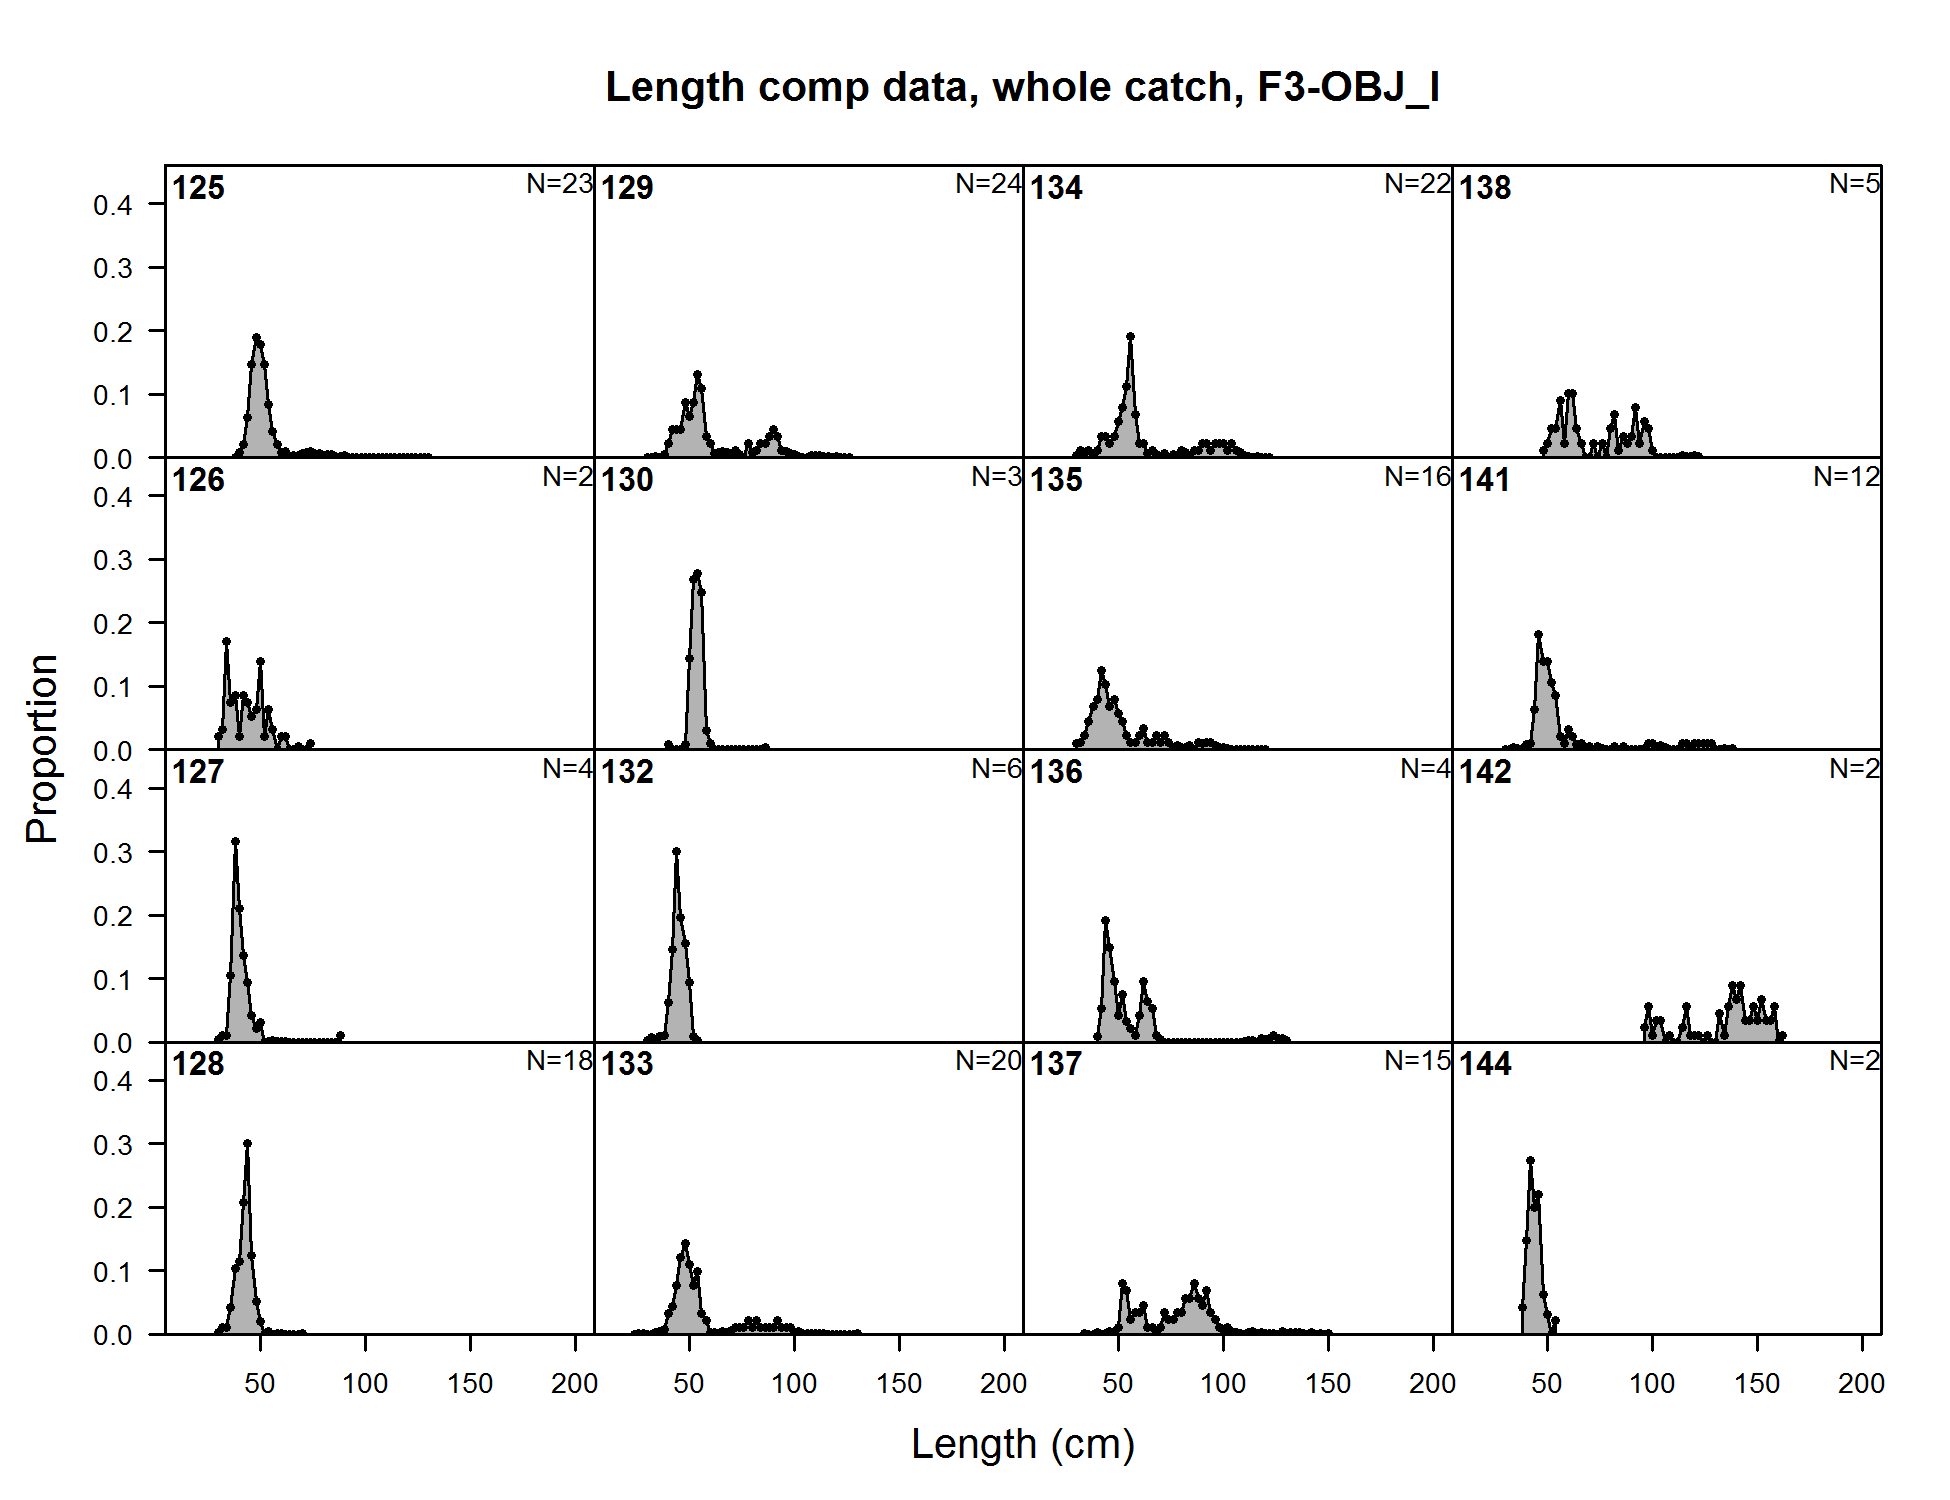
Length comp data, whole catch, F3-OBJ_I (plot 1 of 9) (plot 2 of 9) (plot 3 of 9) (plot 4 of 9) (plot 5 of 9) (plot 6 of 9) (plot 7 of 9)
file: comp_lendat_flt3mkt0_page7.png
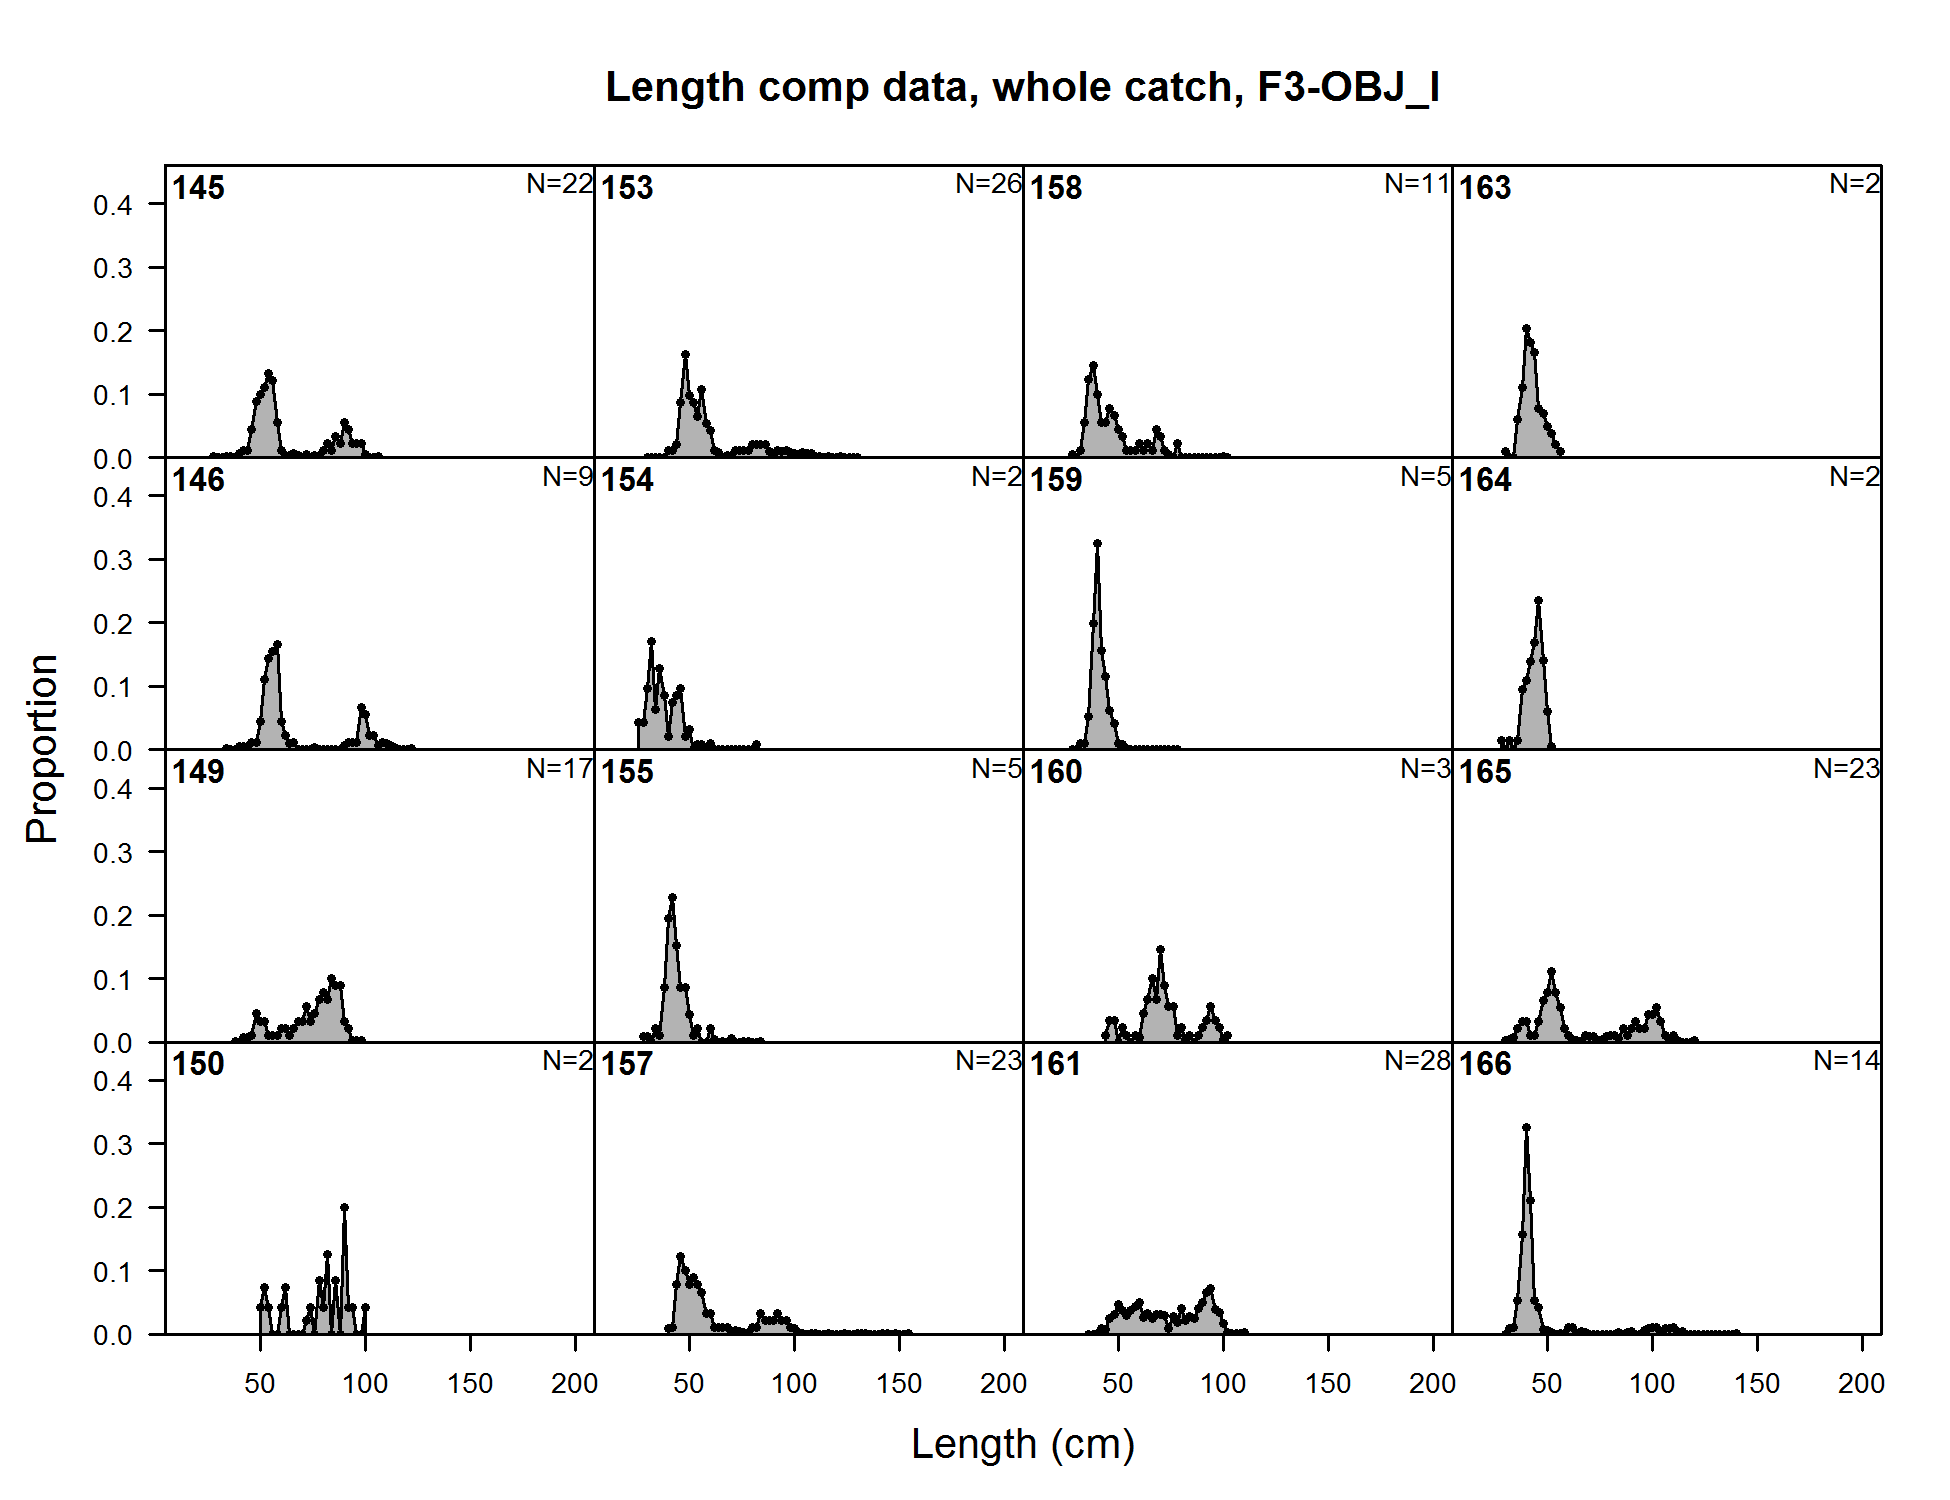
Length comp data, whole catch, F3-OBJ_I (plot 1 of 9) (plot 2 of 9) (plot 3 of 9) (plot 4 of 9) (plot 5 of 9) (plot 6 of 9) (plot 7 of 9) (plot 8 of 9)
file: comp_lendat_flt3mkt0_page8.png
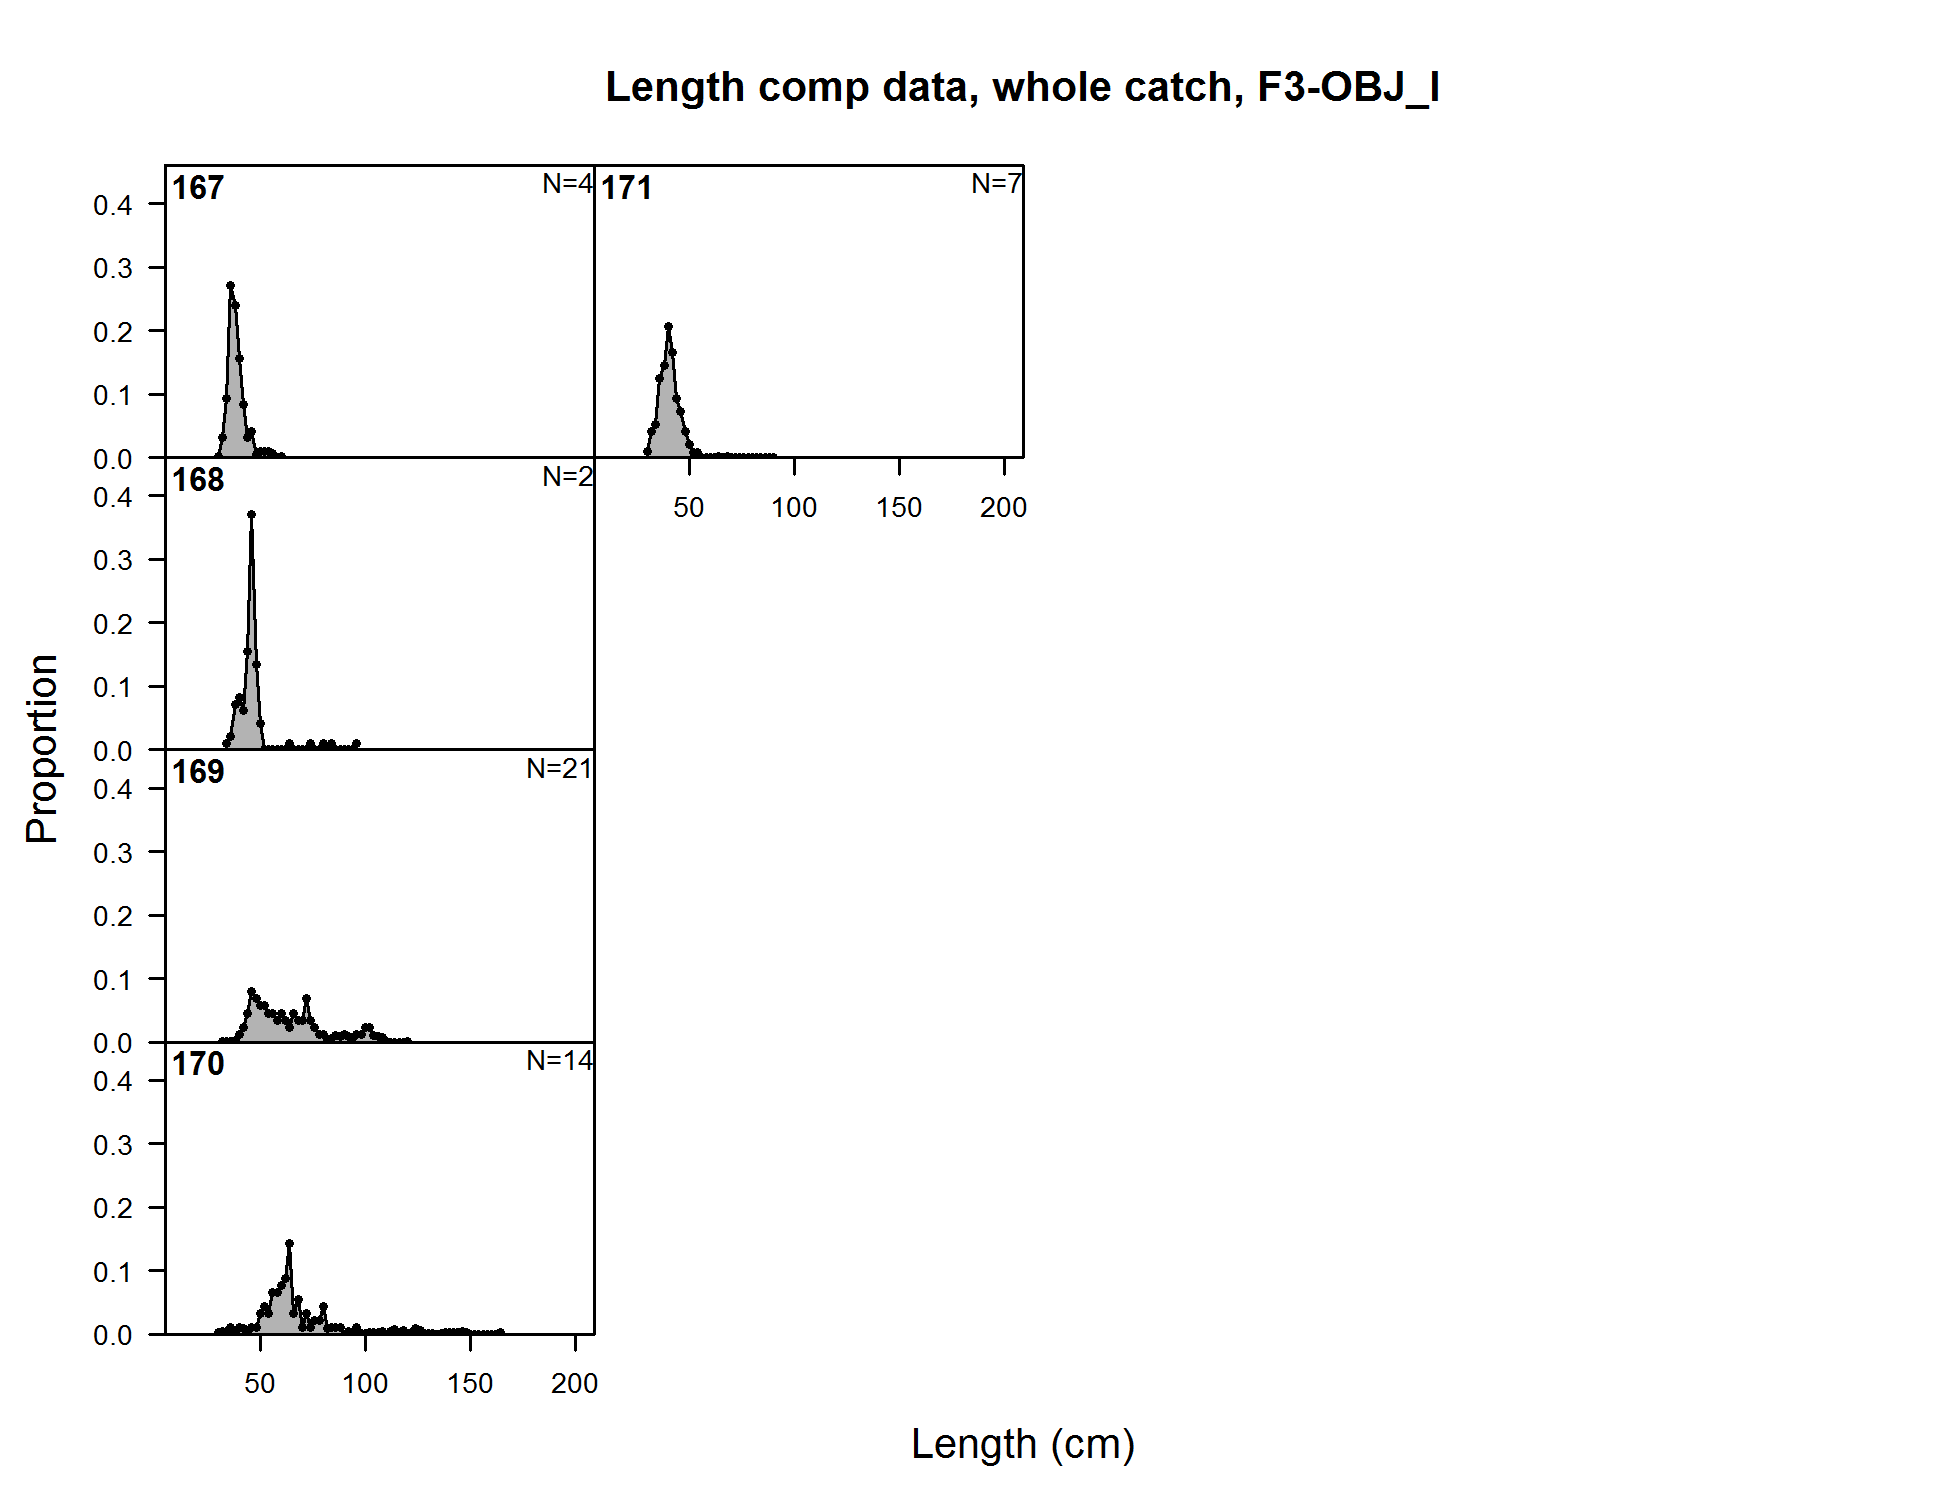
Length comp data, whole catch, F3-OBJ_I (plot 1 of 9) (plot 2 of 9) (plot 3 of 9) (plot 4 of 9) (plot 5 of 9) (plot 6 of 9) (plot 7 of 9) (plot 8 of 9) (plot 9 of 9)
file: comp_lendat_flt3mkt0_page9.png
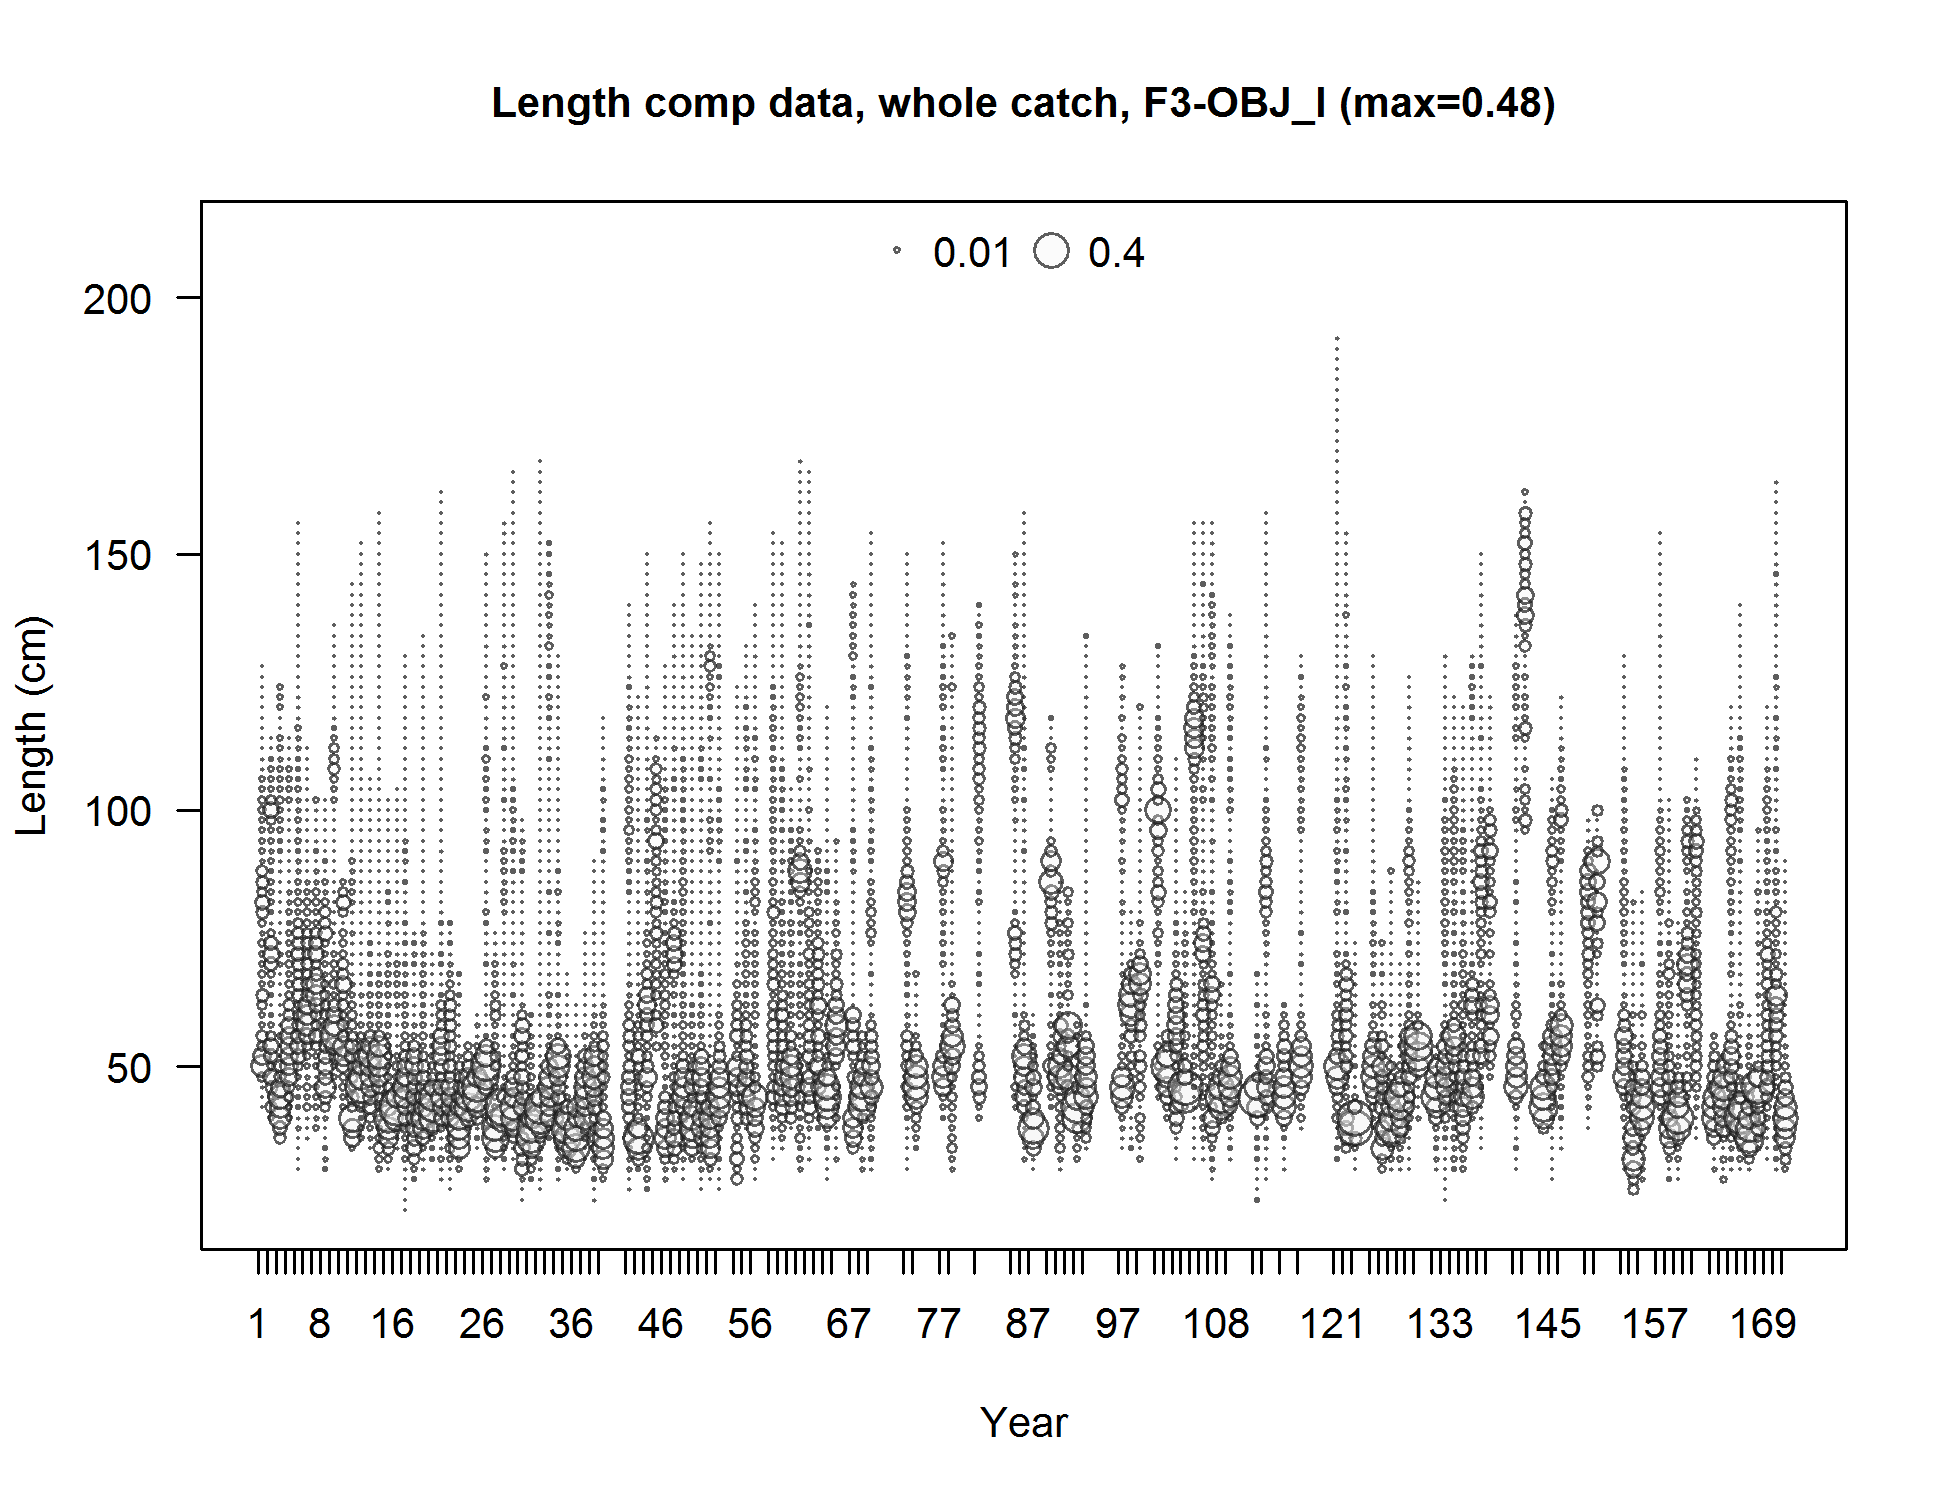
Length comp data, whole catch, F3-OBJ_I (max=0.48) (plot 9 of 9)
file: comp_lendat_bubflt3mkt0_page9.png
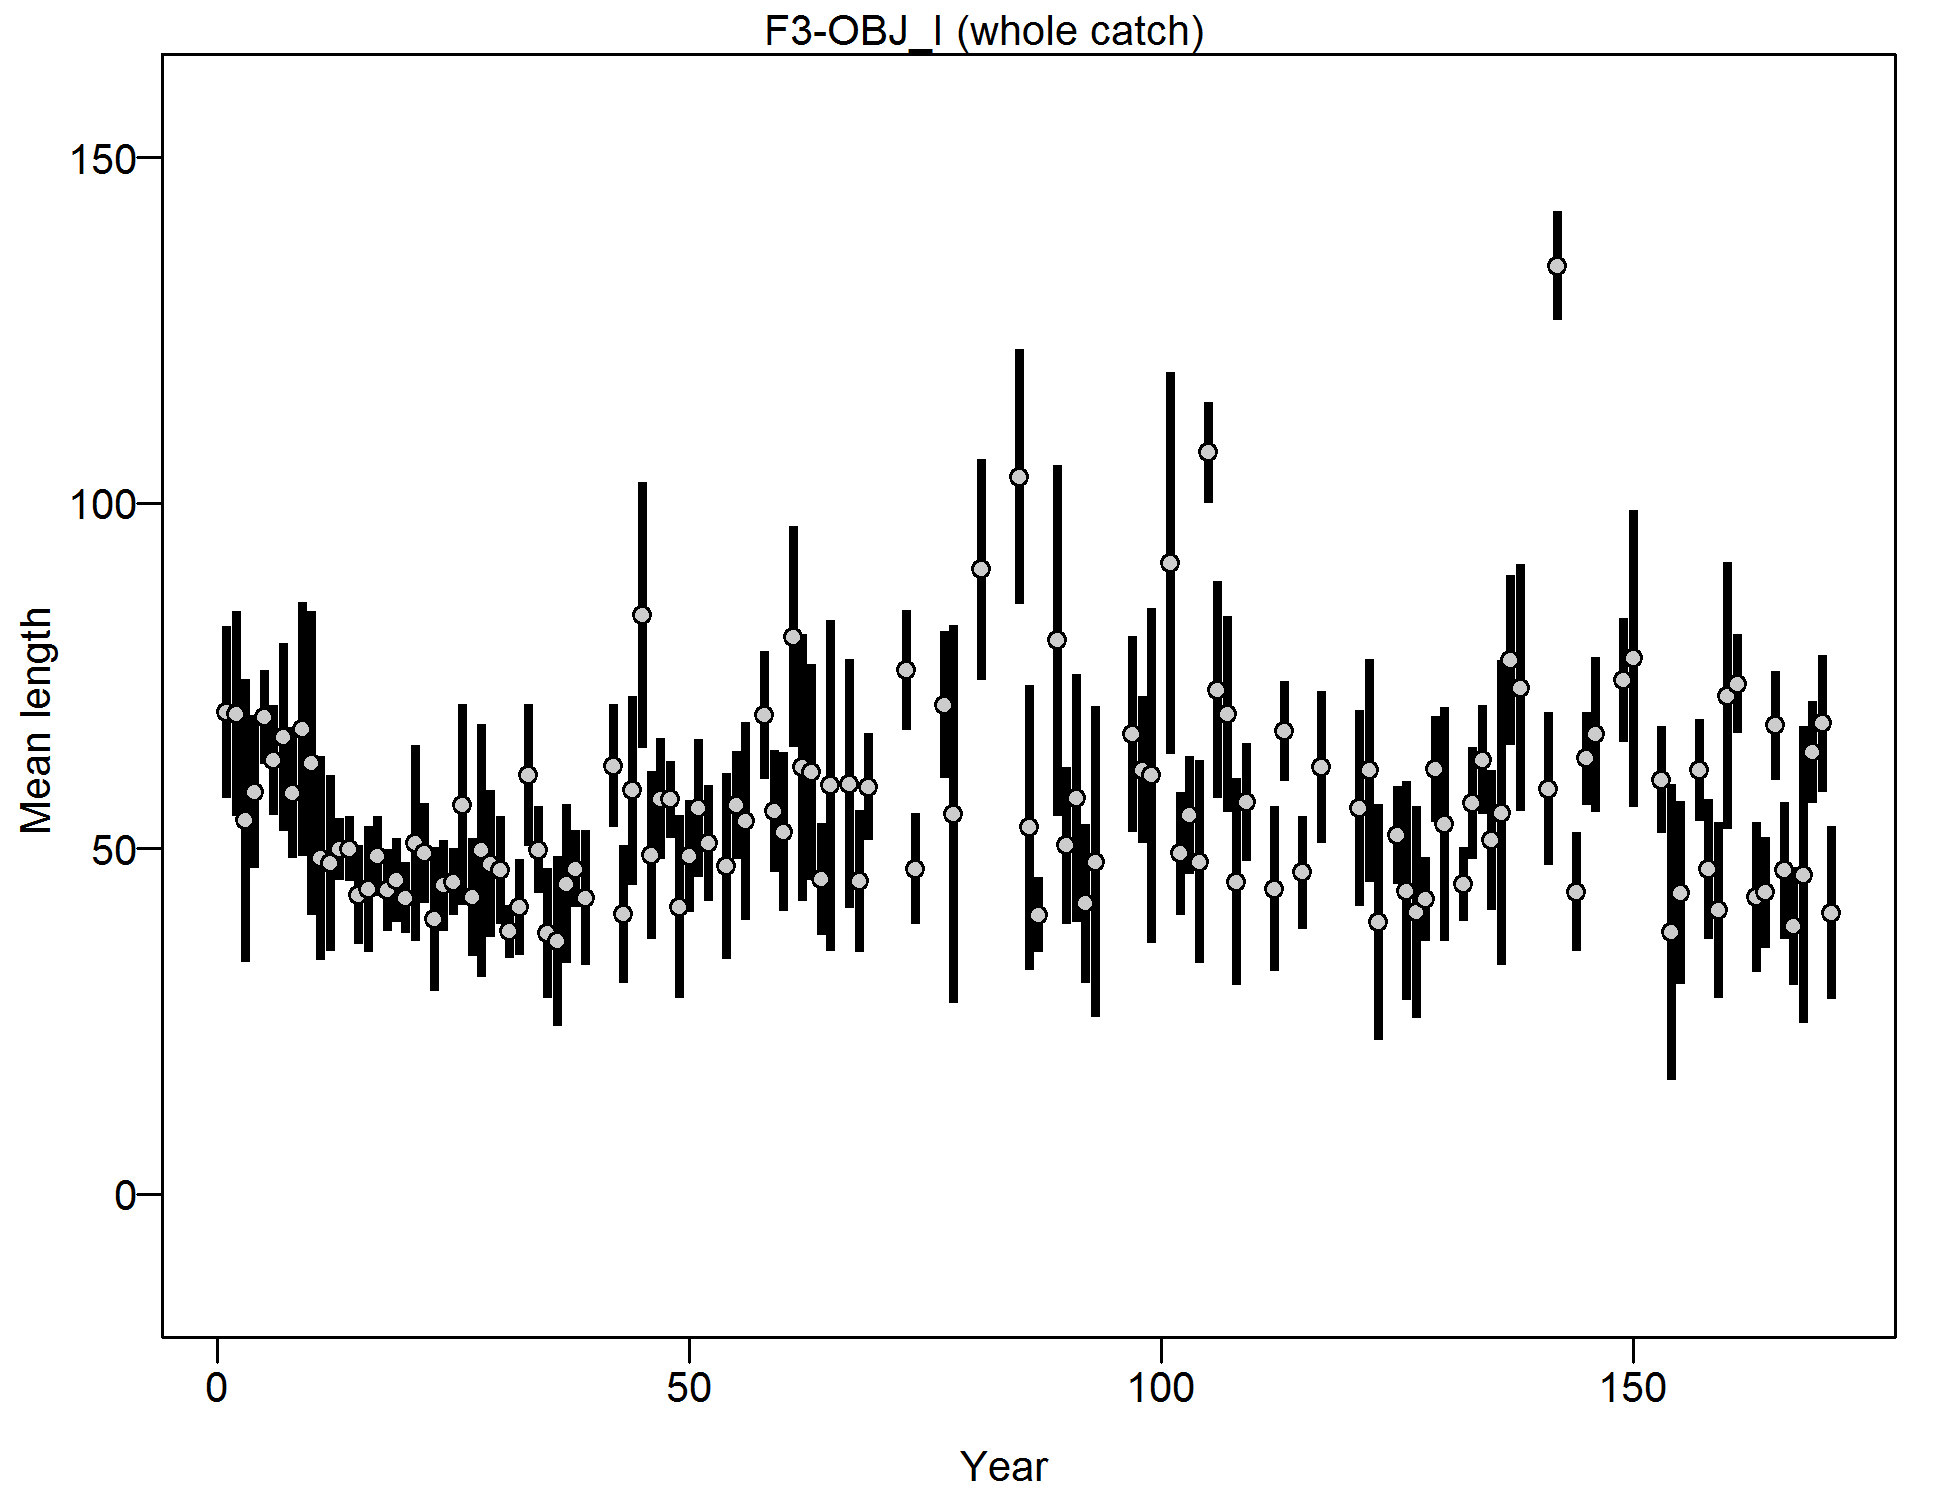
Mean length for F3-OBJ_I with 95% confidence intervals based on current samples sizes.
file: comp_lendat_data_weighting_TA1.8_F3-OBJ_I.png
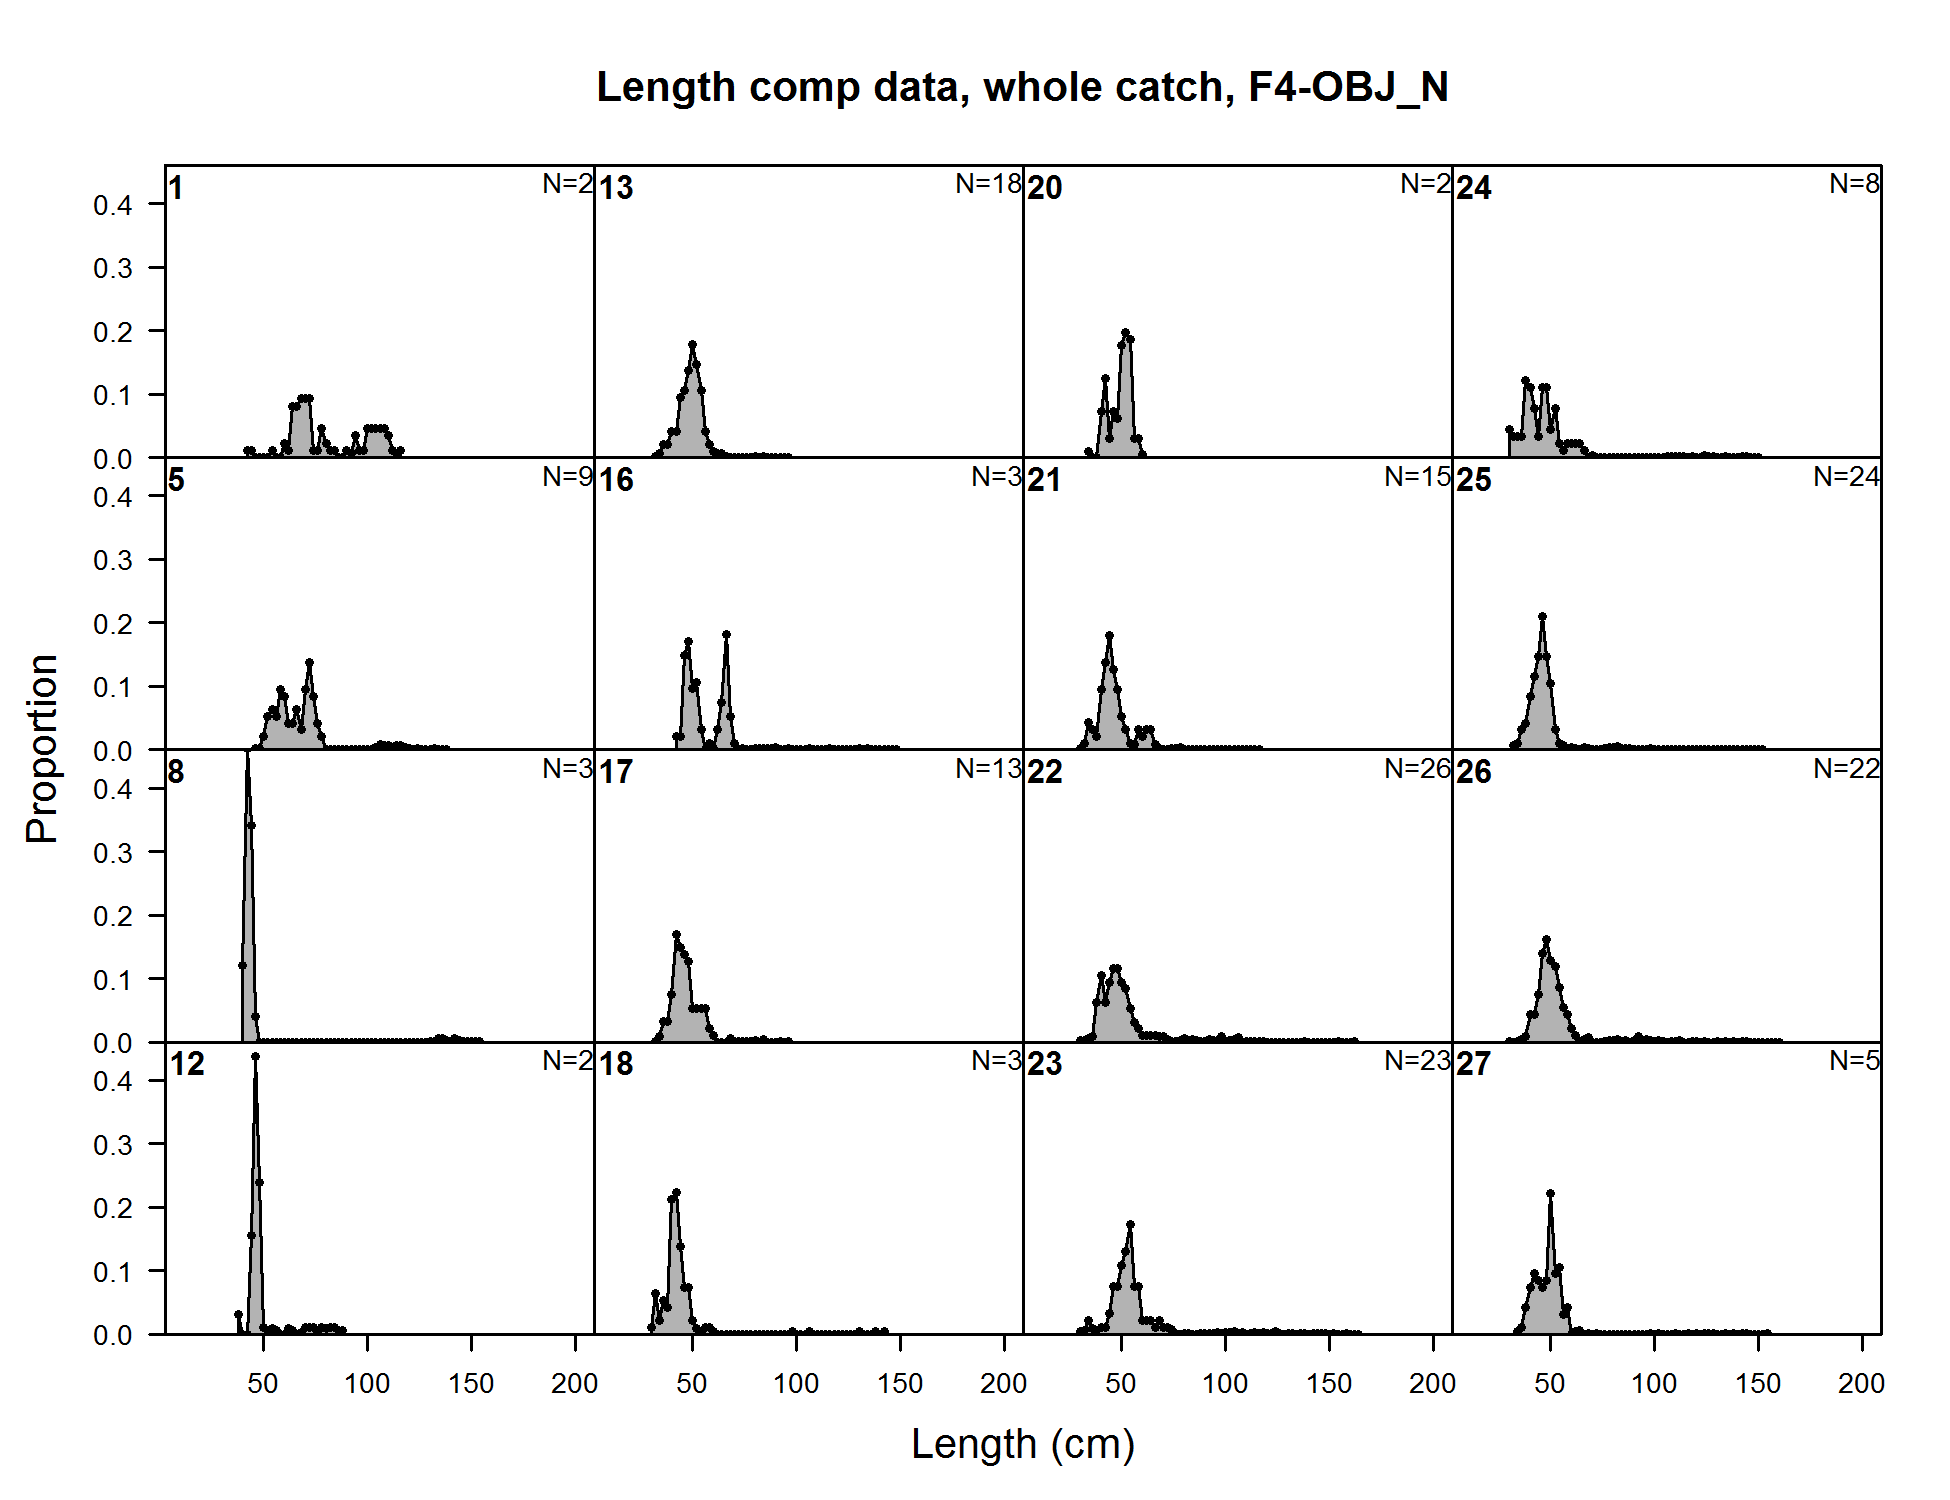
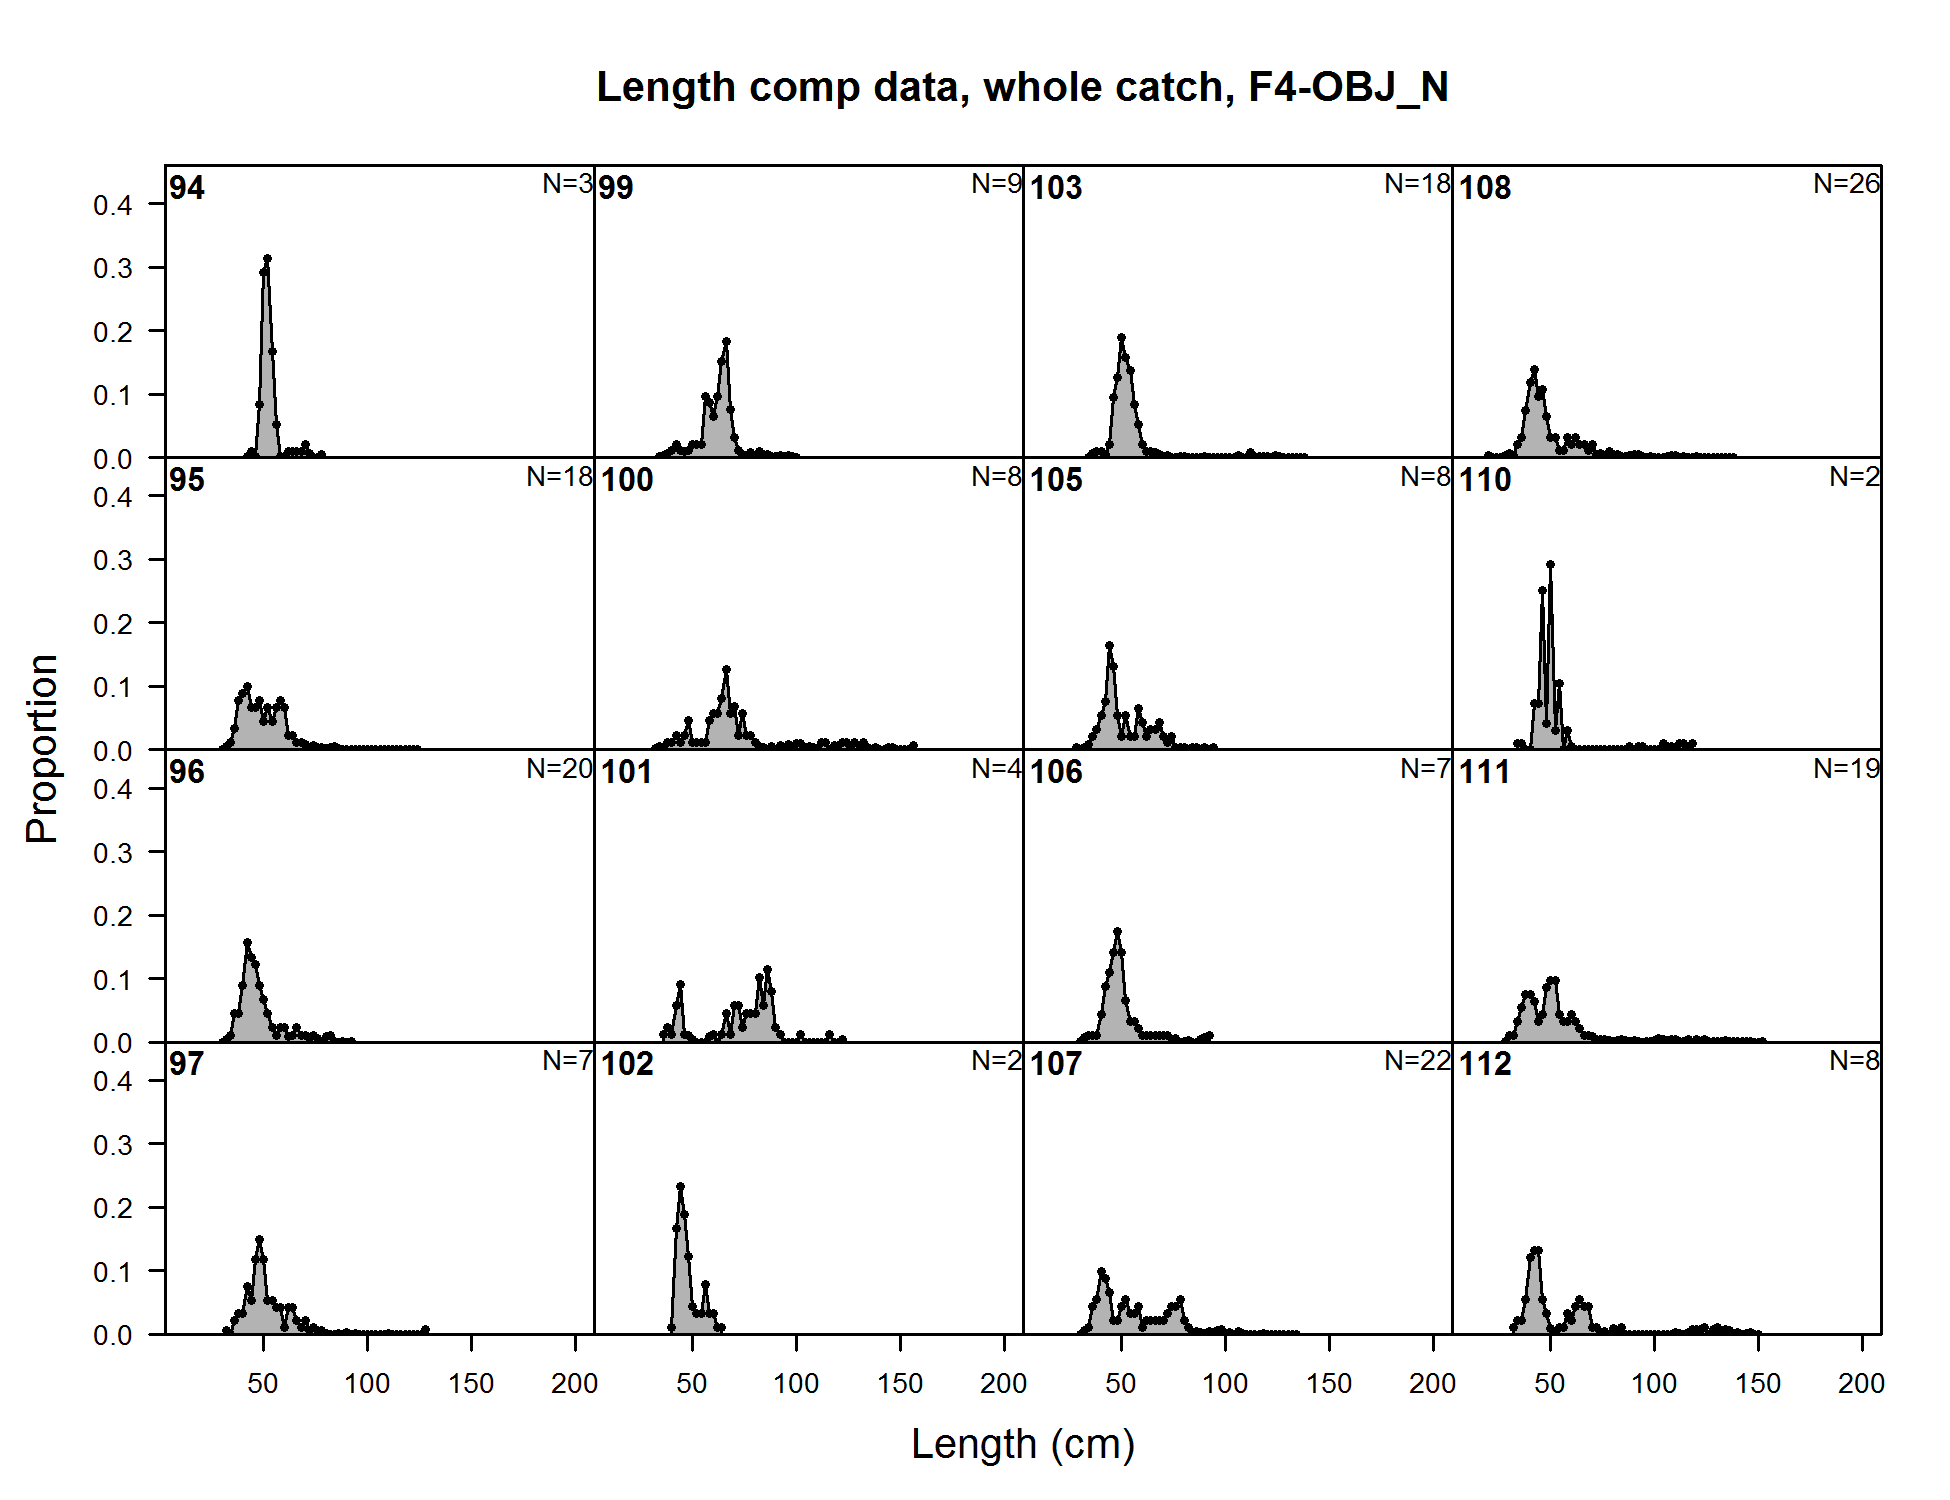
Length comp data, whole catch, F4-OBJ_N (plot 1 of 8)
file: comp_lendat_flt4mkt0_page1.png
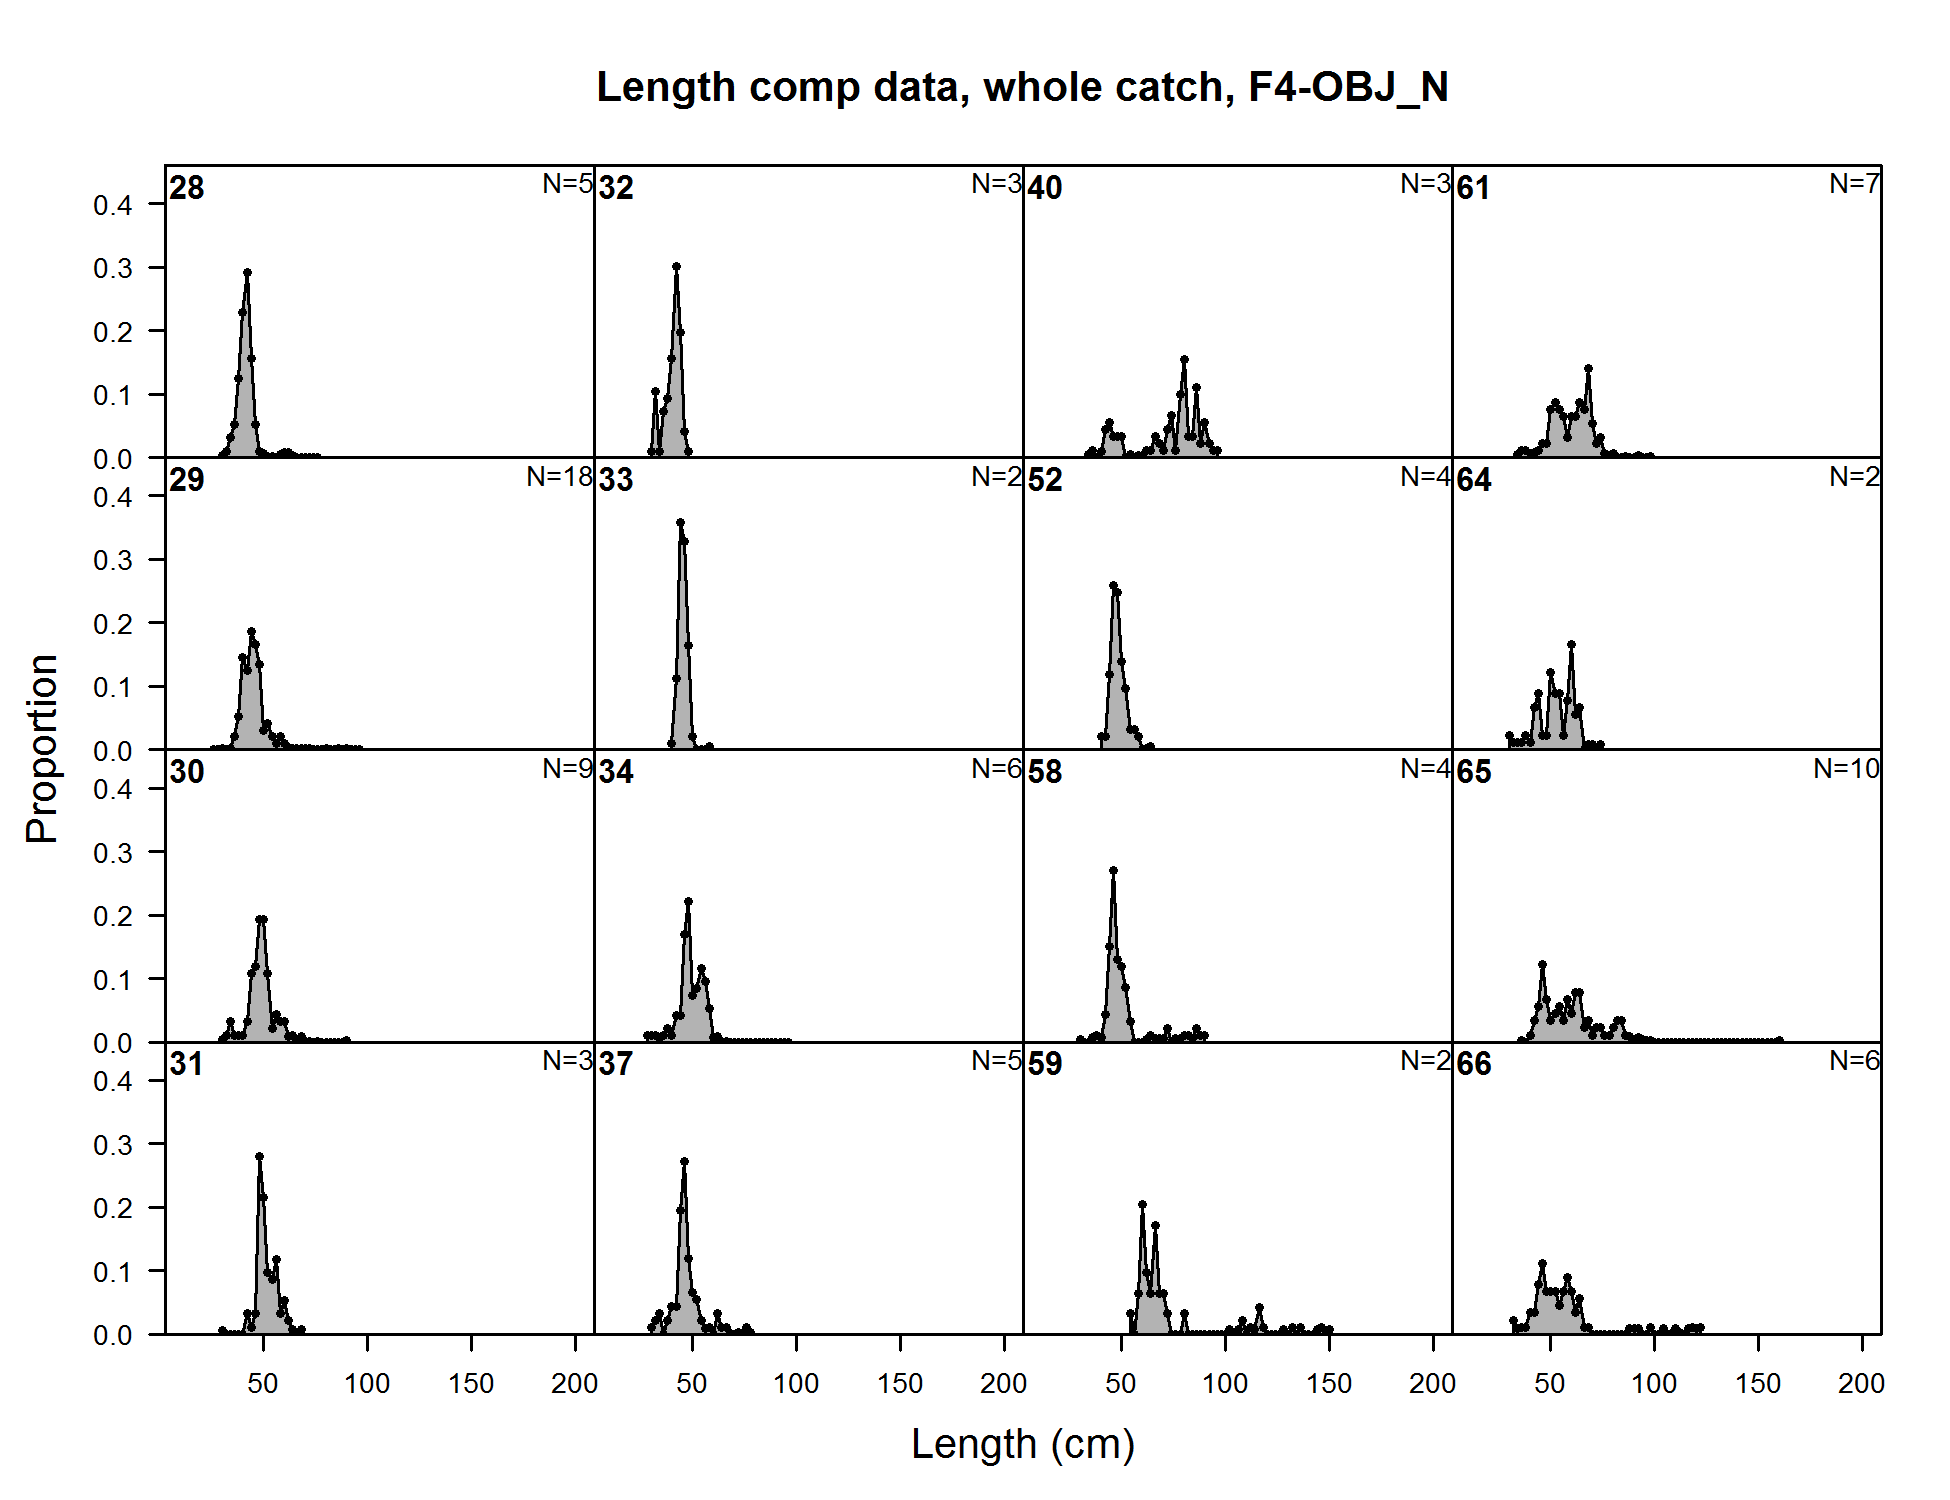
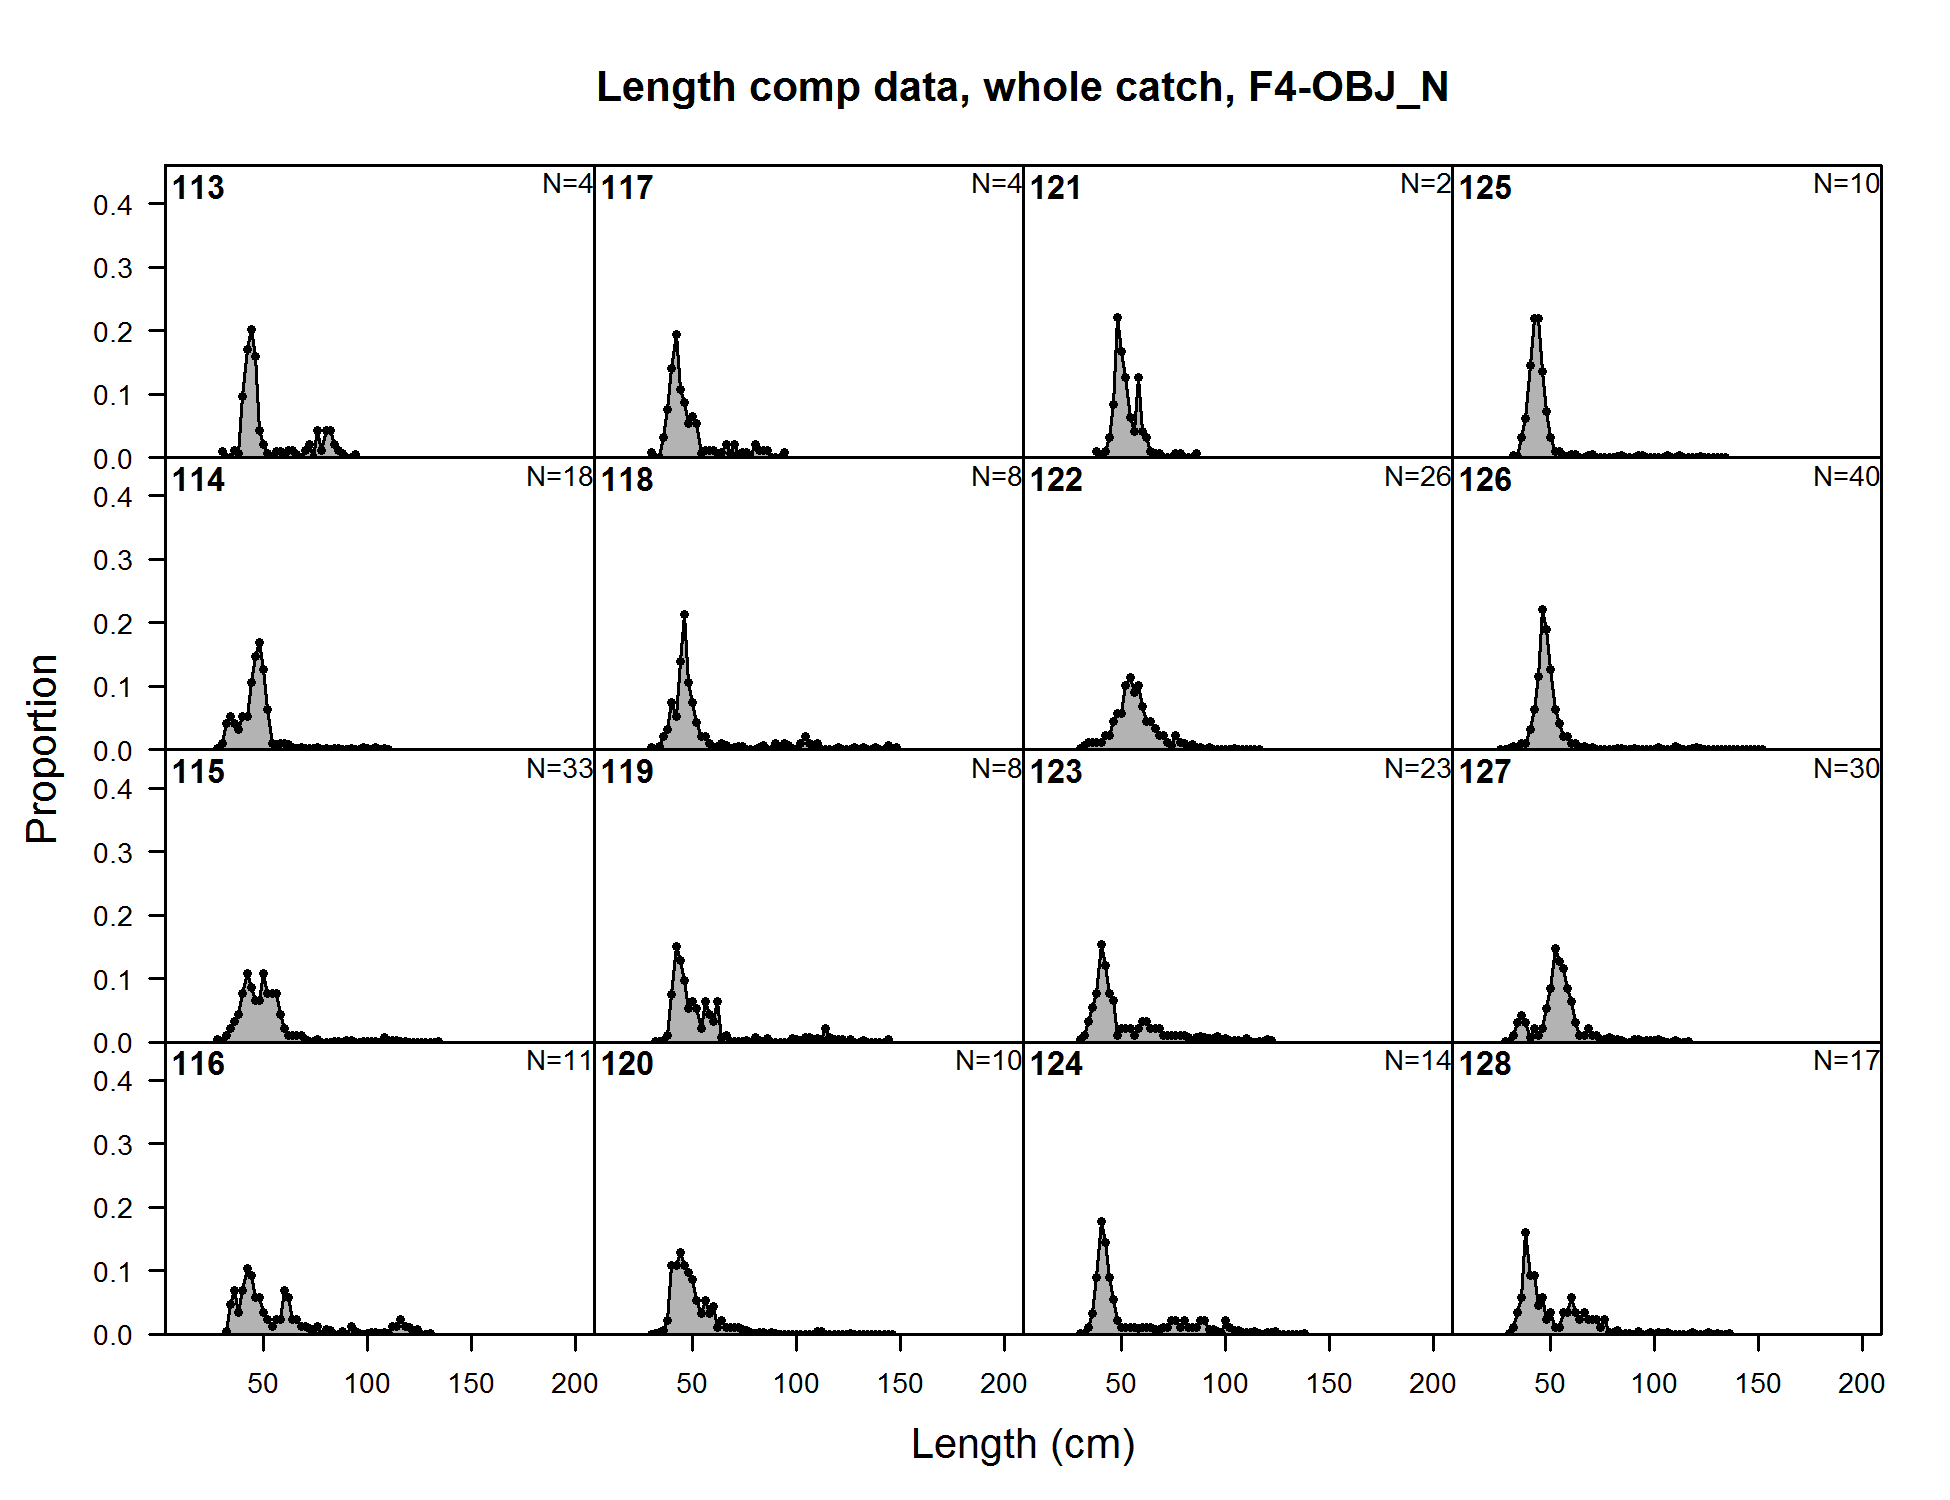
Length comp data, whole catch, F4-OBJ_N (plot 1 of 8) (plot 2 of 8)
file: comp_lendat_flt4mkt0_page2.png
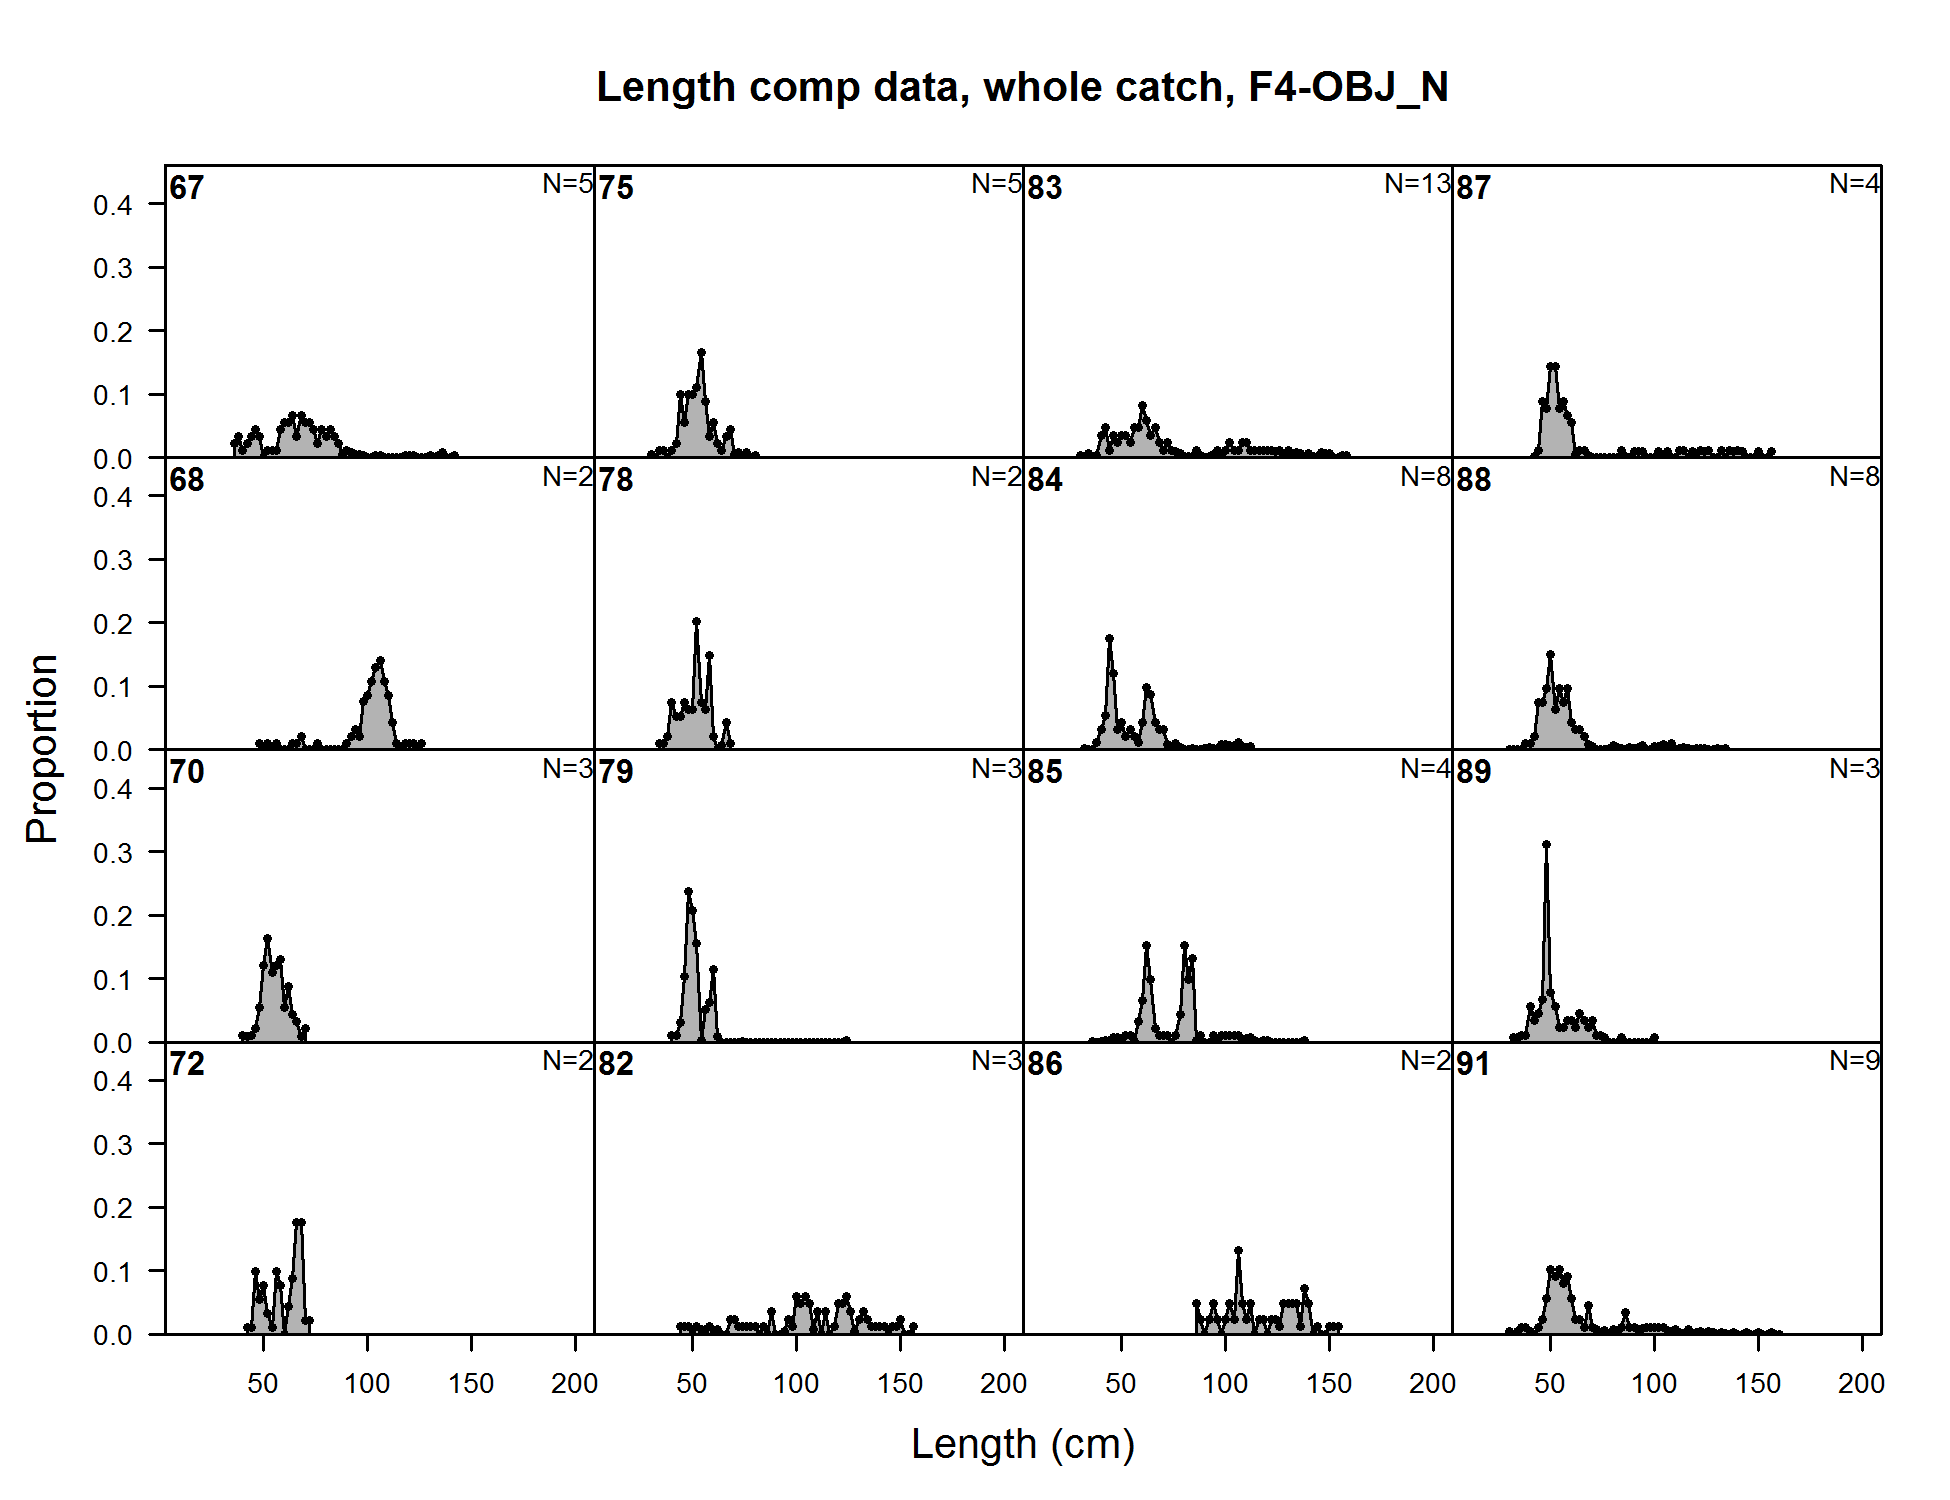
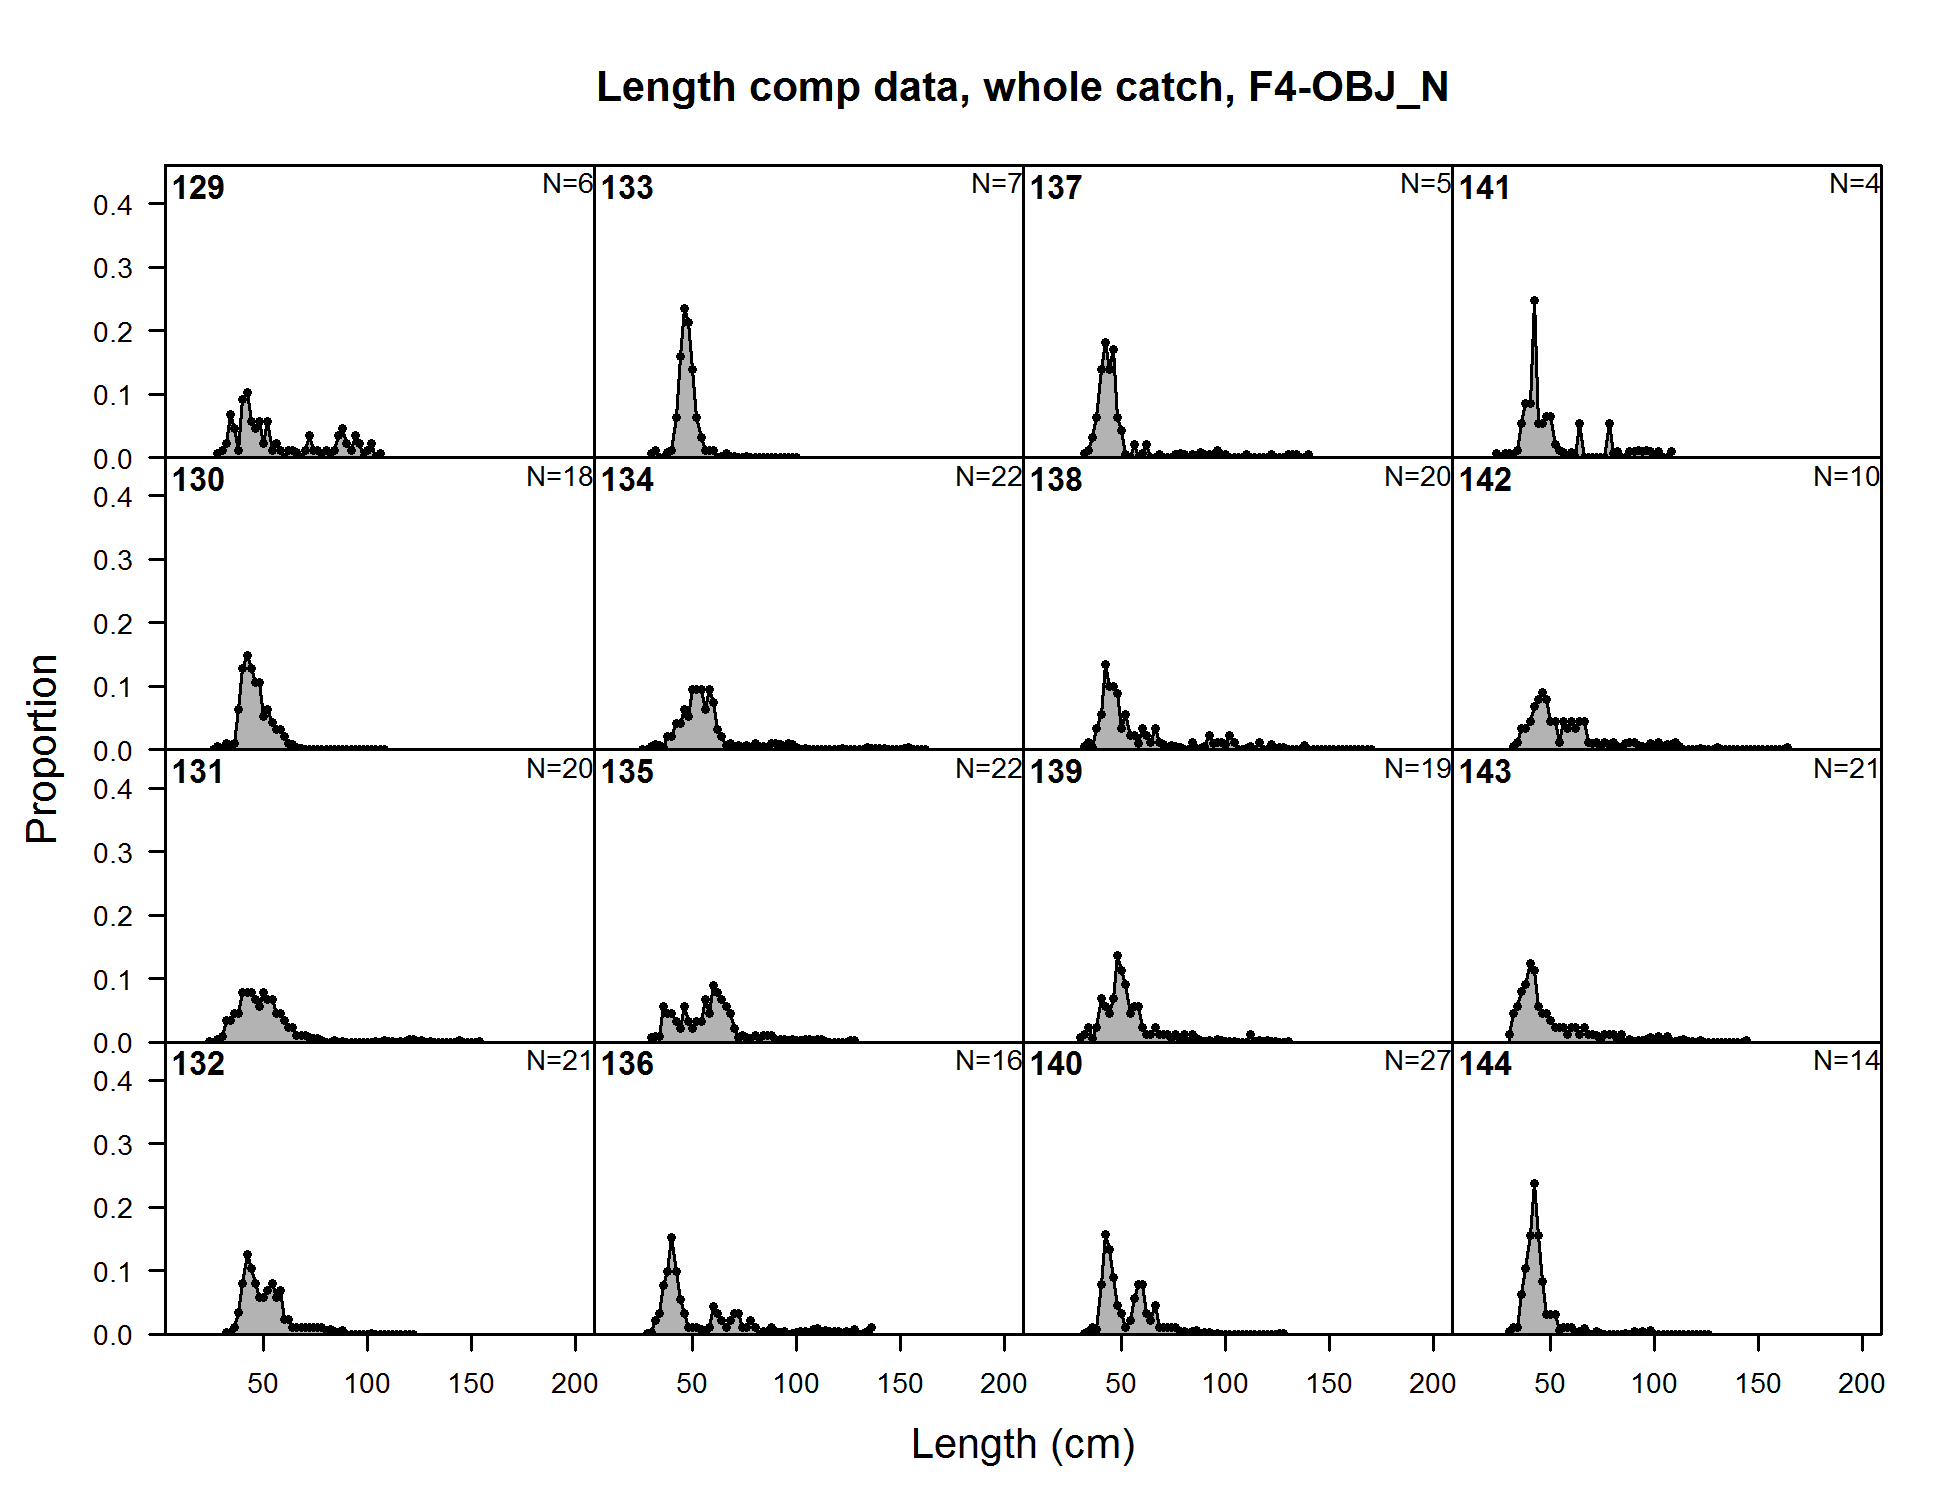
Length comp data, whole catch, F4-OBJ_N (plot 1 of 8) (plot 2 of 8) (plot 3 of 8)
file: comp_lendat_flt4mkt0_page3.png
Length comp data, whole catch, F4-OBJ_N (plot 1 of 8) (plot 2 of 8) (plot 3 of 8) (plot 4 of 8)
file: comp_lendat_flt4mkt0_page4.png
Length comp data, whole catch, F4-OBJ_N (plot 1 of 8) (plot 2 of 8) (plot 3 of 8) (plot 4 of 8) (plot 5 of 8)
file: comp_lendat_flt4mkt0_page5.png
Length comp data, whole catch, F4-OBJ_N (plot 1 of 8) (plot 2 of 8) (plot 3 of 8) (plot 4 of 8) (plot 5 of 8) (plot 6 of 8)
file: comp_lendat_flt4mkt0_page6.png

Length comp data, whole catch, F4-OBJ_N (plot 1 of 8) (plot 2 of 8) (plot 3 of 8) (plot 4 of 8) (plot 5 of 8) (plot 6 of 8) (plot 7 of 8)
file: comp_lendat_flt4mkt0_page7.png
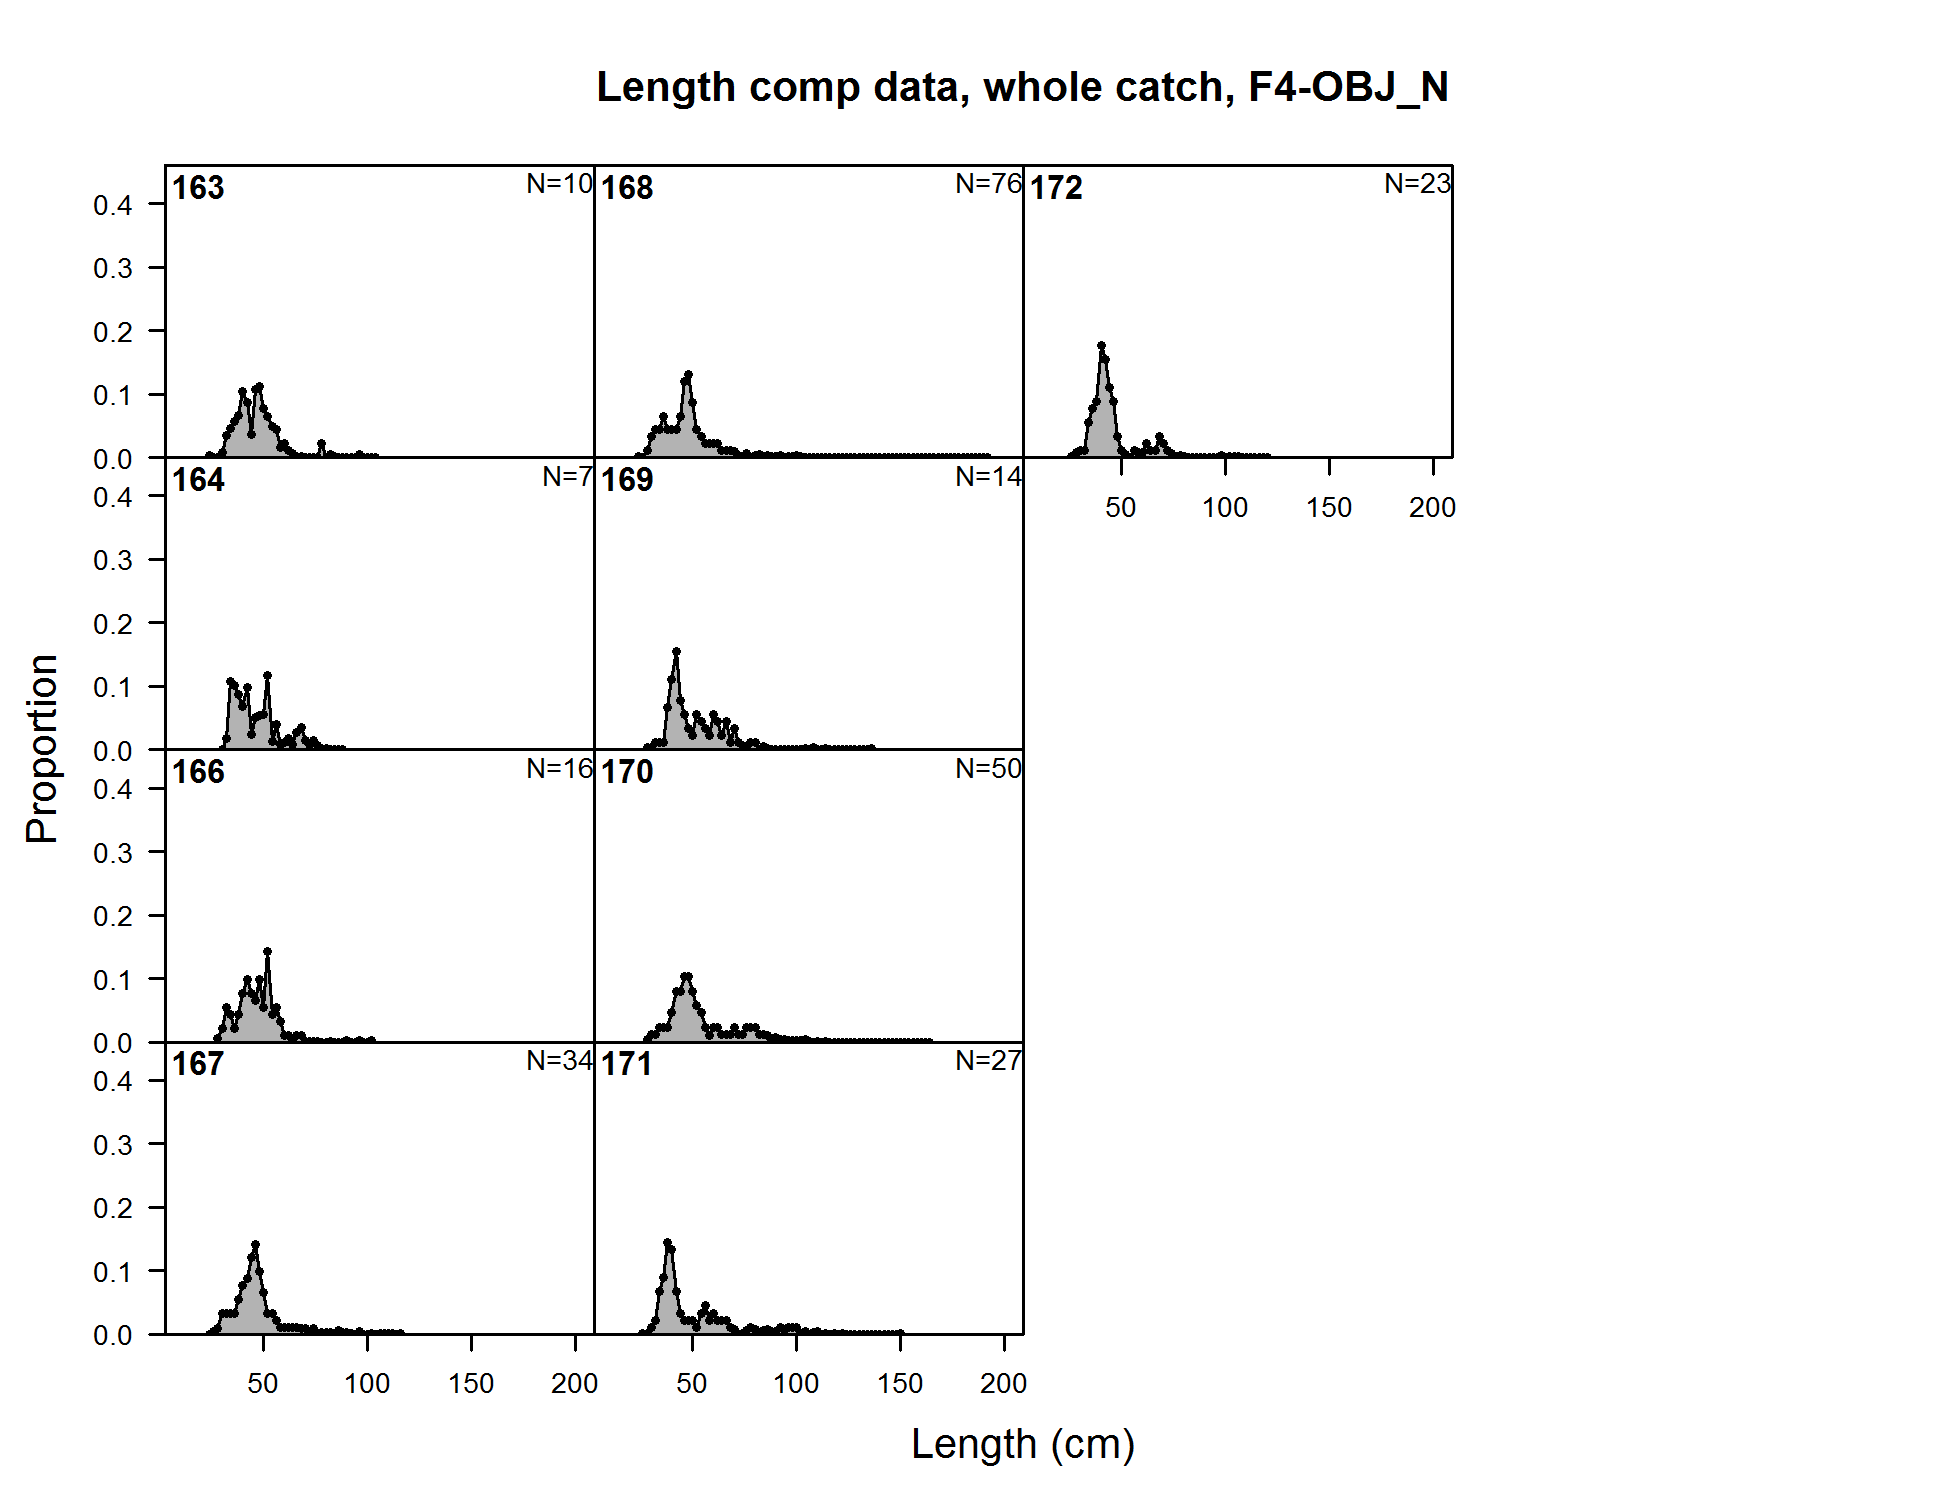
Length comp data, whole catch, F4-OBJ_N (plot 1 of 8) (plot 2 of 8) (plot 3 of 8) (plot 4 of 8) (plot 5 of 8) (plot 6 of 8) (plot 7 of 8) (plot 8 of 8)
file: comp_lendat_flt4mkt0_page8.png
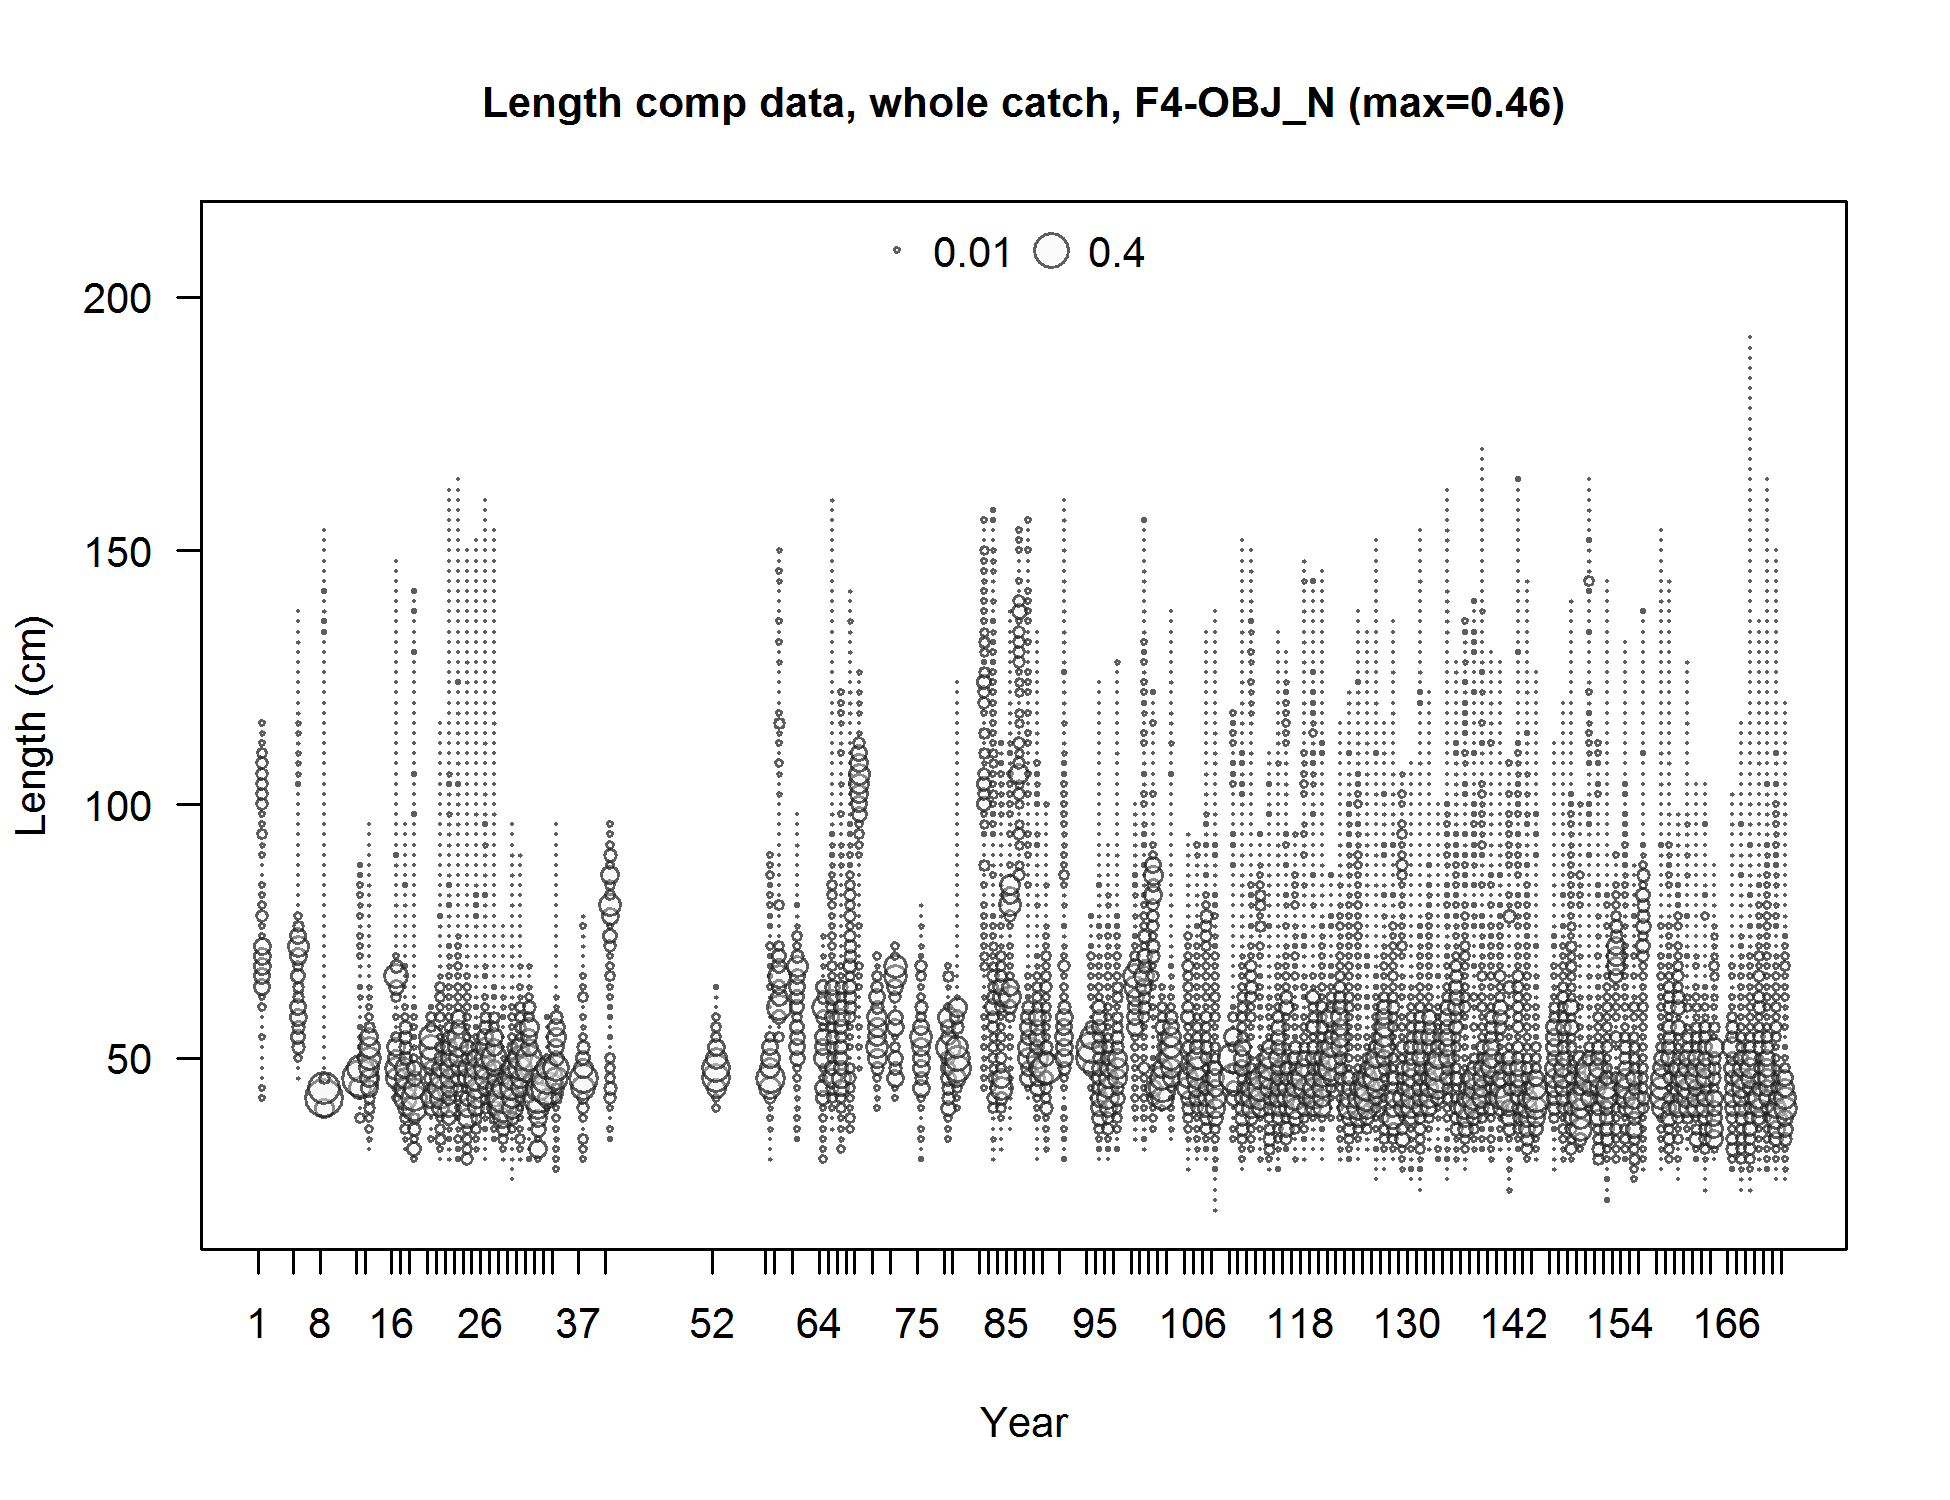
Length comp data, whole catch, F4-OBJ_N (max=0.46) (plot 8 of 8)
file: comp_lendat_bubflt4mkt0_page8.png
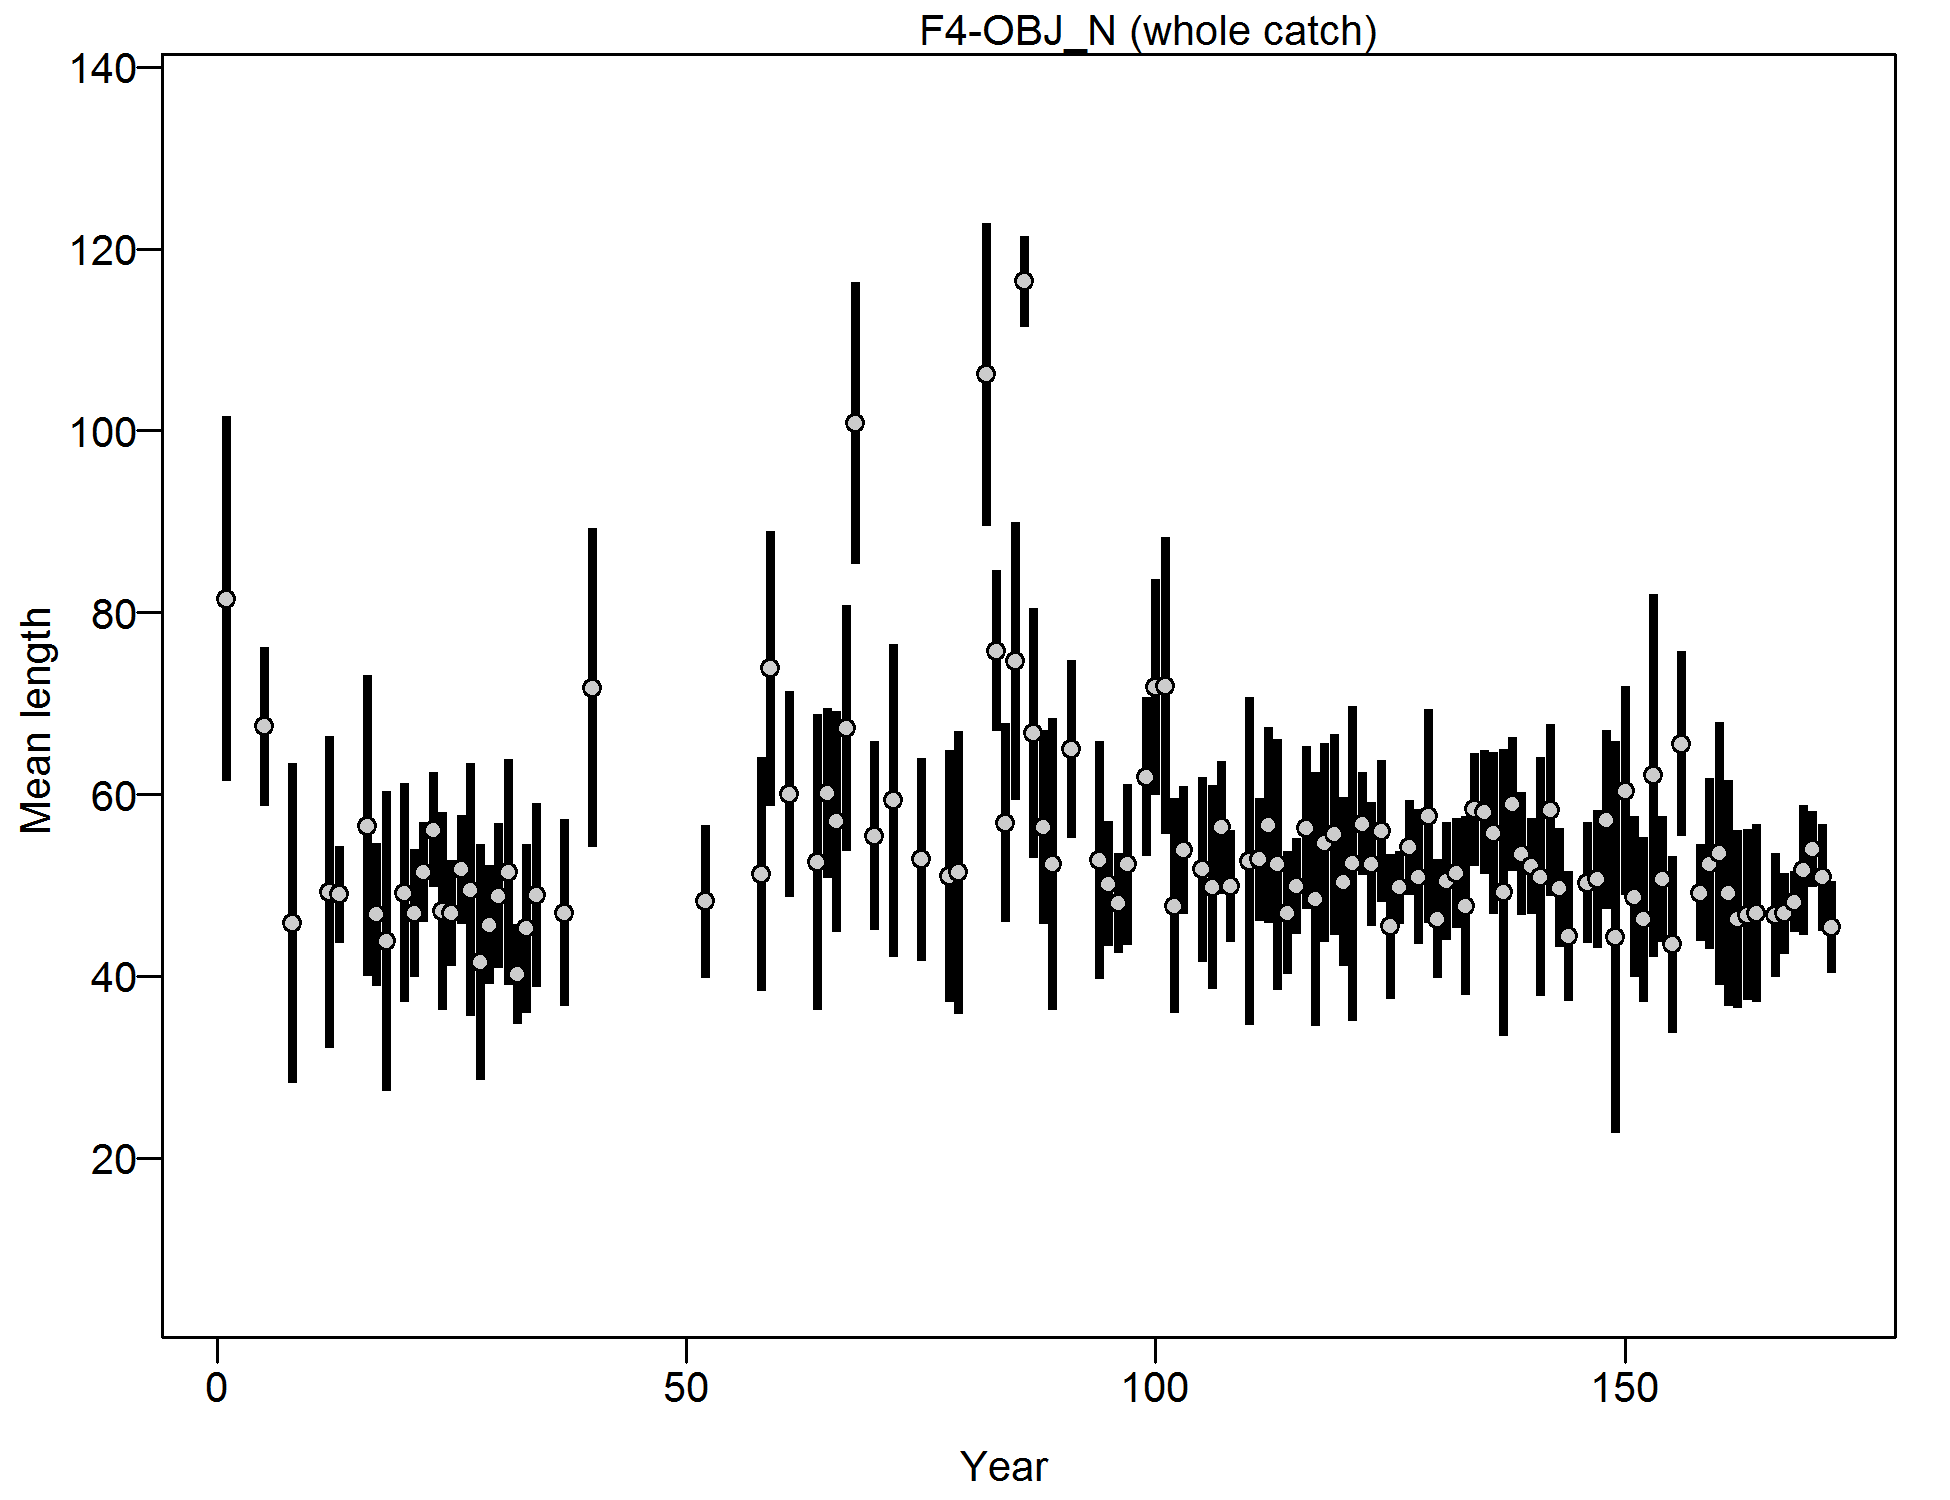
Mean length for F4-OBJ_N with 95% confidence intervals based on current samples sizes.
file: comp_lendat_data_weighting_TA1.8_F4-OBJ_N.png

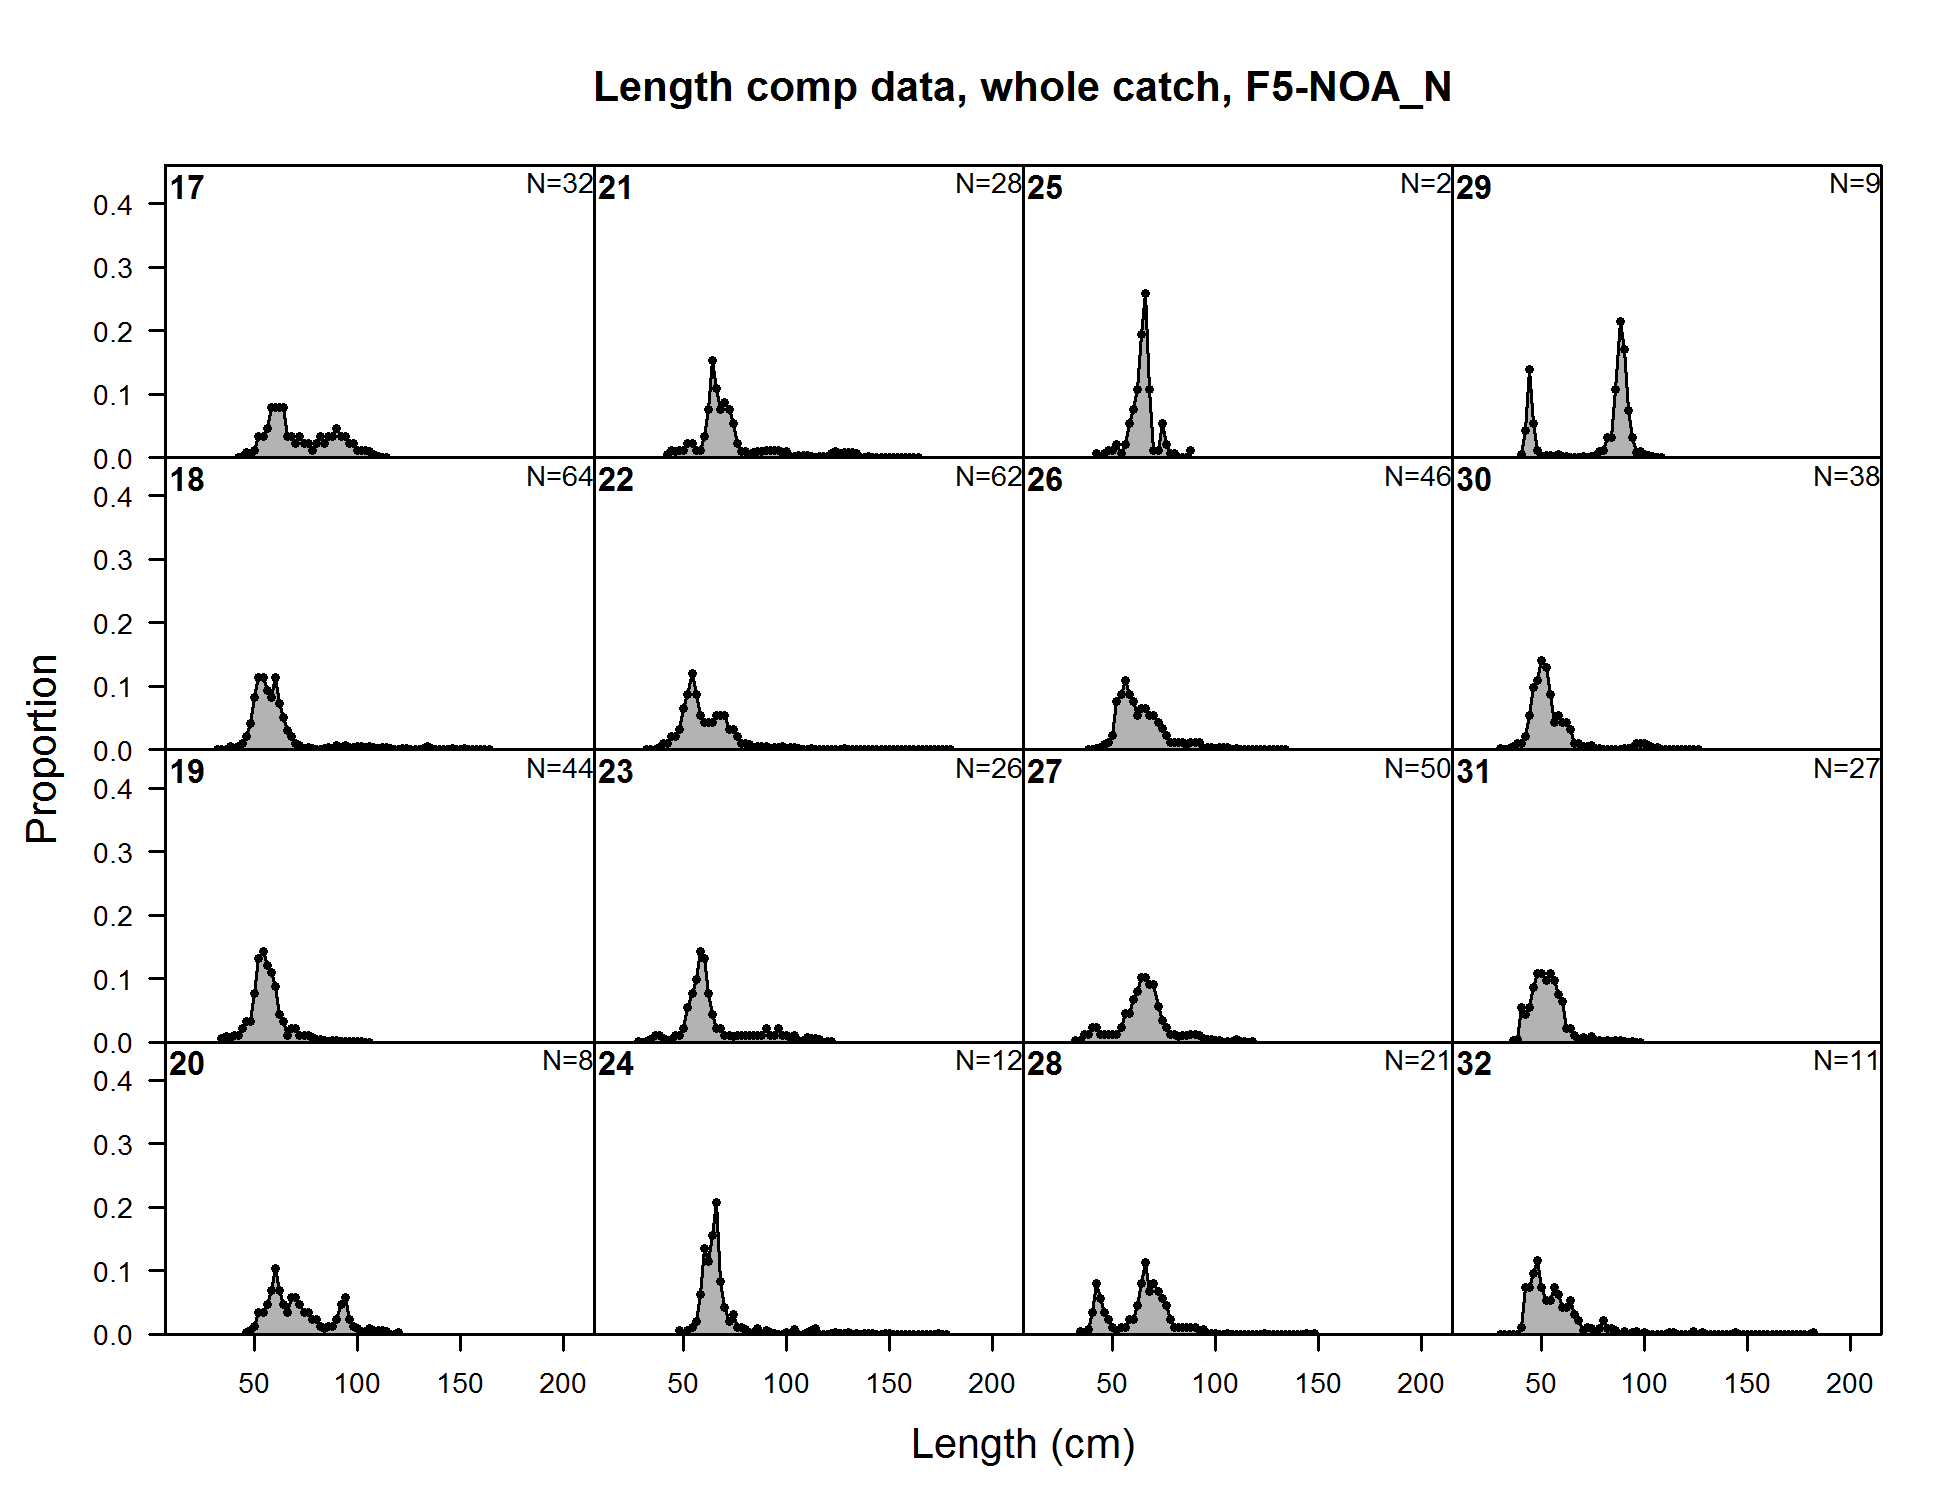
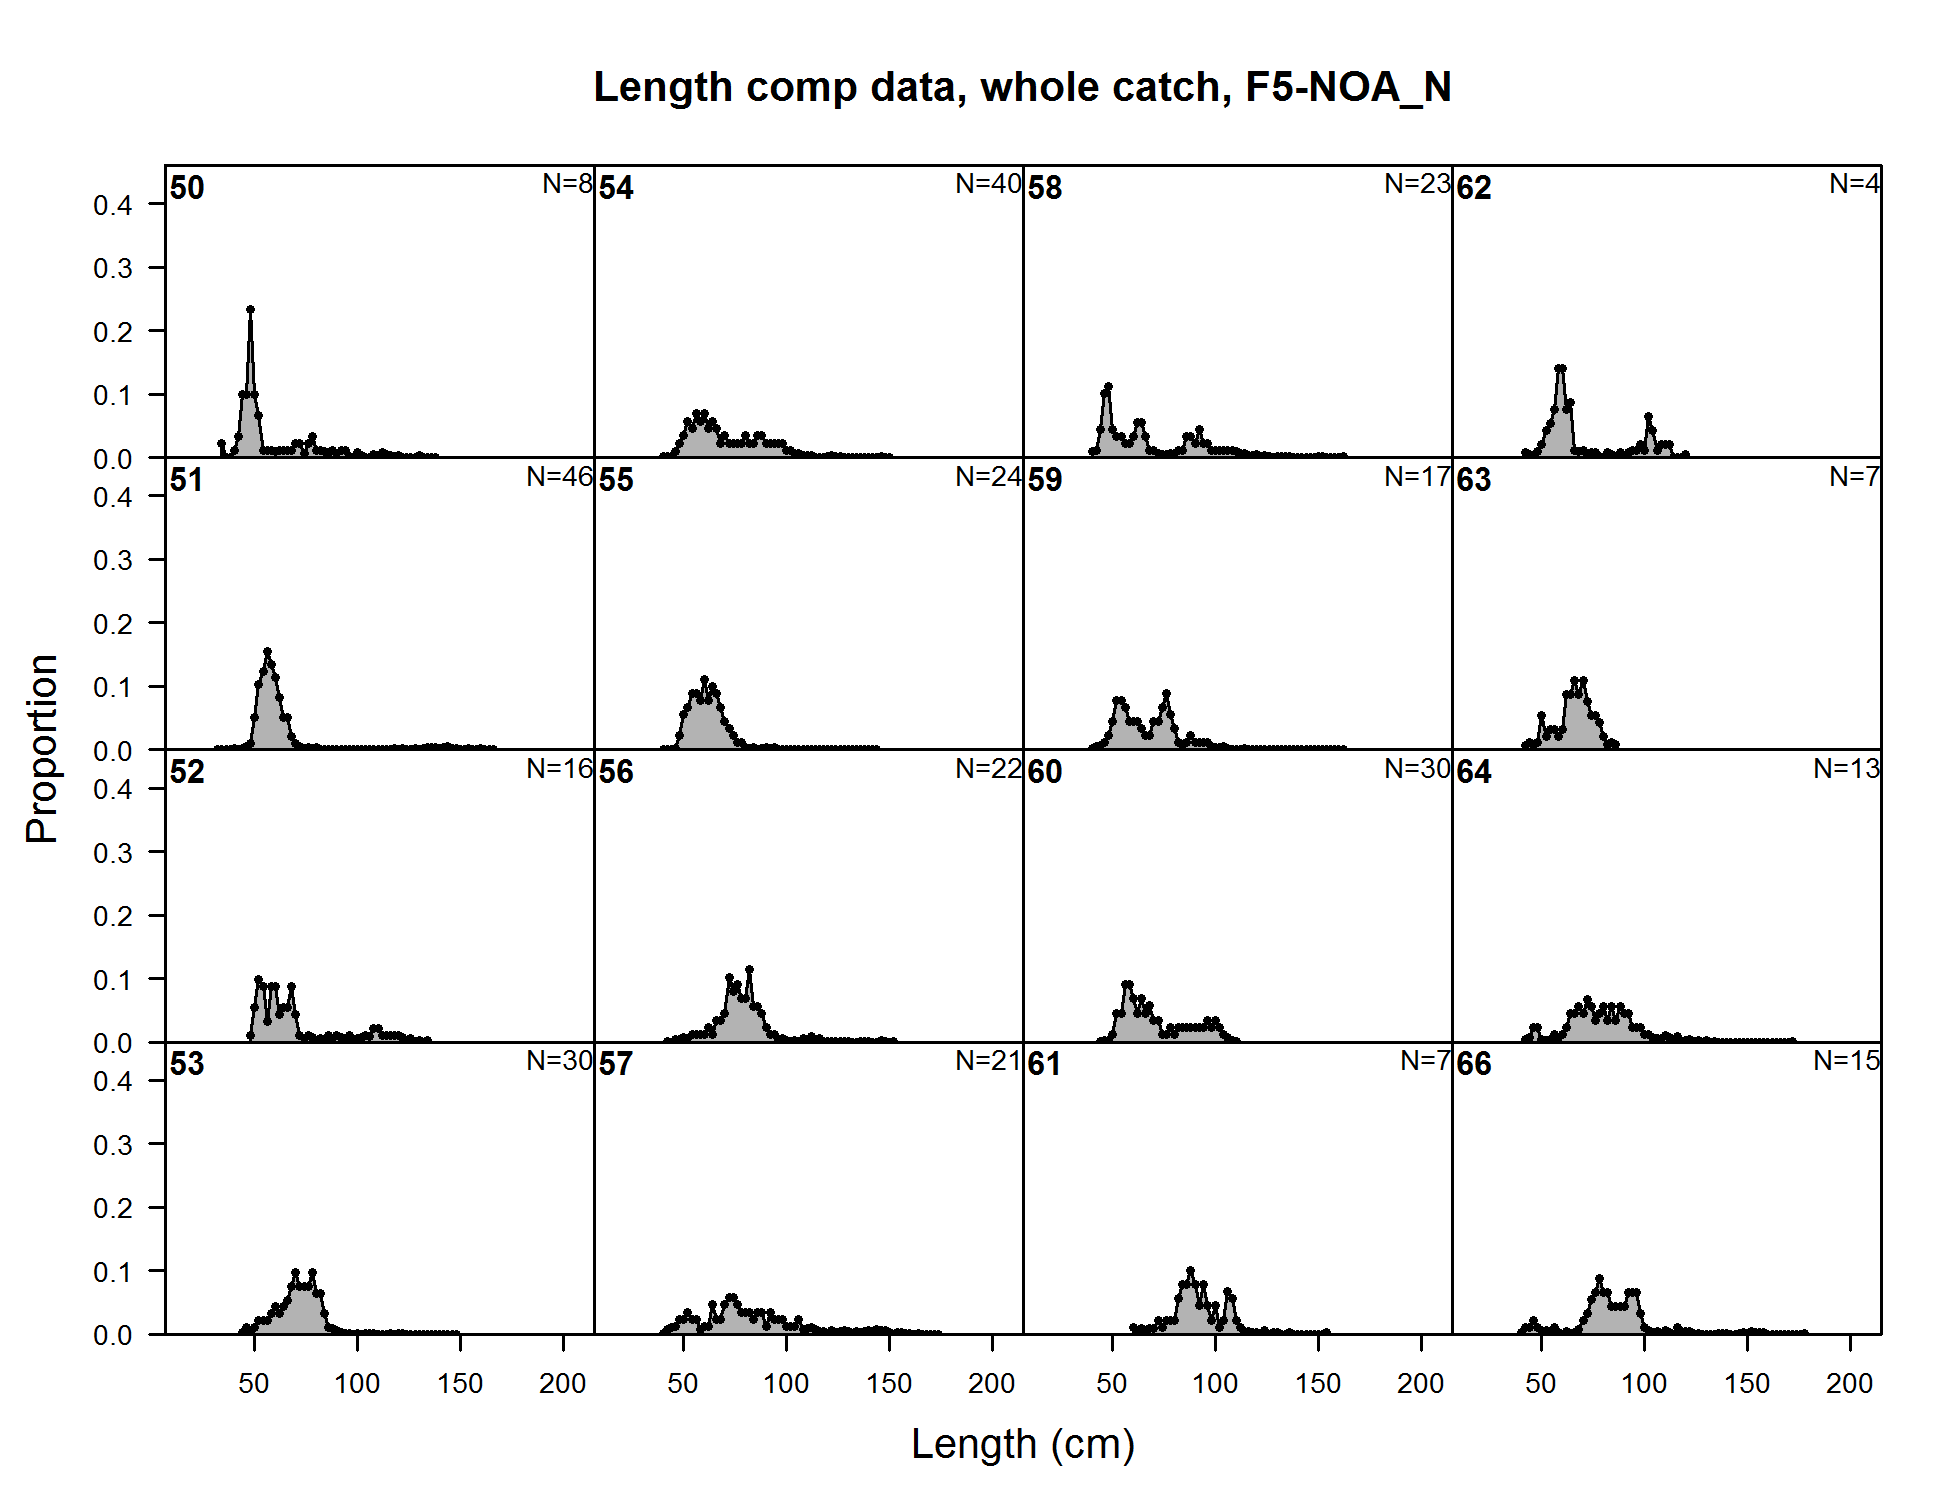
Length comp data, whole catch, F5-NOA_N (plot 1 of 11)
file: comp_lendat_flt5mkt0_page1.png
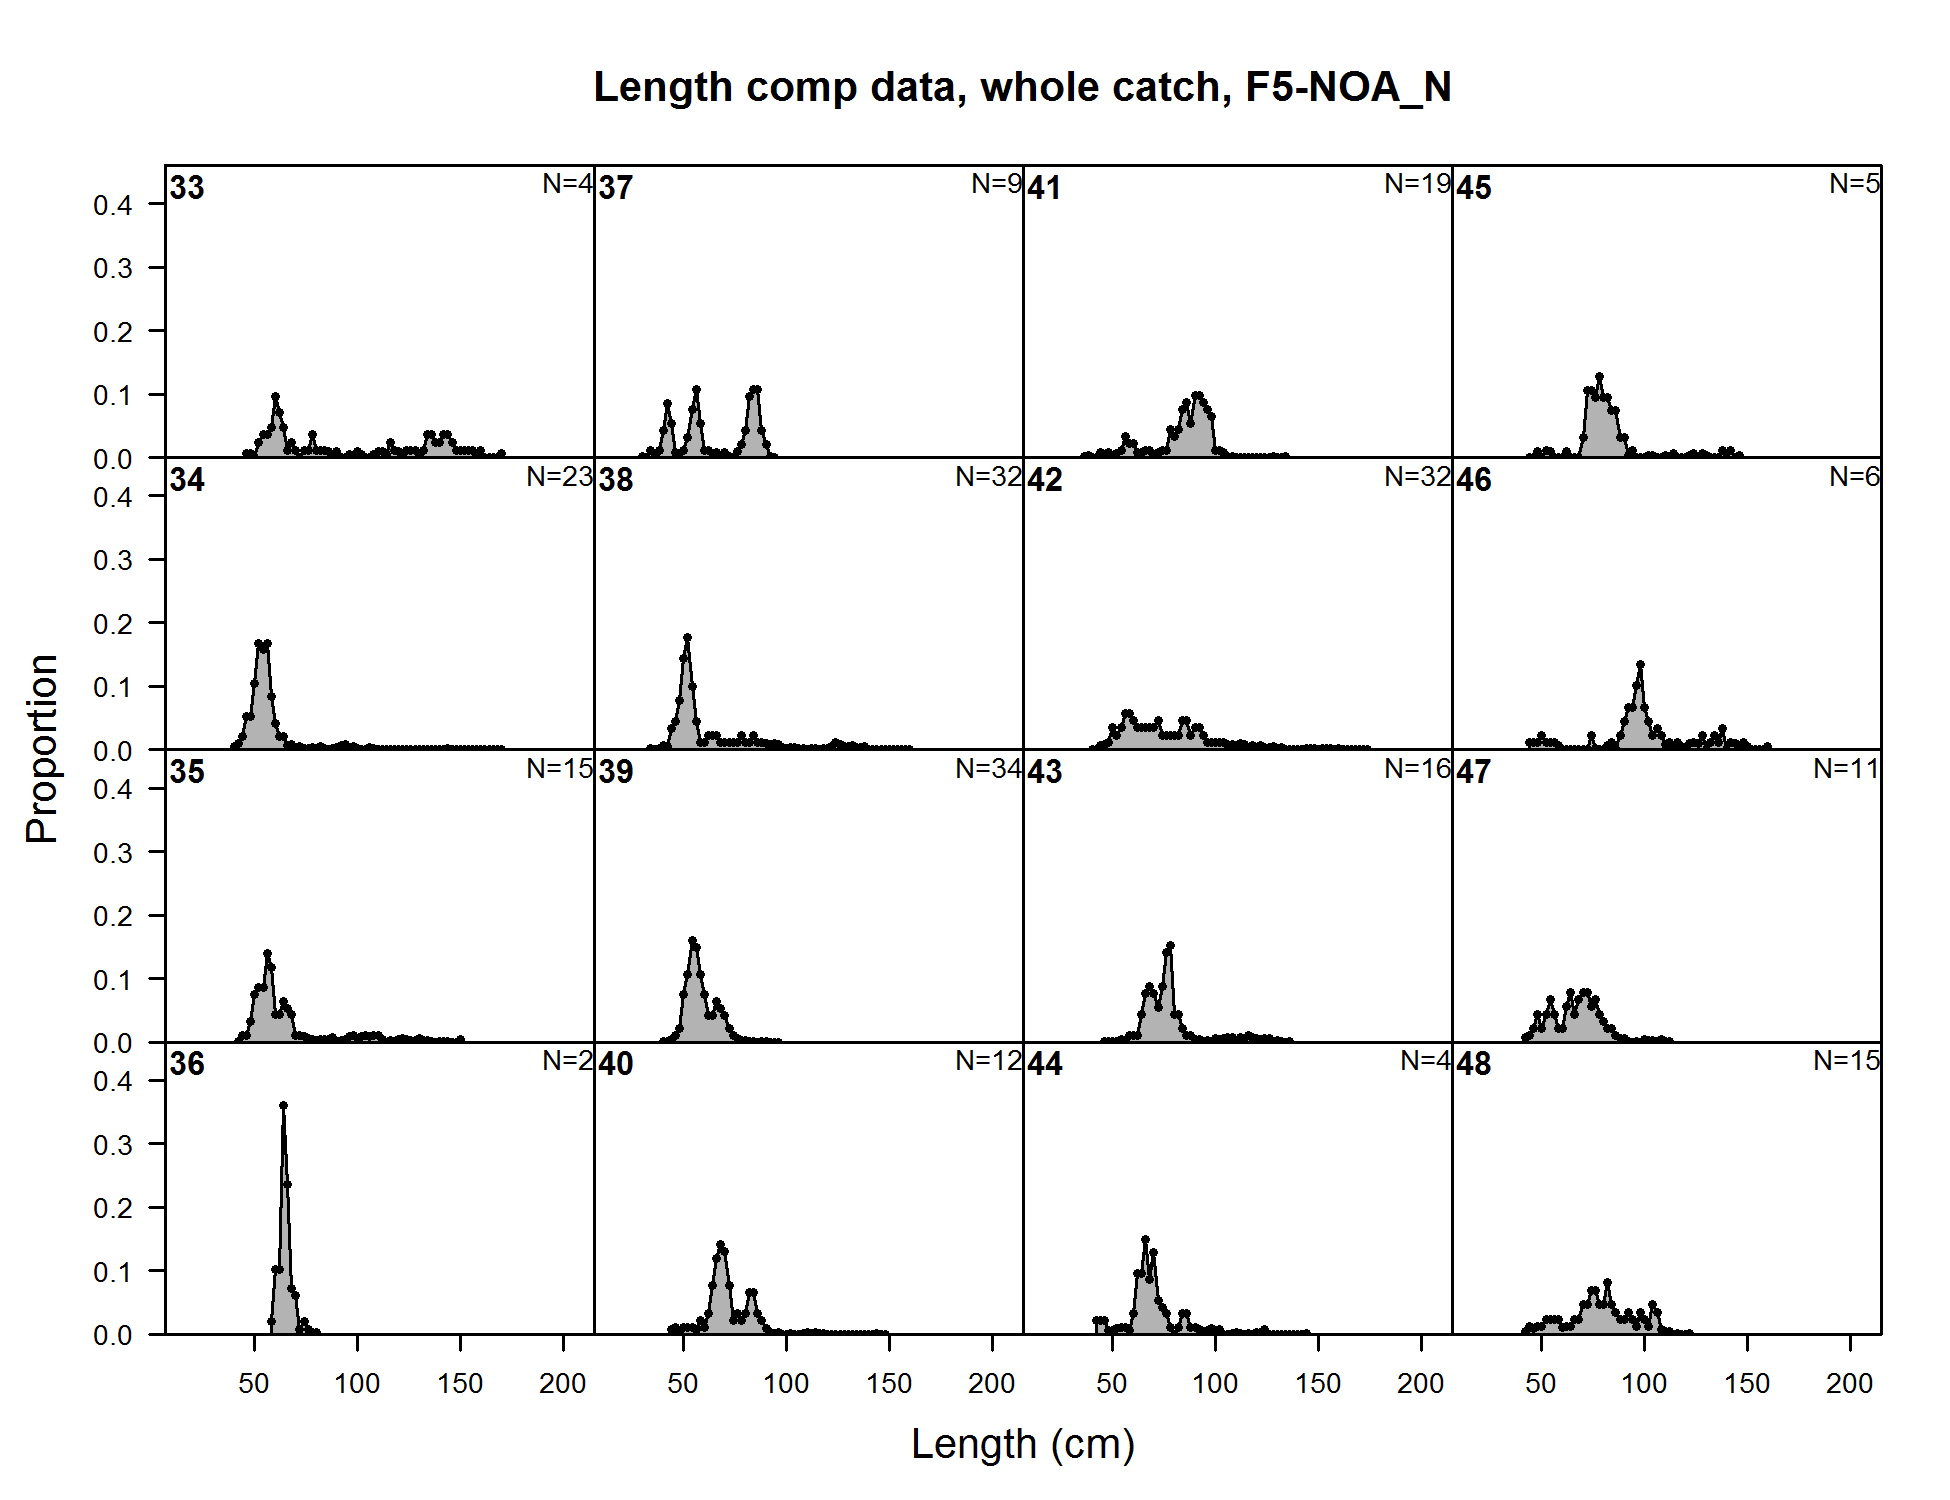
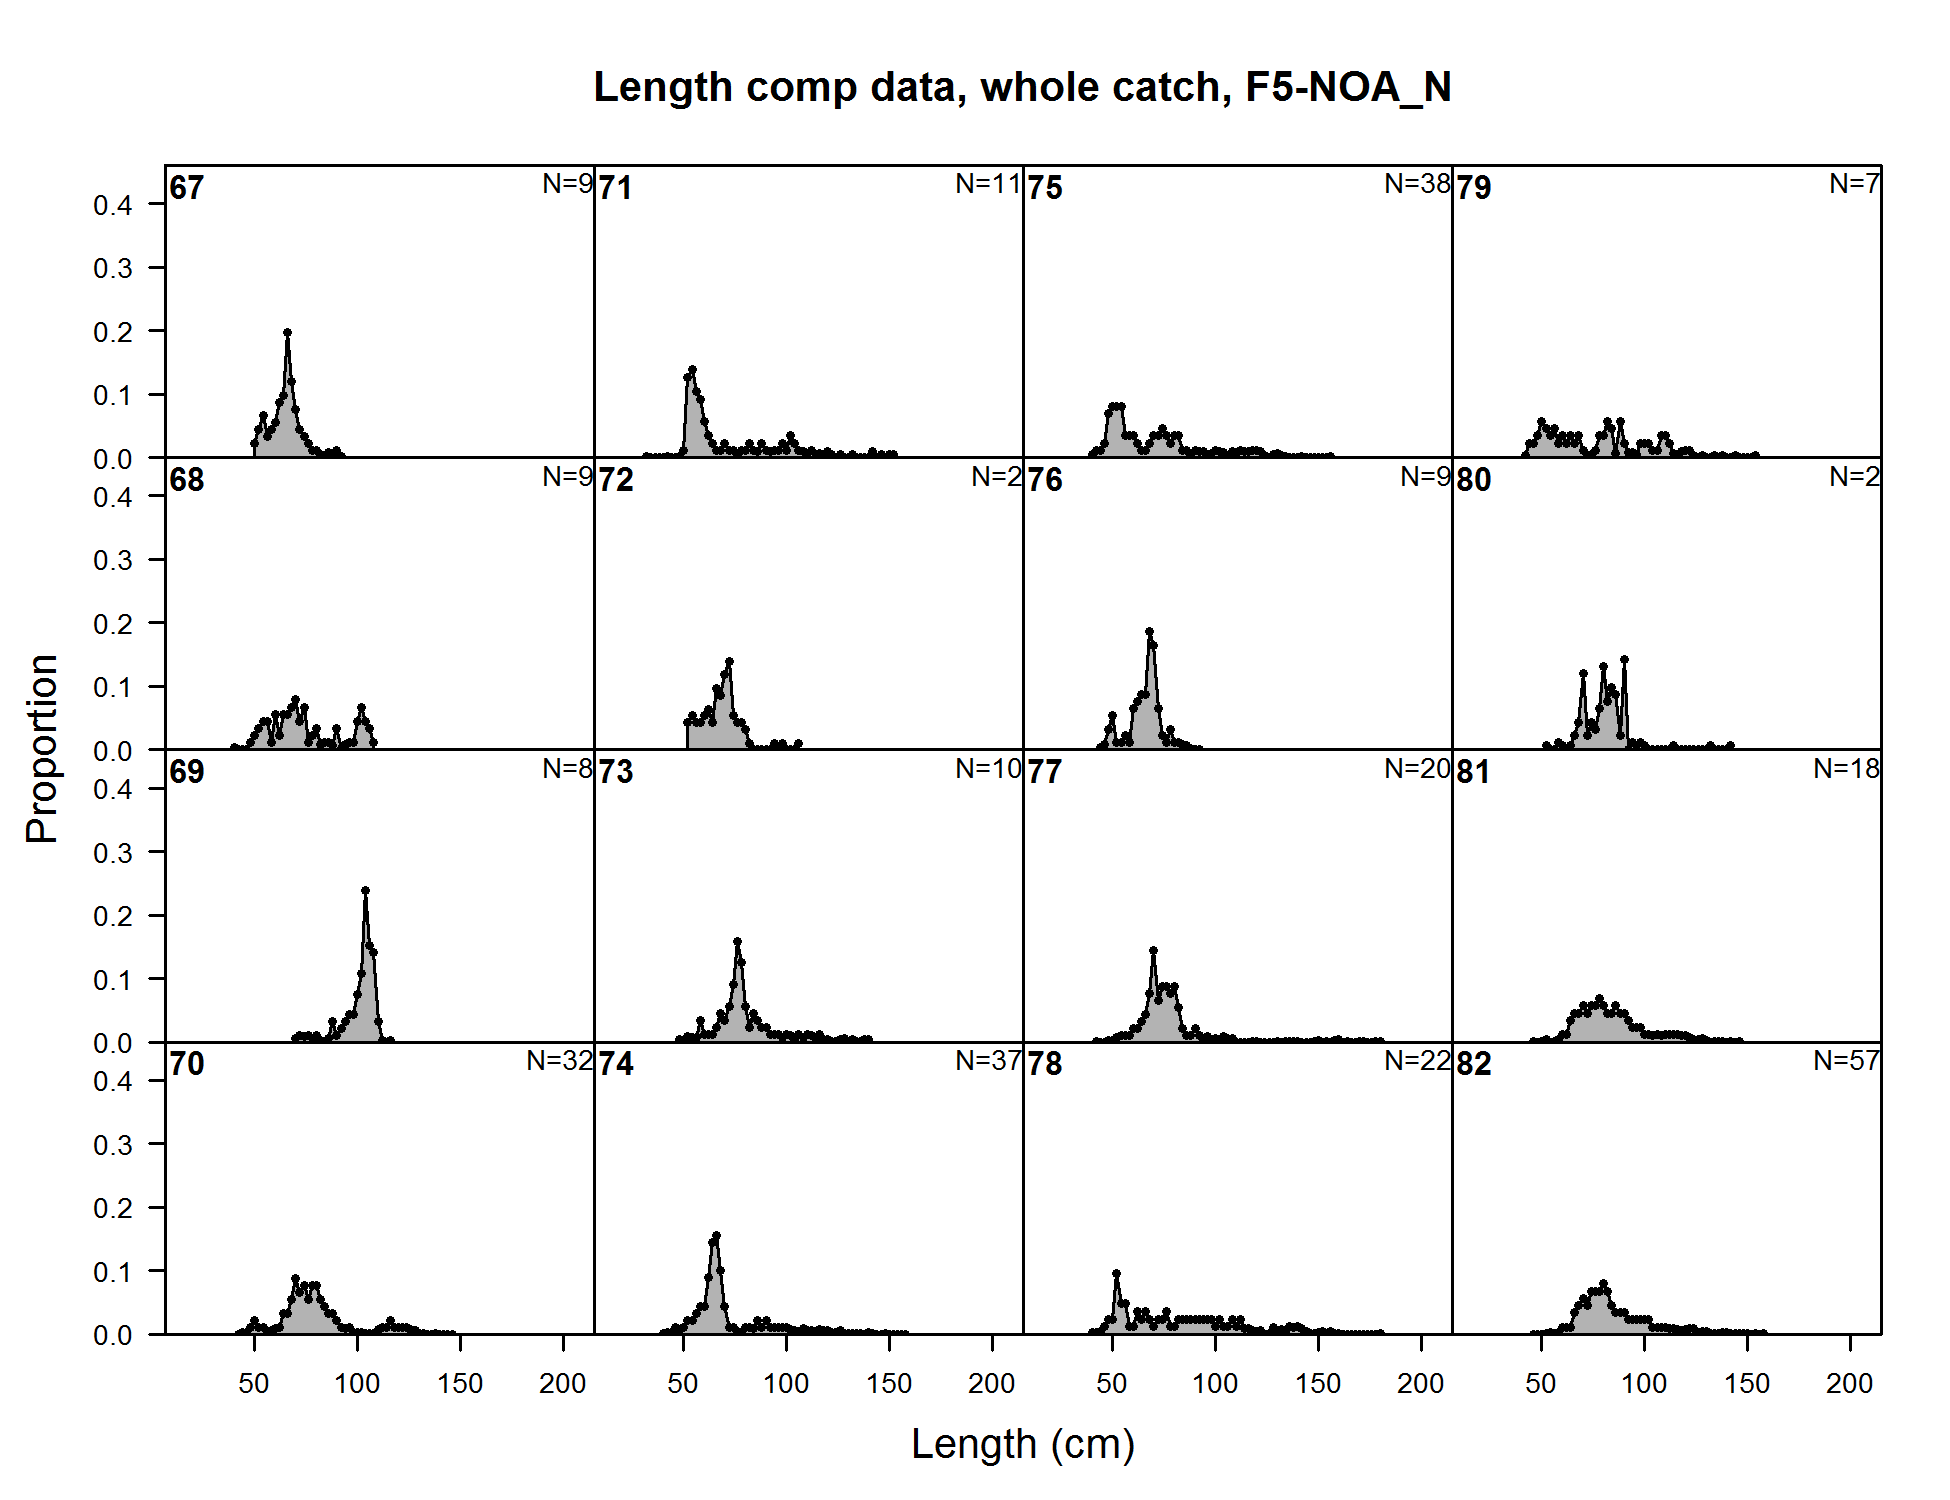
Length comp data, whole catch, F5-NOA_N (plot 1 of 11) (plot 2 of 11)
file: comp_lendat_flt5mkt0_page2.png
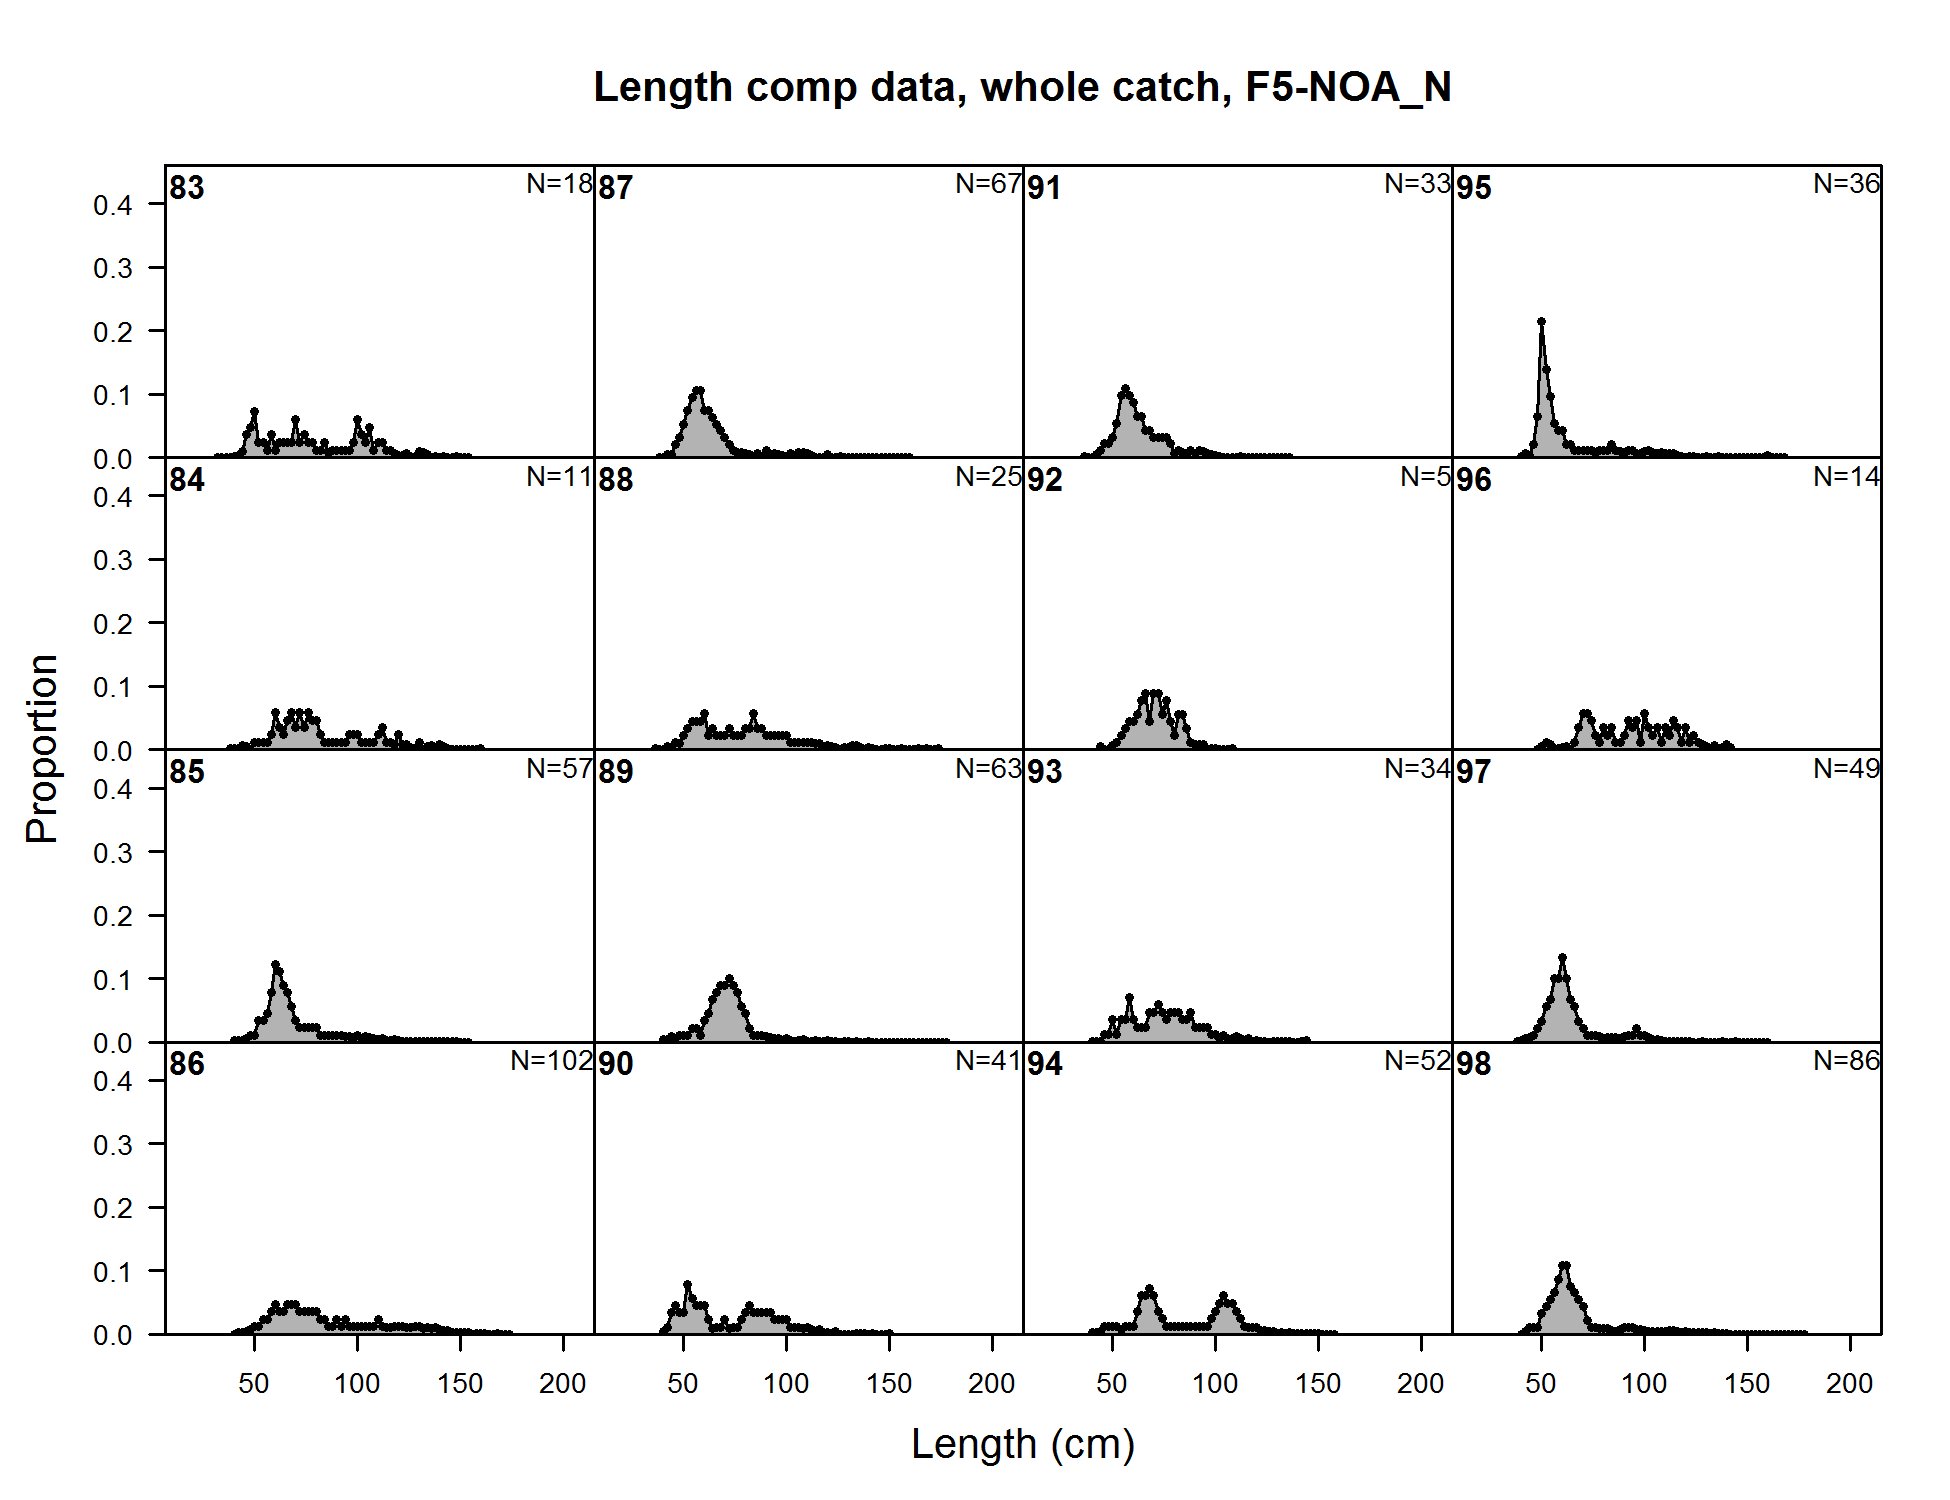
Length comp data, whole catch, F5-NOA_N (plot 1 of 11) (plot 2 of 11) (plot 3 of 11)
file: comp_lendat_flt5mkt0_page3.png
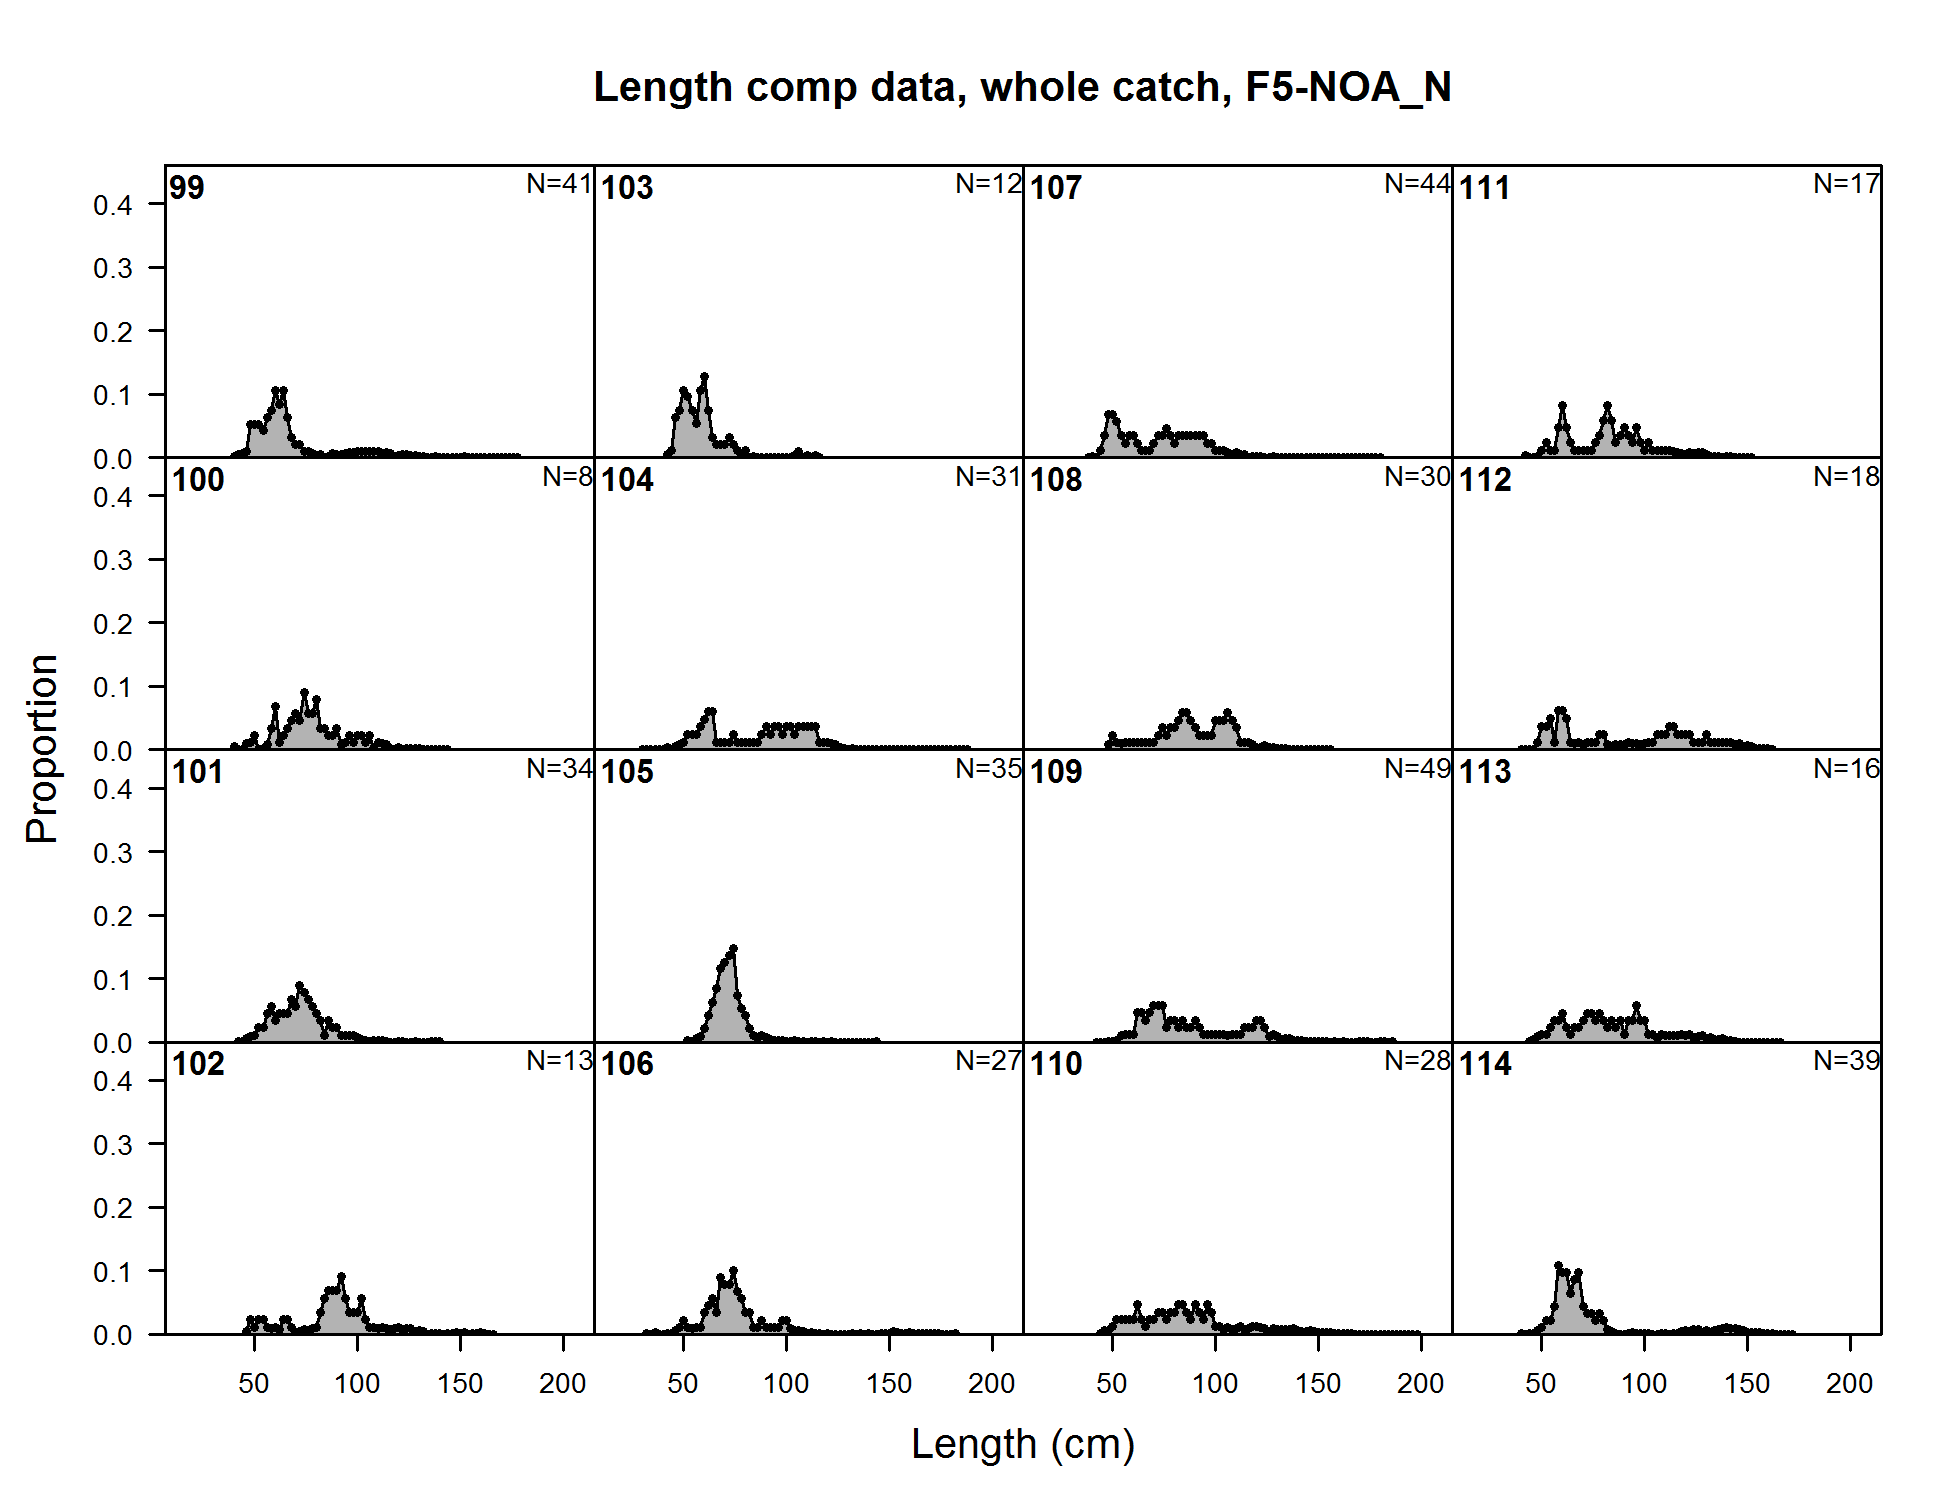
Length comp data, whole catch, F5-NOA_N (plot 1 of 11) (plot 2 of 11) (plot 3 of 11) (plot 4 of 11)
file: comp_lendat_flt5mkt0_page4.png
Length comp data, whole catch, F5-NOA_N (plot 1 of 11) (plot 2 of 11) (plot 3 of 11) (plot 4 of 11) (plot 5 of 11)
file: comp_lendat_flt5mkt0_page5.png
Length comp data, whole catch, F5-NOA_N (plot 1 of 11) (plot 2 of 11) (plot 3 of 11) (plot 4 of 11) (plot 5 of 11) (plot 6 of 11)
file: comp_lendat_flt5mkt0_page6.png
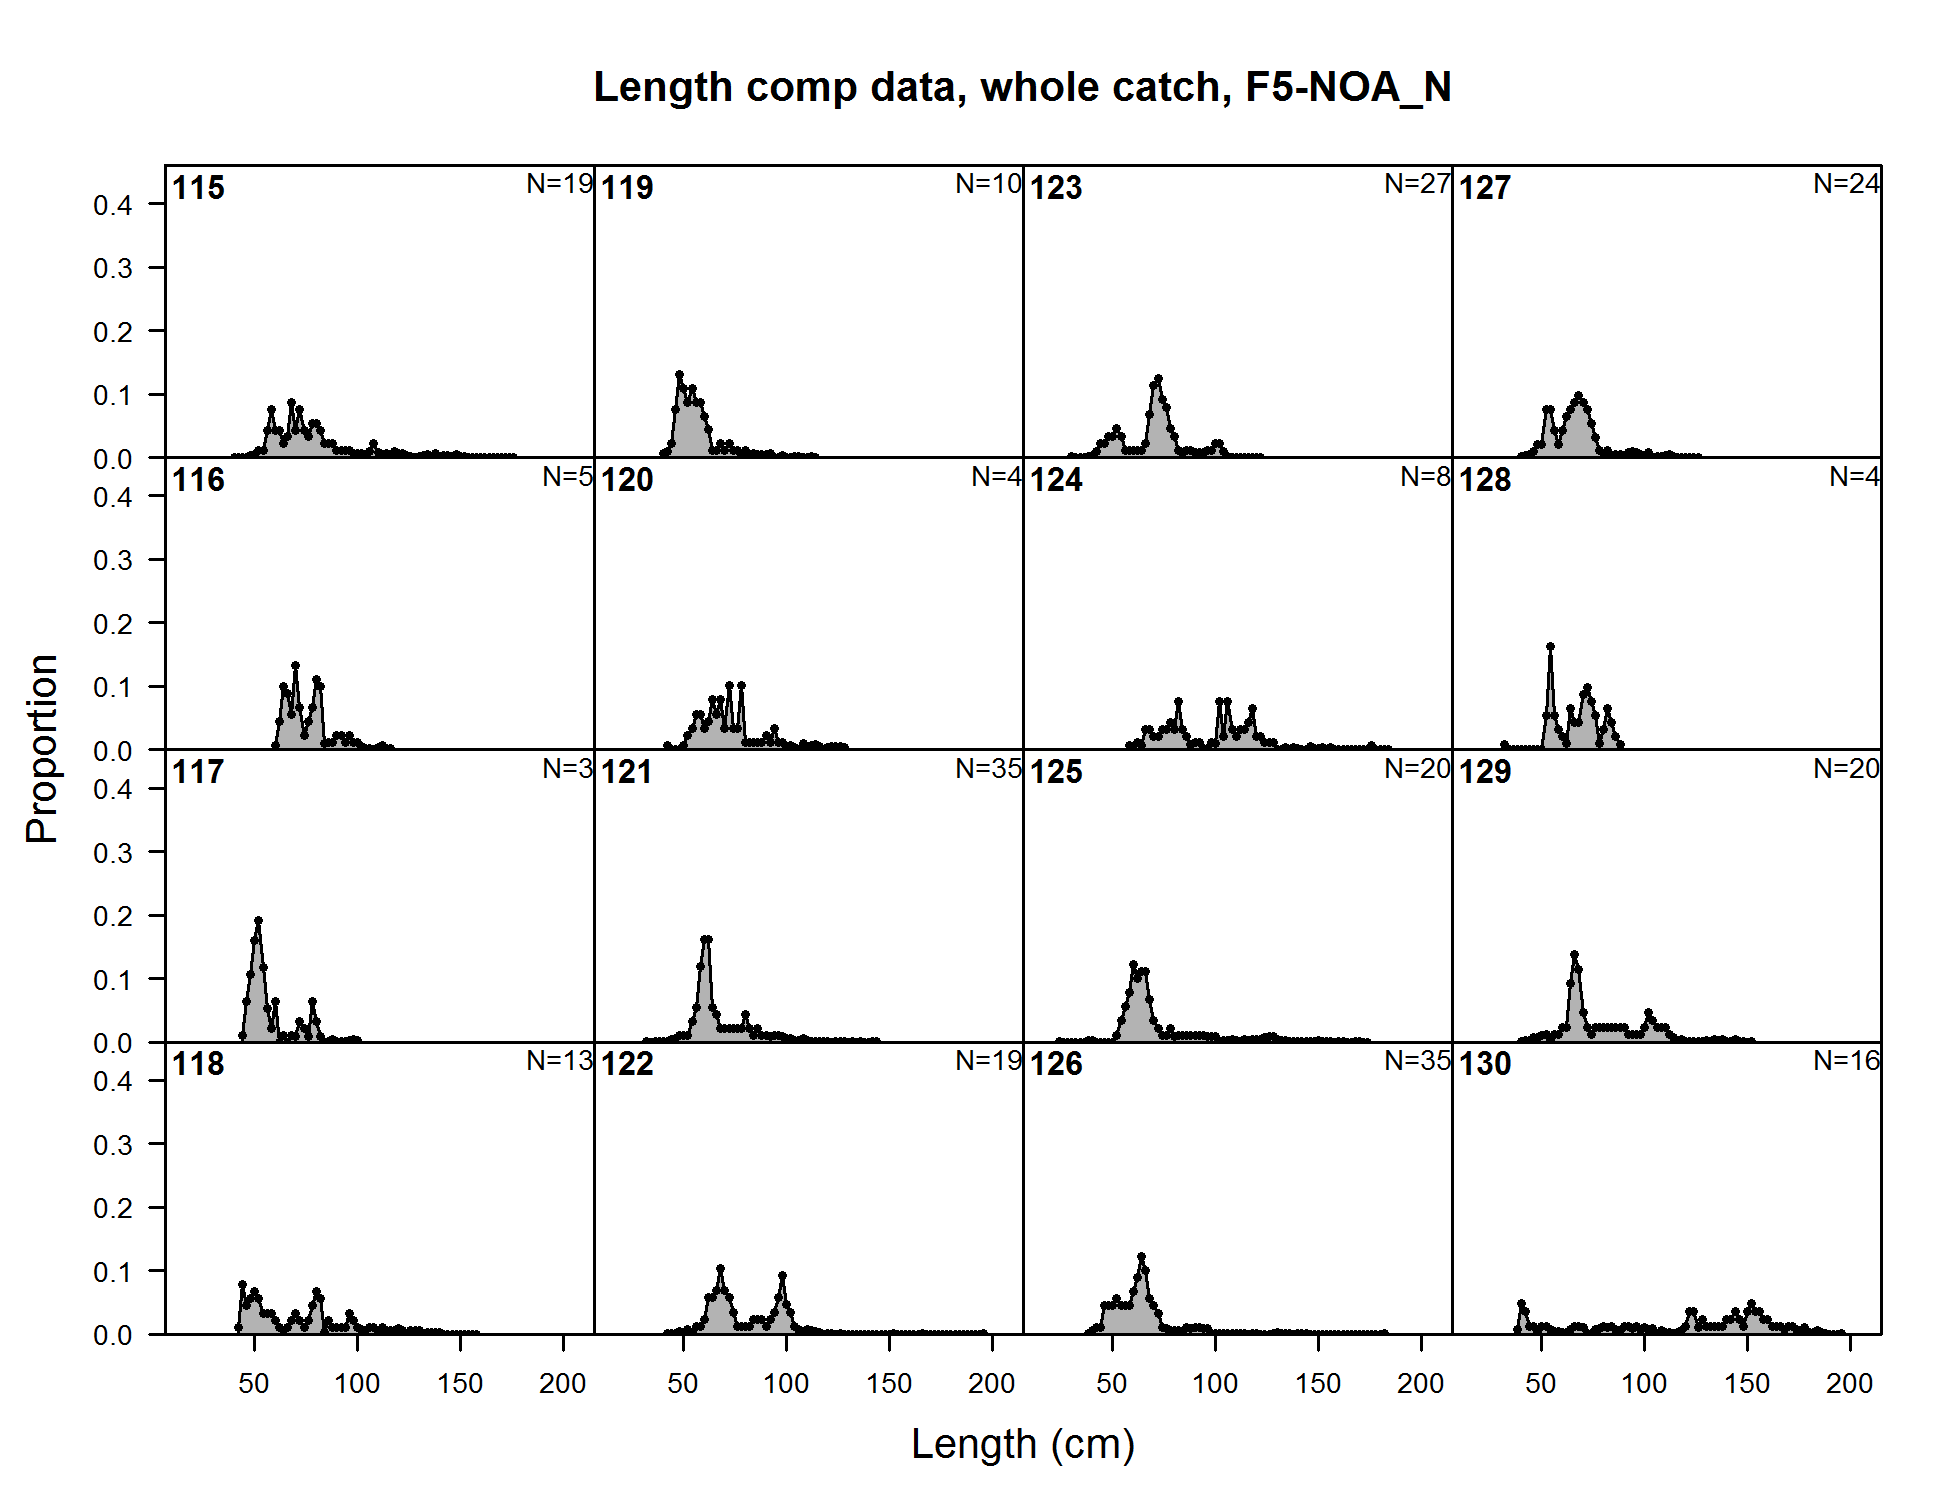
Length comp data, whole catch, F5-NOA_N (plot 1 of 11) (plot 2 of 11) (plot 3 of 11) (plot 4 of 11) (plot 5 of 11) (plot 6 of 11) (plot 7 of 11)
file: comp_lendat_flt5mkt0_page7.png
Length comp data, whole catch, F5-NOA_N (plot 1 of 11) (plot 2 of 11) (plot 3 of 11) (plot 4 of 11) (plot 5 of 11) (plot 6 of 11) (plot 7 of 11) (plot 8 of 11)
file: comp_lendat_flt5mkt0_page8.png
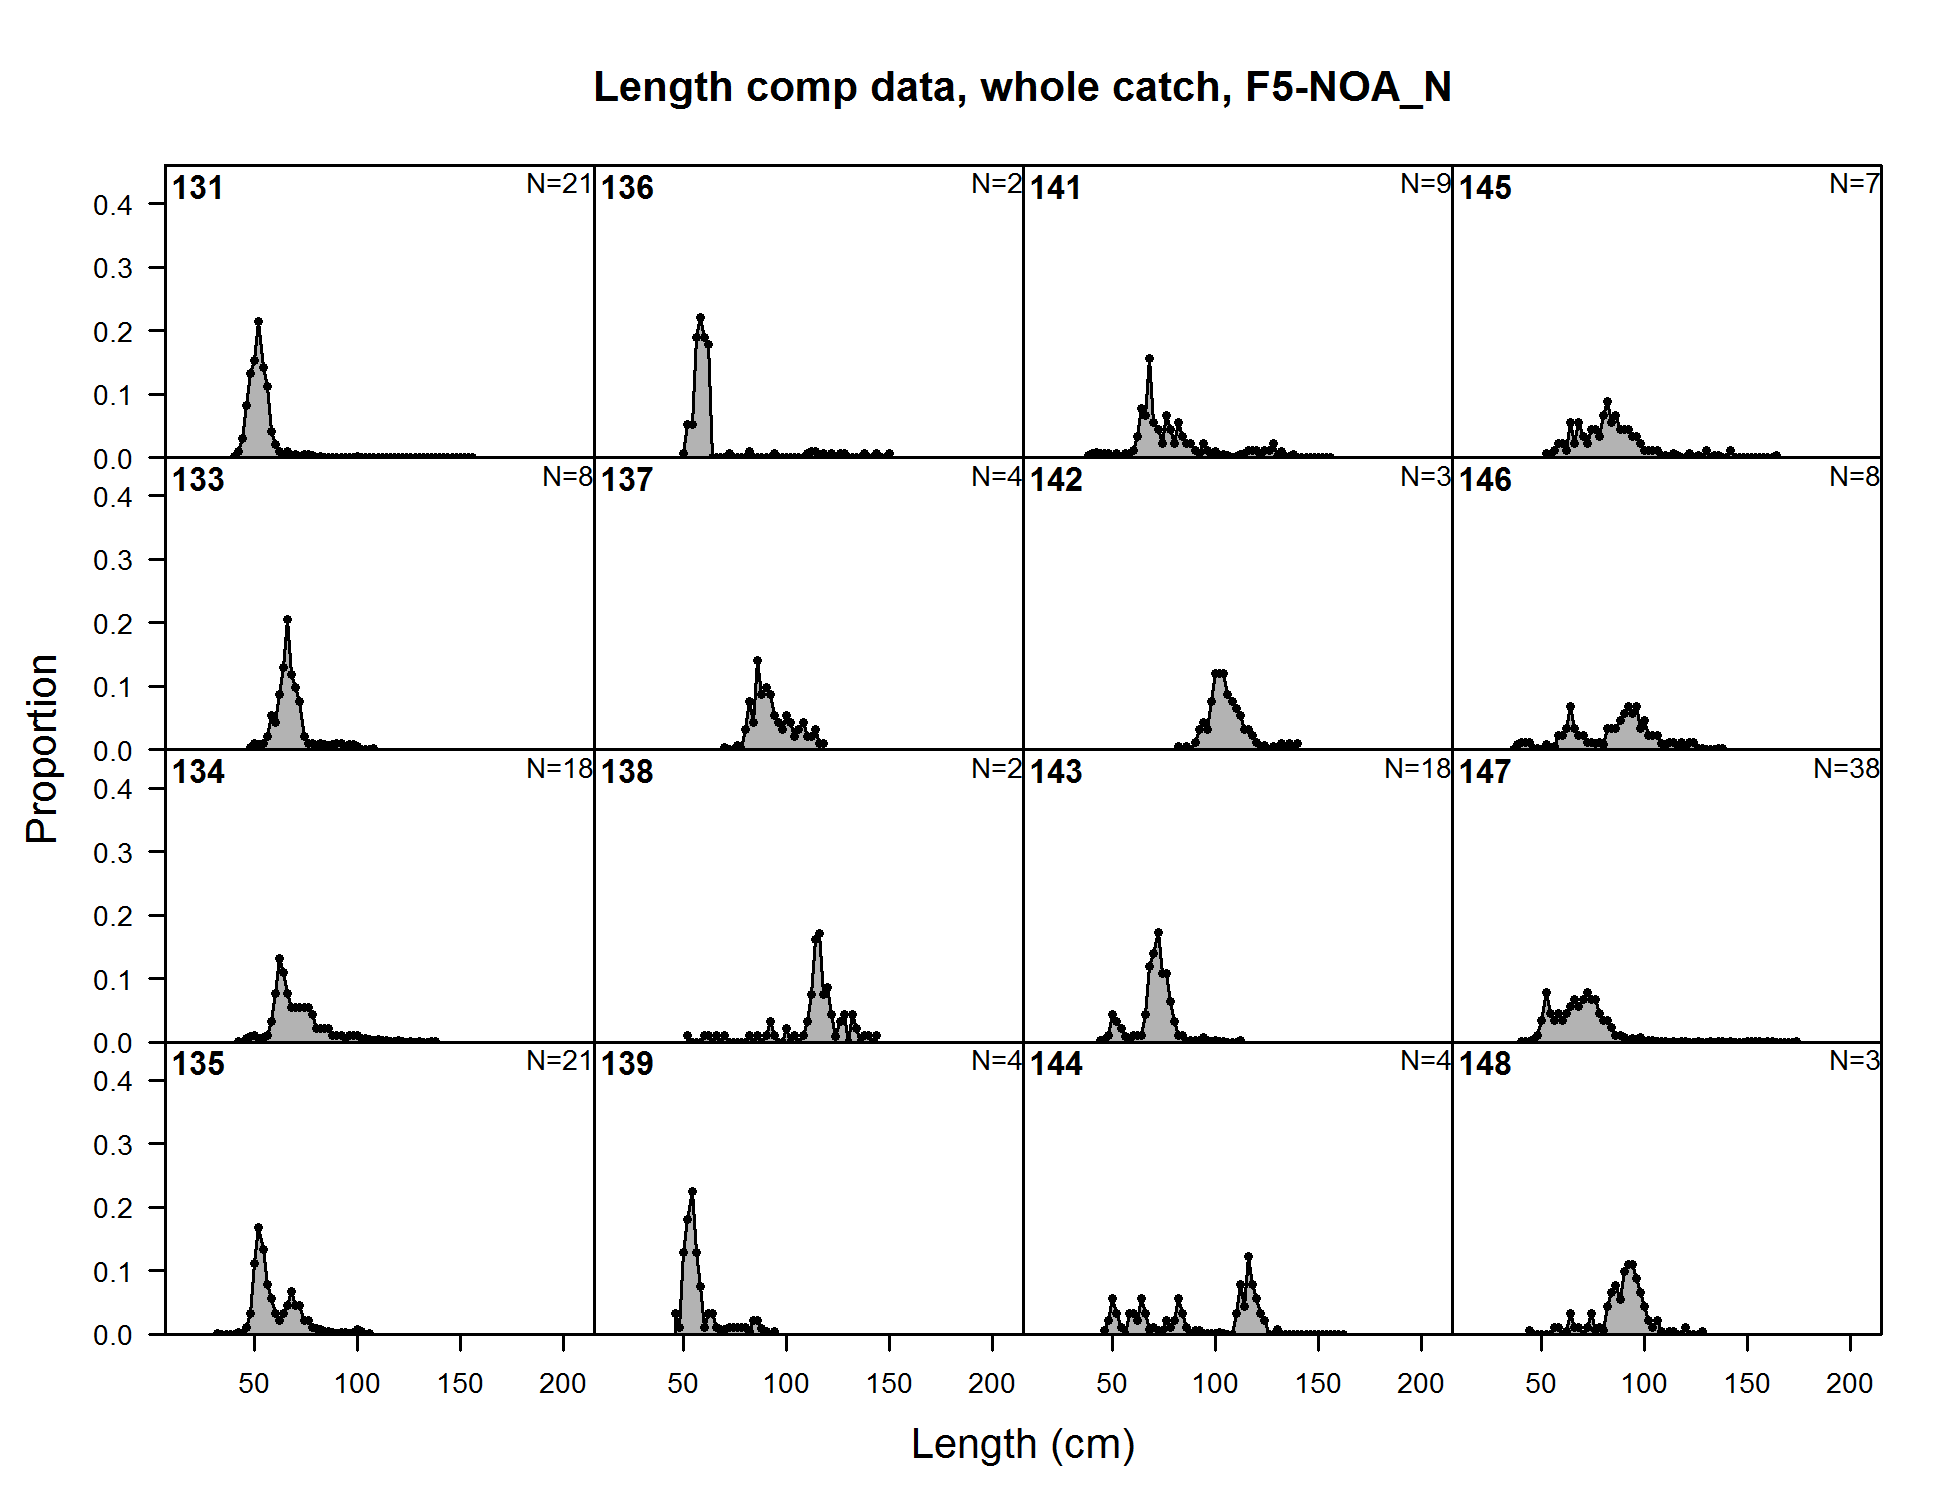
Length comp data, whole catch, F5-NOA_N (plot 1 of 11) (plot 2 of 11) (plot 3 of 11) (plot 4 of 11) (plot 5 of 11) (plot 6 of 11) (plot 7 of 11) (plot 8 of 11) (plot 9 of 11)
file: comp_lendat_flt5mkt0_page9.png

Length comp data, whole catch, F5-NOA_N (plot 1 of 11) (plot 2 of 11) (plot 3 of 11) (plot 4 of 11) (plot 5 of 11) (plot 6 of 11) (plot 7 of 11) (plot 8 of 11) (plot 9 of 11) (plot 10 of 11)
file: comp_lendat_flt5mkt0_page10.png
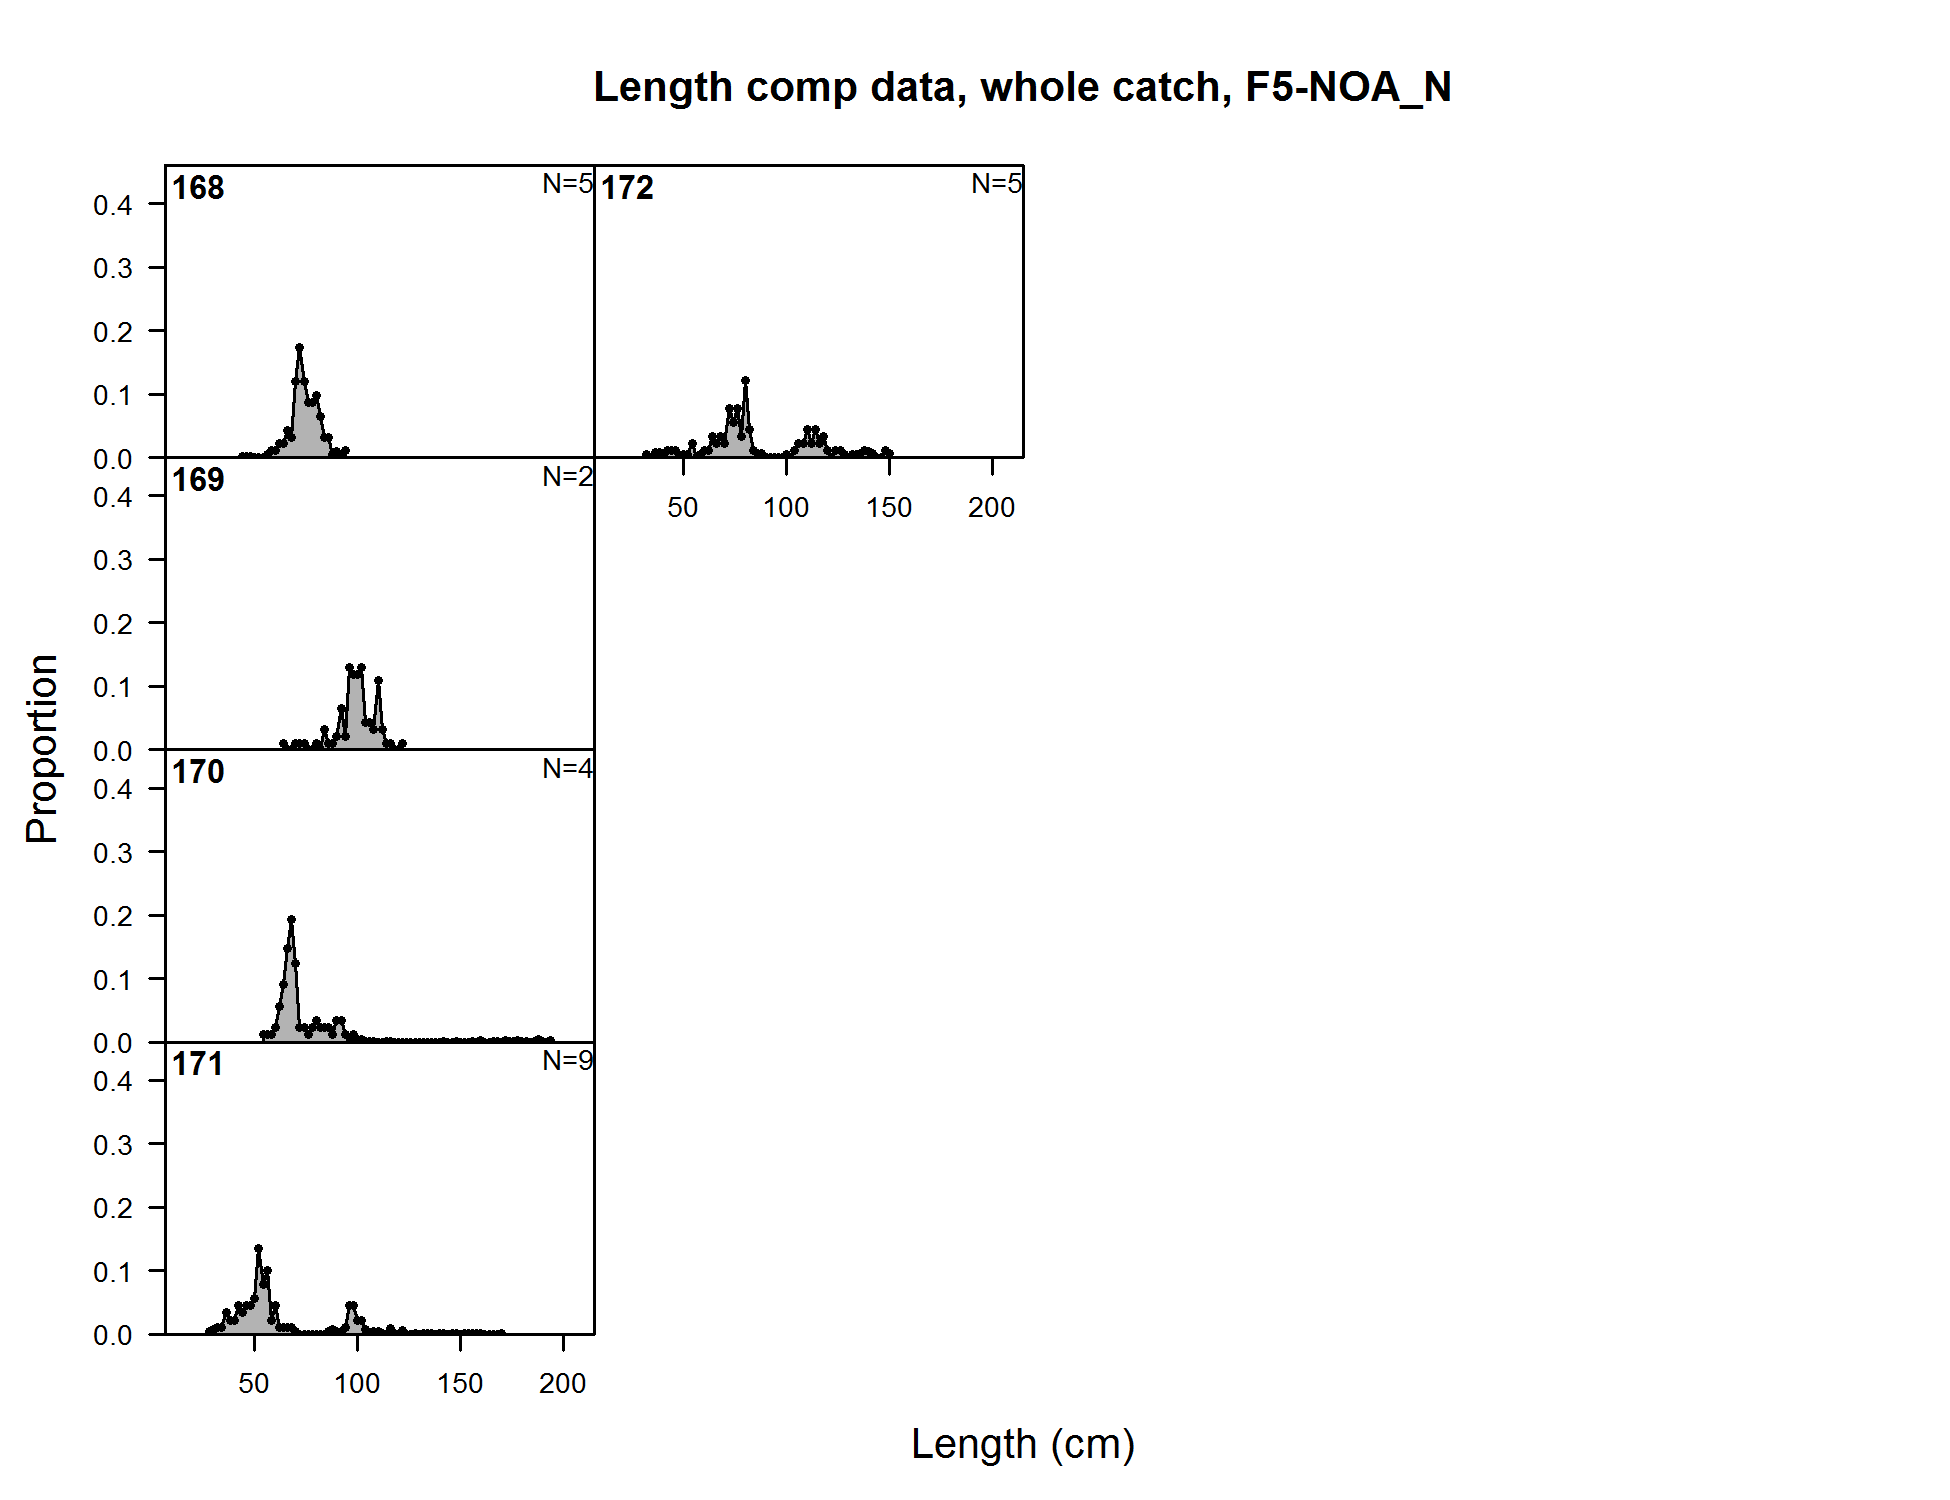
Length comp data, whole catch, F5-NOA_N (plot 1 of 11) (plot 2 of 11) (plot 3 of 11) (plot 4 of 11) (plot 5 of 11) (plot 6 of 11) (plot 7 of 11) (plot 8 of 11) (plot 9 of 11) (plot 10 of 11) (plot 11 of 11)
file: comp_lendat_flt5mkt0_page11.png
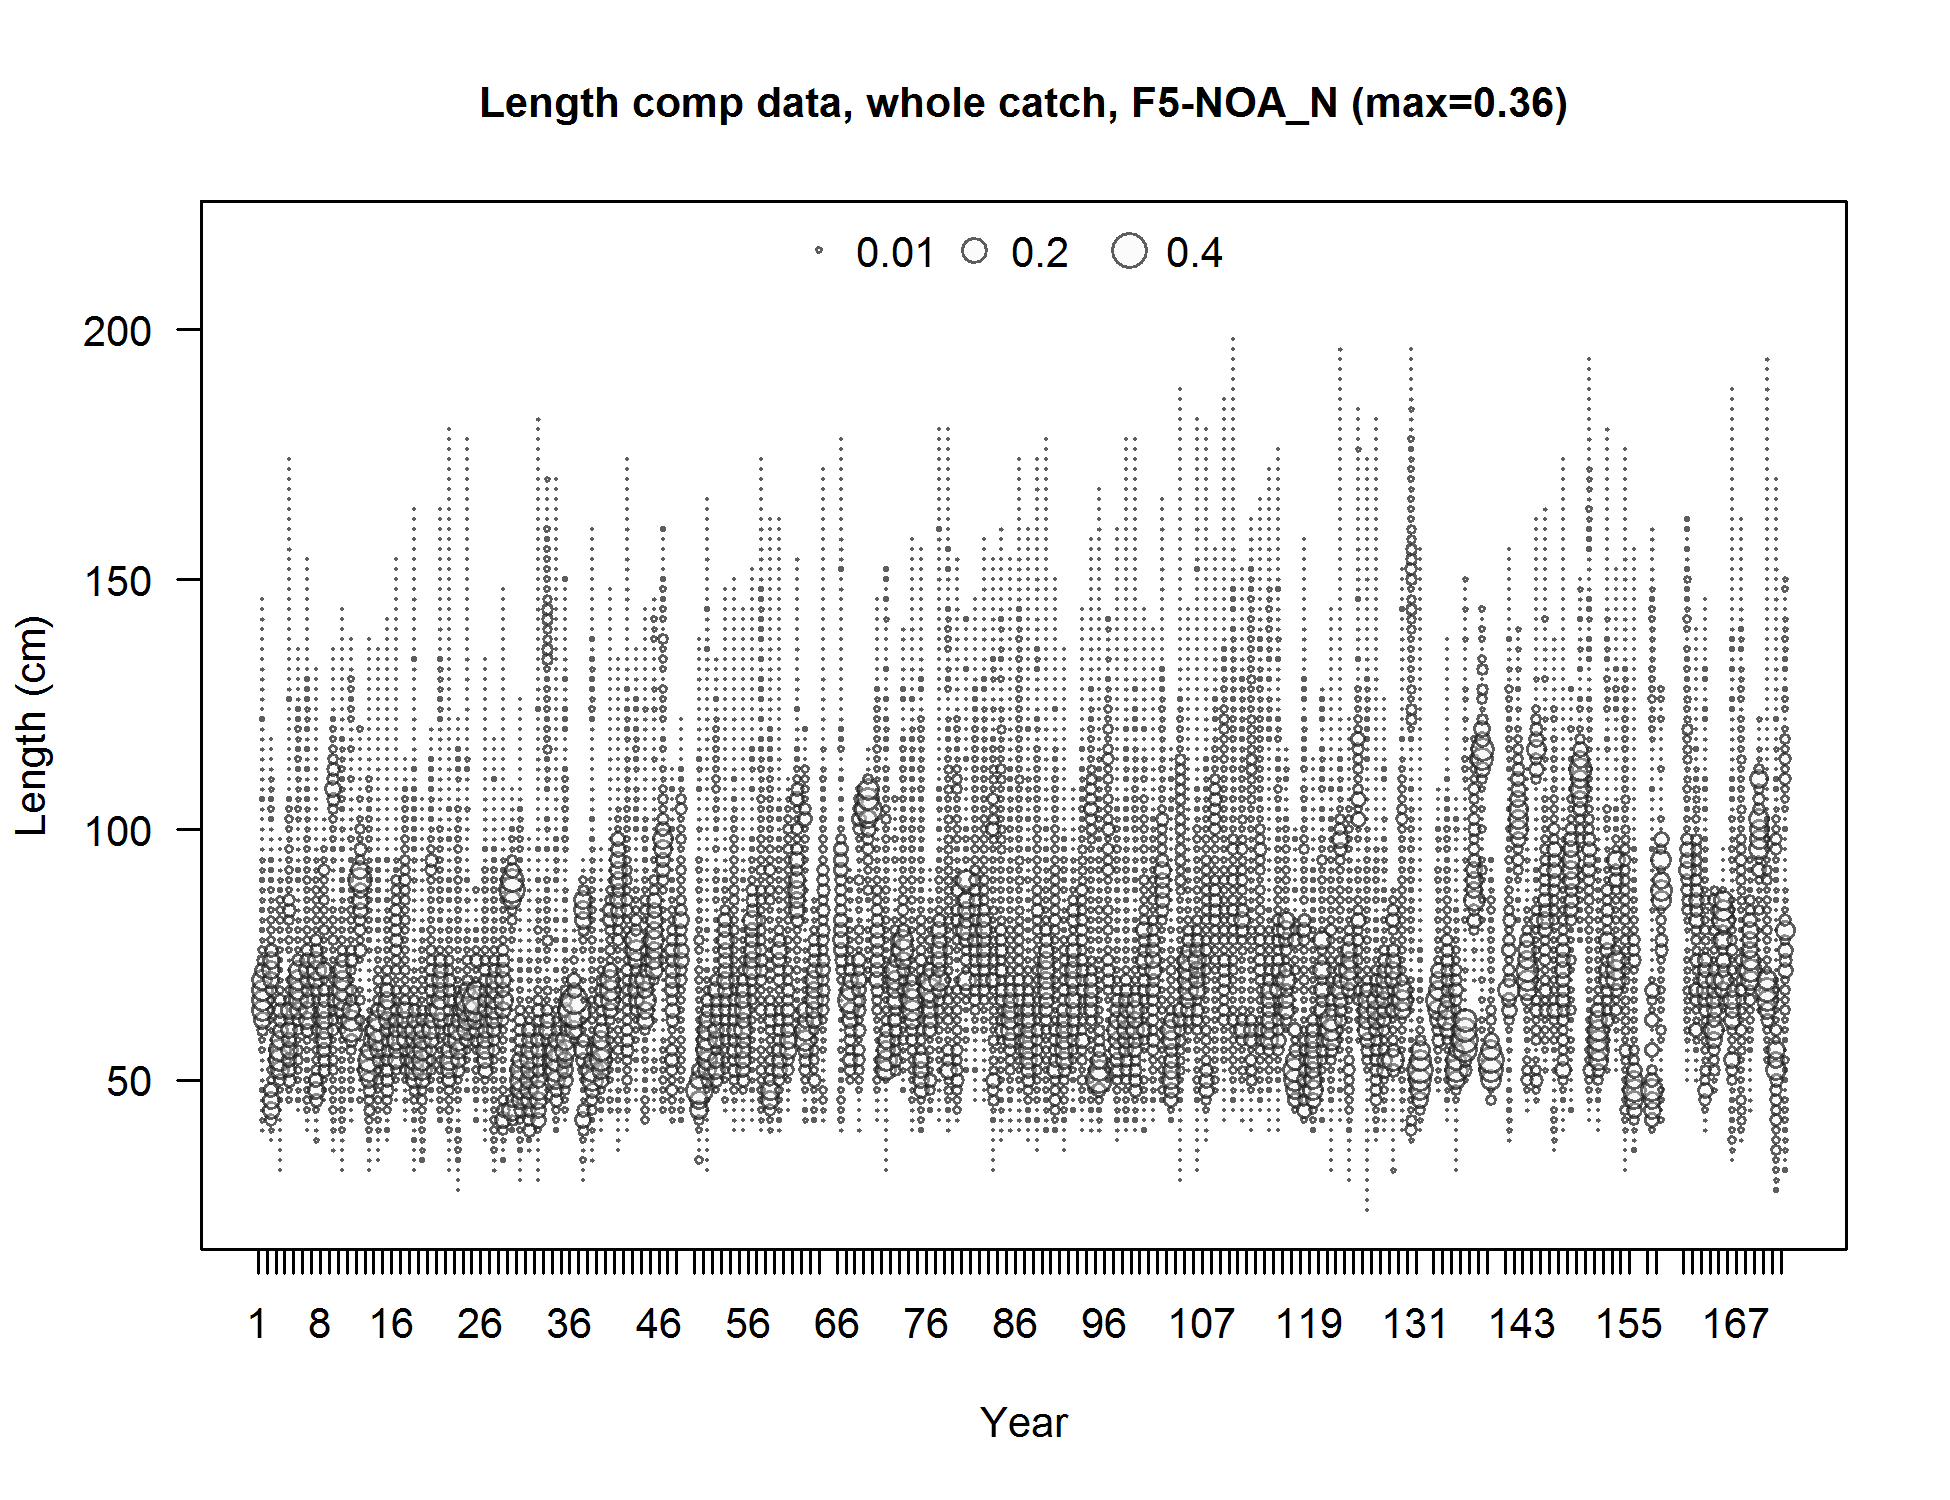
Length comp data, whole catch, F5-NOA_N (max=0.36) (plot 11 of 11)
file: comp_lendat_bubflt5mkt0_page11.png
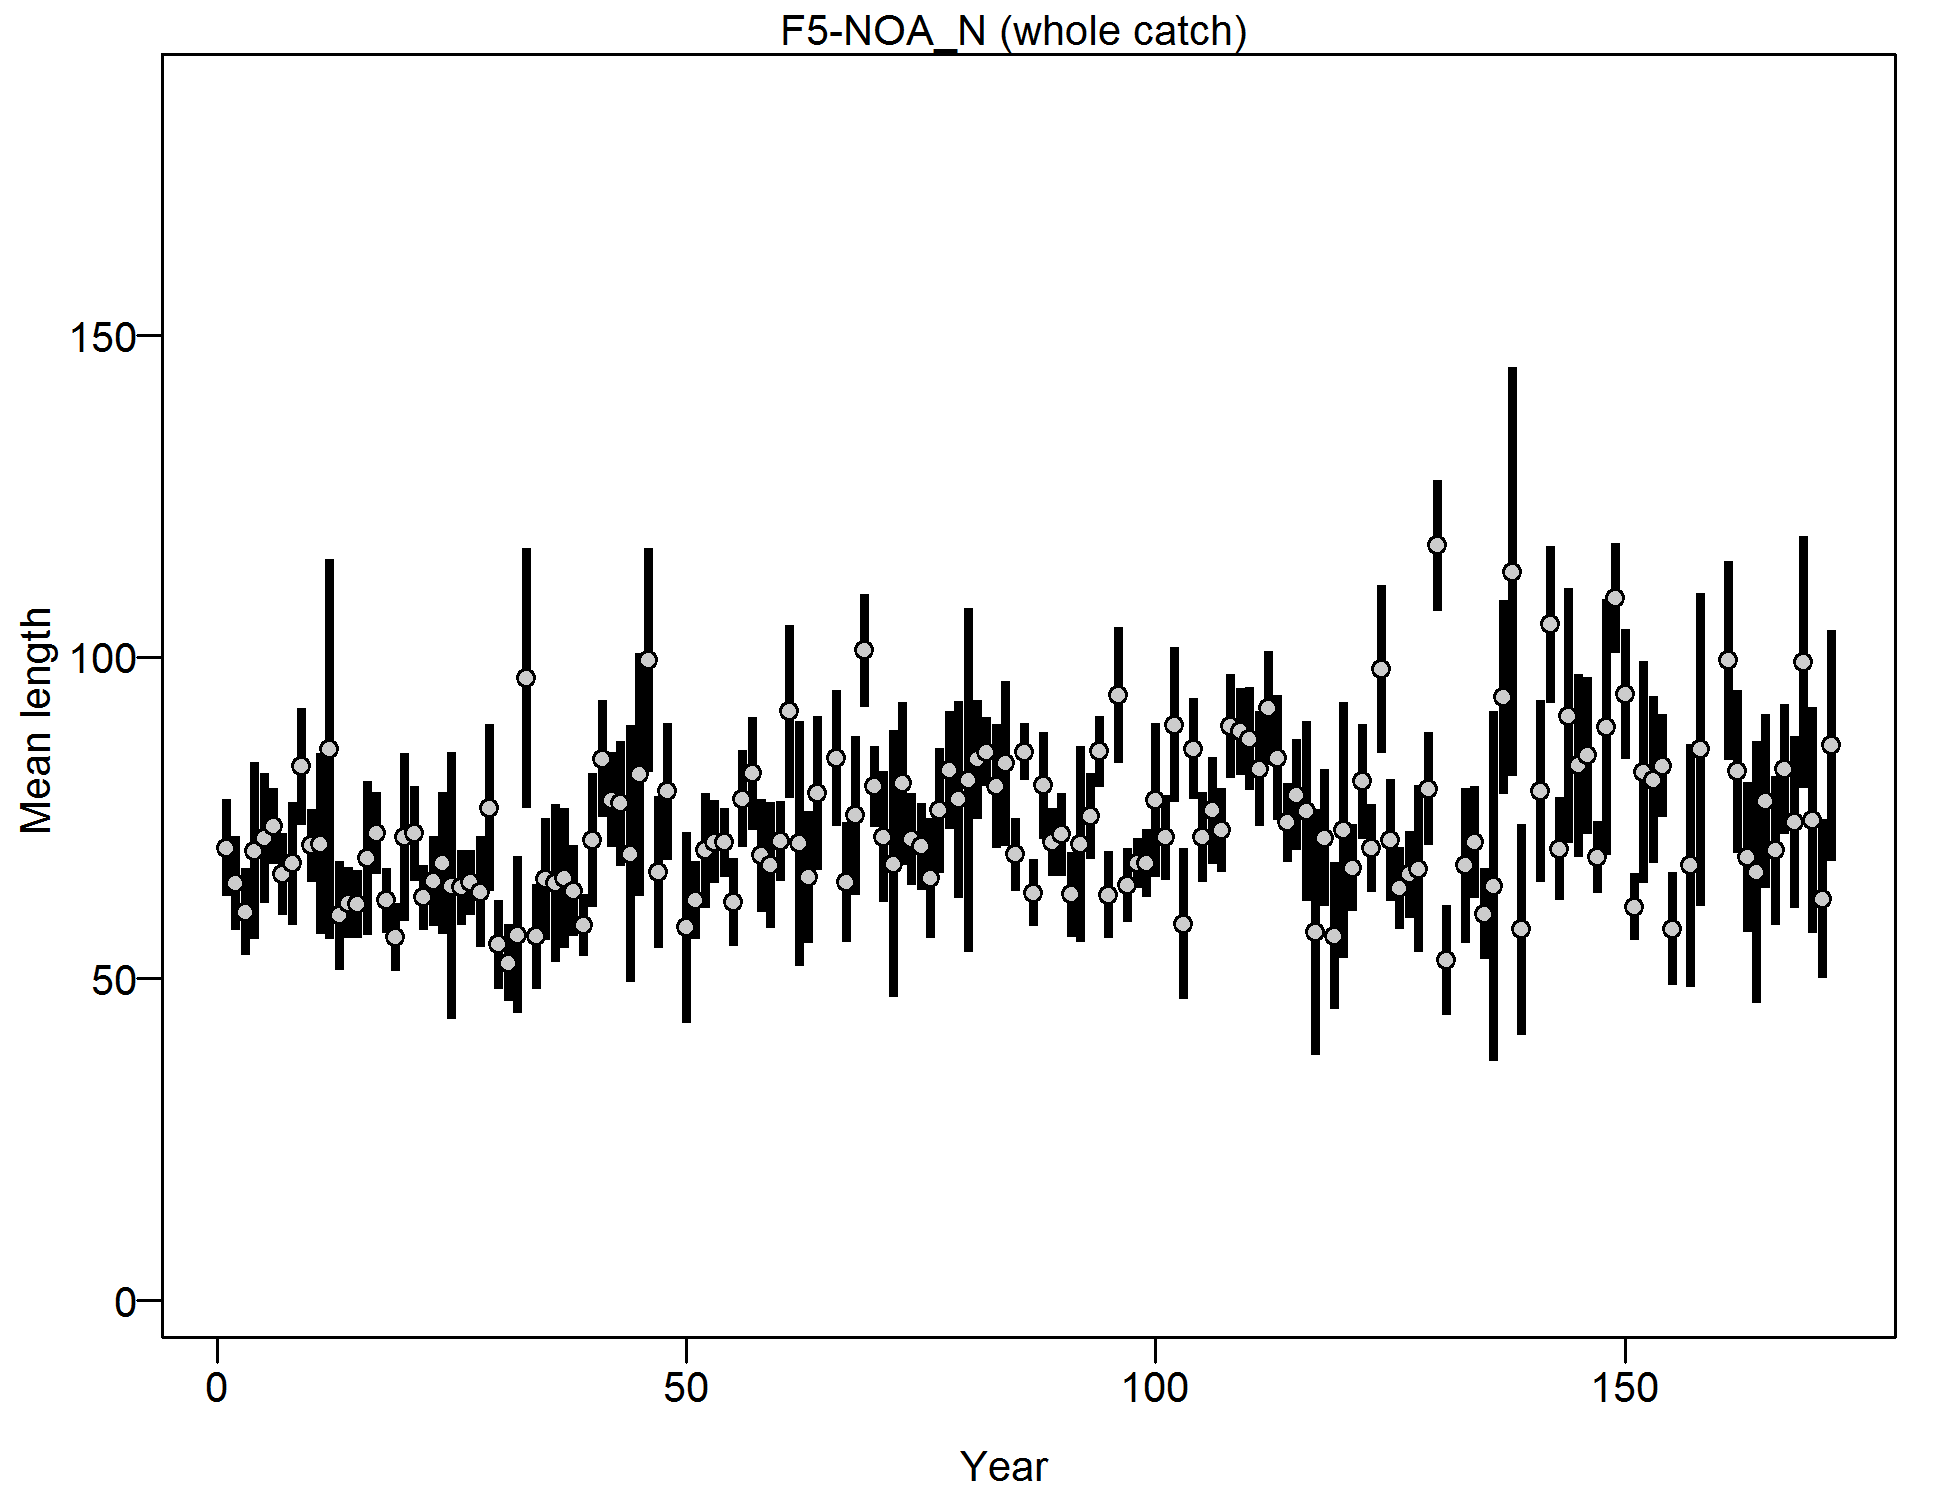
Mean length for F5-NOA_N with 95% confidence intervals based on current samples sizes.
file: comp_lendat_data_weighting_TA1.8_F5-NOA_N.png
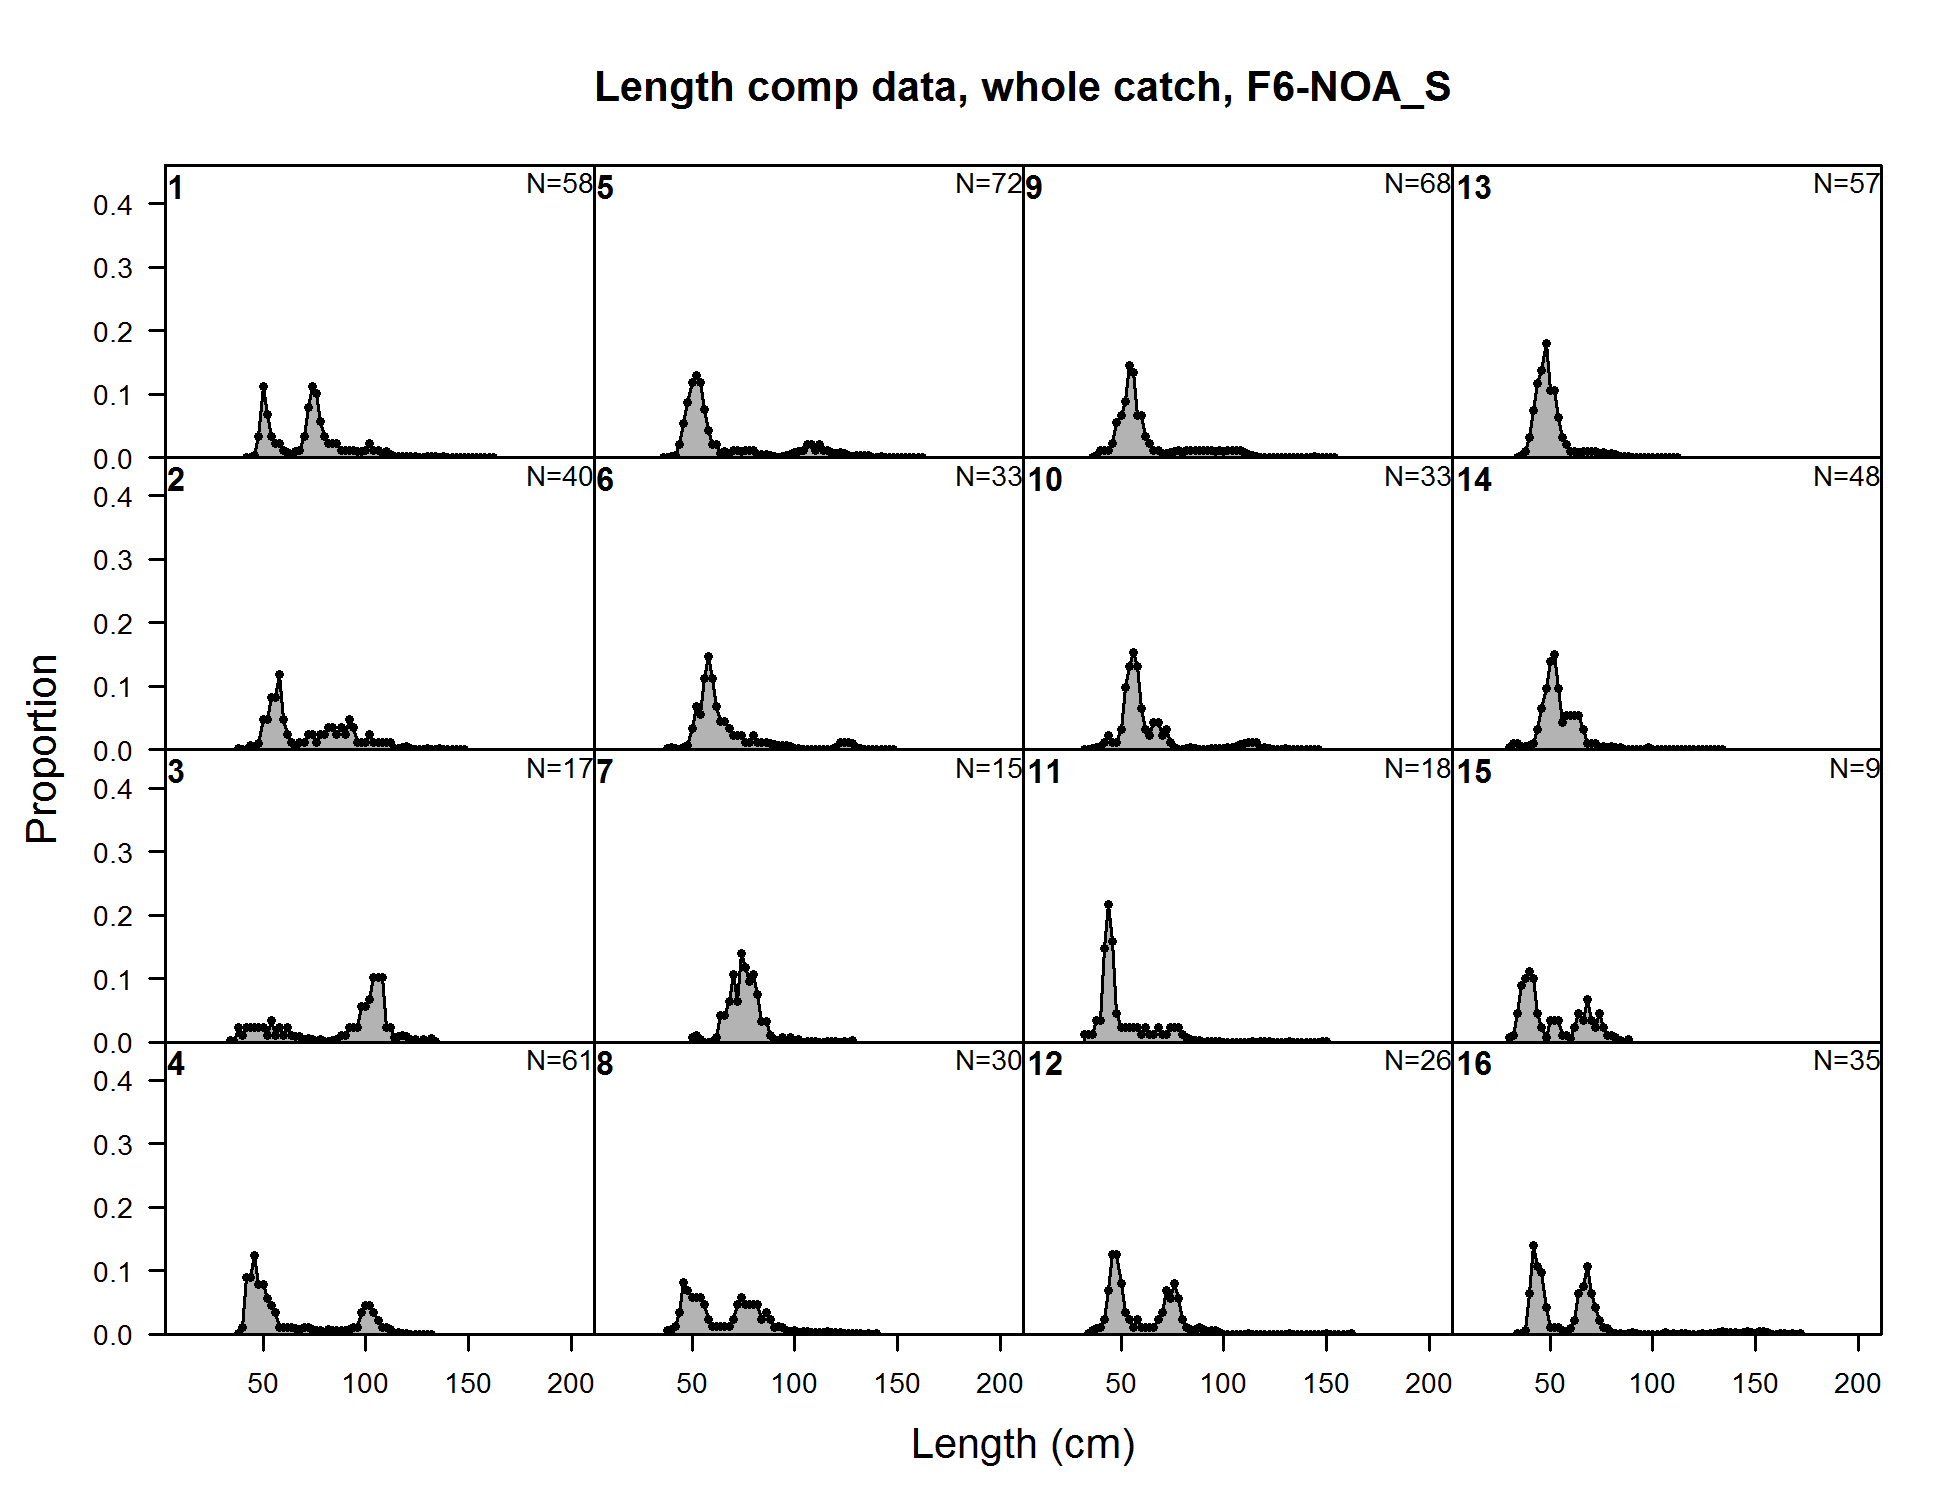
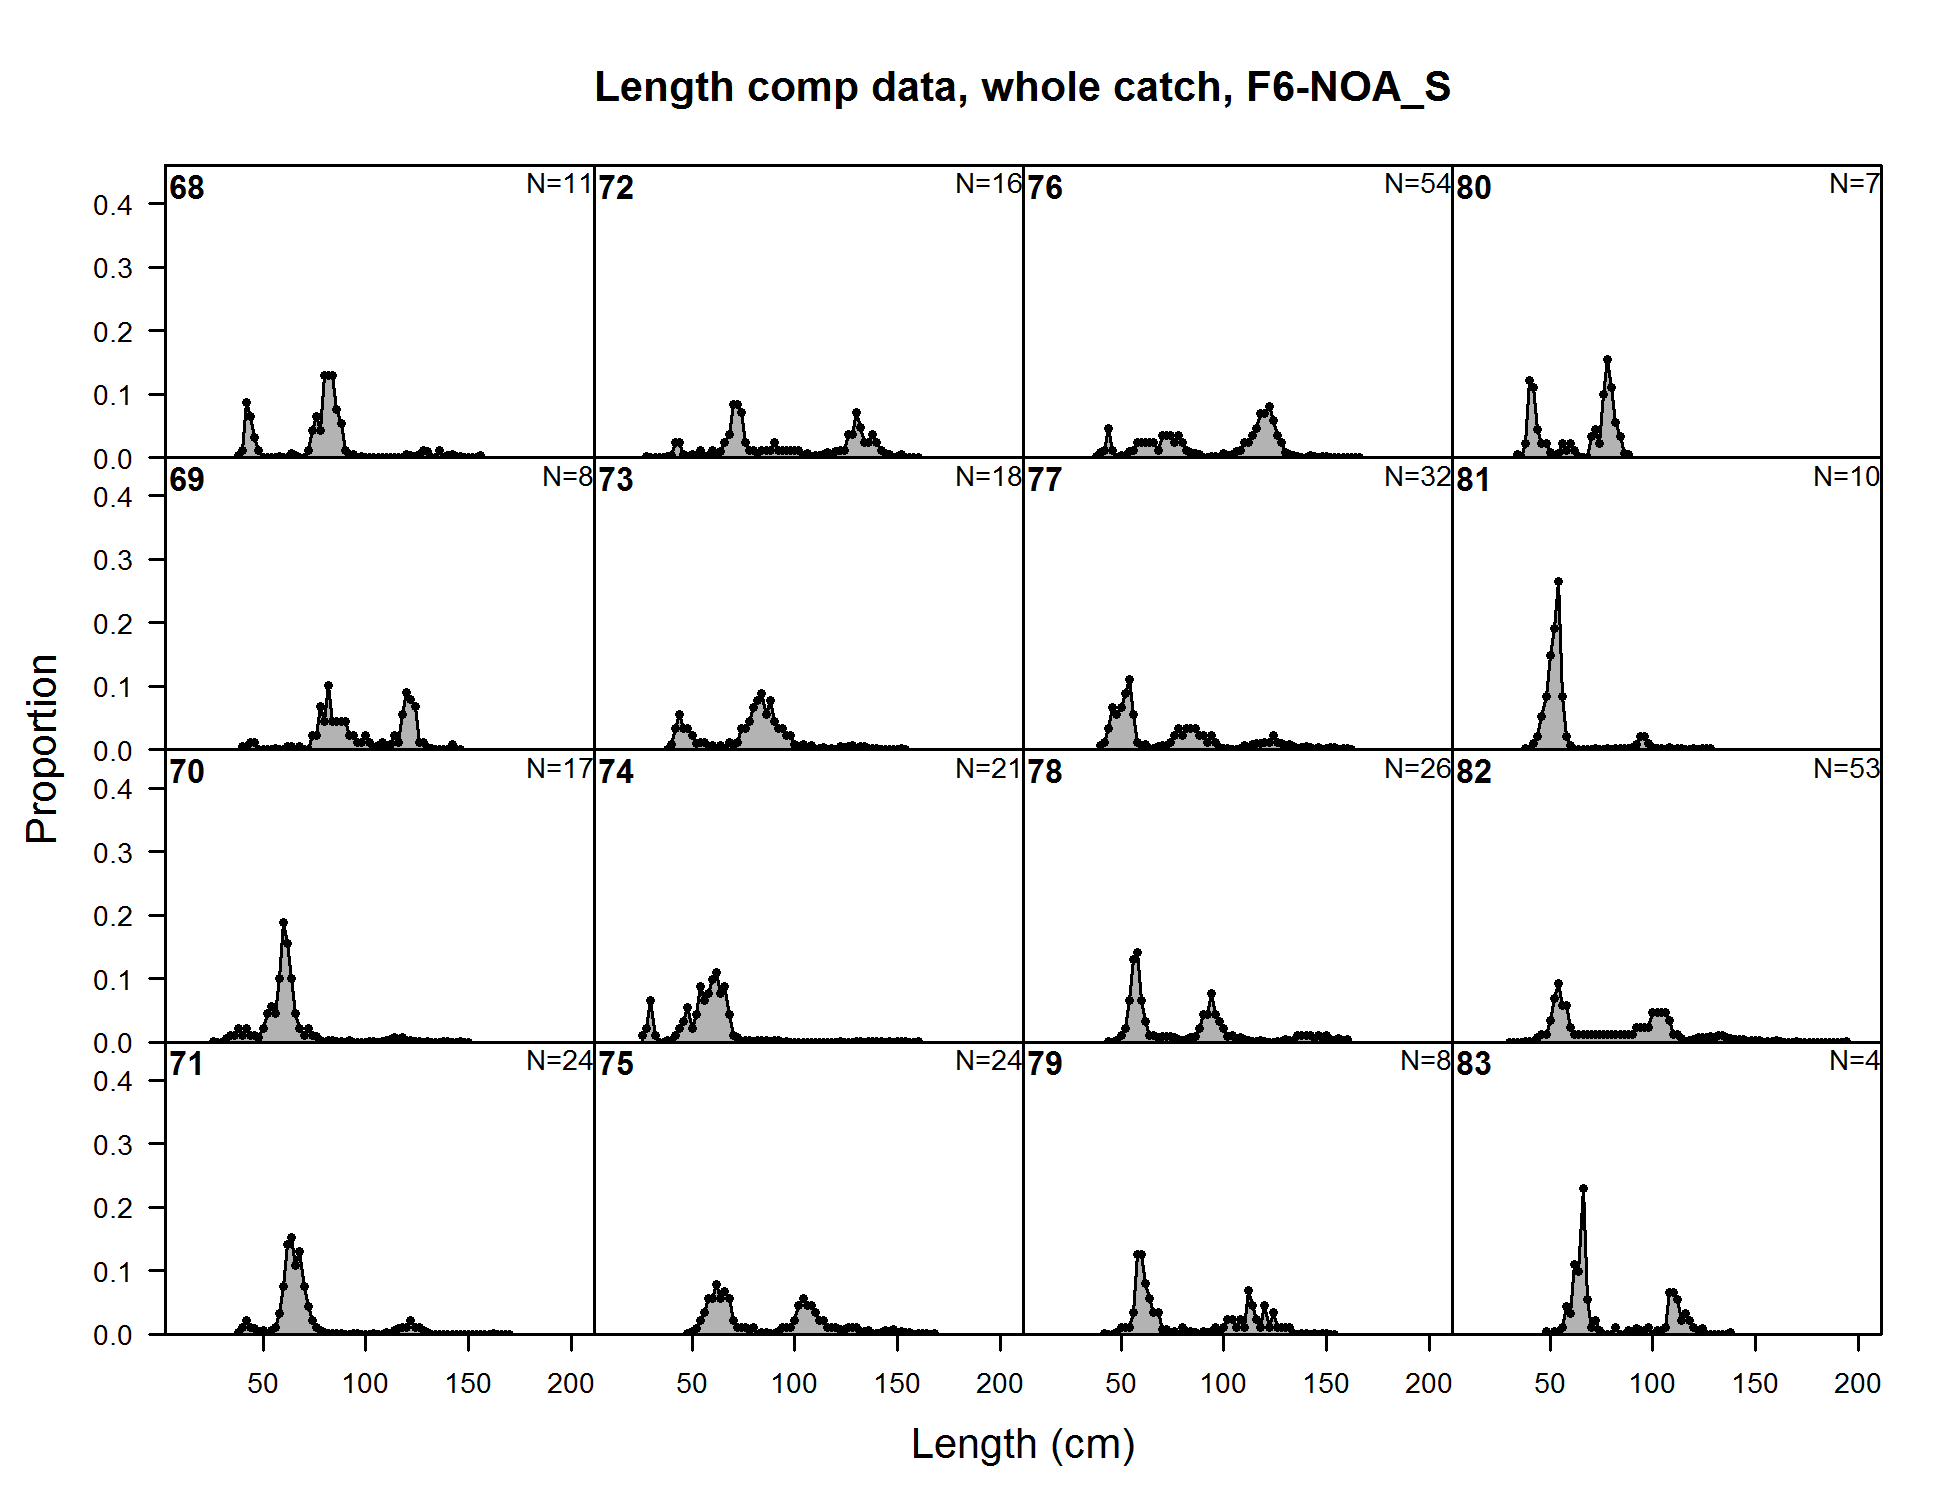
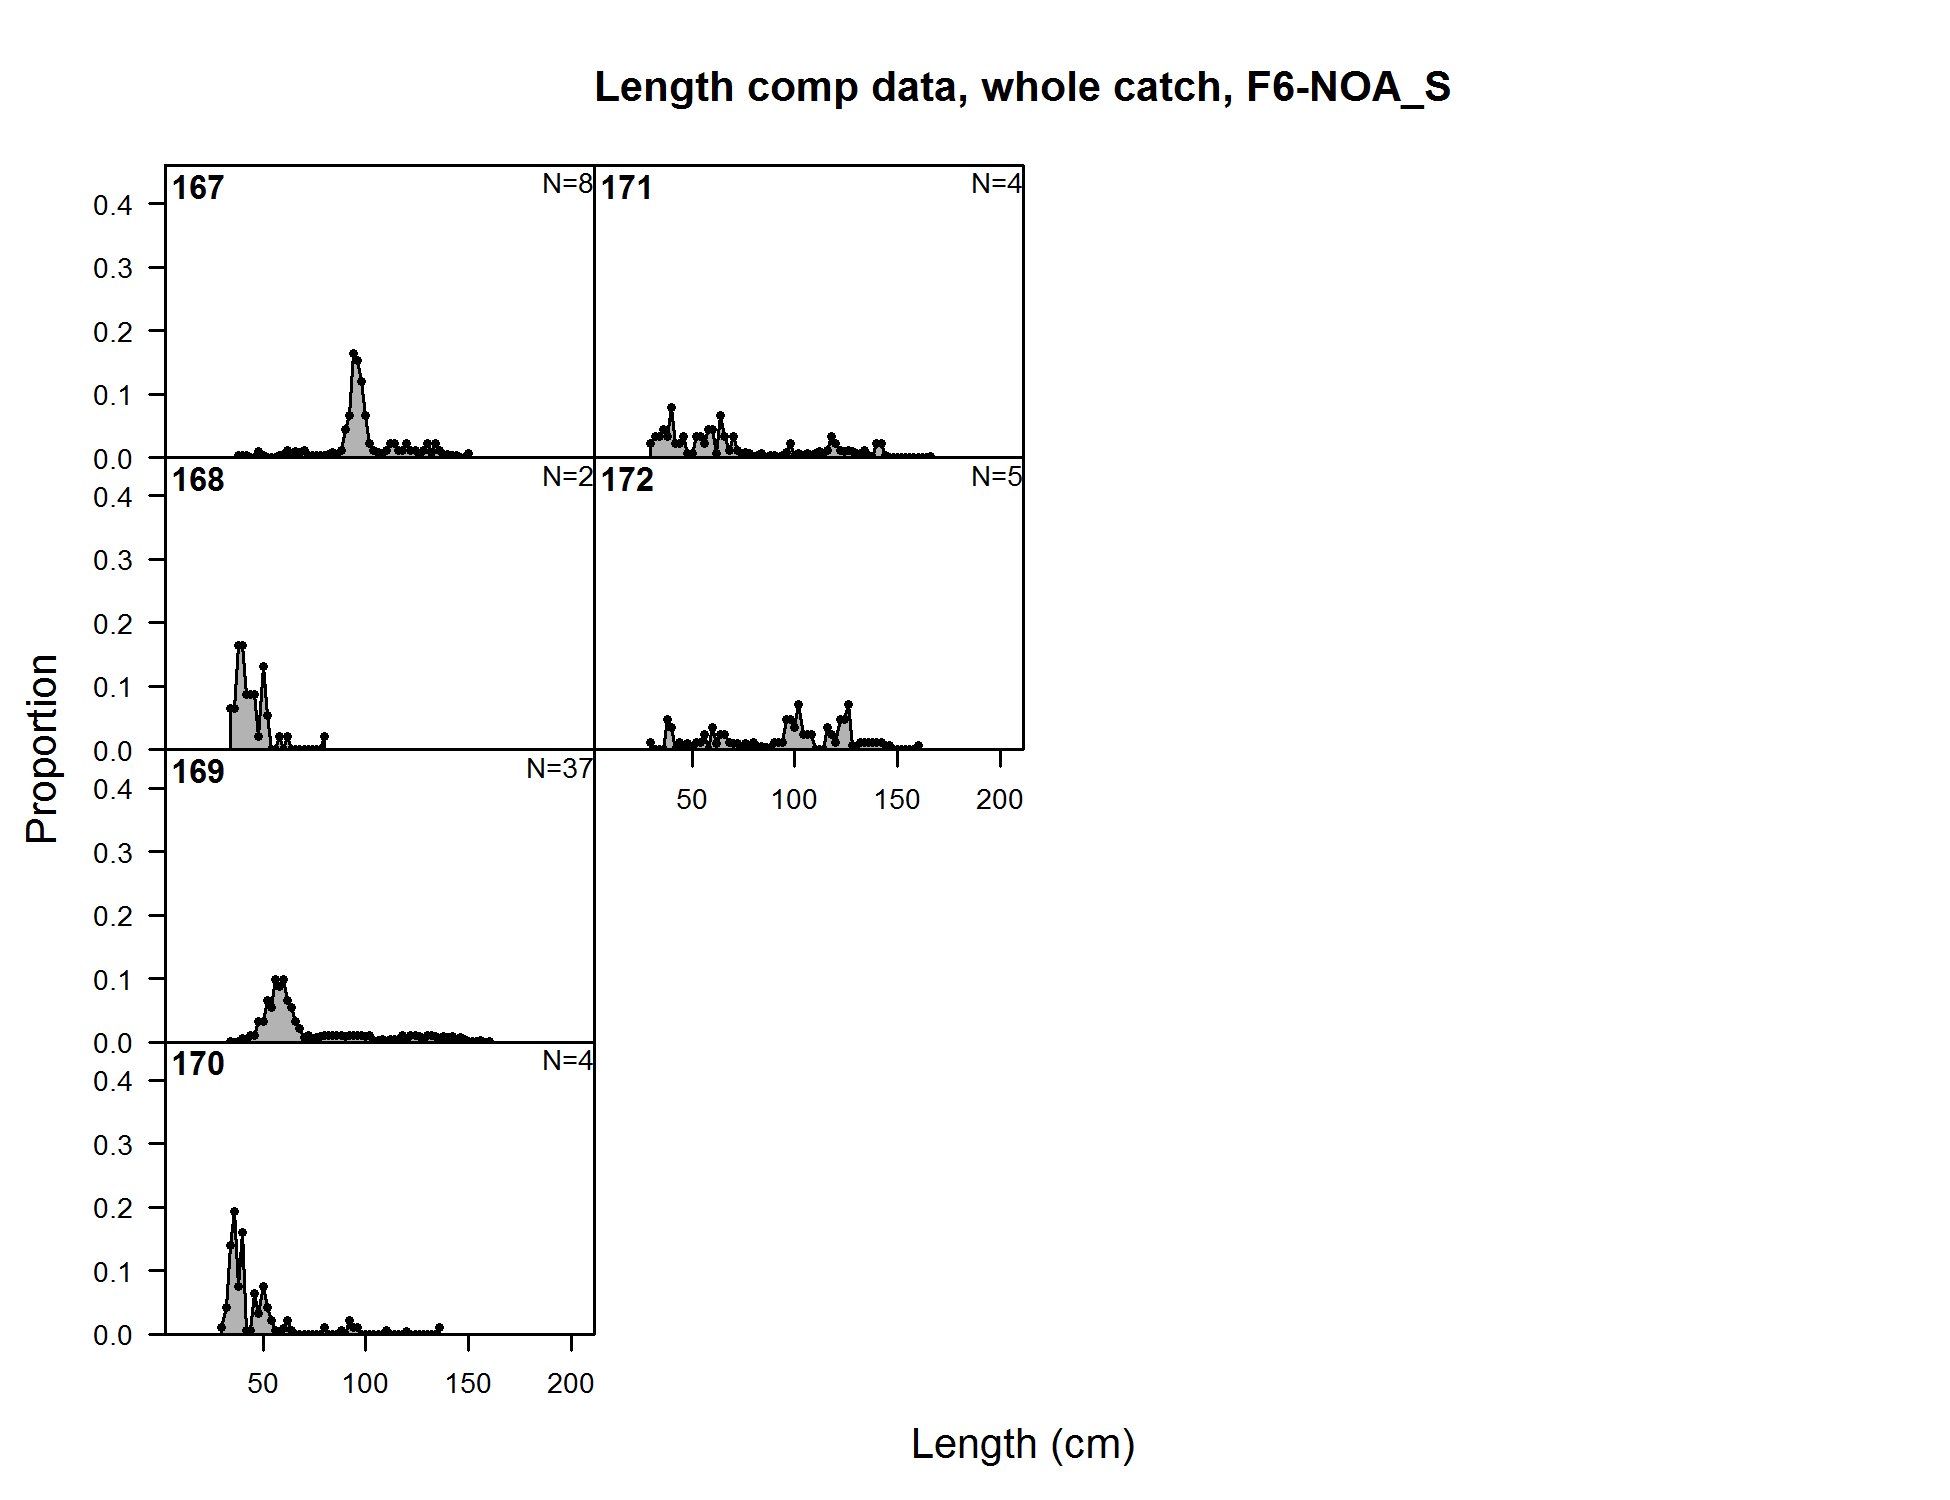
Length comp data, whole catch, F6-NOA_S (plot 1 of 10)
file: comp_lendat_flt6mkt0_page1.png

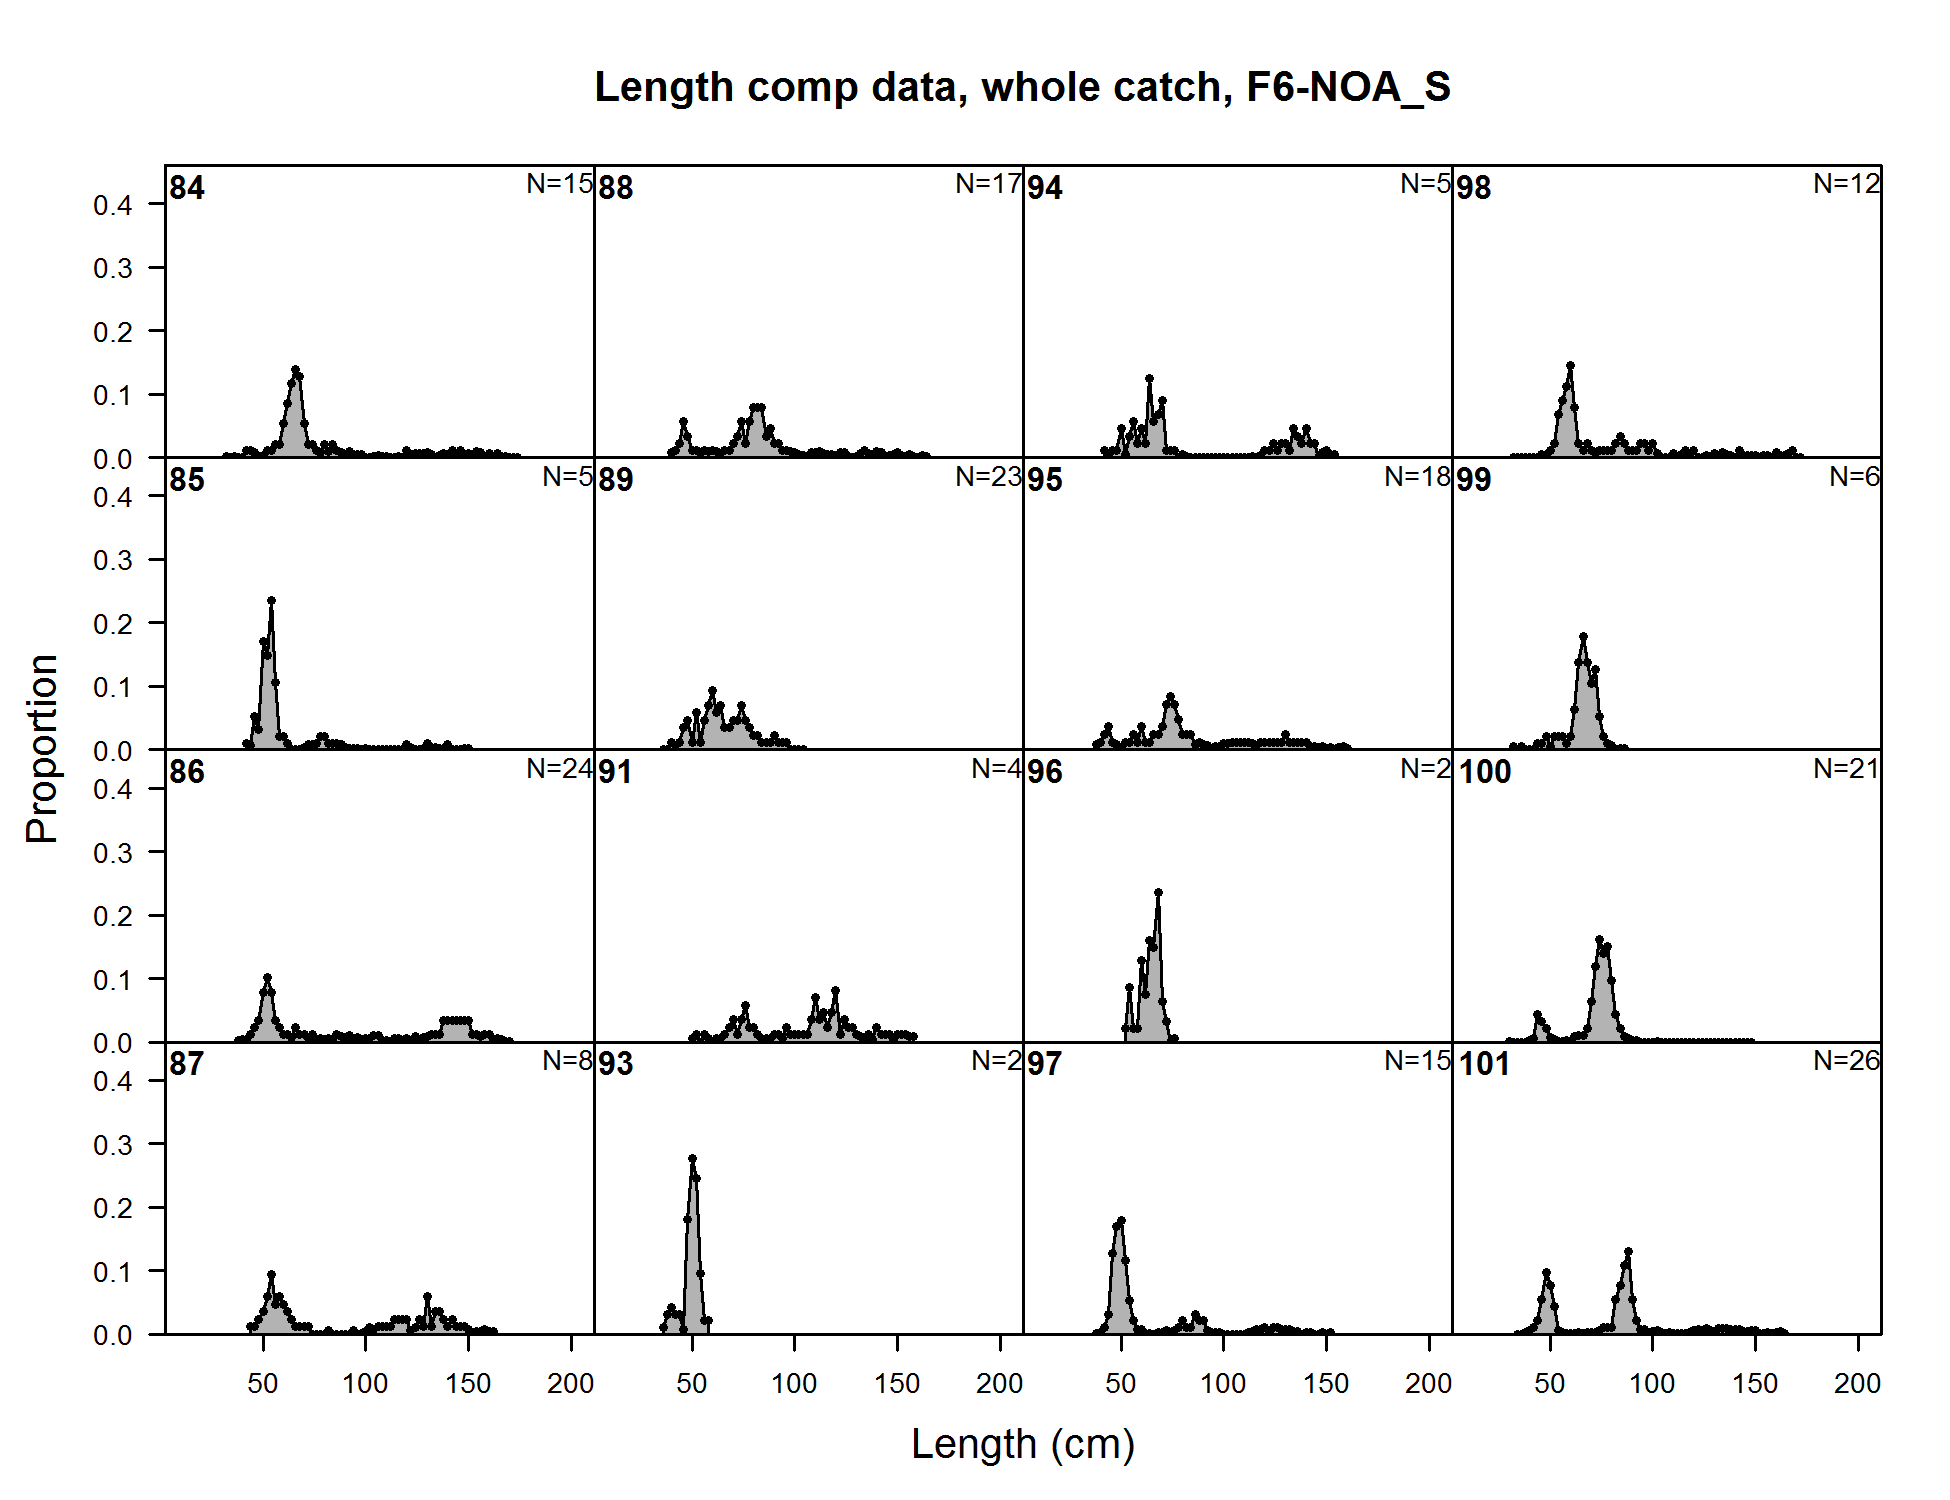
Length comp data, whole catch, F6-NOA_S (plot 1 of 10) (plot 2 of 10)
file: comp_lendat_flt6mkt0_page2.png
Length comp data, whole catch, F6-NOA_S (plot 1 of 10) (plot 2 of 10) (plot 3 of 10)
file: comp_lendat_flt6mkt0_page3.png
Length comp data, whole catch, F6-NOA_S (plot 1 of 10) (plot 2 of 10) (plot 3 of 10) (plot 4 of 10)
file: comp_lendat_flt6mkt0_page4.png
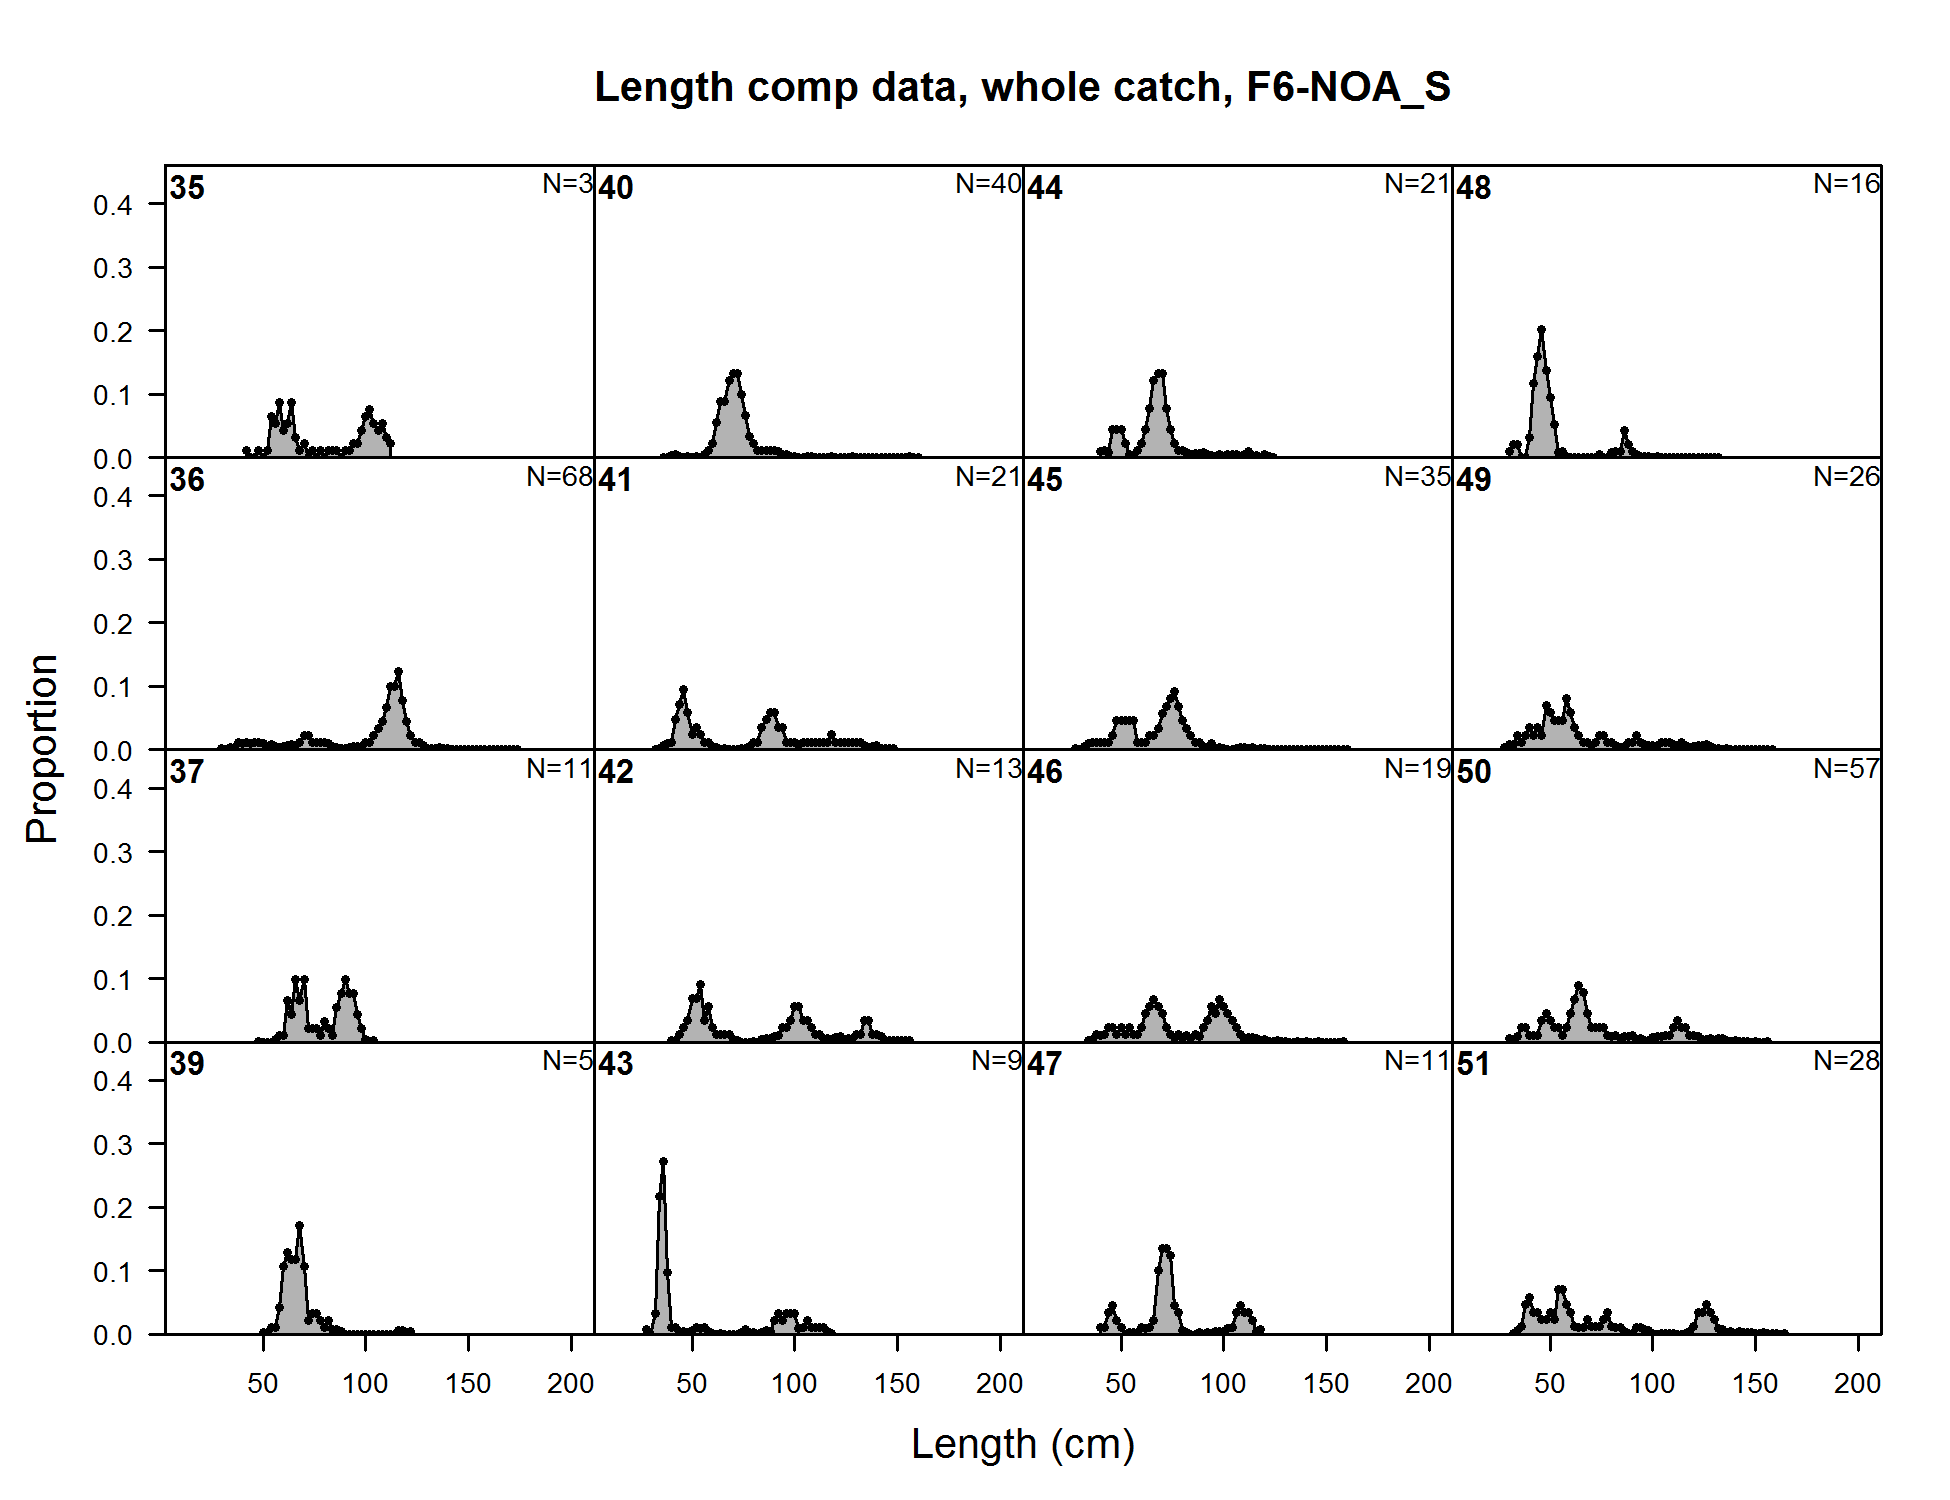
Length comp data, whole catch, F6-NOA_S (plot 1 of 10) (plot 2 of 10) (plot 3 of 10) (plot 4 of 10) (plot 5 of 10)
file: comp_lendat_flt6mkt0_page5.png
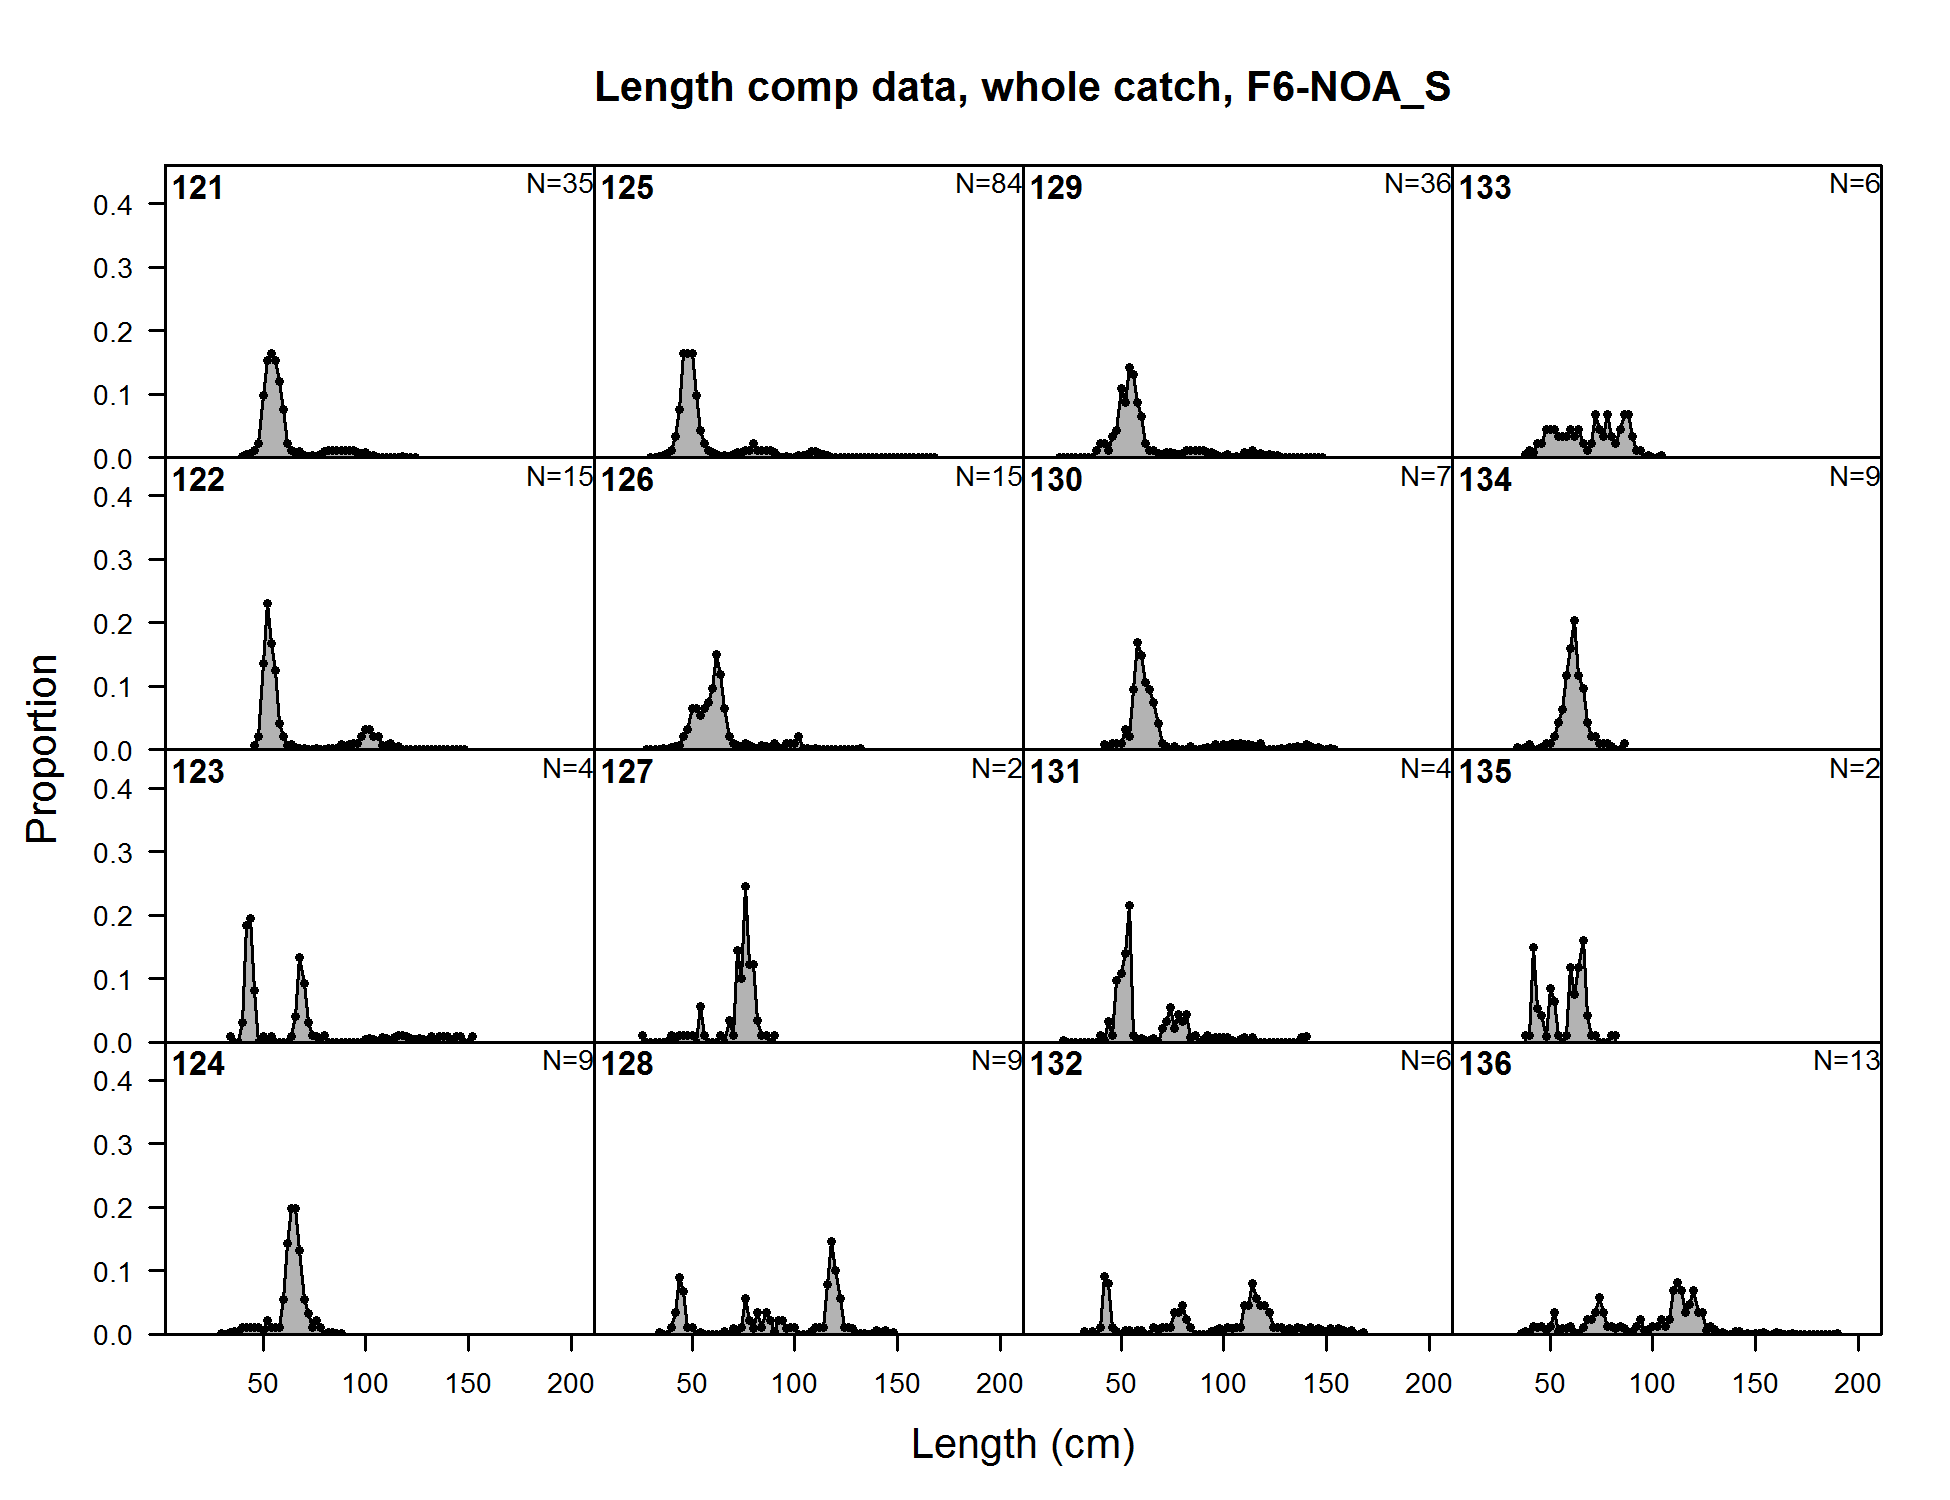
Length comp data, whole catch, F6-NOA_S (plot 1 of 10) (plot 2 of 10) (plot 3 of 10) (plot 4 of 10) (plot 5 of 10) (plot 6 of 10)
file: comp_lendat_flt6mkt0_page6.png

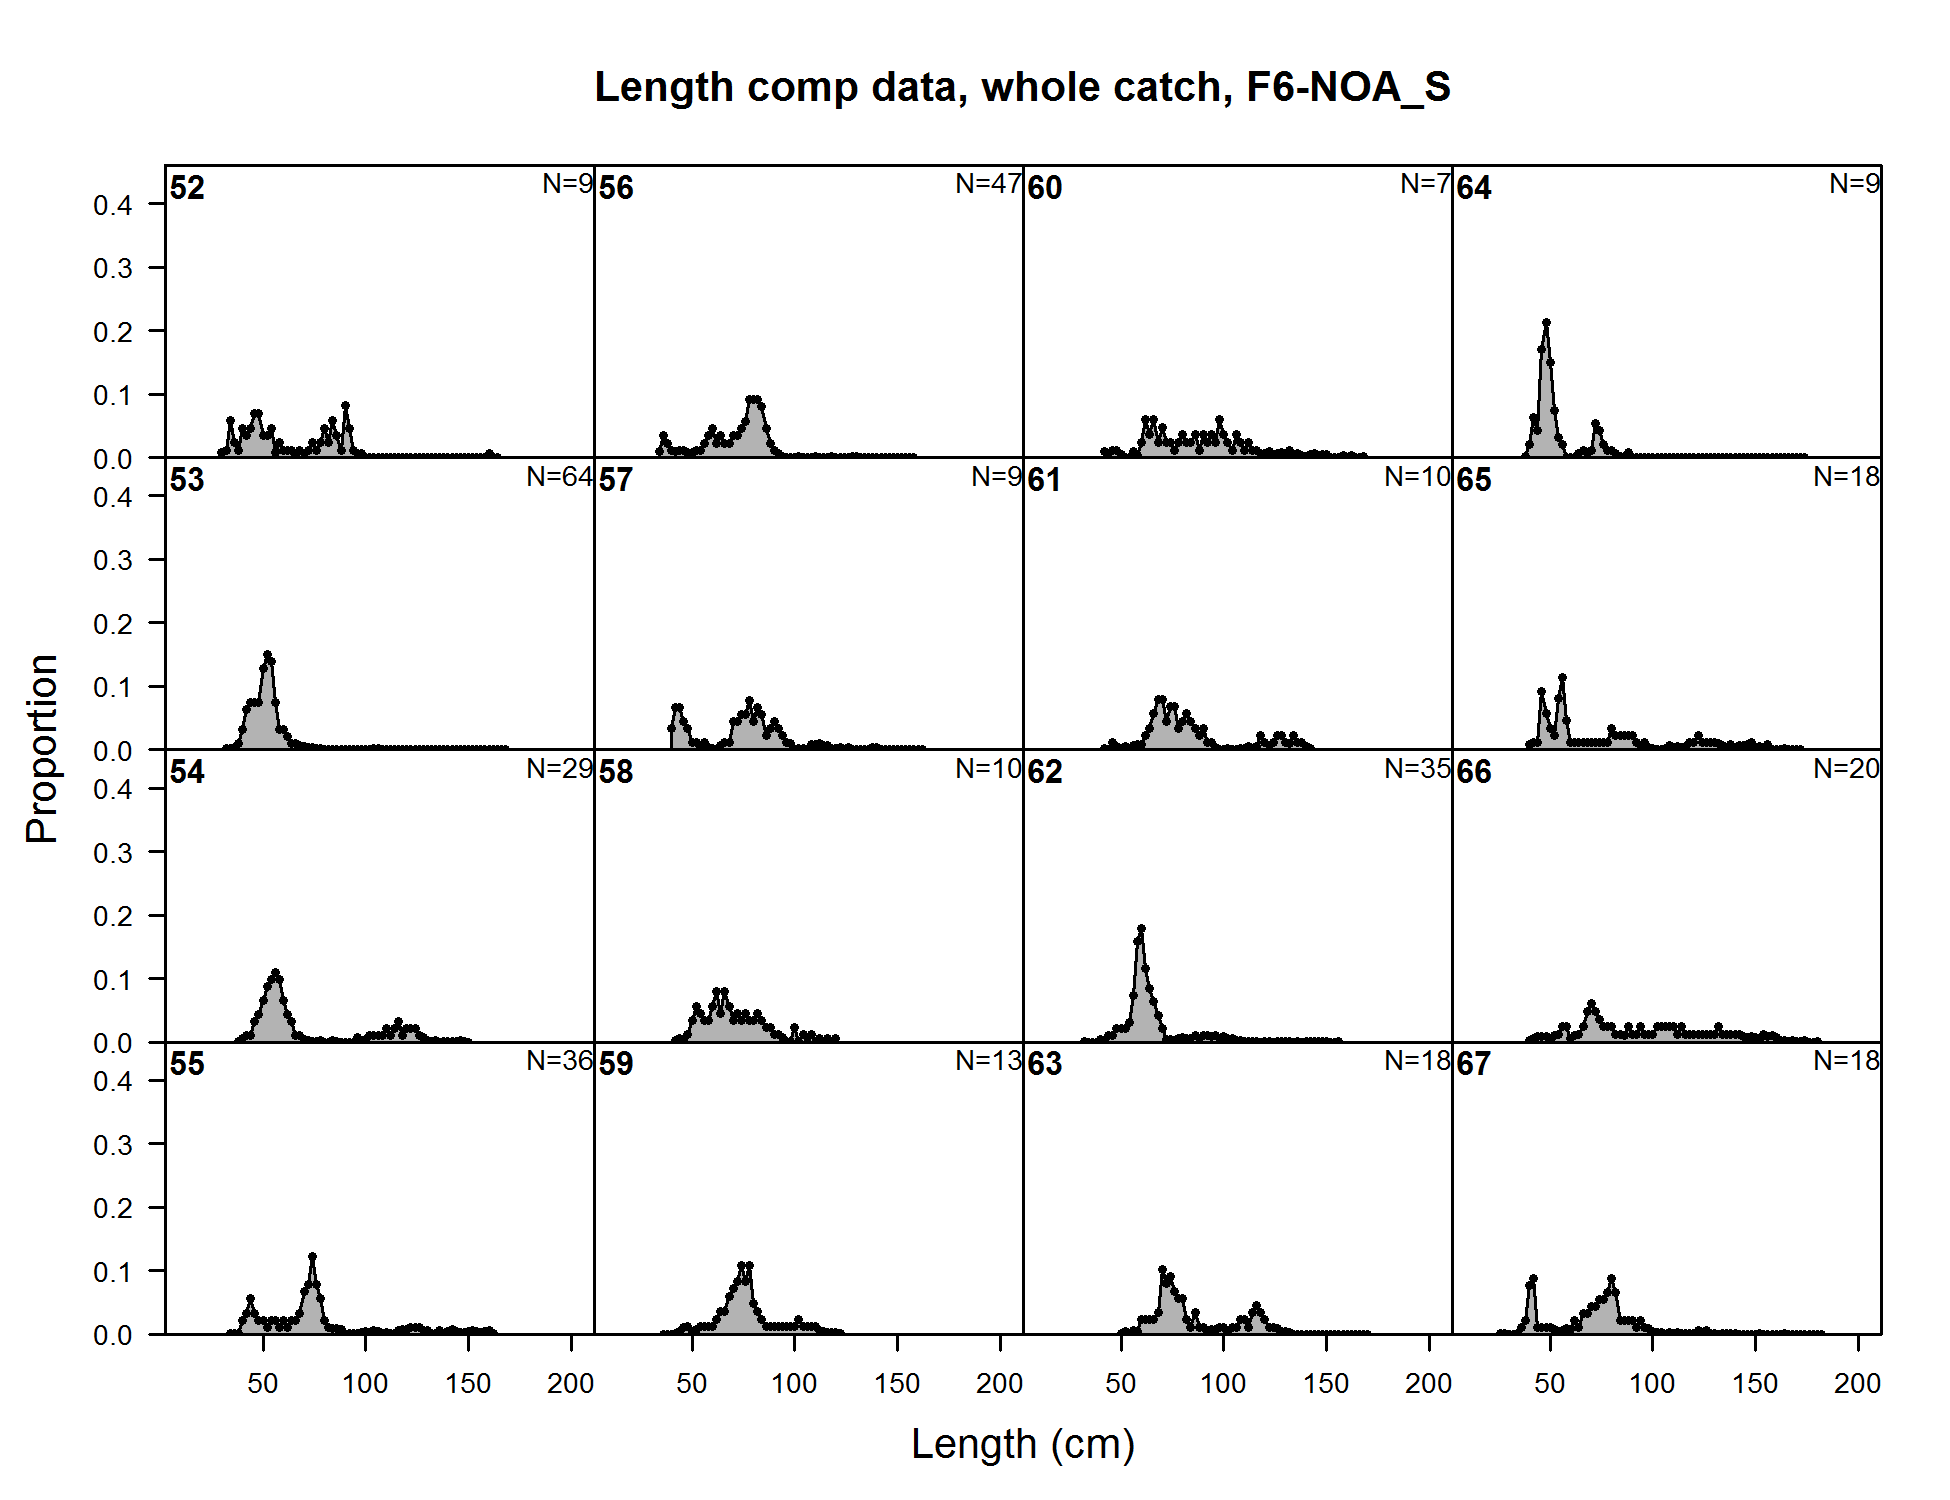
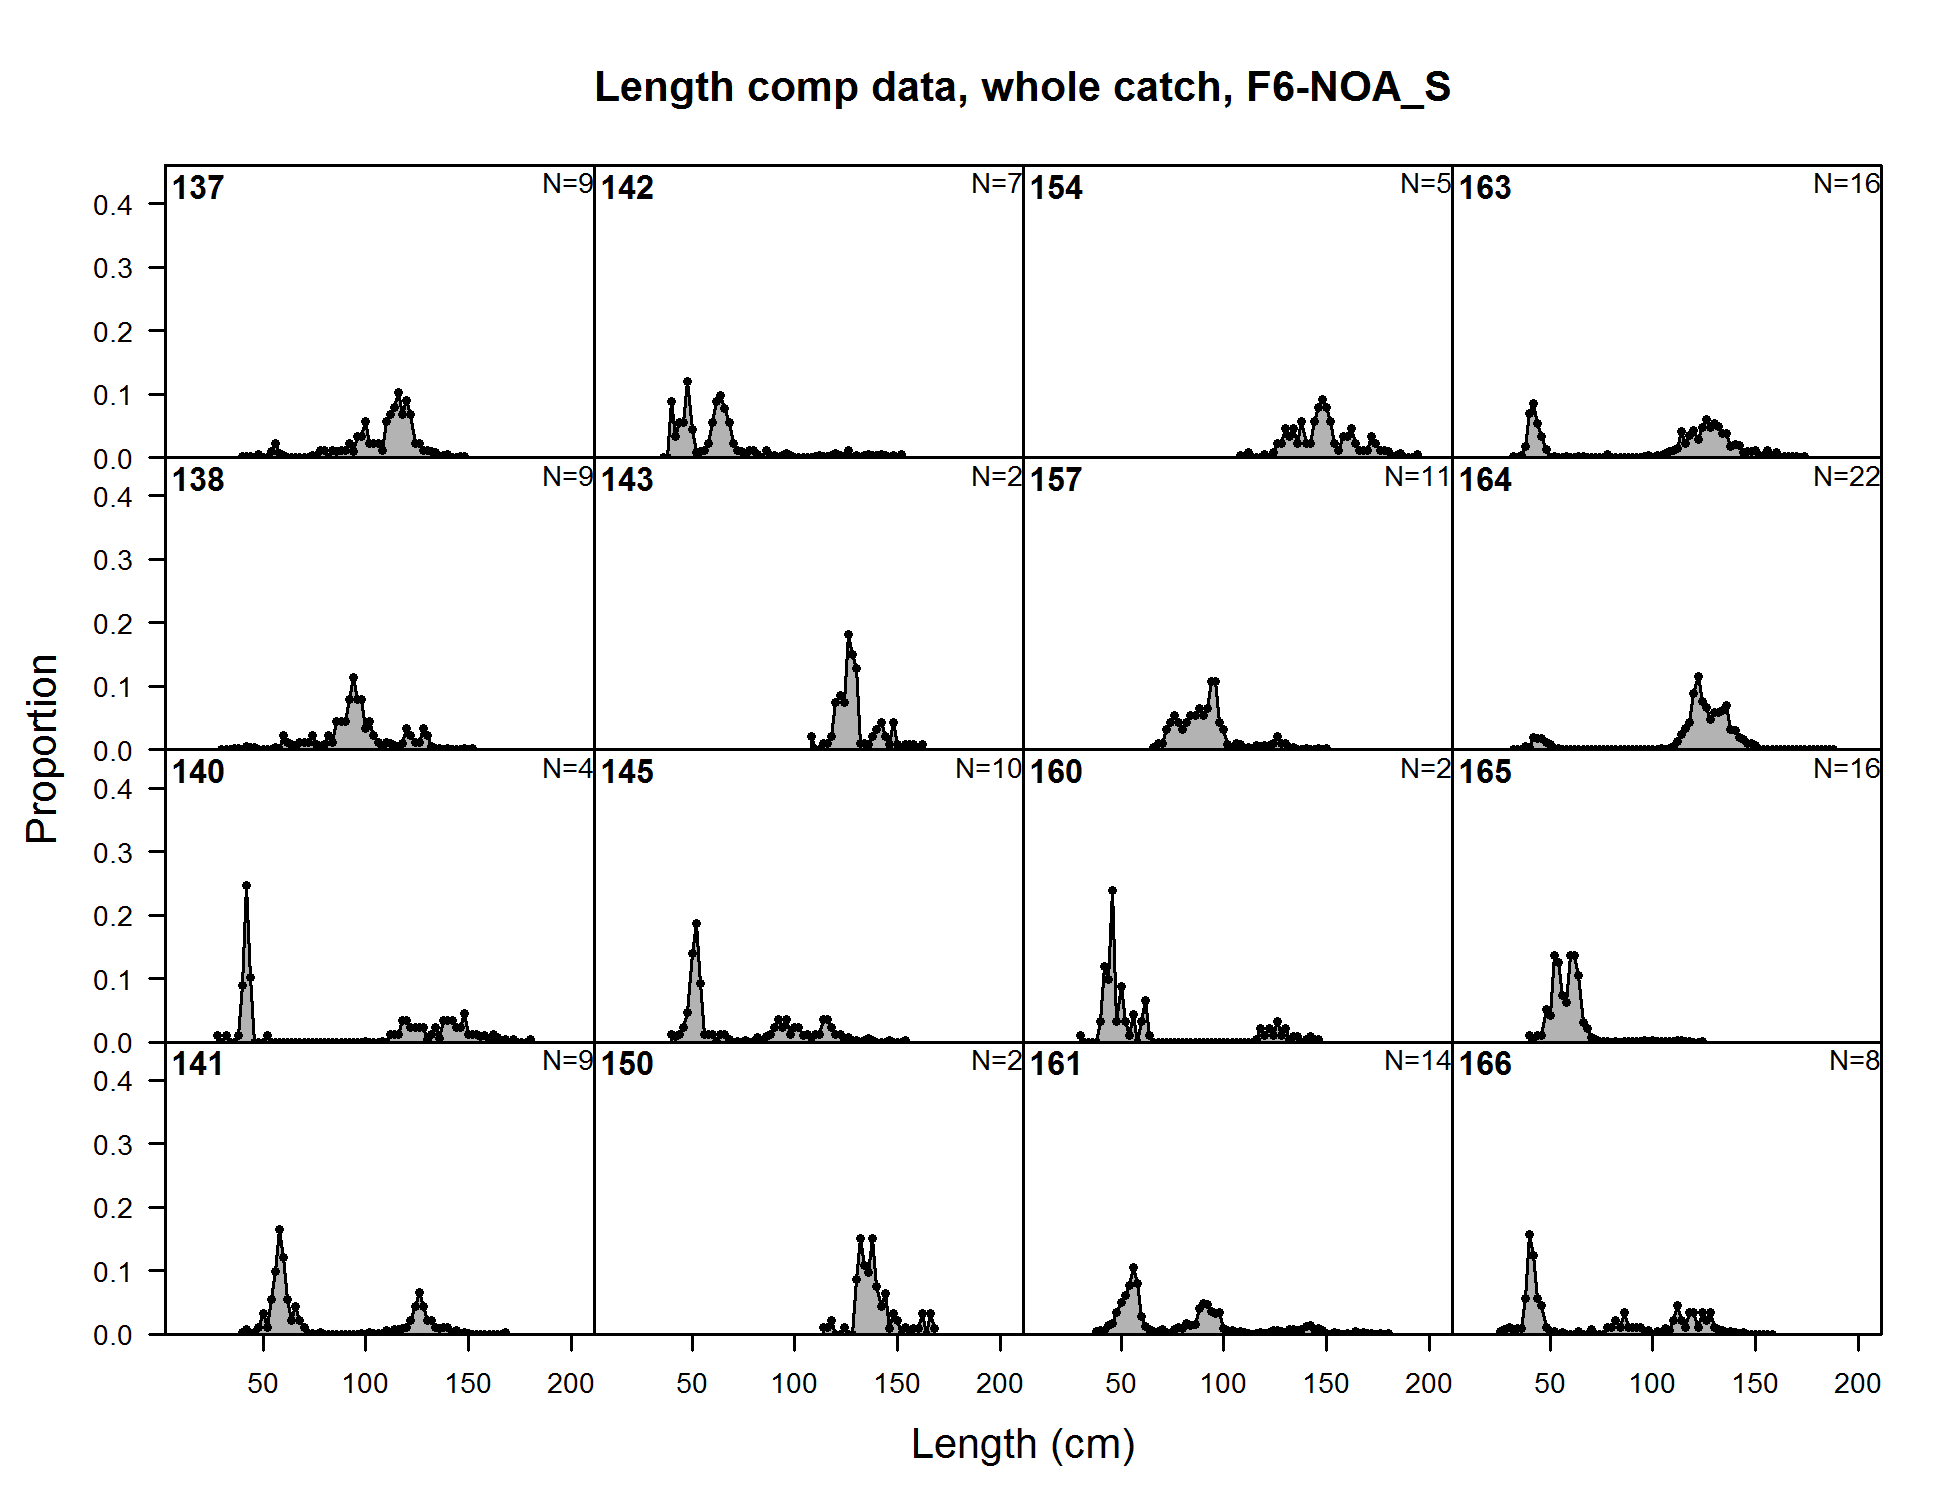
Length comp data, whole catch, F6-NOA_S (plot 1 of 10) (plot 2 of 10) (plot 3 of 10) (plot 4 of 10) (plot 5 of 10) (plot 6 of 10) (plot 7 of 10)
file: comp_lendat_flt6mkt0_page7.png
Length comp data, whole catch, F6-NOA_S (plot 1 of 10) (plot 2 of 10) (plot 3 of 10) (plot 4 of 10) (plot 5 of 10) (plot 6 of 10) (plot 7 of 10) (plot 8 of 10)
file: comp_lendat_flt6mkt0_page8.png
Length comp data, whole catch, F6-NOA_S (plot 1 of 10) (plot 2 of 10) (plot 3 of 10) (plot 4 of 10) (plot 5 of 10) (plot 6 of 10) (plot 7 of 10) (plot 8 of 10) (plot 9 of 10)
file: comp_lendat_flt6mkt0_page9.png
Length comp data, whole catch, F6-NOA_S (plot 1 of 10) (plot 2 of 10) (plot 3 of 10) (plot 4 of 10) (plot 5 of 10) (plot 6 of 10) (plot 7 of 10) (plot 8 of 10) (plot 9 of 10) (plot 10 of 10)
file: comp_lendat_flt6mkt0_page10.png
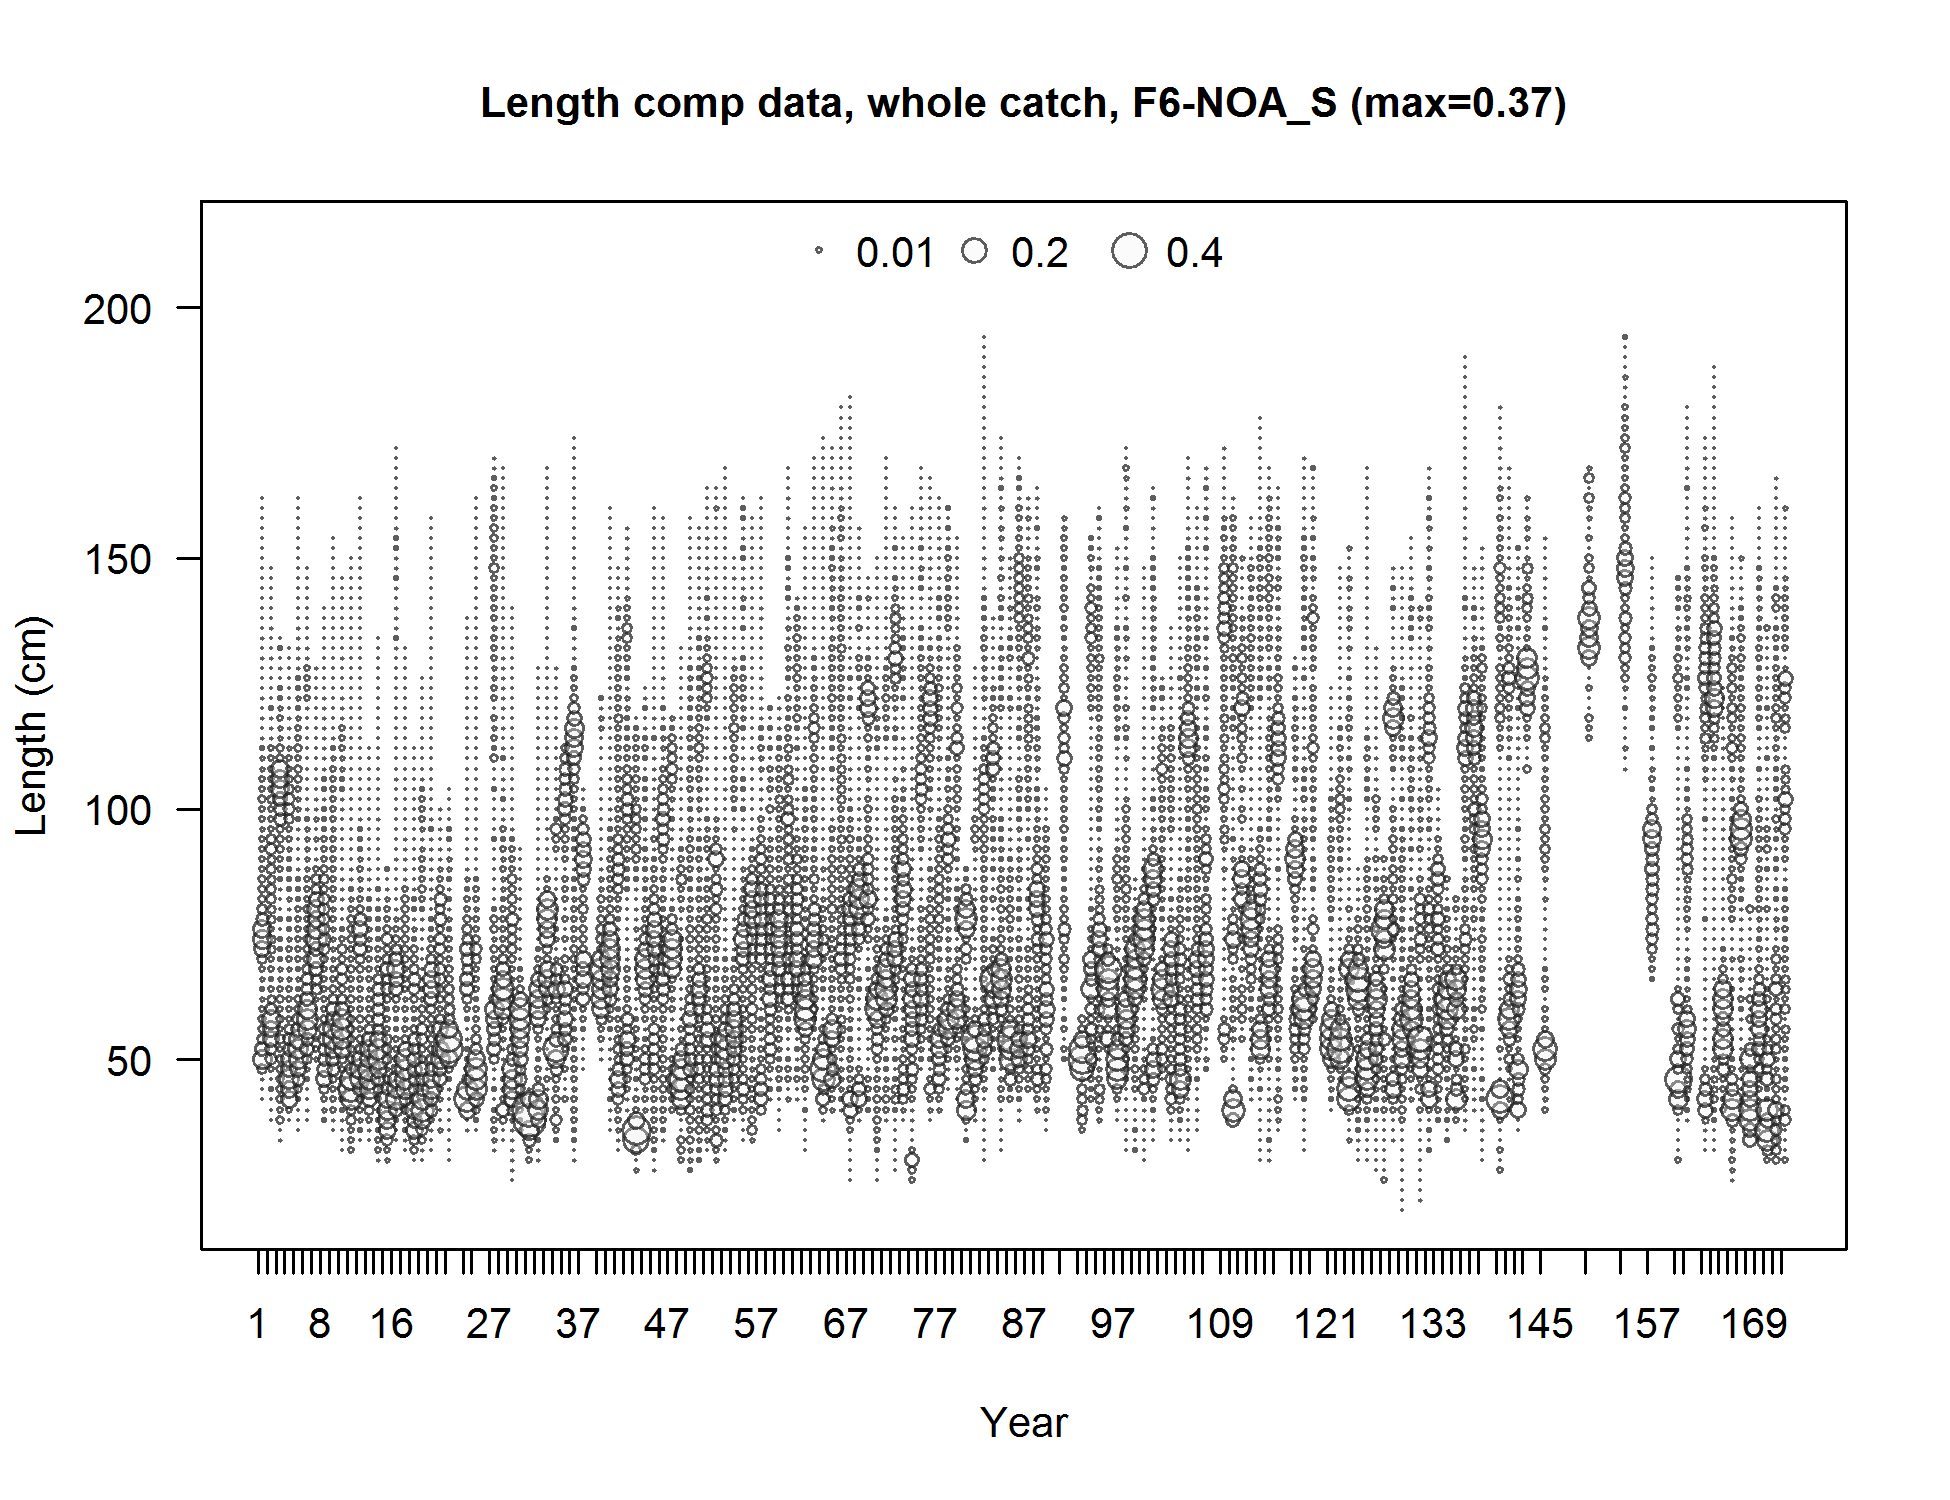
Length comp data, whole catch, F6-NOA_S (max=0.37) (plot 10 of 10)
file: comp_lendat_bubflt6mkt0_page10.png
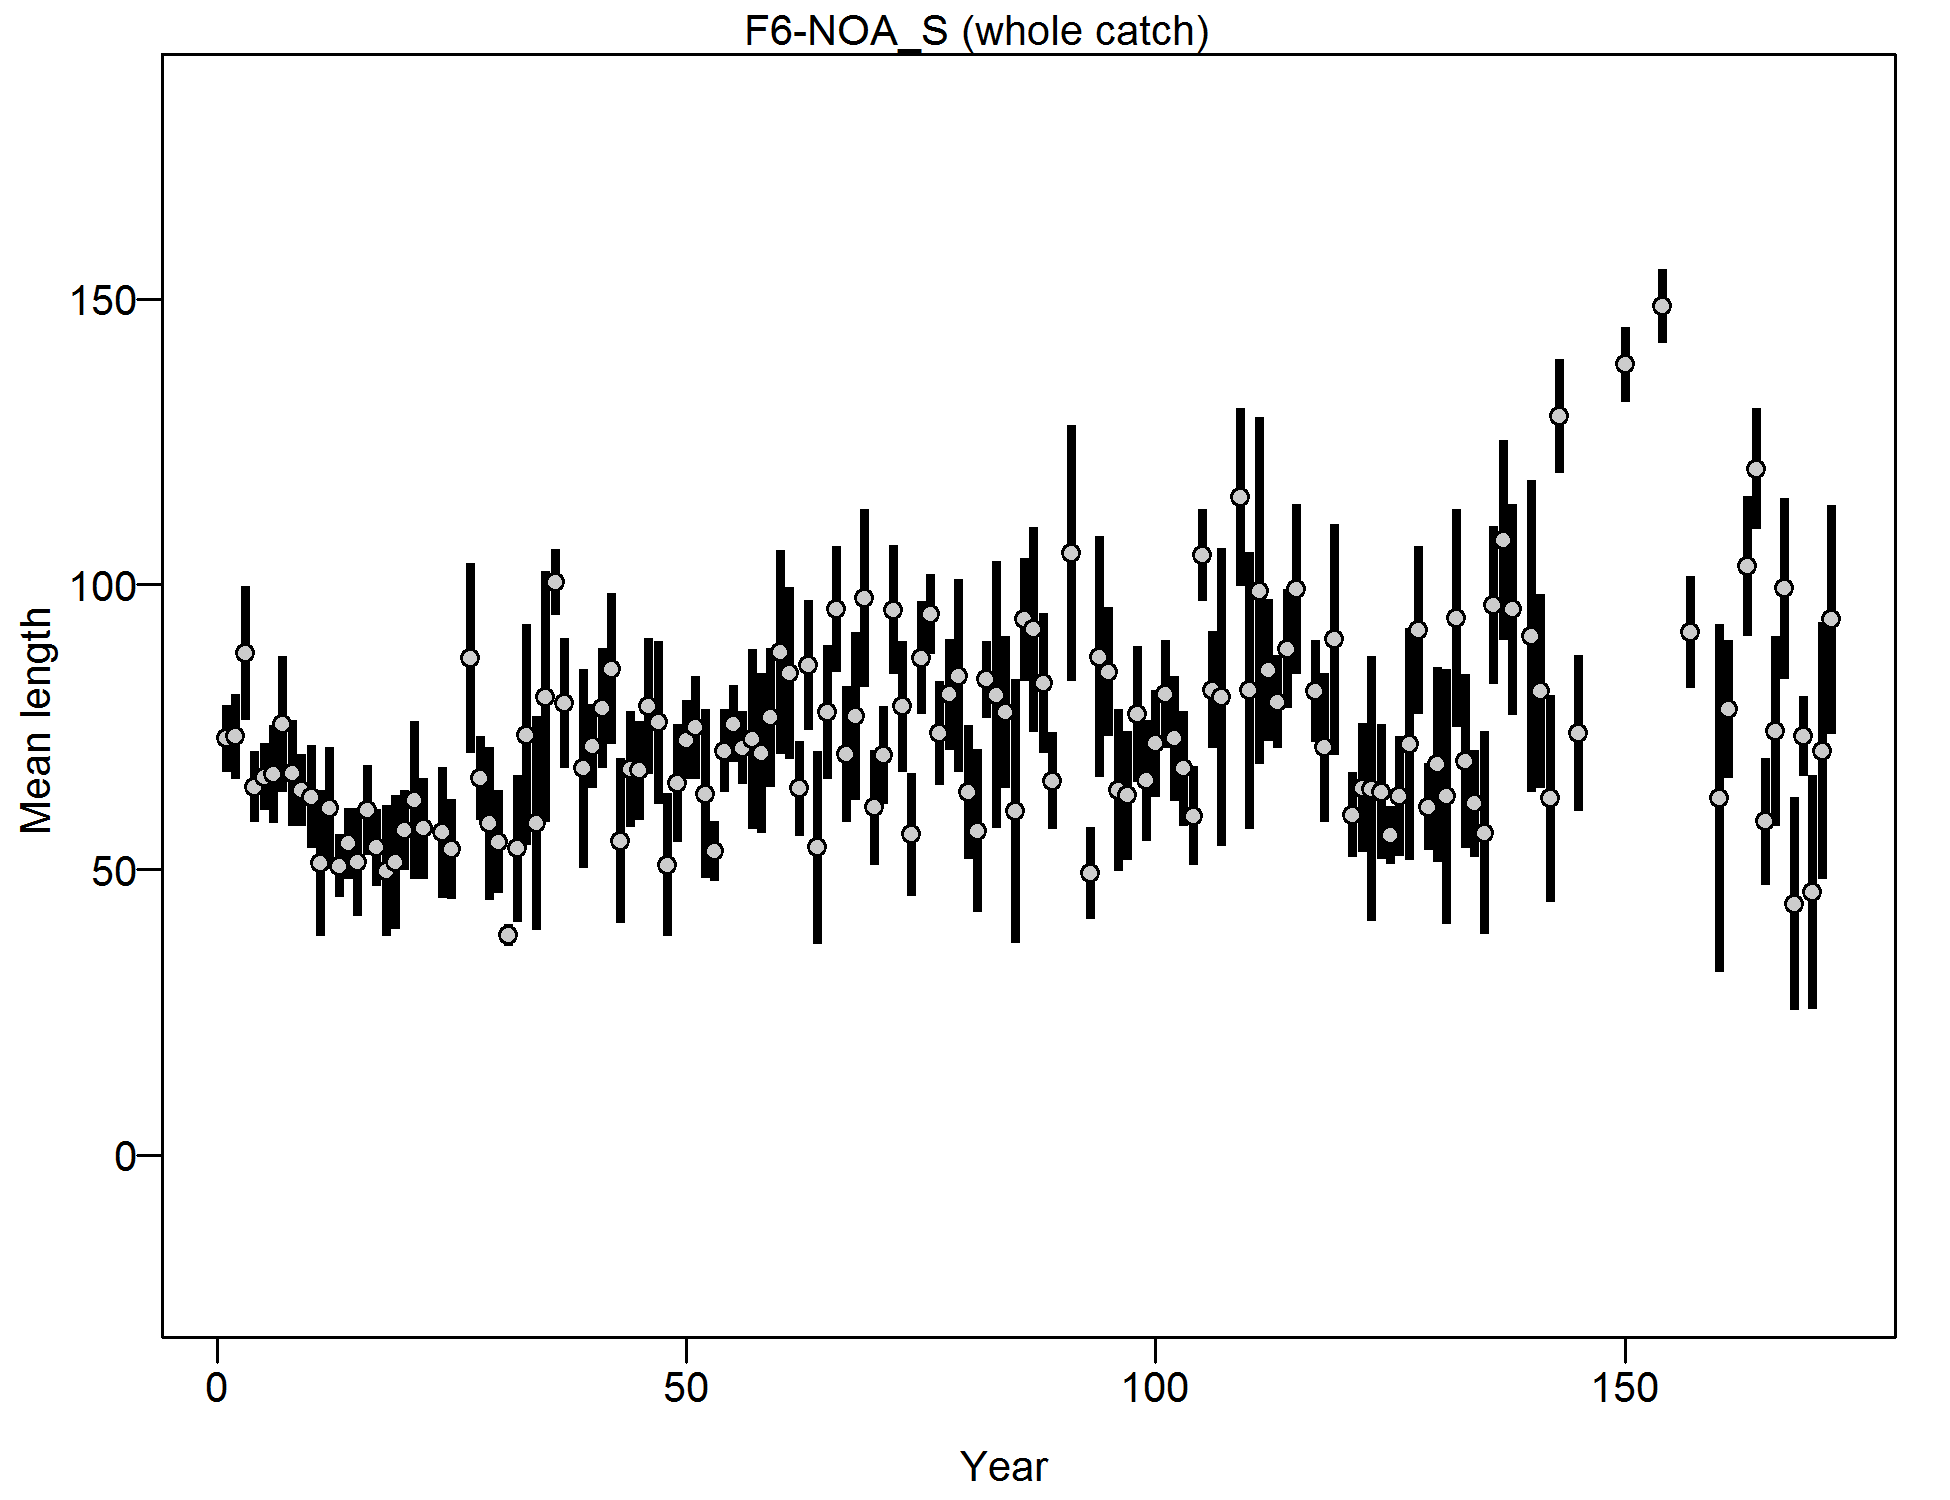
Mean length for F6-NOA_S with 95% confidence intervals based on current samples sizes.
file: comp_lendat_data_weighting_TA1.8_F6-NOA_S.png

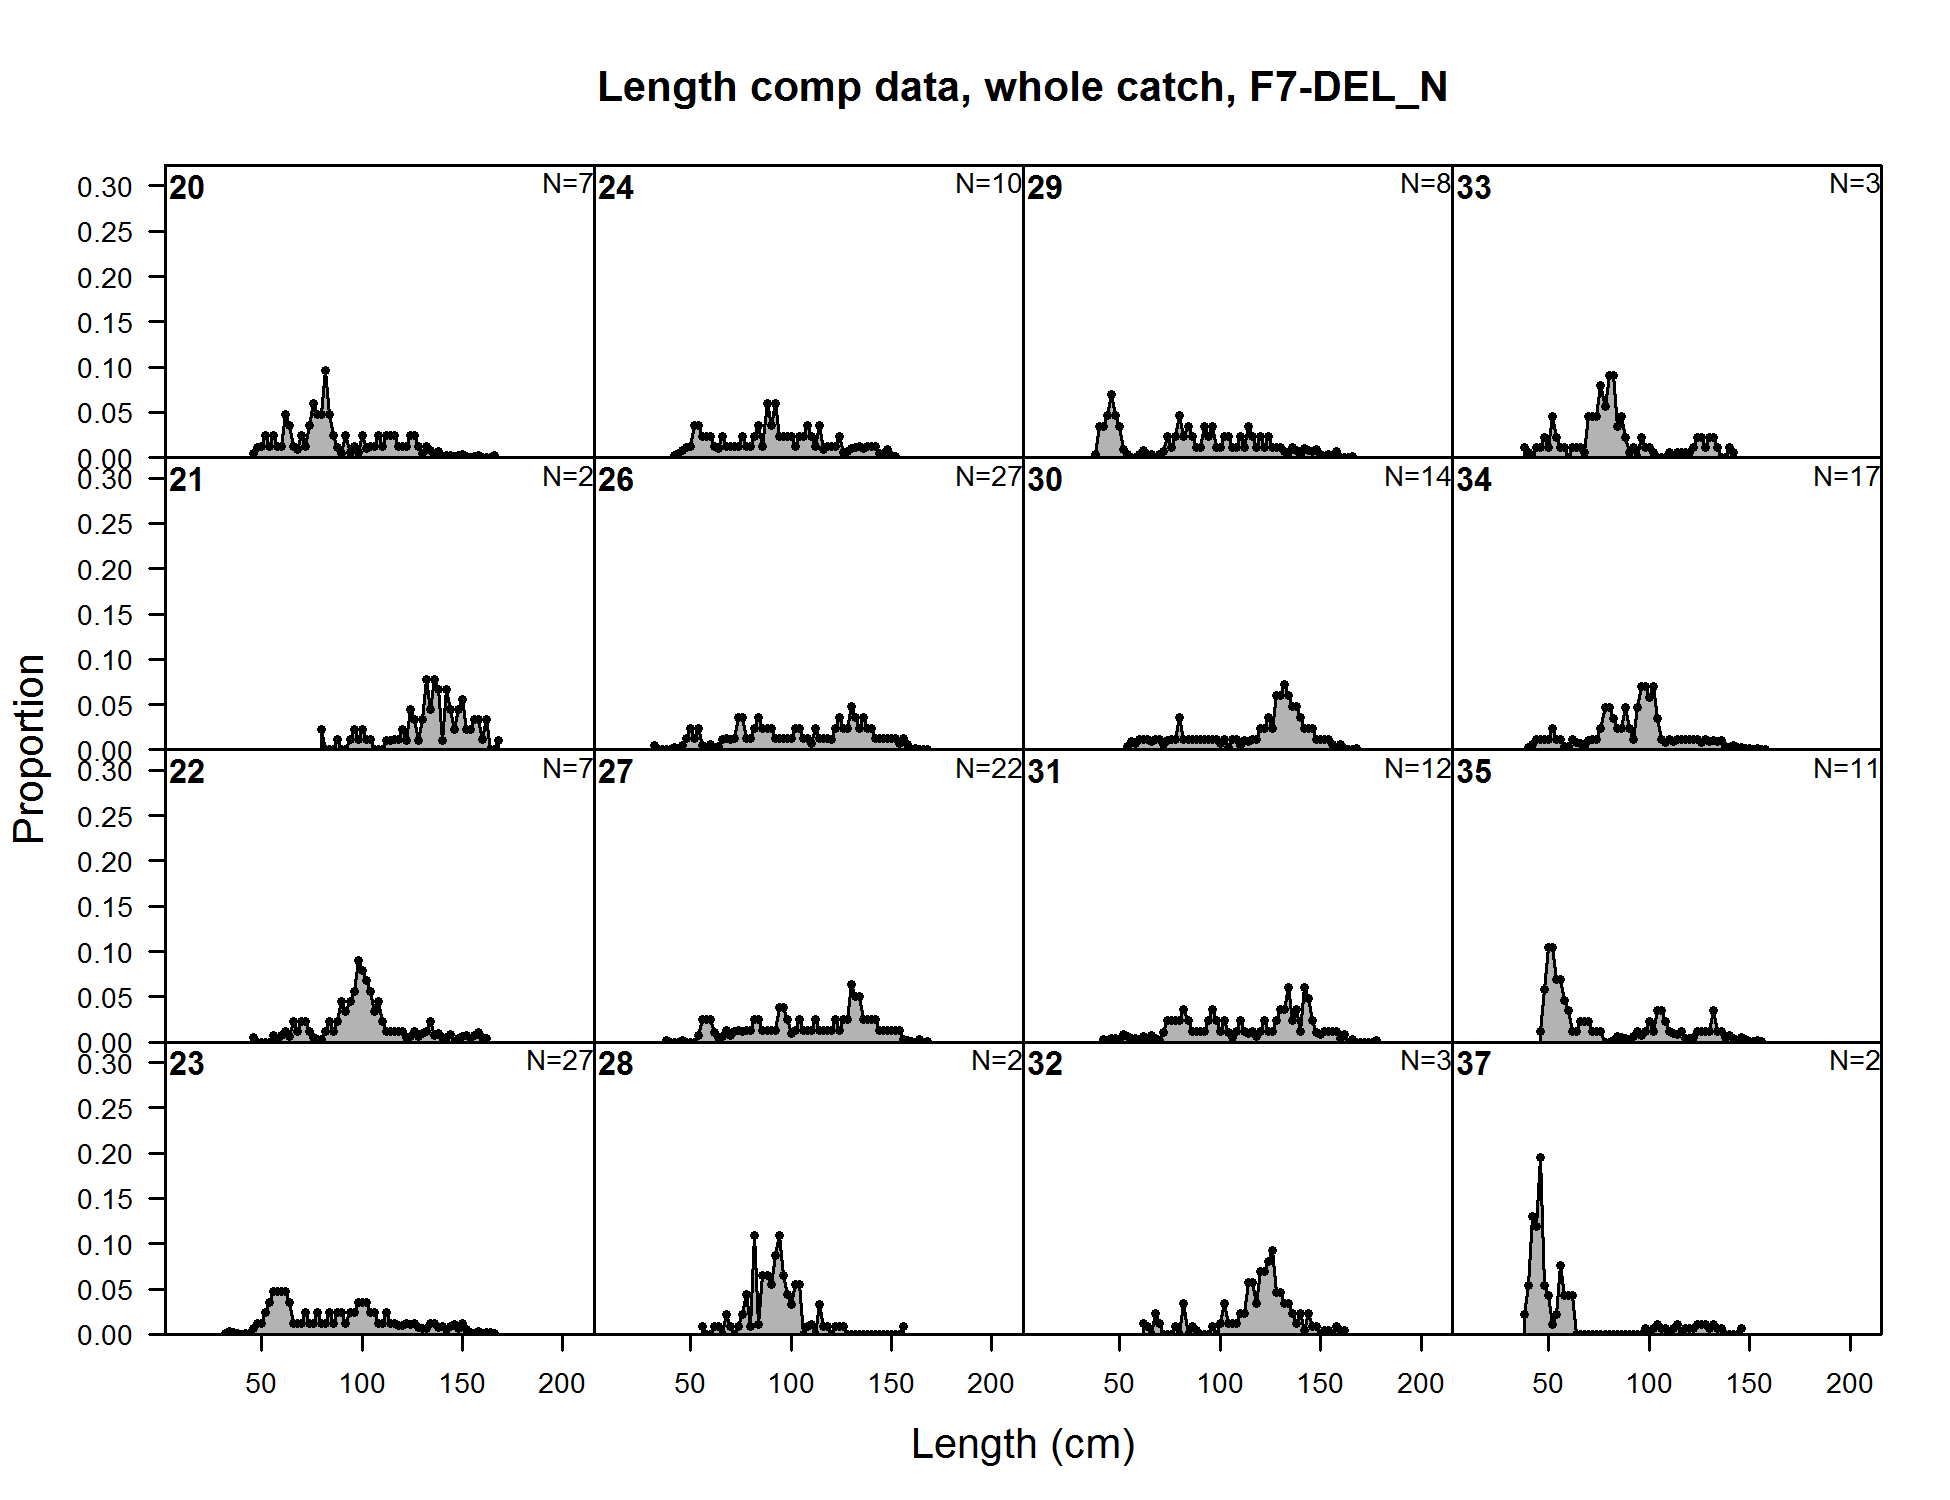
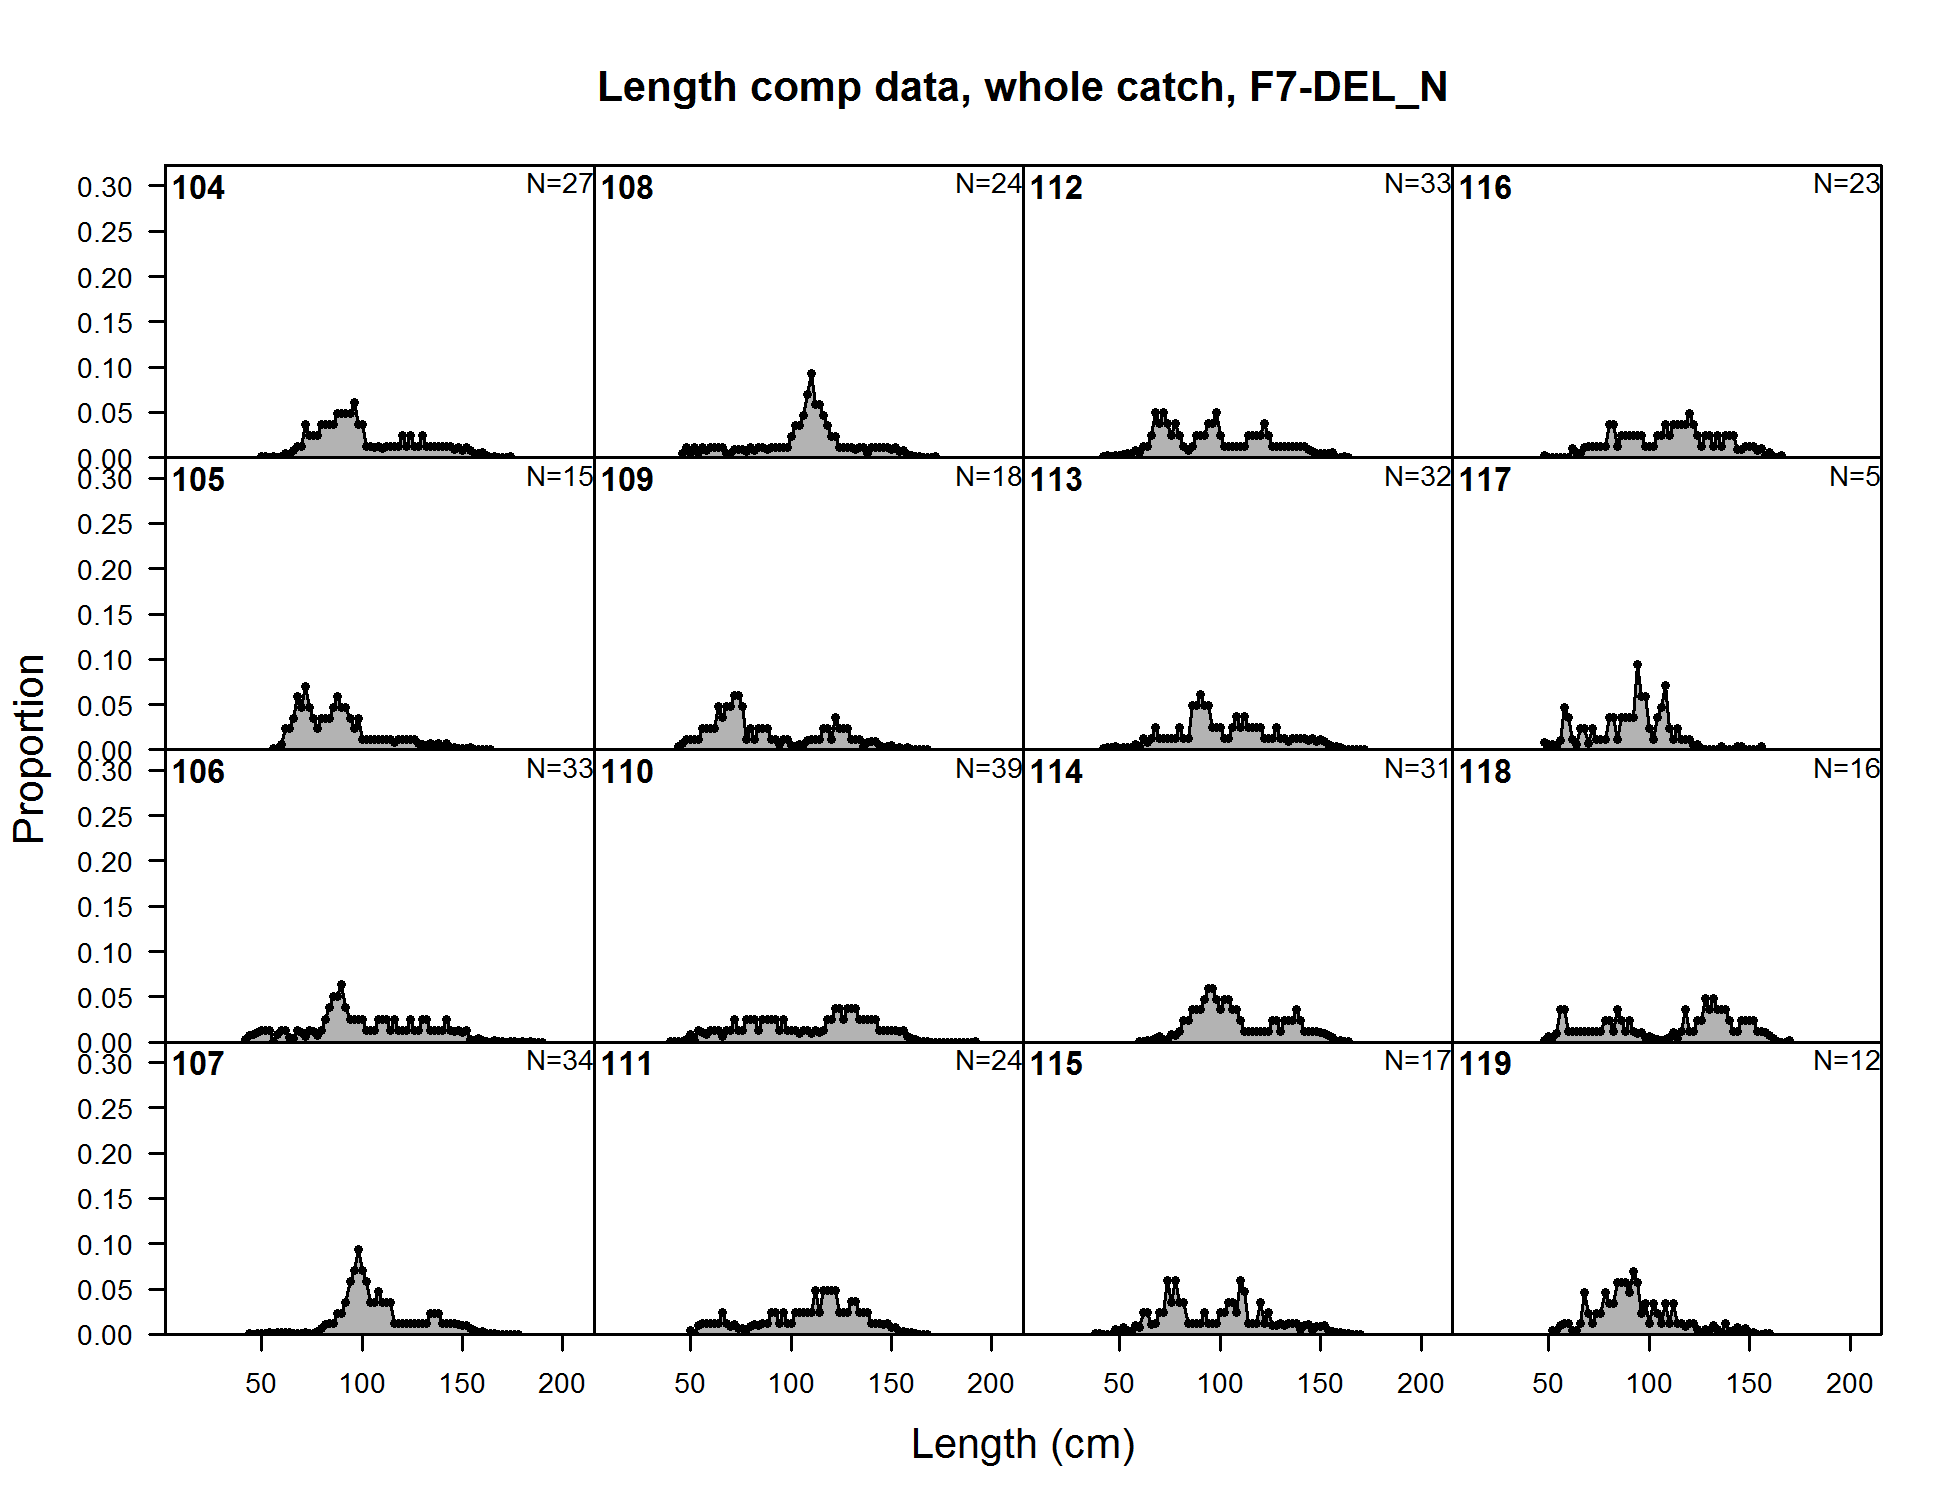
Length comp data, whole catch, F7-DEL_N (plot 1 of 11)
file: comp_lendat_flt7mkt0_page1.png
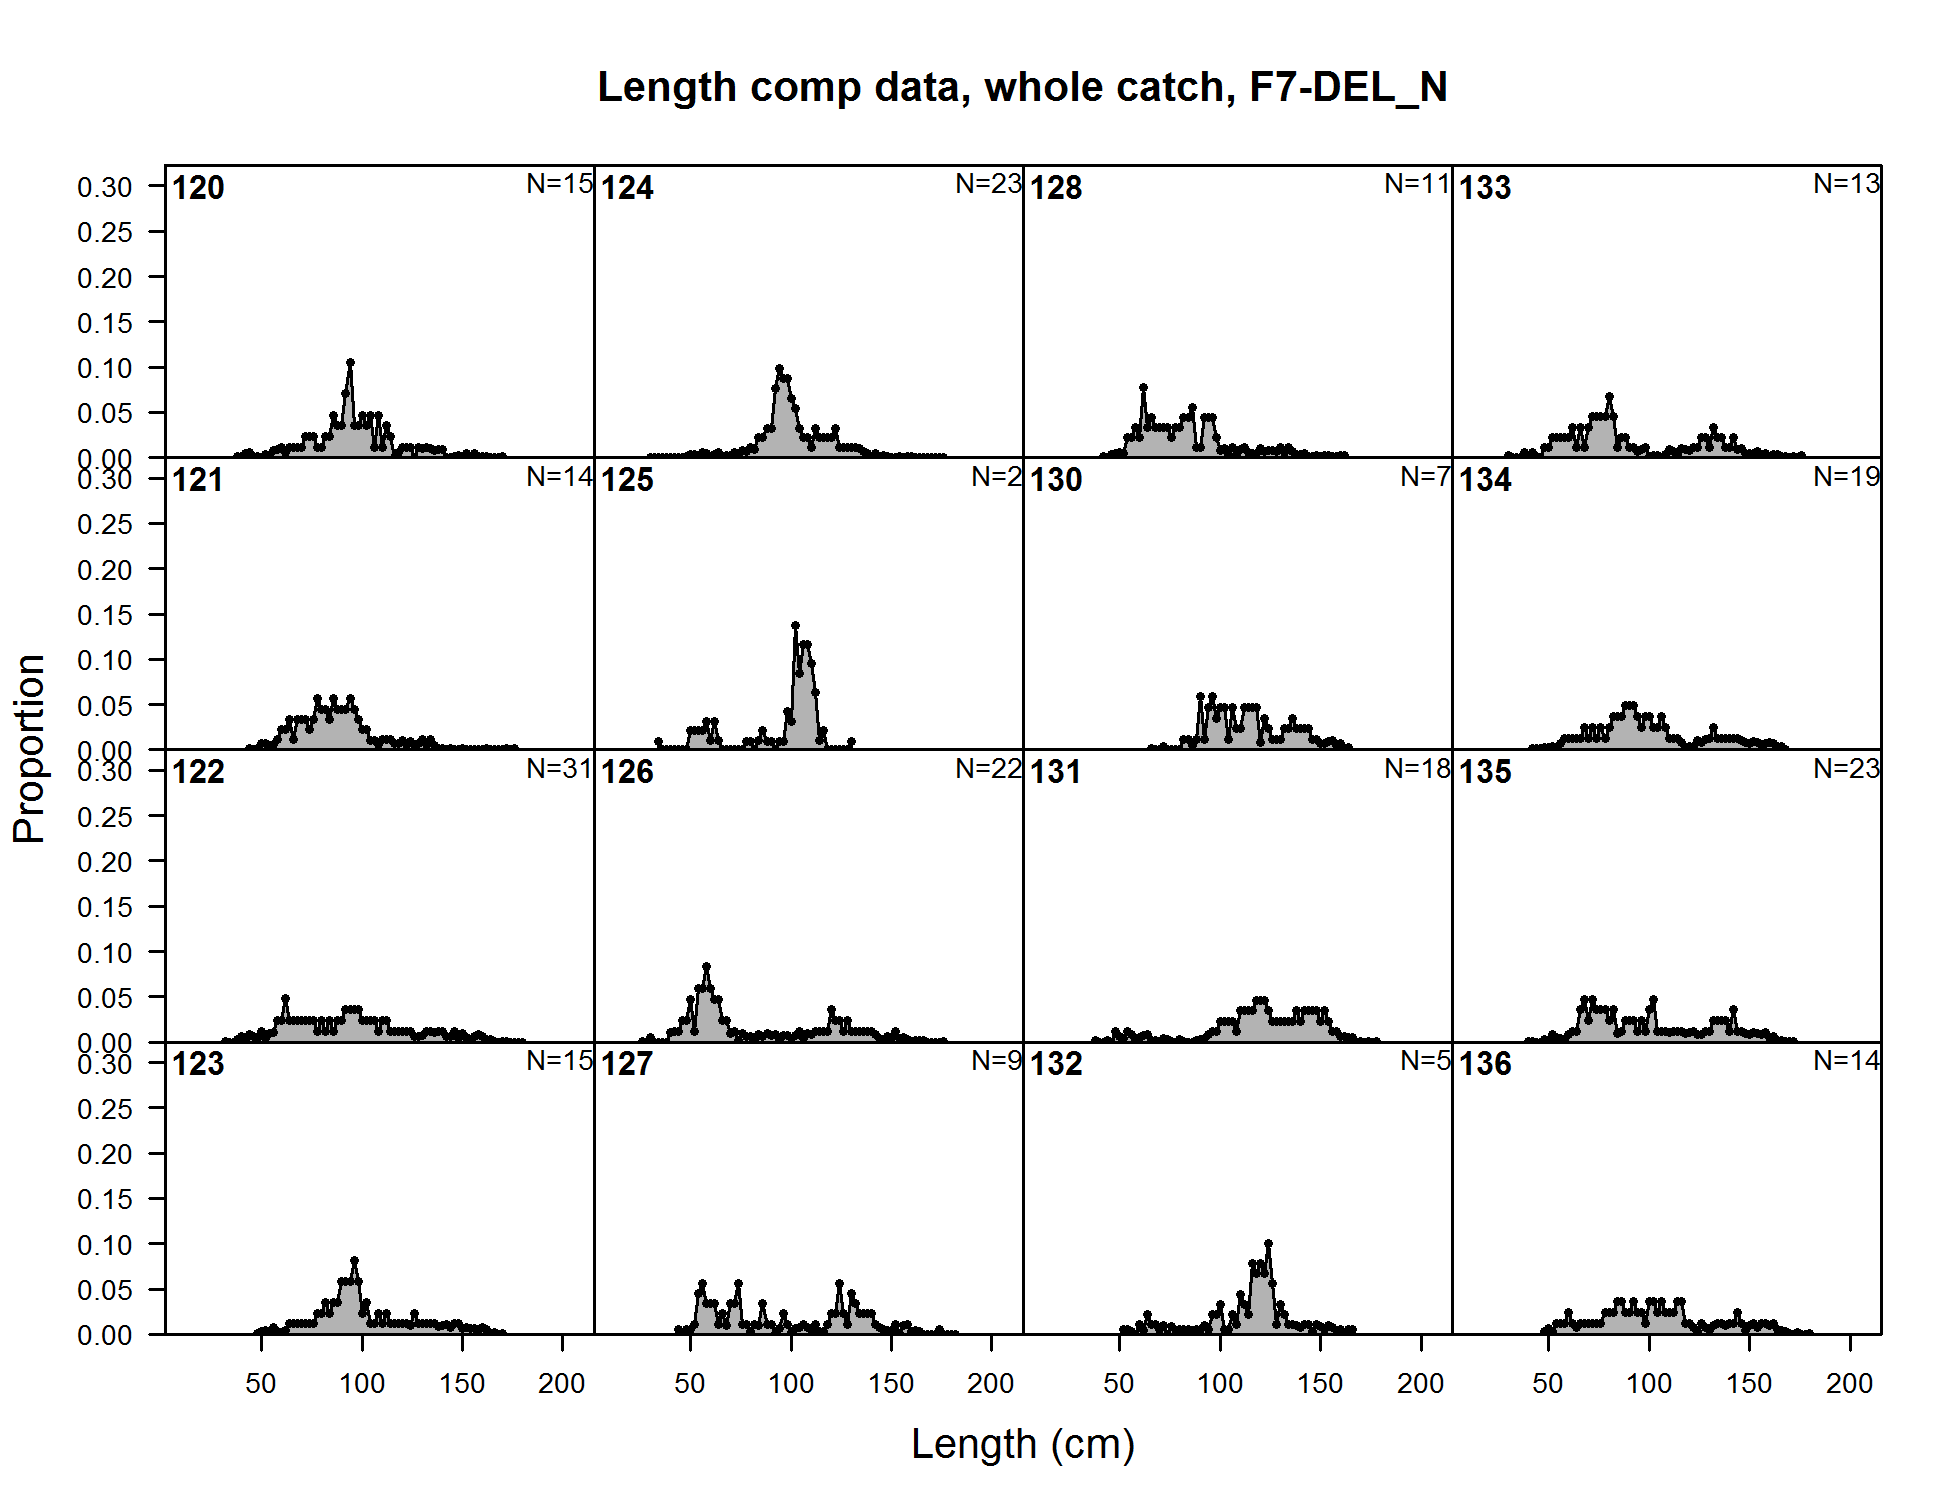
Length comp data, whole catch, F7-DEL_N (plot 1 of 11) (plot 2 of 11)
file: comp_lendat_flt7mkt0_page2.png
Length comp data, whole catch, F7-DEL_N (plot 1 of 11) (plot 2 of 11) (plot 3 of 11)
file: comp_lendat_flt7mkt0_page3.png
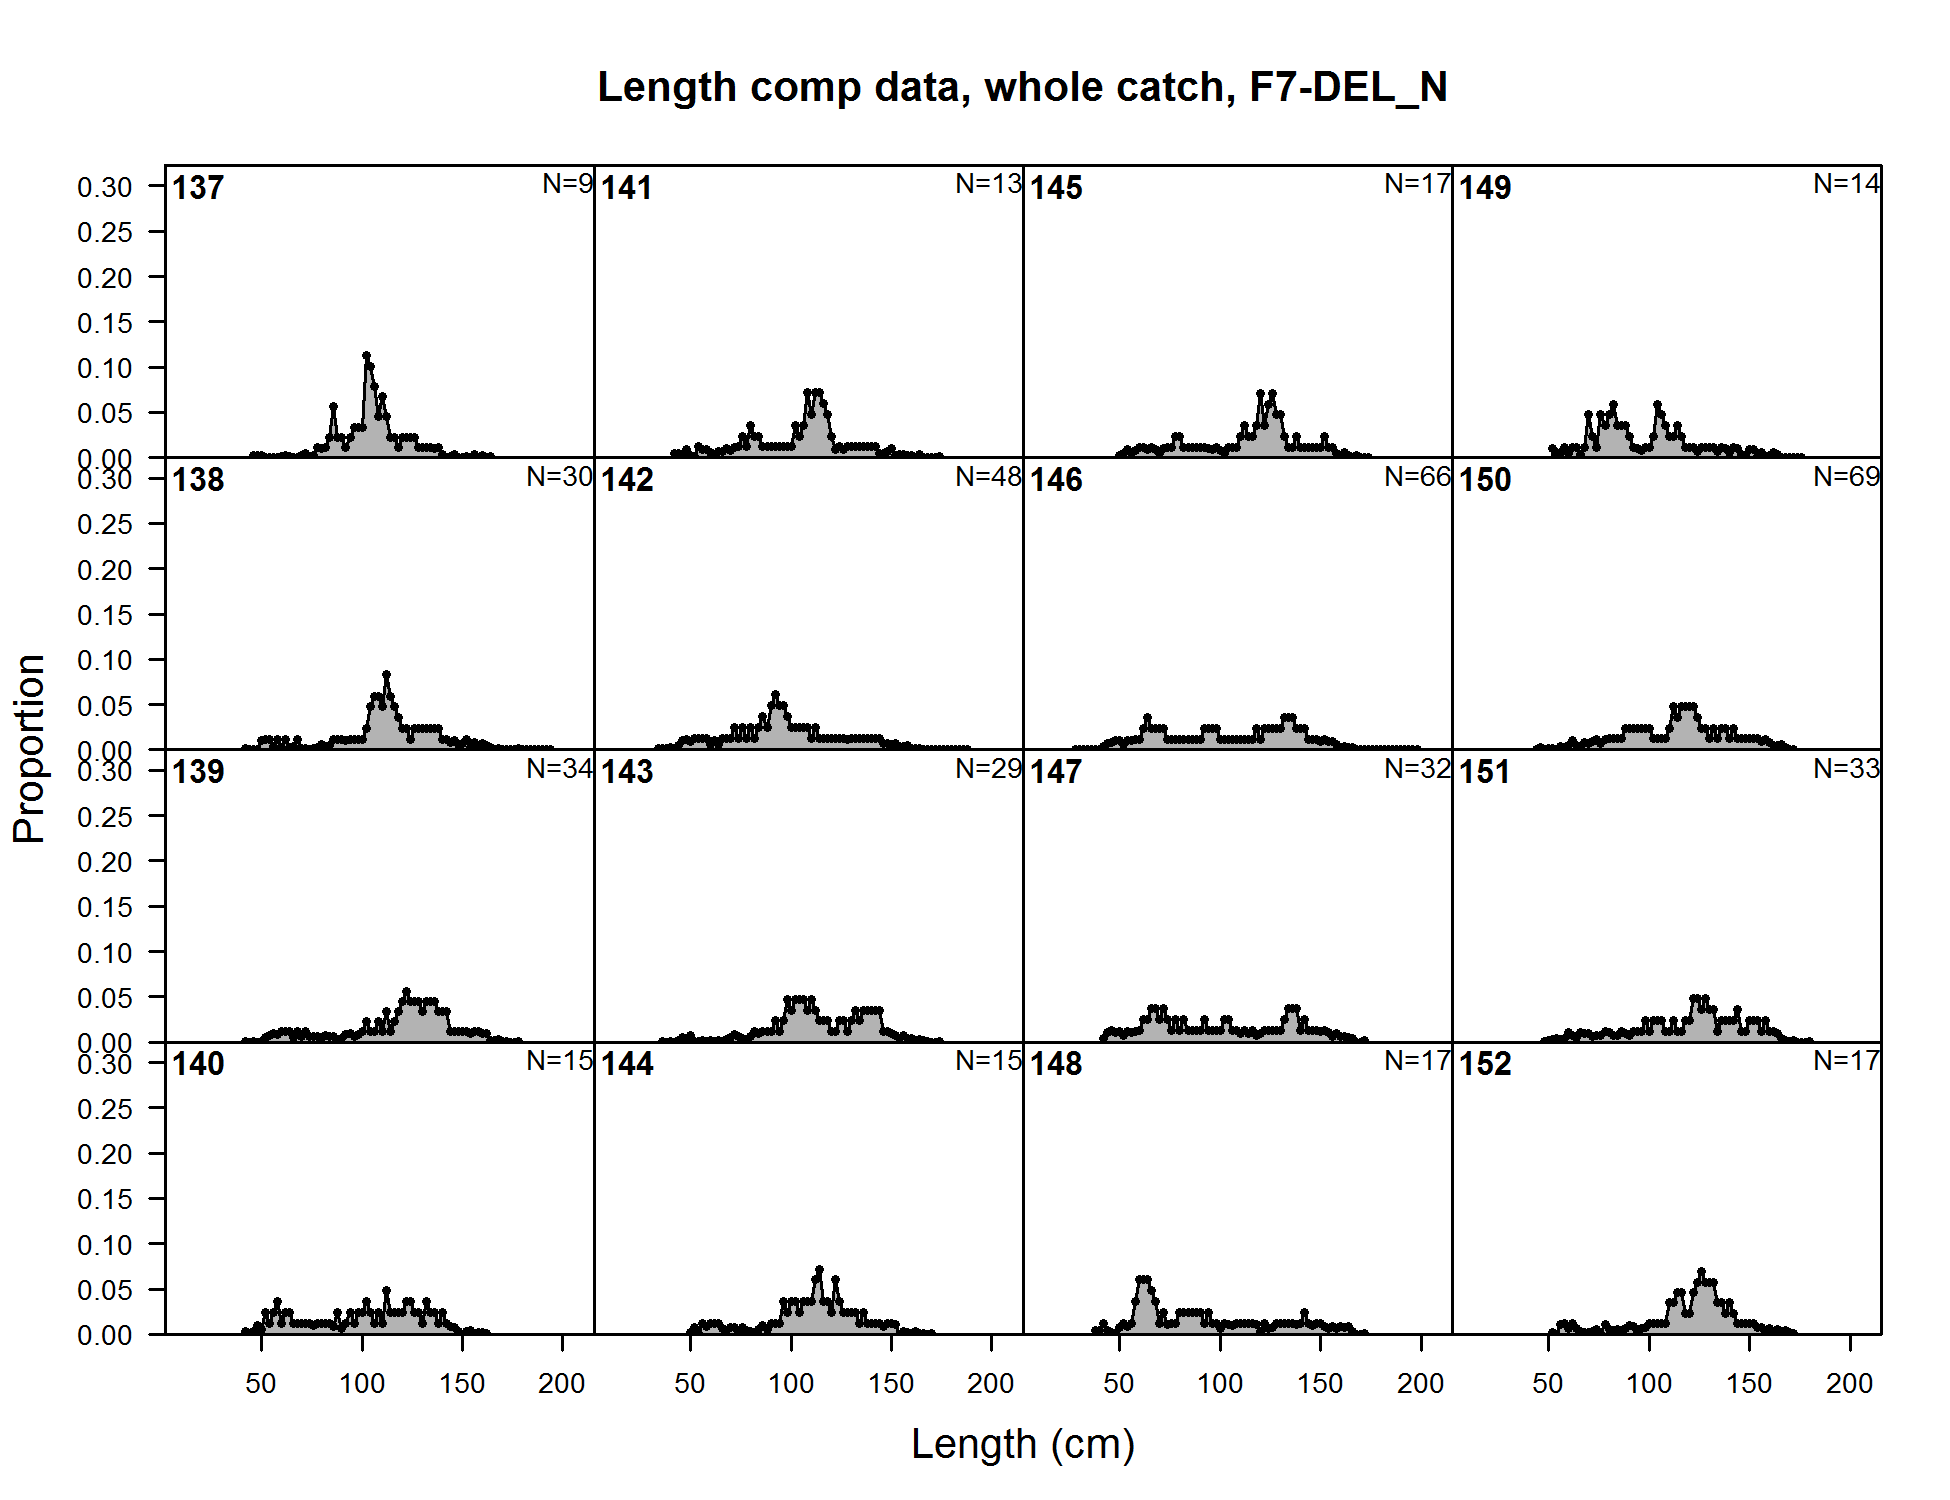
Length comp data, whole catch, F7-DEL_N (plot 1 of 11) (plot 2 of 11) (plot 3 of 11) (plot 4 of 11)
file: comp_lendat_flt7mkt0_page4.png
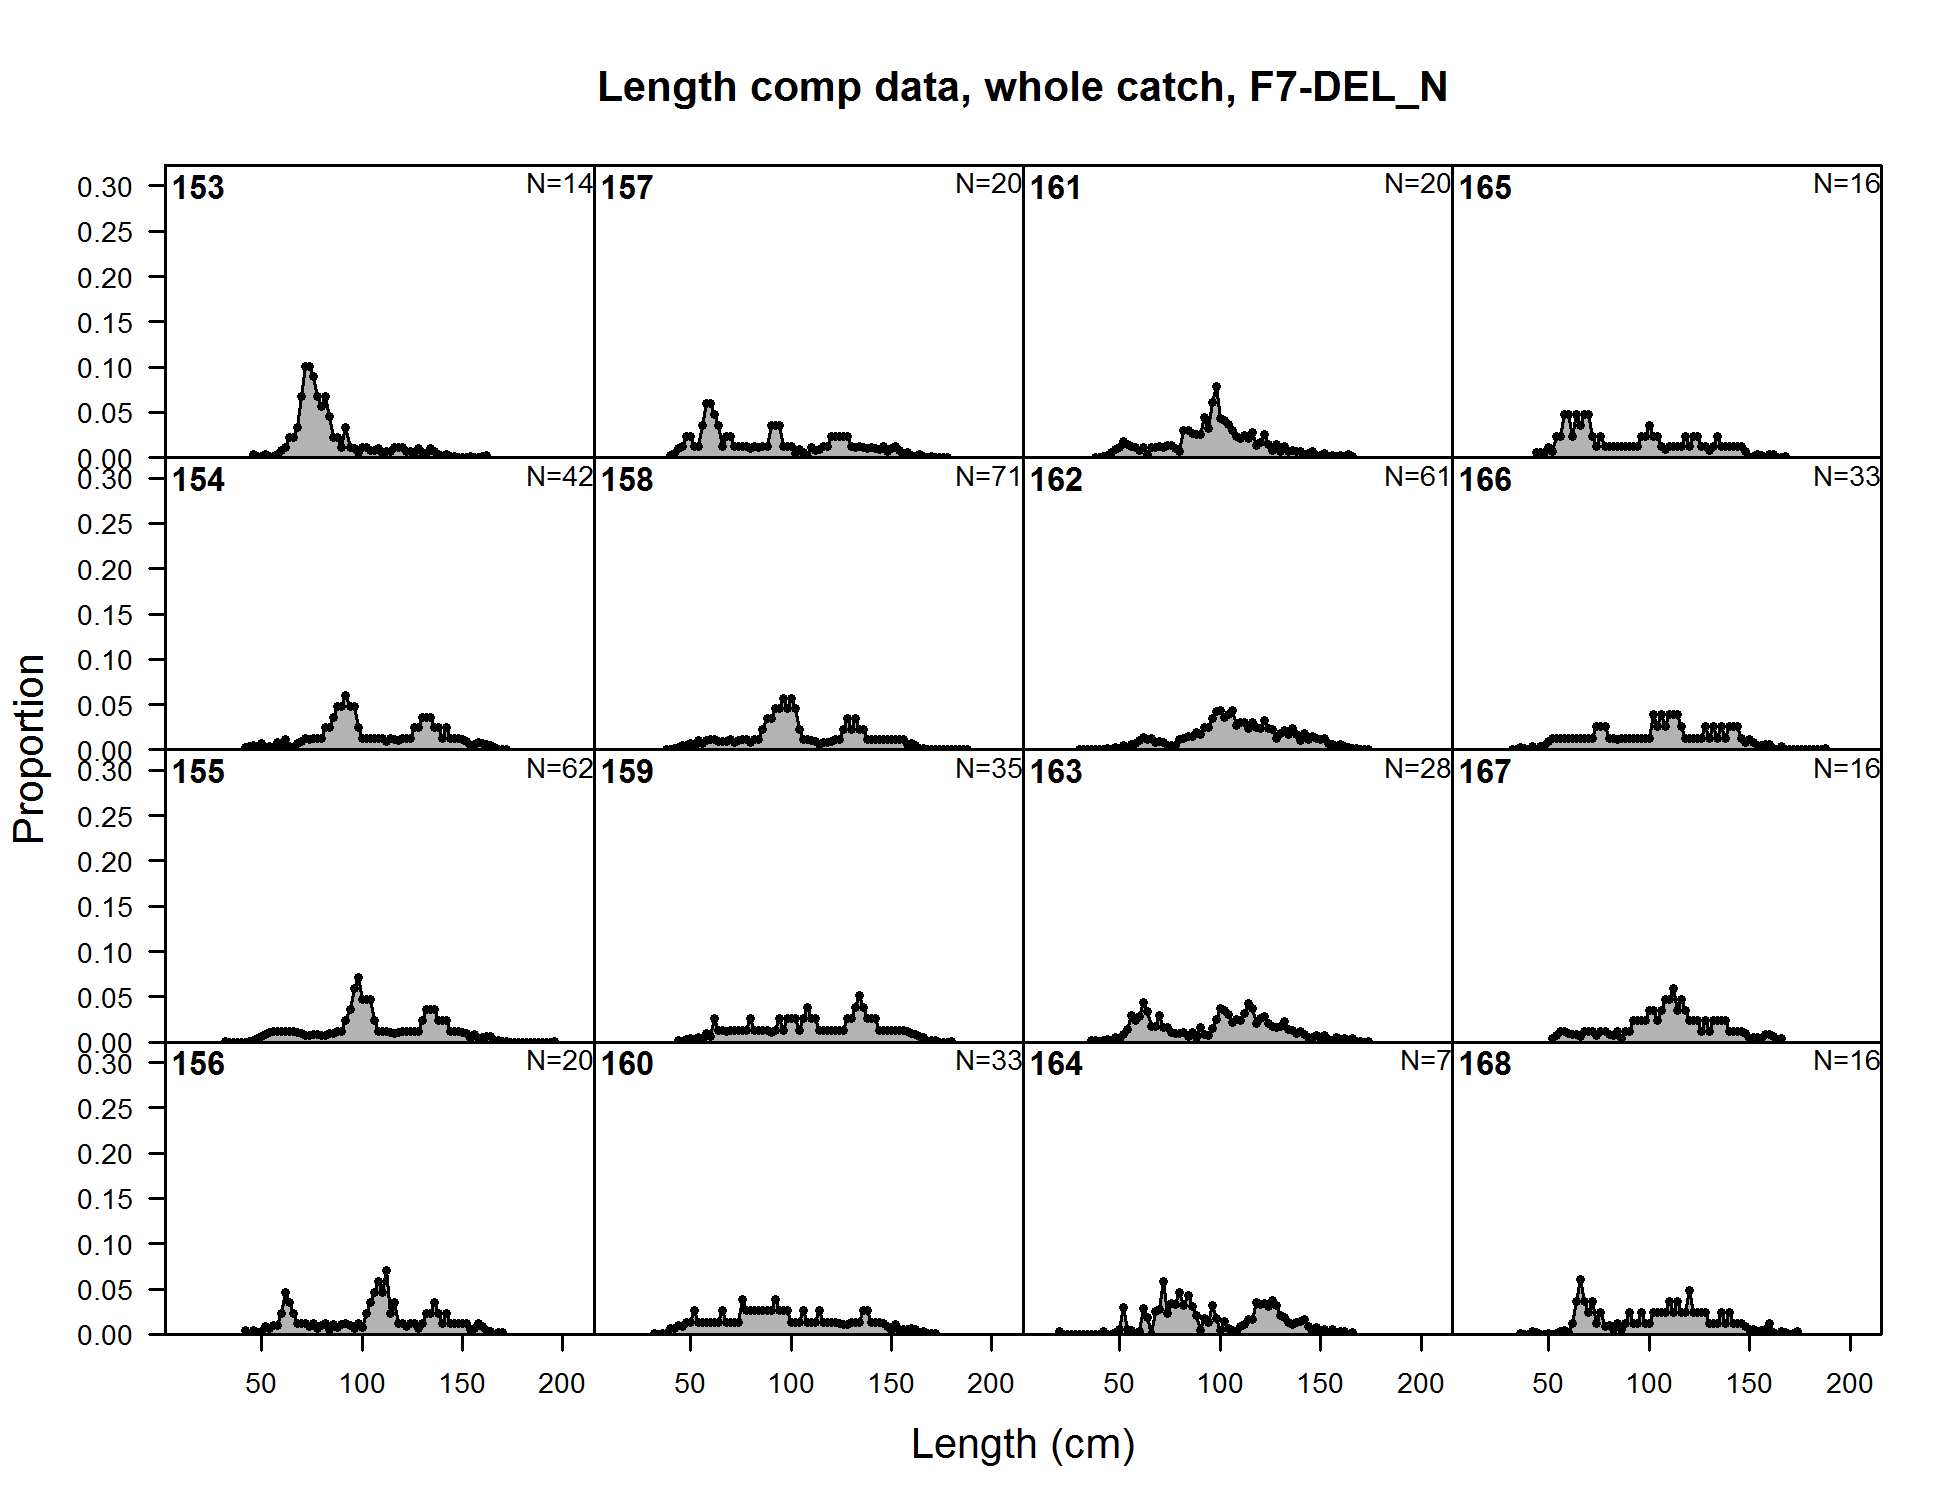
Length comp data, whole catch, F7-DEL_N (plot 1 of 11) (plot 2 of 11) (plot 3 of 11) (plot 4 of 11) (plot 5 of 11)
file: comp_lendat_flt7mkt0_page5.png
Length comp data, whole catch, F7-DEL_N (plot 1 of 11) (plot 2 of 11) (plot 3 of 11) (plot 4 of 11) (plot 5 of 11) (plot 6 of 11)
file: comp_lendat_flt7mkt0_page6.png
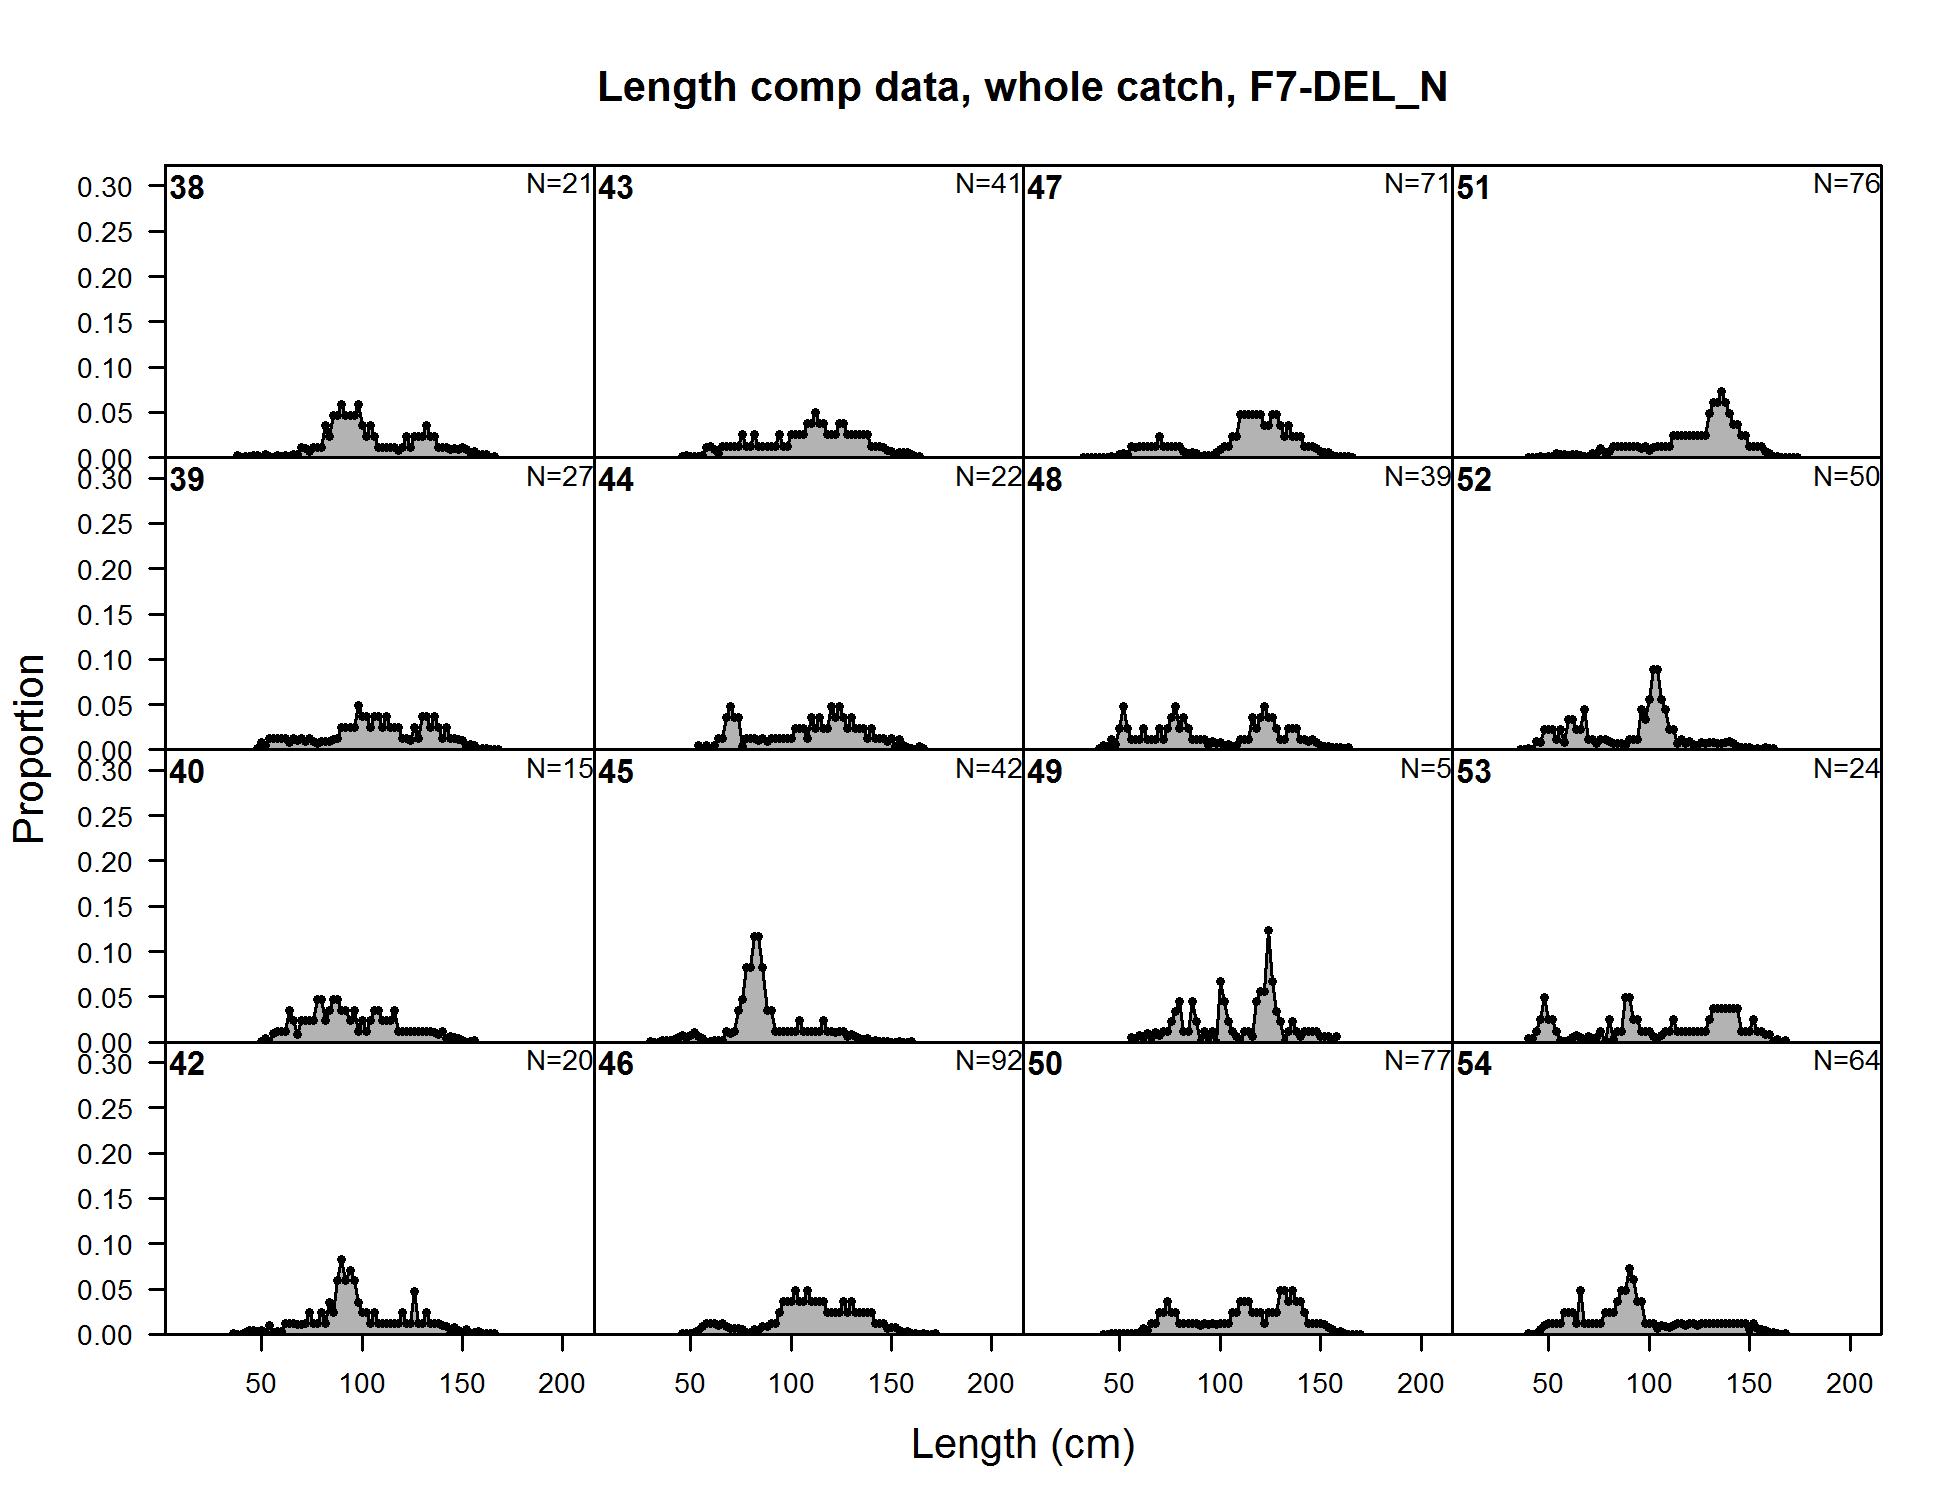
Length comp data, whole catch, F7-DEL_N (plot 1 of 11) (plot 2 of 11) (plot 3 of 11) (plot 4 of 11) (plot 5 of 11) (plot 6 of 11) (plot 7 of 11)
file: comp_lendat_flt7mkt0_page7.png
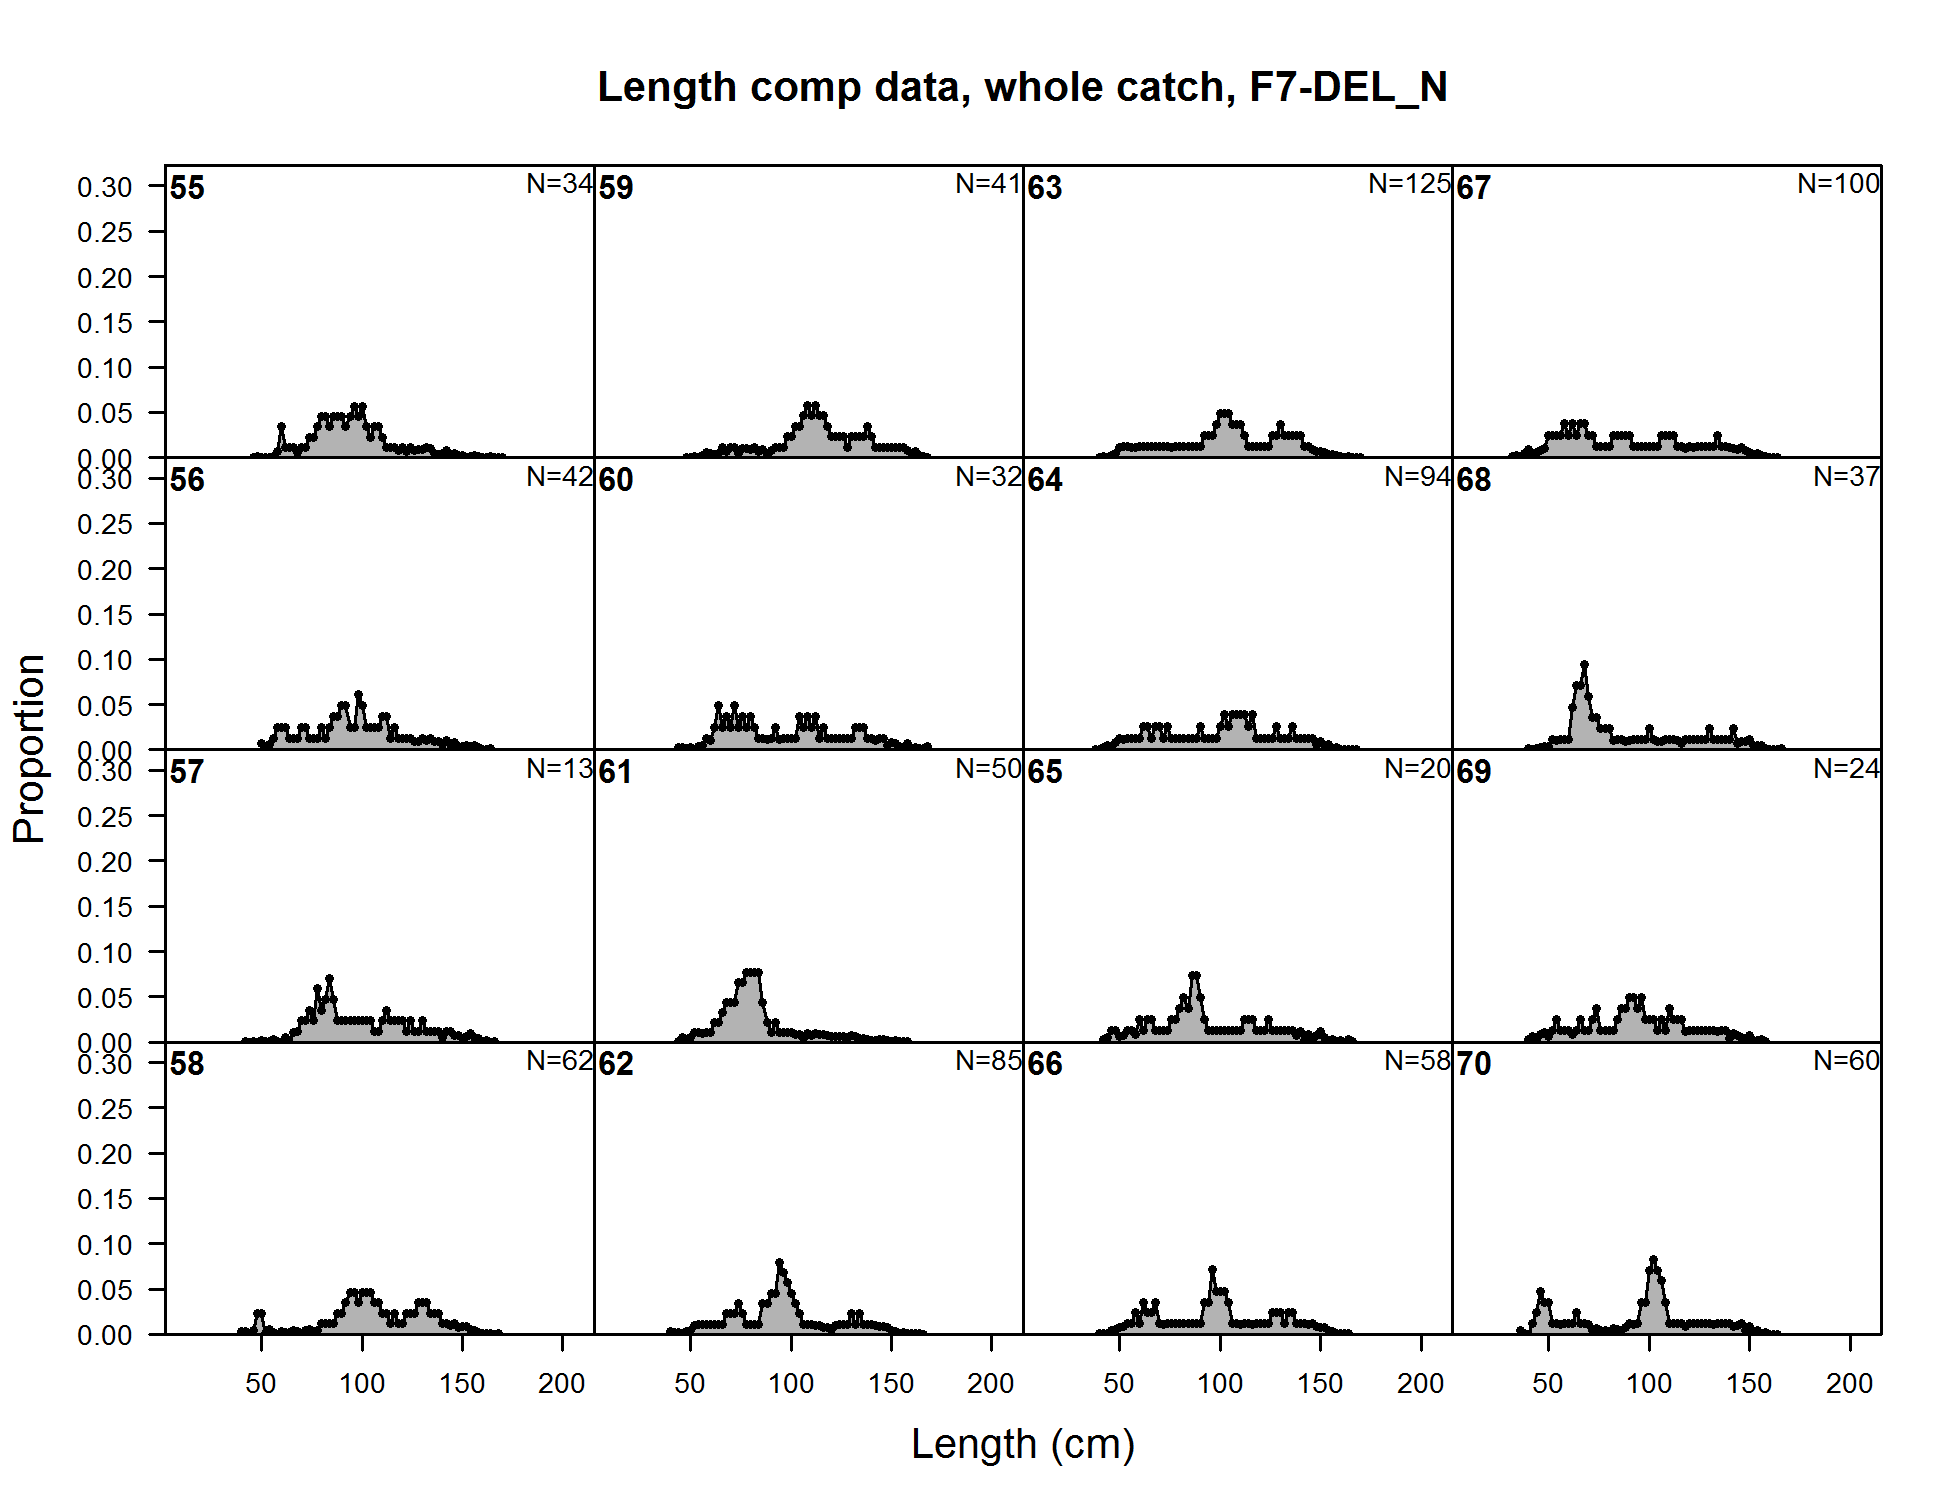
Length comp data, whole catch, F7-DEL_N (plot 1 of 11) (plot 2 of 11) (plot 3 of 11) (plot 4 of 11) (plot 5 of 11) (plot 6 of 11) (plot 7 of 11) (plot 8 of 11)
file: comp_lendat_flt7mkt0_page8.png
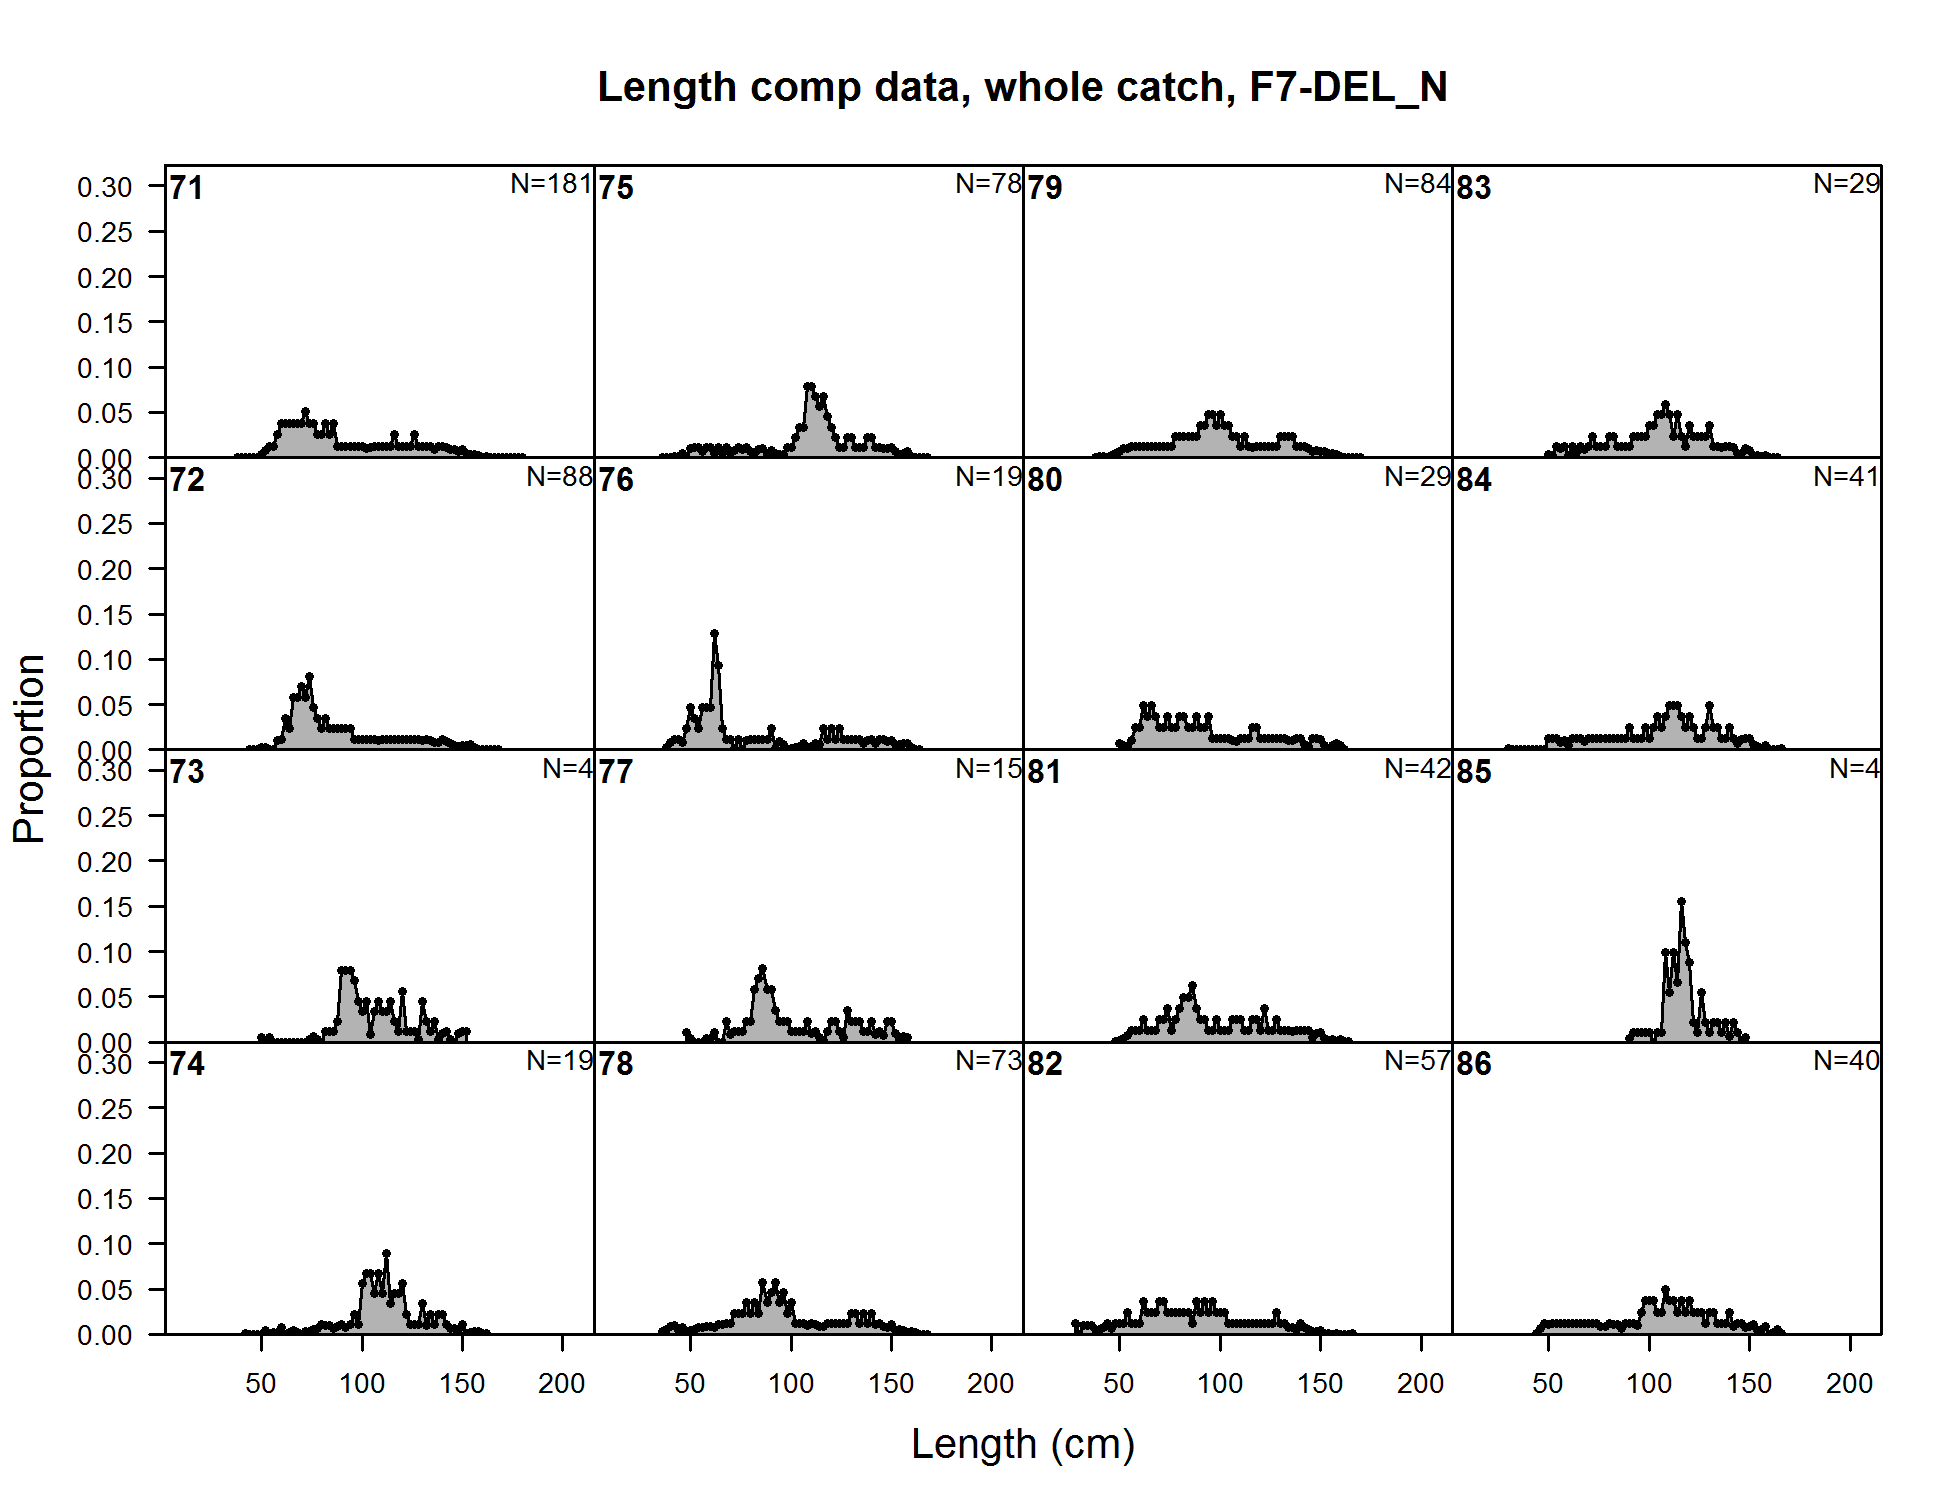
Length comp data, whole catch, F7-DEL_N (plot 1 of 11) (plot 2 of 11) (plot 3 of 11) (plot 4 of 11) (plot 5 of 11) (plot 6 of 11) (plot 7 of 11) (plot 8 of 11) (plot 9 of 11)
file: comp_lendat_flt7mkt0_page9.png
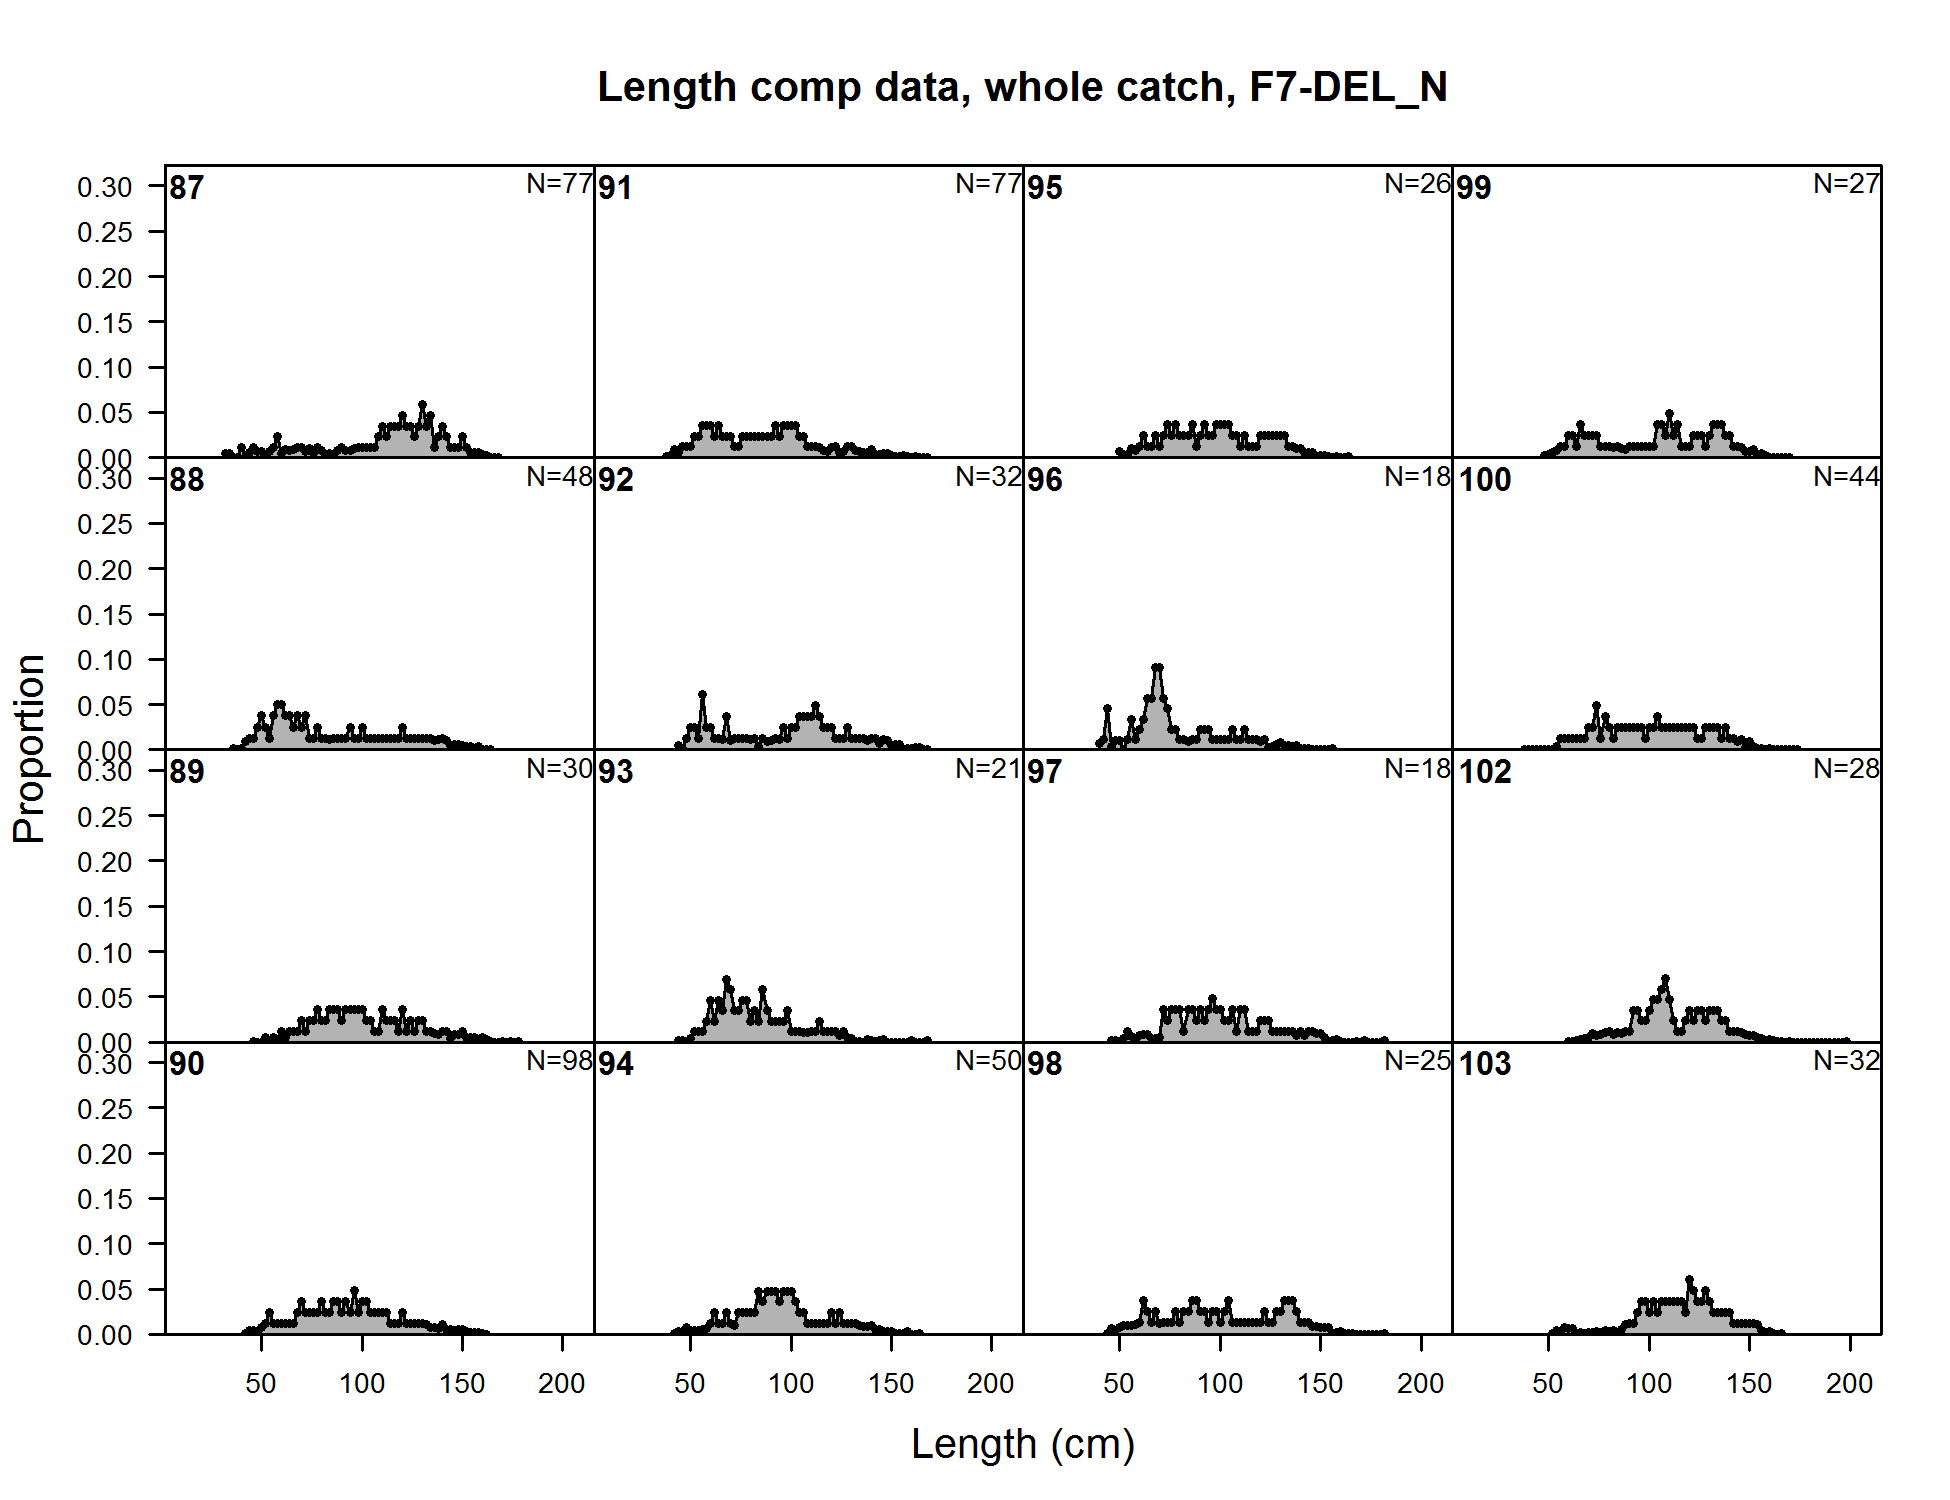
Length comp data, whole catch, F7-DEL_N (plot 1 of 11) (plot 2 of 11) (plot 3 of 11) (plot 4 of 11) (plot 5 of 11) (plot 6 of 11) (plot 7 of 11) (plot 8 of 11) (plot 9 of 11) (plot 10 of 11)
file: comp_lendat_flt7mkt0_page10.png
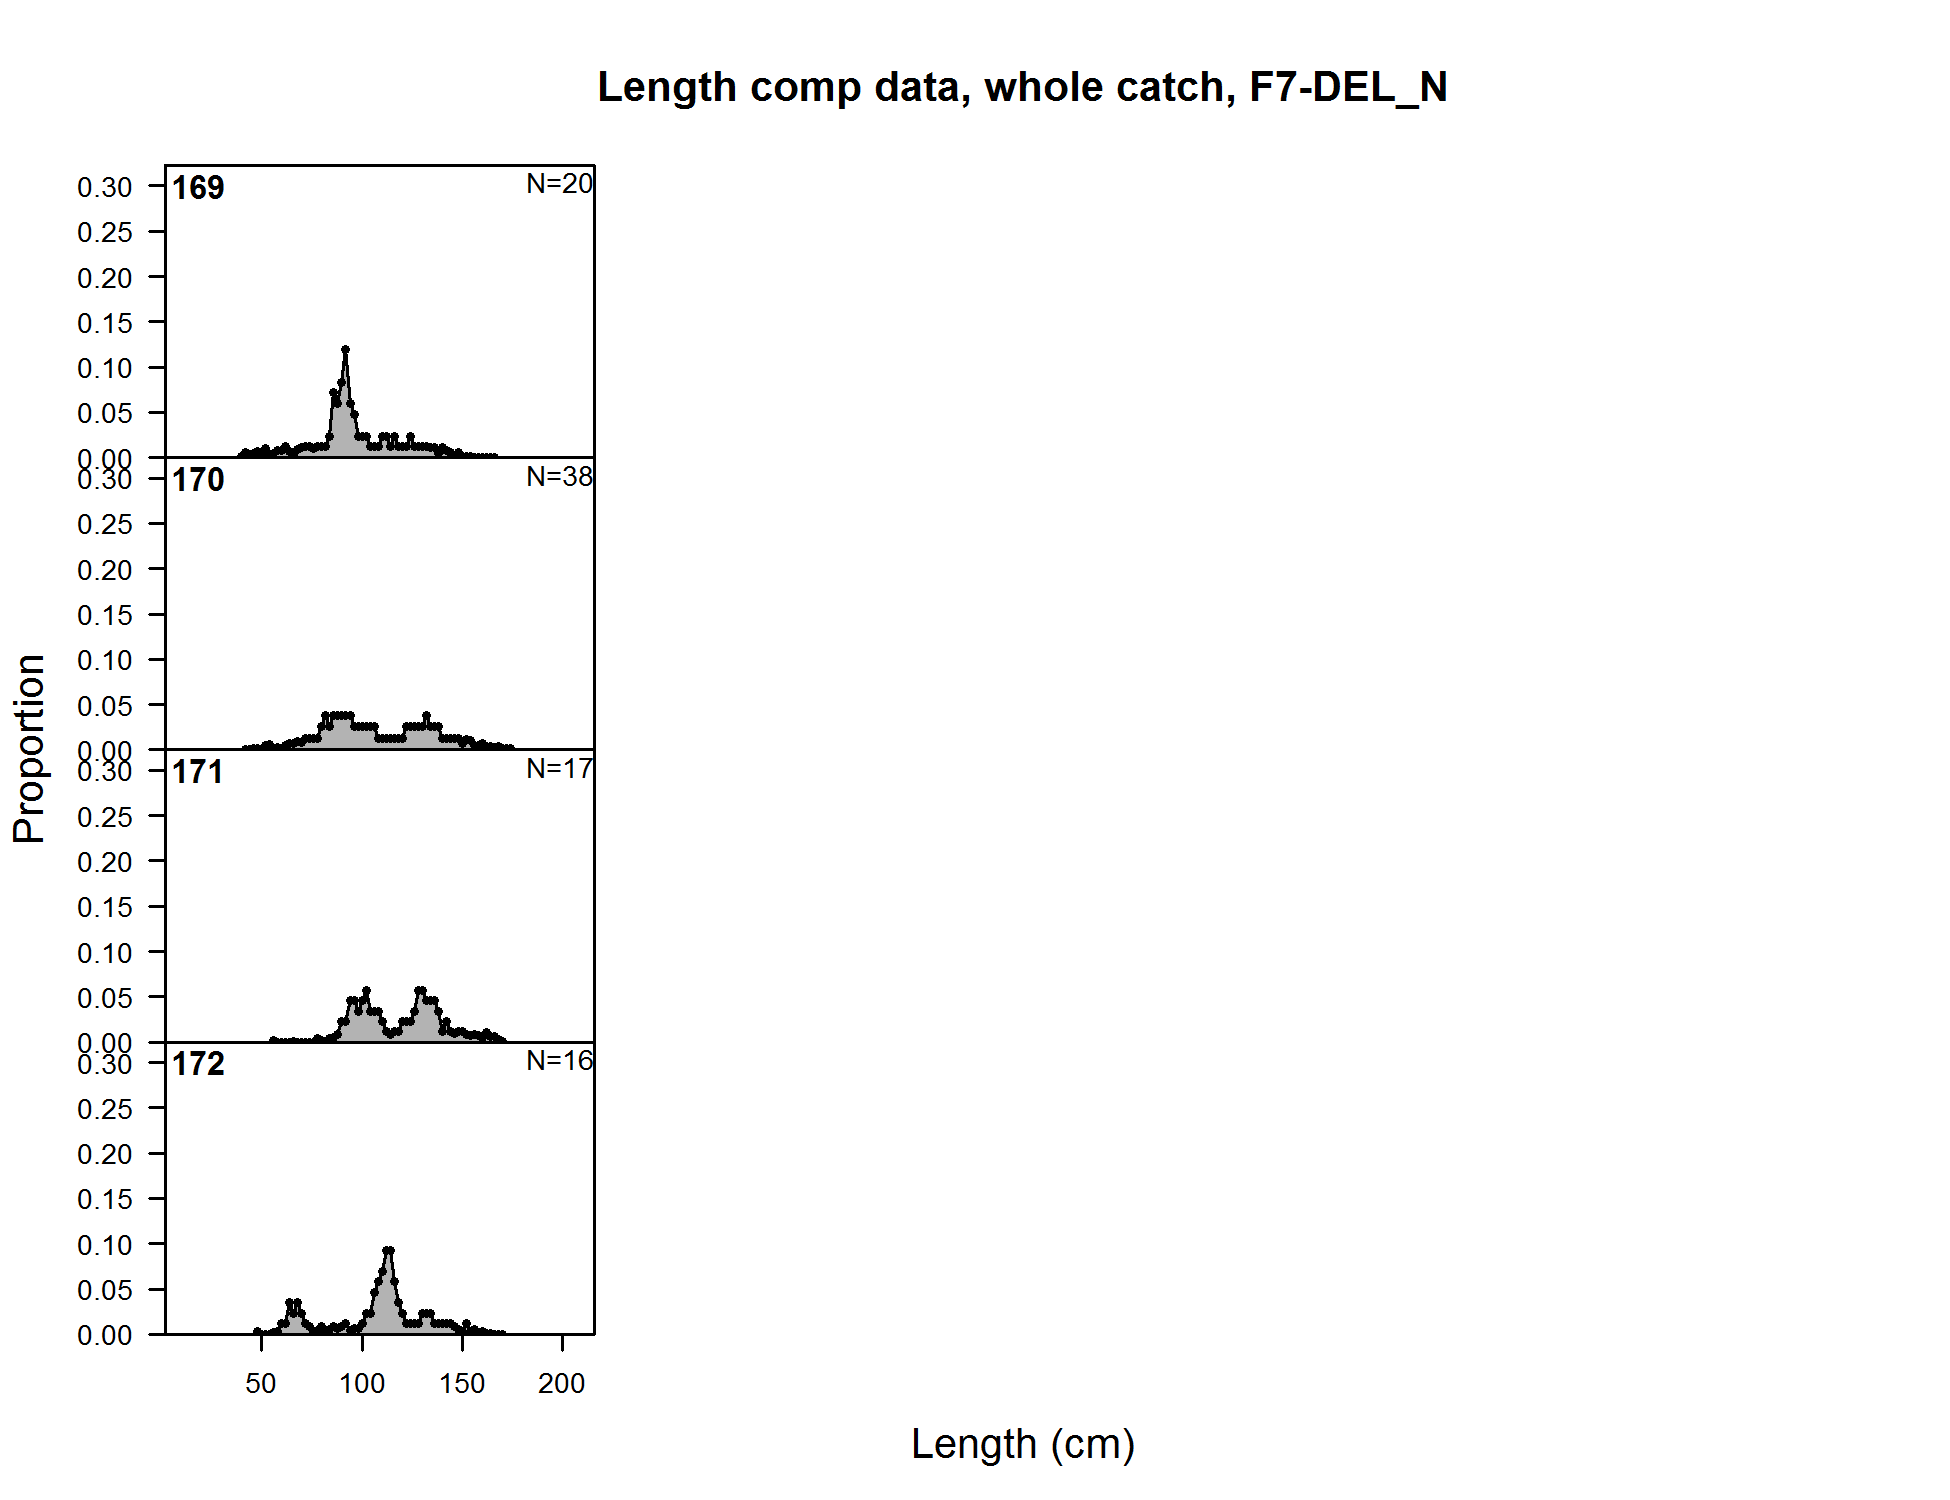
Length comp data, whole catch, F7-DEL_N (plot 1 of 11) (plot 2 of 11) (plot 3 of 11) (plot 4 of 11) (plot 5 of 11) (plot 6 of 11) (plot 7 of 11) (plot 8 of 11) (plot 9 of 11) (plot 10 of 11) (plot 11 of 11)
file: comp_lendat_flt7mkt0_page11.png
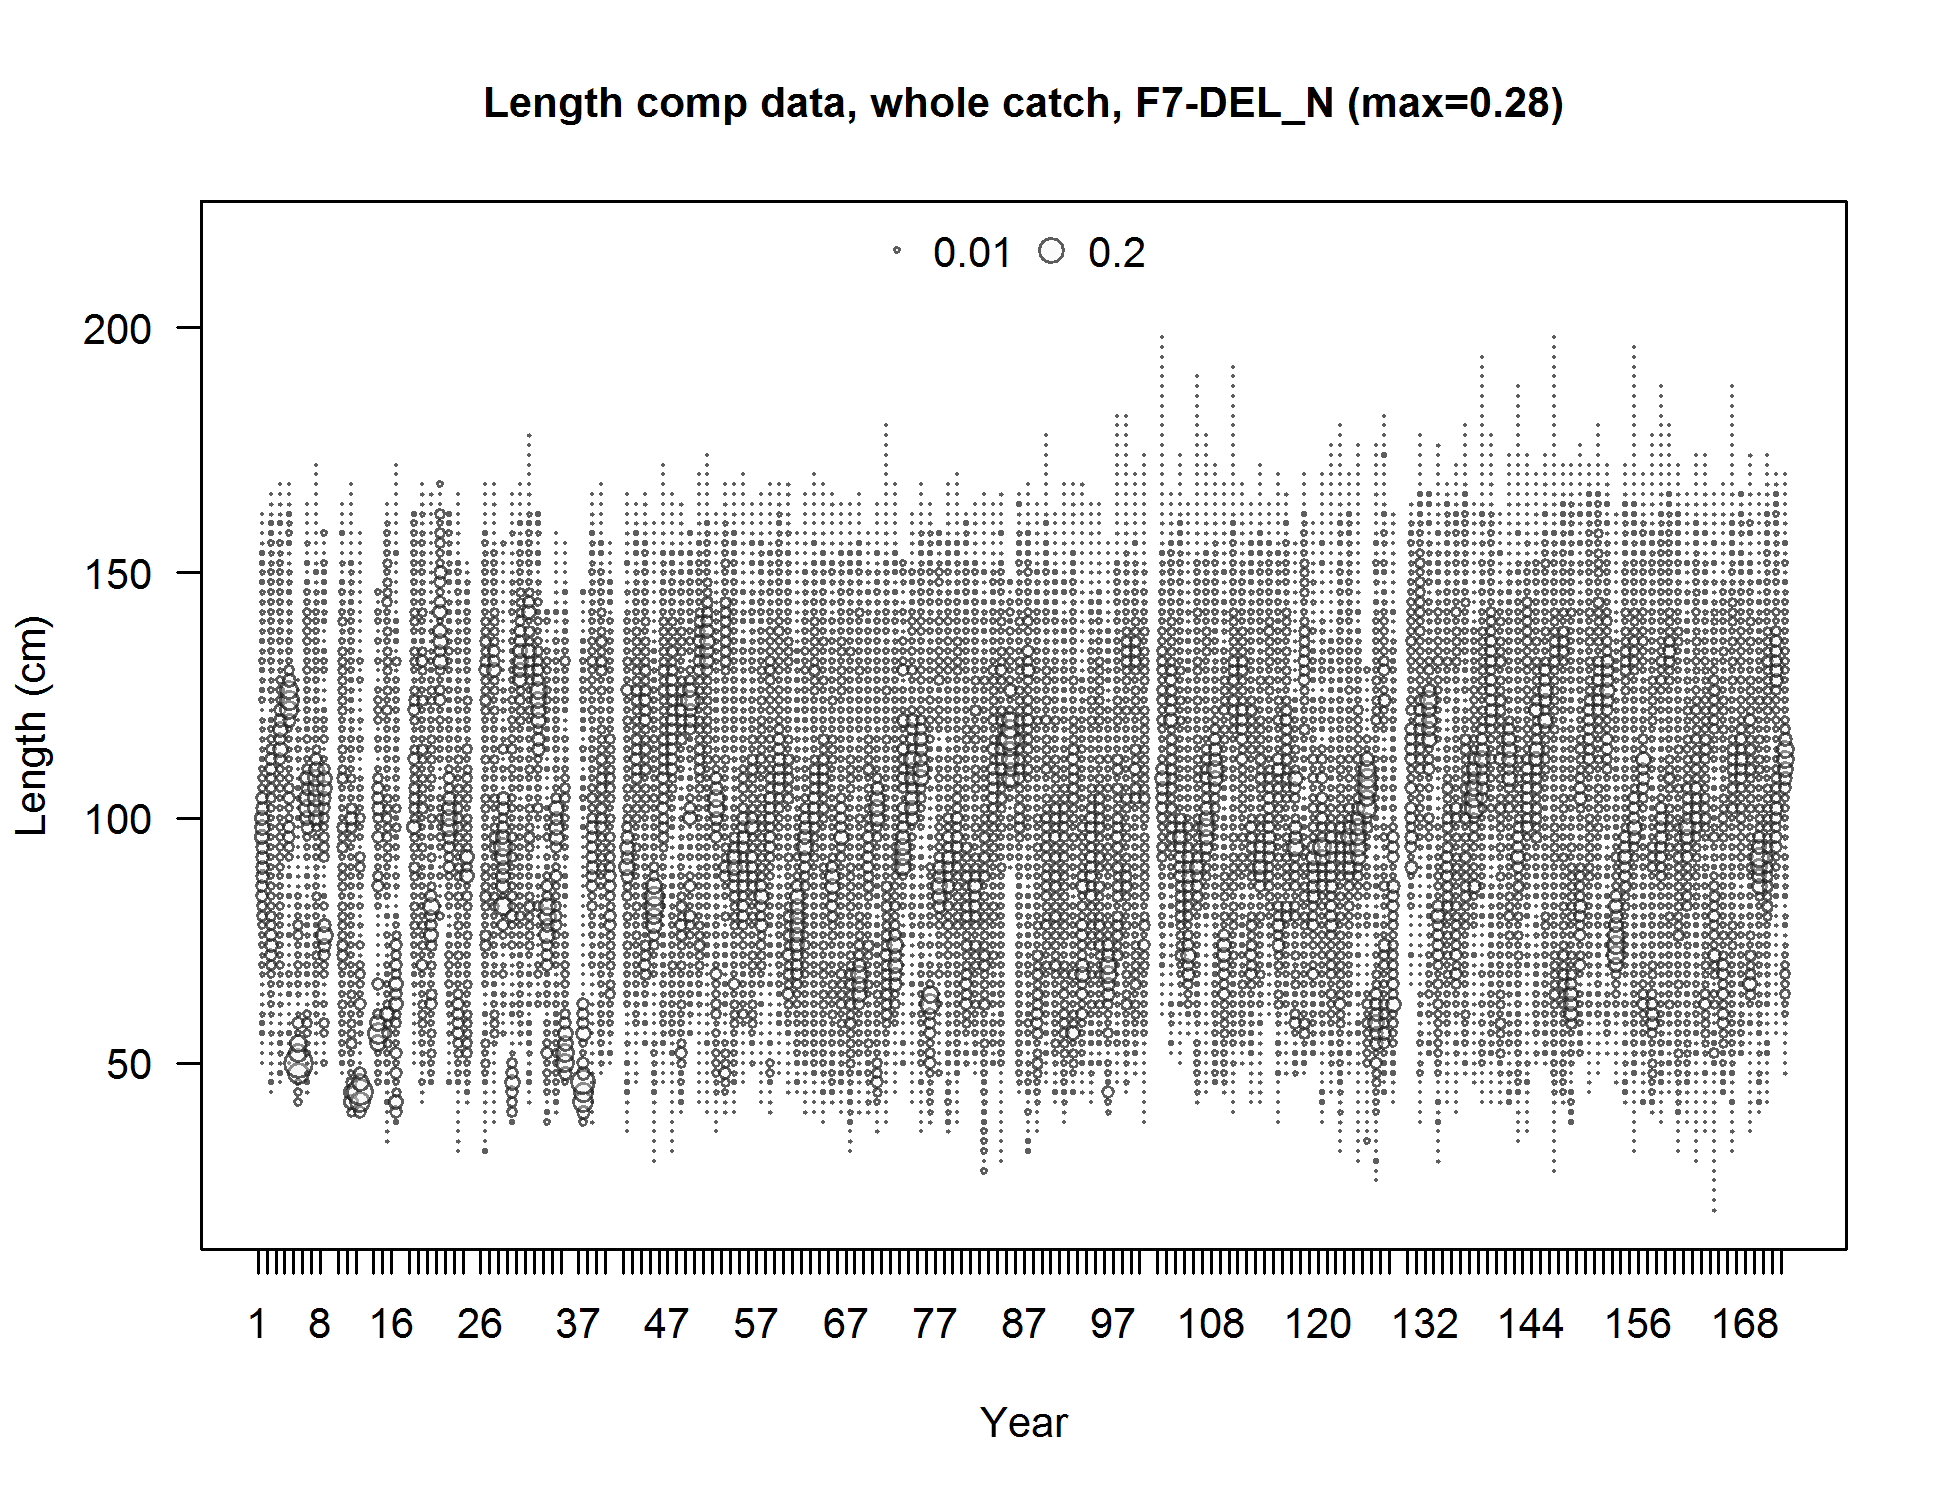
Length comp data, whole catch, F7-DEL_N (max=0.28) (plot 11 of 11)
file: comp_lendat_bubflt7mkt0_page11.png
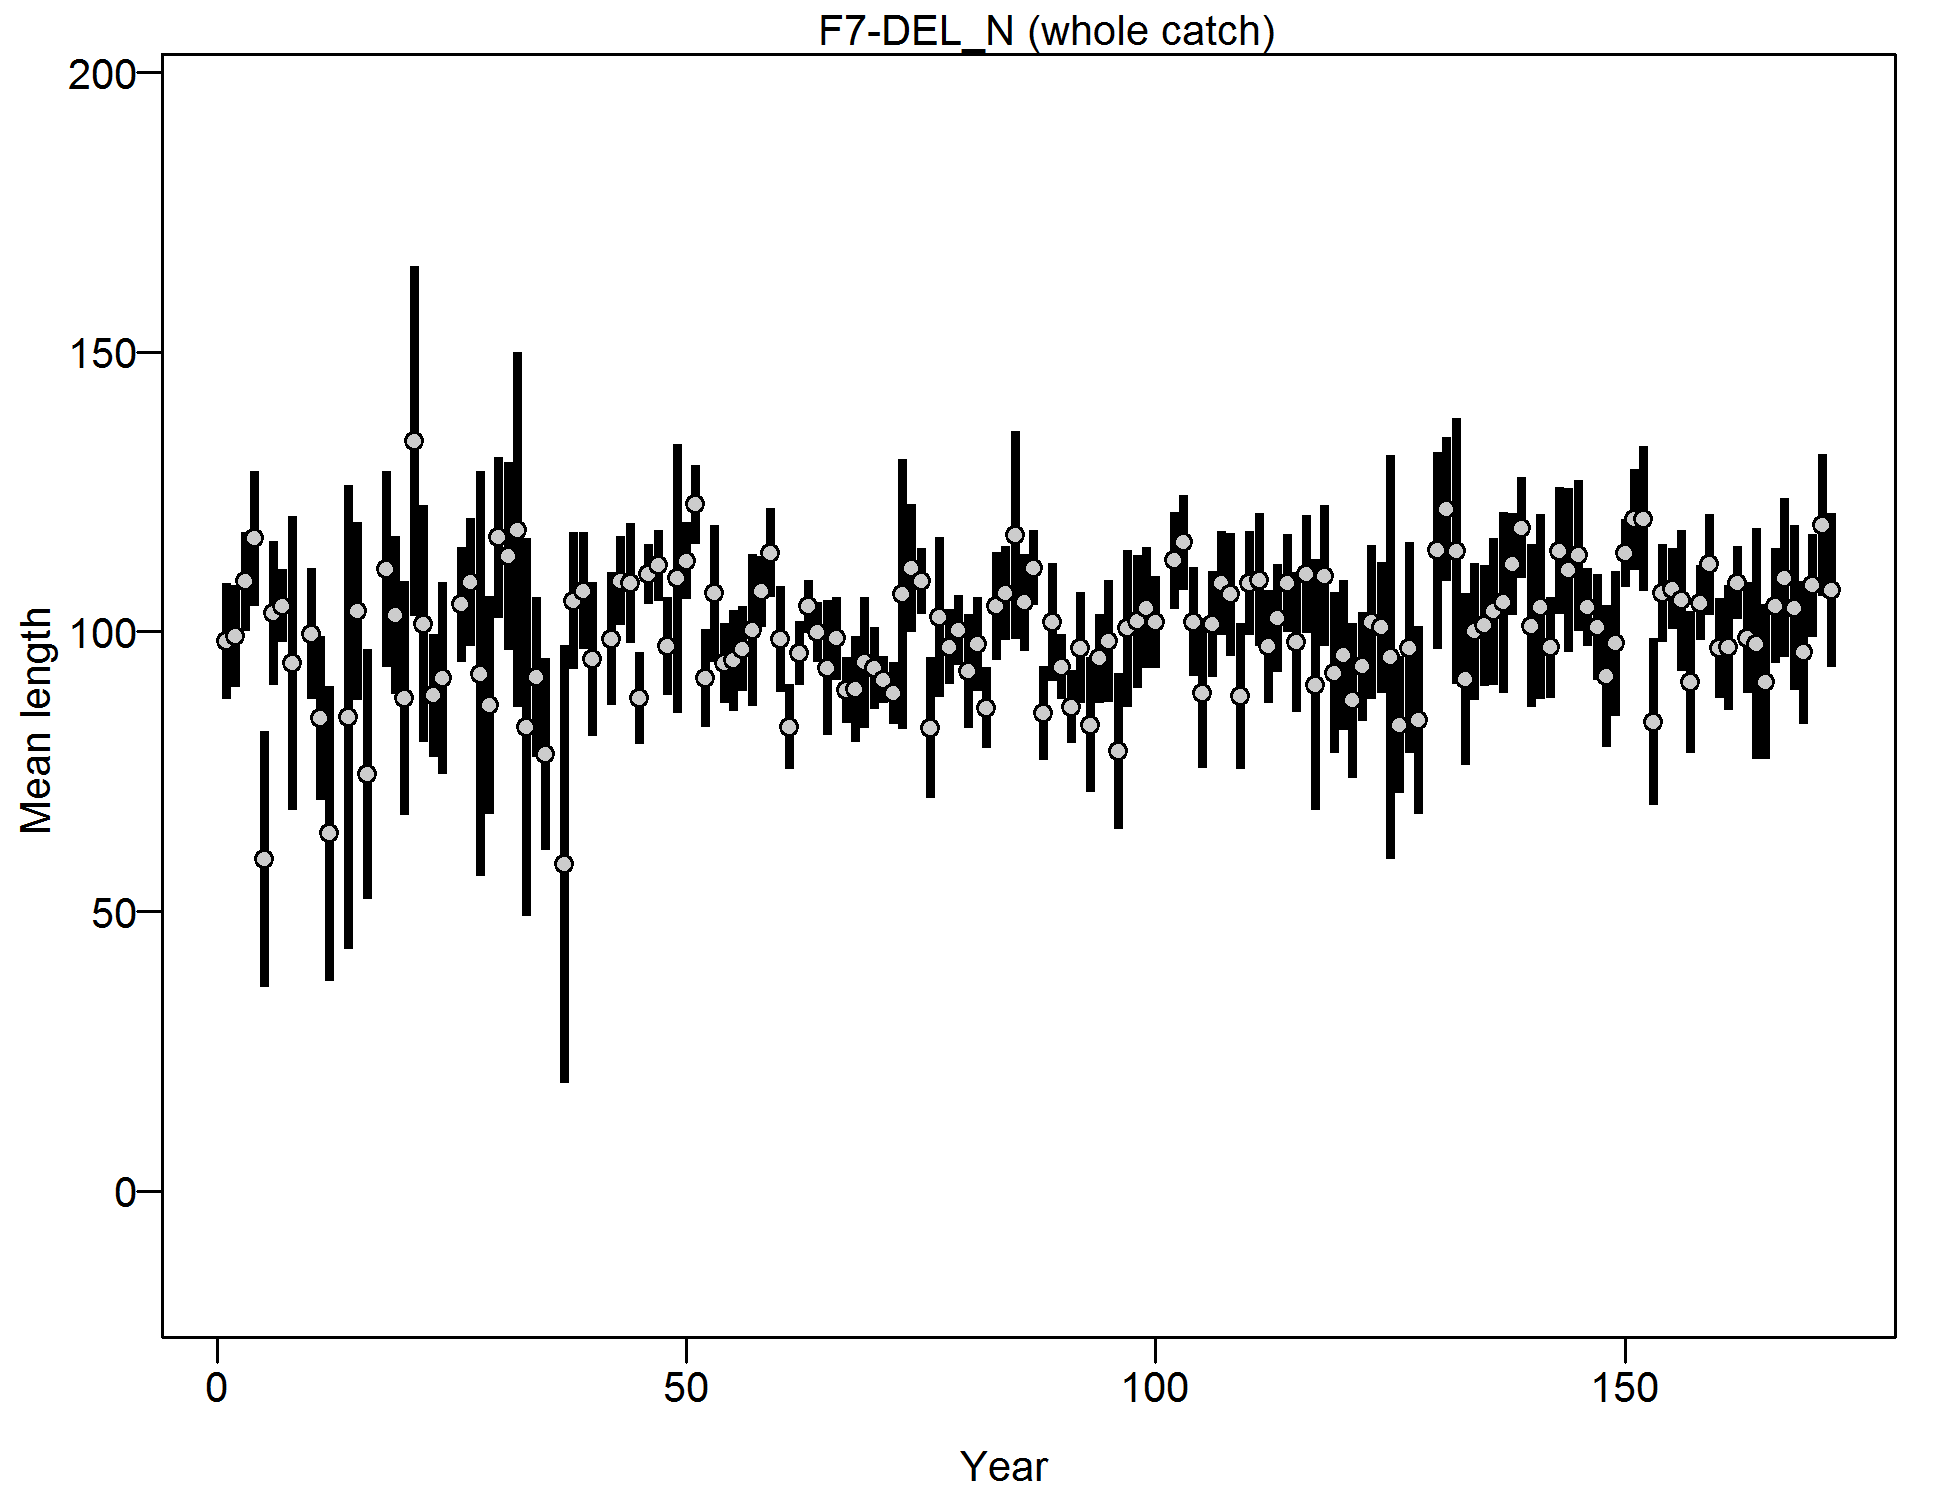
Mean length for F7-DEL_N with 95% confidence intervals based on current samples sizes.
file: comp_lendat_data_weighting_TA1.8_F7-DEL_N.png
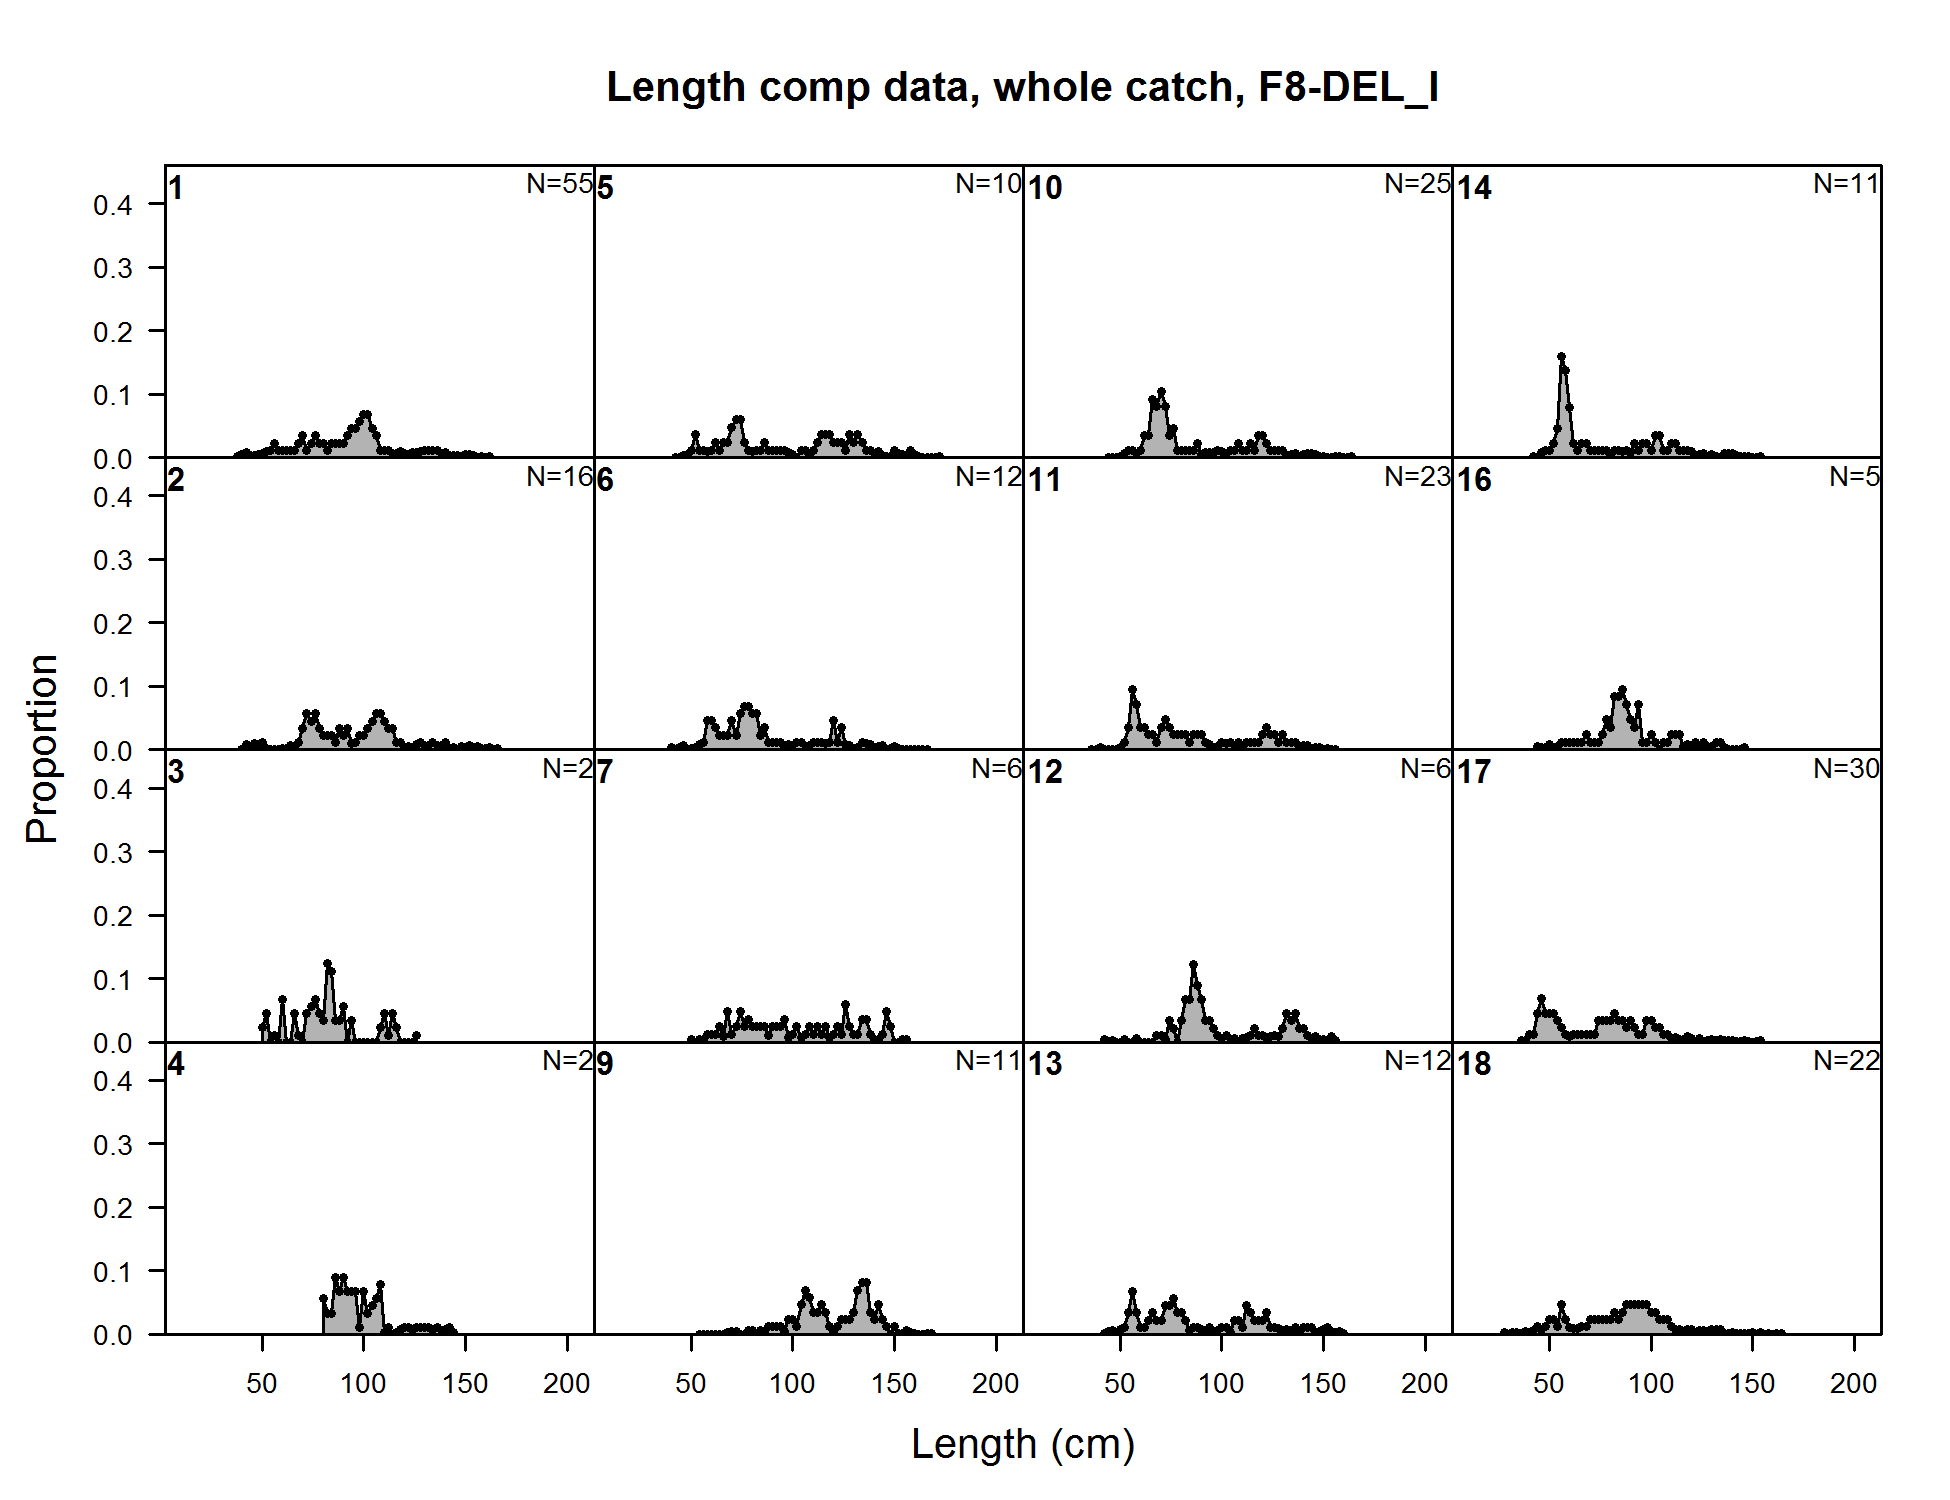
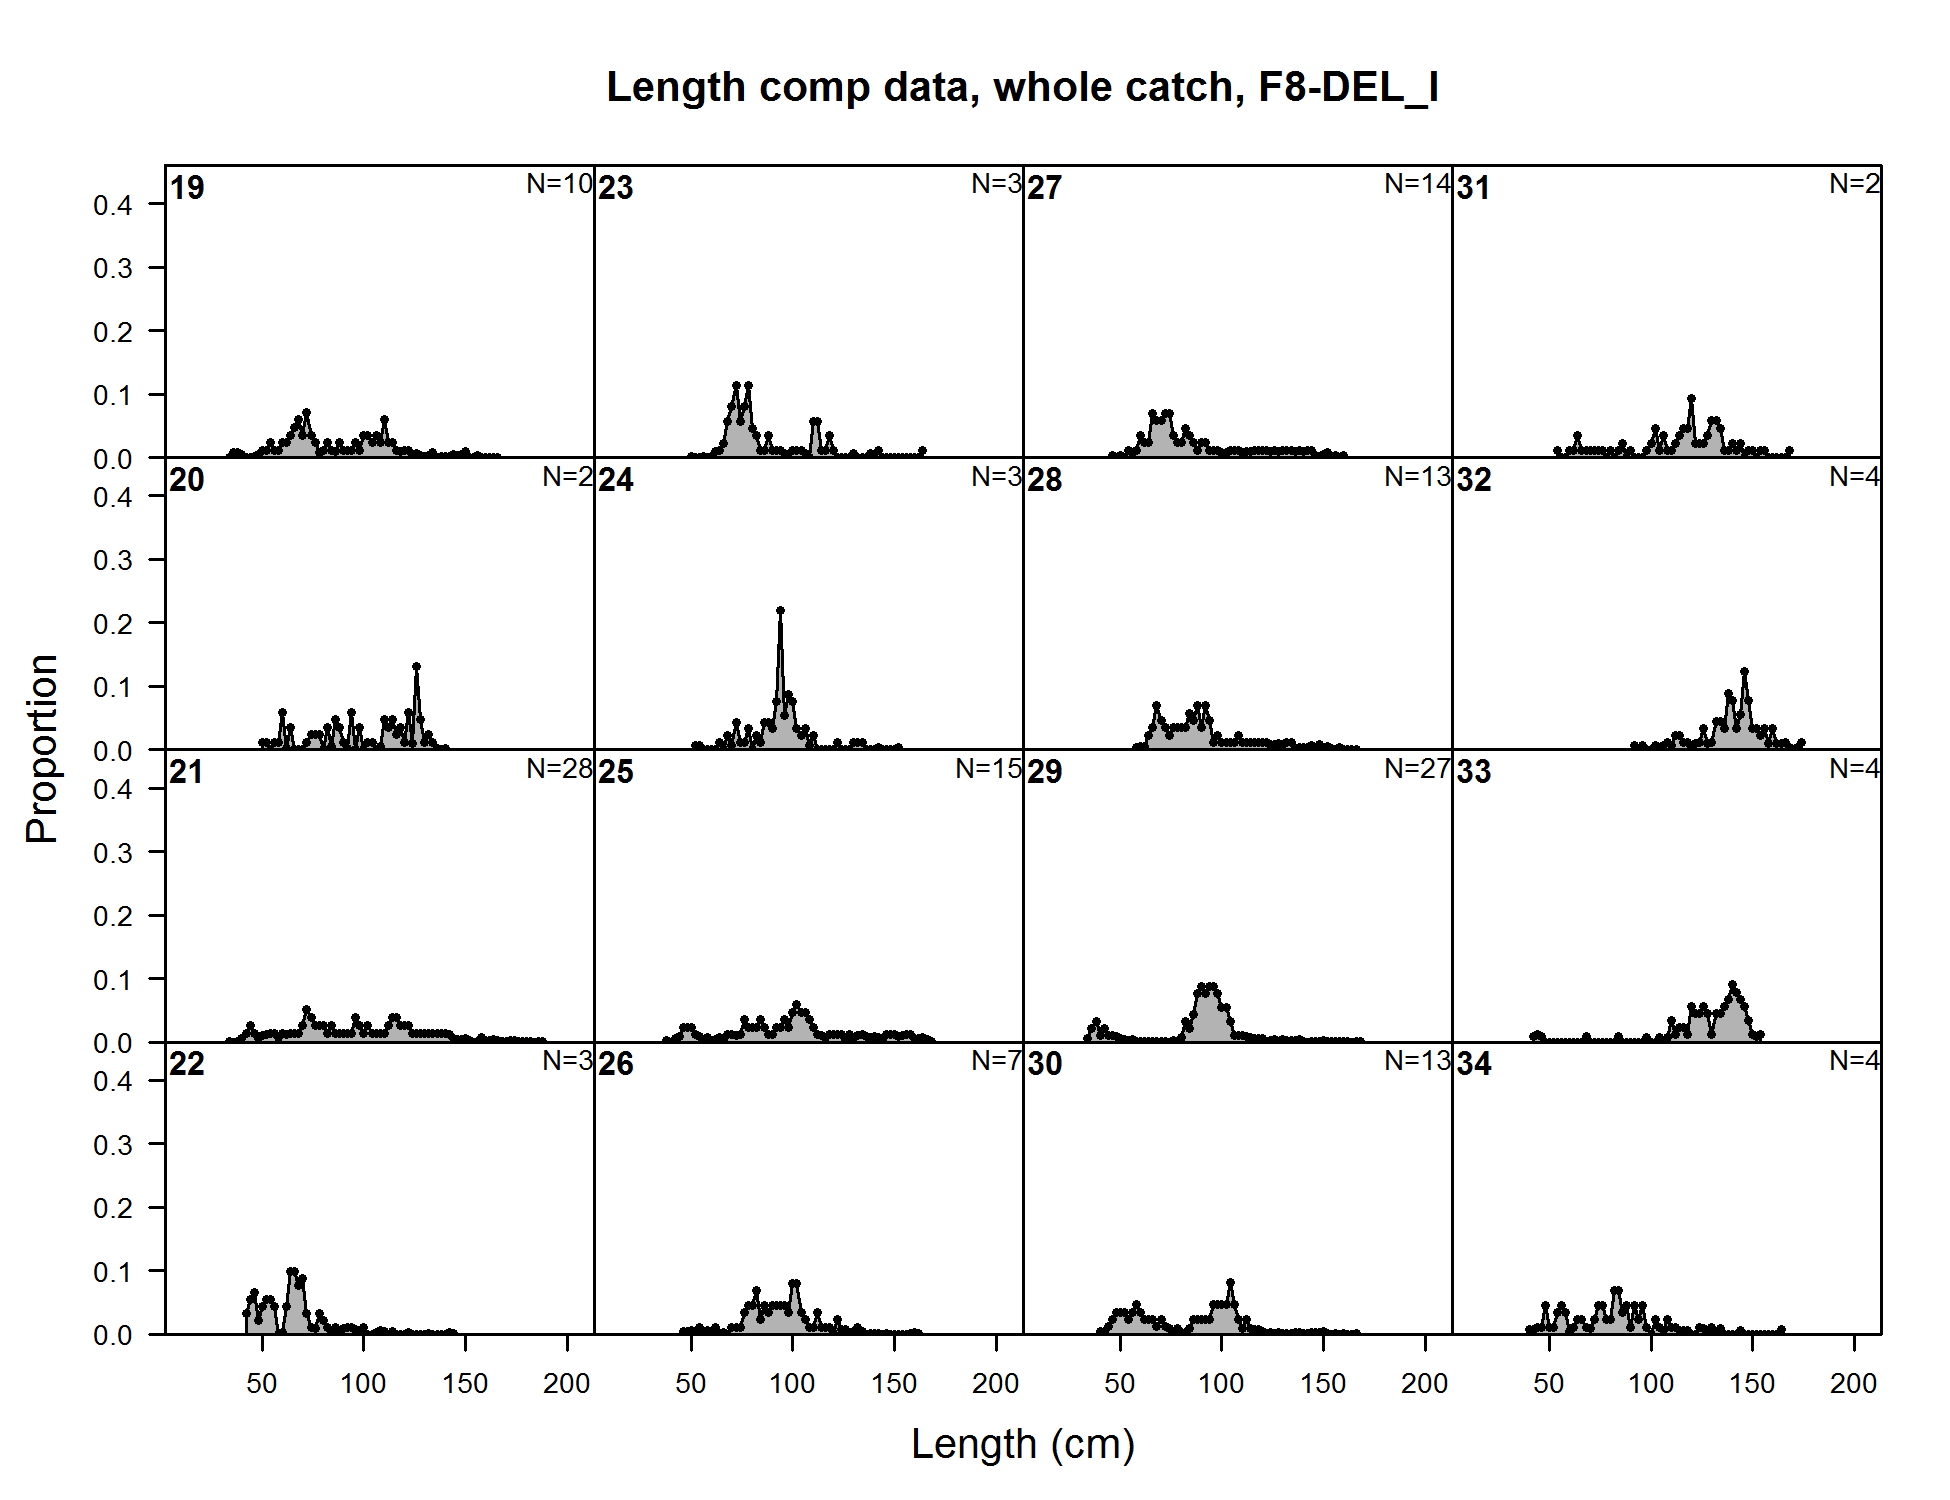
Length comp data, whole catch, F8-DEL_I (plot 1 of 11)
file: comp_lendat_flt8mkt0_page1.png
Length comp data, whole catch, F8-DEL_I (plot 1 of 11) (plot 2 of 11)
file: comp_lendat_flt8mkt0_page2.png
Length comp data, whole catch, F8-DEL_I (plot 1 of 11) (plot 2 of 11) (plot 3 of 11)
file: comp_lendat_flt8mkt0_page3.png
Length comp data, whole catch, F8-DEL_I (plot 1 of 11) (plot 2 of 11) (plot 3 of 11) (plot 4 of 11)
file: comp_lendat_flt8mkt0_page4.png

Length comp data, whole catch, F8-DEL_I (plot 1 of 11) (plot 2 of 11) (plot 3 of 11) (plot 4 of 11) (plot 5 of 11)
file: comp_lendat_flt8mkt0_page5.png
Length comp data, whole catch, F8-DEL_I (plot 1 of 11) (plot 2 of 11) (plot 3 of 11) (plot 4 of 11) (plot 5 of 11) (plot 6 of 11)
file: comp_lendat_flt8mkt0_page6.png
Length comp data, whole catch, F8-DEL_I (plot 1 of 11) (plot 2 of 11) (plot 3 of 11) (plot 4 of 11) (plot 5 of 11) (plot 6 of 11) (plot 7 of 11)
file: comp_lendat_flt8mkt0_page7.png
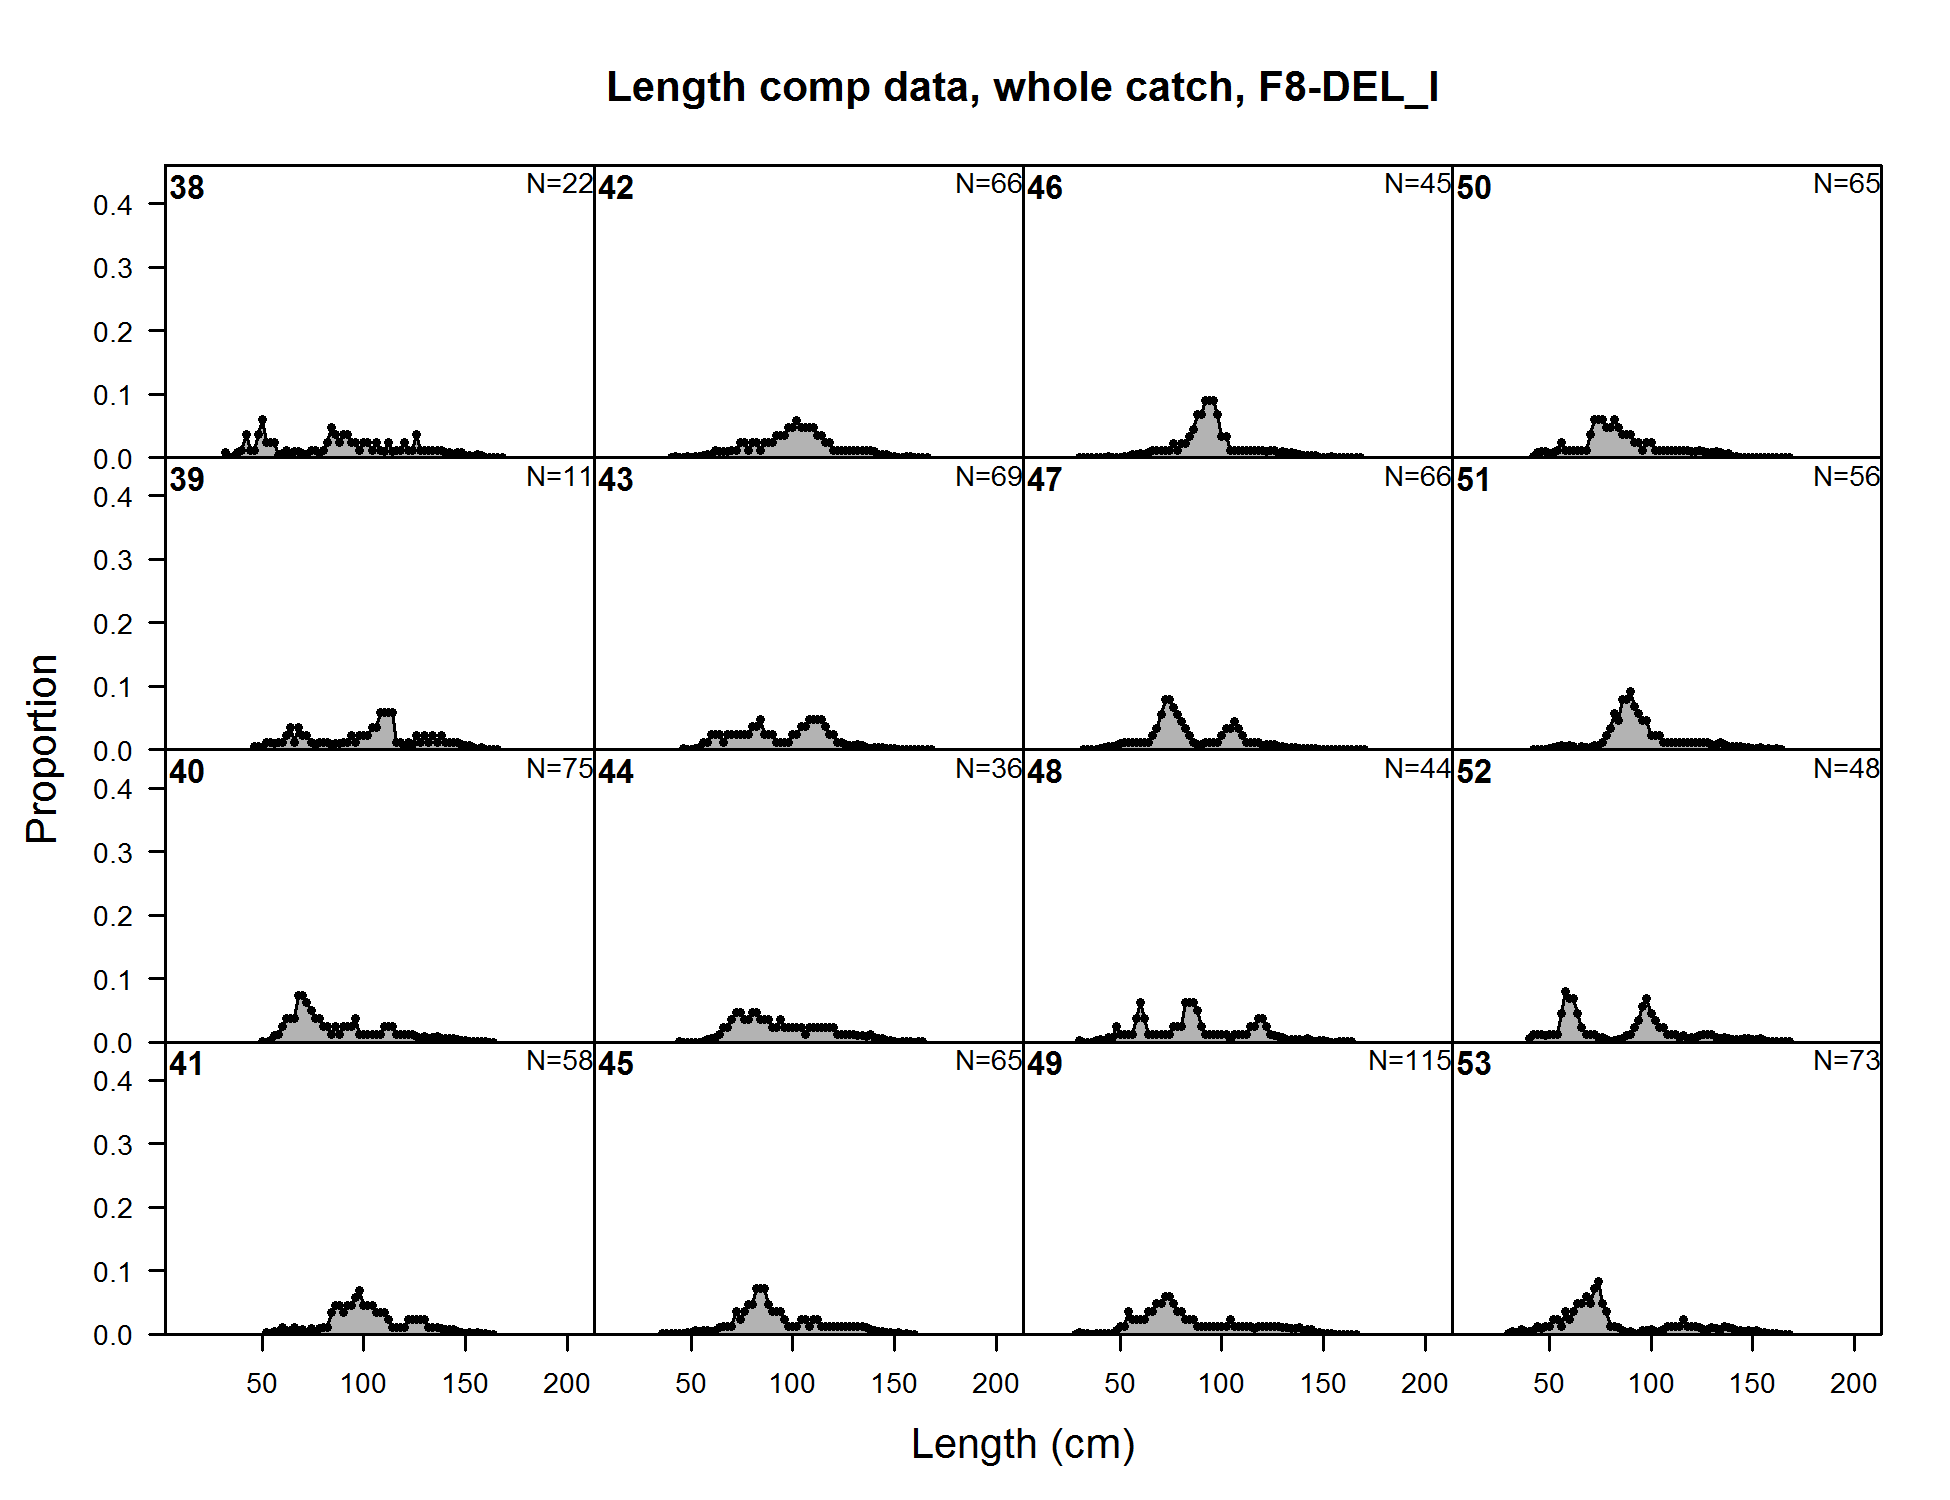
Length comp data, whole catch, F8-DEL_I (plot 1 of 11) (plot 2 of 11) (plot 3 of 11) (plot 4 of 11) (plot 5 of 11) (plot 6 of 11) (plot 7 of 11) (plot 8 of 11)
file: comp_lendat_flt8mkt0_page8.png
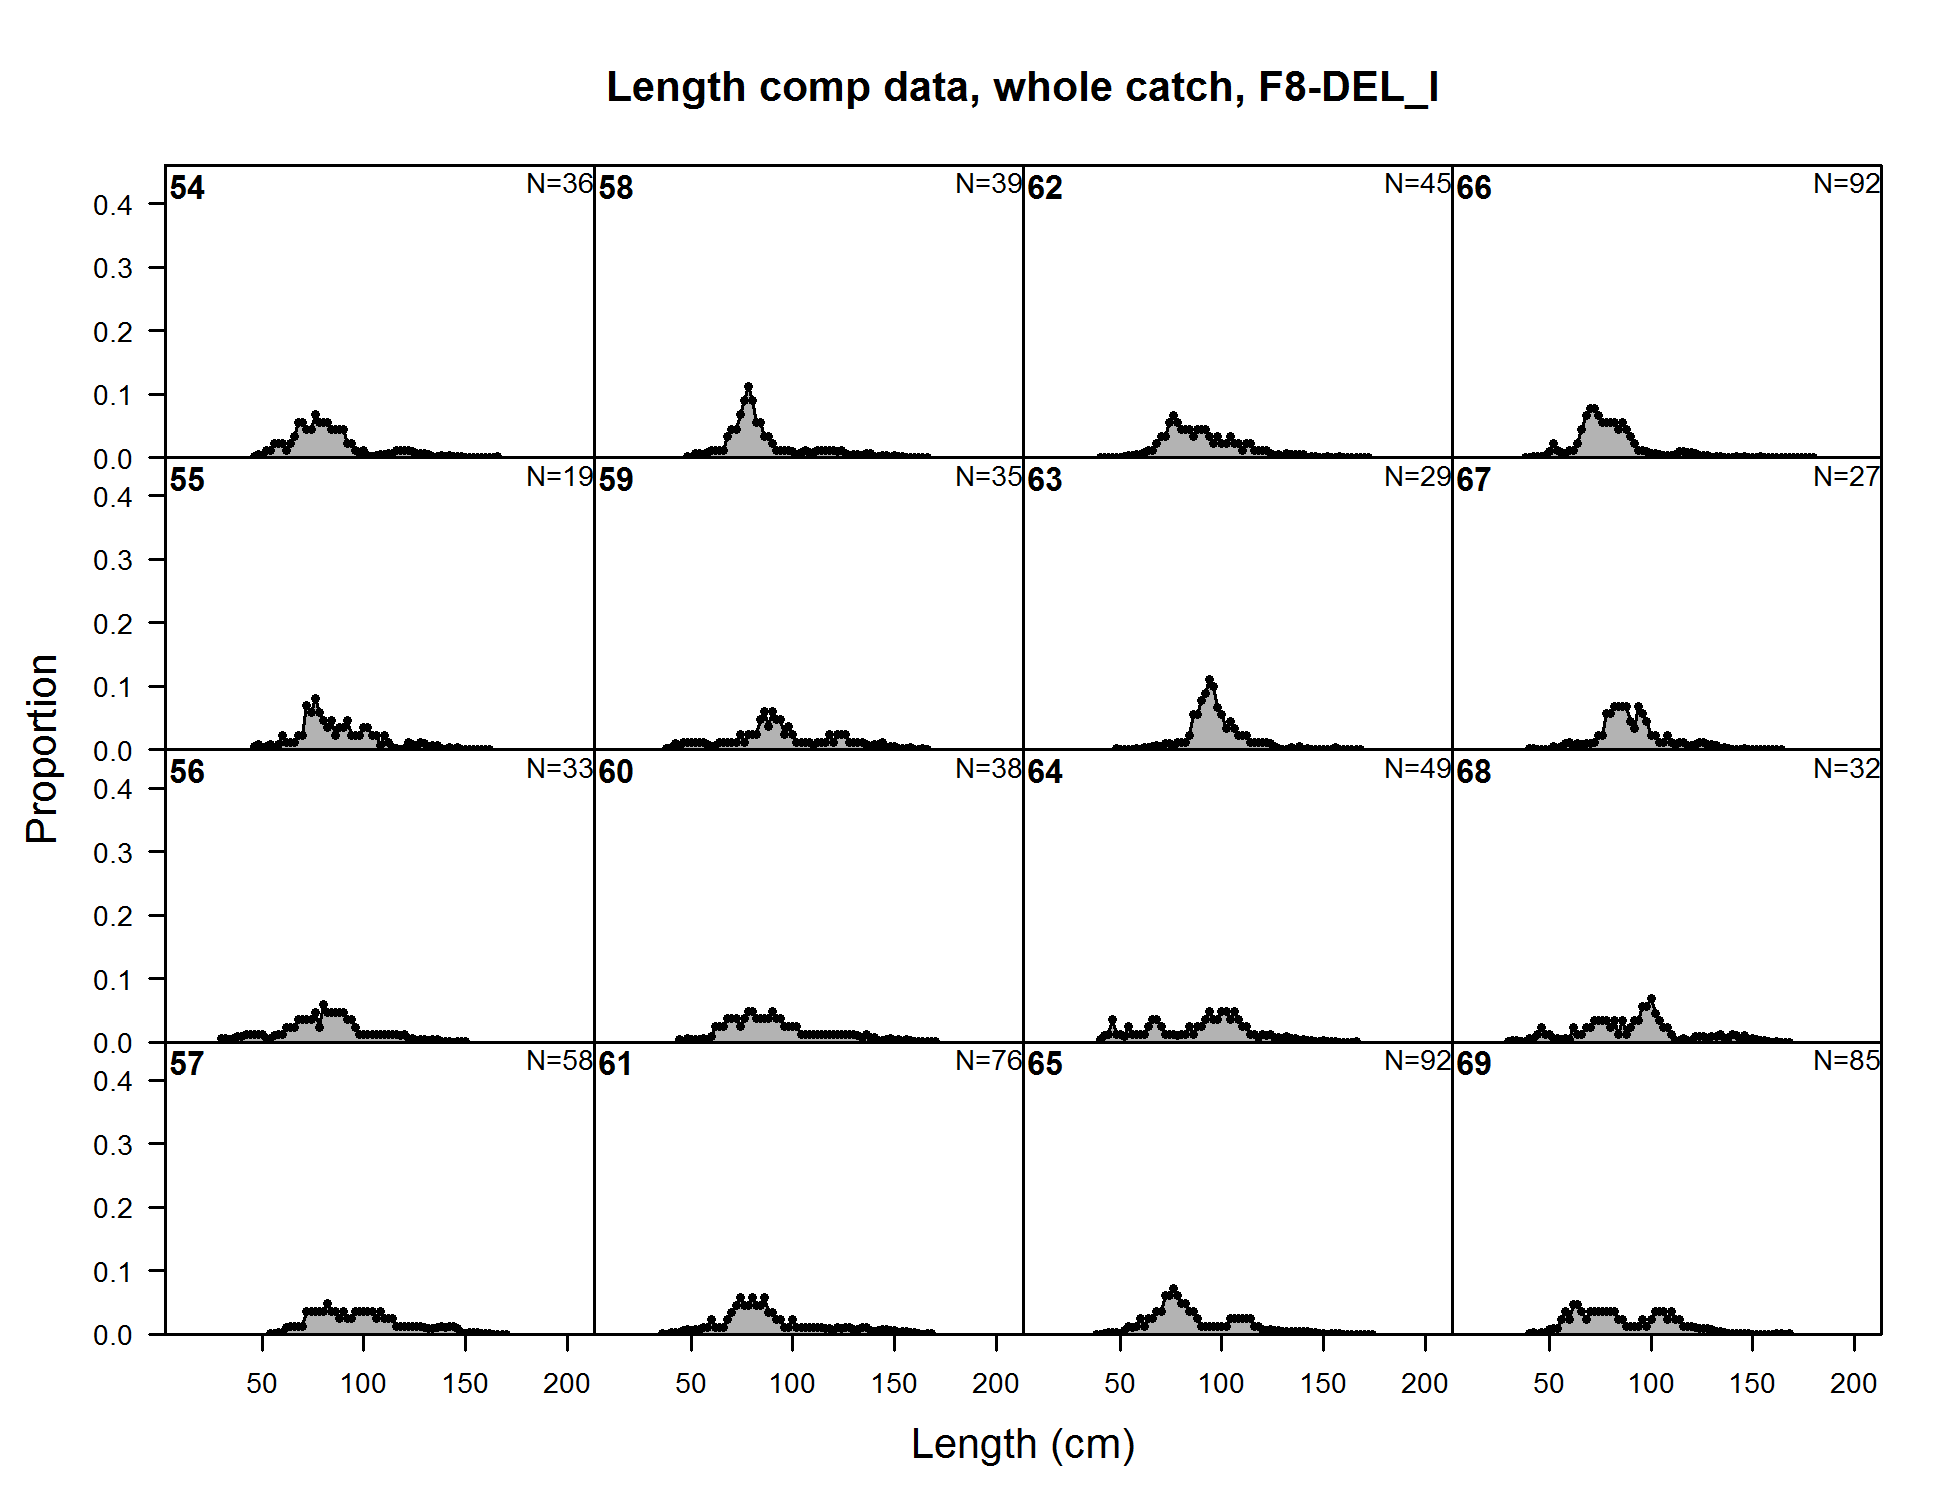
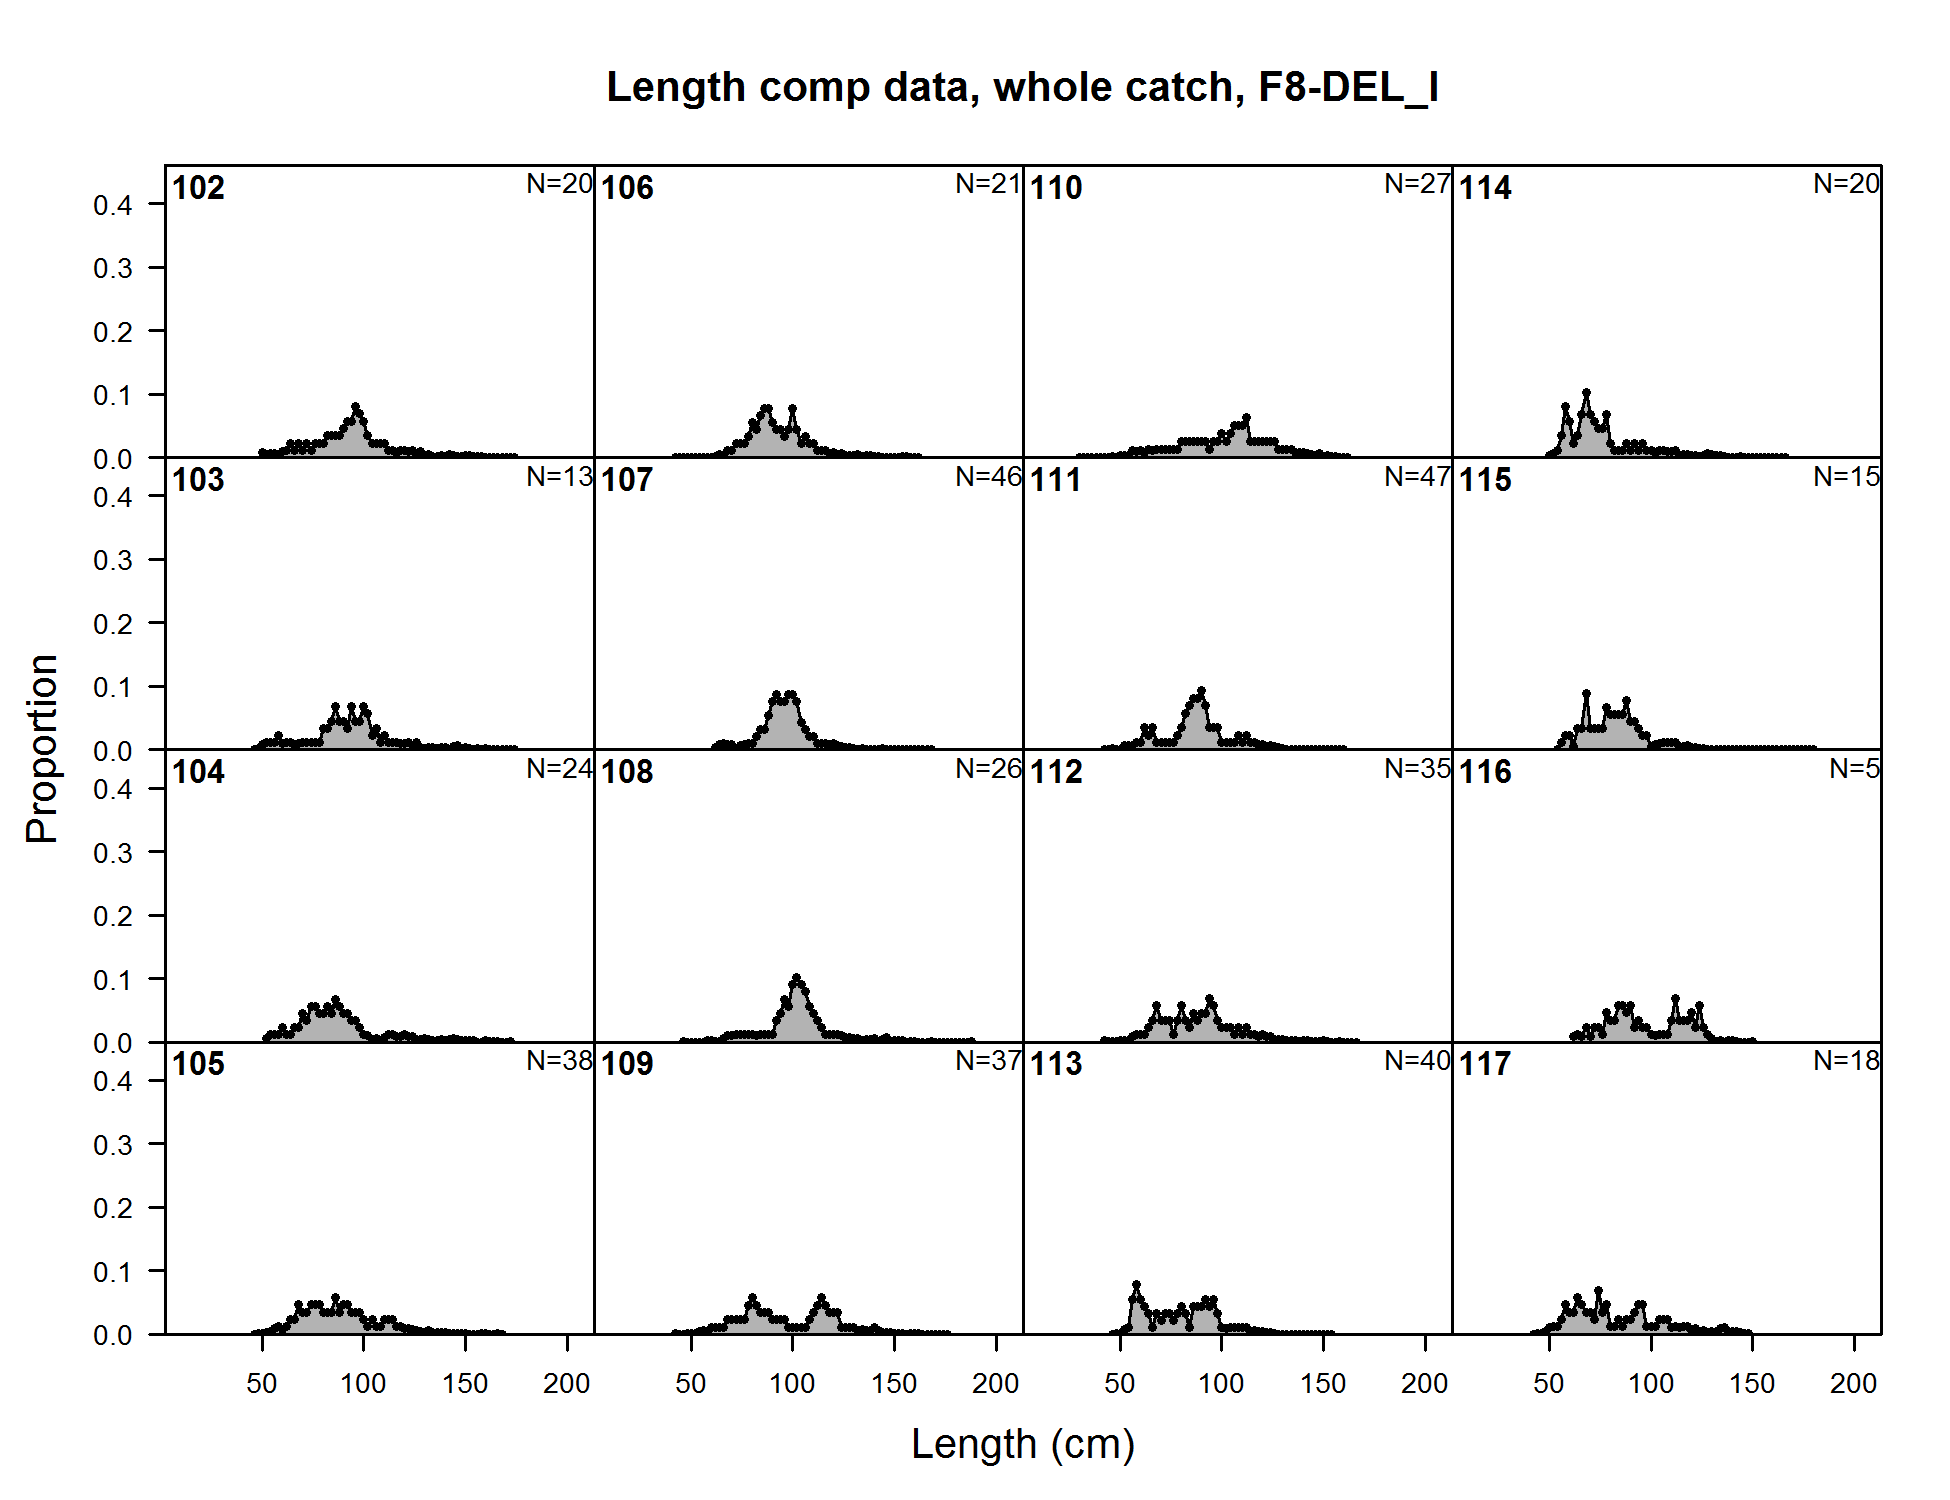
Length comp data, whole catch, F8-DEL_I (plot 1 of 11) (plot 2 of 11) (plot 3 of 11) (plot 4 of 11) (plot 5 of 11) (plot 6 of 11) (plot 7 of 11) (plot 8 of 11) (plot 9 of 11)
file: comp_lendat_flt8mkt0_page9.png
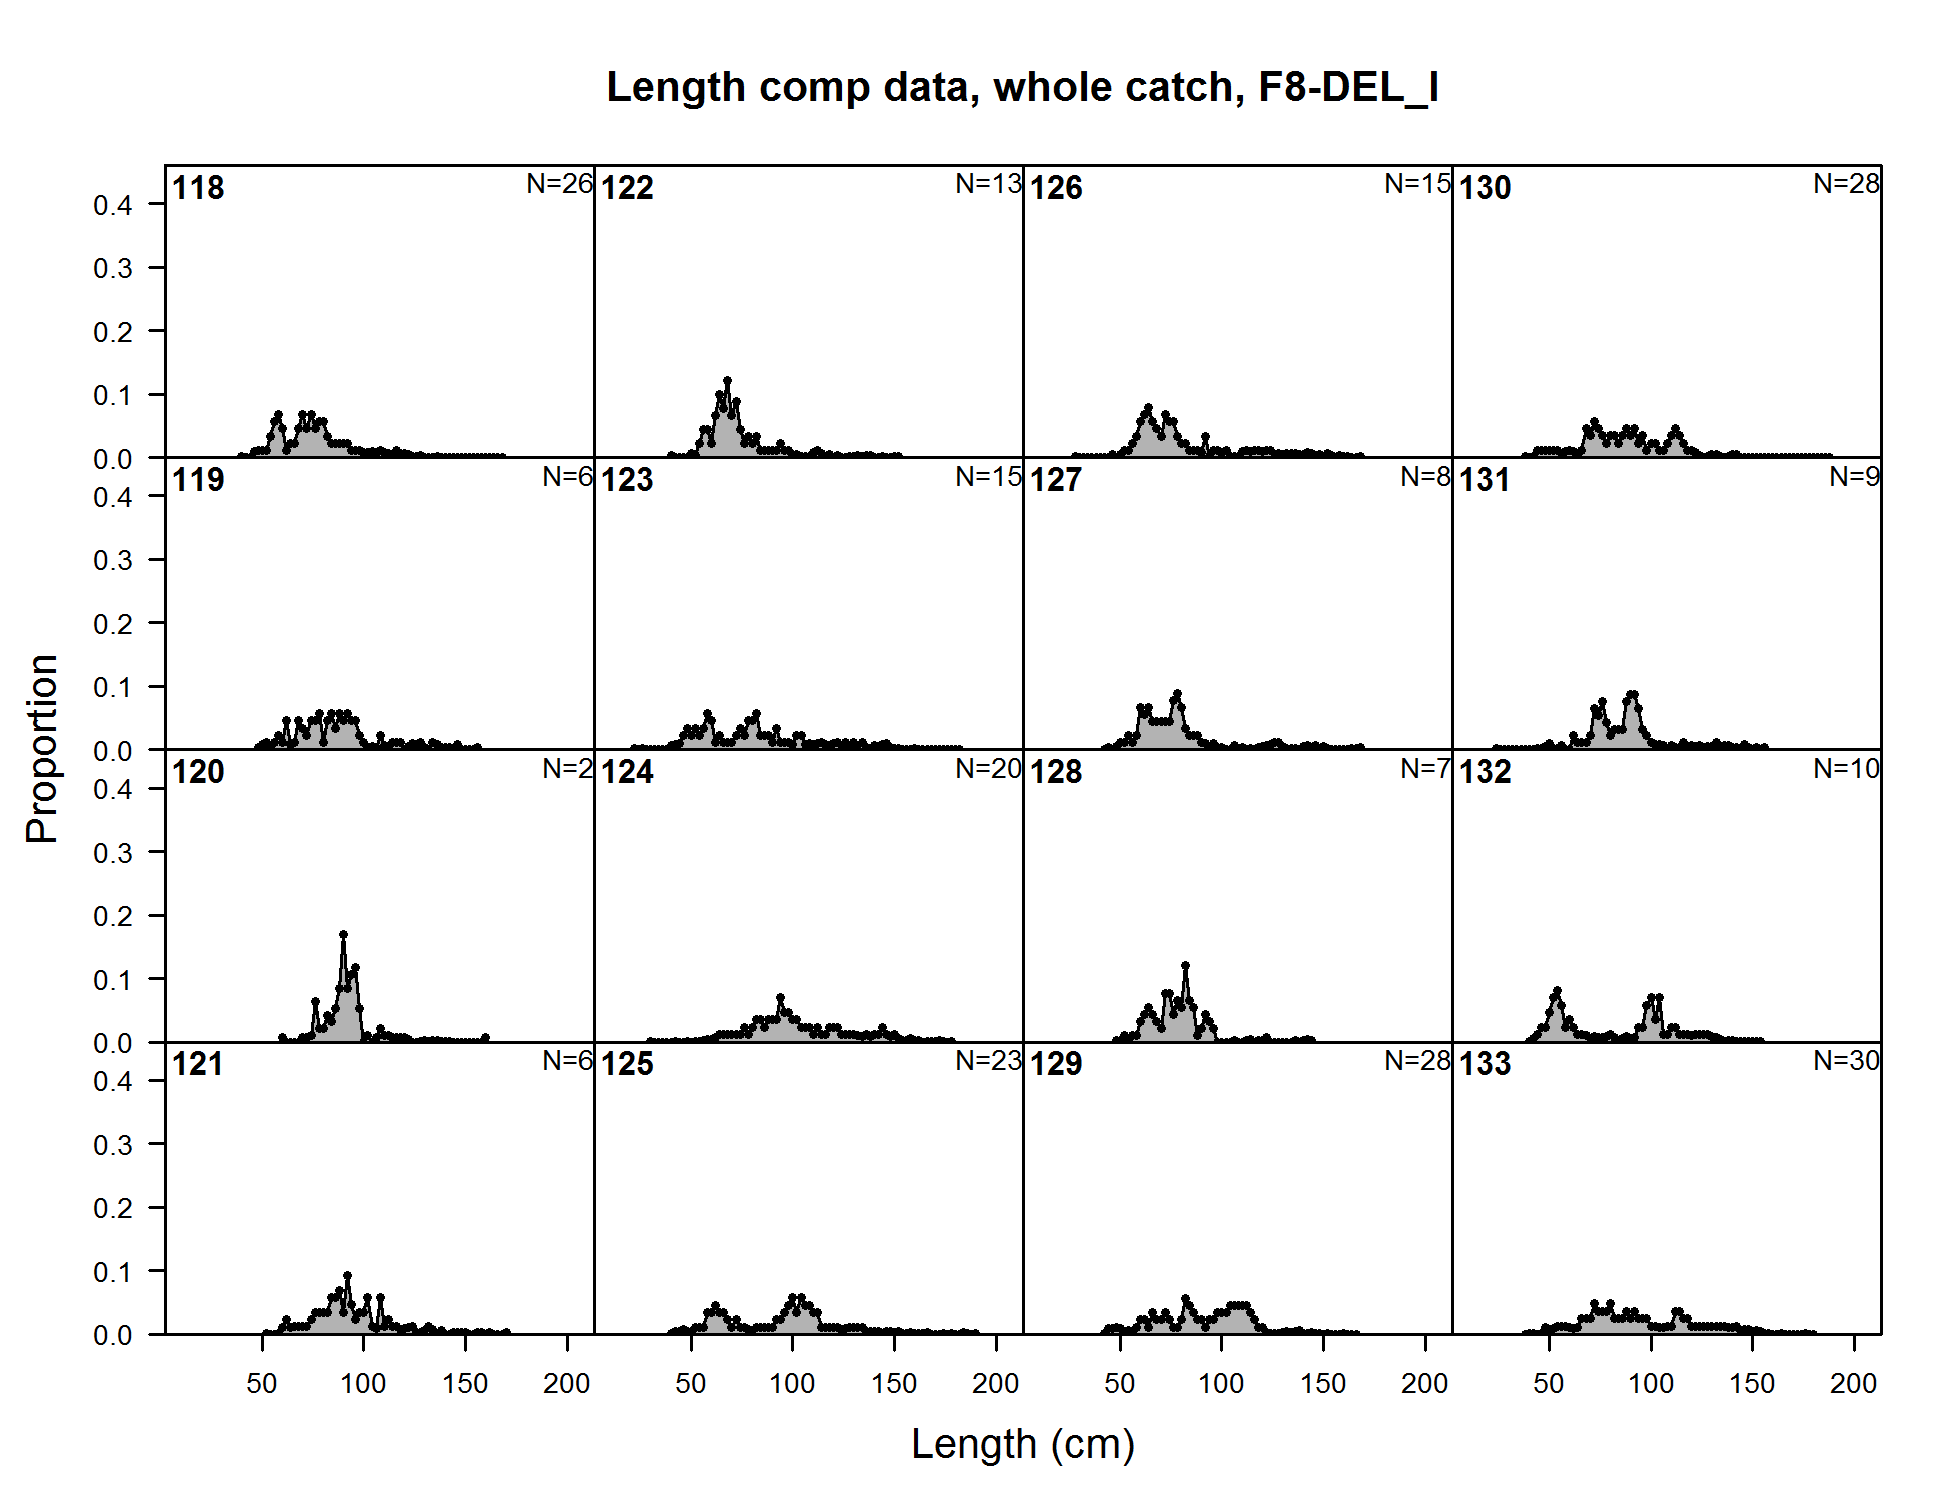
Length comp data, whole catch, F8-DEL_I (plot 1 of 11) (plot 2 of 11) (plot 3 of 11) (plot 4 of 11) (plot 5 of 11) (plot 6 of 11) (plot 7 of 11) (plot 8 of 11) (plot 9 of 11) (plot 10 of 11)
file: comp_lendat_flt8mkt0_page10.png
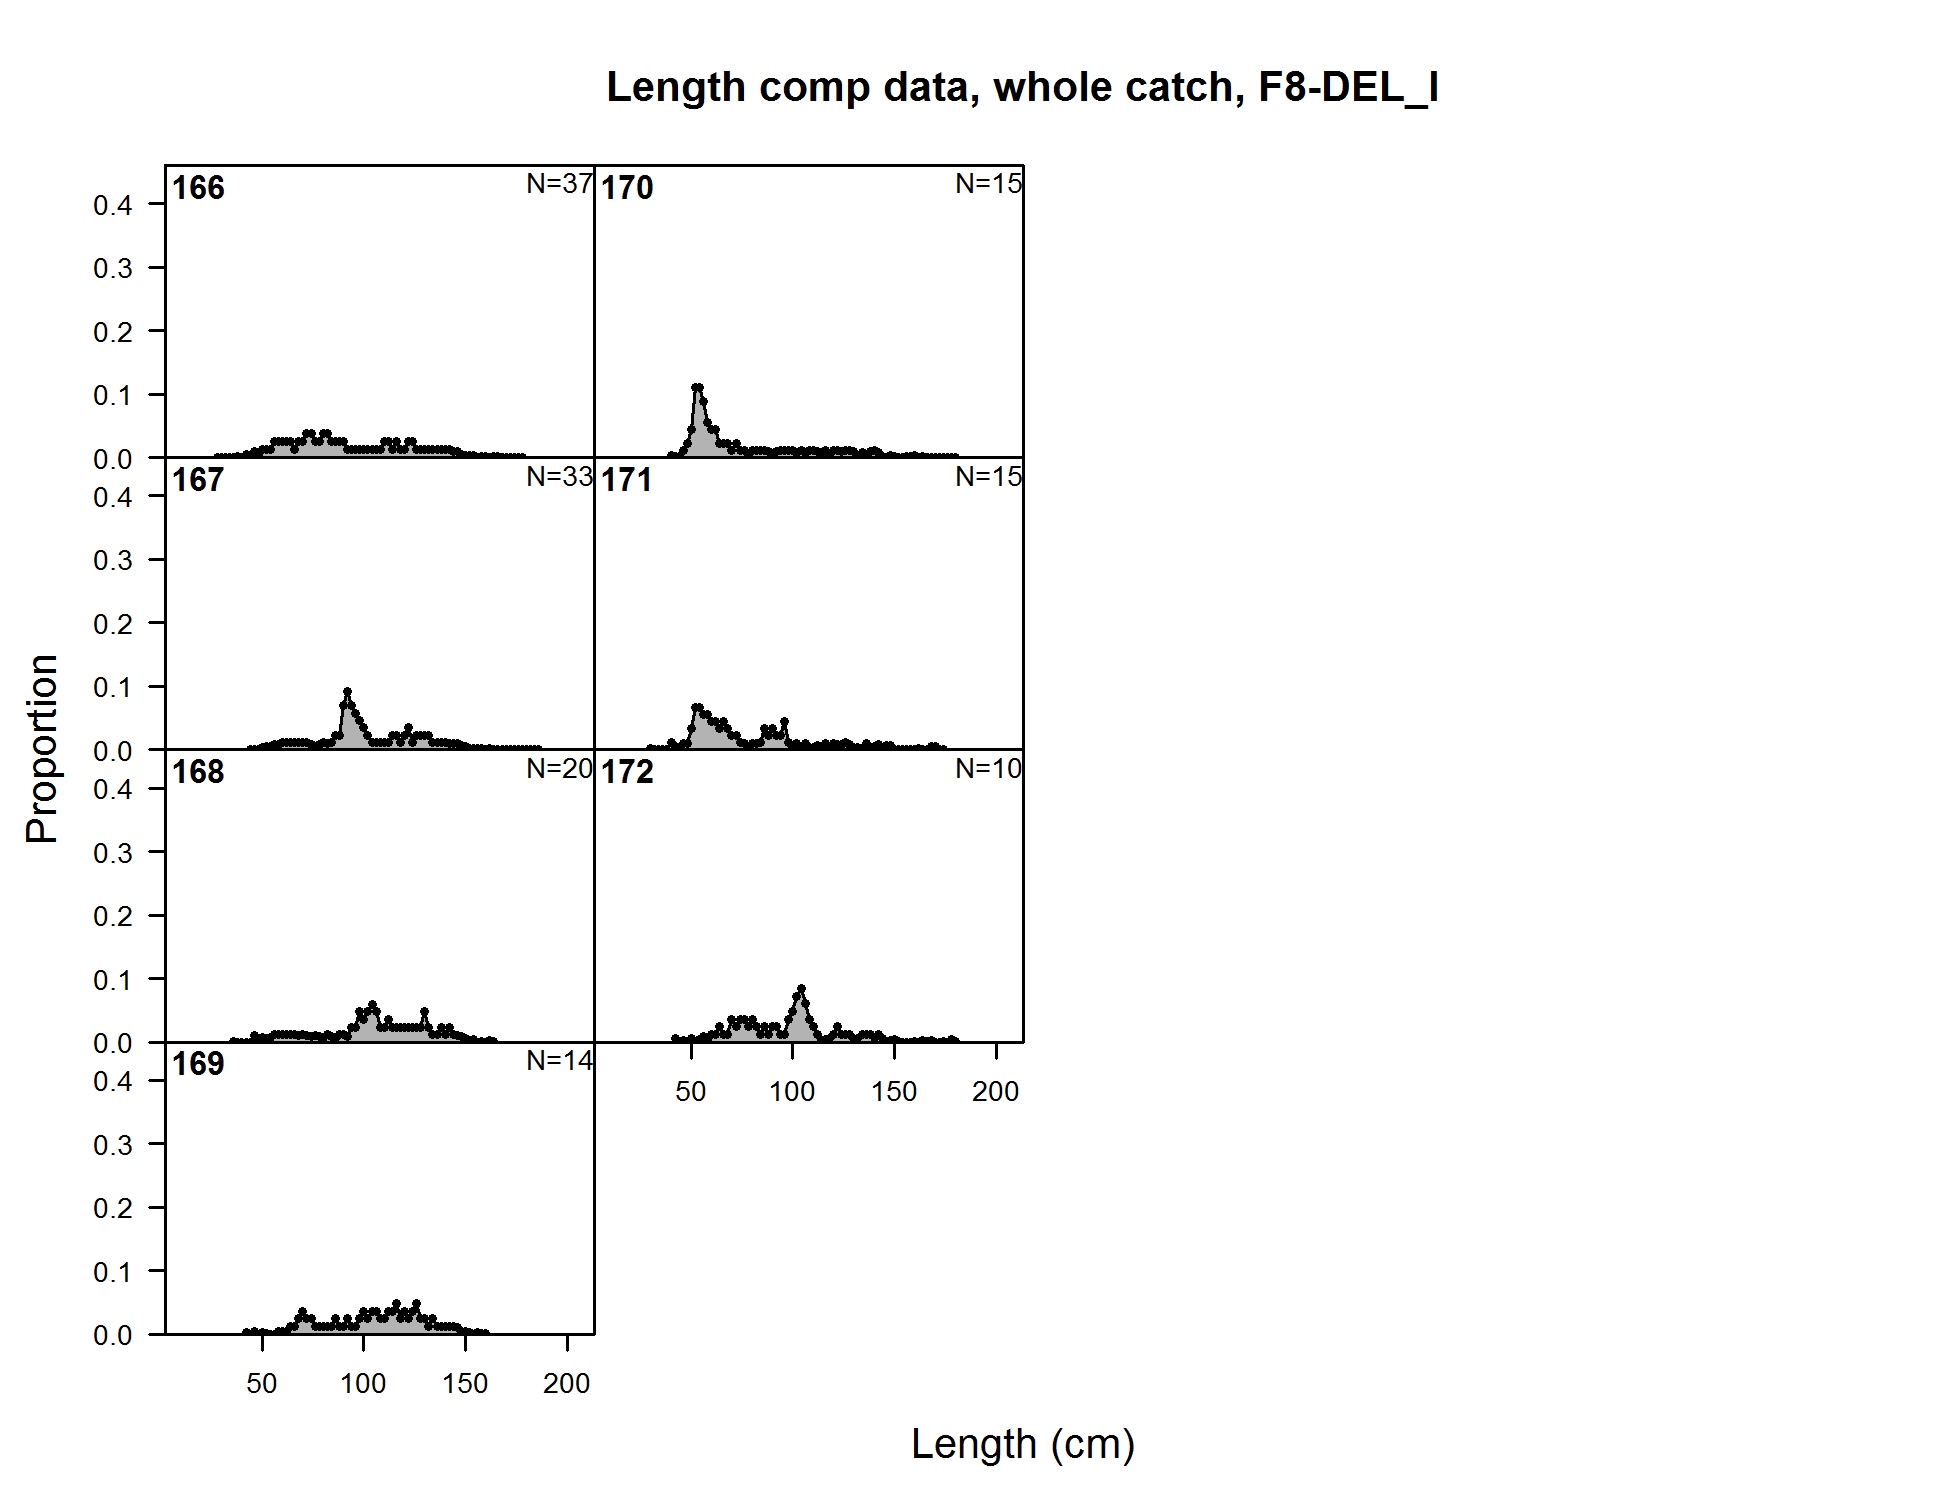
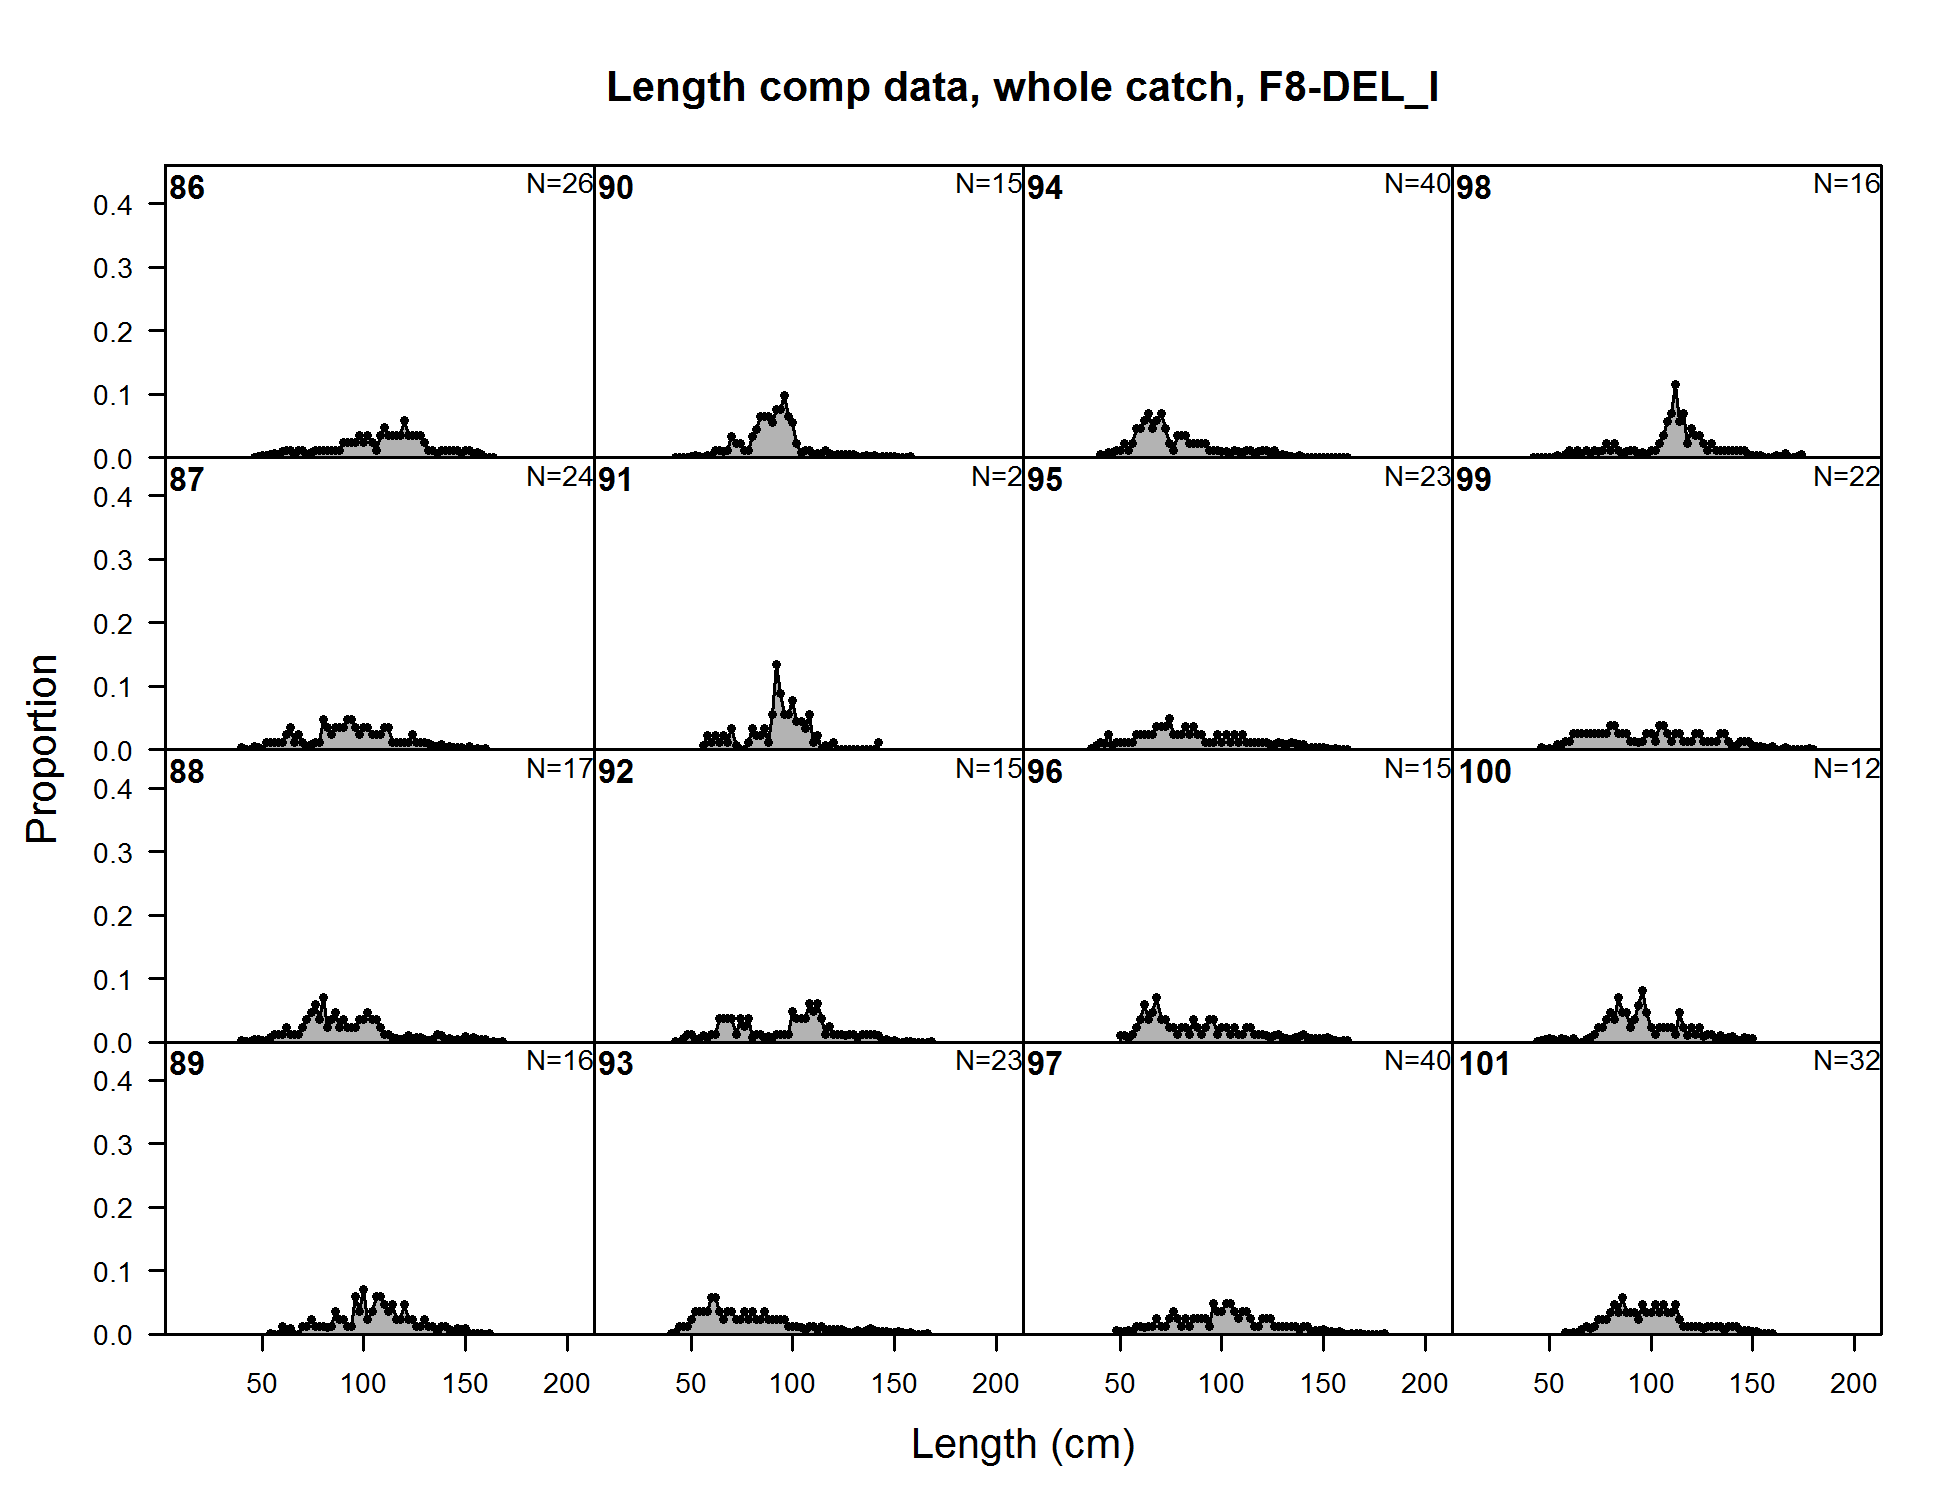
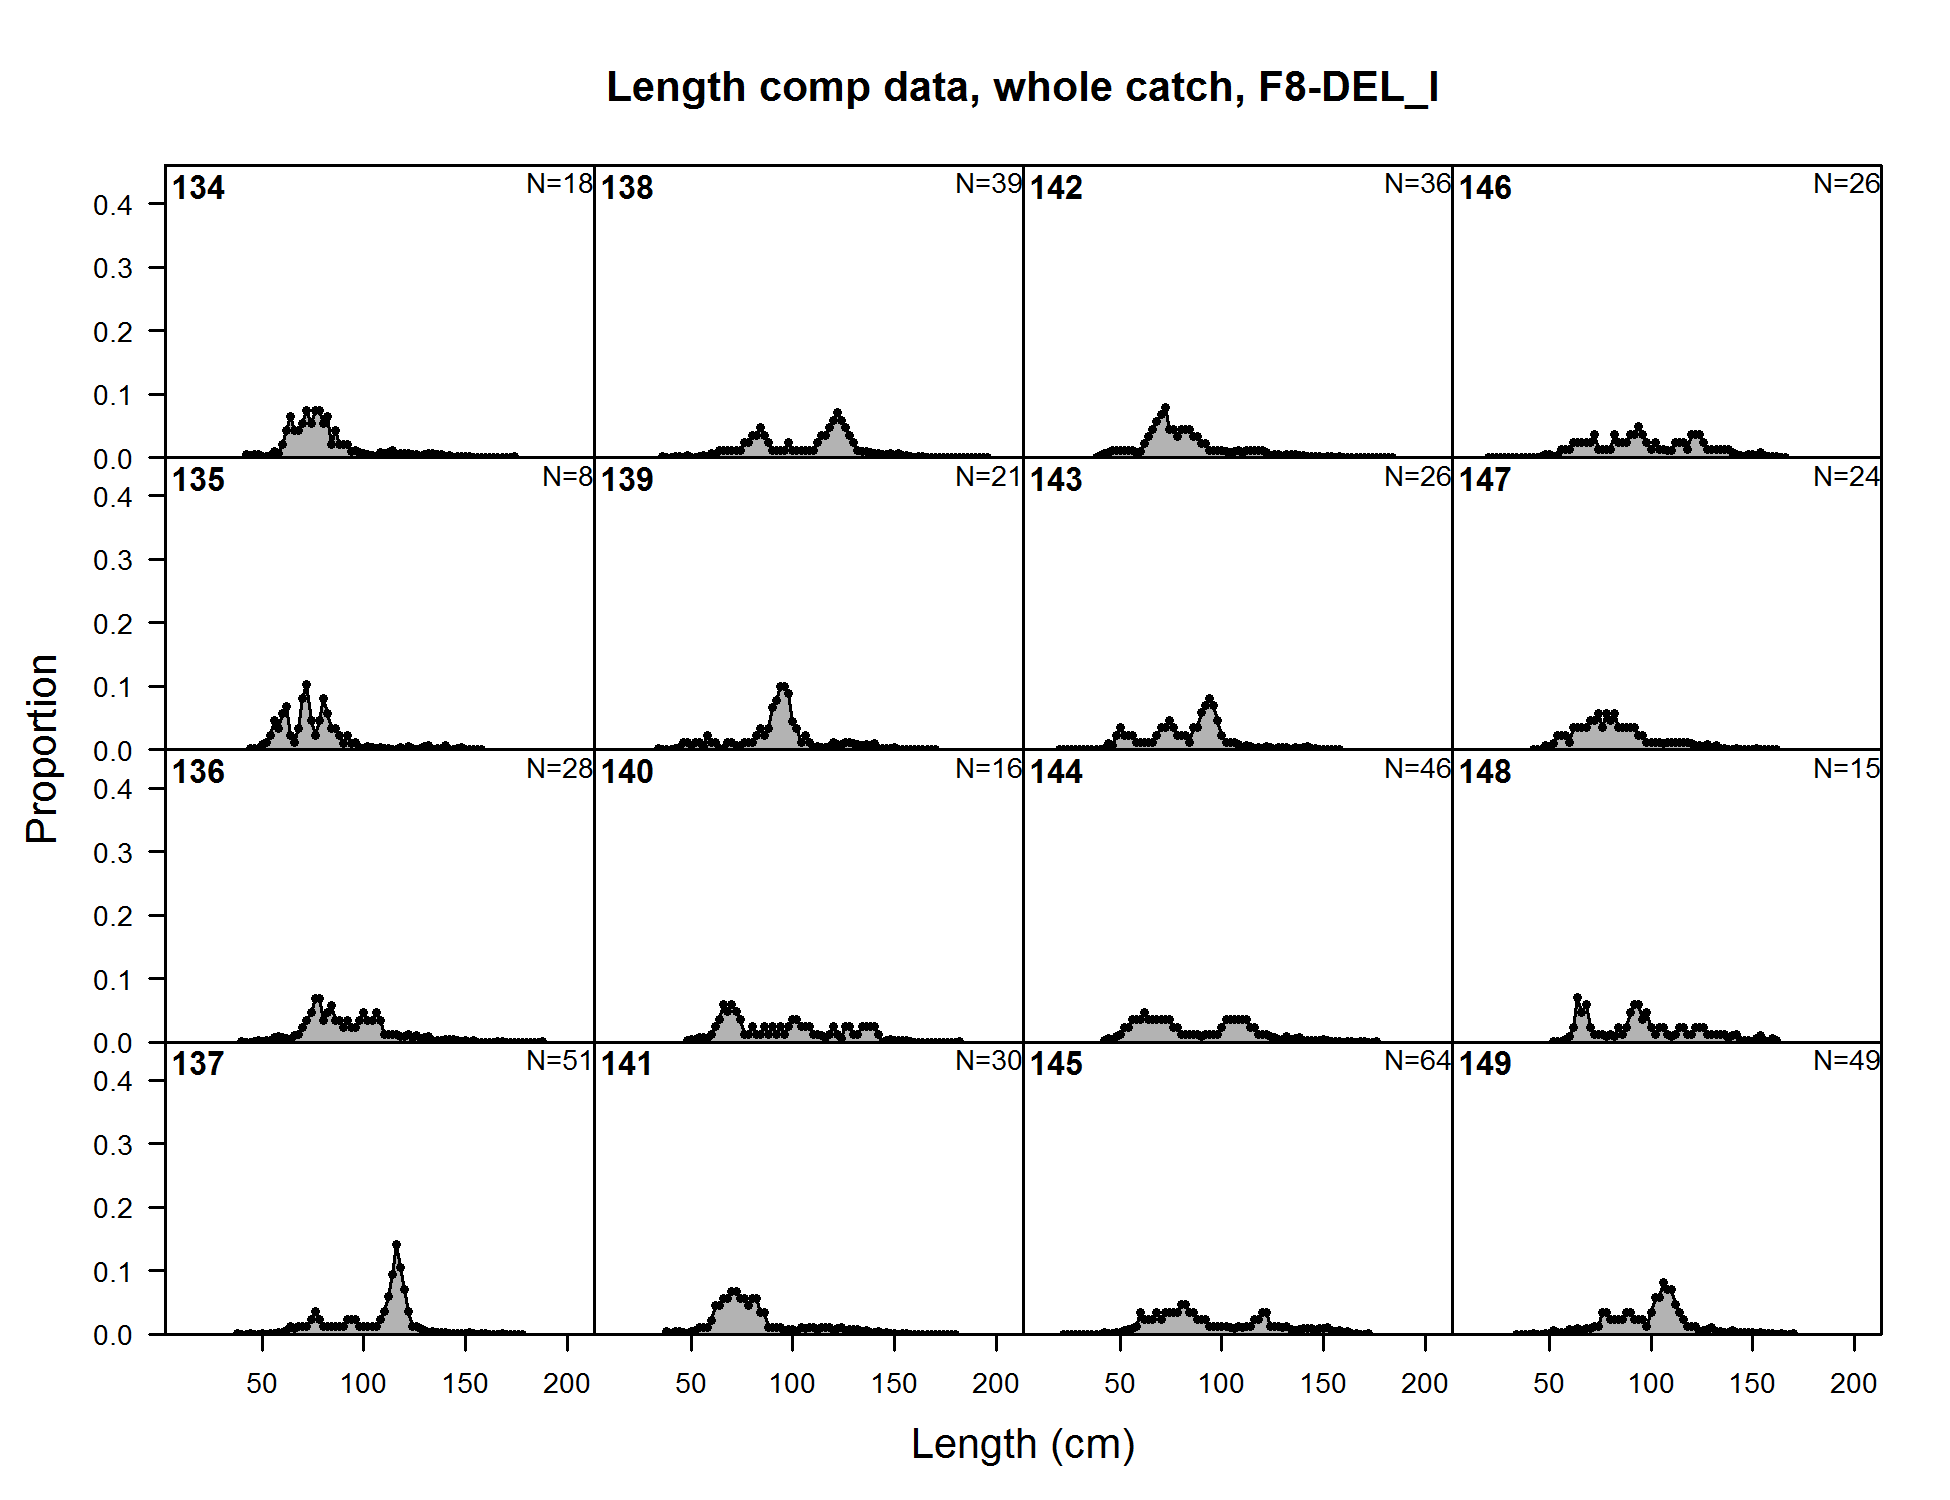
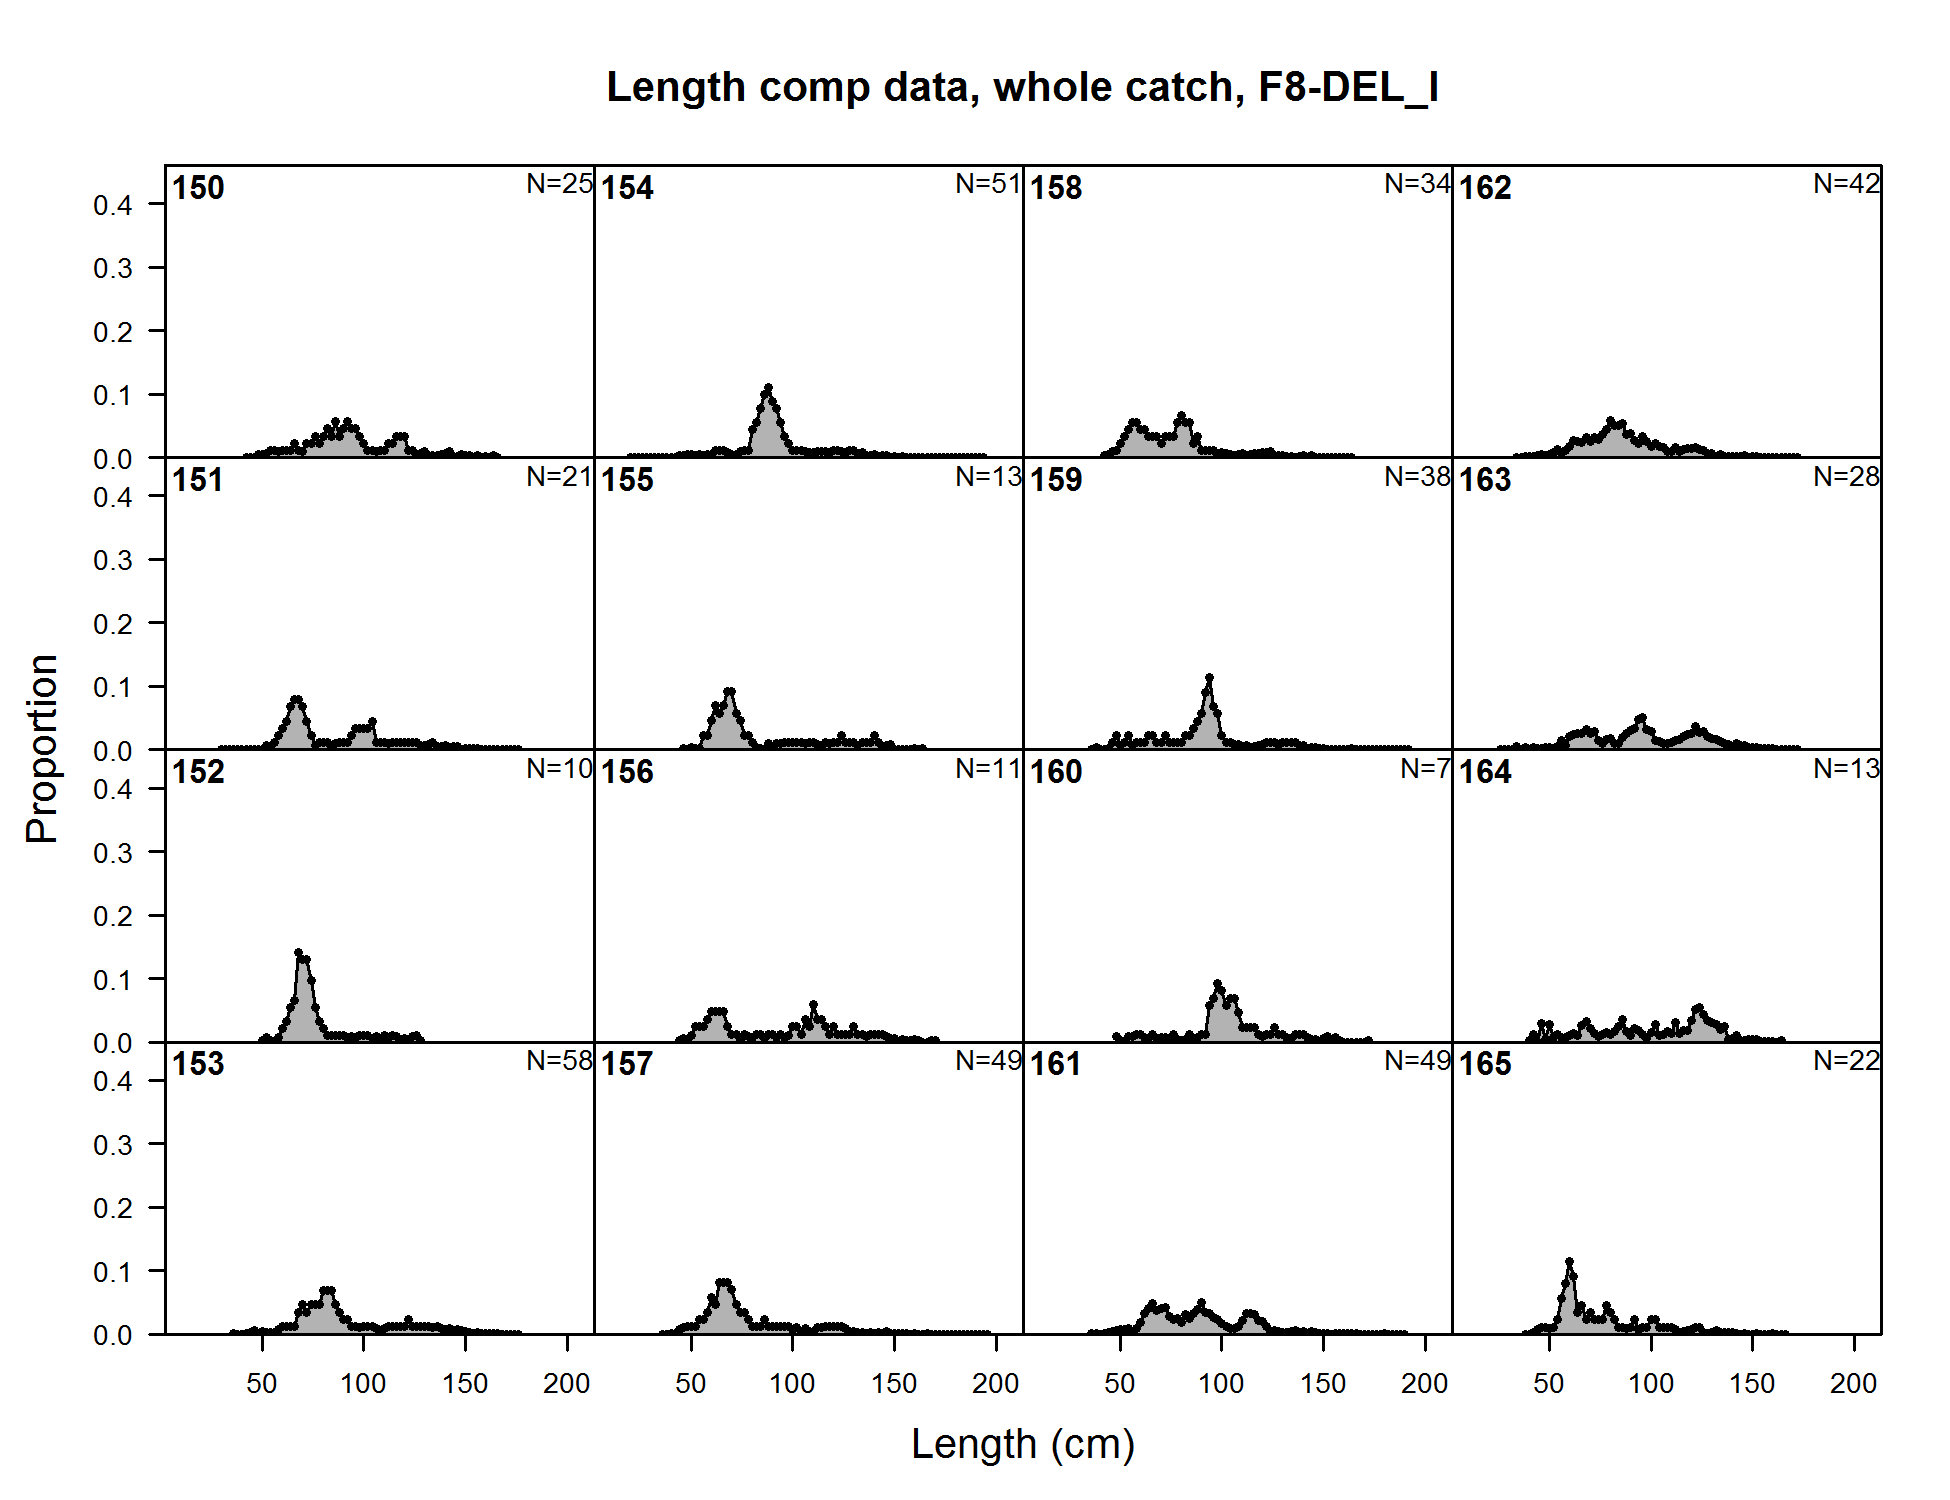
Length comp data, whole catch, F8-DEL_I (plot 1 of 11) (plot 2 of 11) (plot 3 of 11) (plot 4 of 11) (plot 5 of 11) (plot 6 of 11) (plot 7 of 11) (plot 8 of 11) (plot 9 of 11) (plot 10 of 11) (plot 11 of 11)
file: comp_lendat_flt8mkt0_page11.png
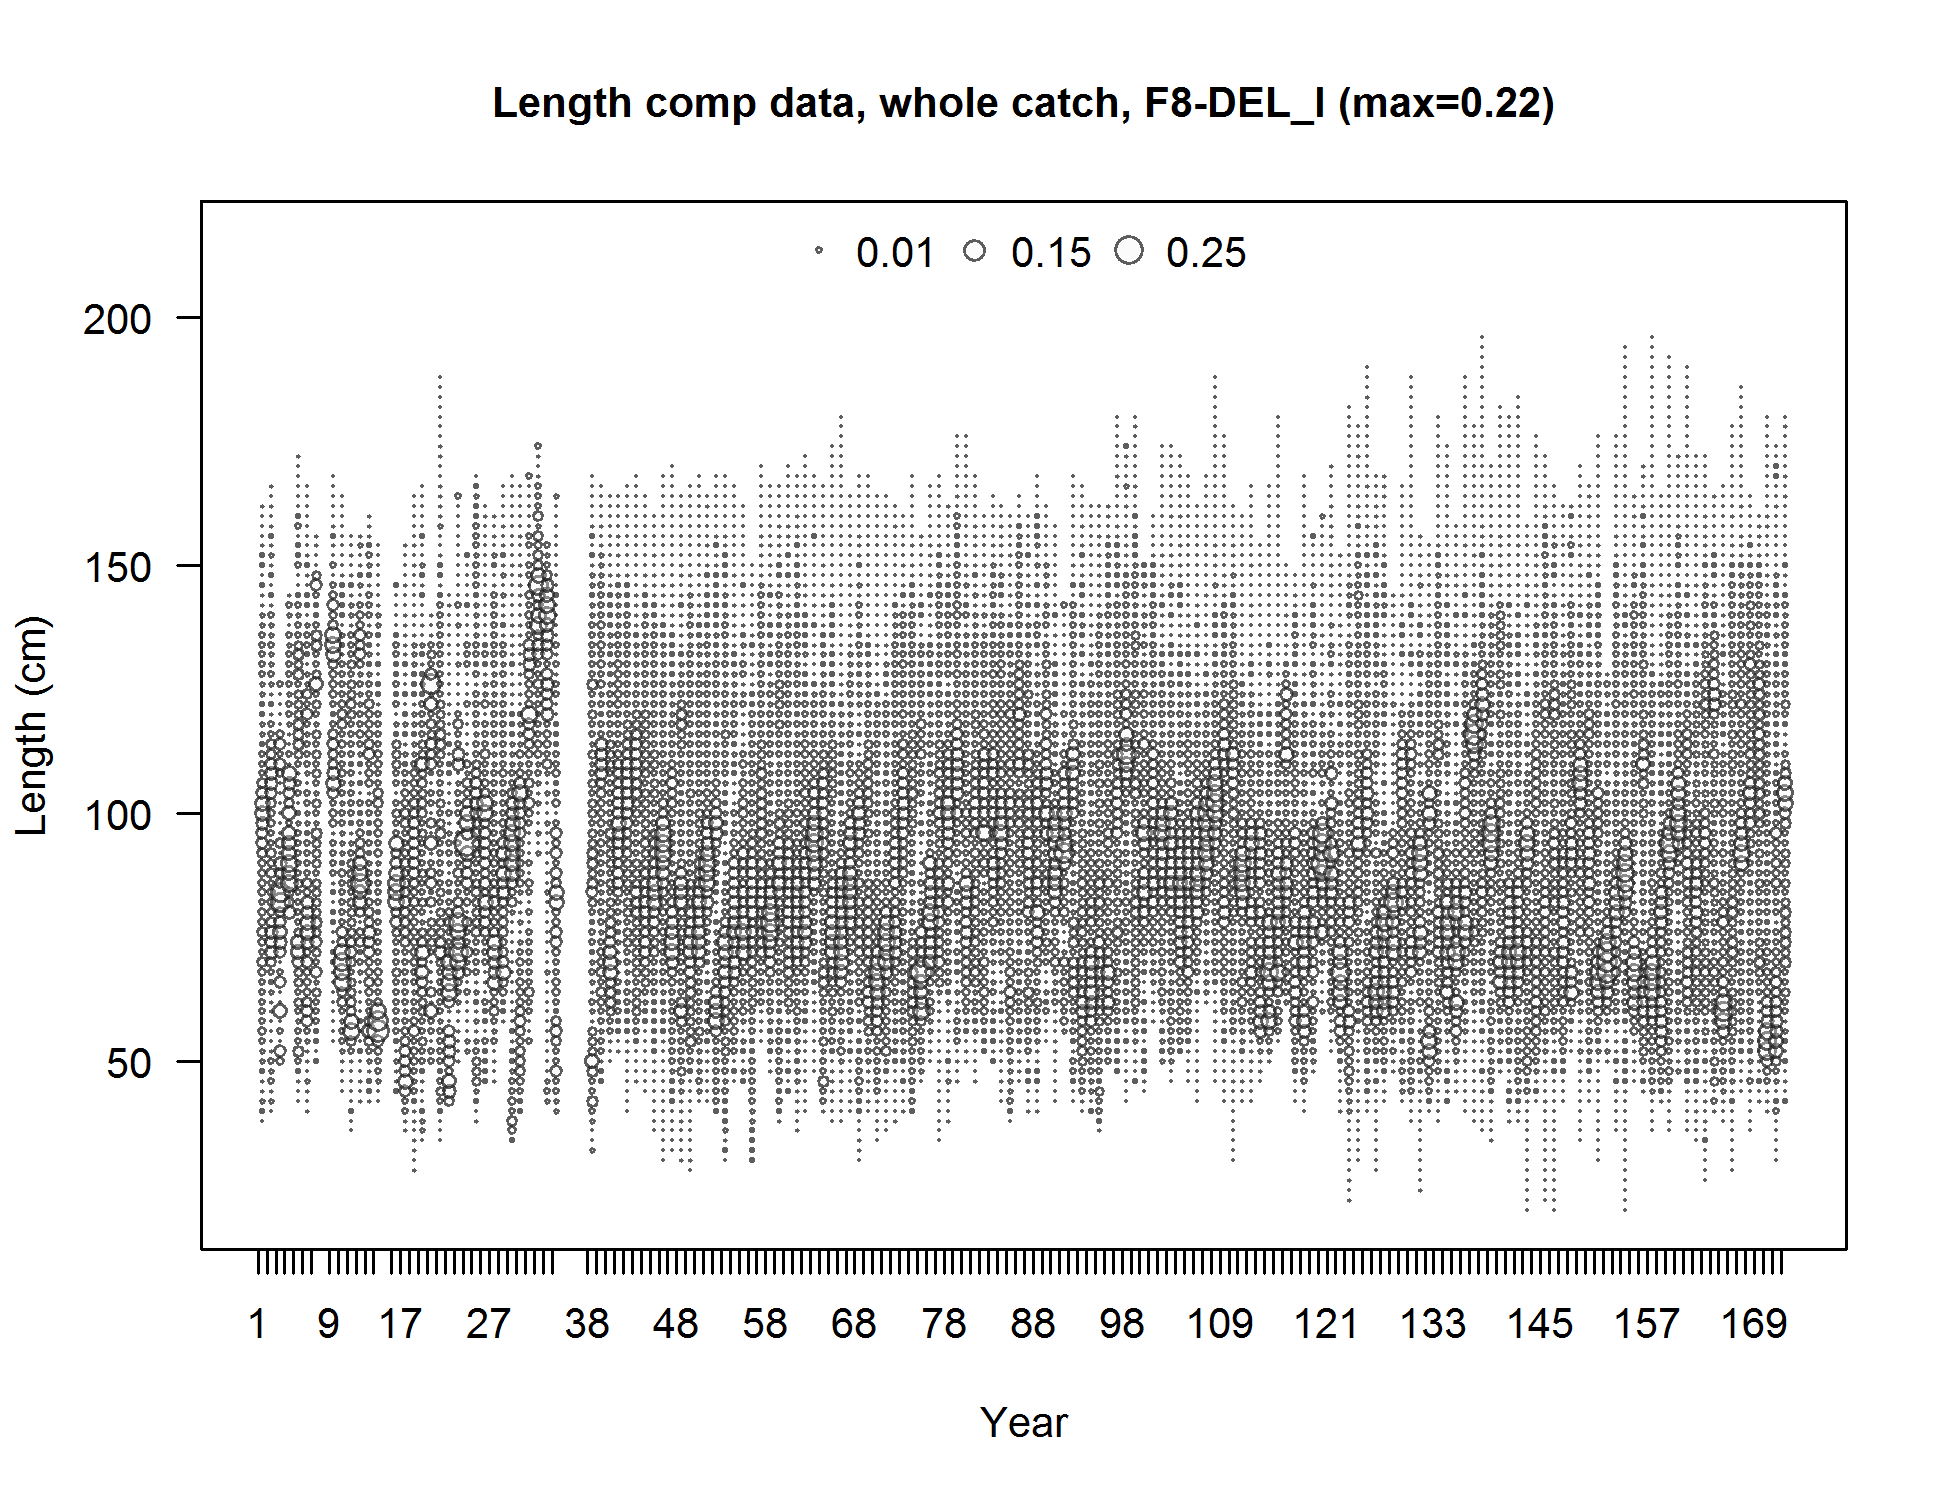
Length comp data, whole catch, F8-DEL_I (max=0.22) (plot 11 of 11)
file: comp_lendat_bubflt8mkt0_page11.png
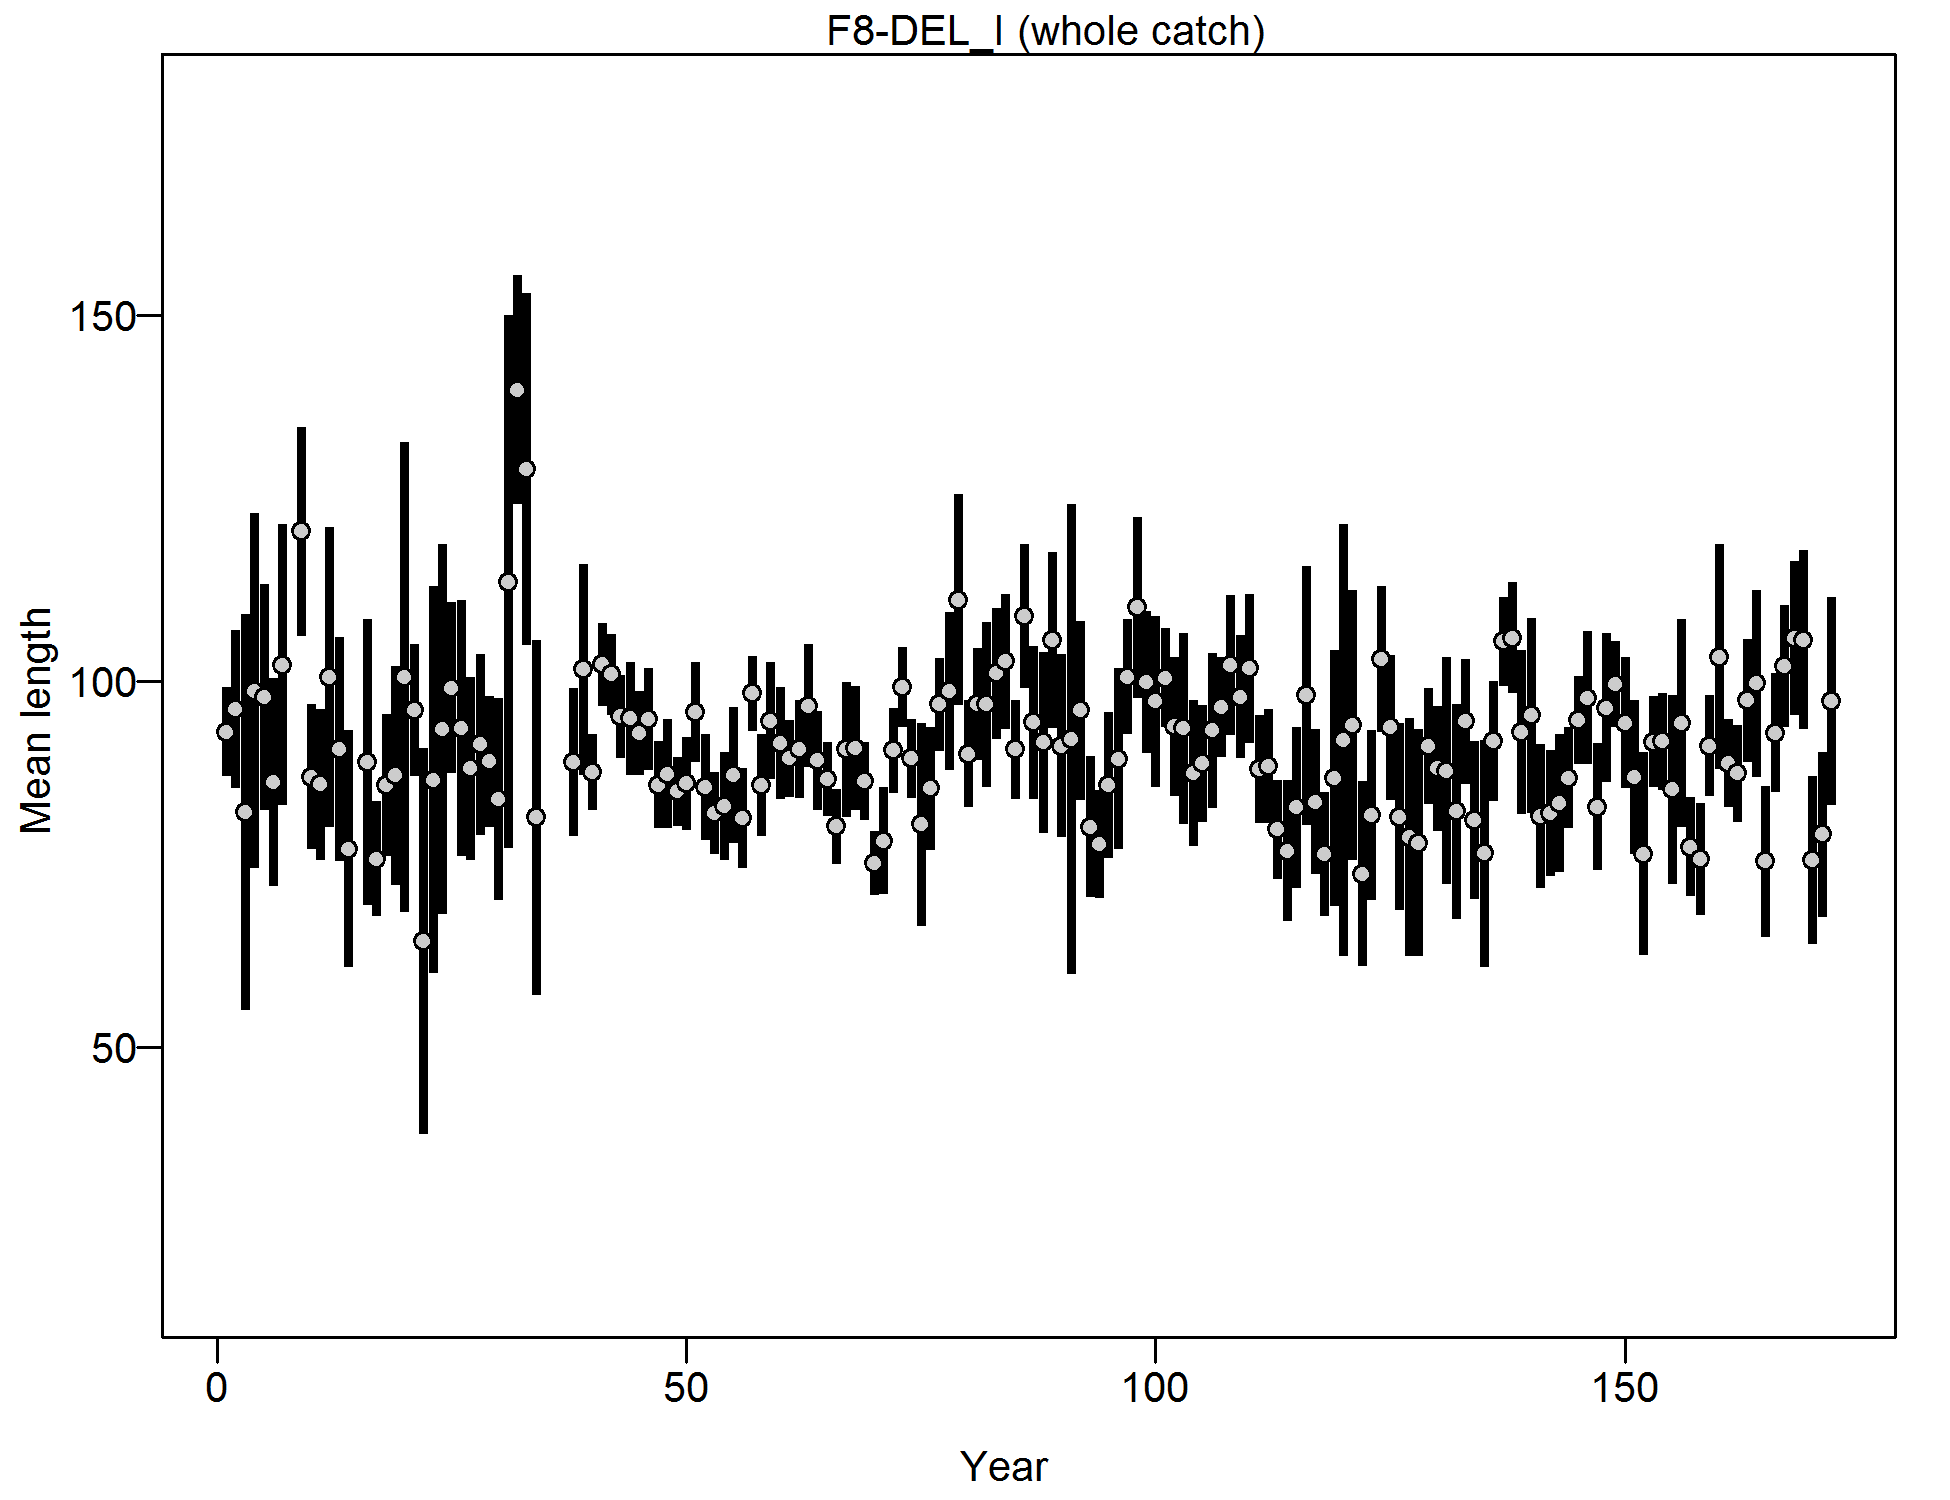
Mean length for F8-DEL_I with 95% confidence intervals based on current samples sizes.
file: comp_lendat_data_weighting_TA1.8_F8-DEL_I.png
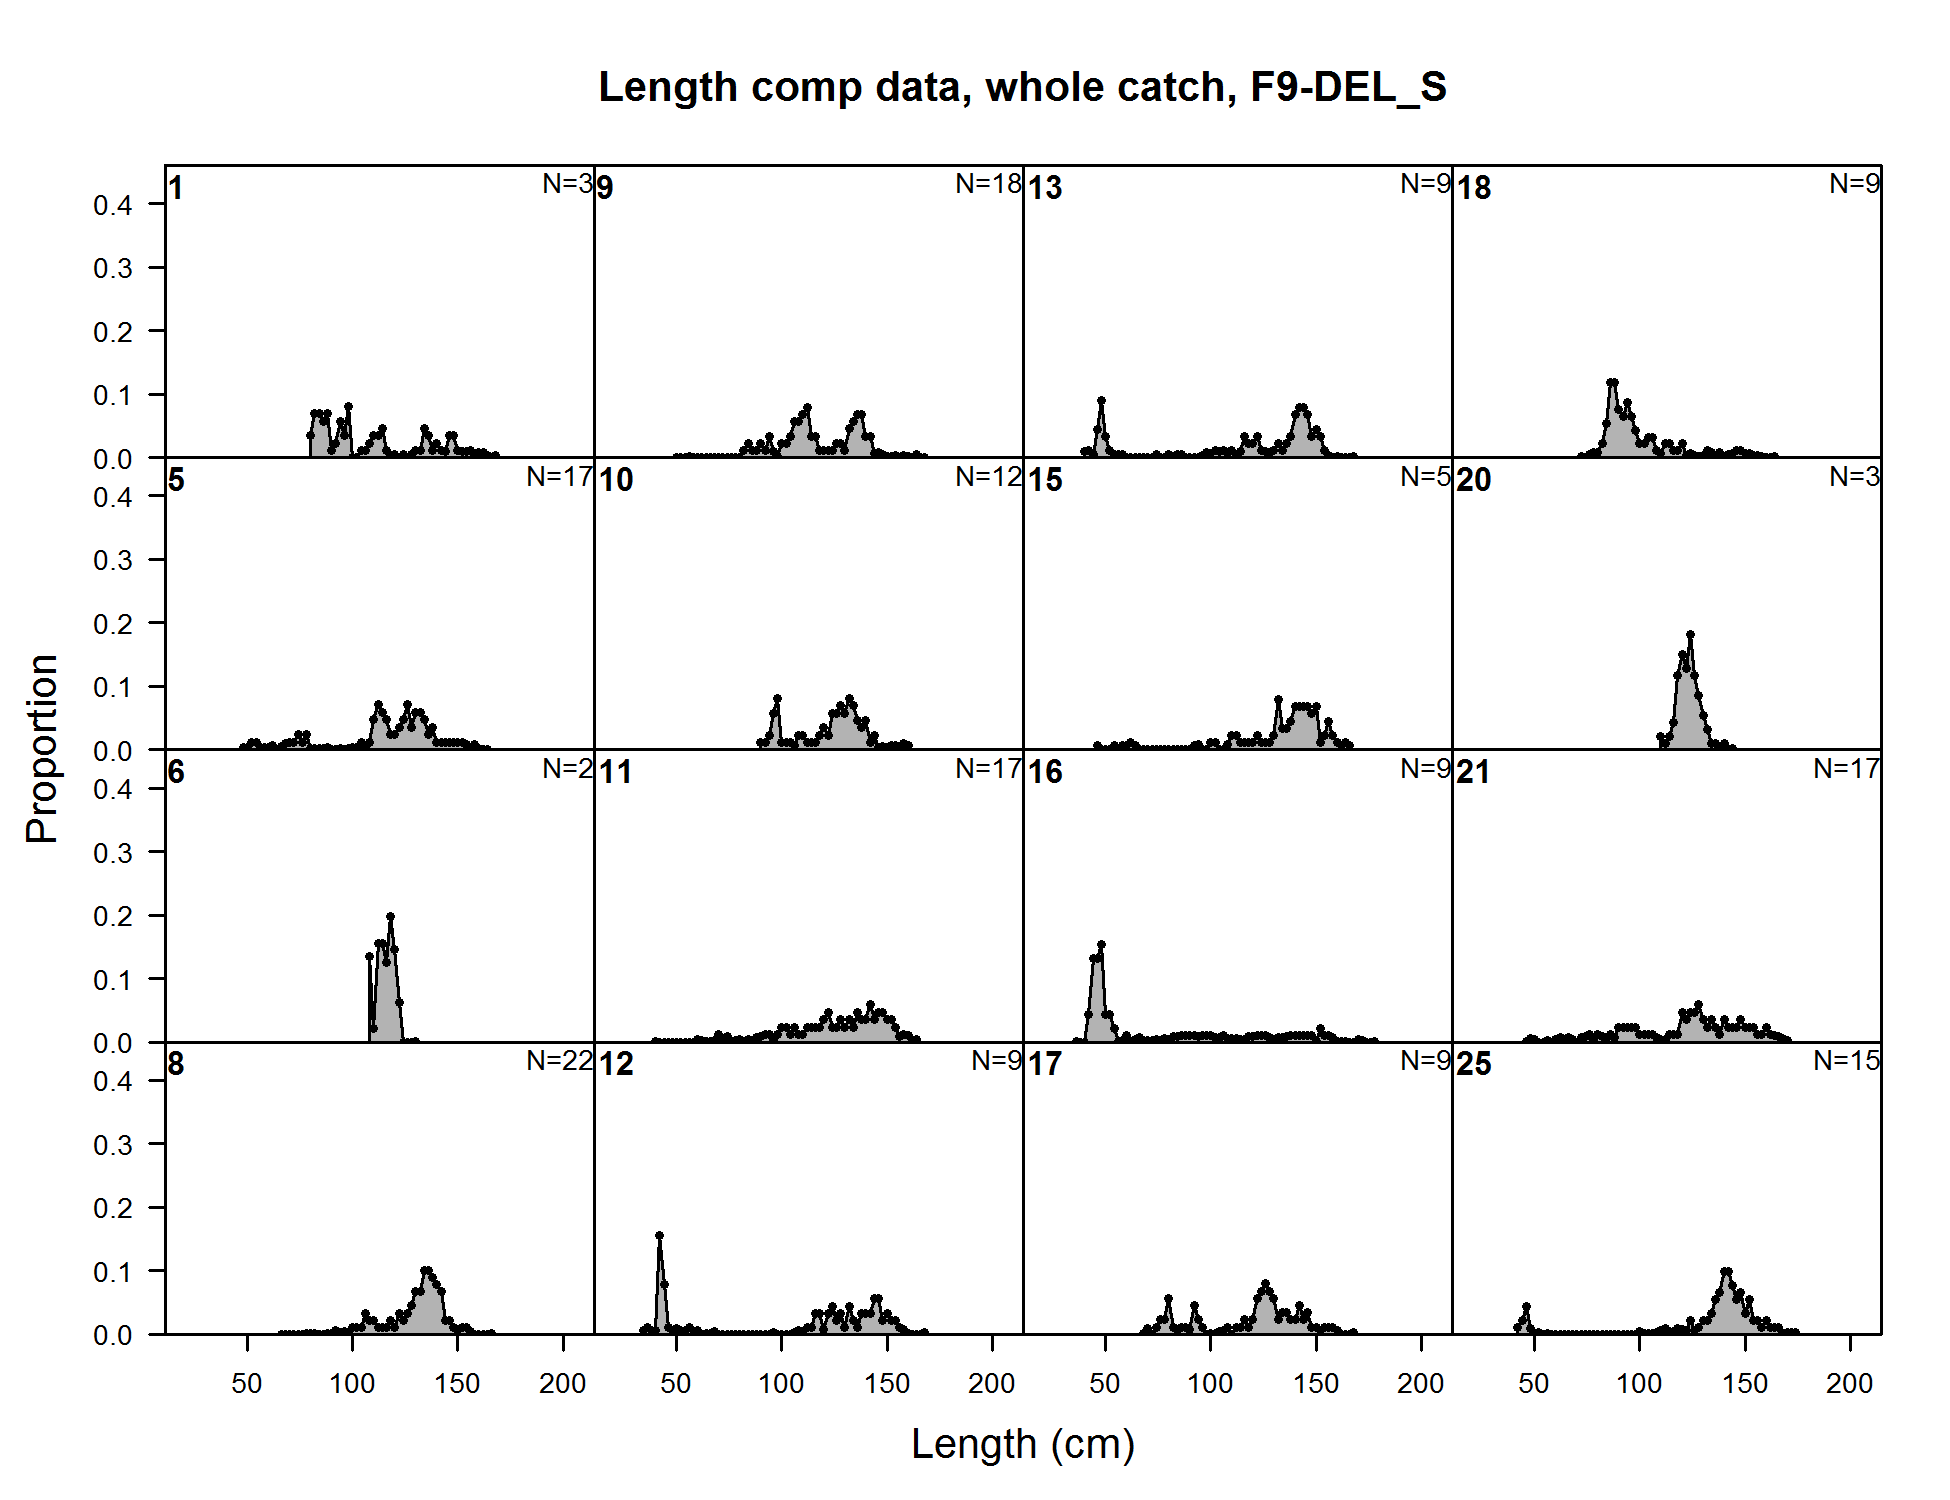
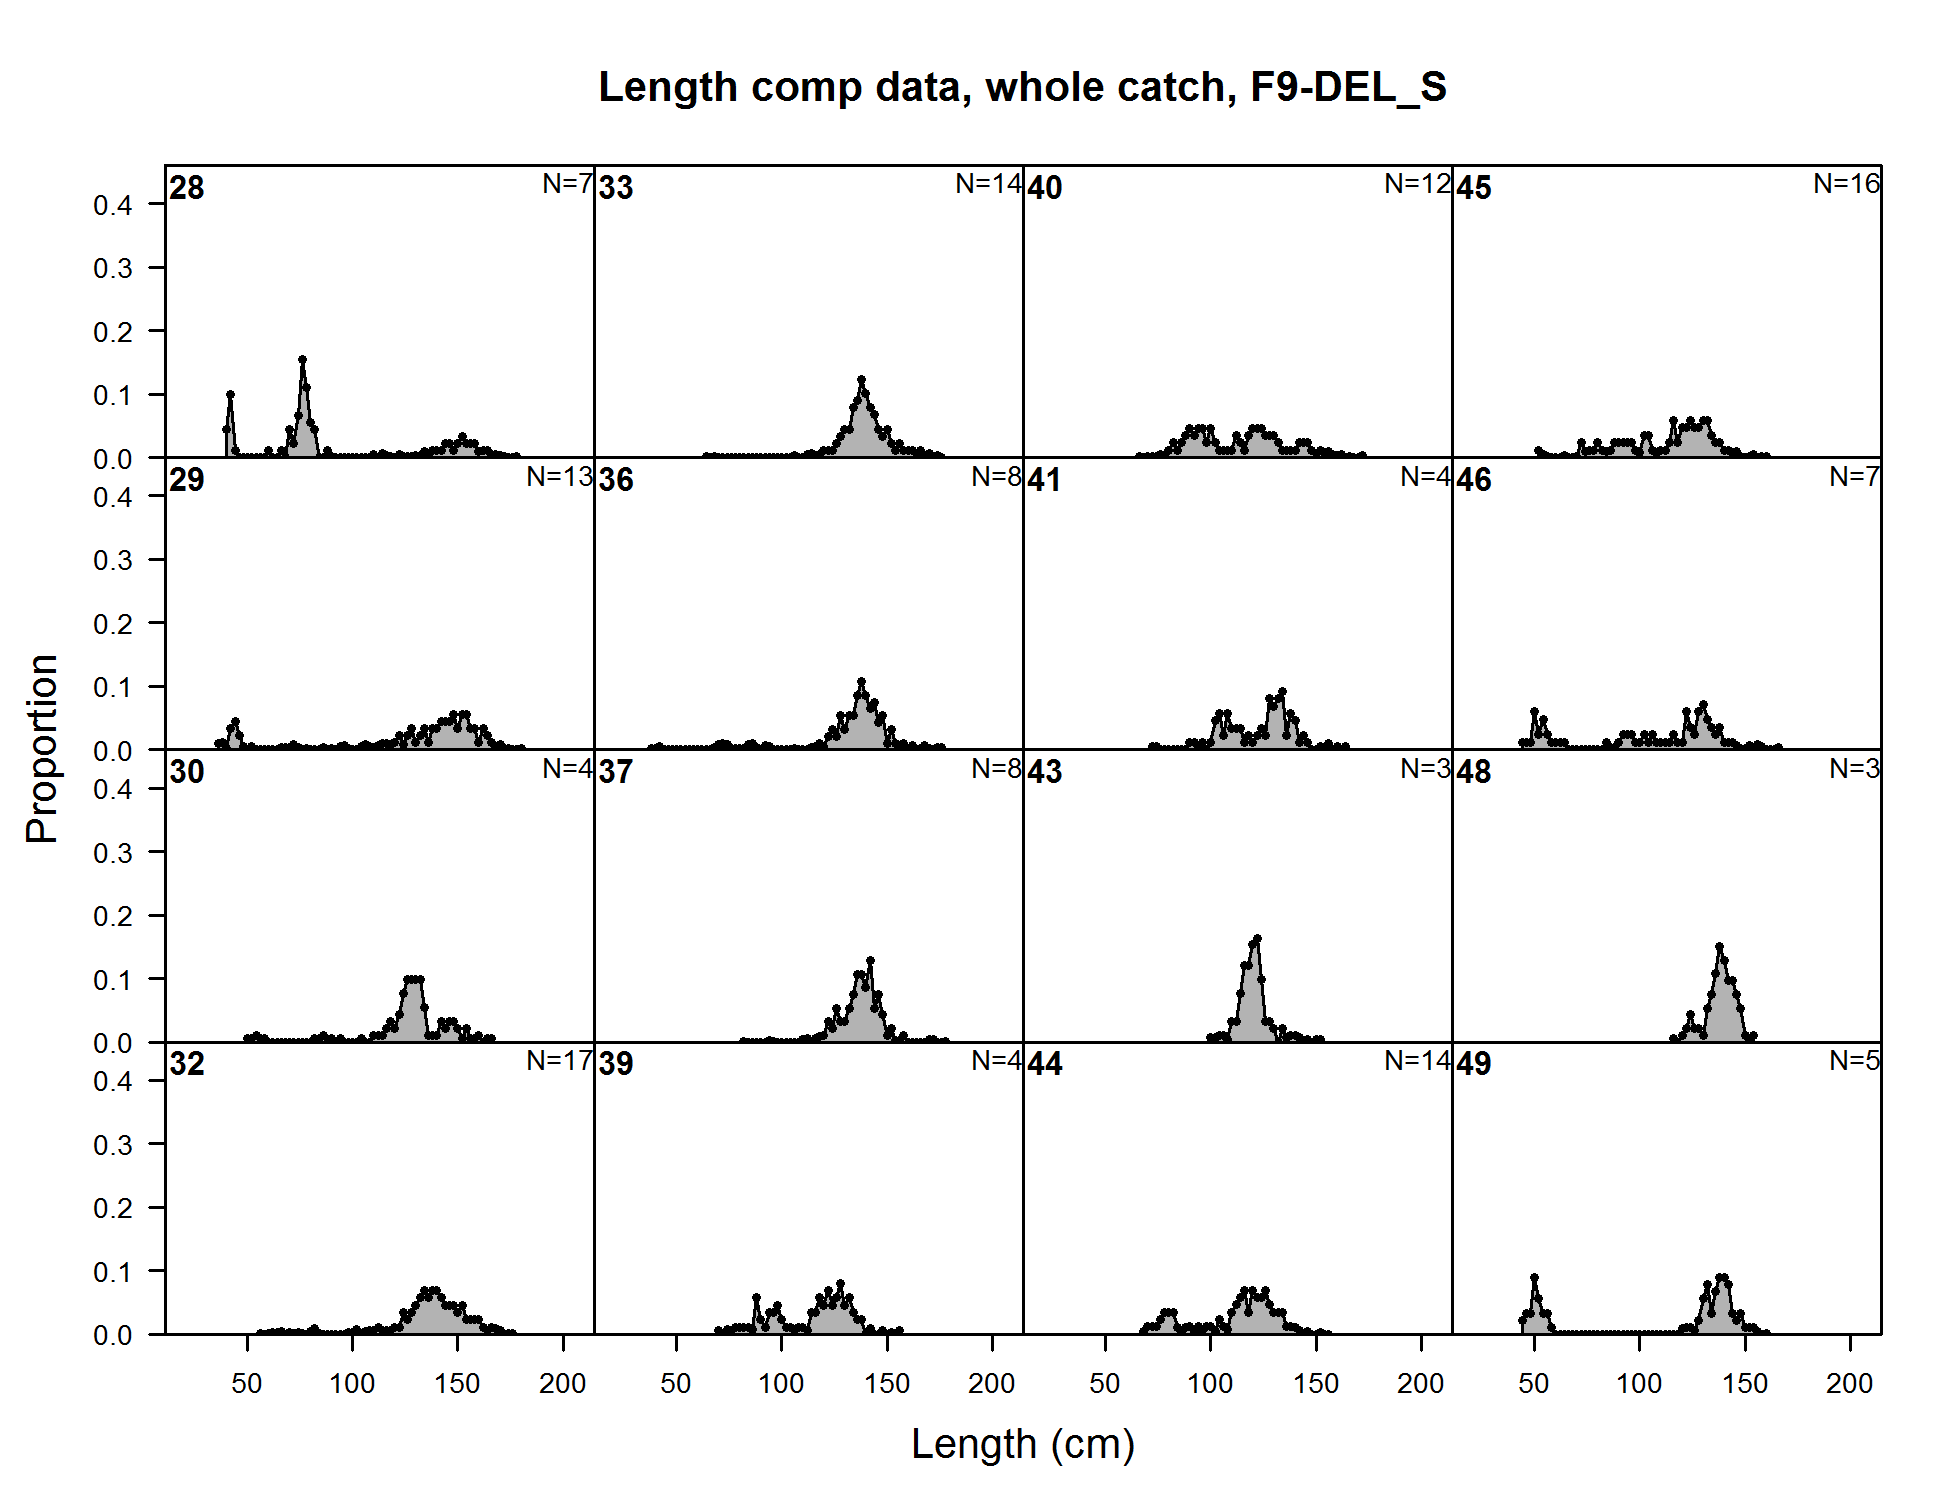
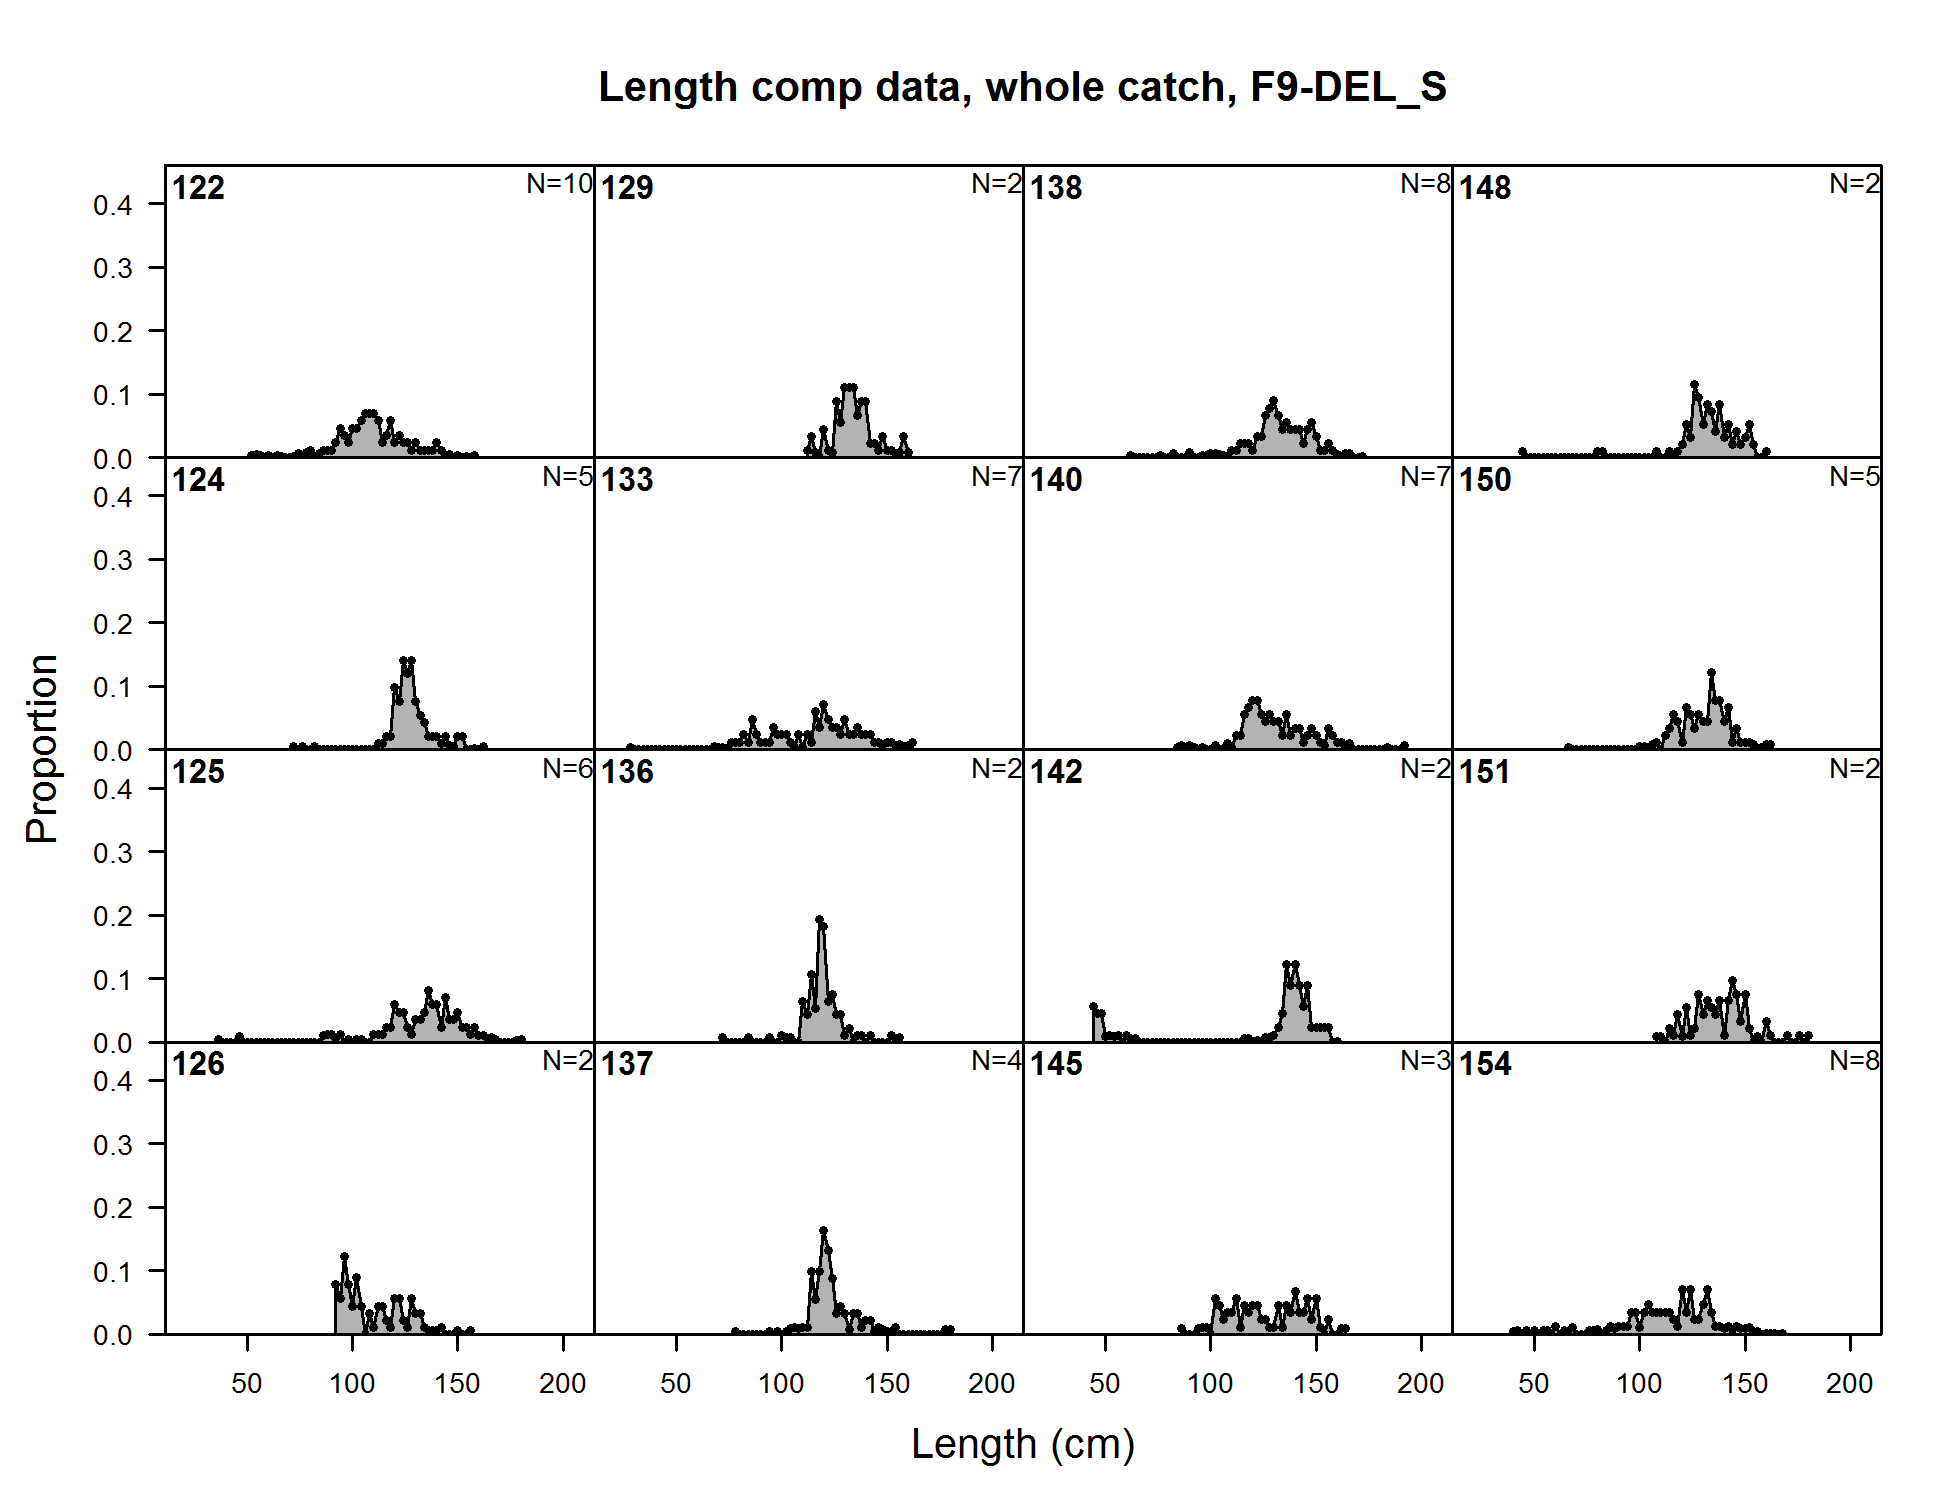
Length comp data, whole catch, F9-DEL_S (plot 1 of 7)
file: comp_lendat_flt9mkt0_page1.png
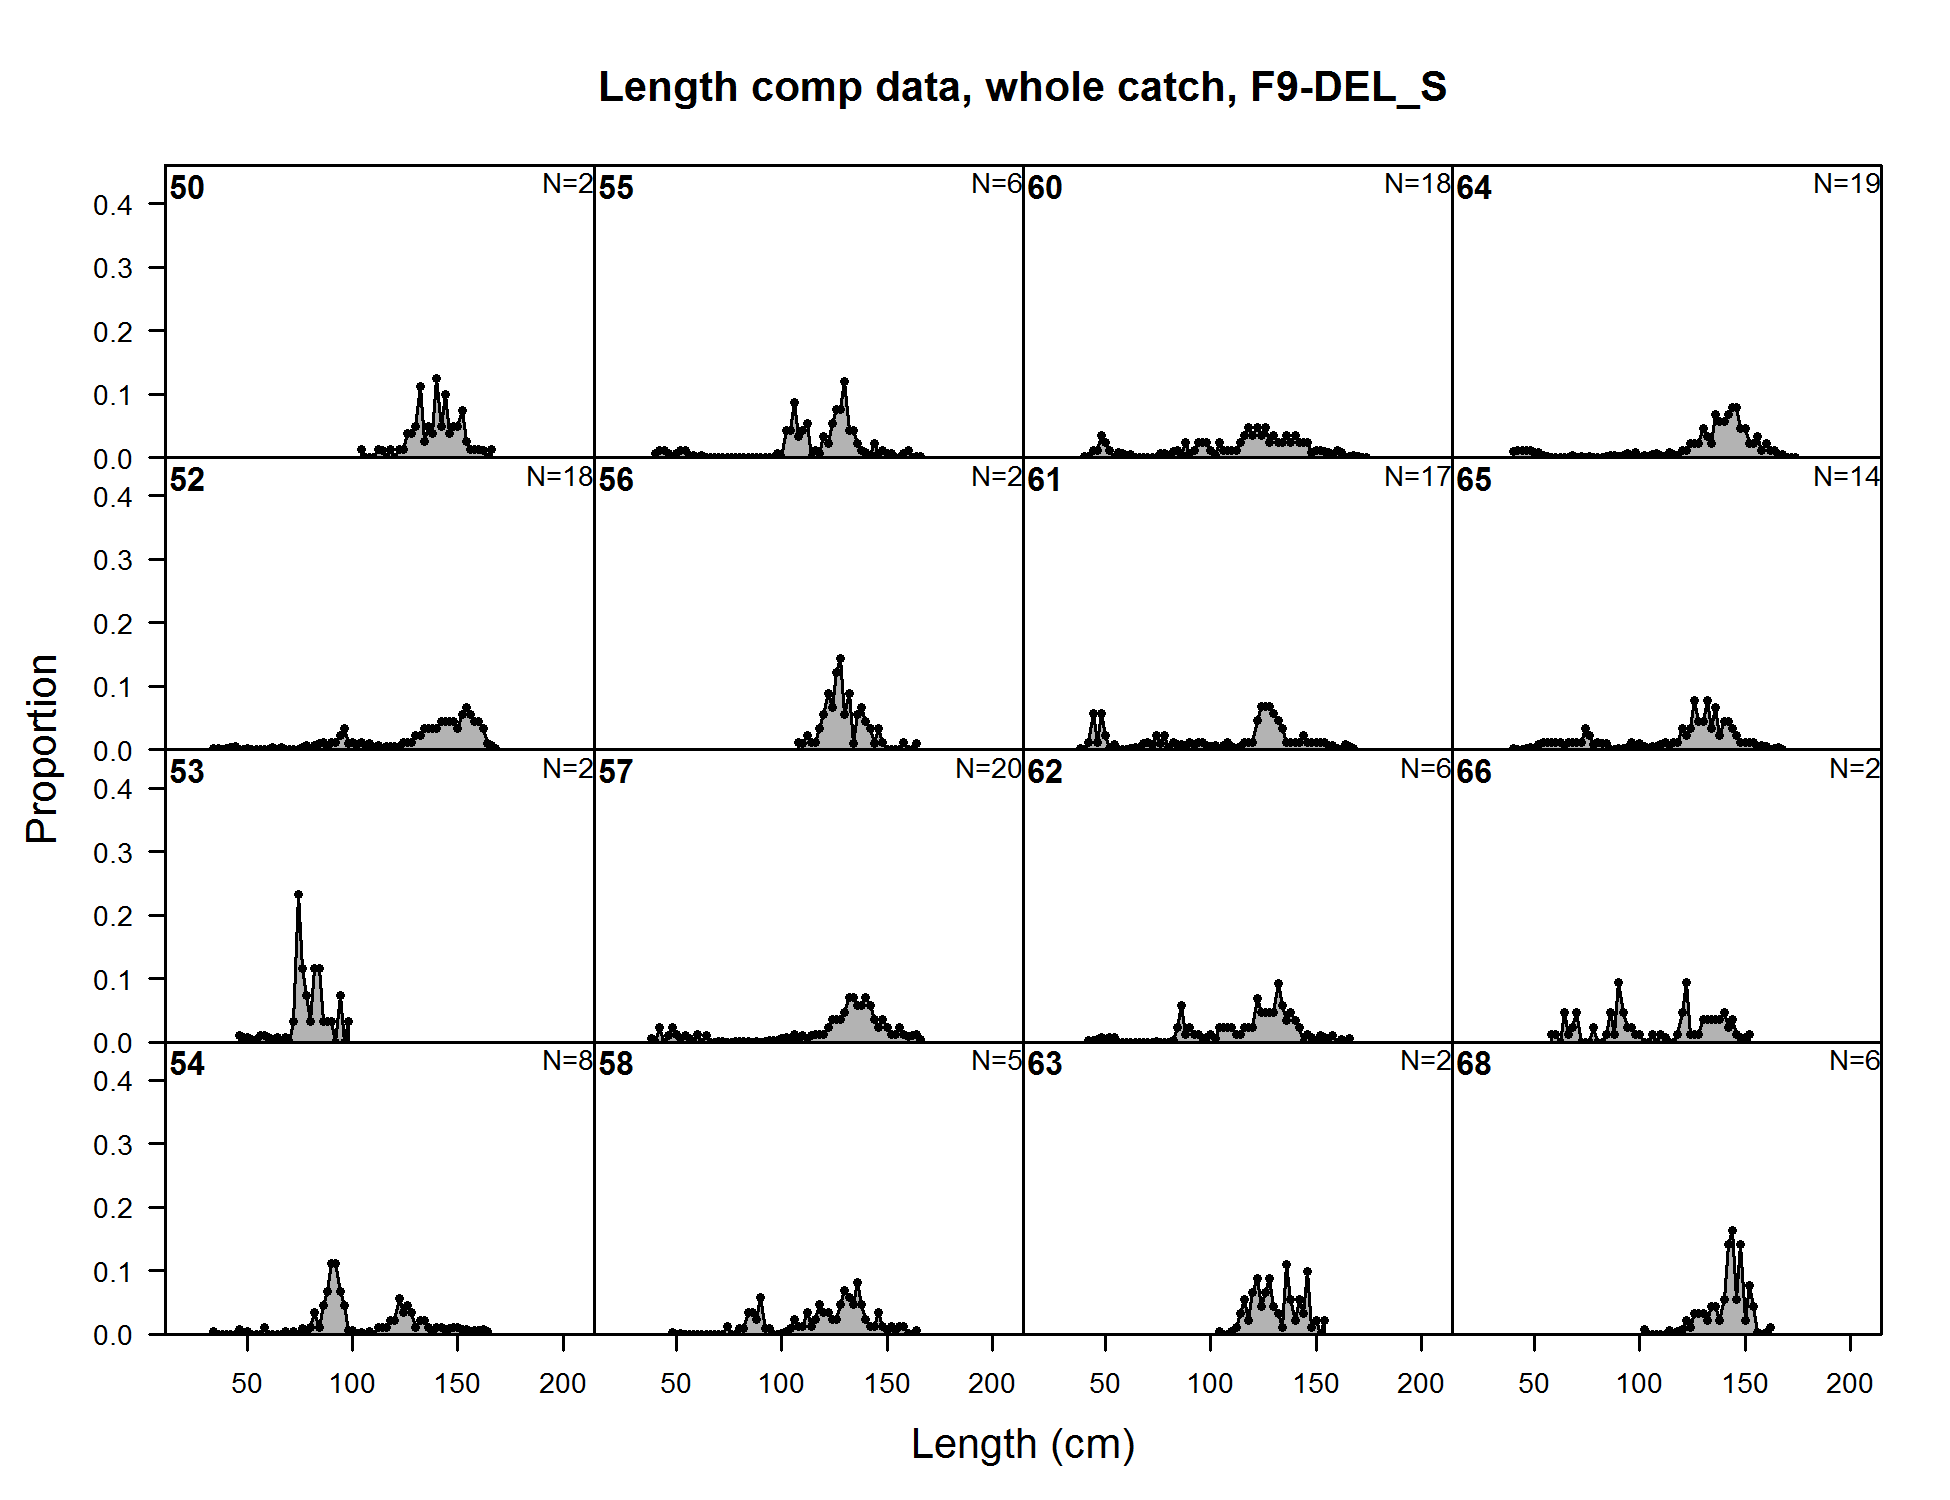
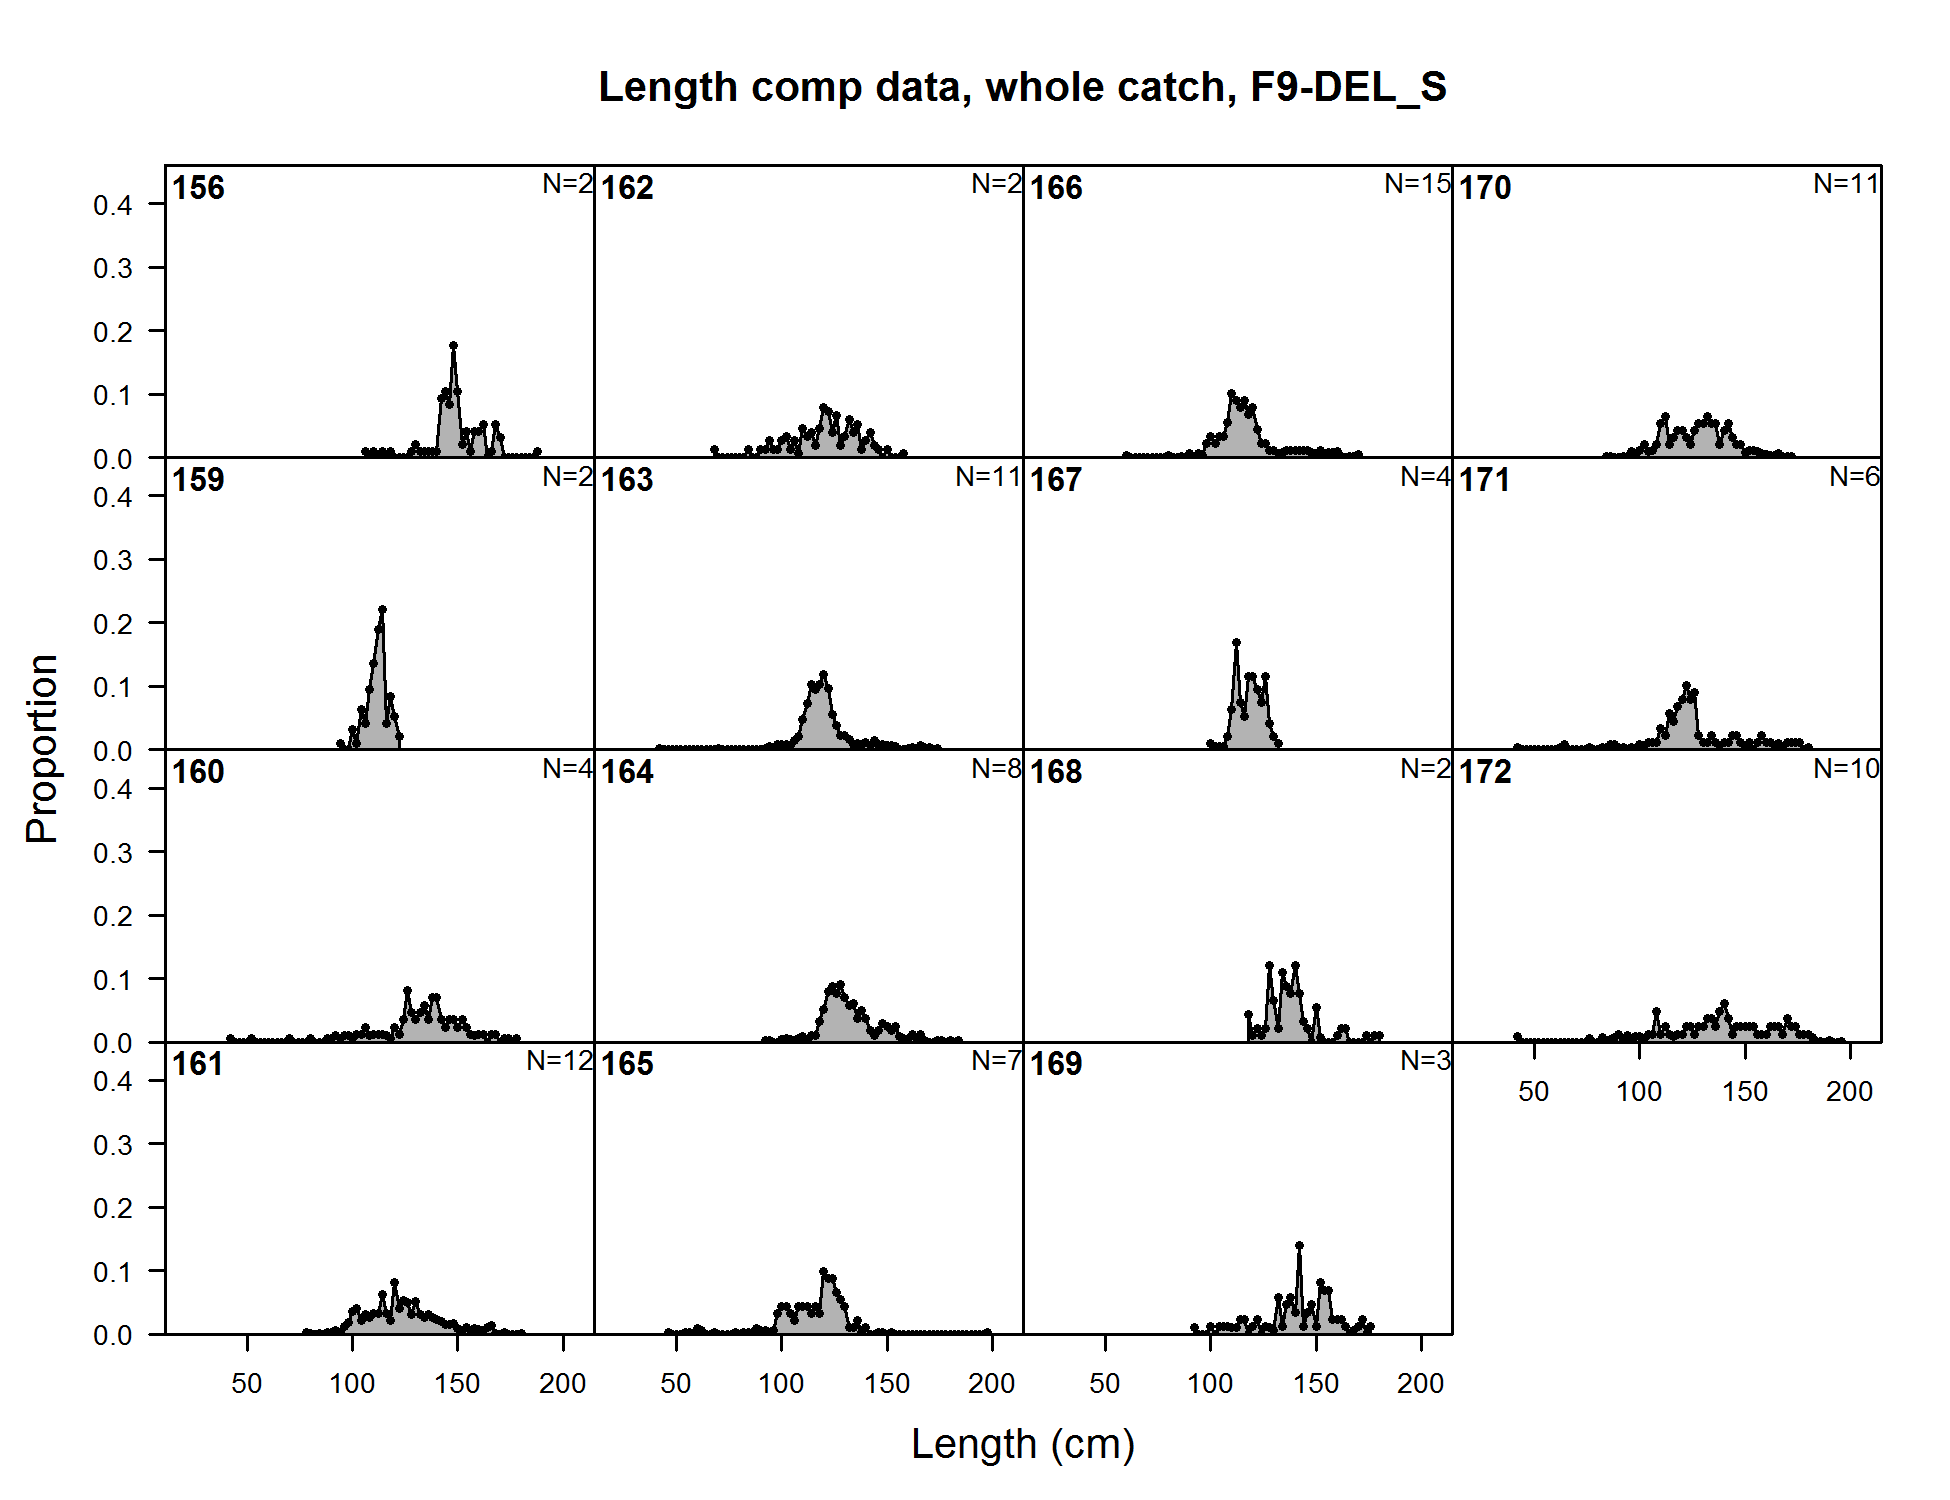
Length comp data, whole catch, F9-DEL_S (plot 1 of 7) (plot 2 of 7)
file: comp_lendat_flt9mkt0_page2.png
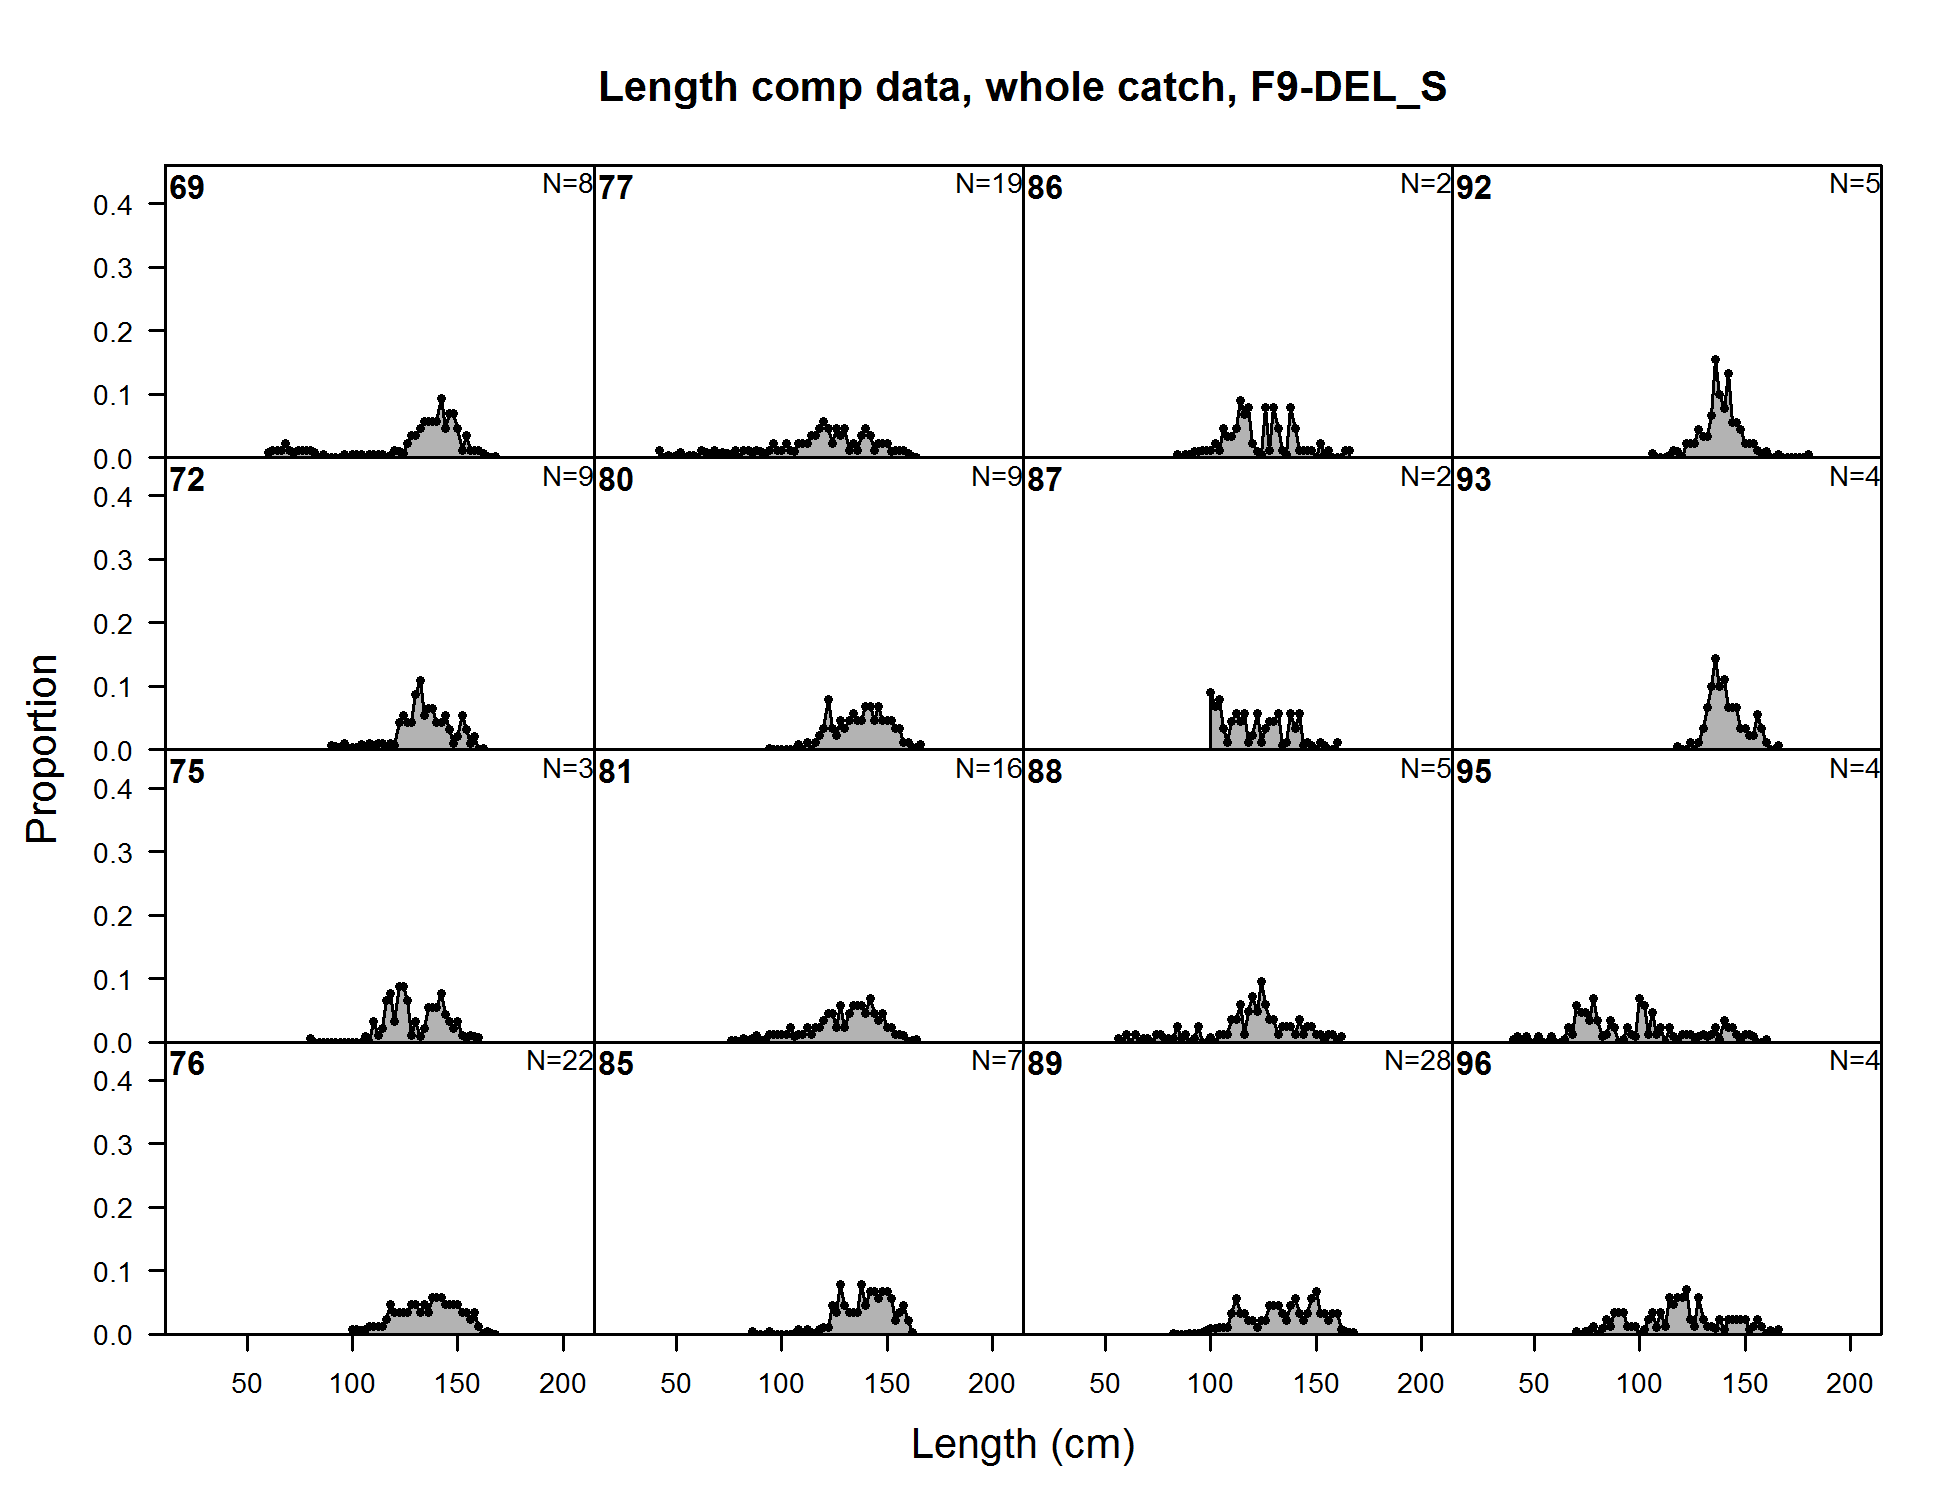
Length comp data, whole catch, F9-DEL_S (plot 1 of 7) (plot 2 of 7) (plot 3 of 7)
file: comp_lendat_flt9mkt0_page3.png
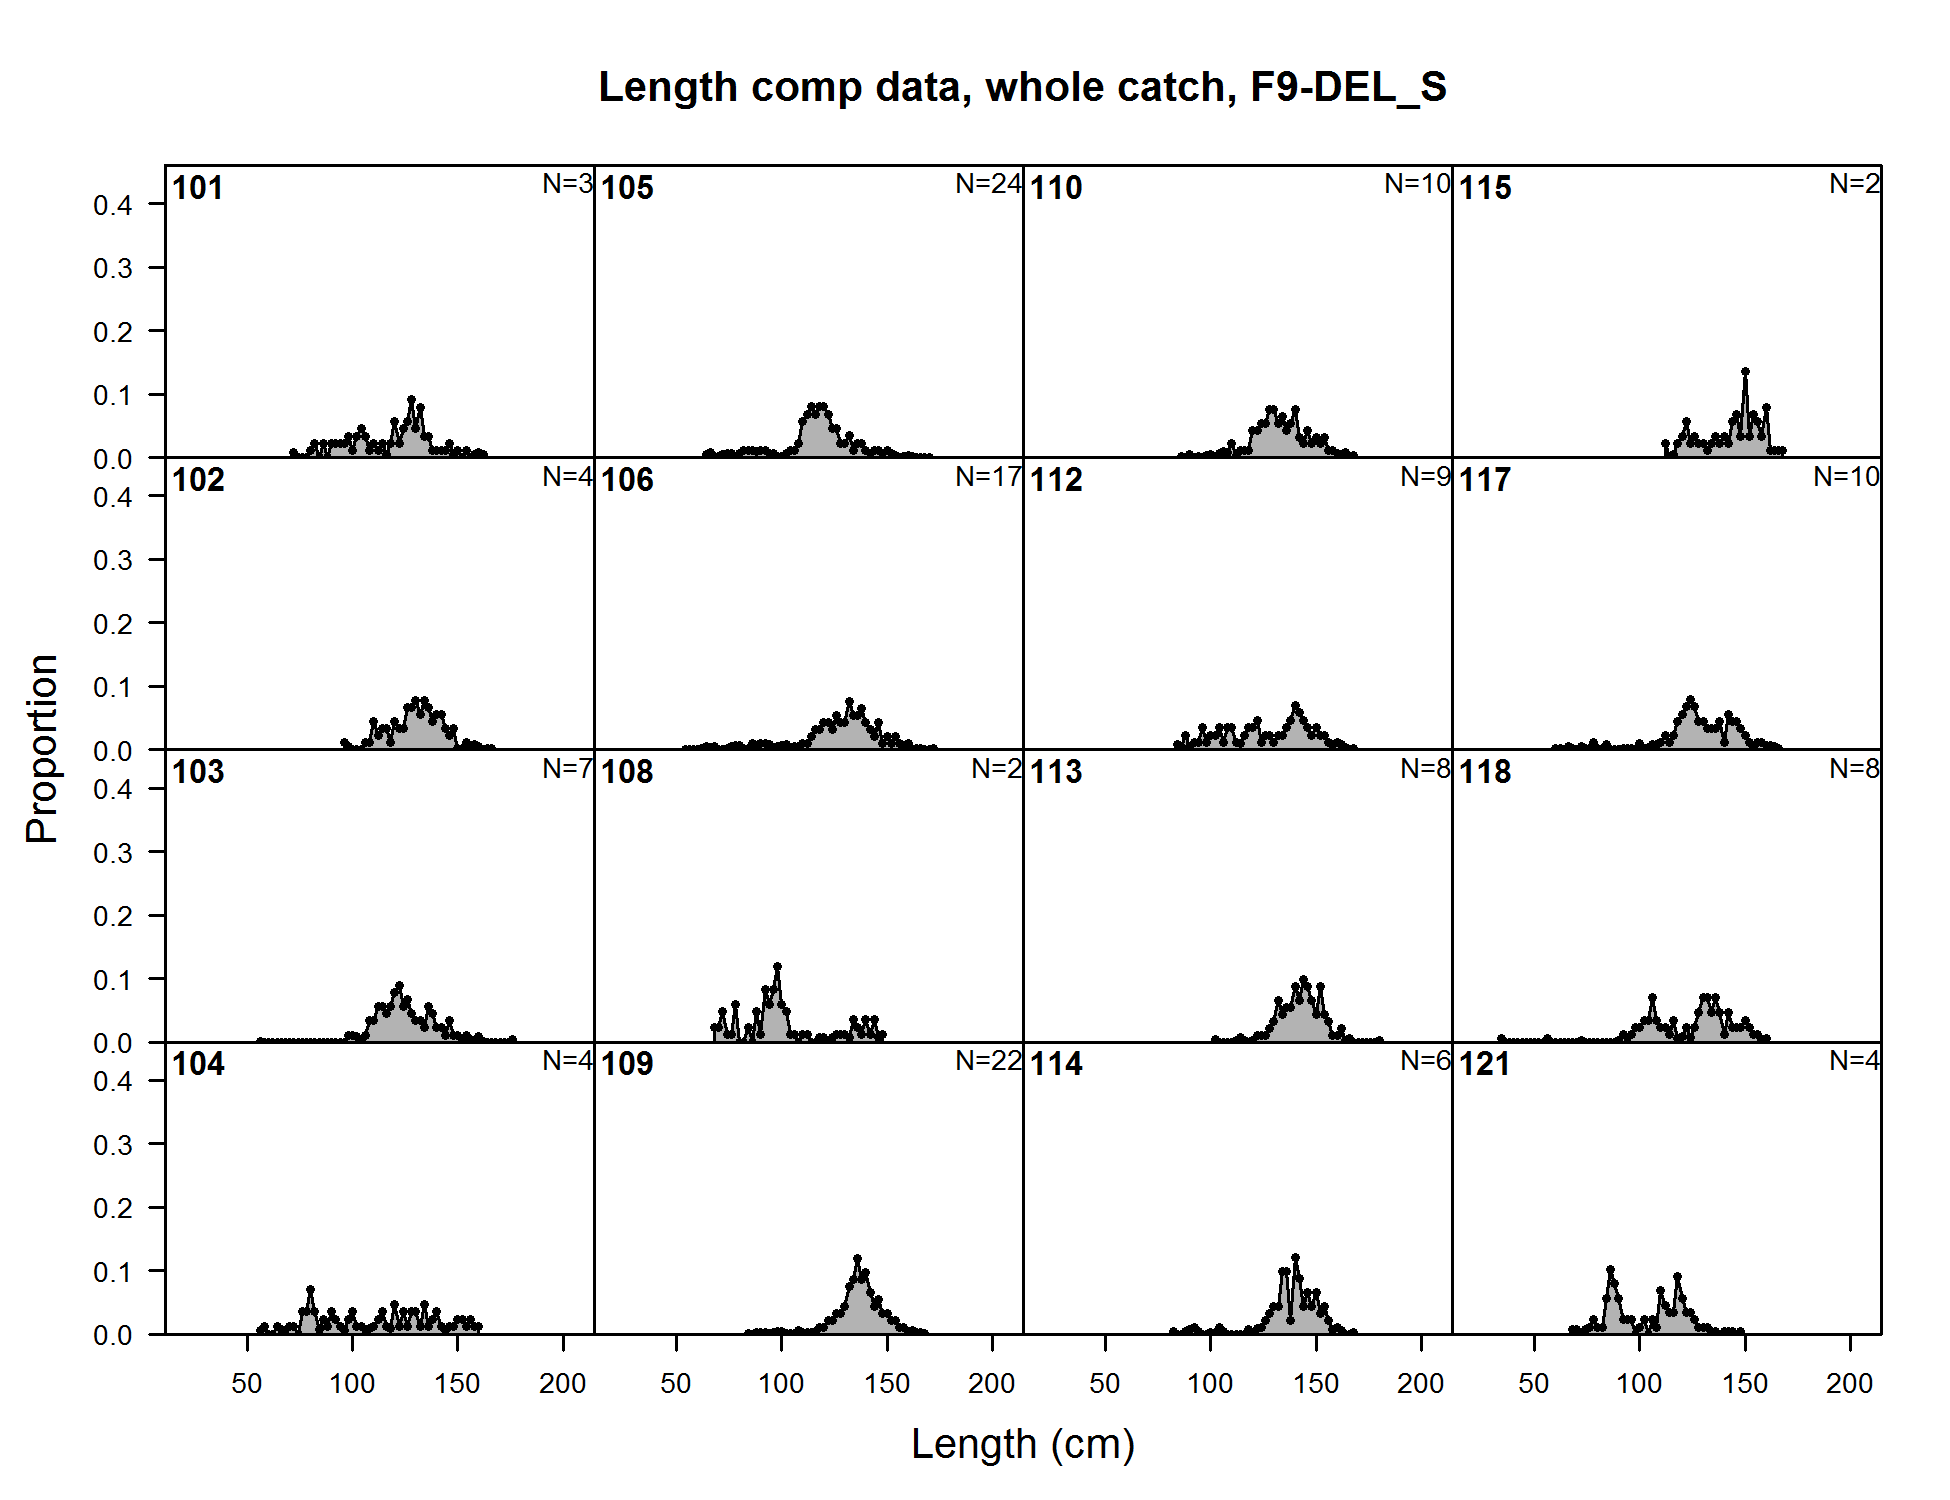
Length comp data, whole catch, F9-DEL_S (plot 1 of 7) (plot 2 of 7) (plot 3 of 7) (plot 4 of 7)
file: comp_lendat_flt9mkt0_page4.png
Length comp data, whole catch, F9-DEL_S (plot 1 of 7) (plot 2 of 7) (plot 3 of 7) (plot 4 of 7) (plot 5 of 7)
file: comp_lendat_flt9mkt0_page5.png
Length comp data, whole catch, F9-DEL_S (plot 1 of 7) (plot 2 of 7) (plot 3 of 7) (plot 4 of 7) (plot 5 of 7) (plot 6 of 7)
file: comp_lendat_flt9mkt0_page6.png
Length comp data, whole catch, F9-DEL_S (plot 1 of 7) (plot 2 of 7) (plot 3 of 7) (plot 4 of 7) (plot 5 of 7) (plot 6 of 7) (plot 7 of 7)
file: comp_lendat_flt9mkt0_page7.png
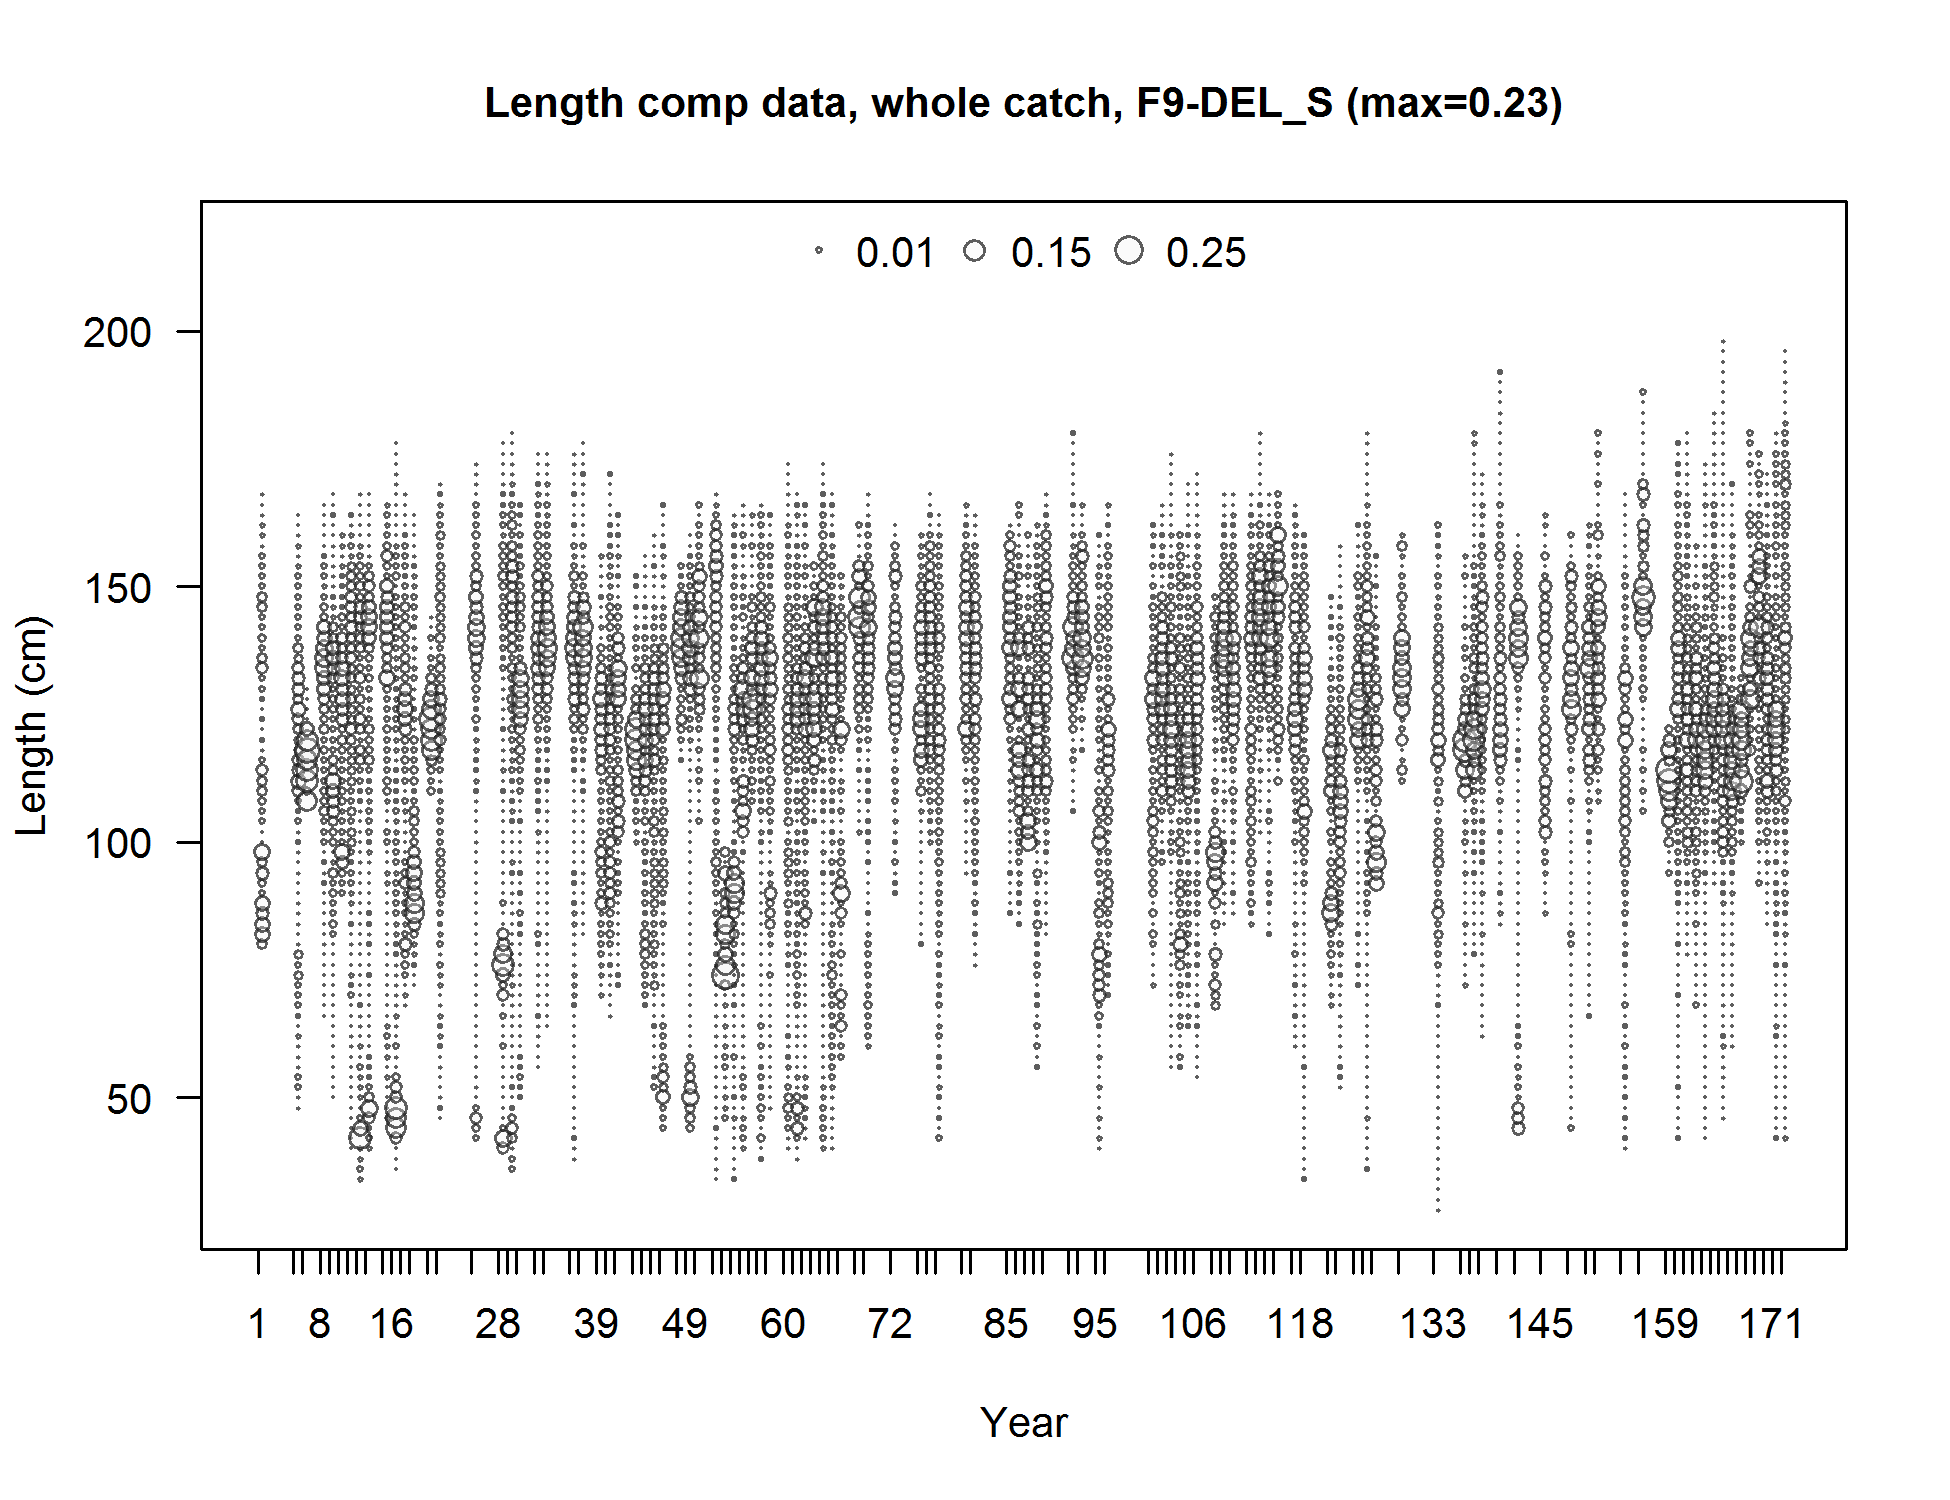
Length comp data, whole catch, F9-DEL_S (max=0.23) (plot 7 of 7)
file: comp_lendat_bubflt9mkt0_page7.png
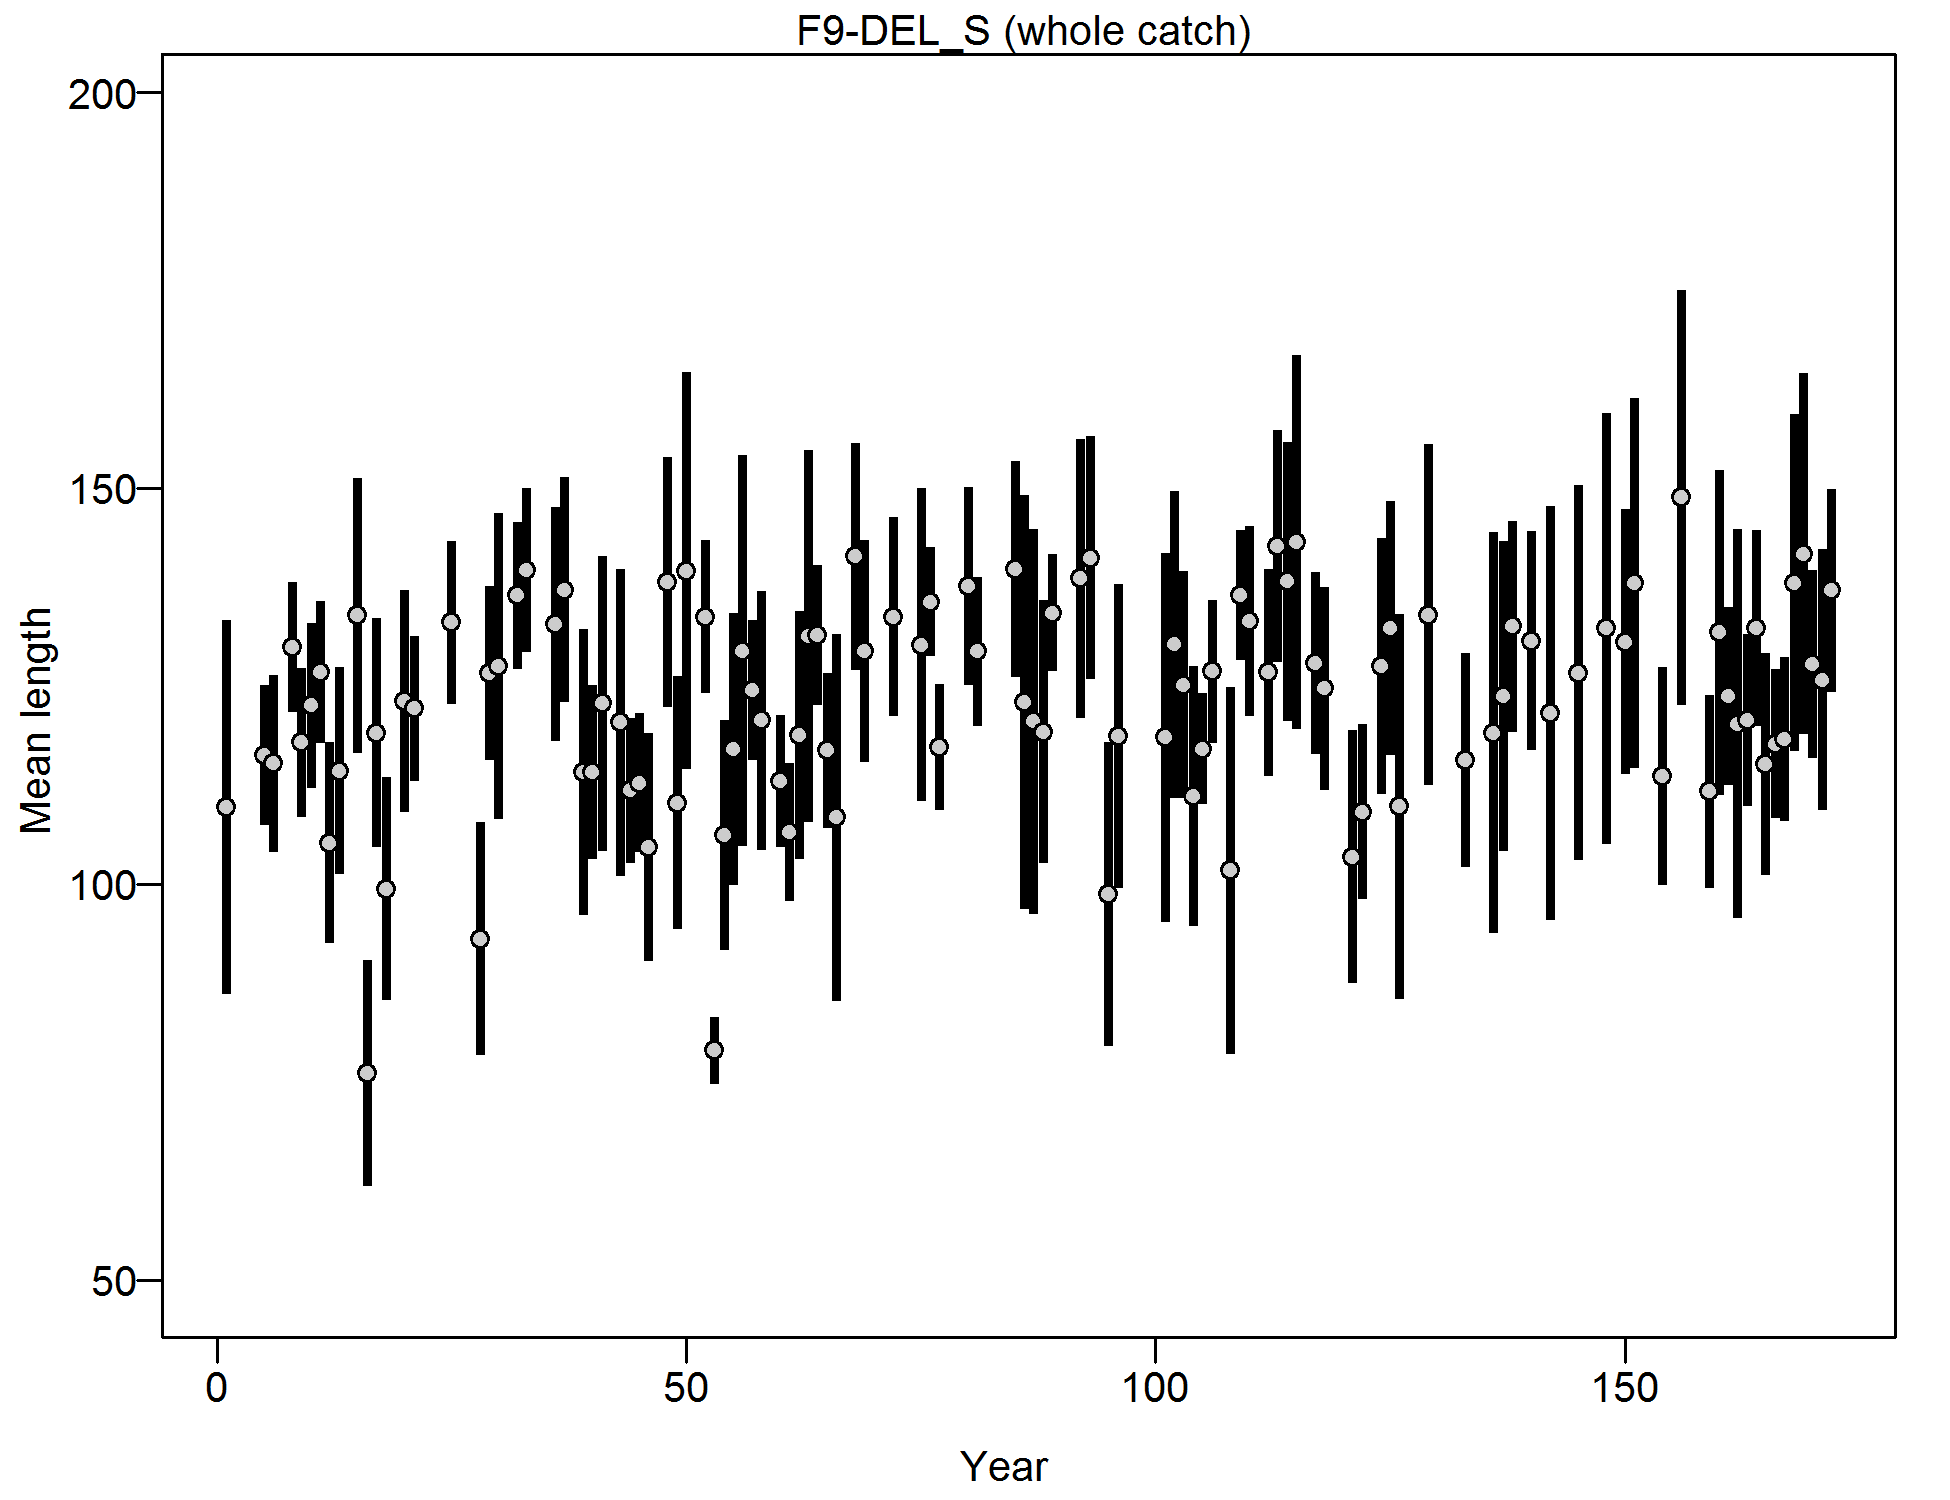
Mean length for F9-DEL_S with 95% confidence intervals based on current samples sizes.
file: comp_lendat_data_weighting_TA1.8_F9-DEL_S.png
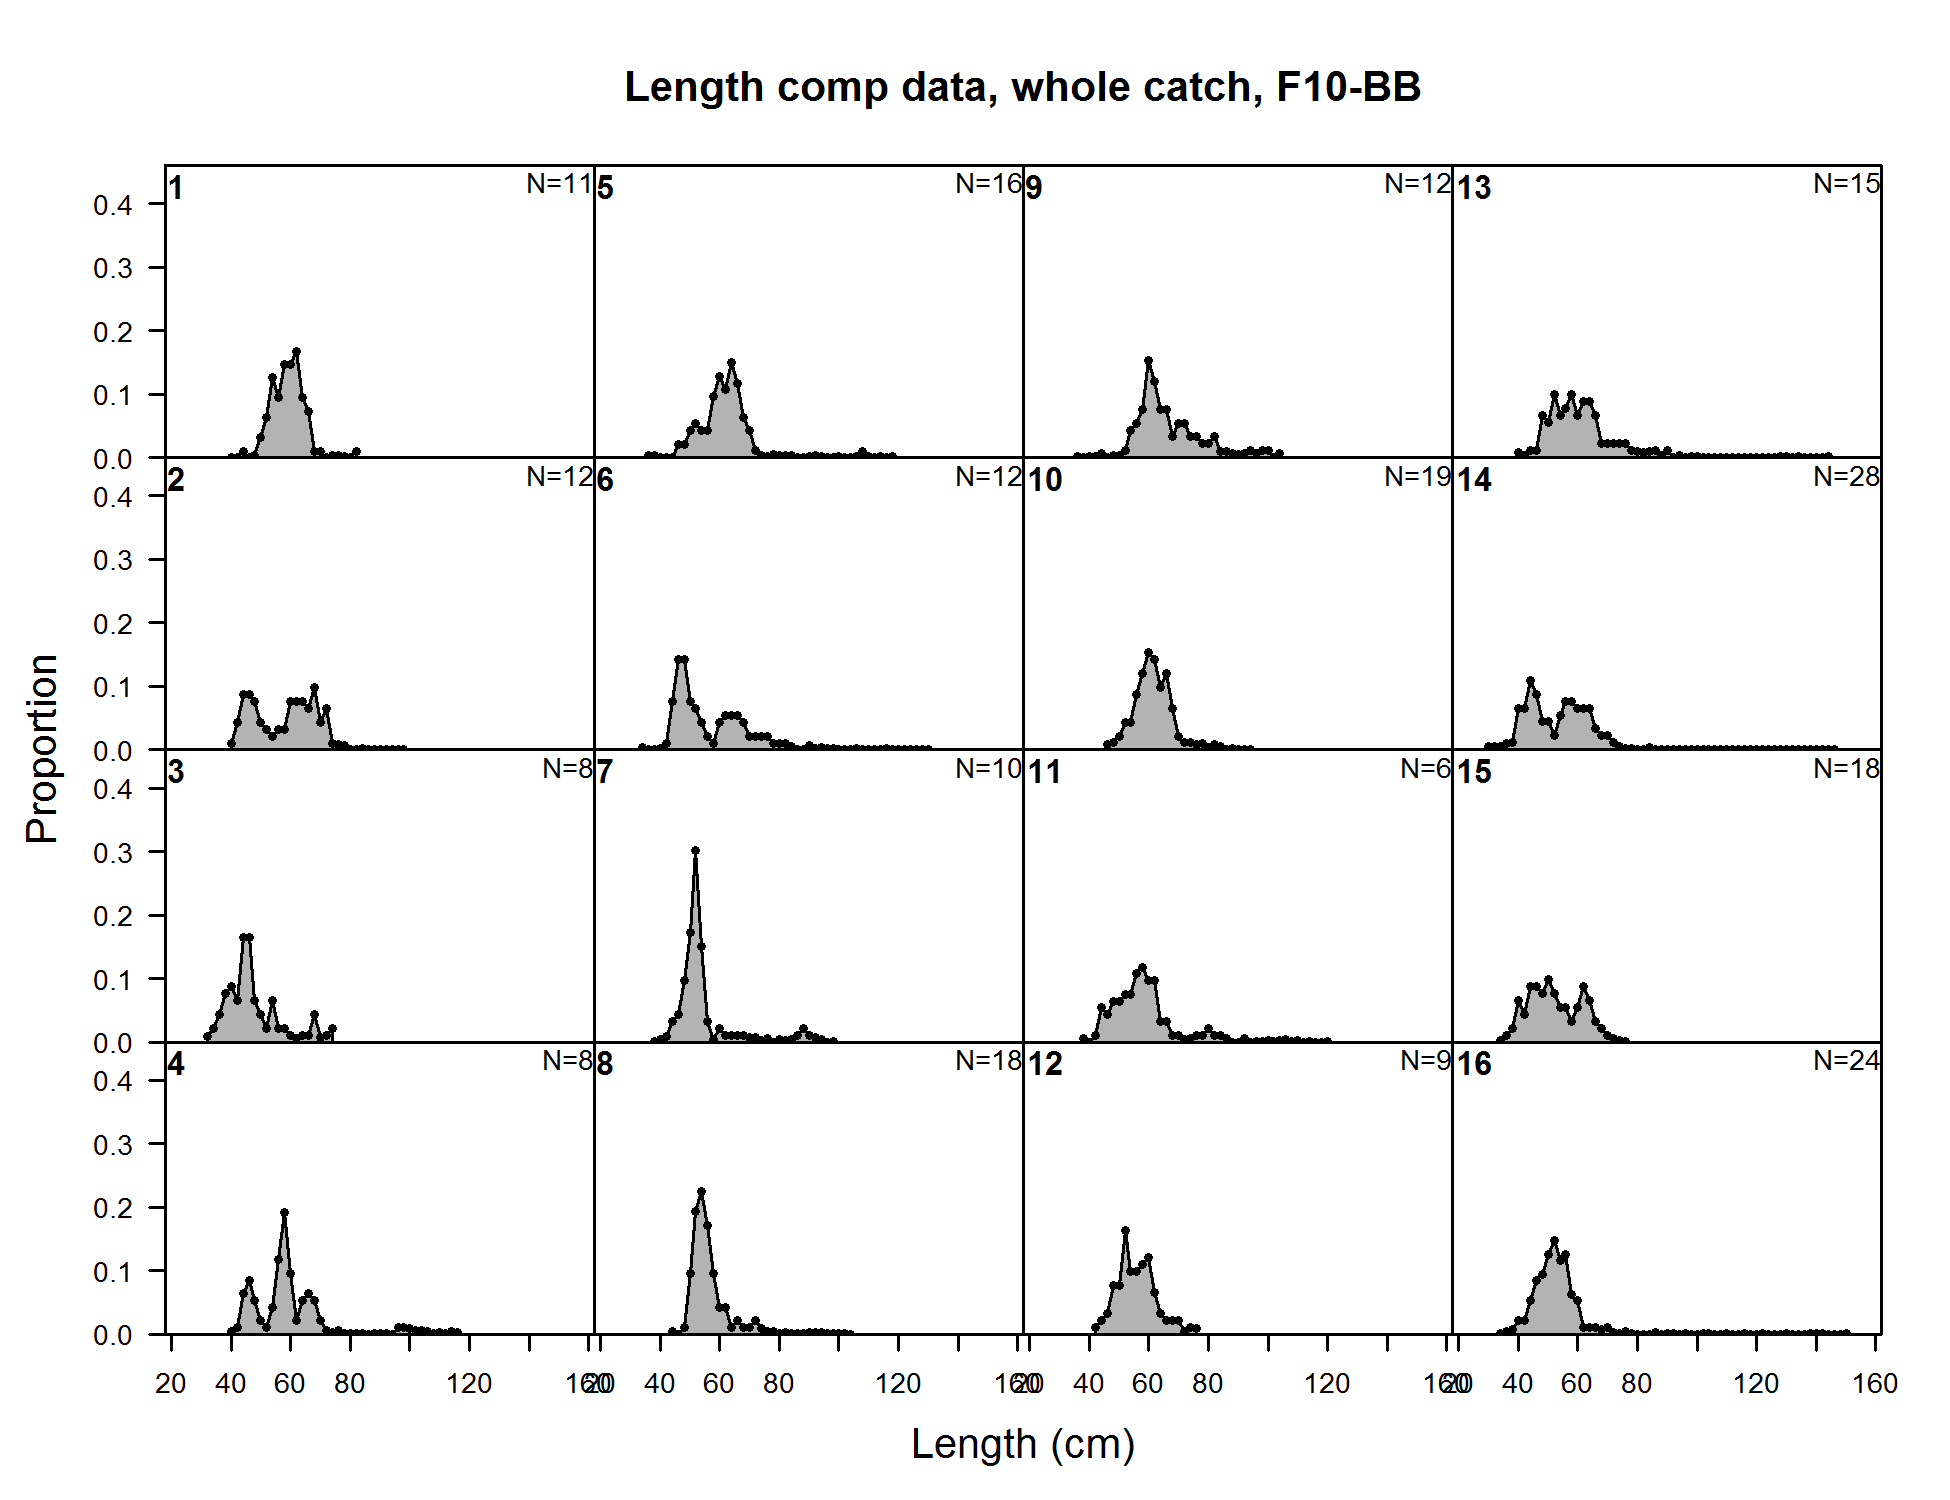
Length comp data, whole catch, F10-BB (plot 1 of 6)
file: comp_lendat_flt10mkt0_page1.png

Length comp data, whole catch, F10-BB (plot 1 of 6) (plot 2 of 6)
file: comp_lendat_flt10mkt0_page2.png
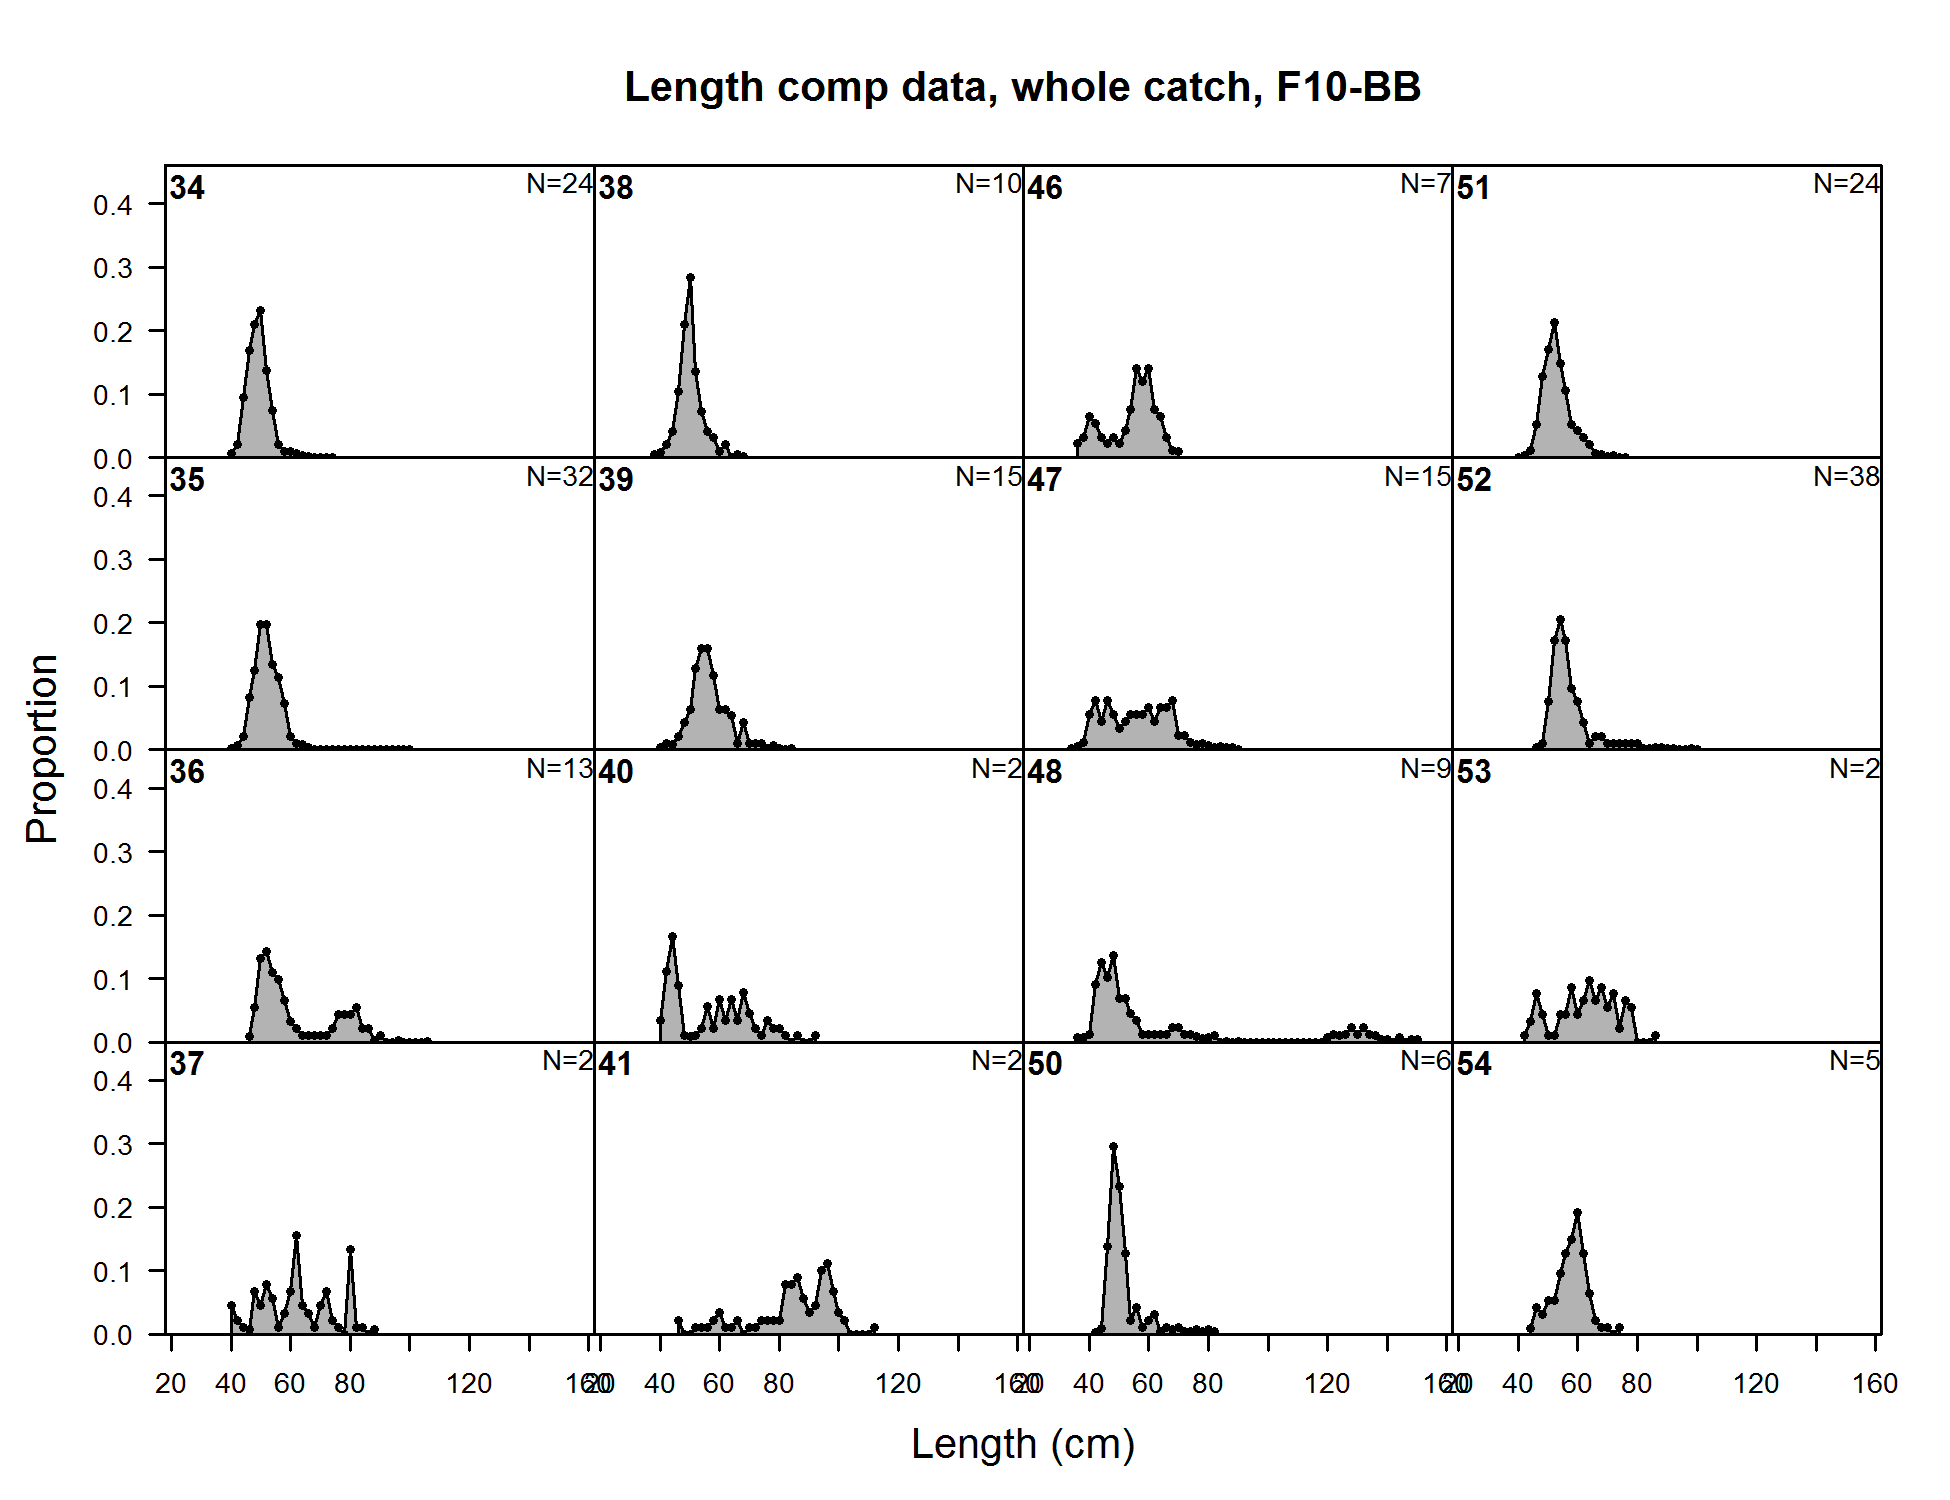
Length comp data, whole catch, F10-BB (plot 1 of 6) (plot 2 of 6) (plot 3 of 6)
file: comp_lendat_flt10mkt0_page3.png
Length comp data, whole catch, F10-BB (plot 1 of 6) (plot 2 of 6) (plot 3 of 6) (plot 4 of 6)
file: comp_lendat_flt10mkt0_page4.png
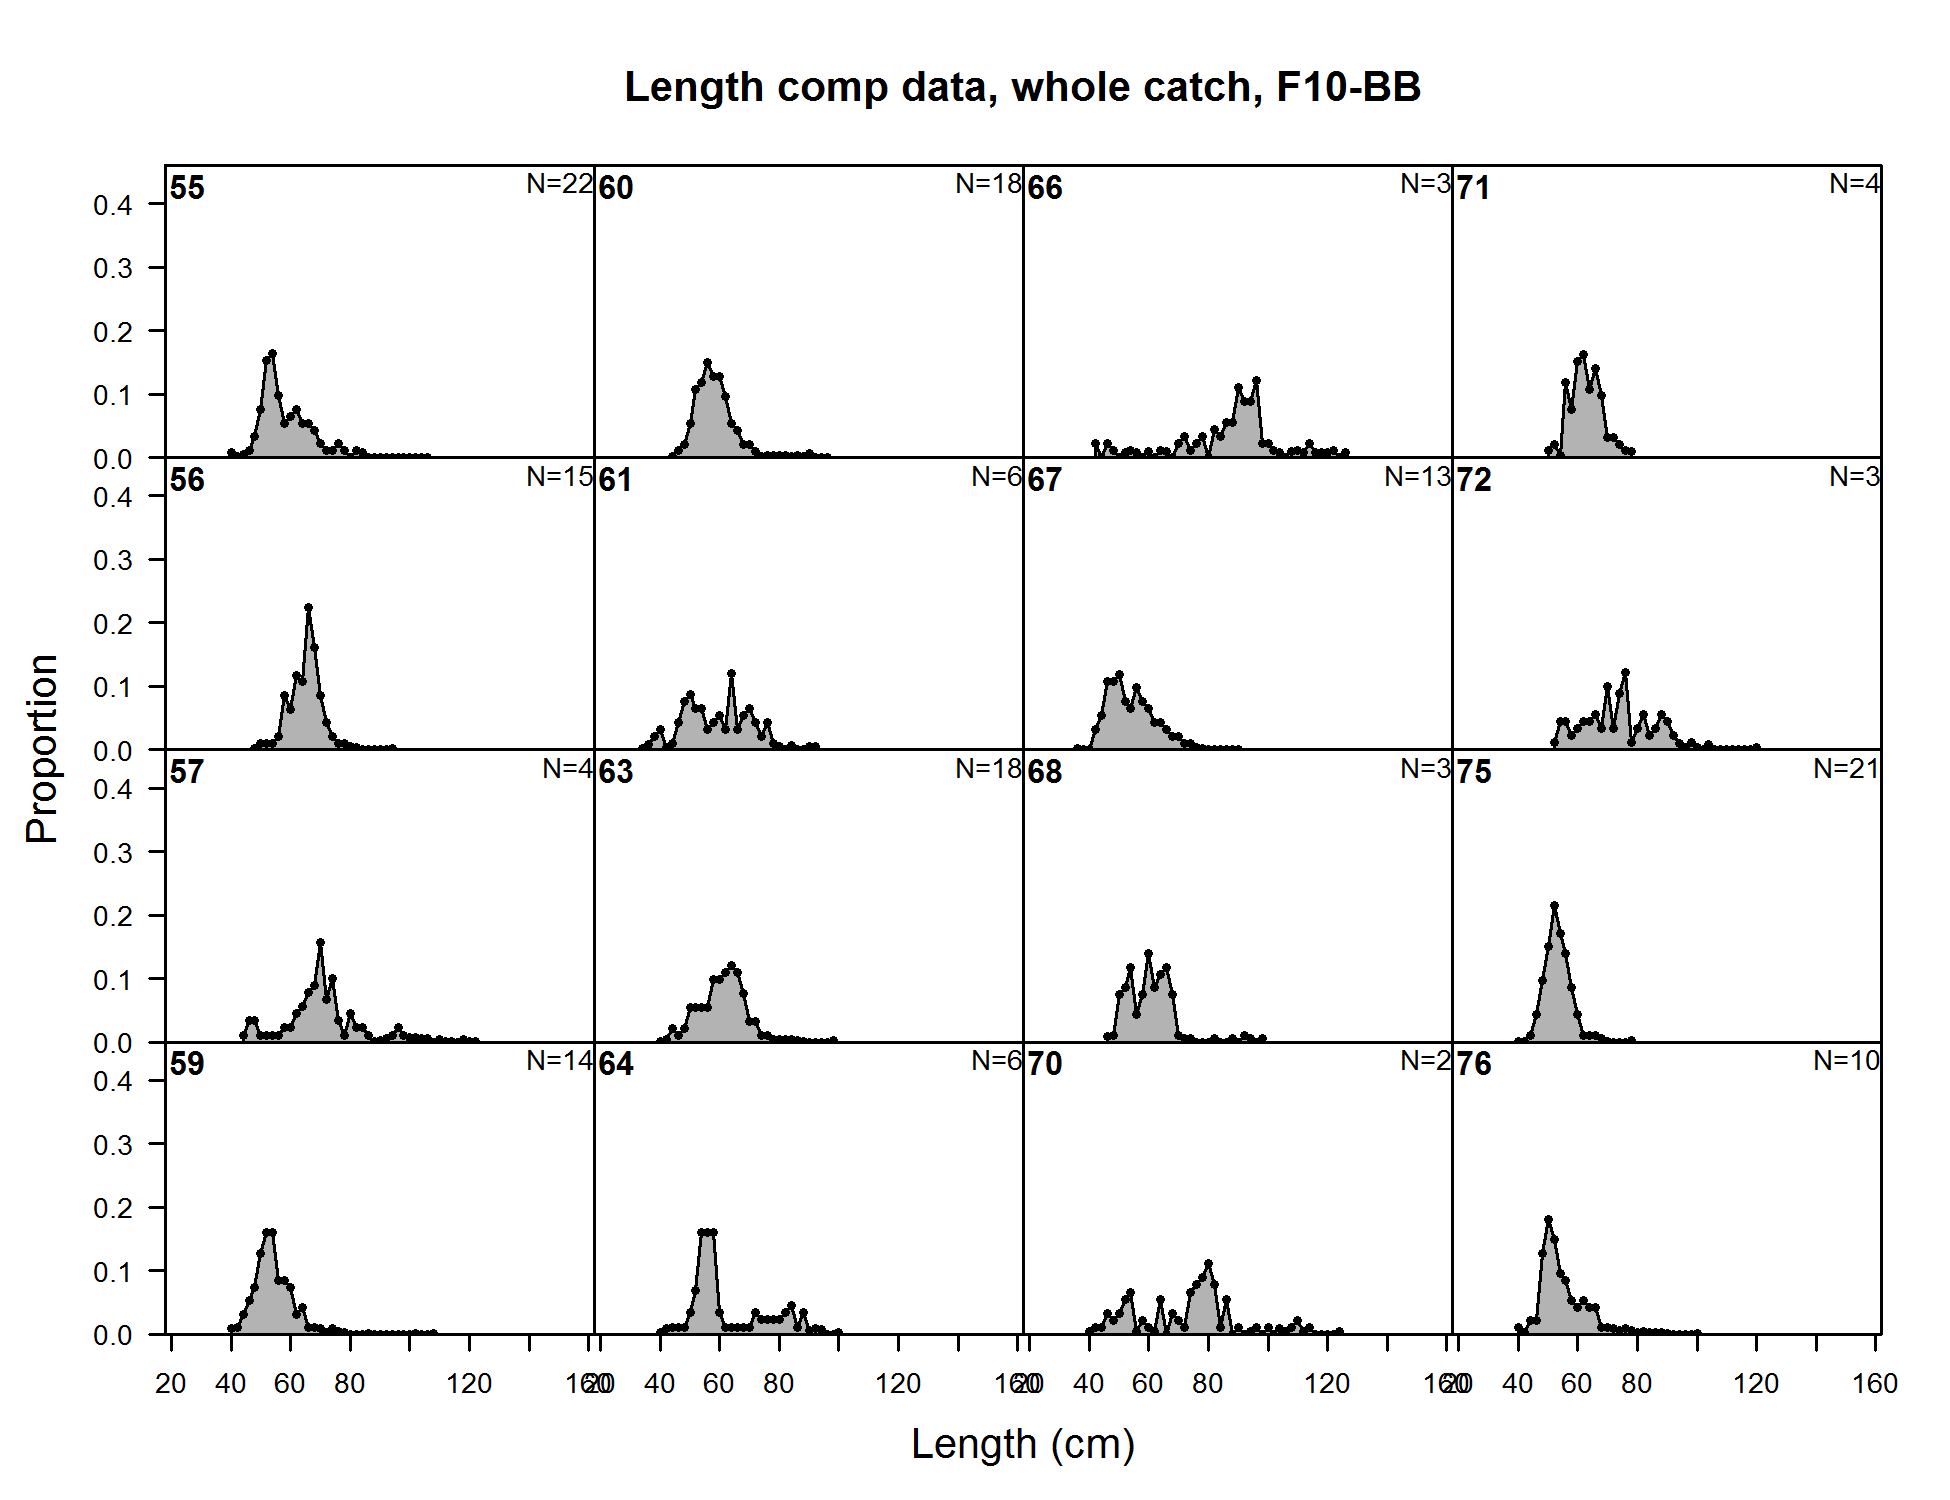
Length comp data, whole catch, F10-BB (plot 1 of 6) (plot 2 of 6) (plot 3 of 6) (plot 4 of 6) (plot 5 of 6)
file: comp_lendat_flt10mkt0_page5.png
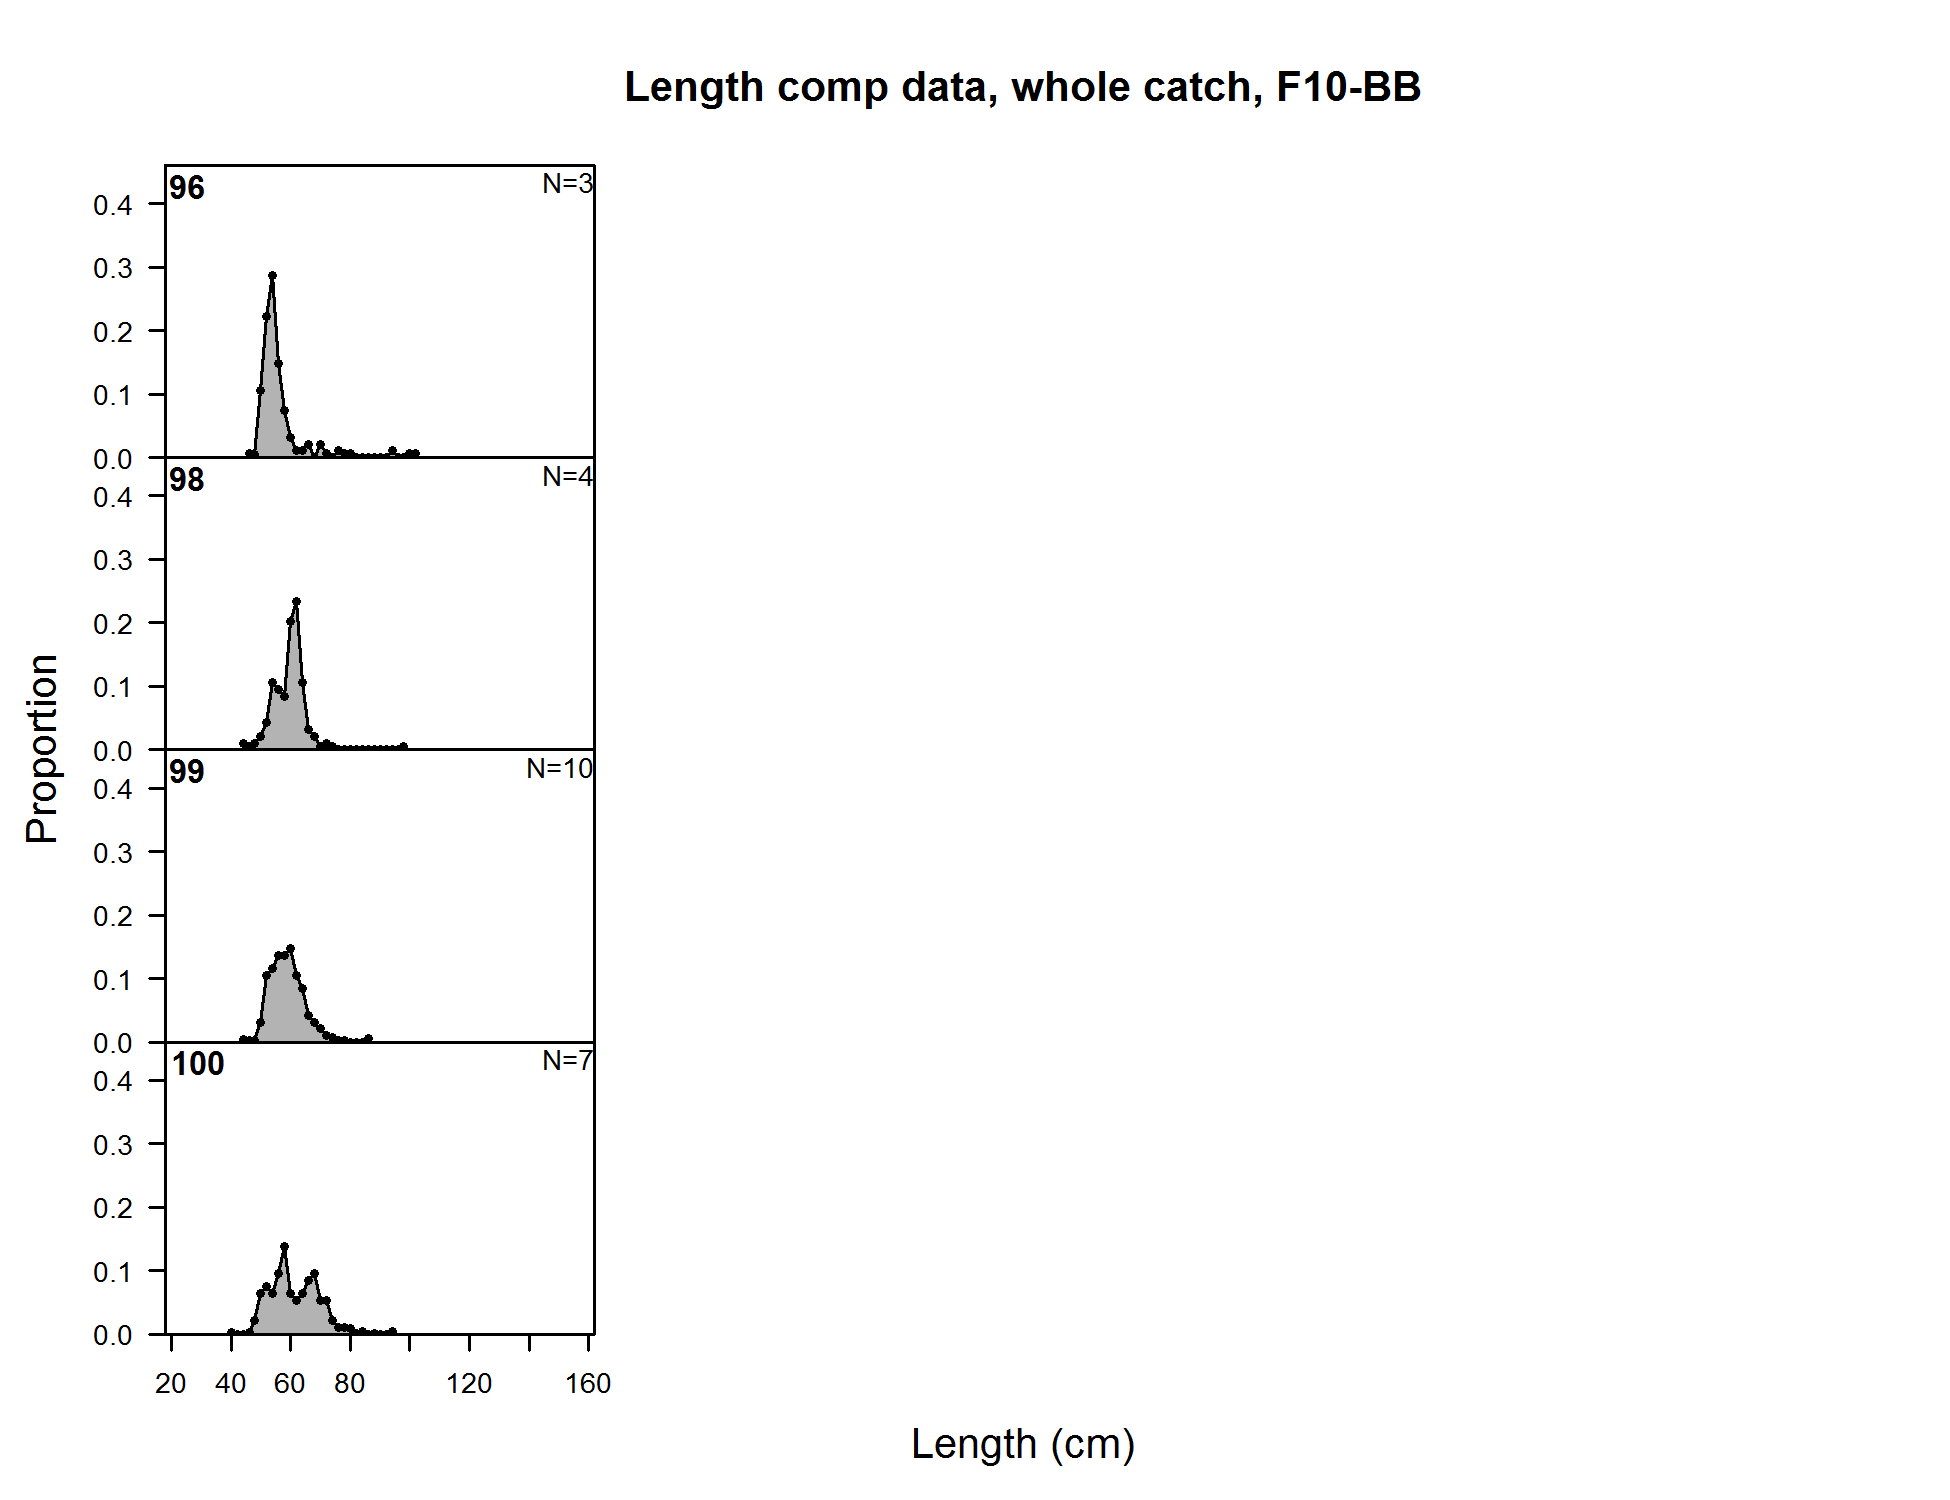
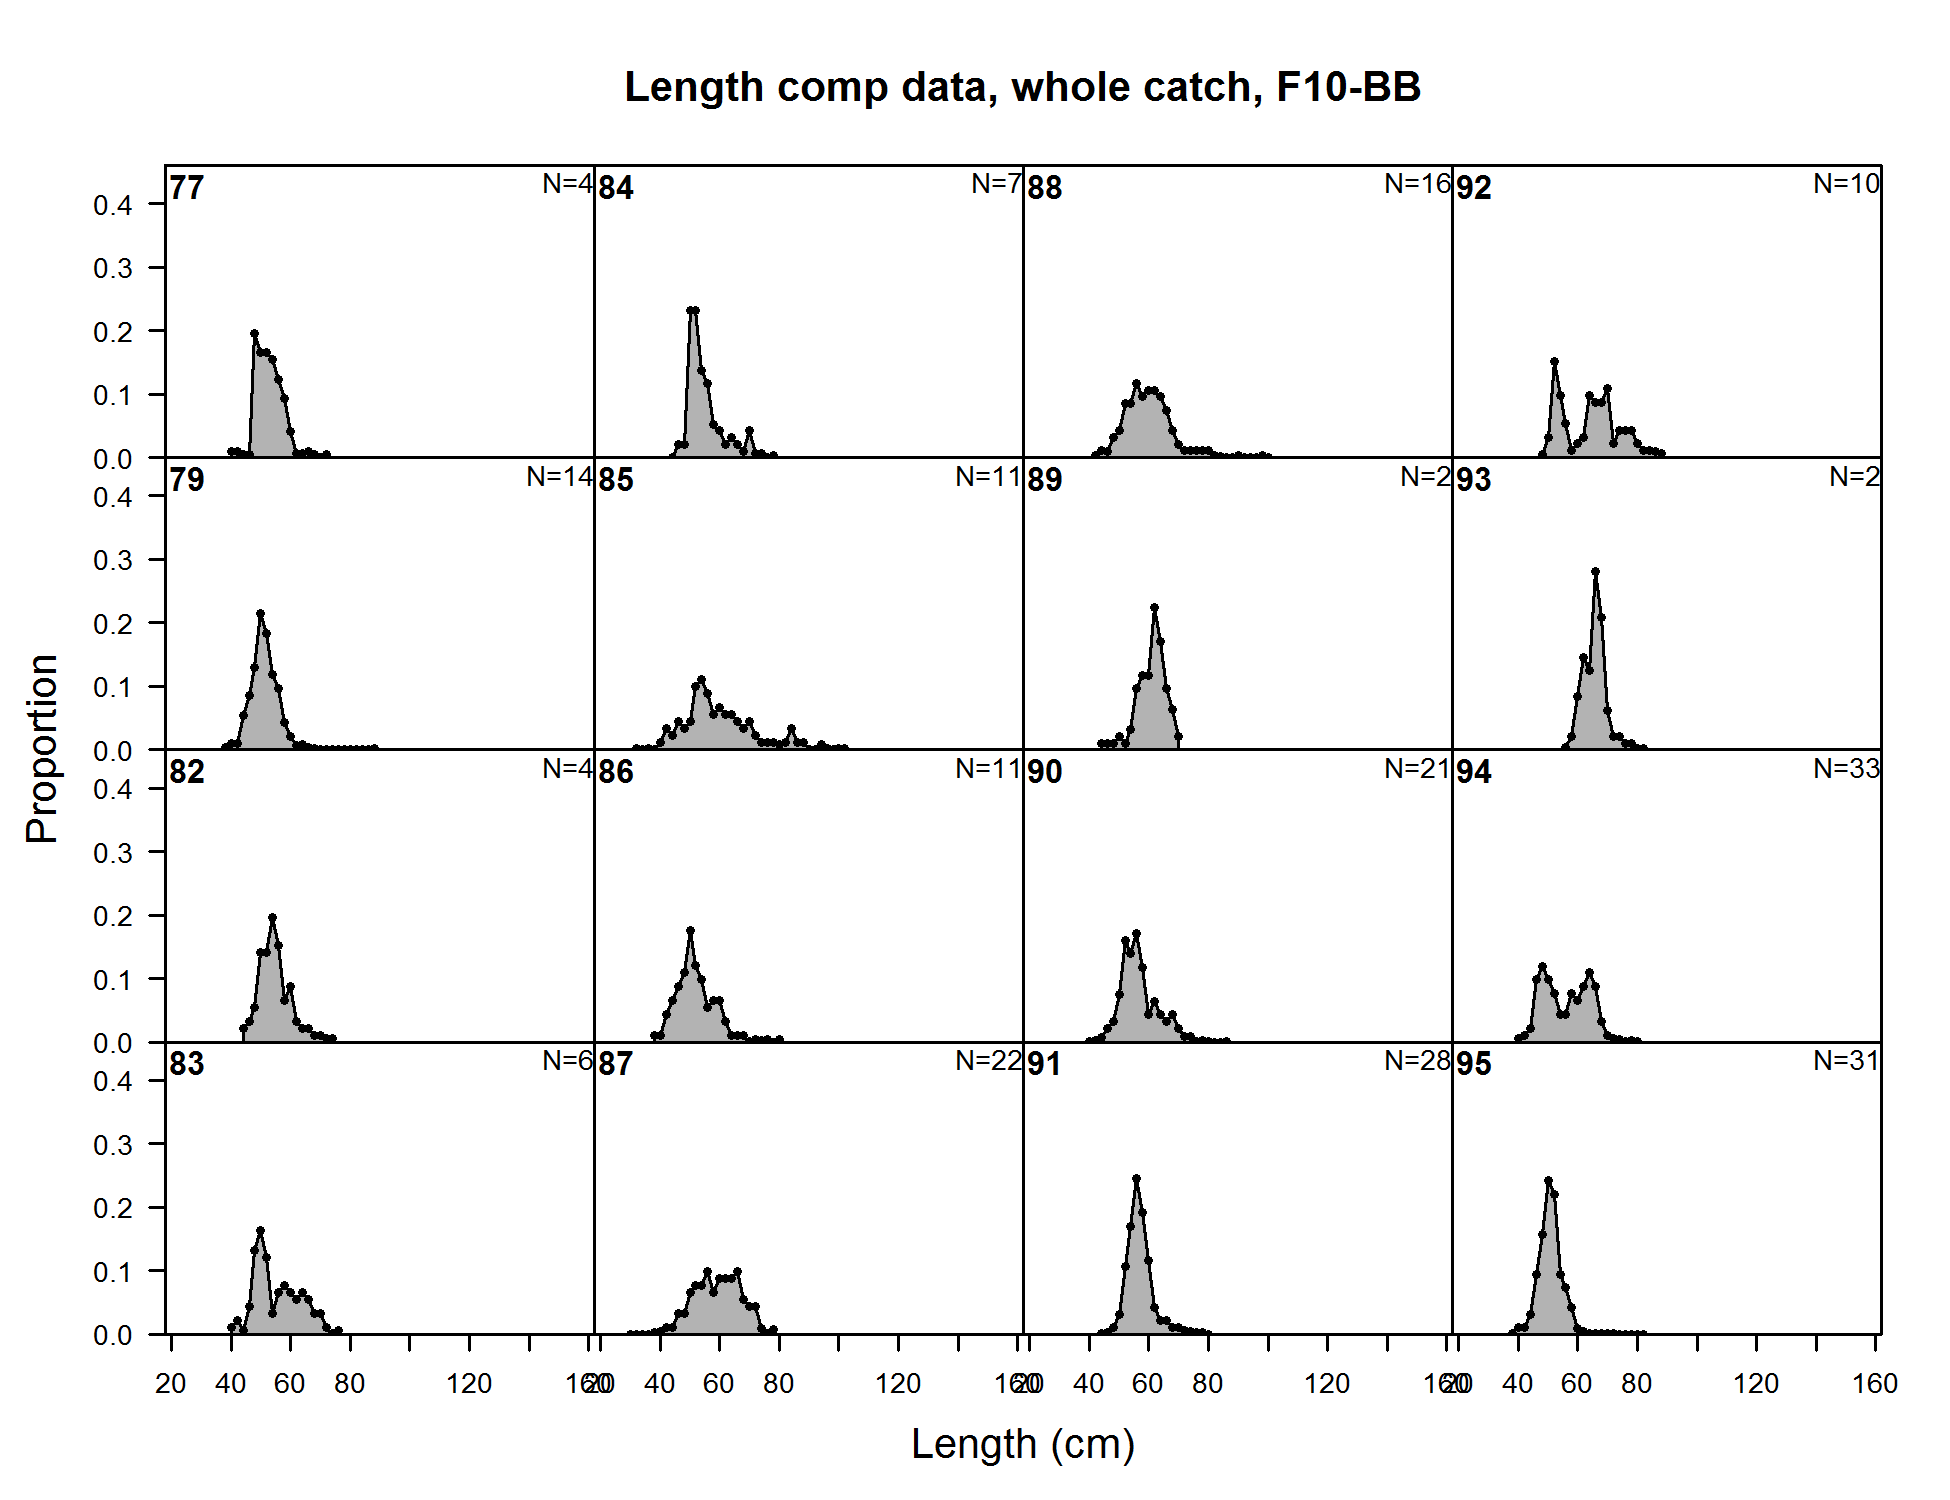
Length comp data, whole catch, F10-BB (plot 1 of 6) (plot 2 of 6) (plot 3 of 6) (plot 4 of 6) (plot 5 of 6) (plot 6 of 6)
file: comp_lendat_flt10mkt0_page6.png
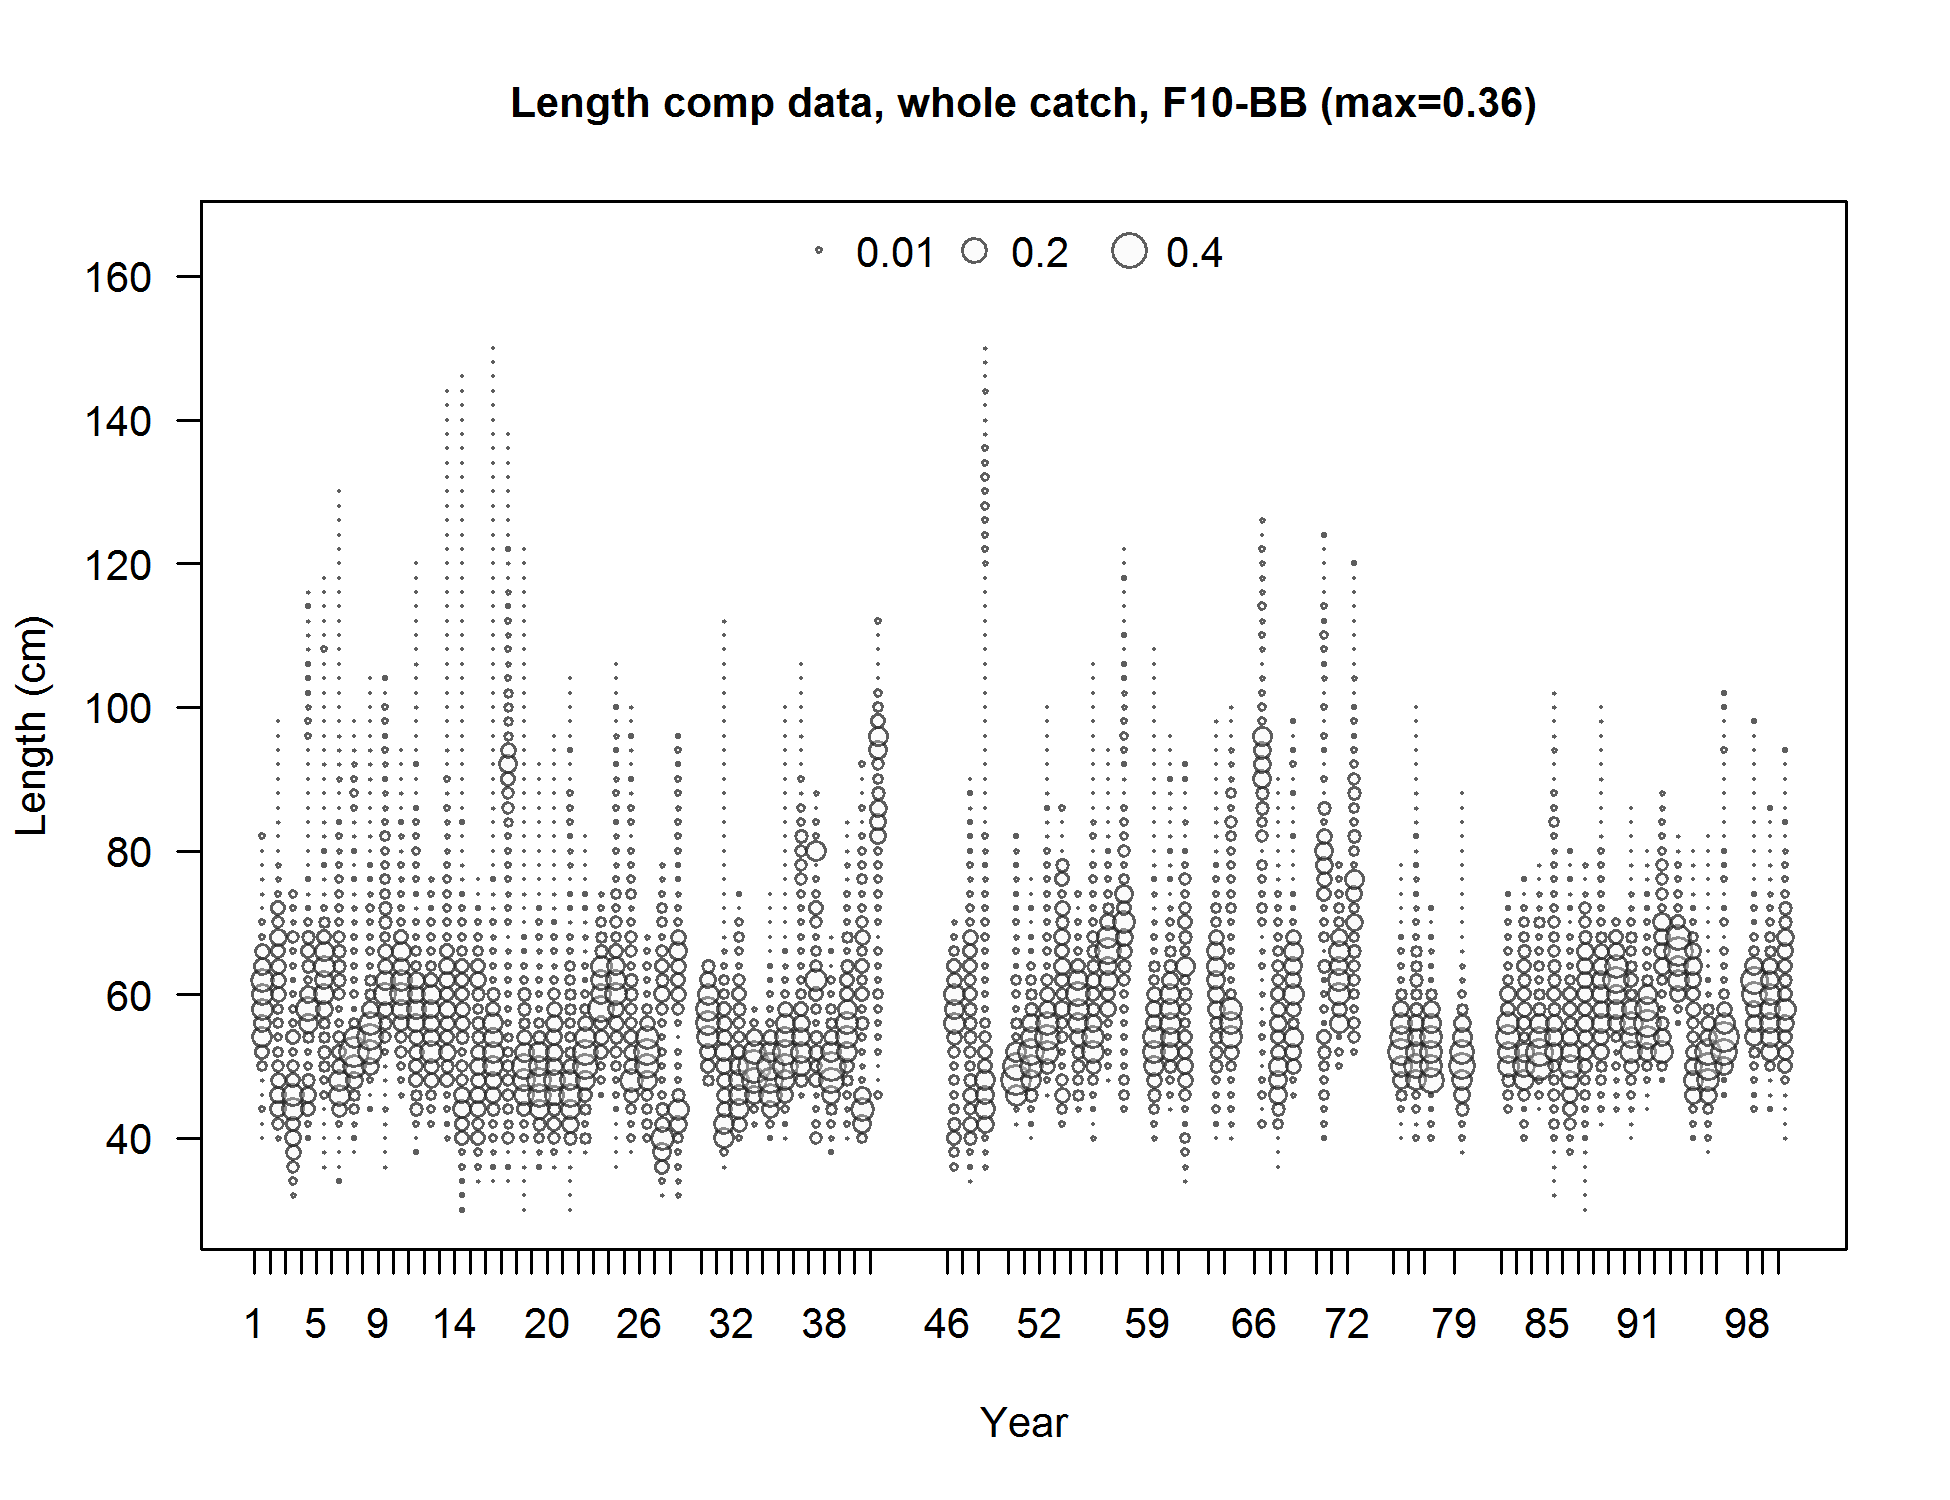
Length comp data, whole catch, F10-BB (max=0.36) (plot 6 of 6)
file: comp_lendat_bubflt10mkt0_page6.png
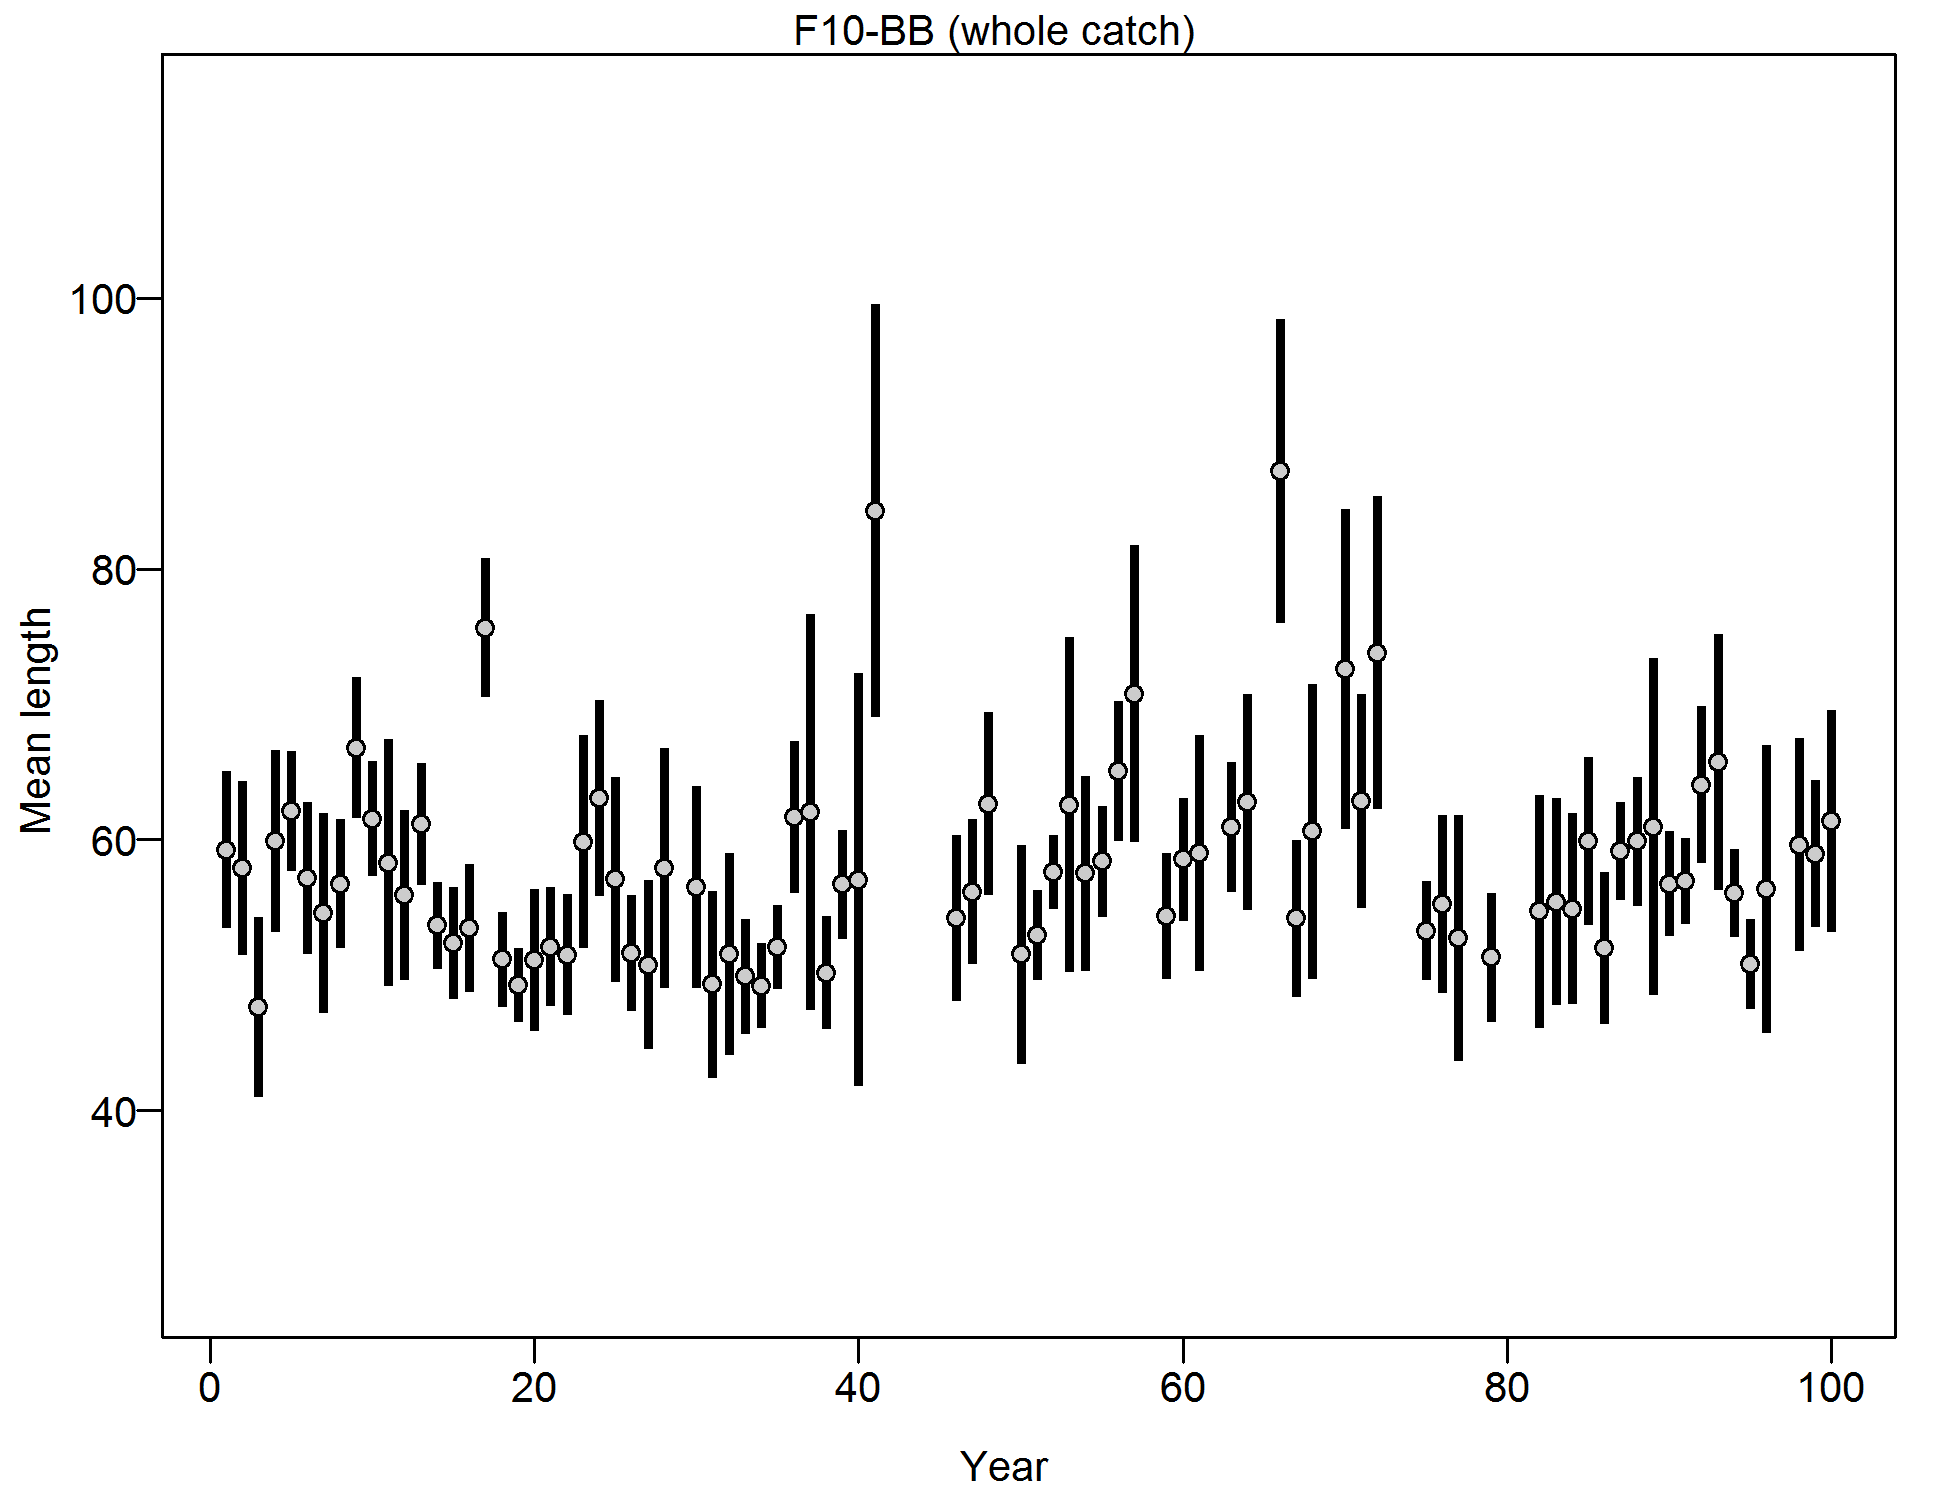
Mean length for F10-BB with 95% confidence intervals based on current samples sizes.
file: comp_lendat_data_weighting_TA1.8_F10-BB.png
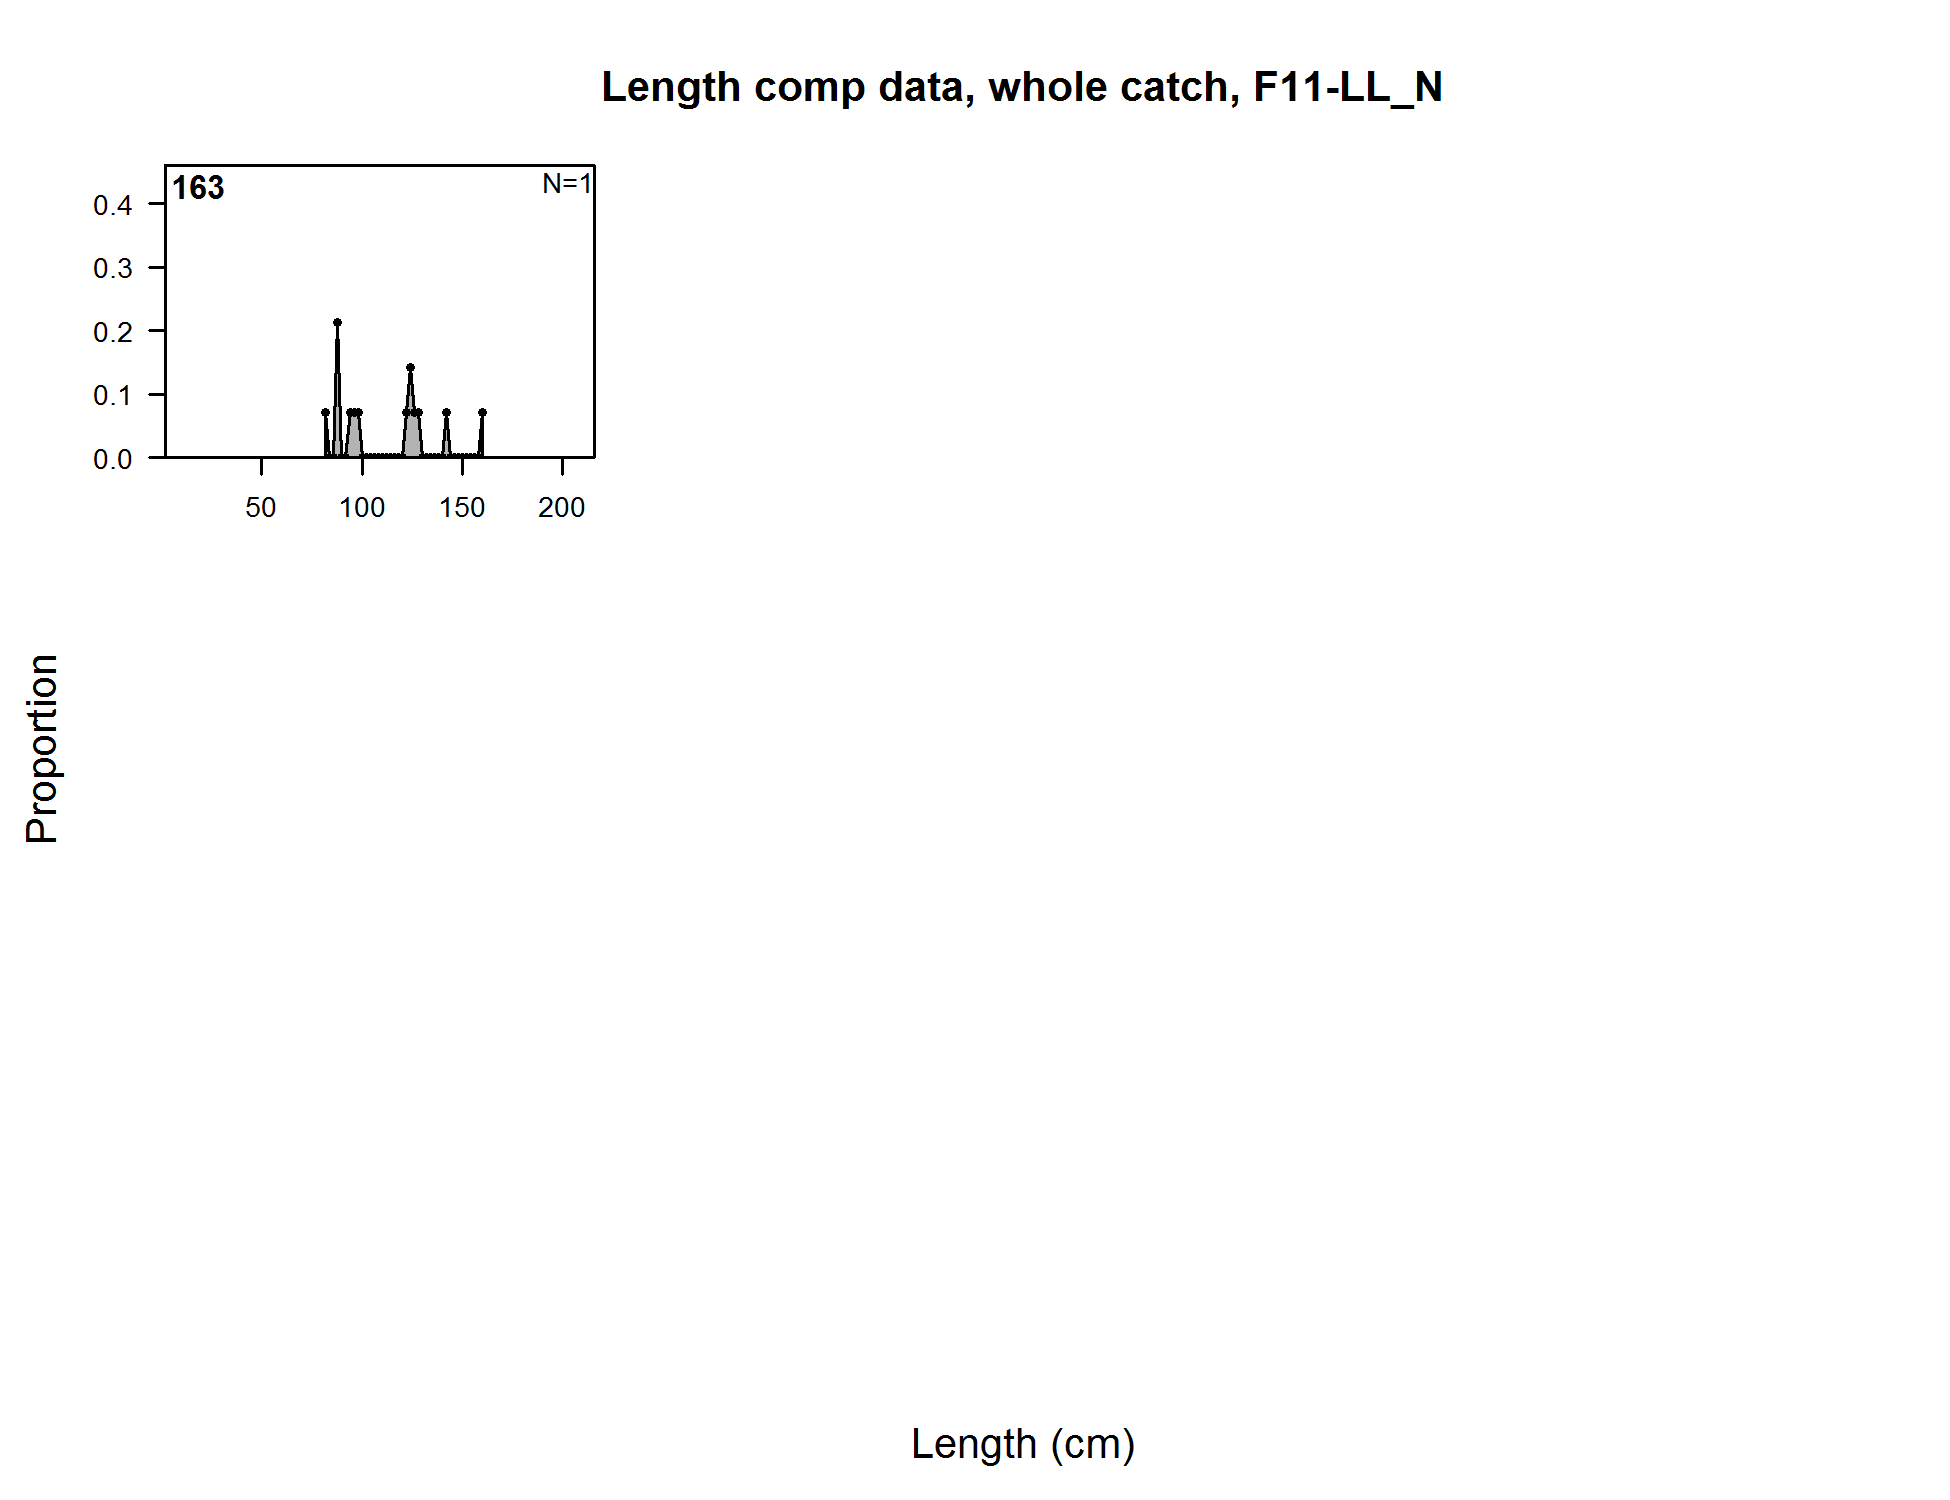
Length comp data, whole catch, F11-LL_N (plot 1 of 2)
file: comp_lendat_flt11mkt0_page1.png
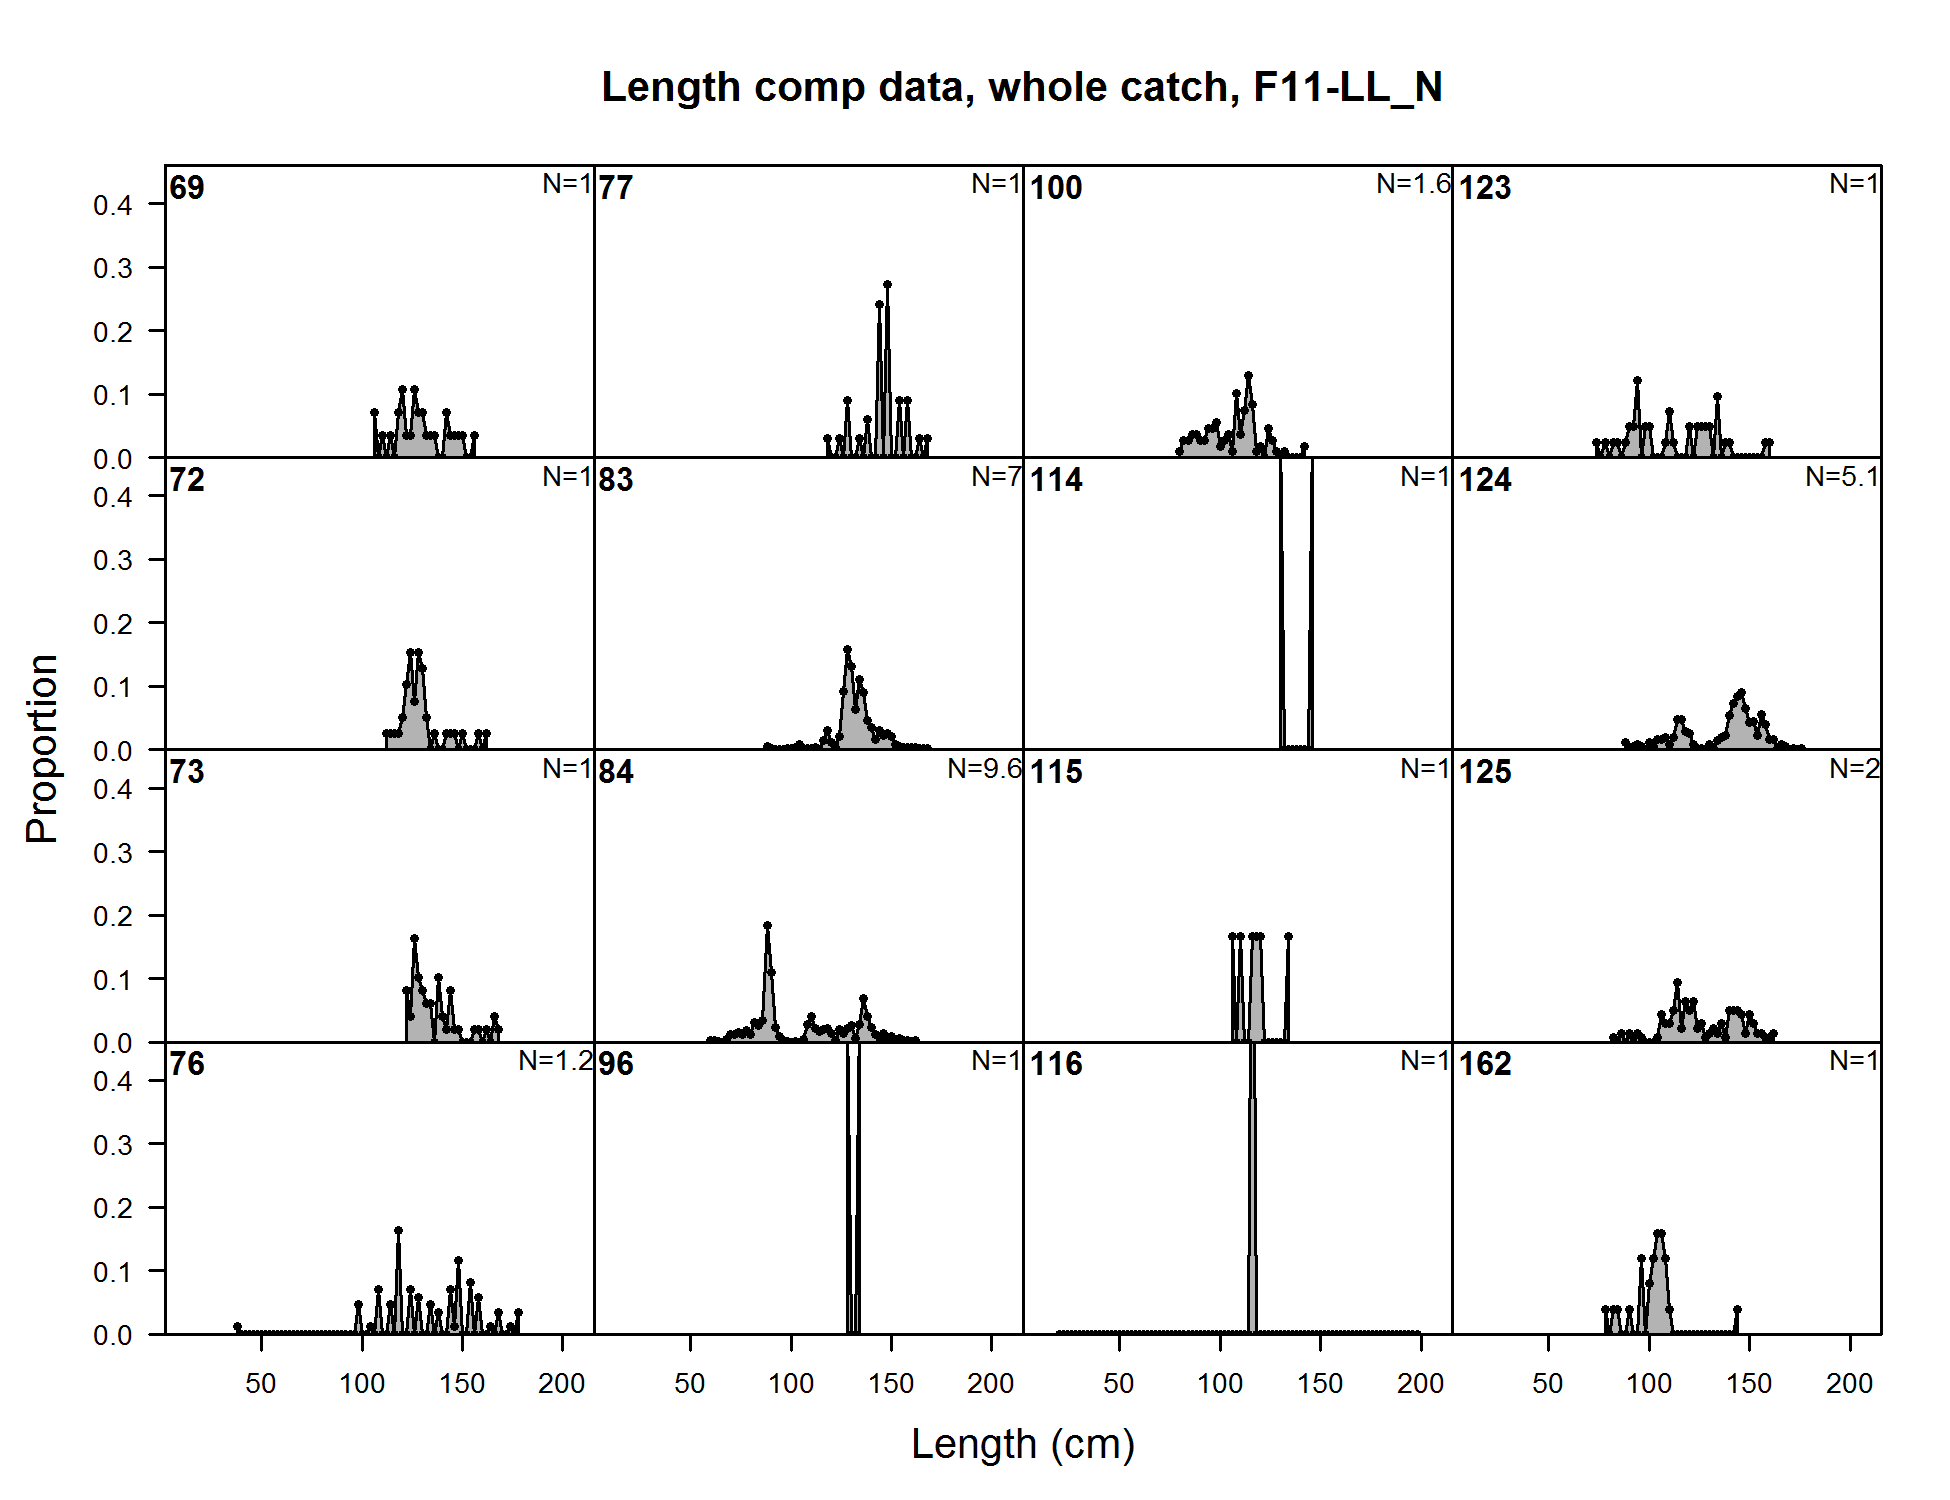
Length comp data, whole catch, F11-LL_N (plot 1 of 2) (plot 2 of 2)
file: comp_lendat_flt11mkt0_page2.png
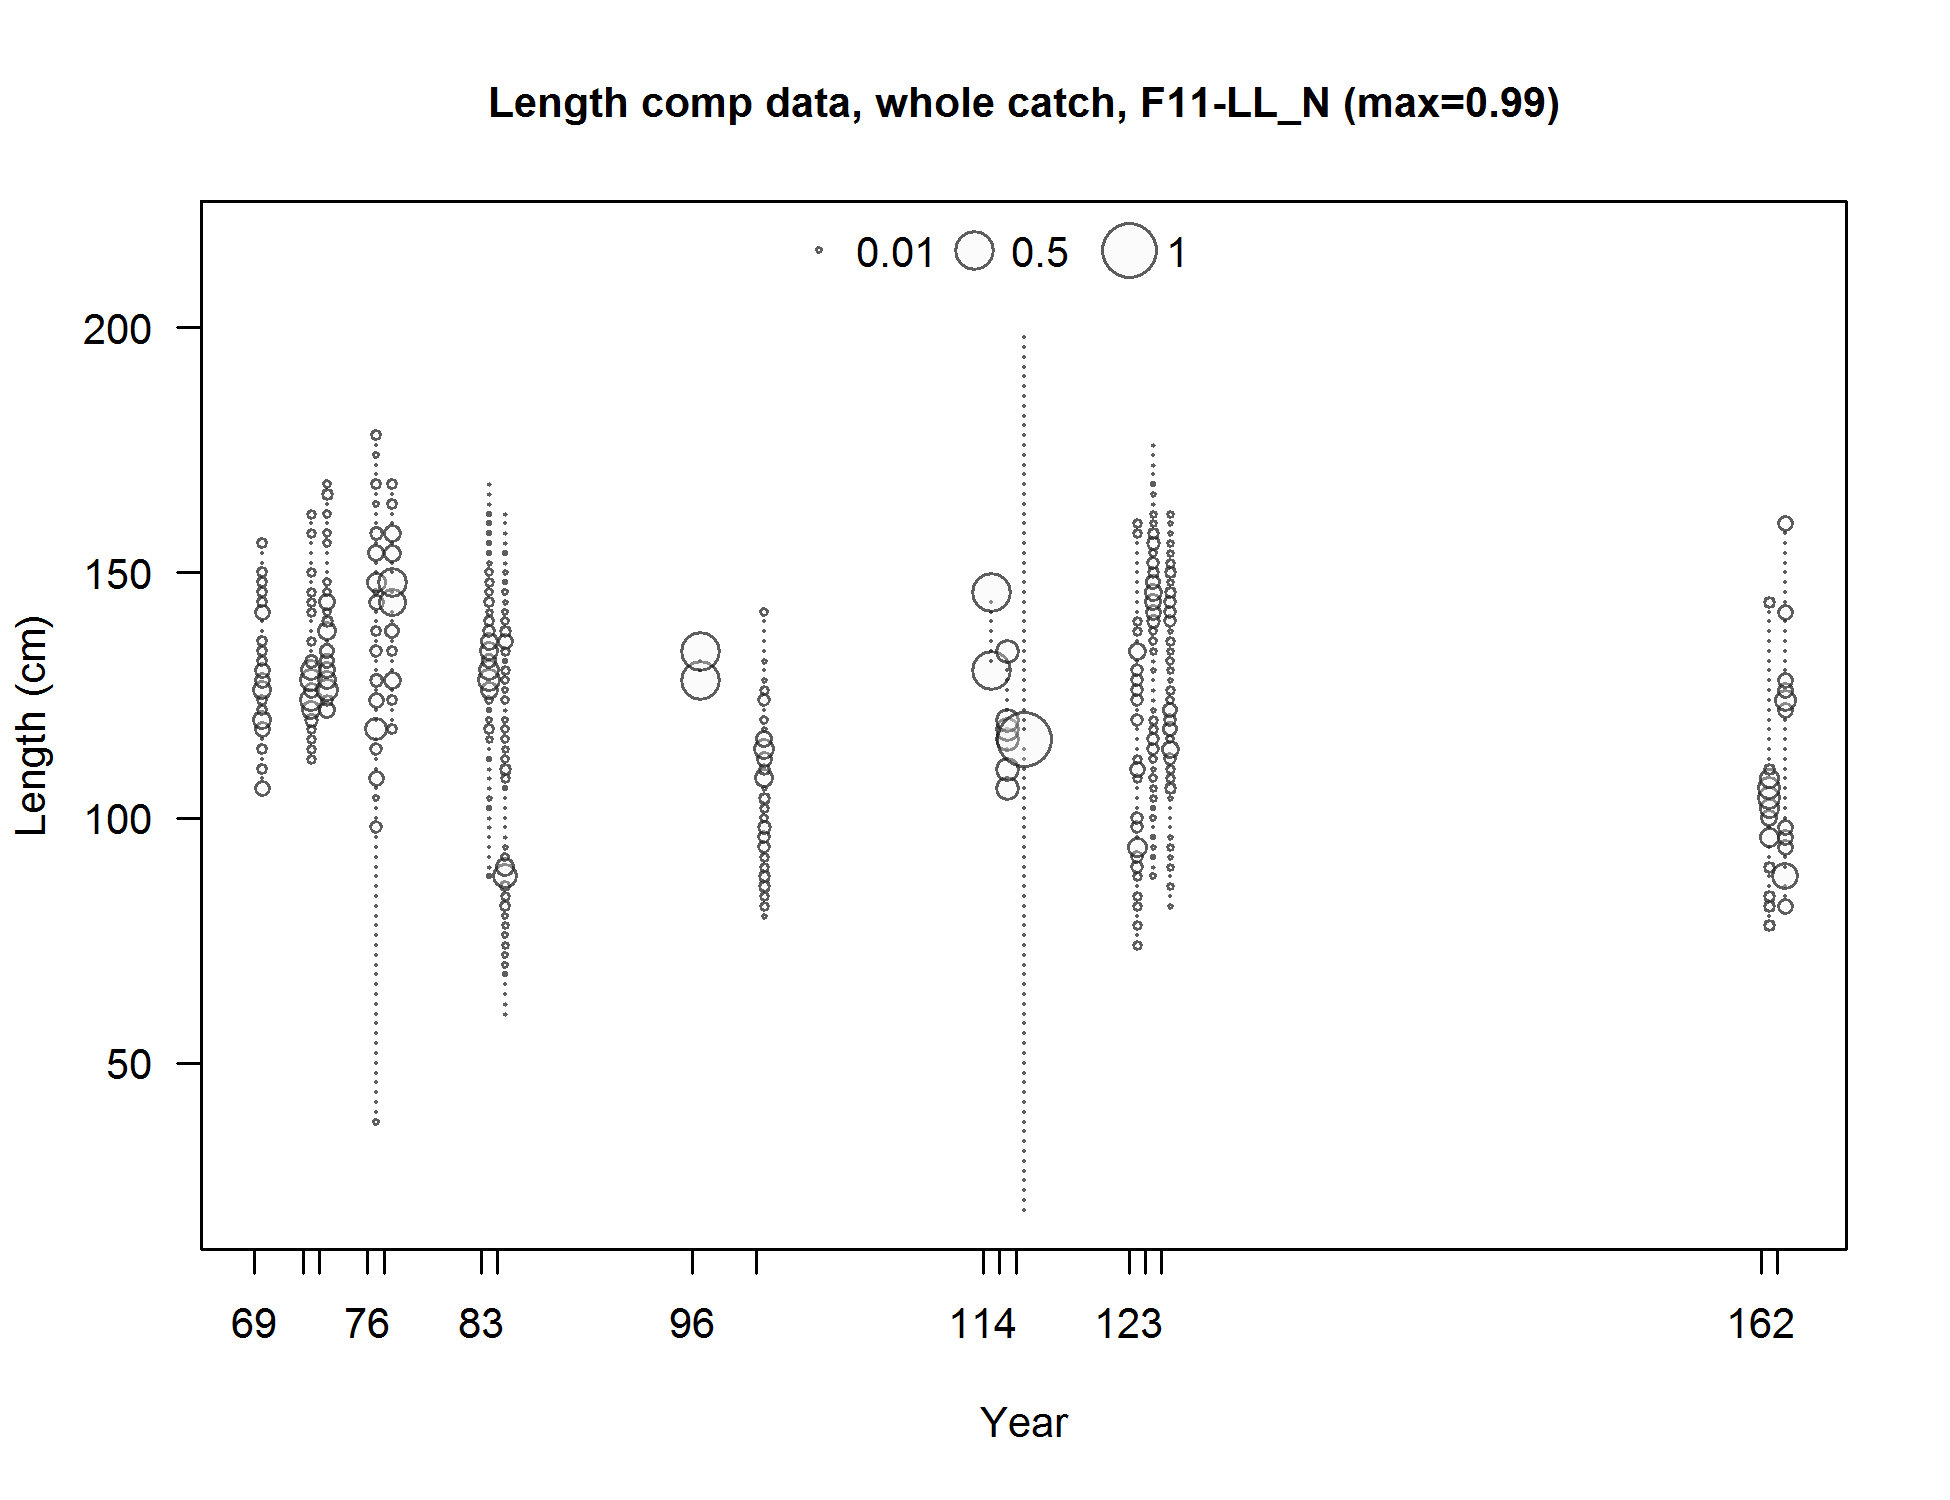
Length comp data, whole catch, F11-LL_N (max=0.99) (plot 2 of 2)
file: comp_lendat_bubflt11mkt0_page2.png

Mean length for F11-LL_N with 95% confidence intervals based on current samples sizes.
file: comp_lendat_data_weighting_TA1.8_F11-LL_N.png
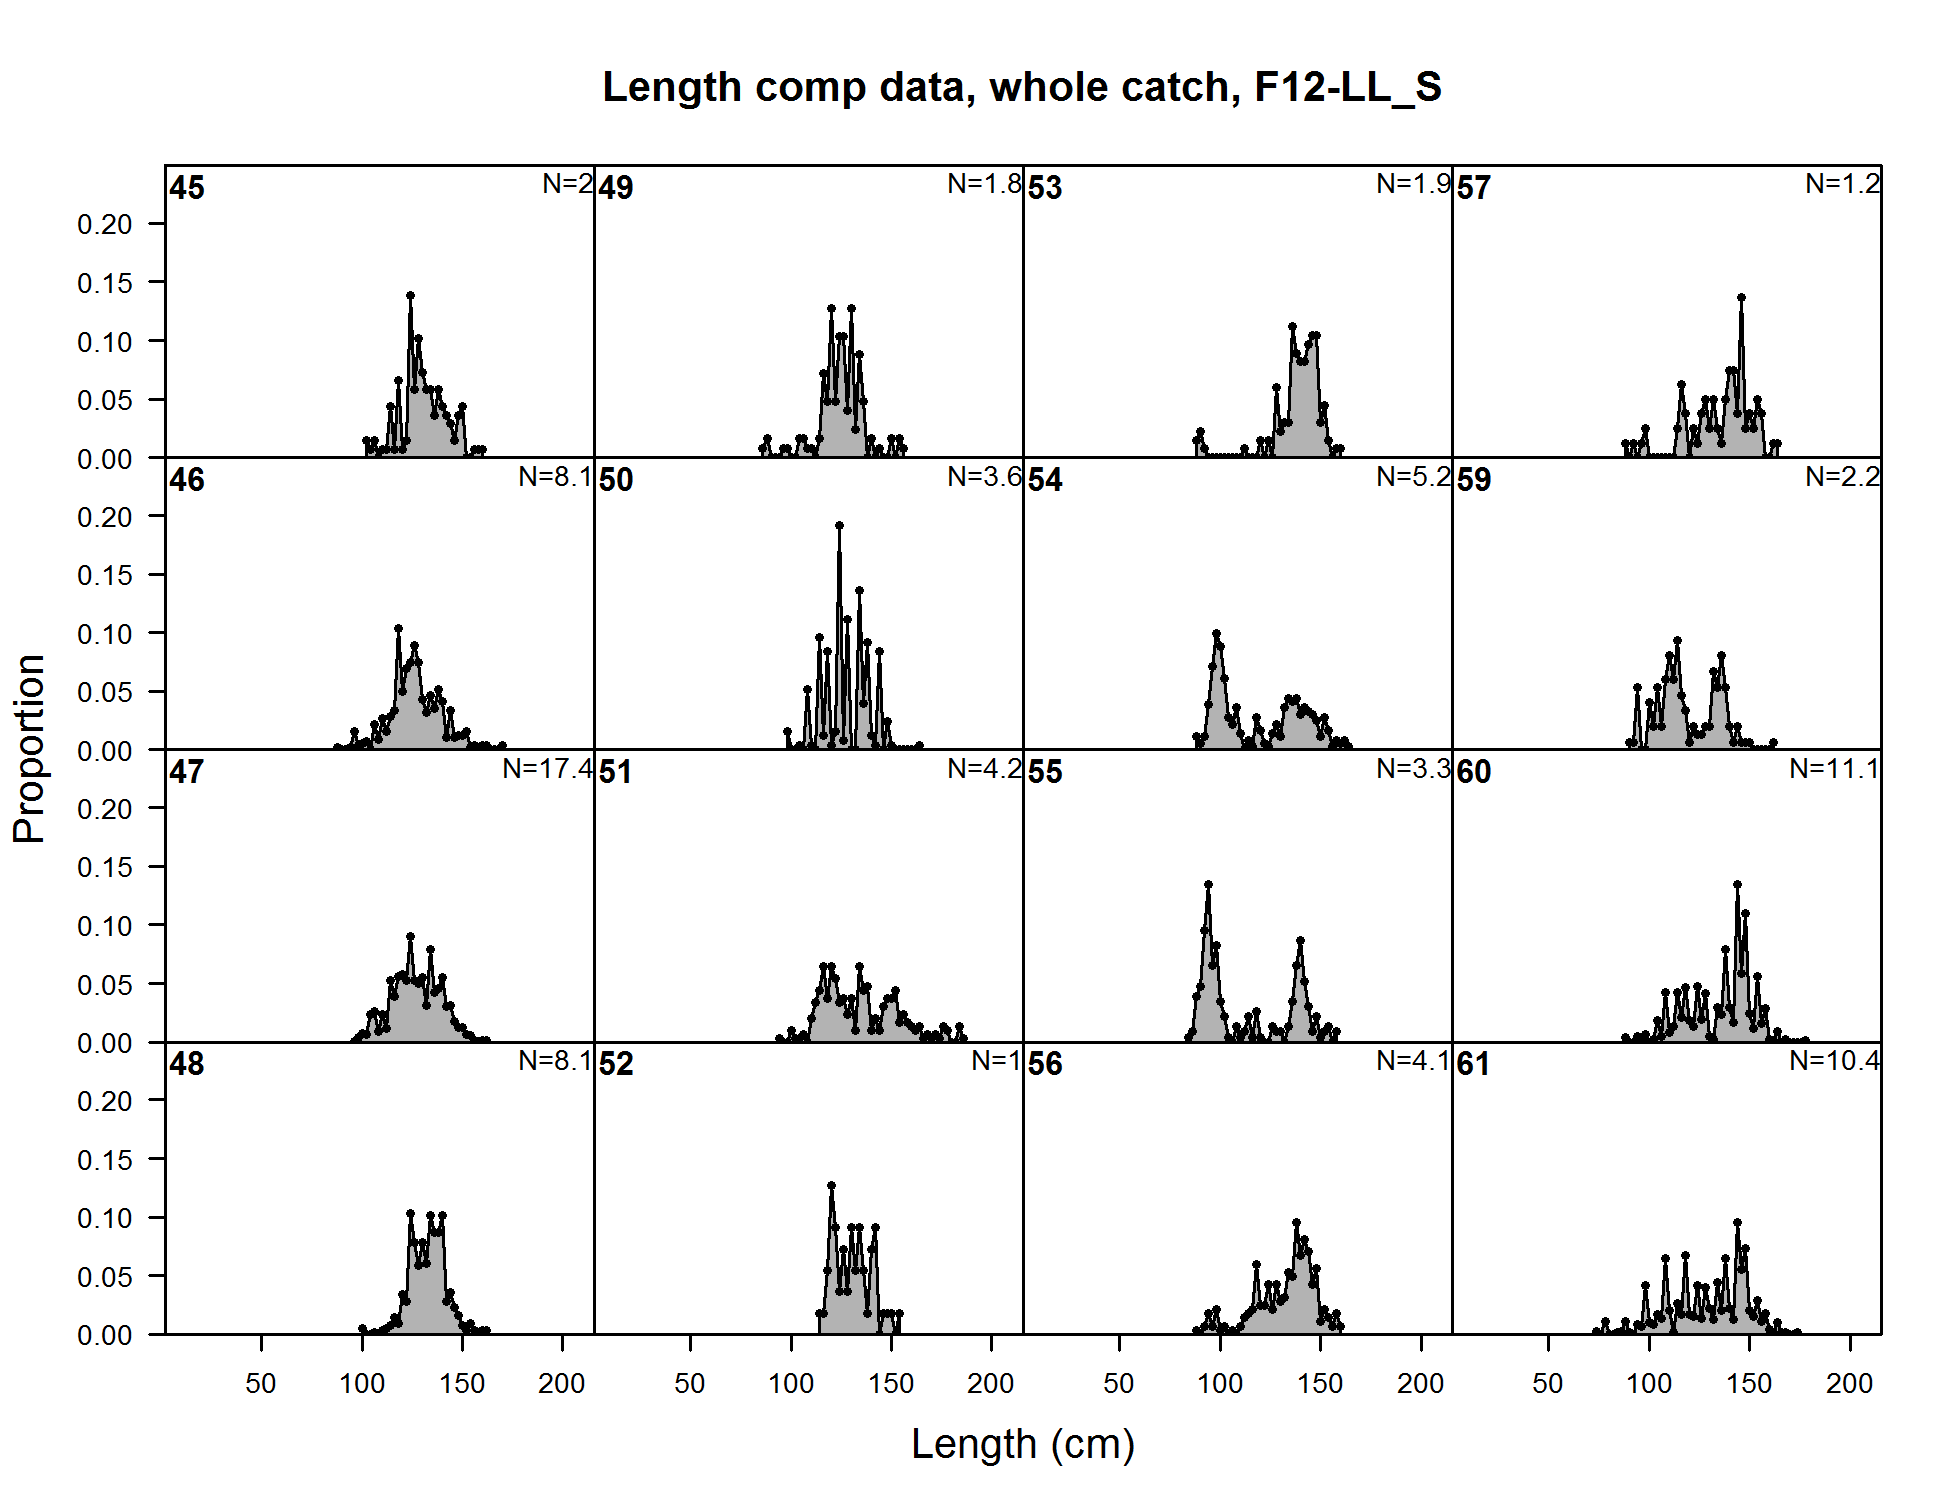
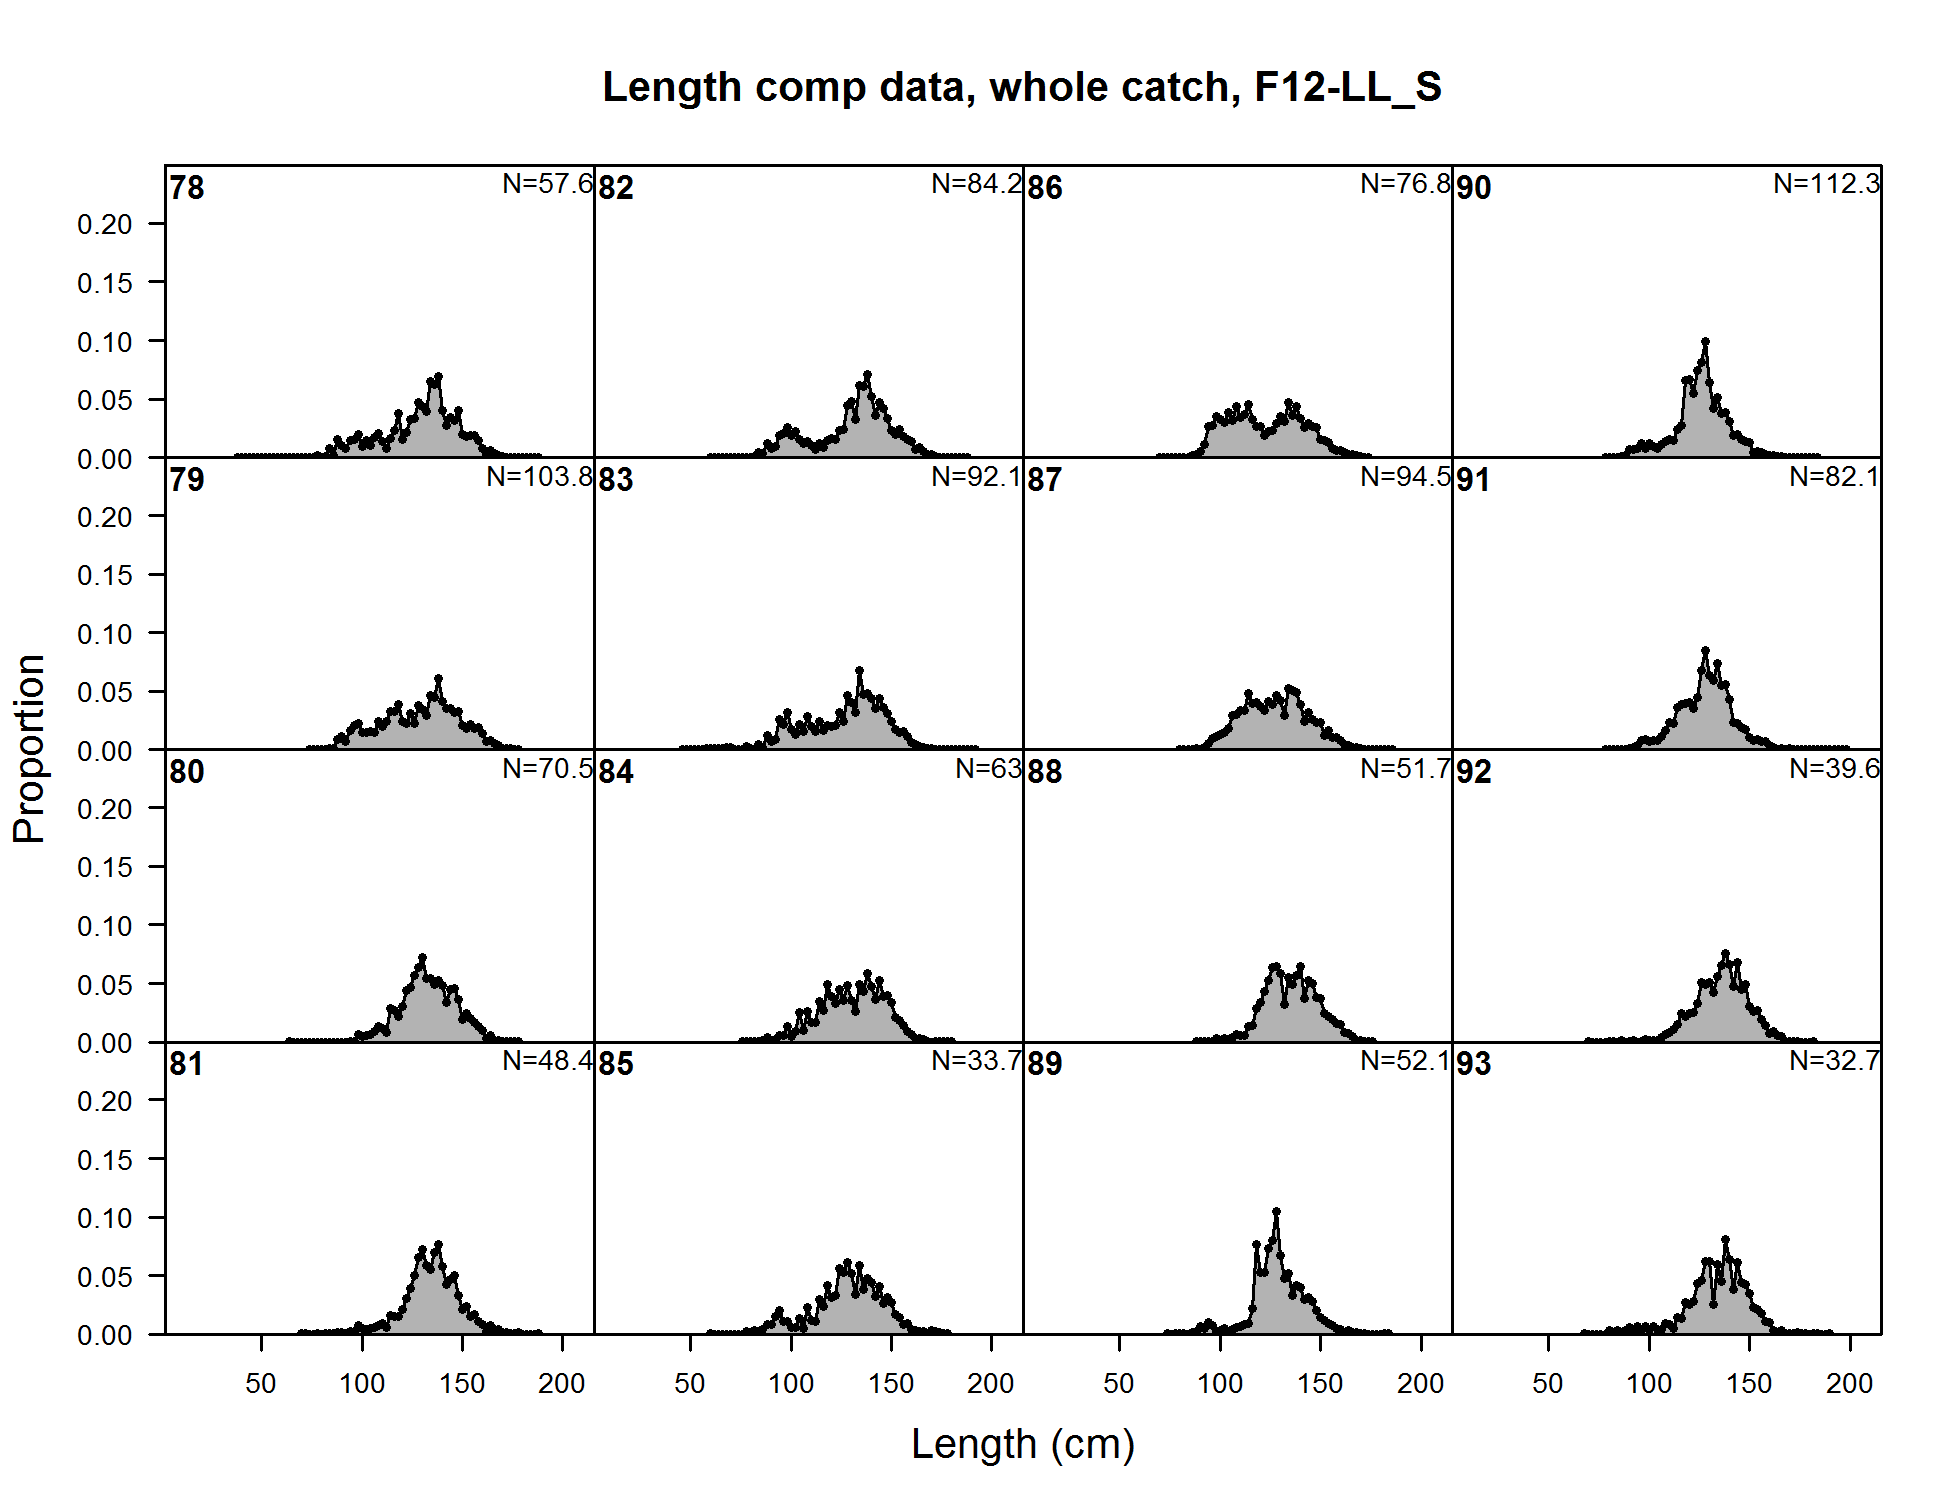
Length comp data, whole catch, F12-LL_S (plot 1 of 8)
file: comp_lendat_flt12mkt0_page1.png
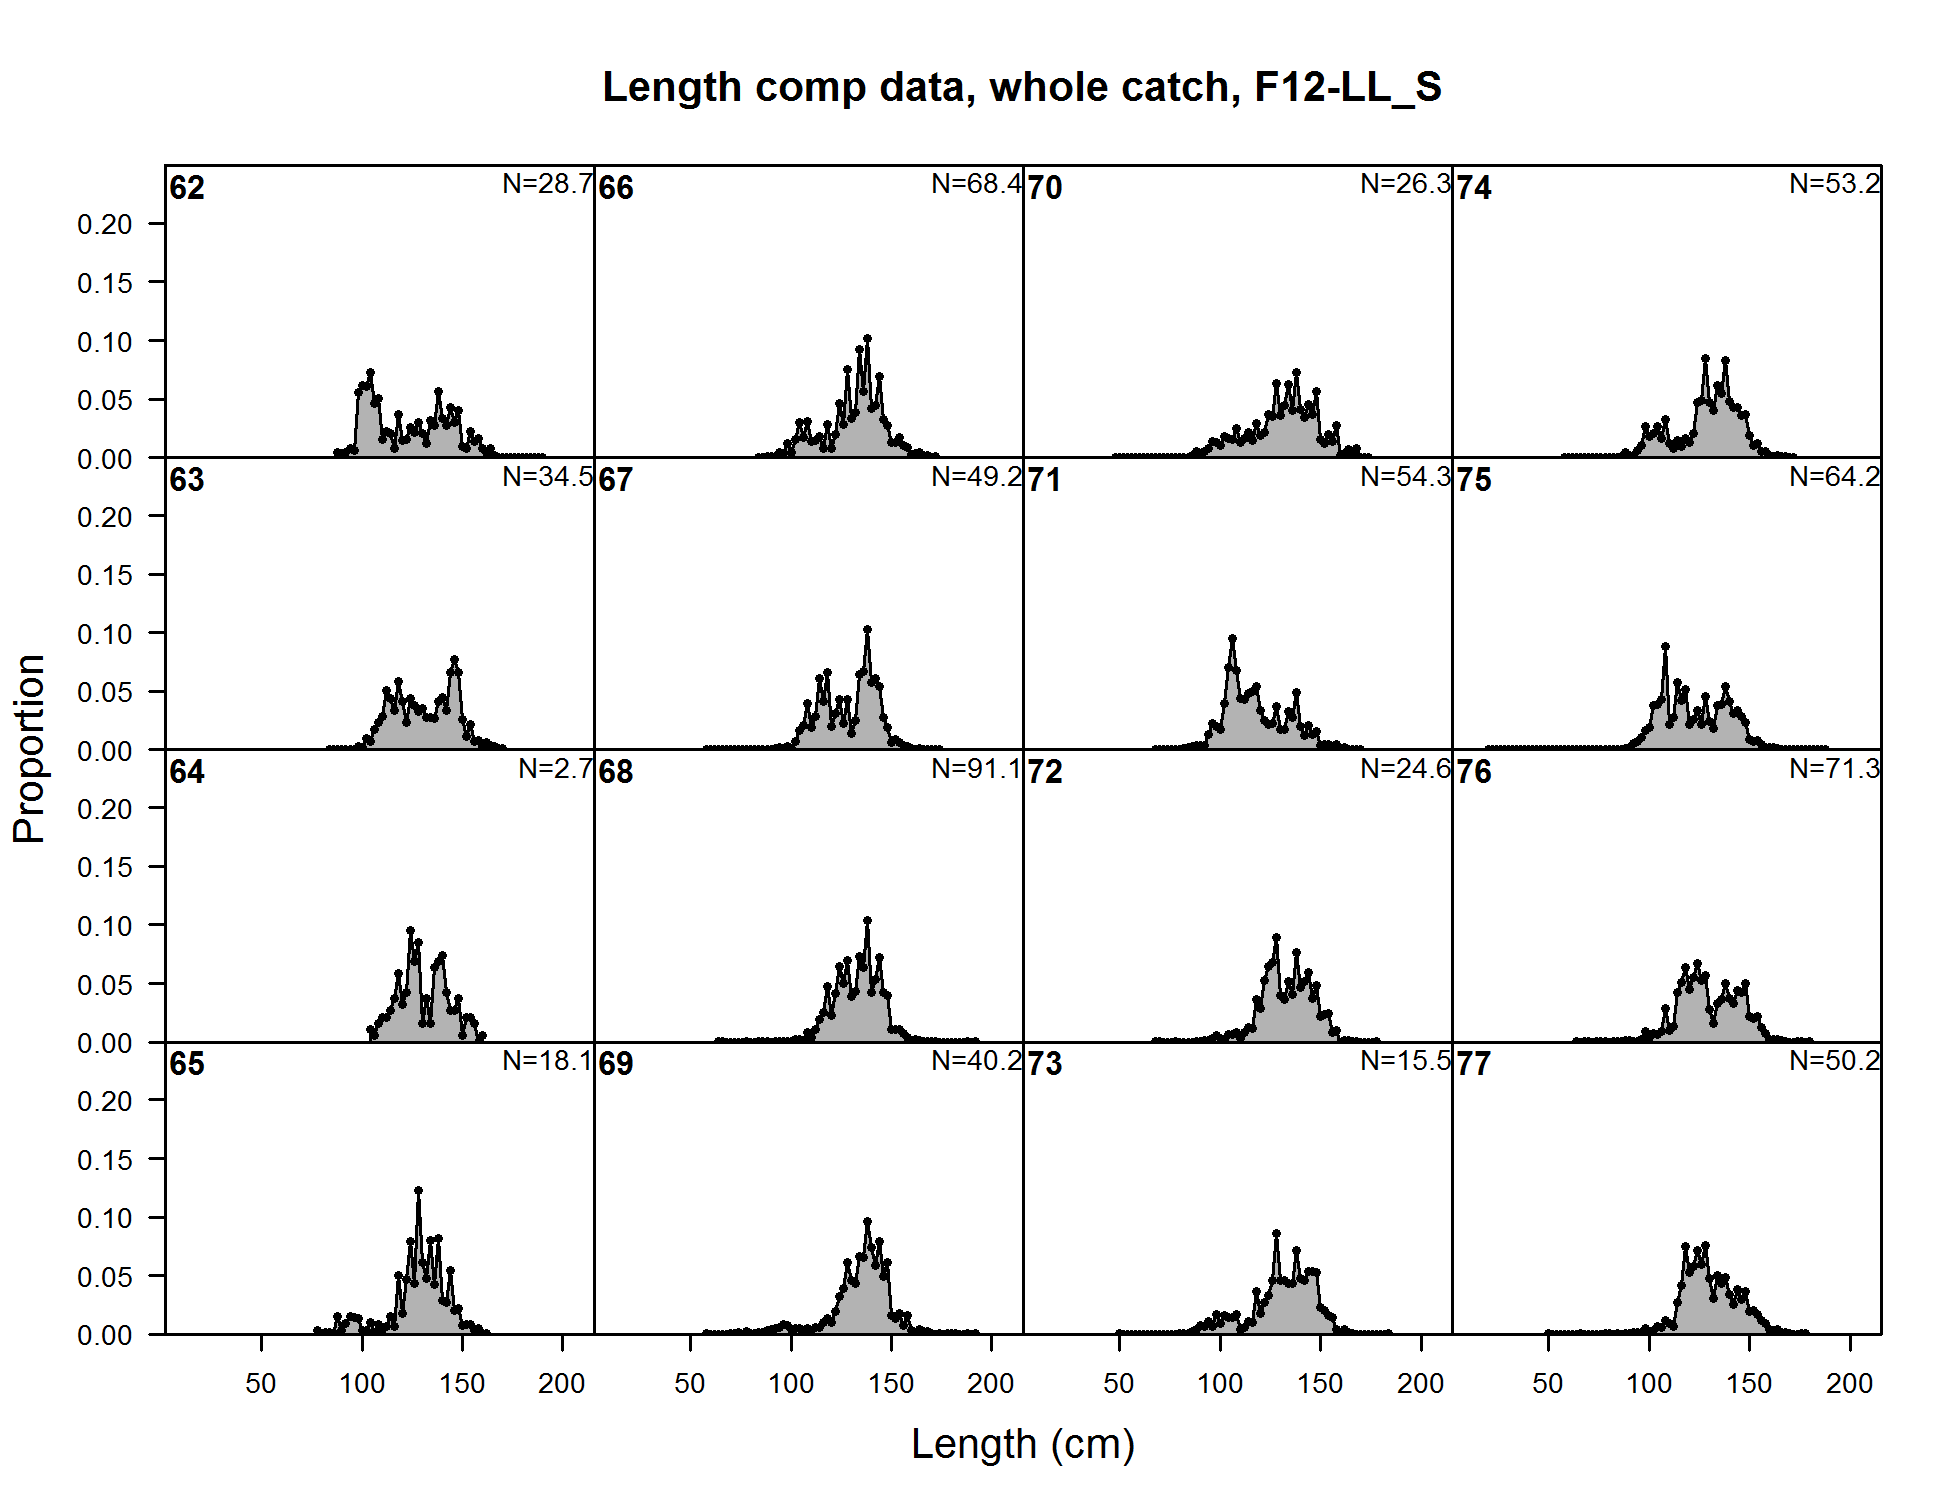
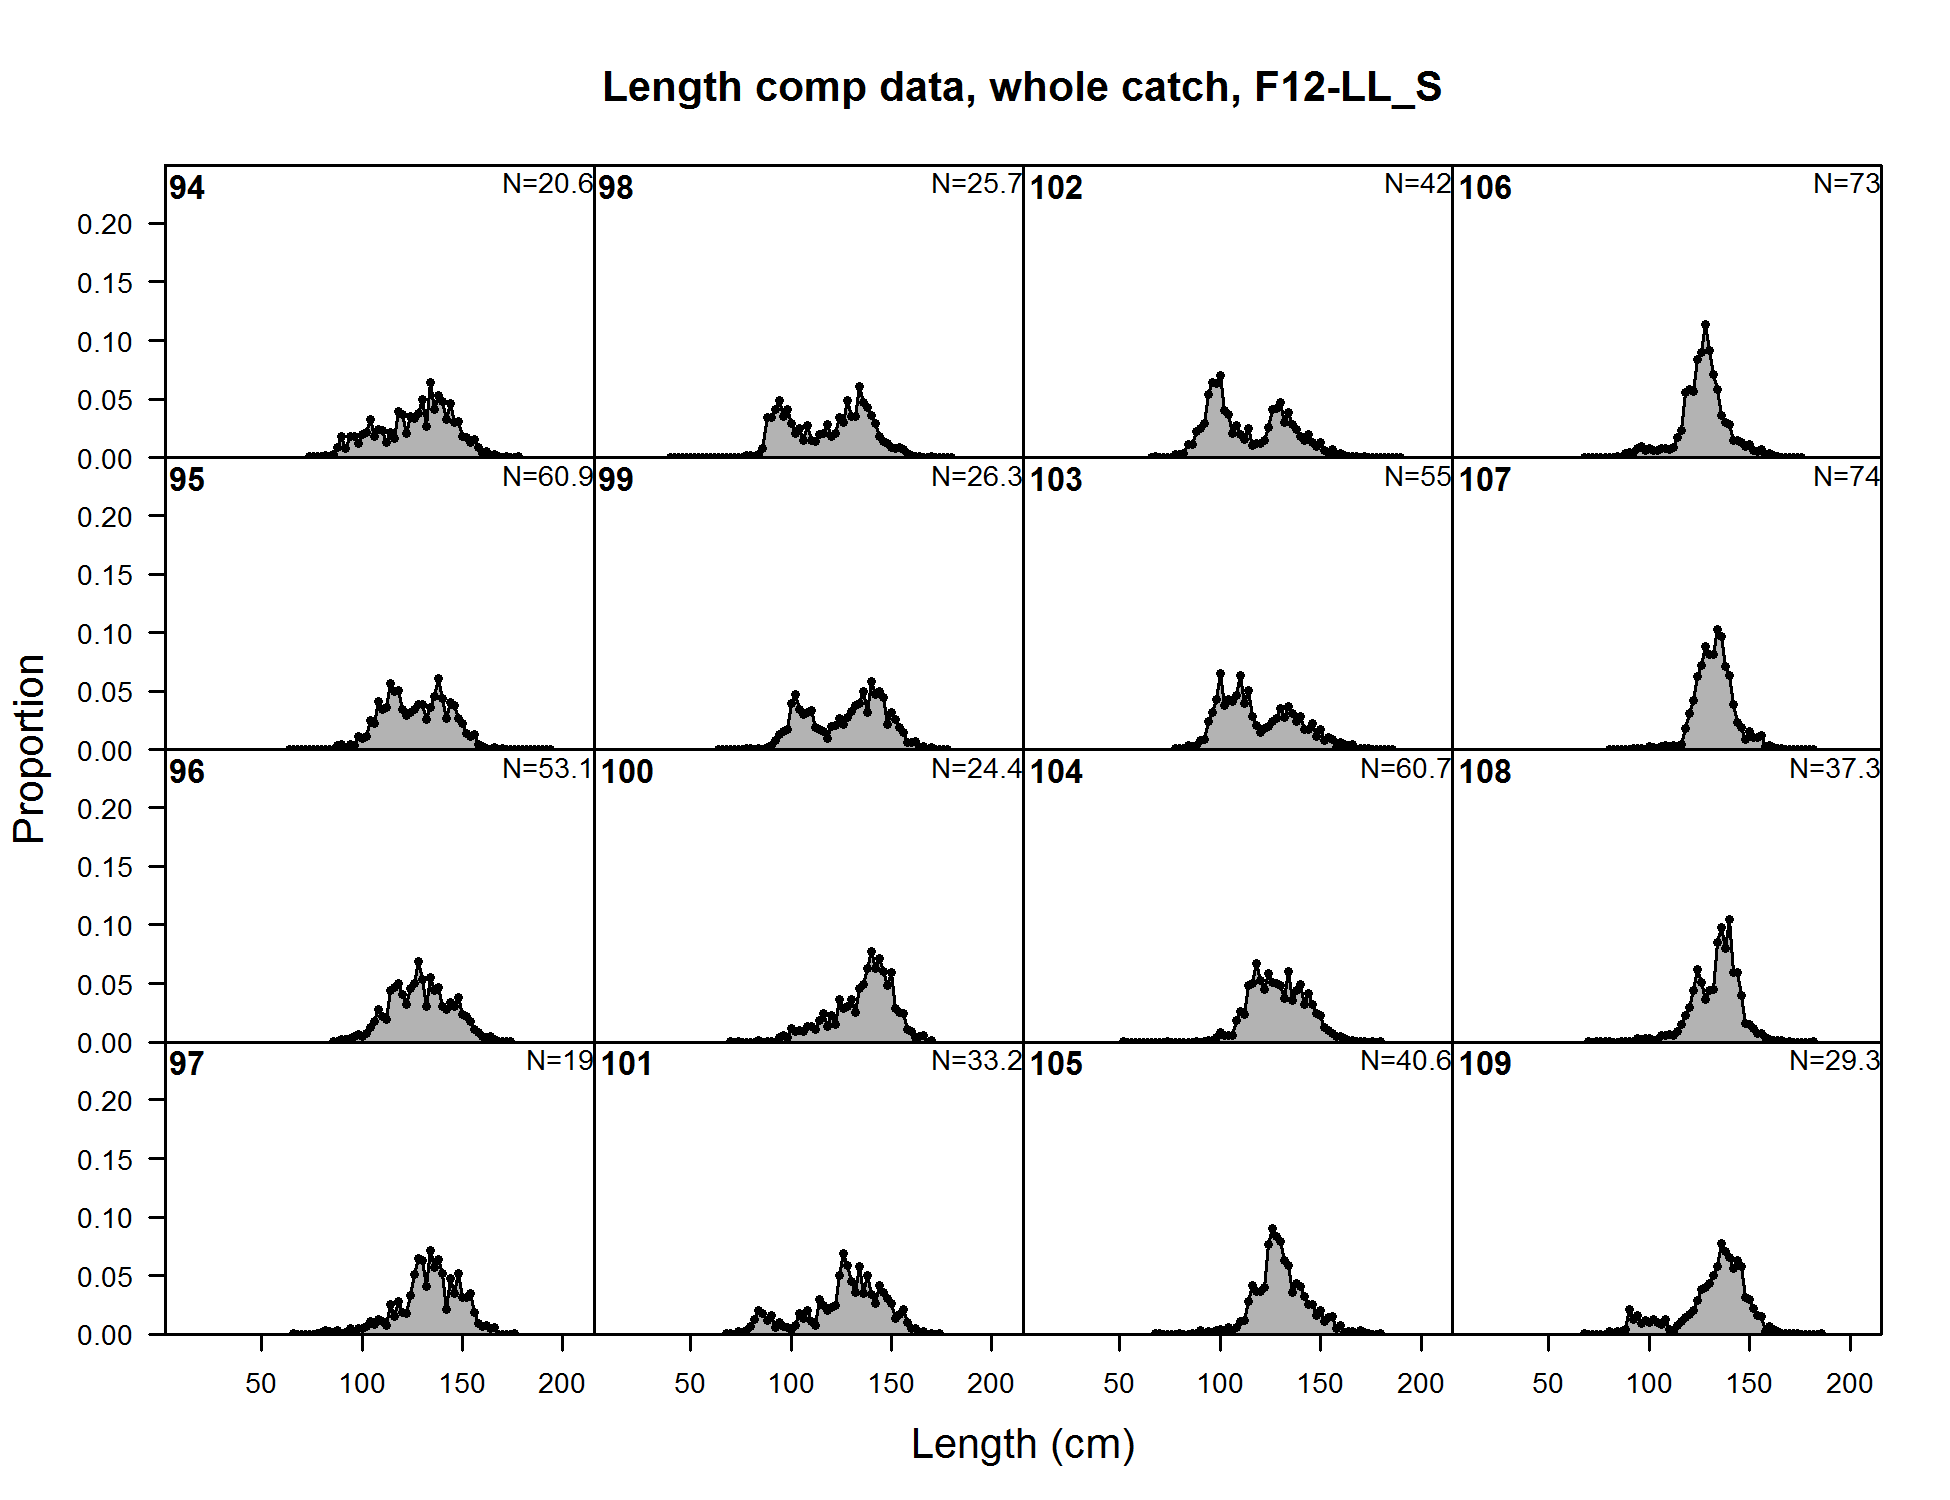
Length comp data, whole catch, F12-LL_S (plot 1 of 8) (plot 2 of 8)
file: comp_lendat_flt12mkt0_page2.png
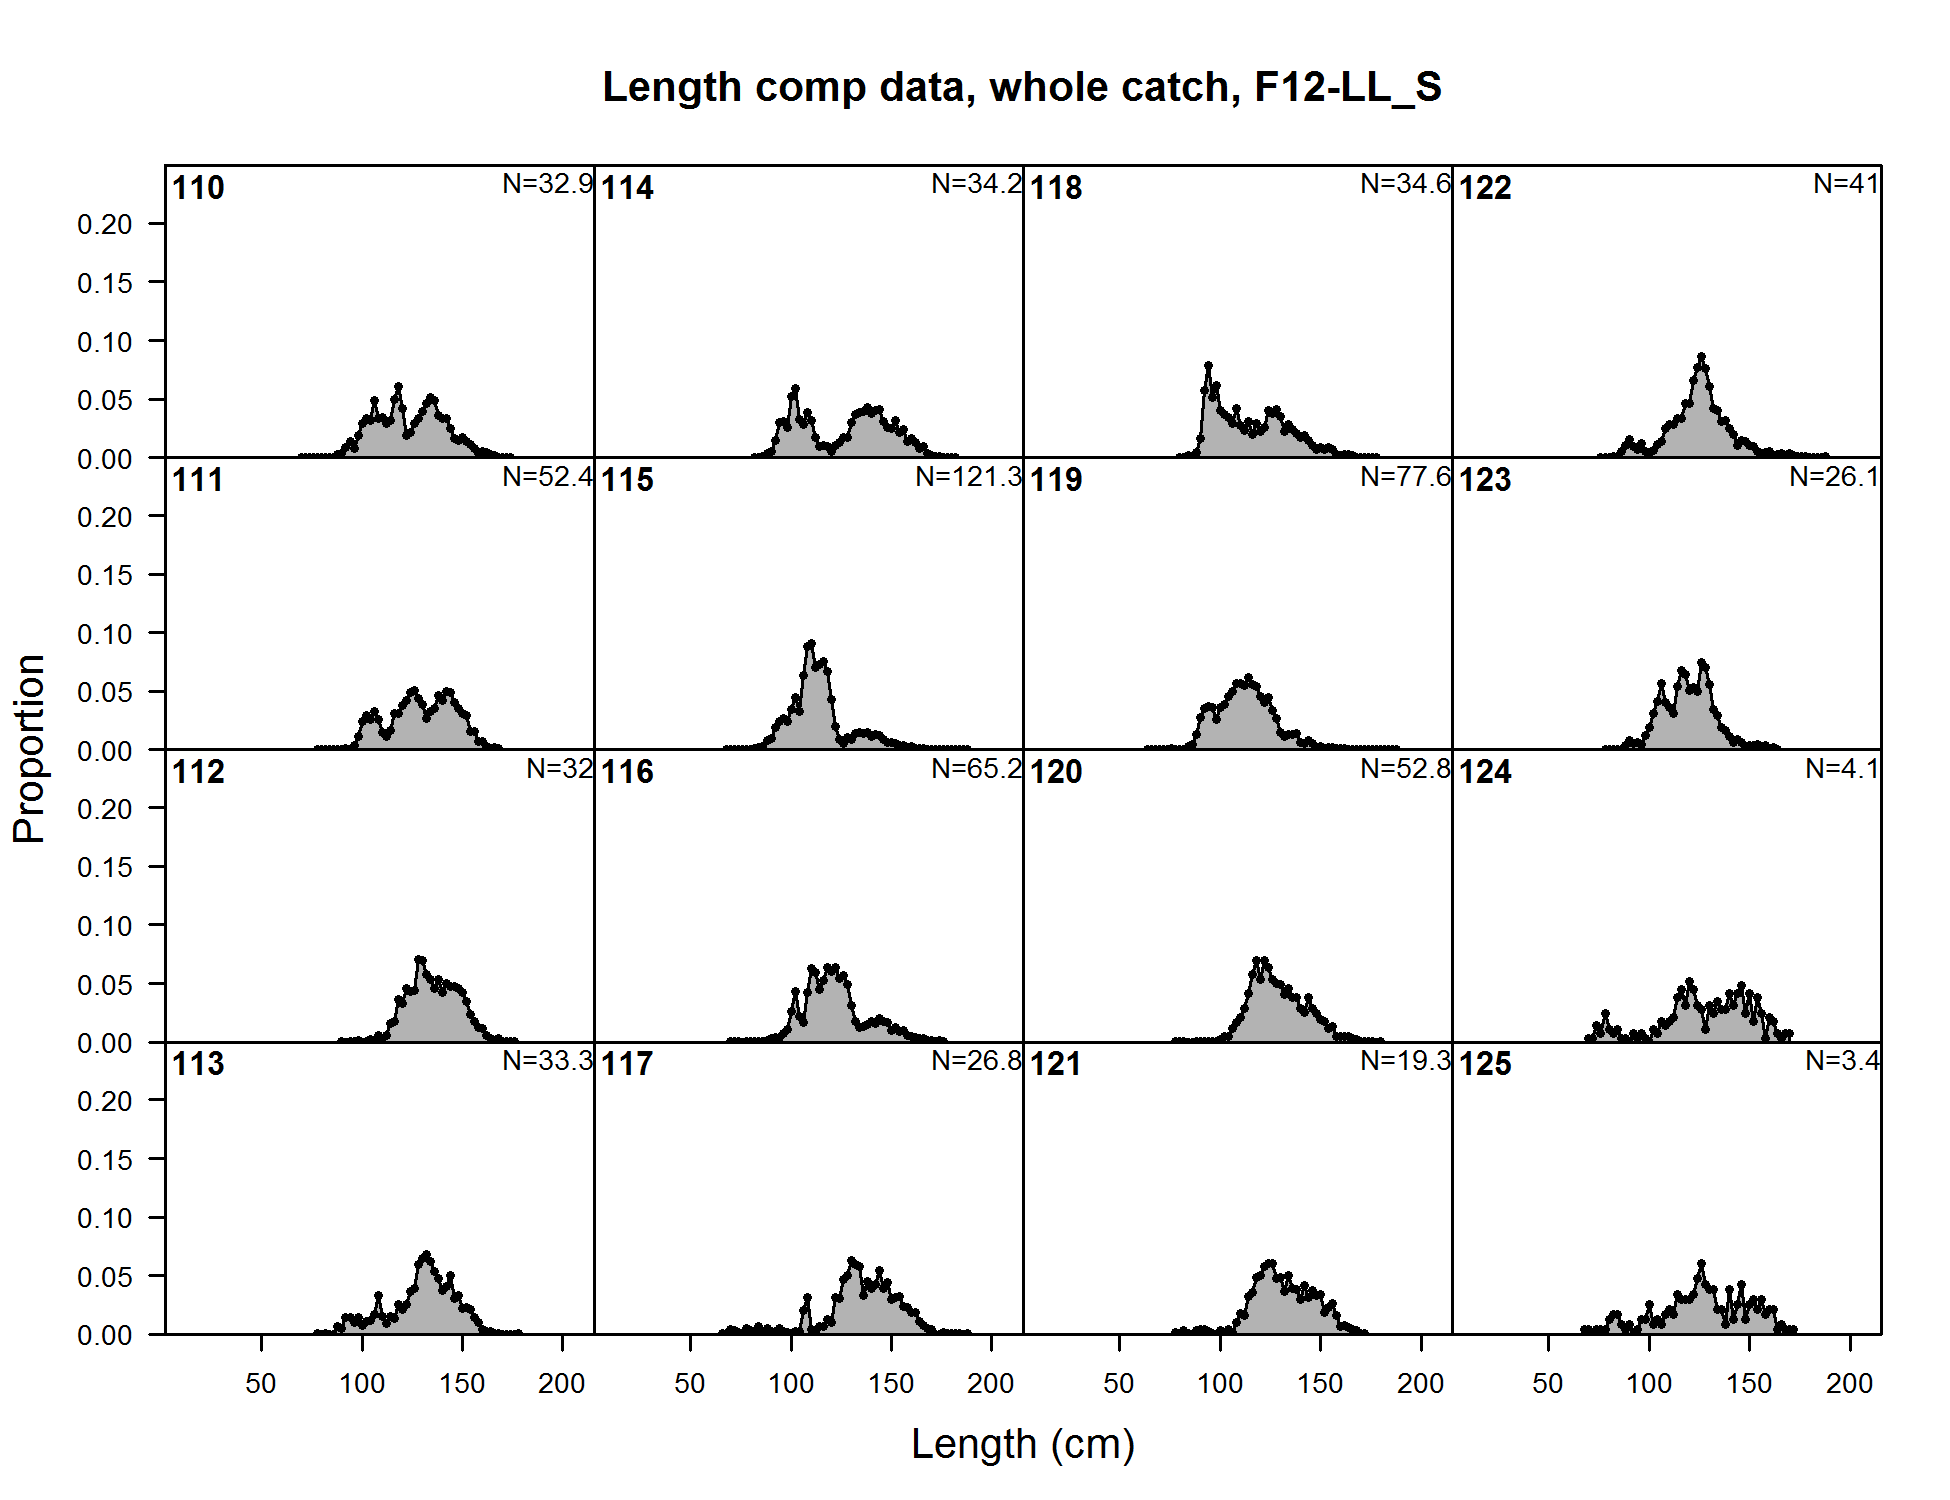
Length comp data, whole catch, F12-LL_S (plot 1 of 8) (plot 2 of 8) (plot 3 of 8)
file: comp_lendat_flt12mkt0_page3.png
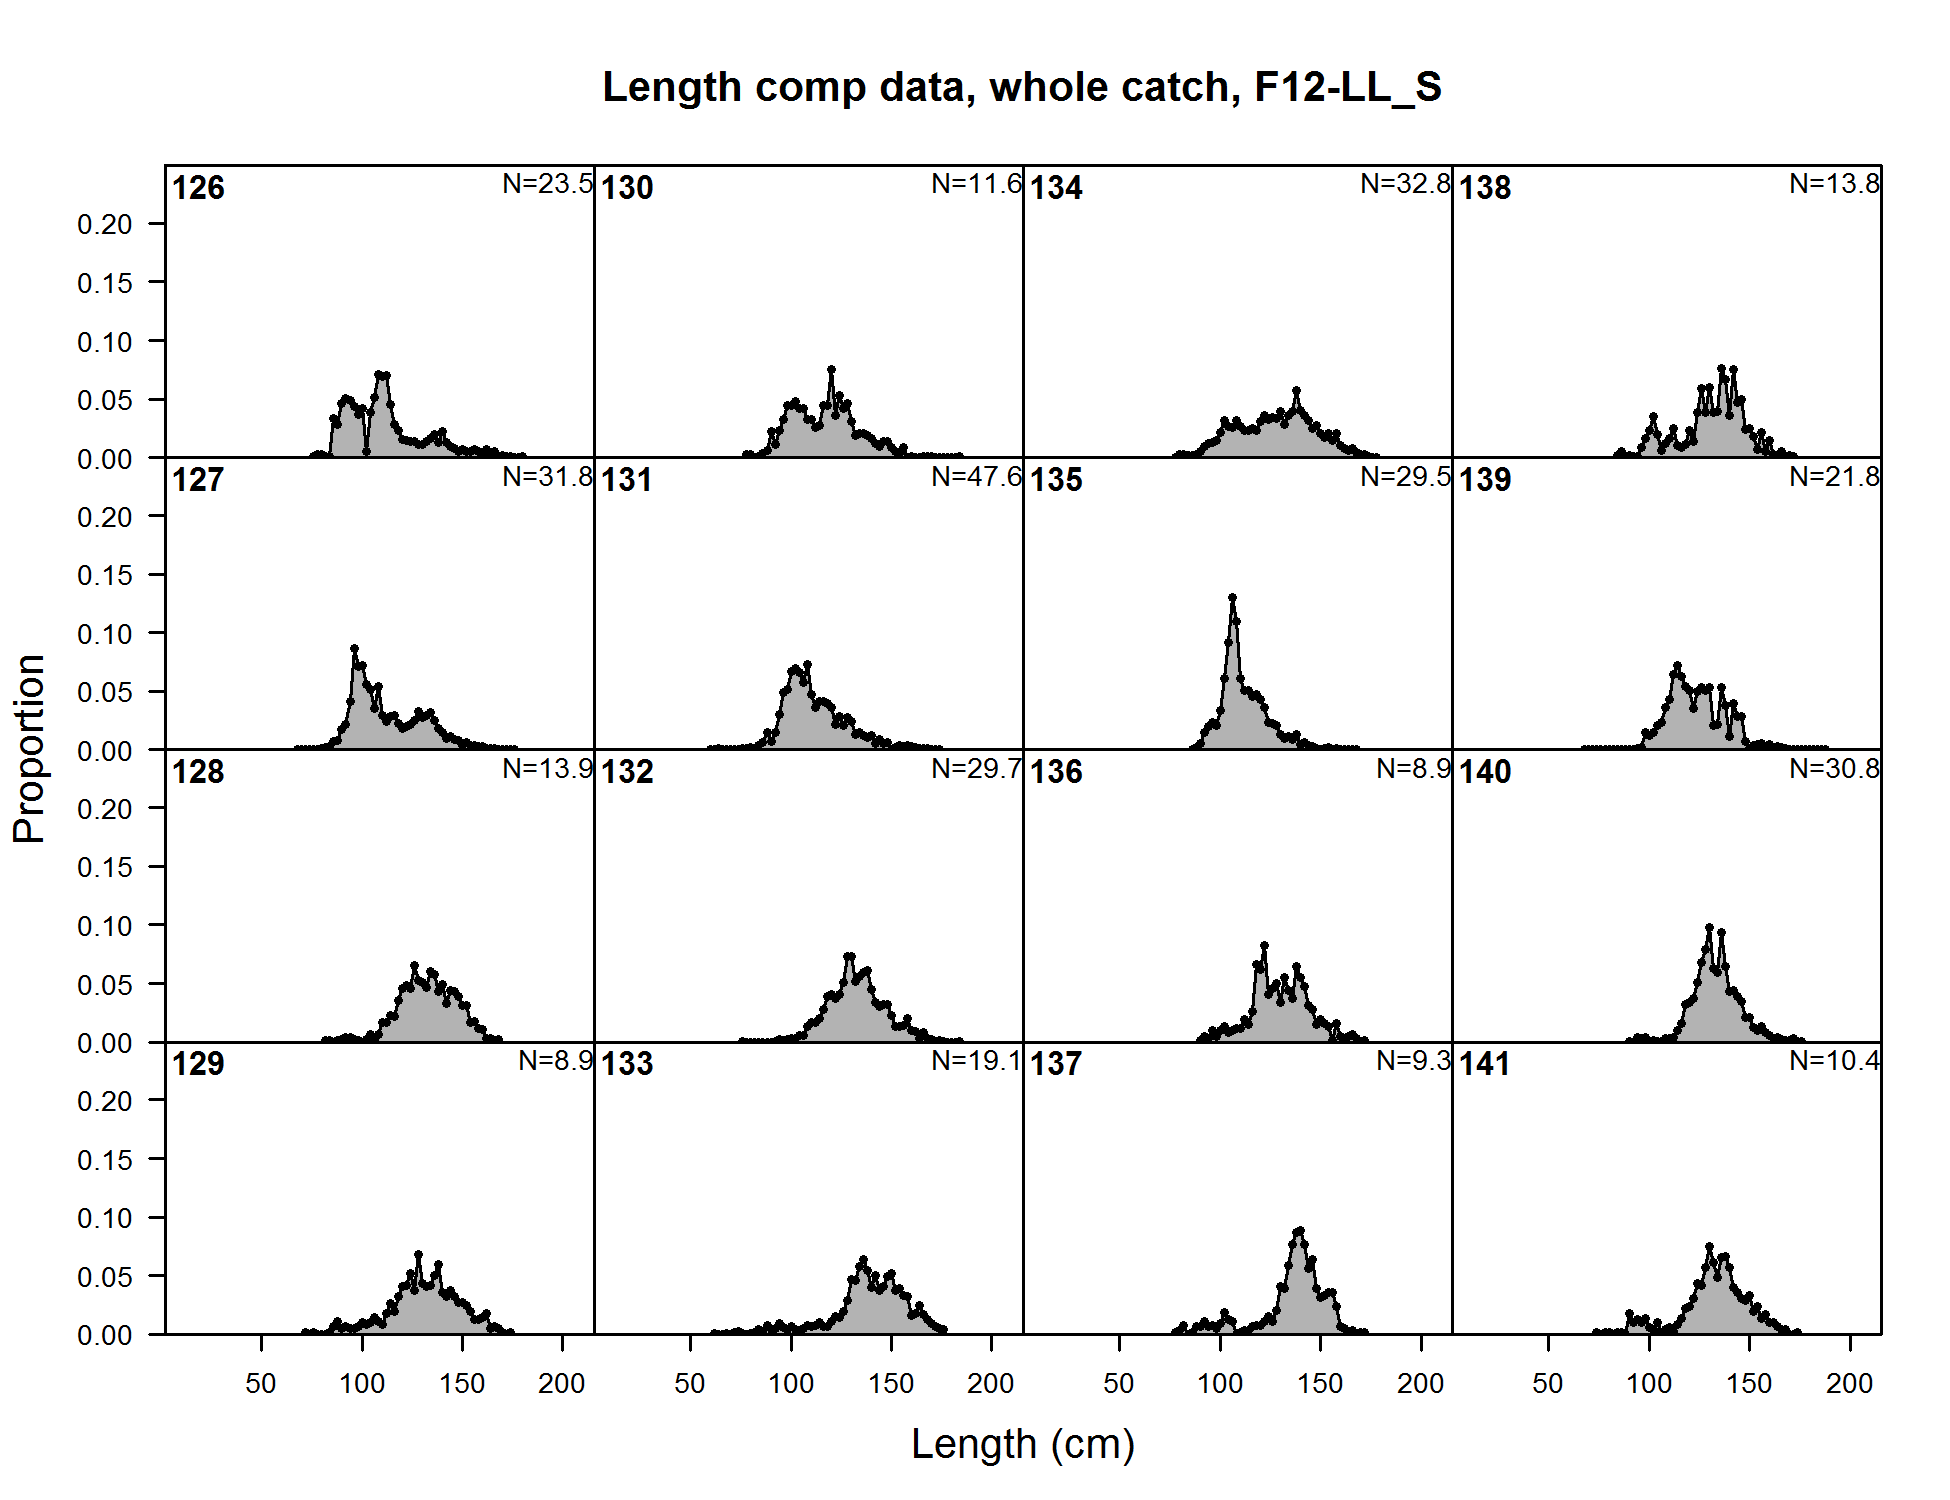
Length comp data, whole catch, F12-LL_S (plot 1 of 8) (plot 2 of 8) (plot 3 of 8) (plot 4 of 8)
file: comp_lendat_flt12mkt0_page4.png
Length comp data, whole catch, F12-LL_S (plot 1 of 8) (plot 2 of 8) (plot 3 of 8) (plot 4 of 8) (plot 5 of 8)
file: comp_lendat_flt12mkt0_page5.png
Length comp data, whole catch, F12-LL_S (plot 1 of 8) (plot 2 of 8) (plot 3 of 8) (plot 4 of 8) (plot 5 of 8) (plot 6 of 8)
file: comp_lendat_flt12mkt0_page6.png
Length comp data, whole catch, F12-LL_S (plot 1 of 8) (plot 2 of 8) (plot 3 of 8) (plot 4 of 8) (plot 5 of 8) (plot 6 of 8) (plot 7 of 8)
file: comp_lendat_flt12mkt0_page7.png
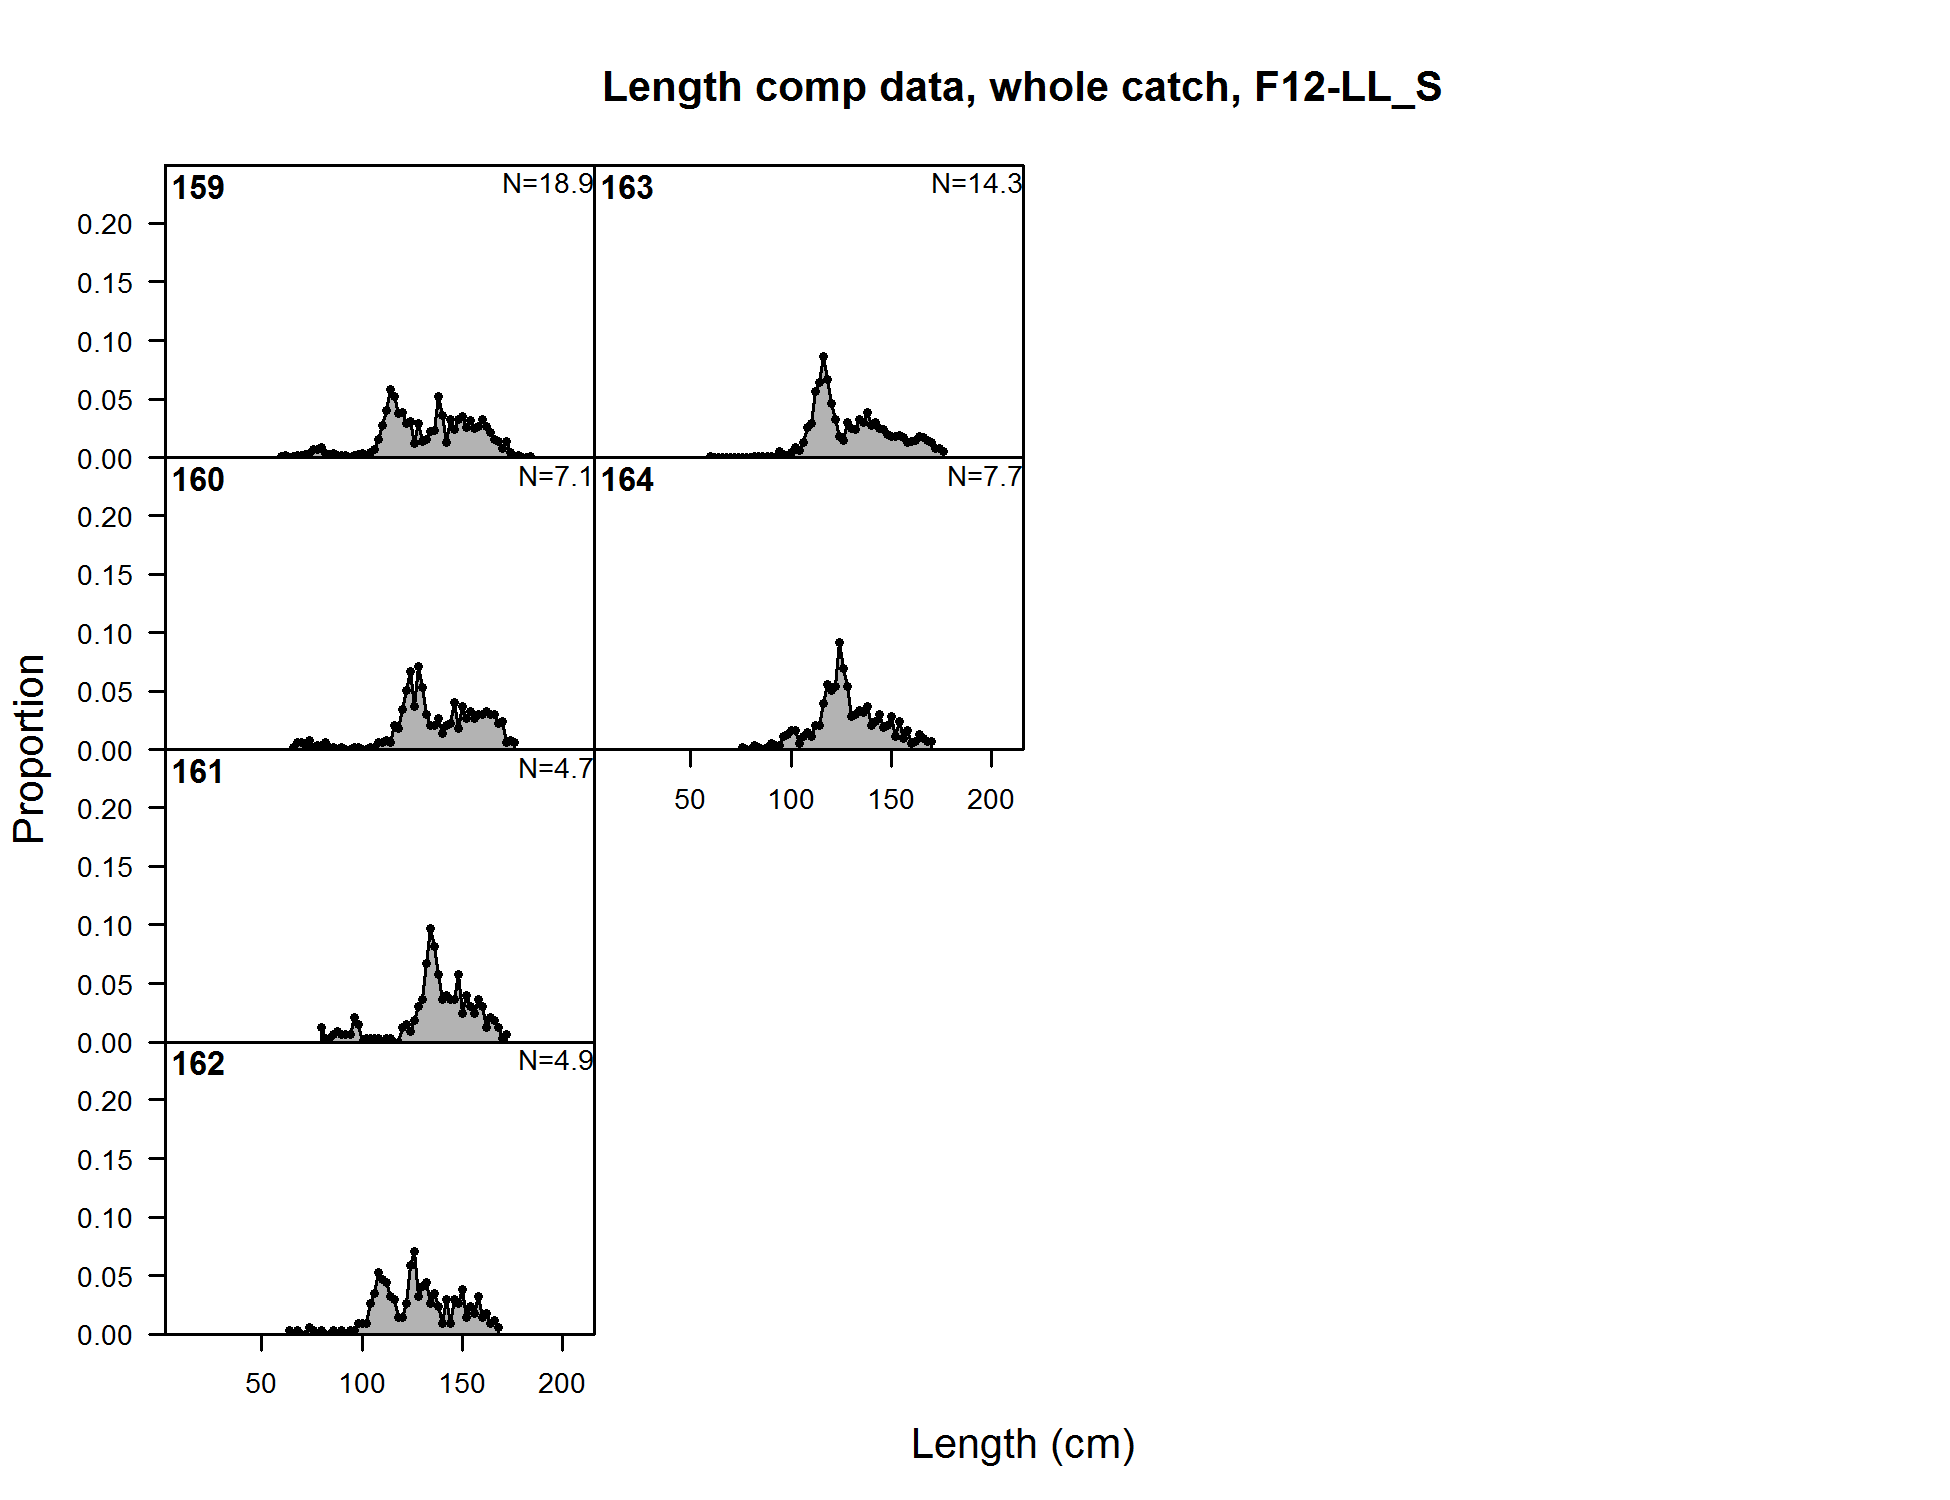
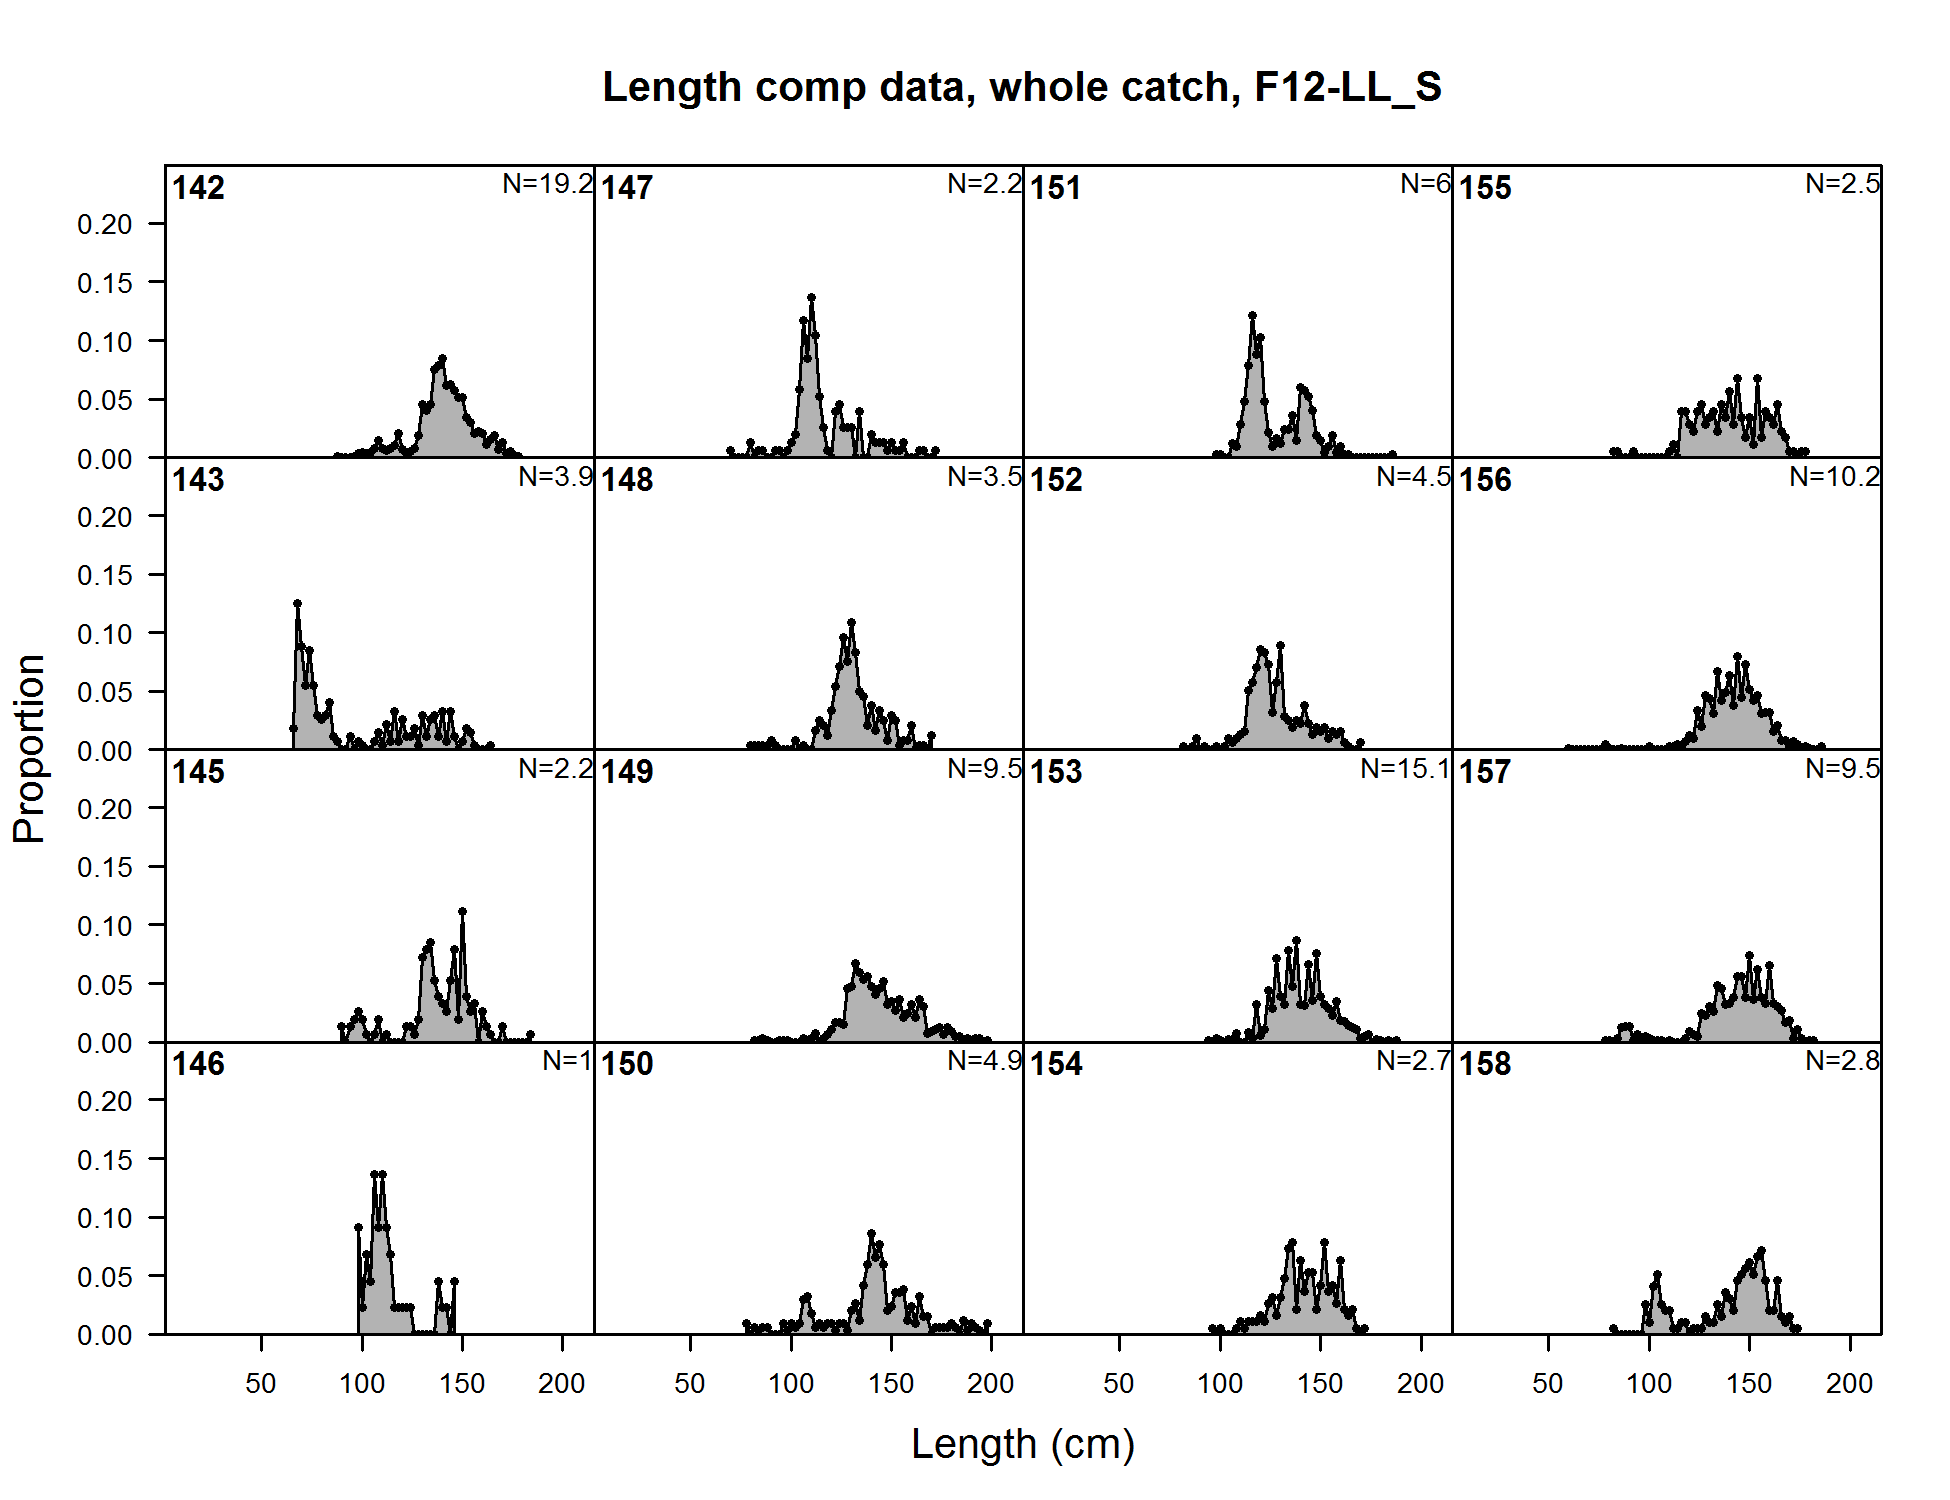
Length comp data, whole catch, F12-LL_S (plot 1 of 8) (plot 2 of 8) (plot 3 of 8) (plot 4 of 8) (plot 5 of 8) (plot 6 of 8) (plot 7 of 8) (plot 8 of 8)
file: comp_lendat_flt12mkt0_page8.png
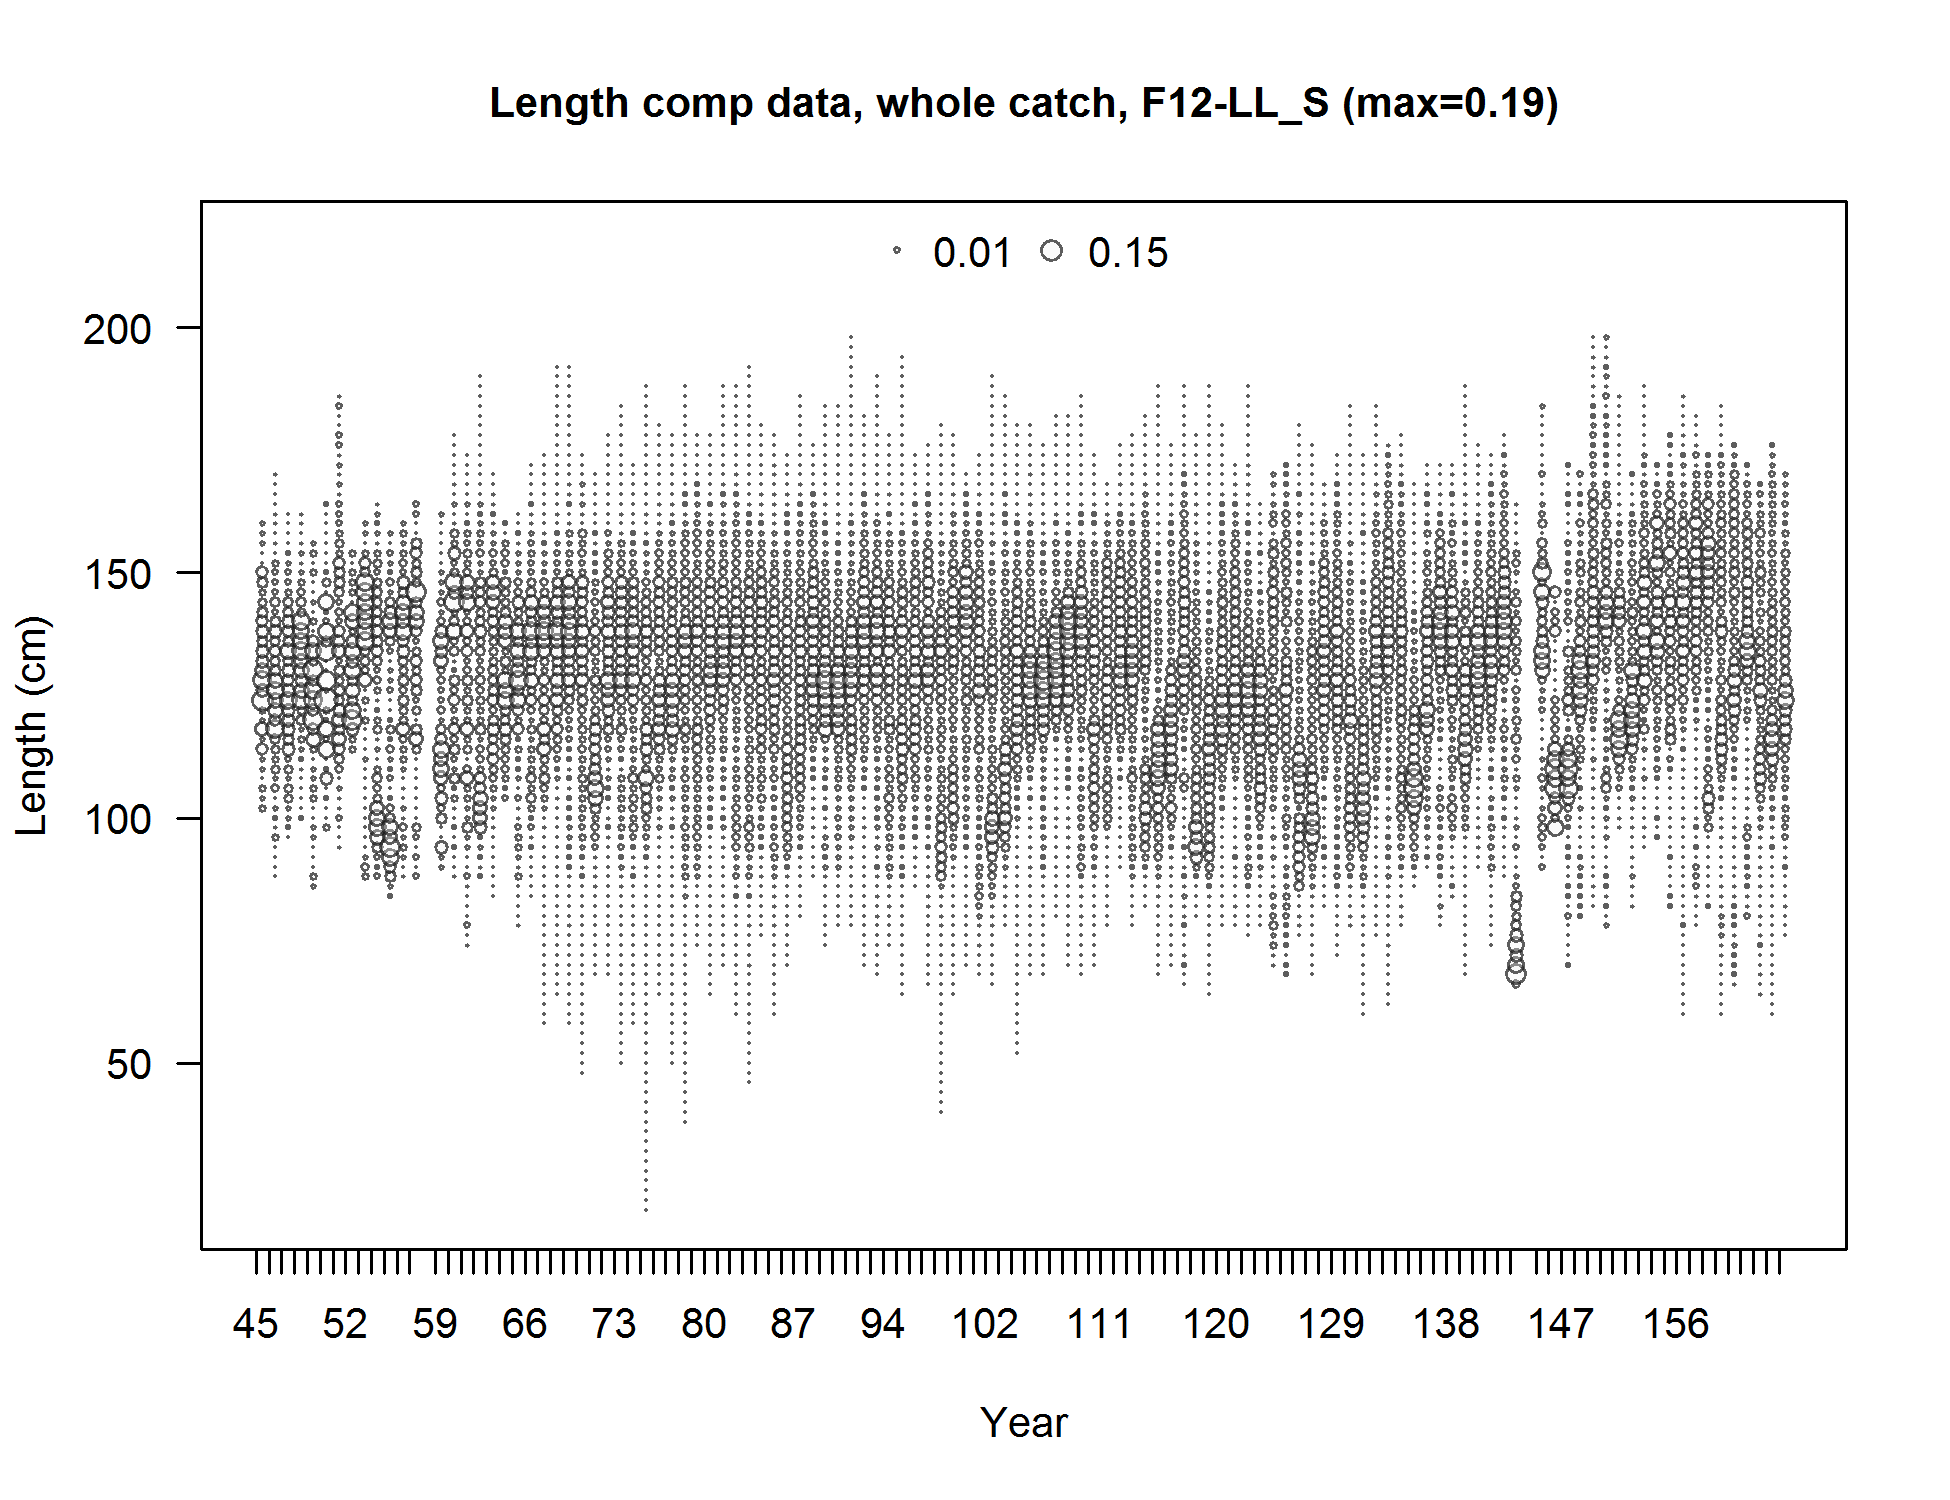
Length comp data, whole catch, F12-LL_S (max=0.19) (plot 8 of 8)
file: comp_lendat_bubflt12mkt0_page8.png
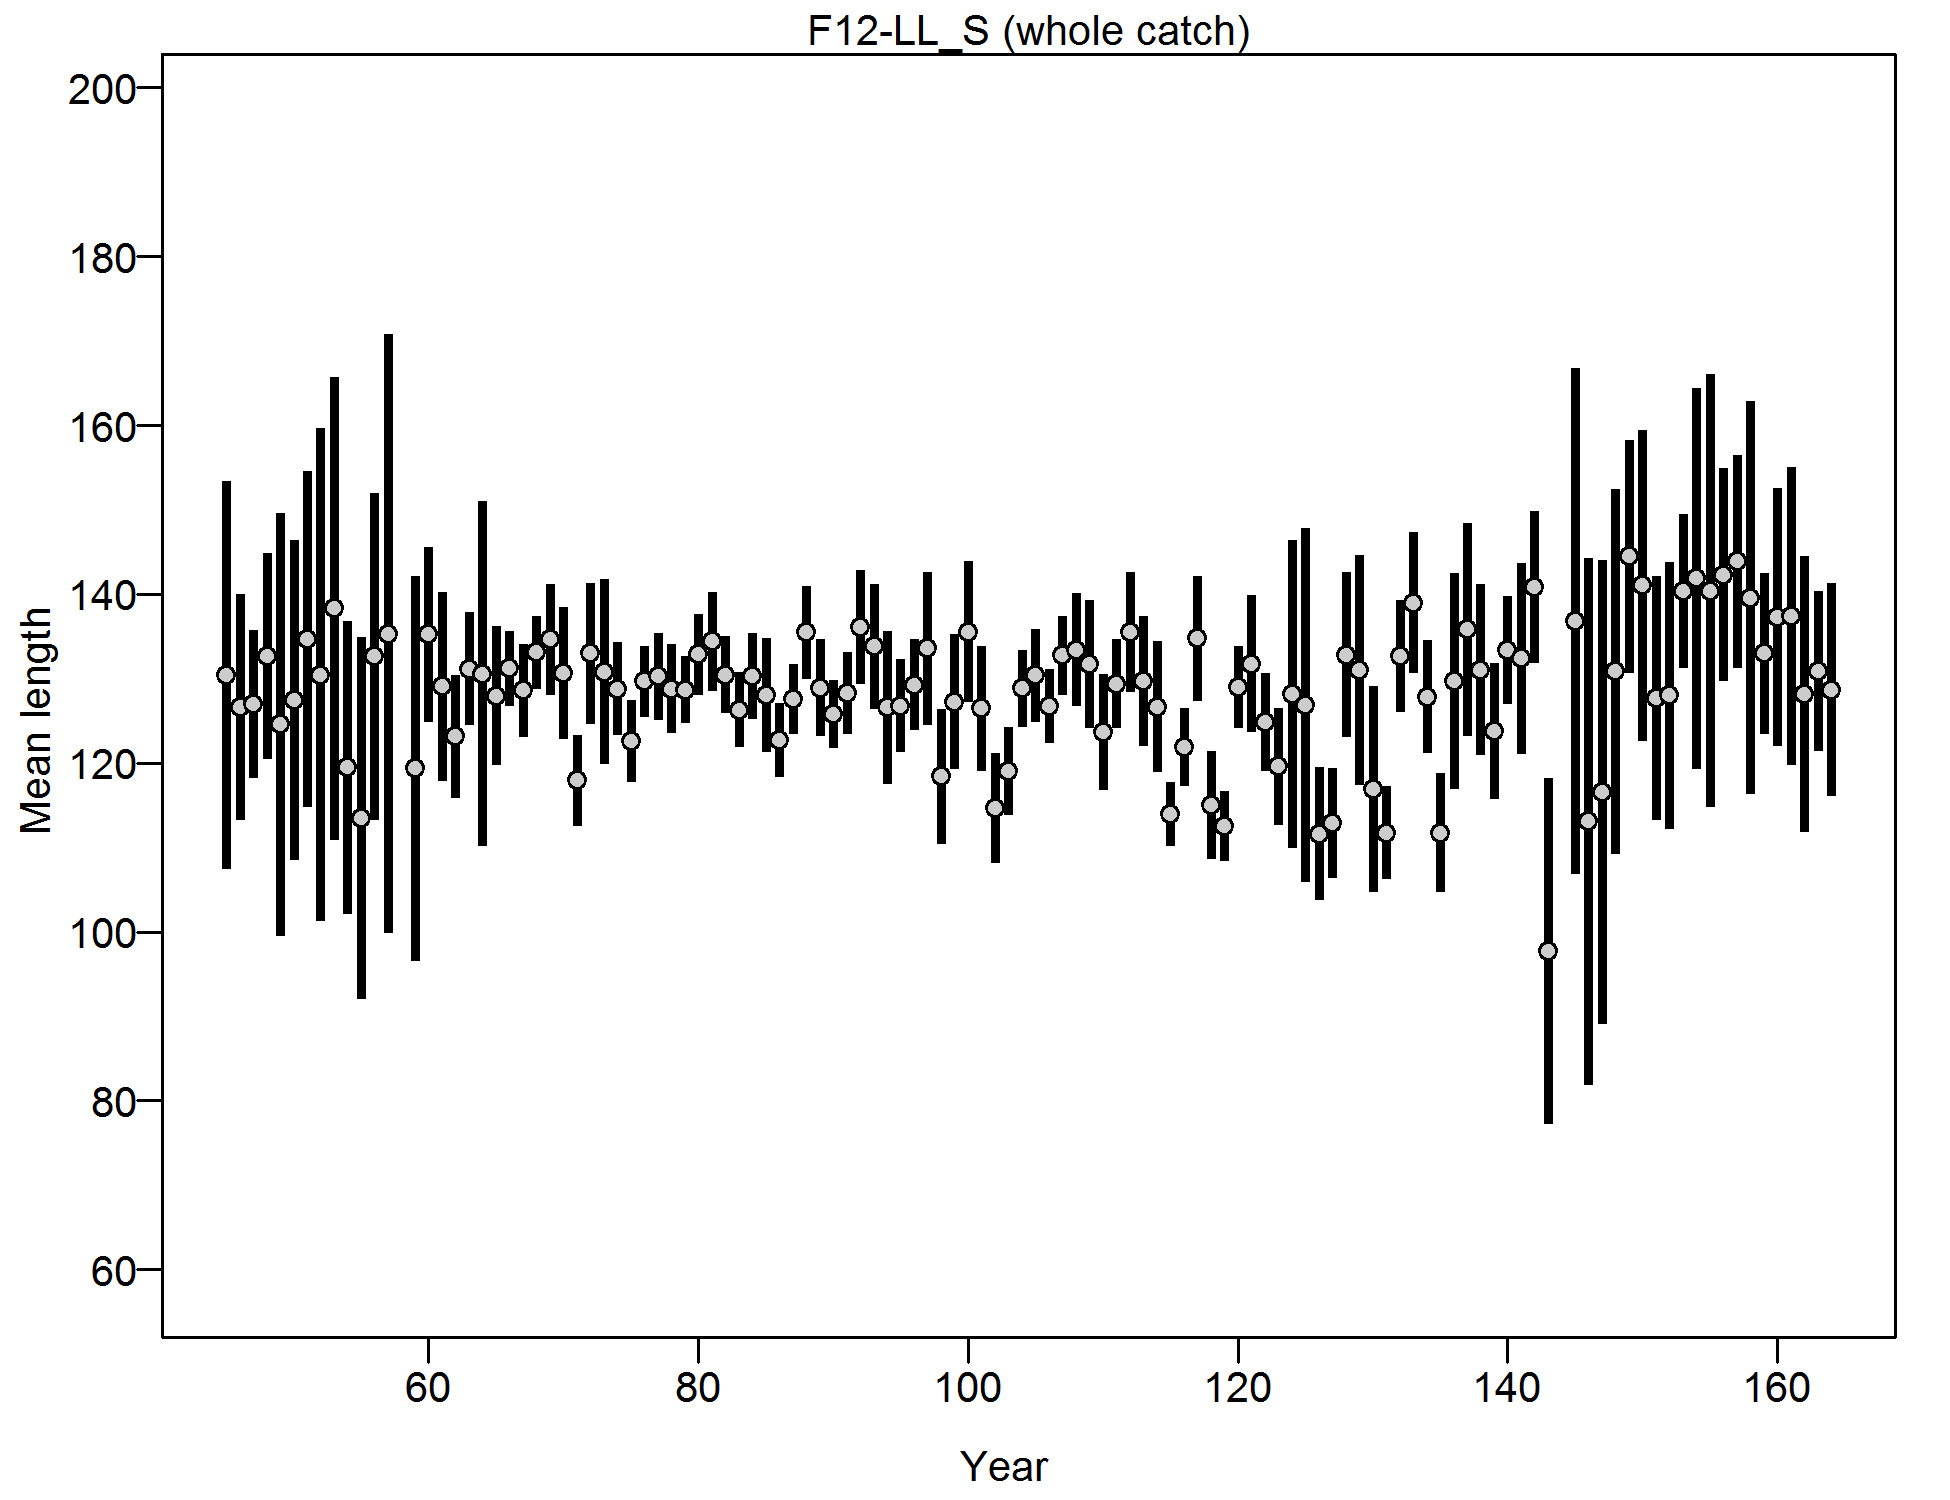
Mean length for F12-LL_S with 95% confidence intervals based on current samples sizes.
file: comp_lendat_data_weighting_TA1.8_F12-LL_S.png
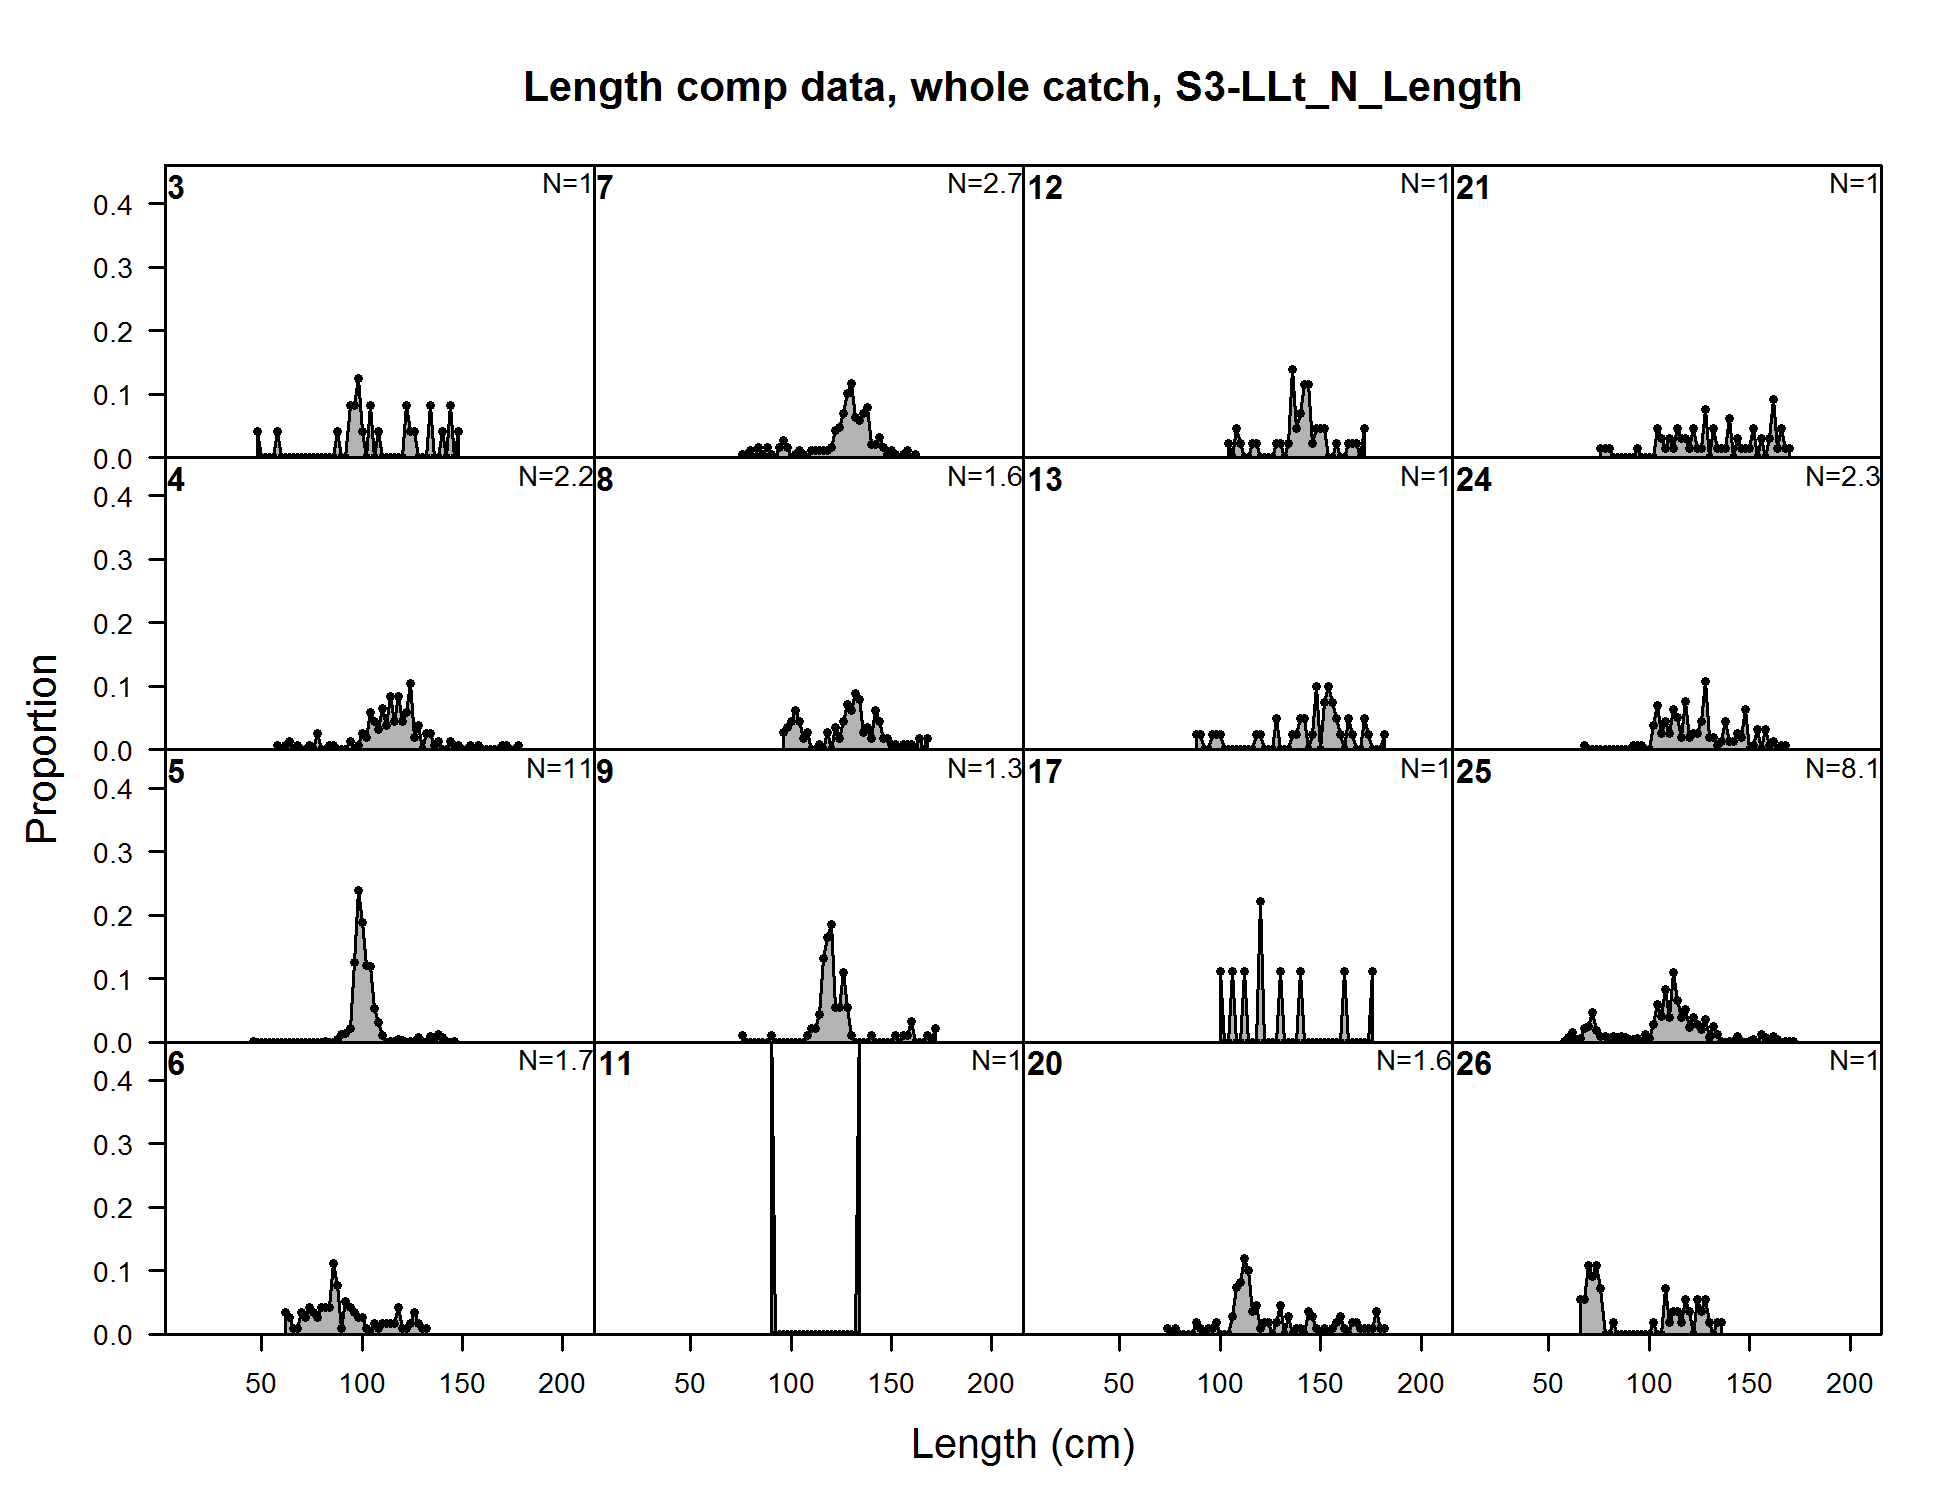
Length comp data, whole catch, S3-LLt_N_Length (plot 1 of 5)
file: comp_lendat_flt19mkt0_page1.png
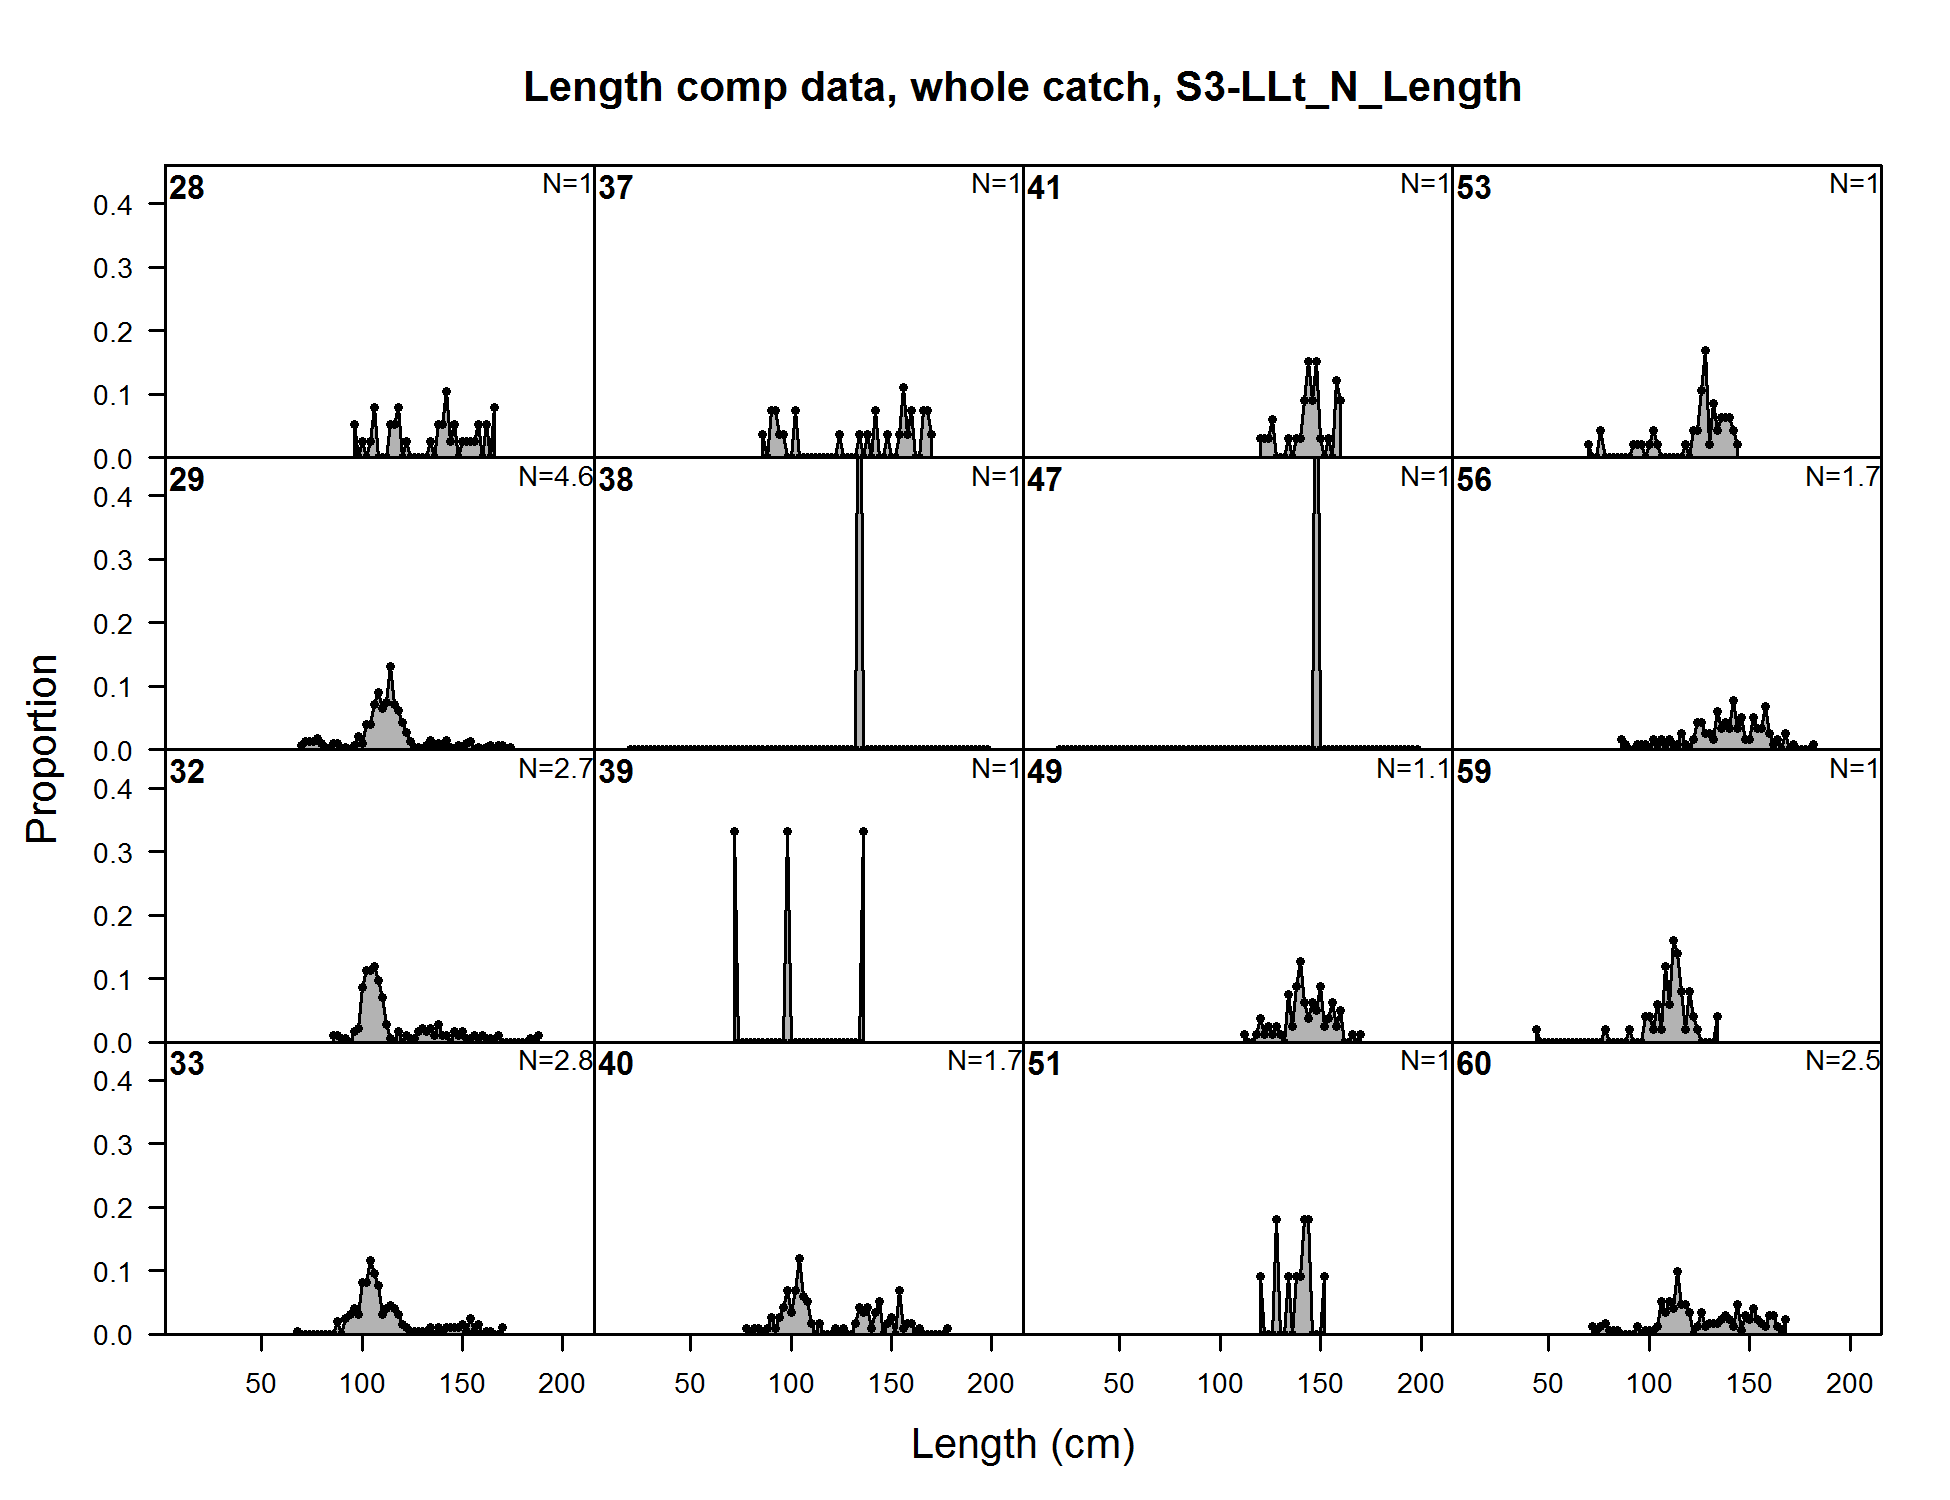
Length comp data, whole catch, S3-LLt_N_Length (plot 1 of 5) (plot 2 of 5)
file: comp_lendat_flt19mkt0_page2.png
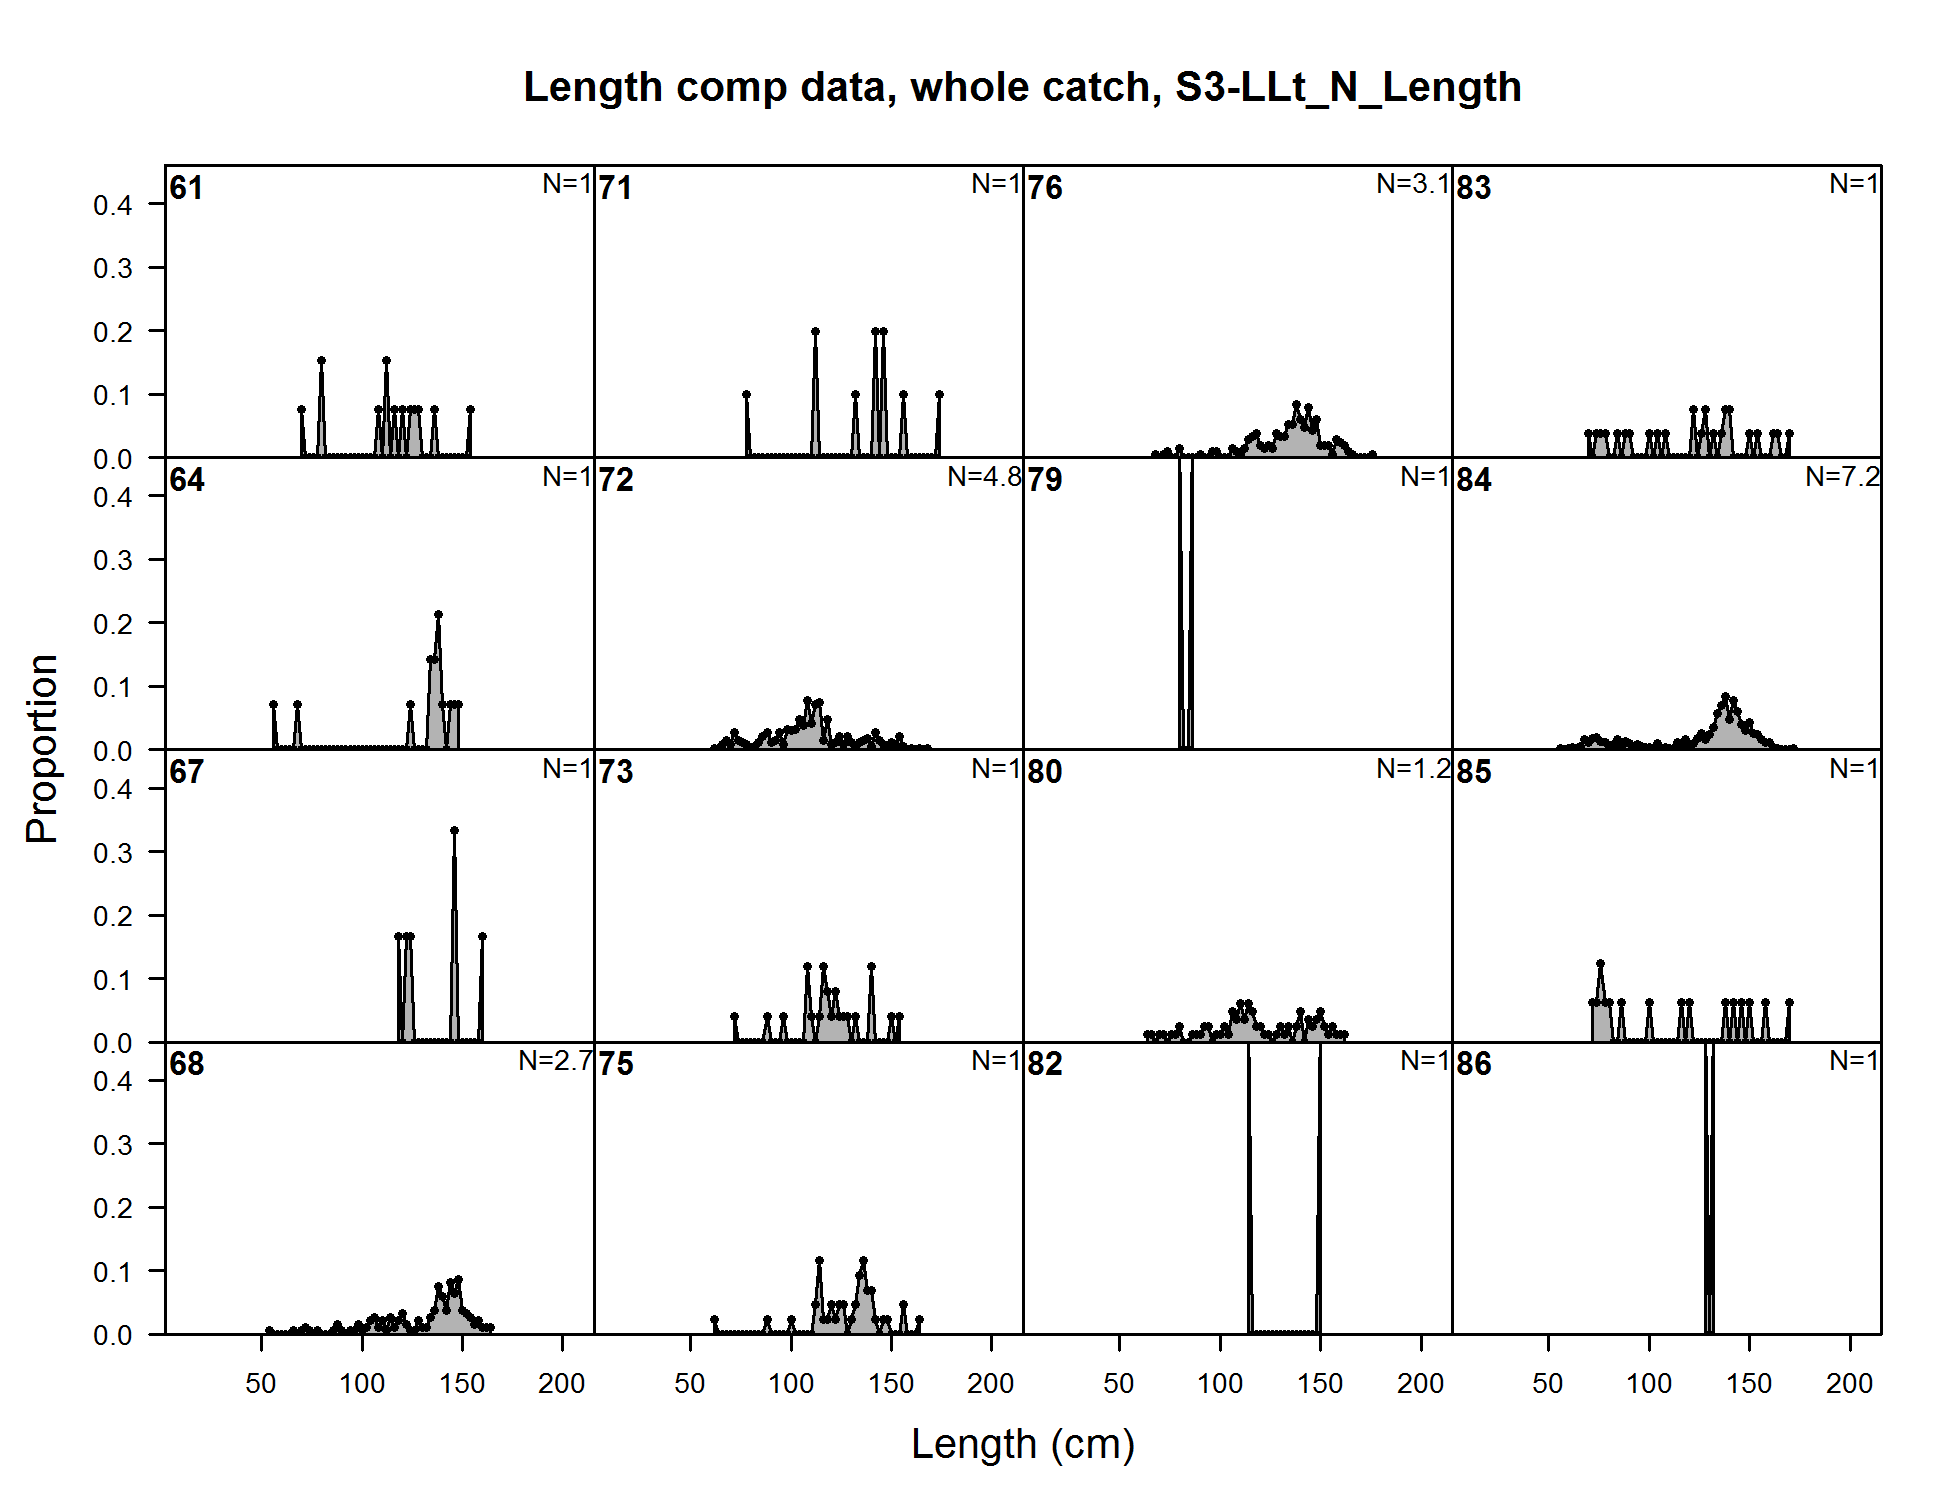
Length comp data, whole catch, S3-LLt_N_Length (plot 1 of 5) (plot 2 of 5) (plot 3 of 5)
file: comp_lendat_flt19mkt0_page3.png
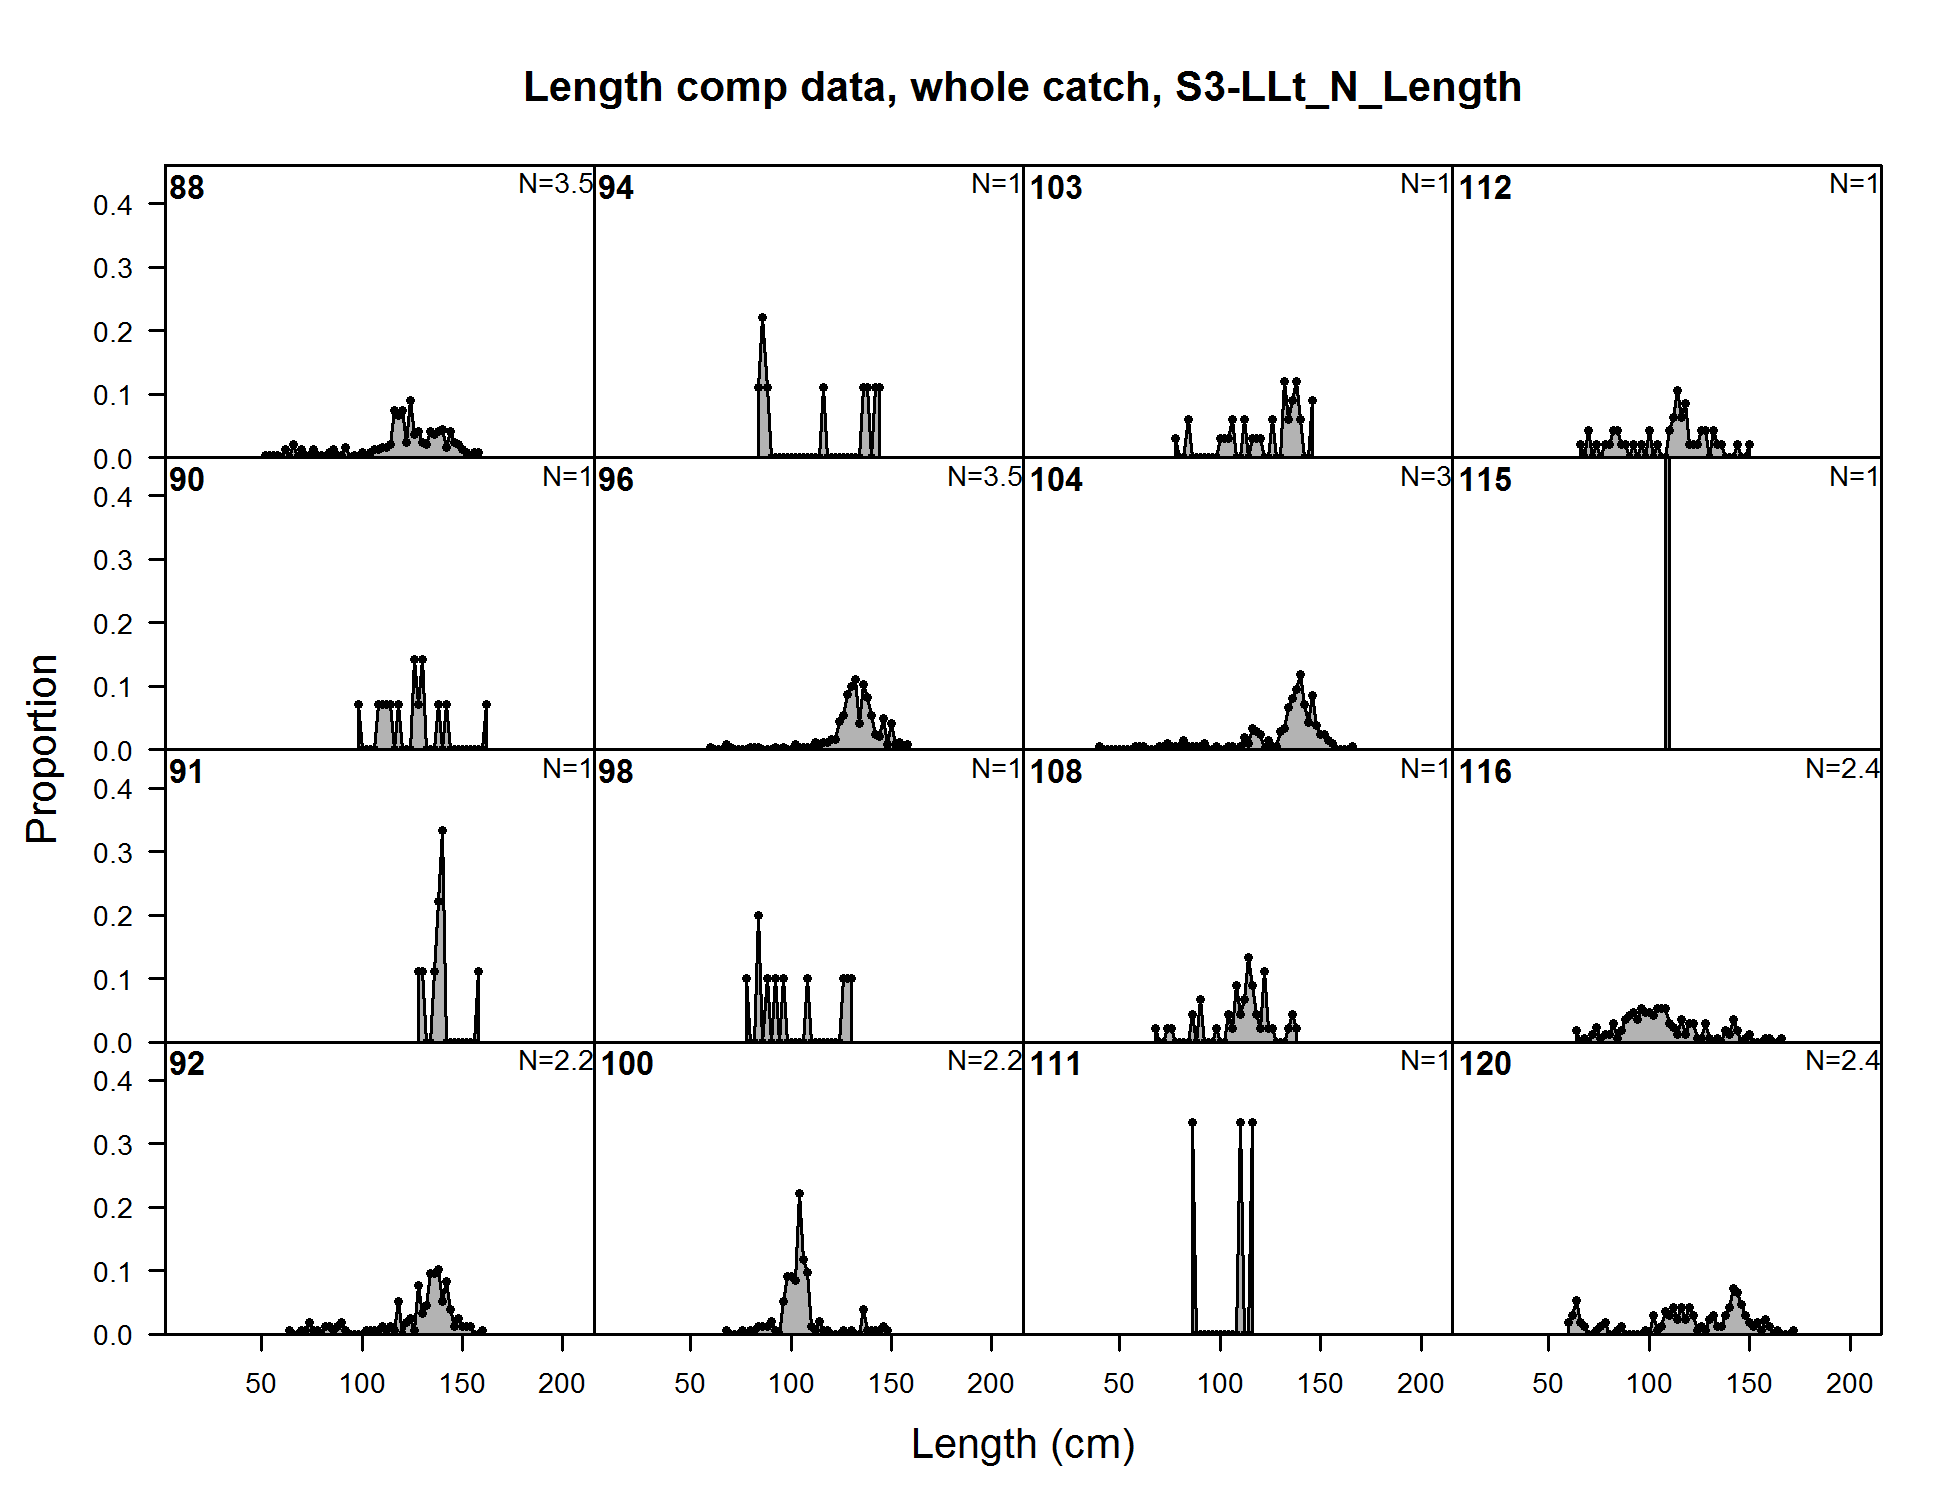
Length comp data, whole catch, S3-LLt_N_Length (plot 1 of 5) (plot 2 of 5) (plot 3 of 5) (plot 4 of 5)
file: comp_lendat_flt19mkt0_page4.png
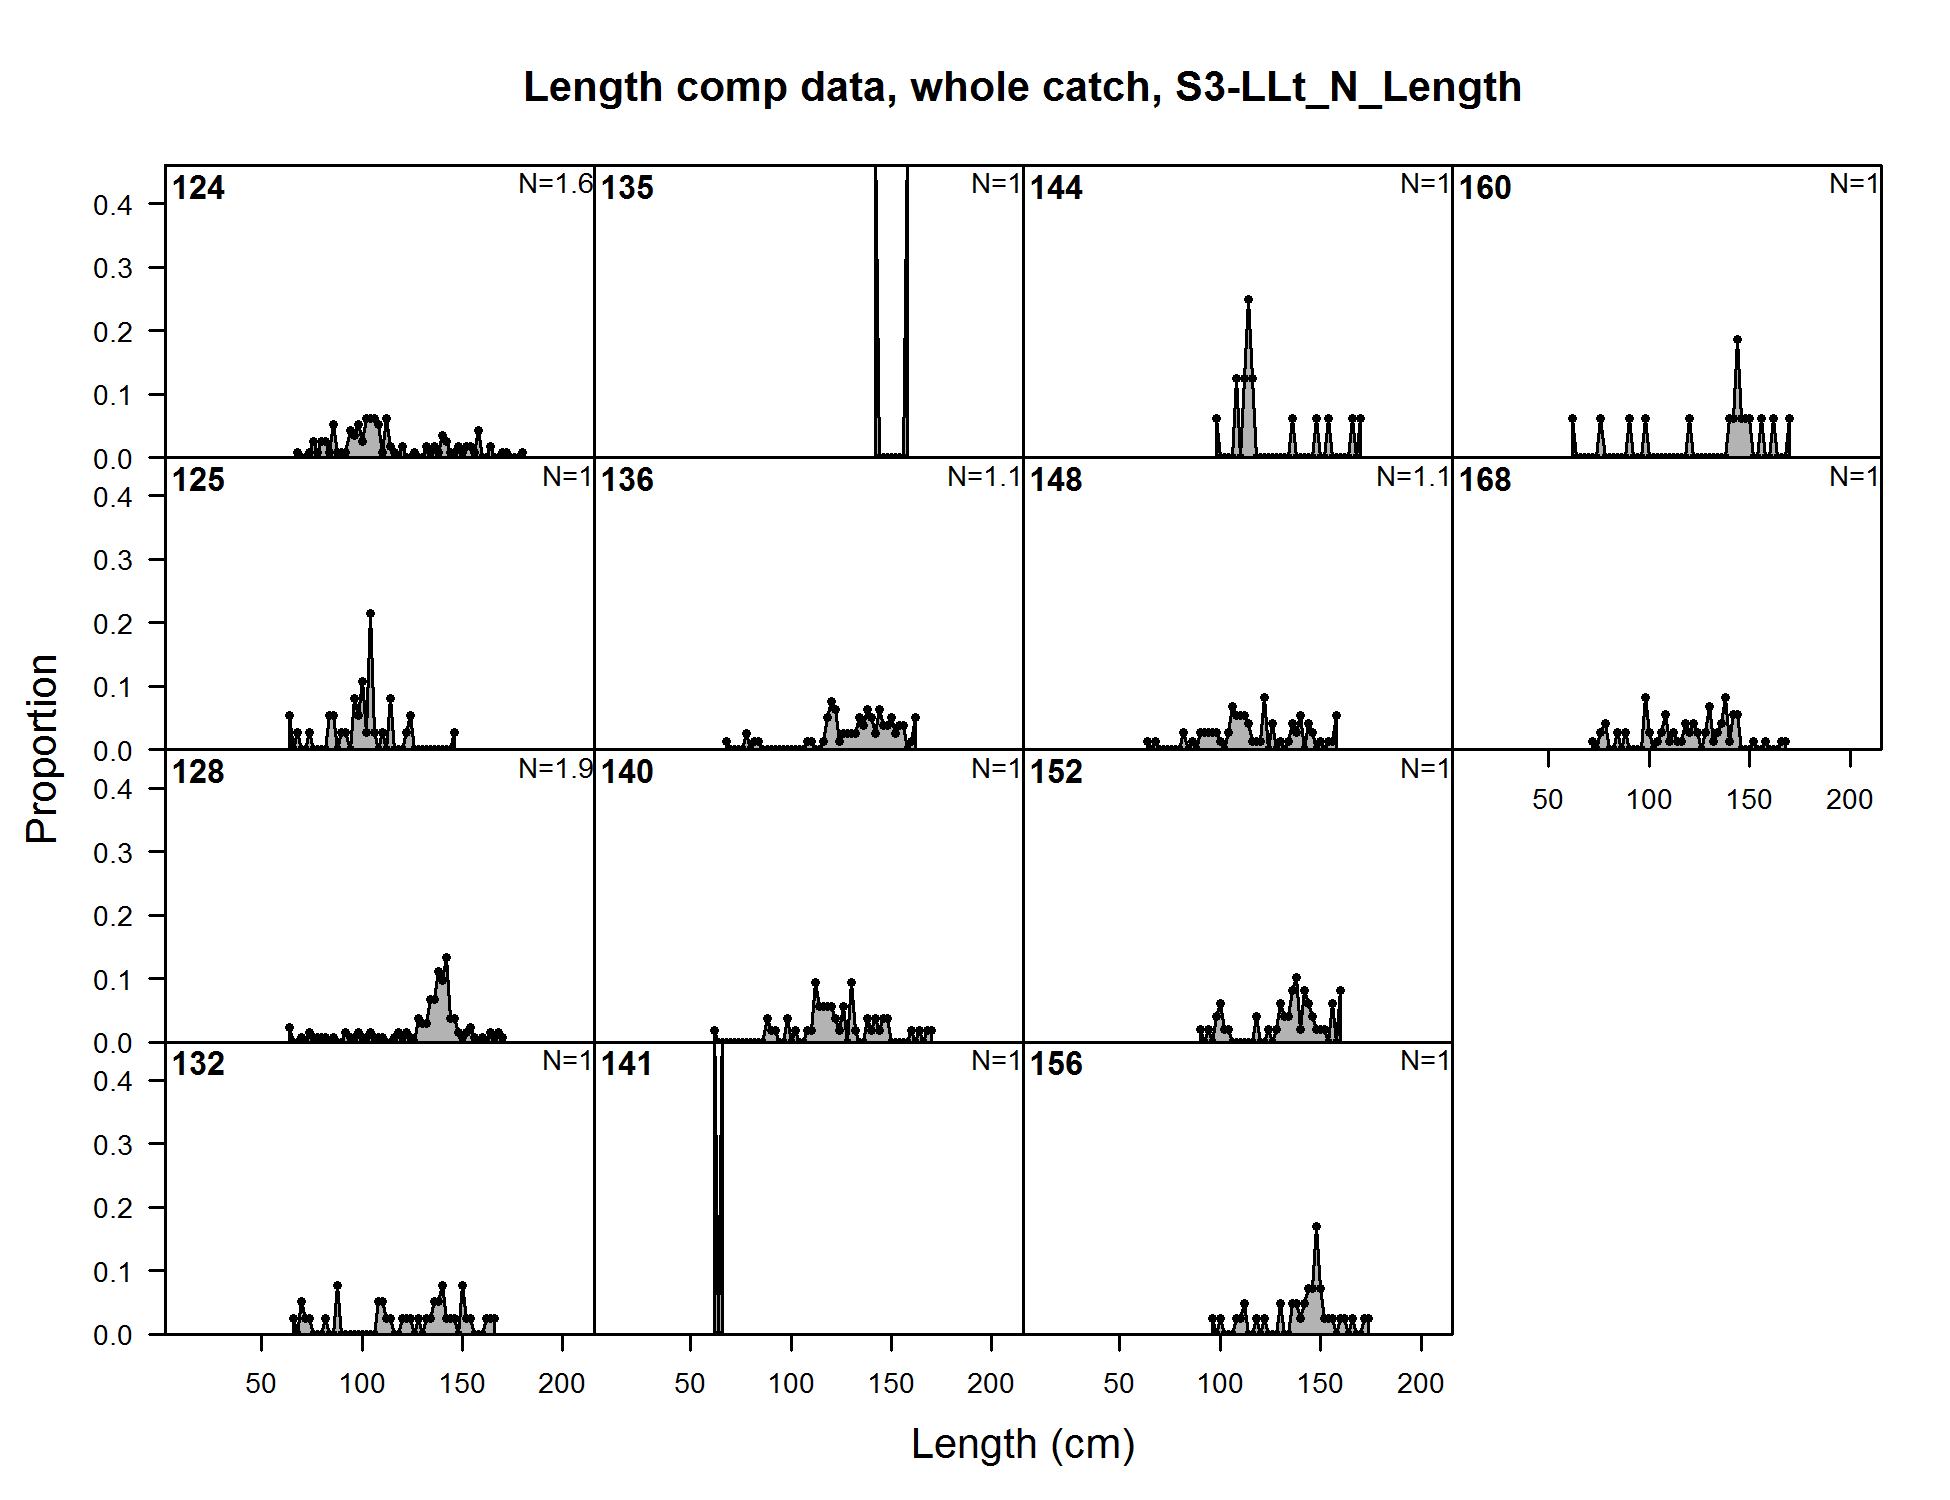
Length comp data, whole catch, S3-LLt_N_Length (plot 1 of 5) (plot 2 of 5) (plot 3 of 5) (plot 4 of 5) (plot 5 of 5)
file: comp_lendat_flt19mkt0_page5.png
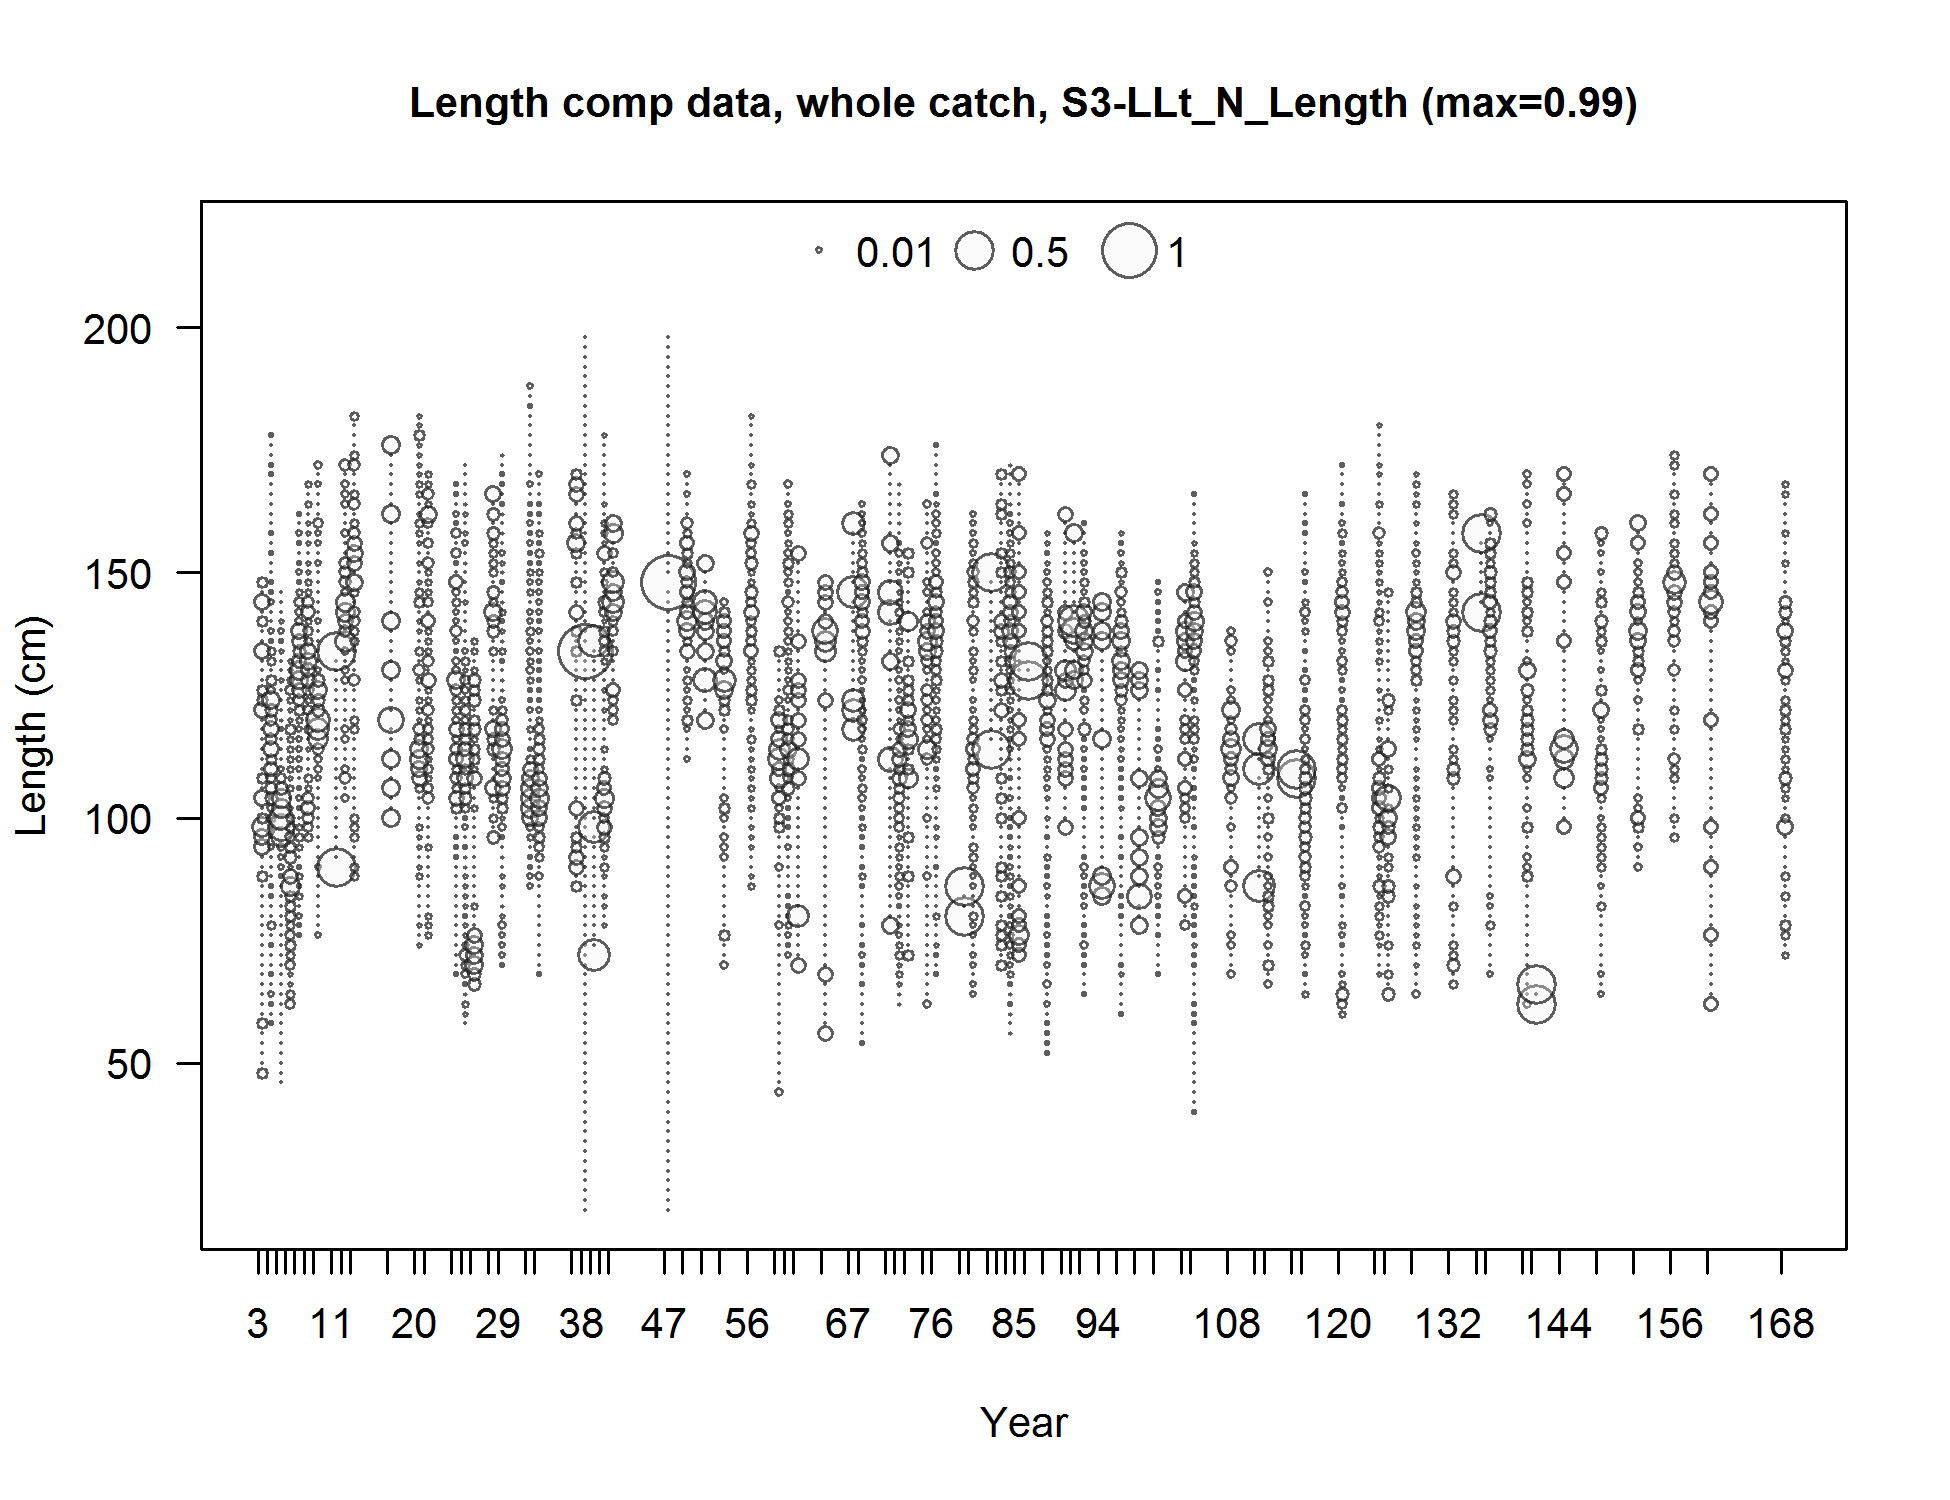
Length comp data, whole catch, S3-LLt_N_Length (max=0.99) (plot 5 of 5)
file: comp_lendat_bubflt19mkt0_page5.png
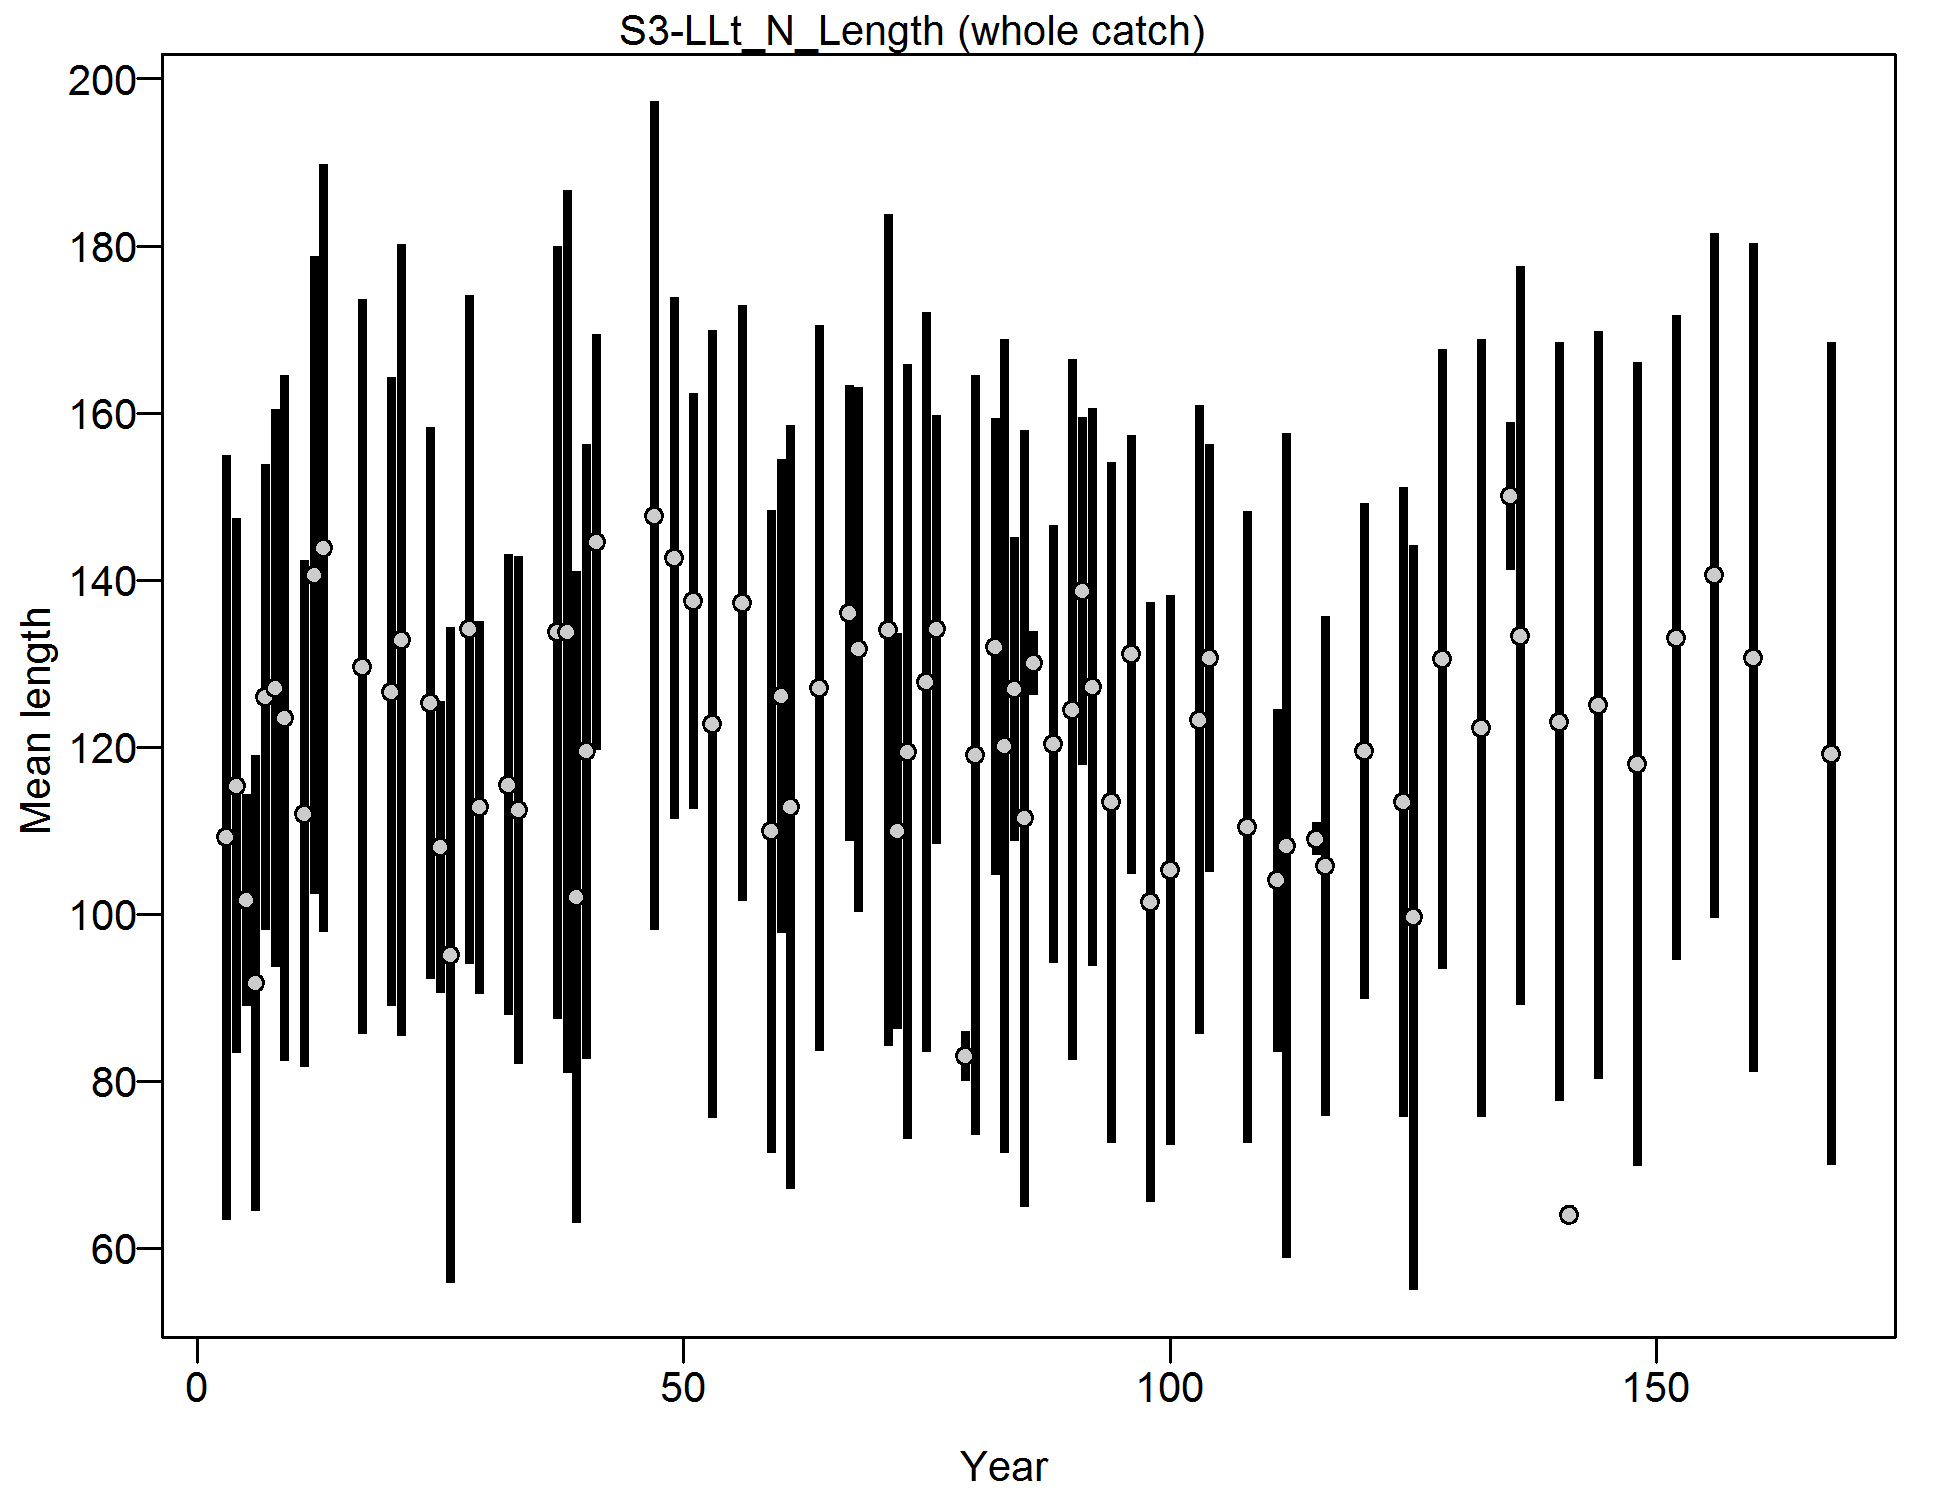
Mean length for S3-LLt_N_Length with 95% confidence intervals based on current samples sizes.
file: comp_lendat_data_weighting_TA1.8_S3-LLt_N_Length.png
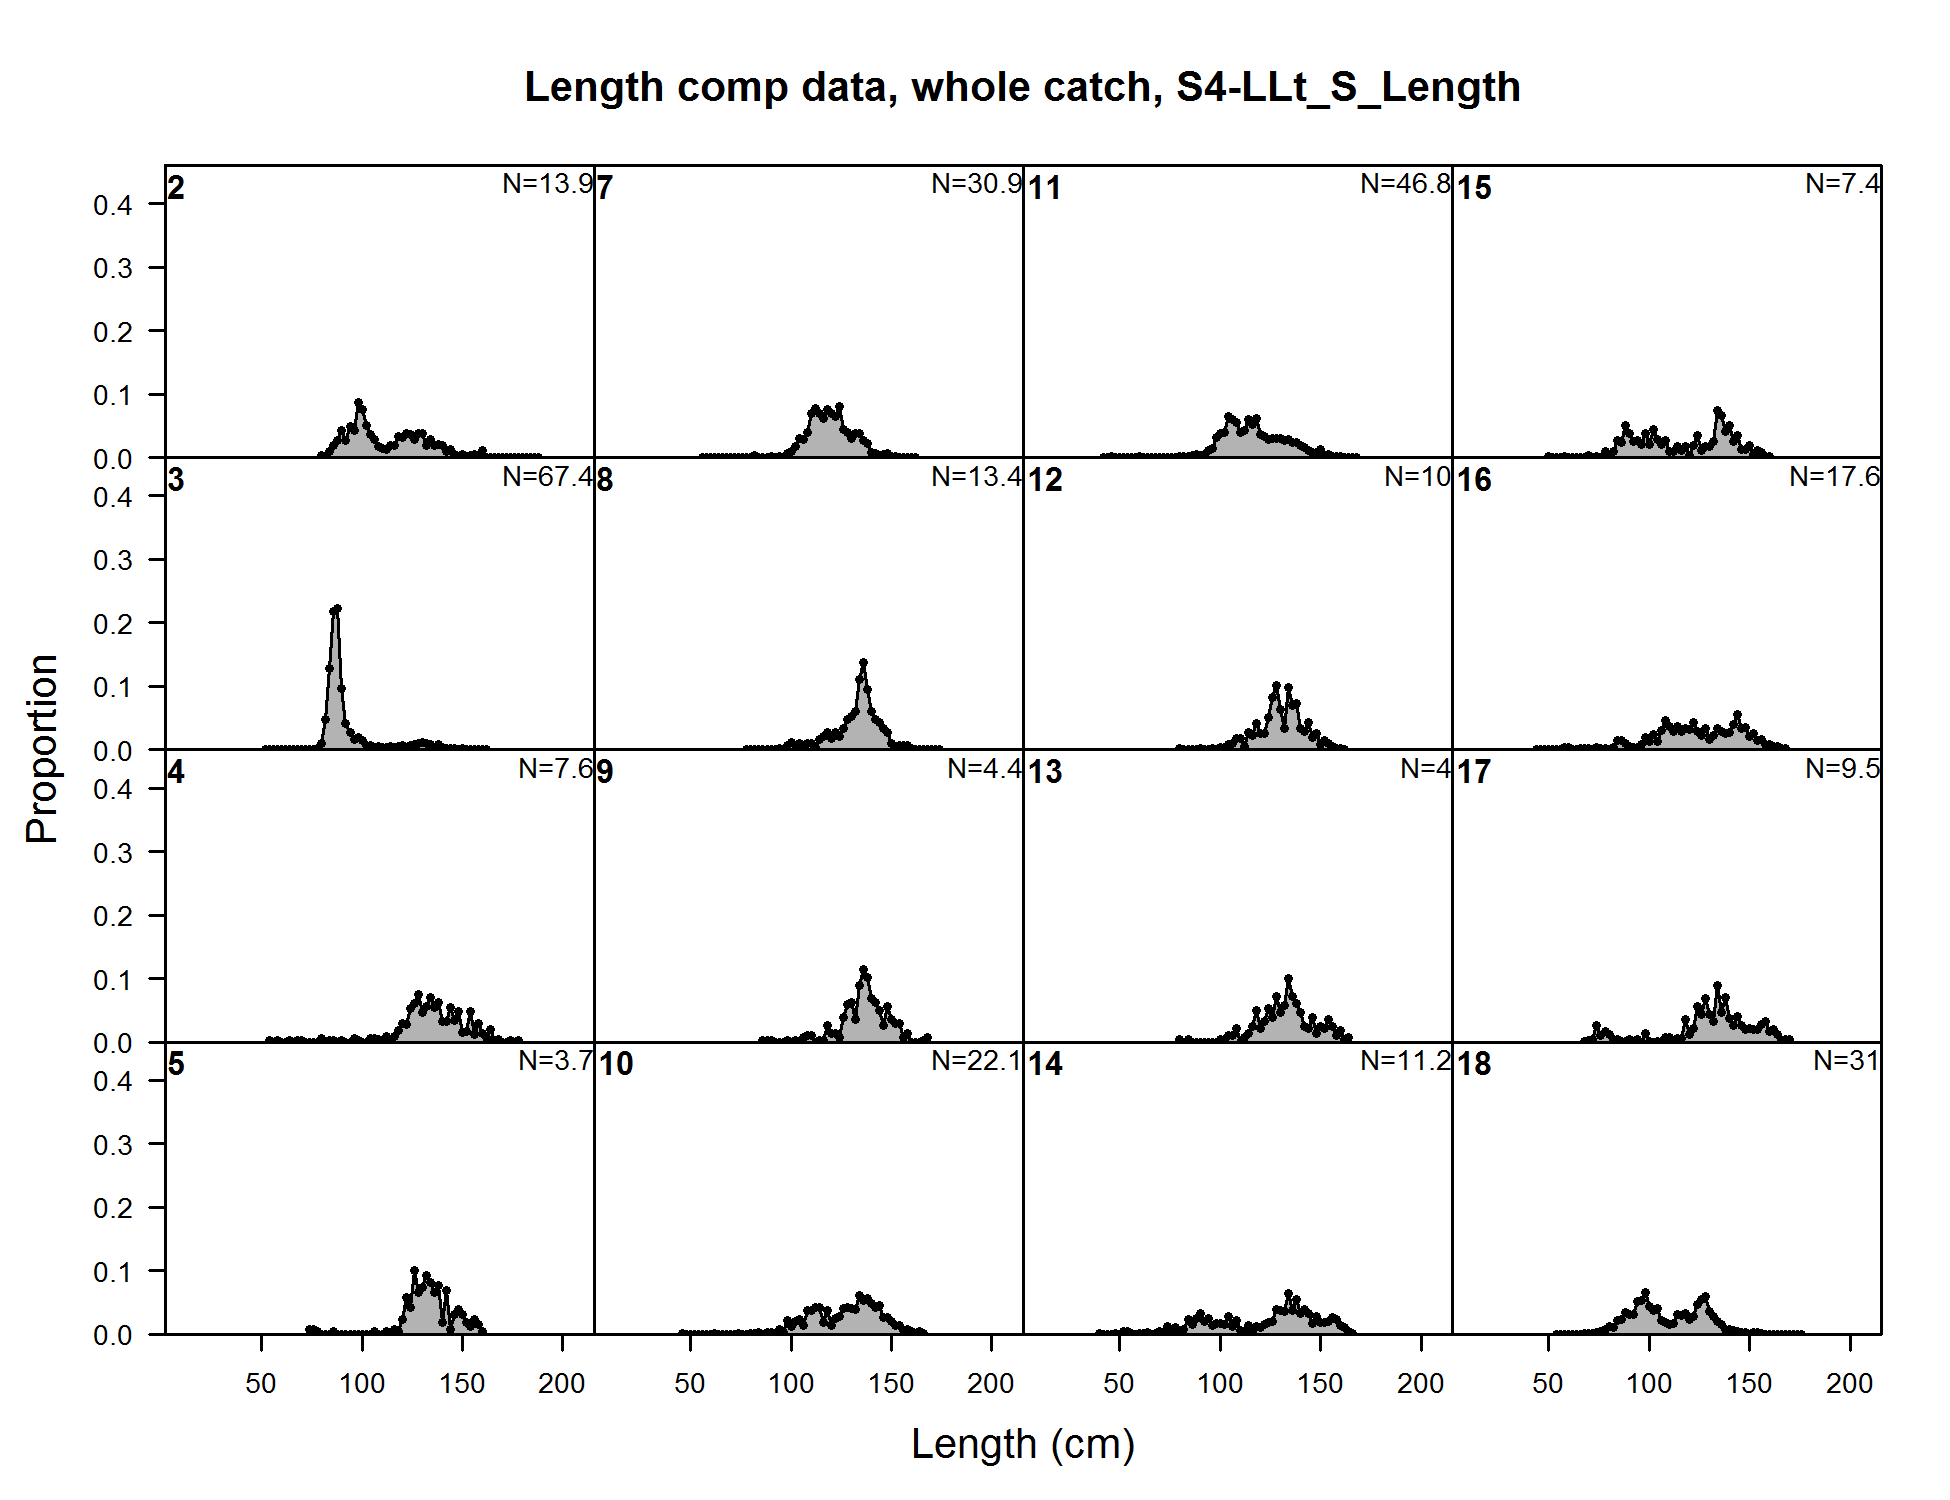
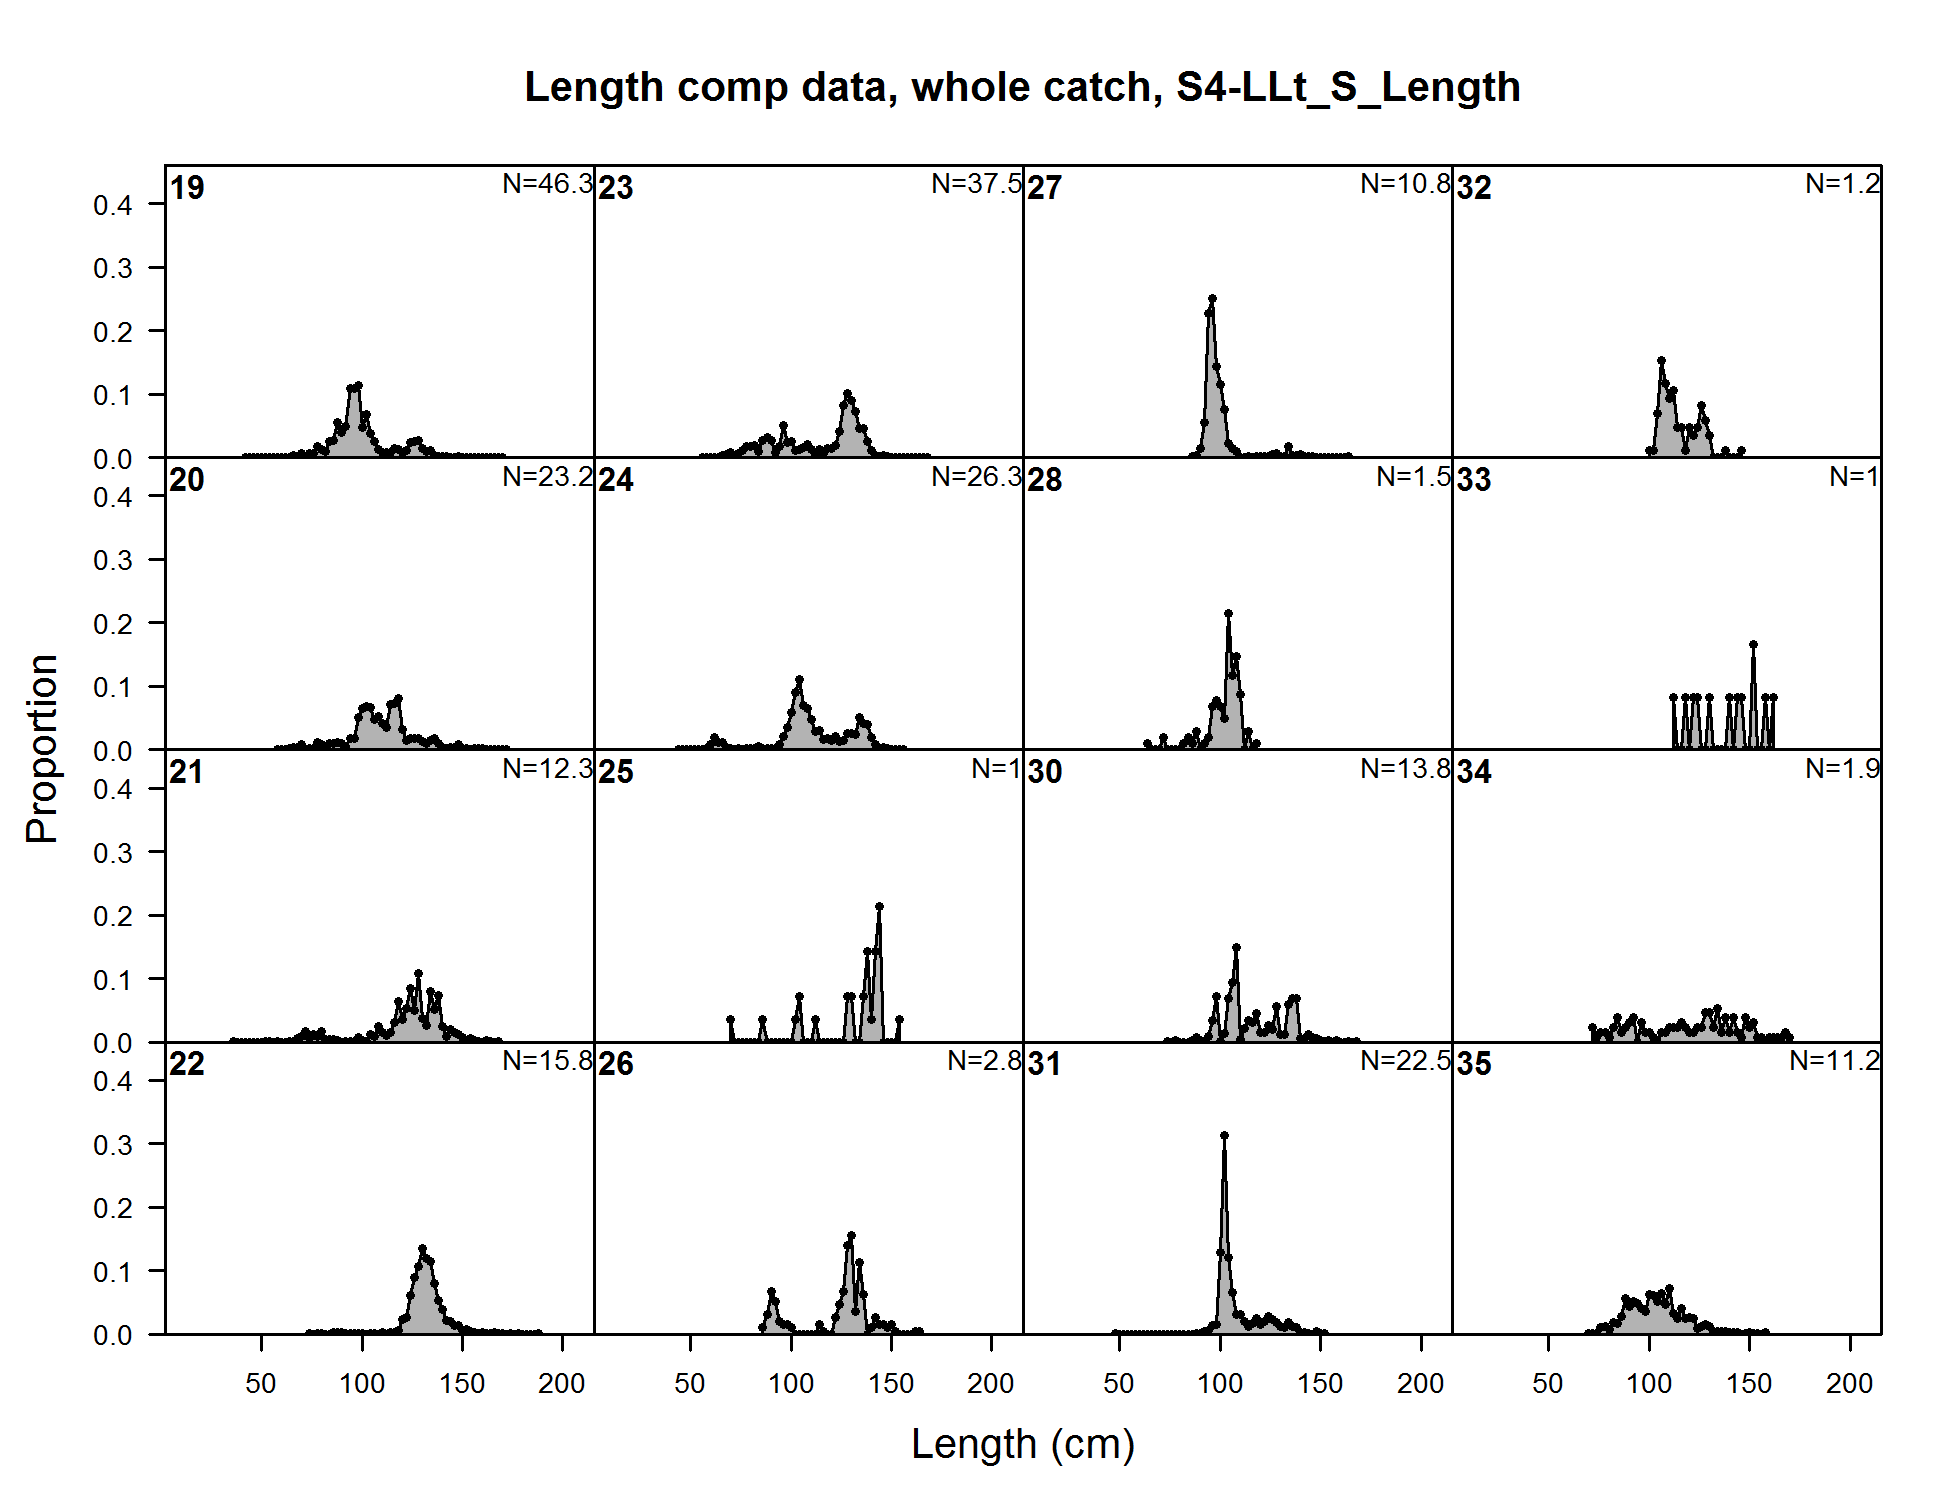
Length comp data, whole catch, S4-LLt_S_Length (plot 1 of 6)
file: comp_lendat_flt20mkt0_page1.png
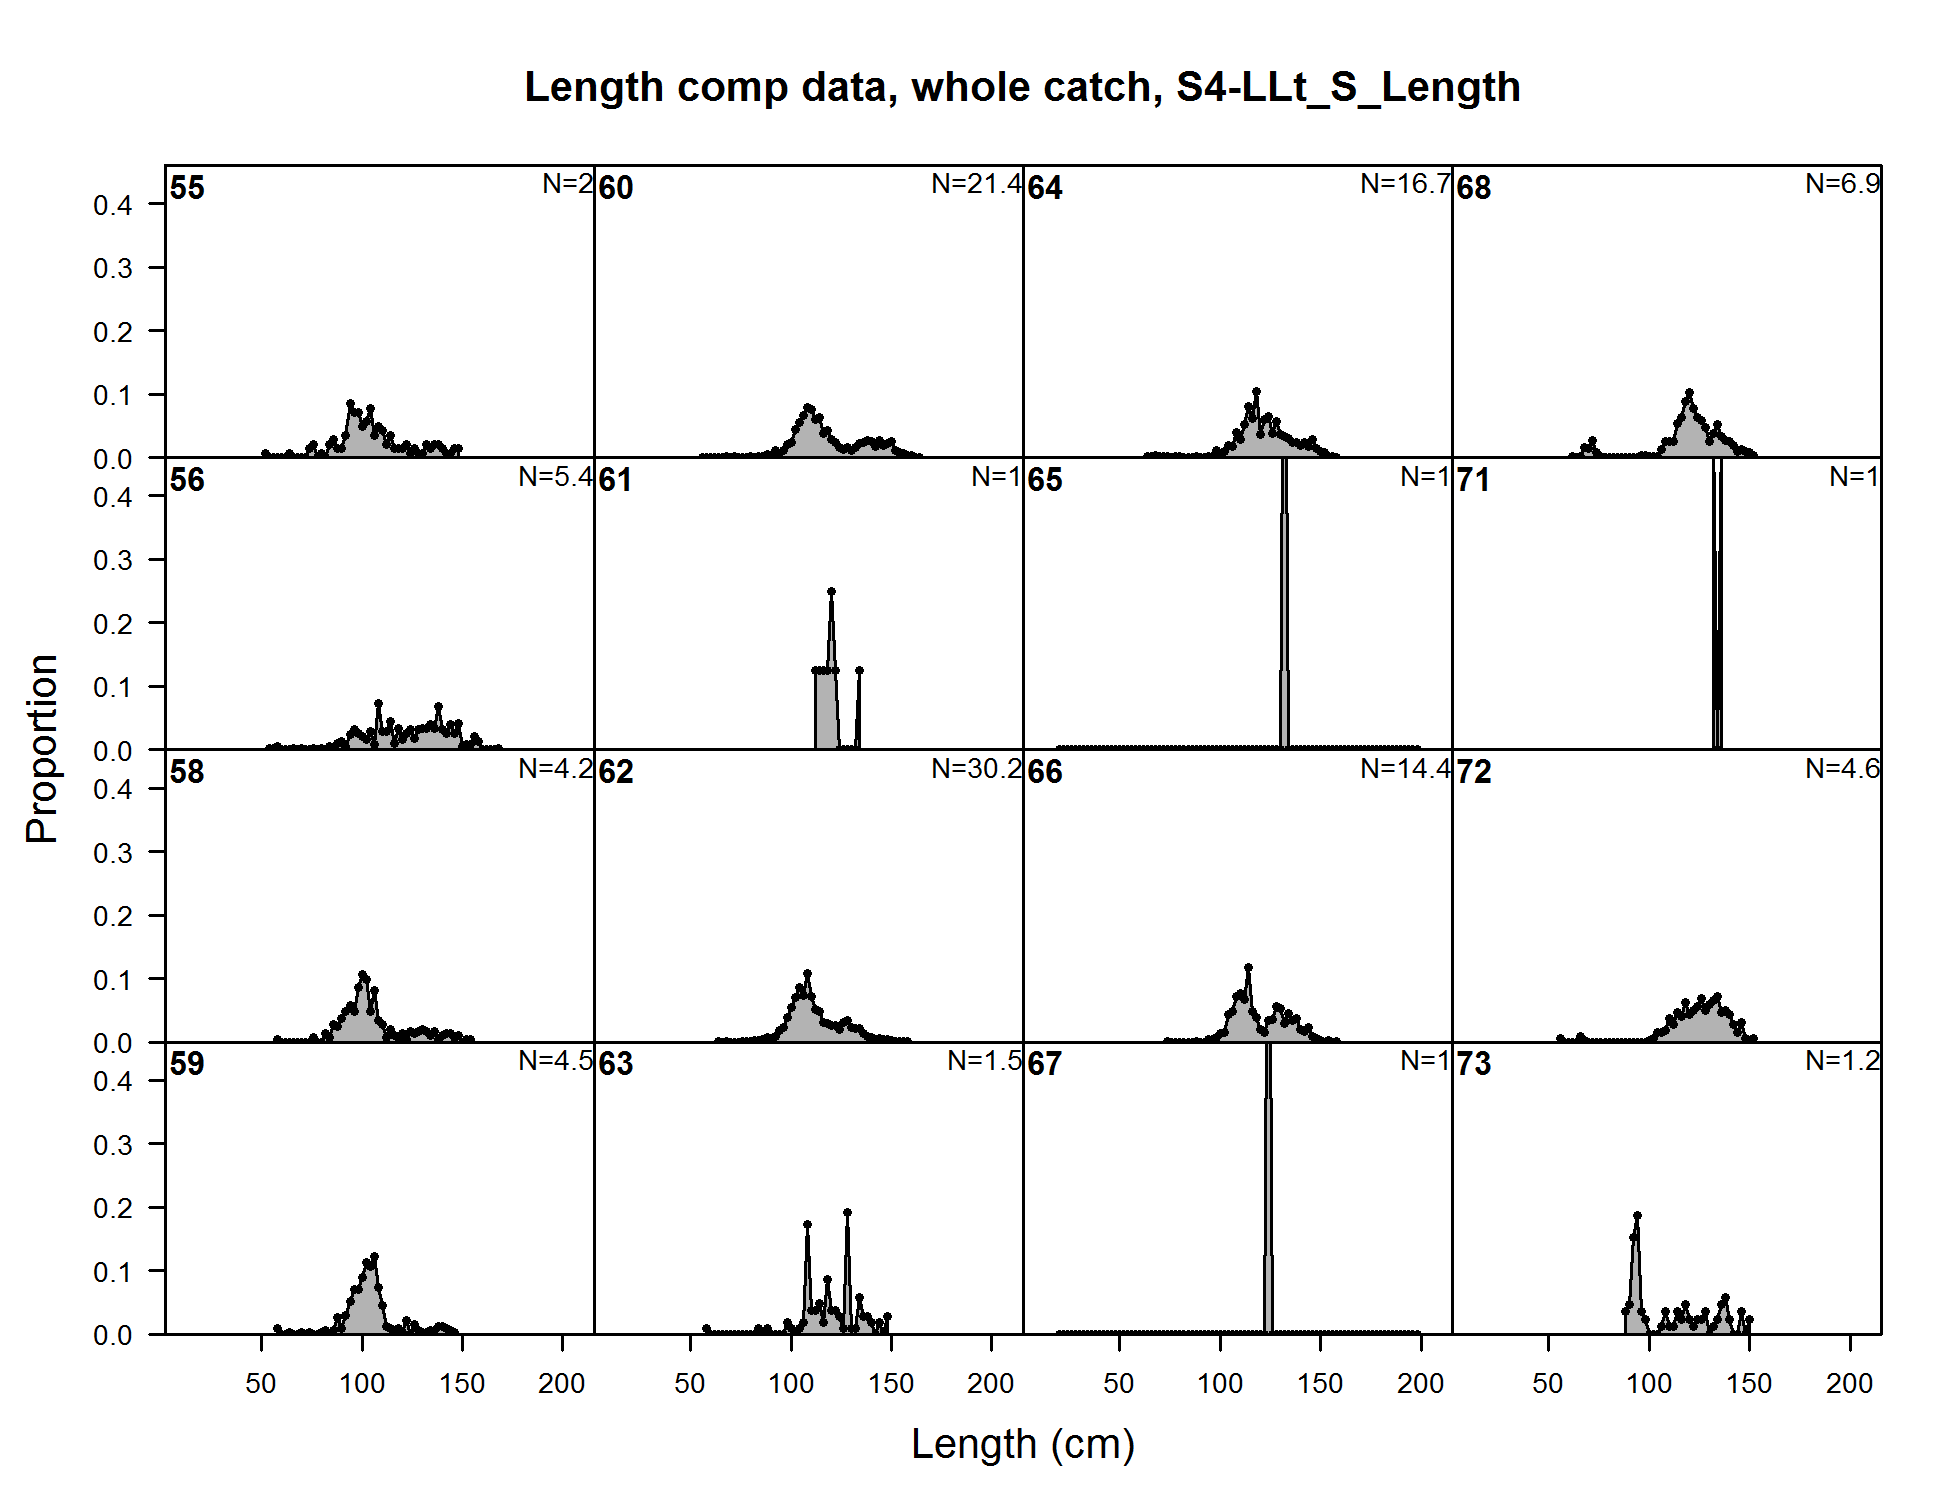
Length comp data, whole catch, S4-LLt_S_Length (plot 1 of 6) (plot 2 of 6)
file: comp_lendat_flt20mkt0_page2.png

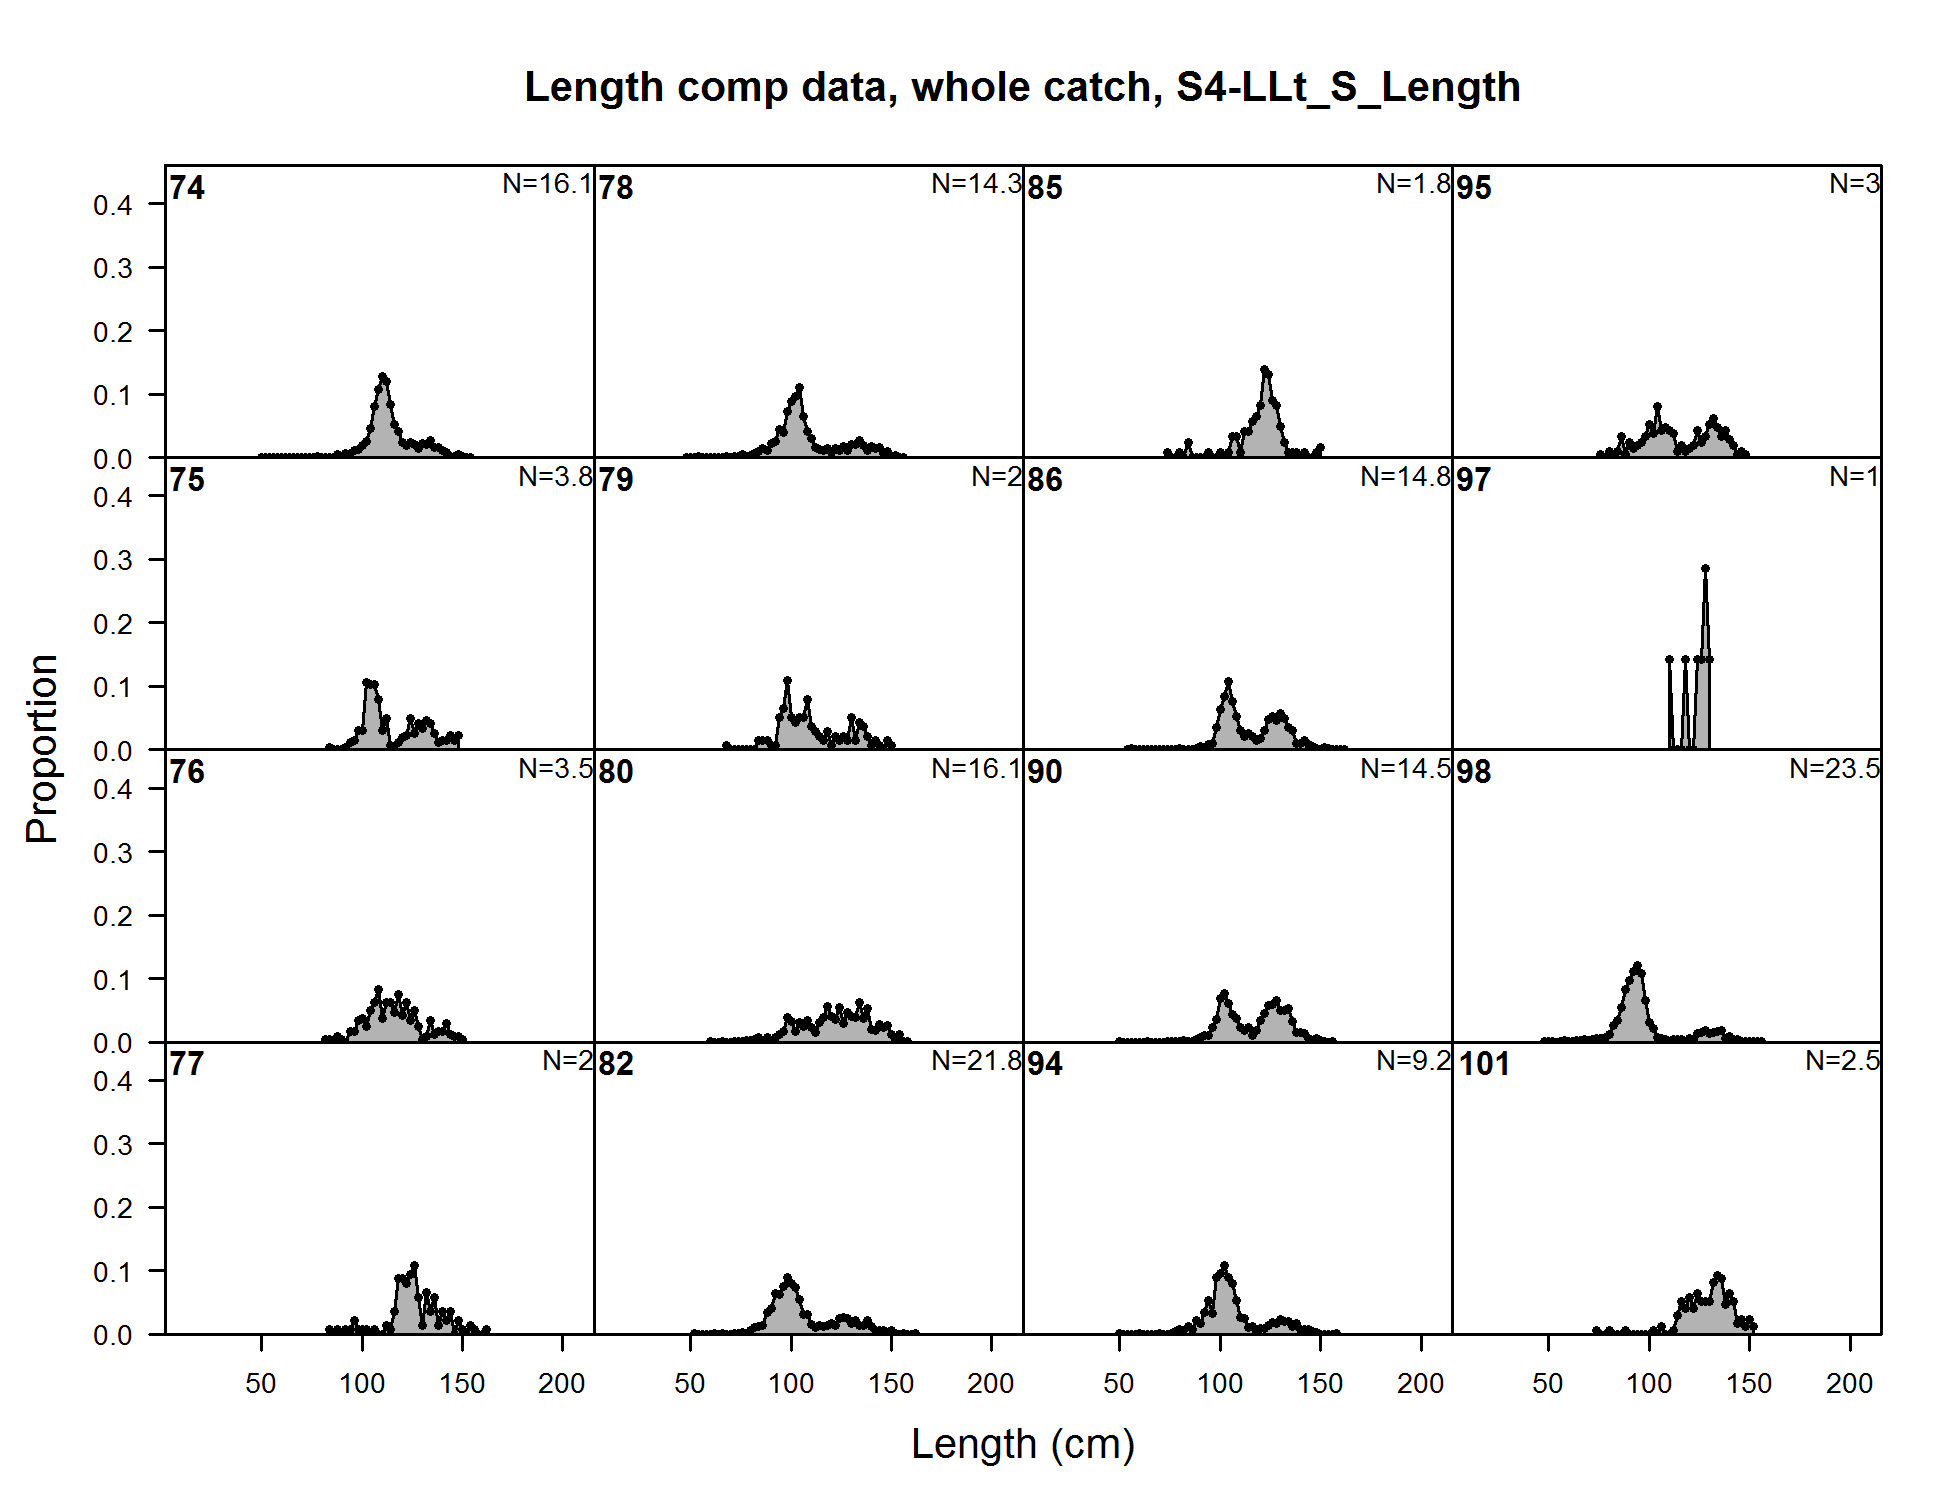
Length comp data, whole catch, S4-LLt_S_Length (plot 1 of 6) (plot 2 of 6) (plot 3 of 6)
file: comp_lendat_flt20mkt0_page3.png
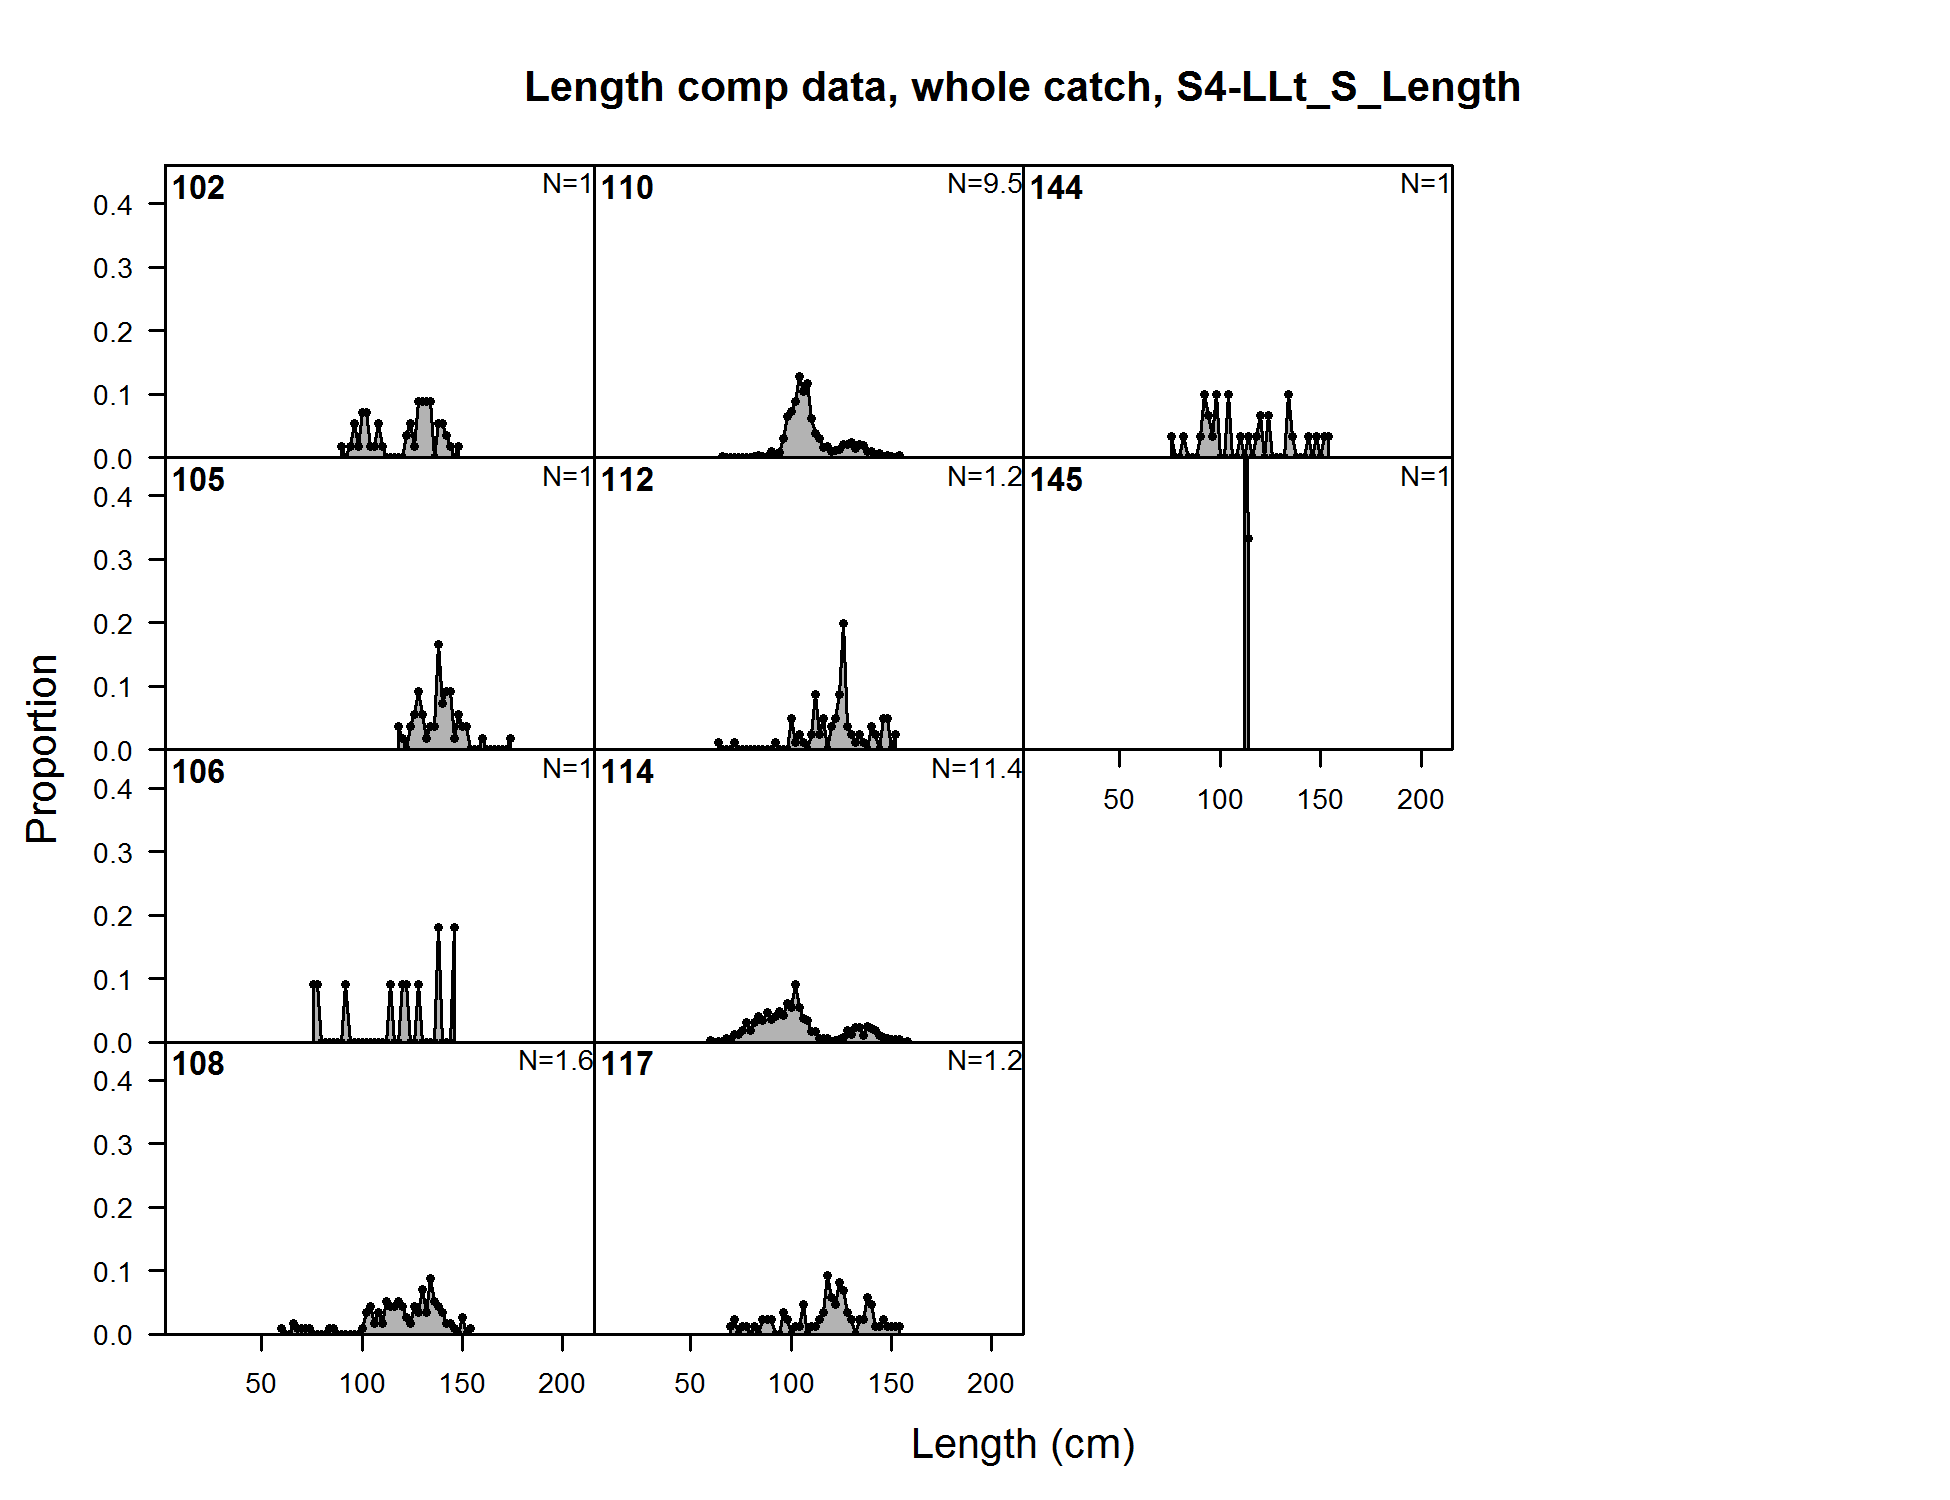
Length comp data, whole catch, S4-LLt_S_Length (plot 1 of 6) (plot 2 of 6) (plot 3 of 6) (plot 4 of 6)
file: comp_lendat_flt20mkt0_page4.png
Length comp data, whole catch, S4-LLt_S_Length (plot 1 of 6) (plot 2 of 6) (plot 3 of 6) (plot 4 of 6) (plot 5 of 6)
file: comp_lendat_flt20mkt0_page5.png
Length comp data, whole catch, S4-LLt_S_Length (plot 1 of 6) (plot 2 of 6) (plot 3 of 6) (plot 4 of 6) (plot 5 of 6) (plot 6 of 6)
file: comp_lendat_flt20mkt0_page6.png
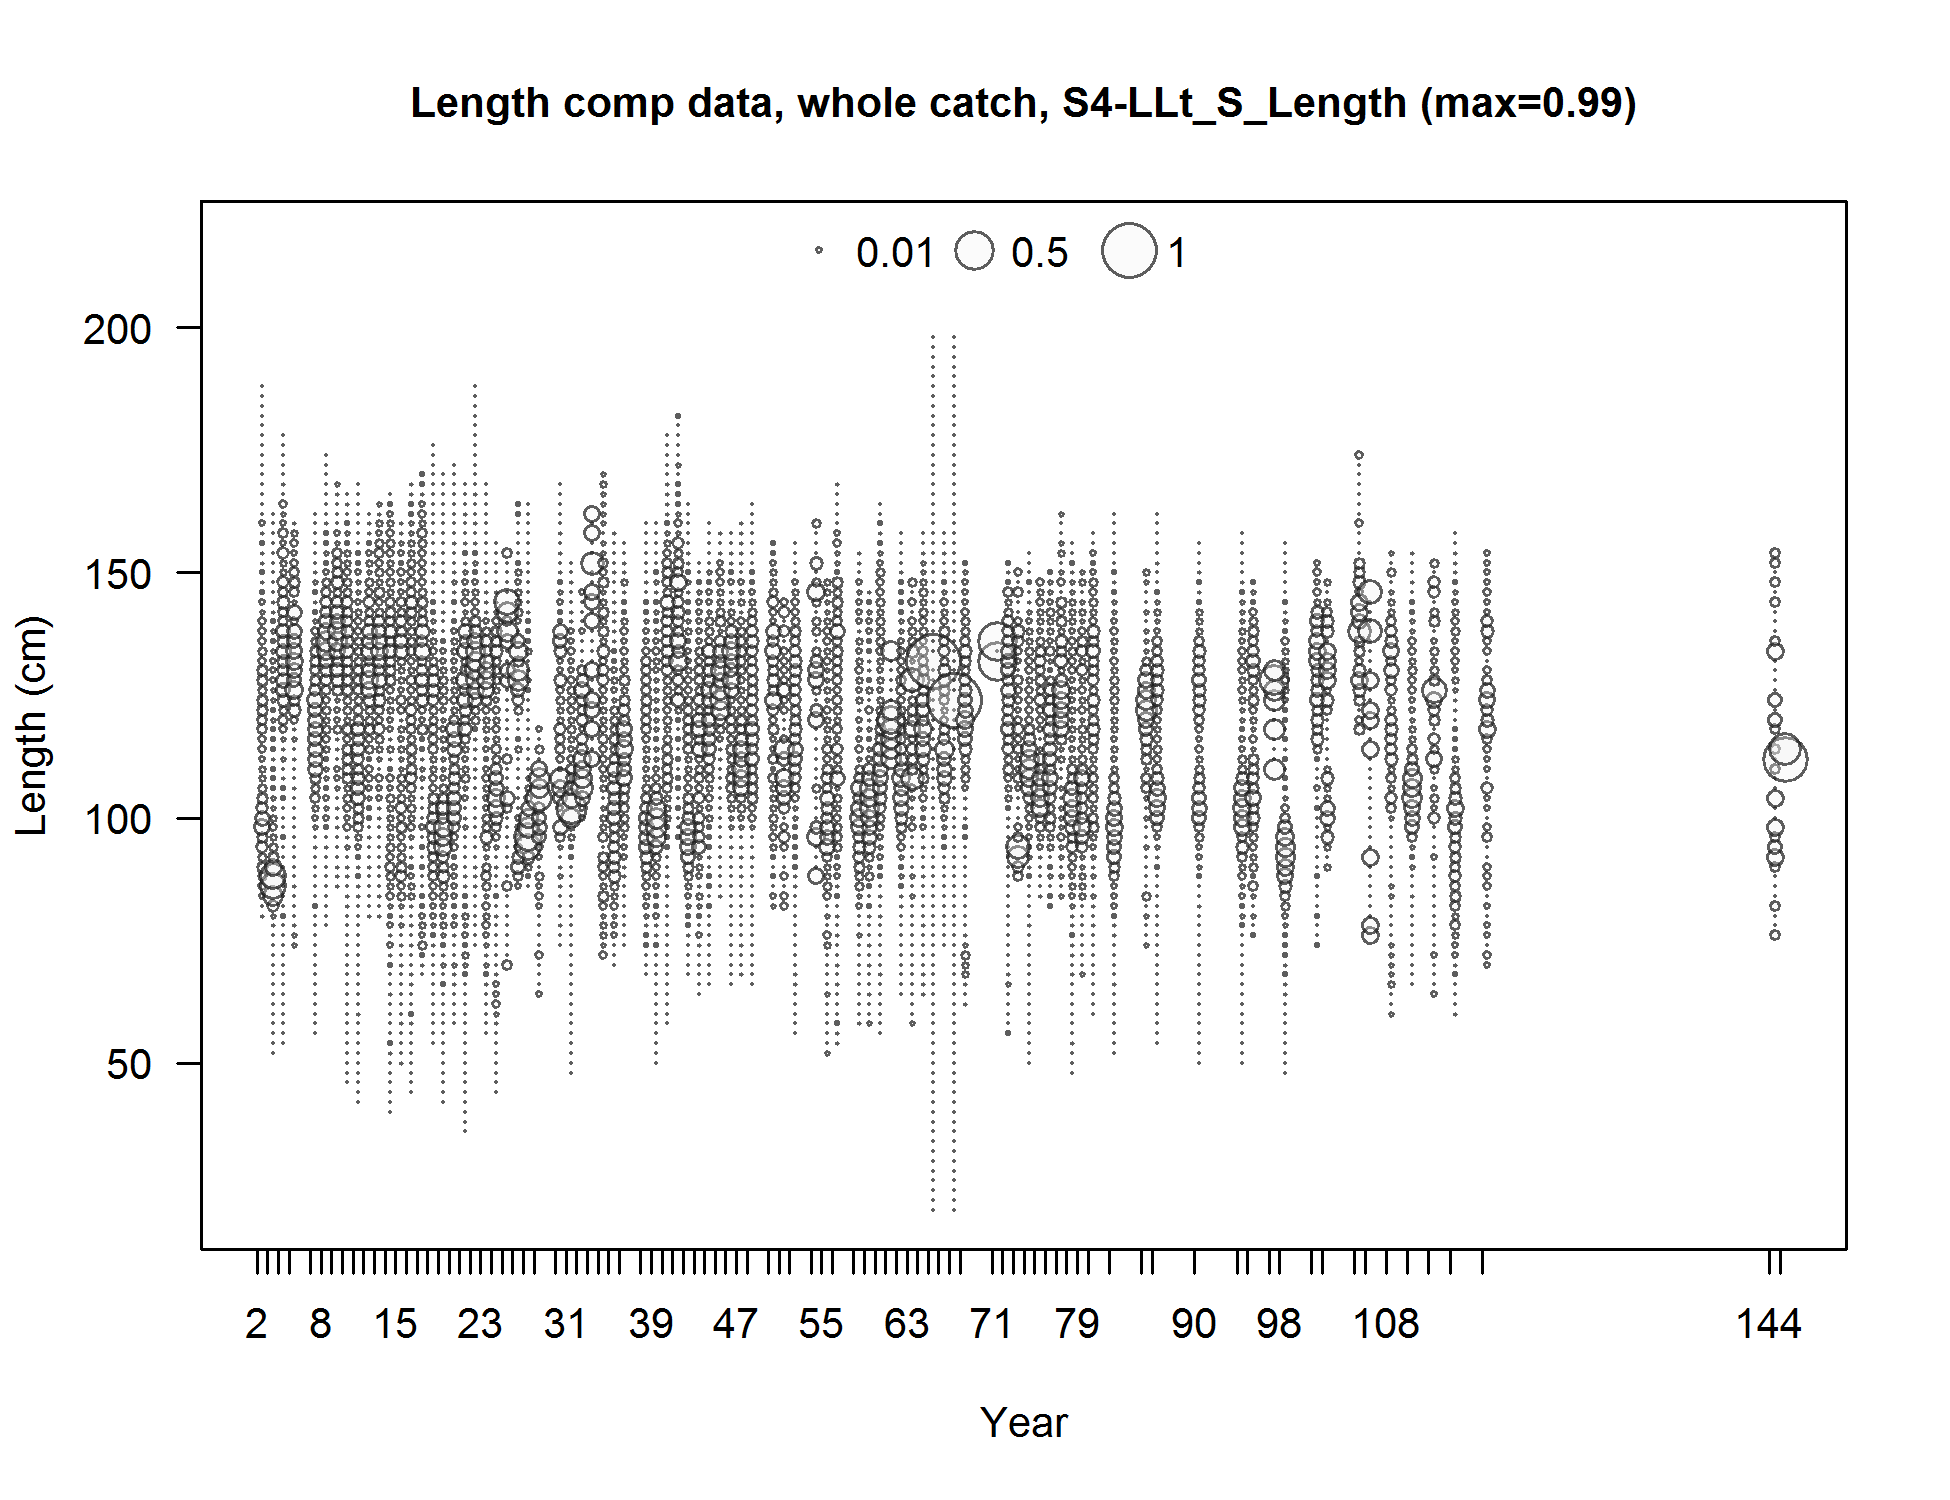
Length comp data, whole catch, S4-LLt_S_Length (max=0.99) (plot 6 of 6)
file: comp_lendat_bubflt20mkt0_page6.png
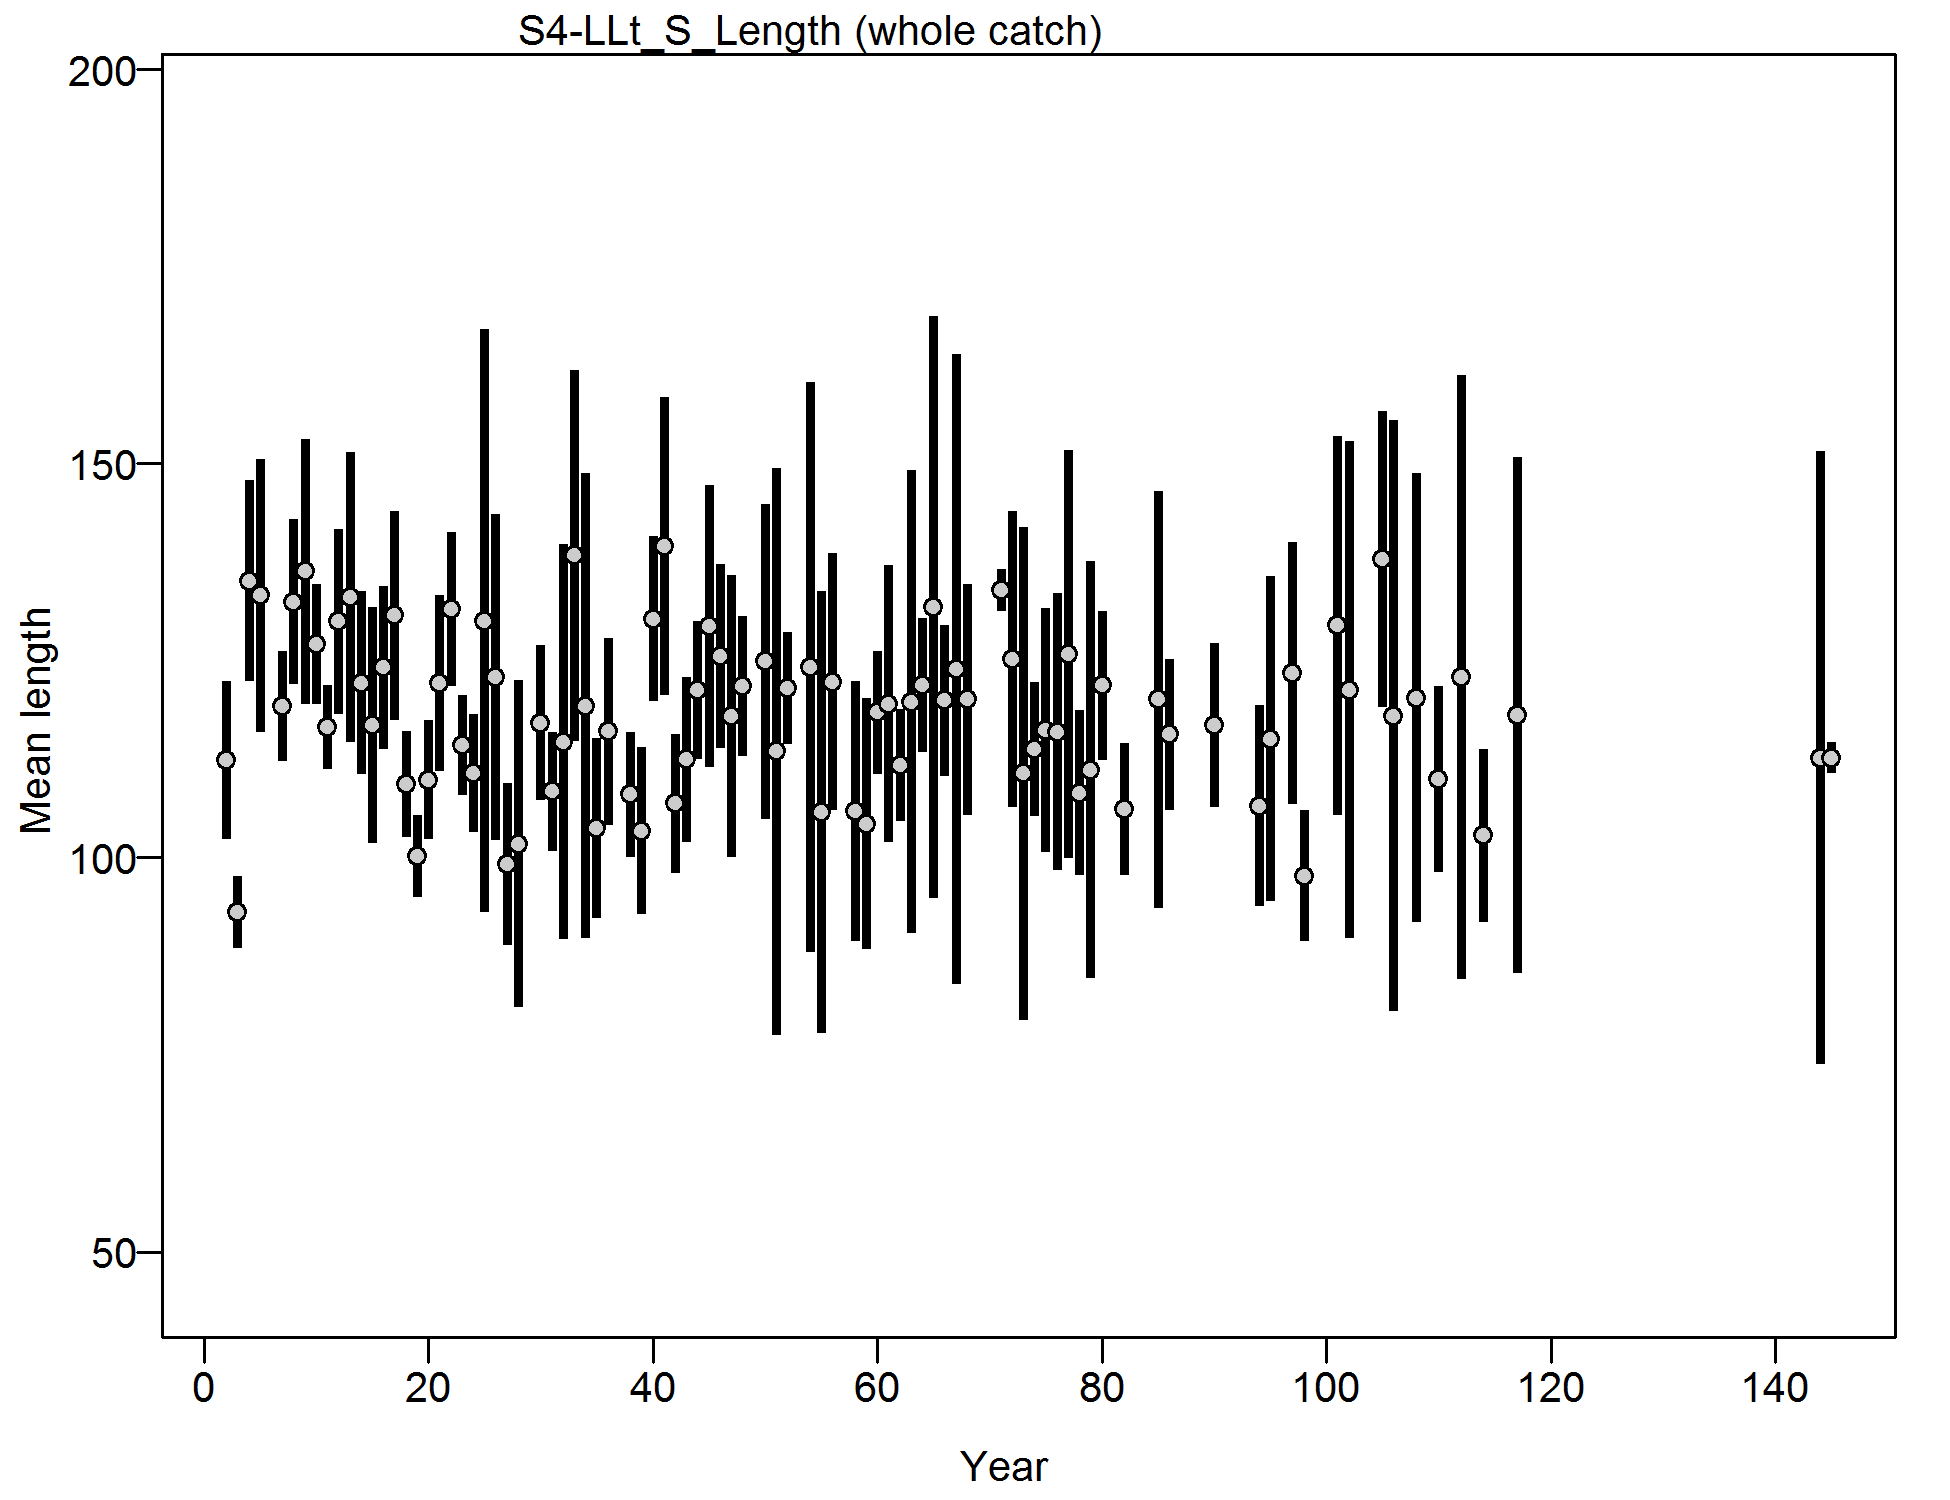
Mean length for S4-LLt_S_Length with 95% confidence intervals based on current samples sizes.
file: comp_lendat_data_weighting_TA1.8_S4-LLt_S_Length.png
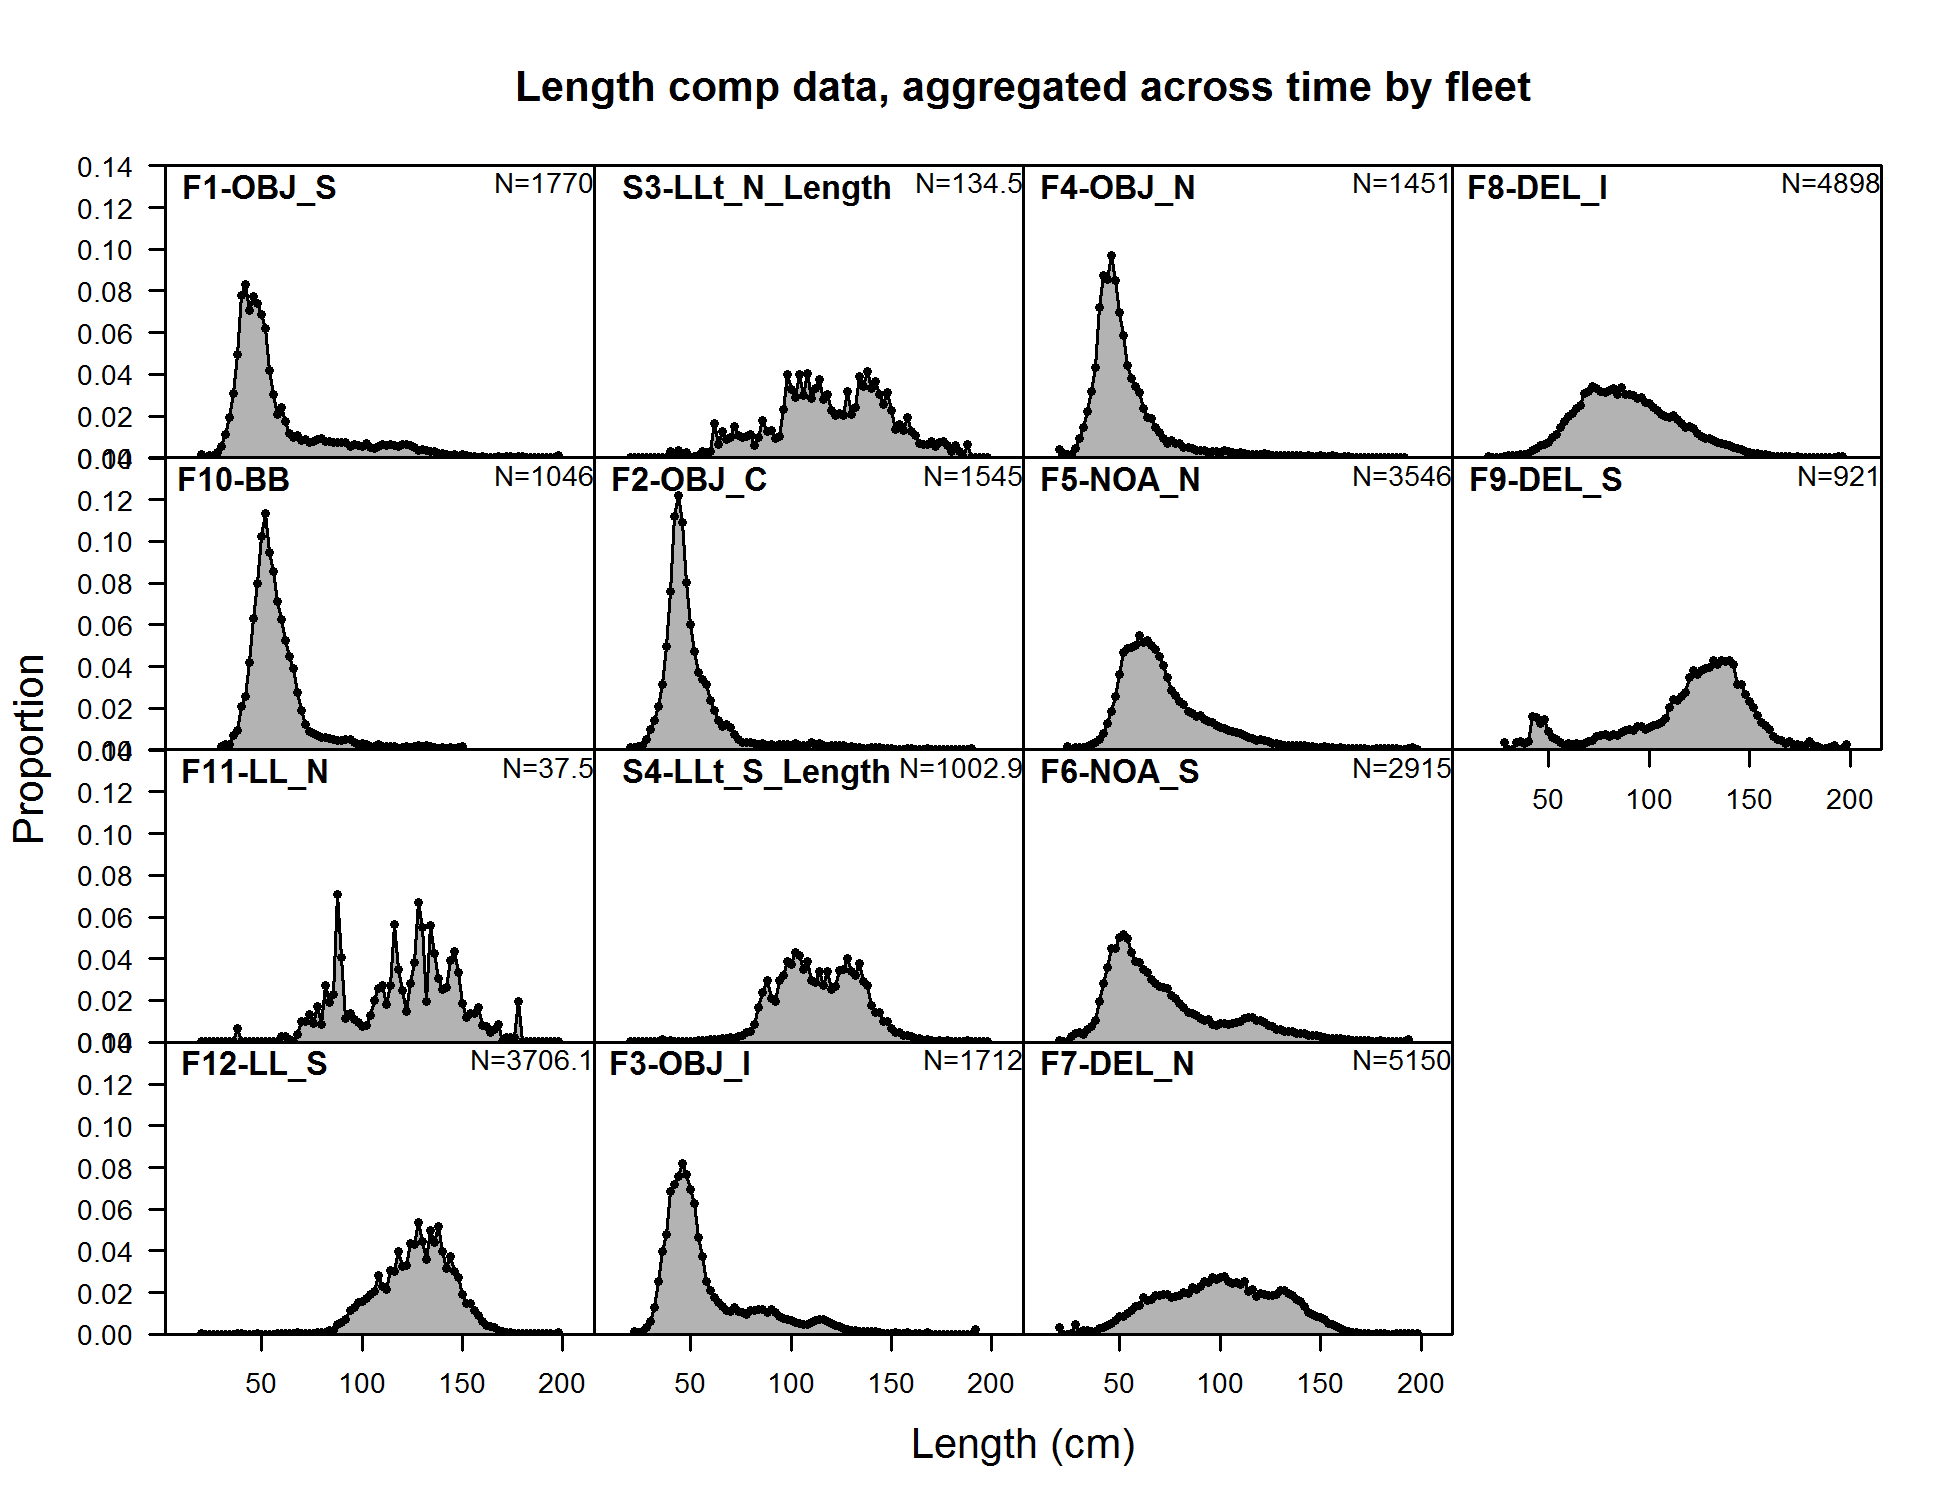
Length comp data, aggregated across time by fleet.
Labels 'retained' and 'discard' indicate discarded or retained sampled for each fleet. Panels without this designation represent the whole catch.
file: comp_lendat__aggregated_across_time.png
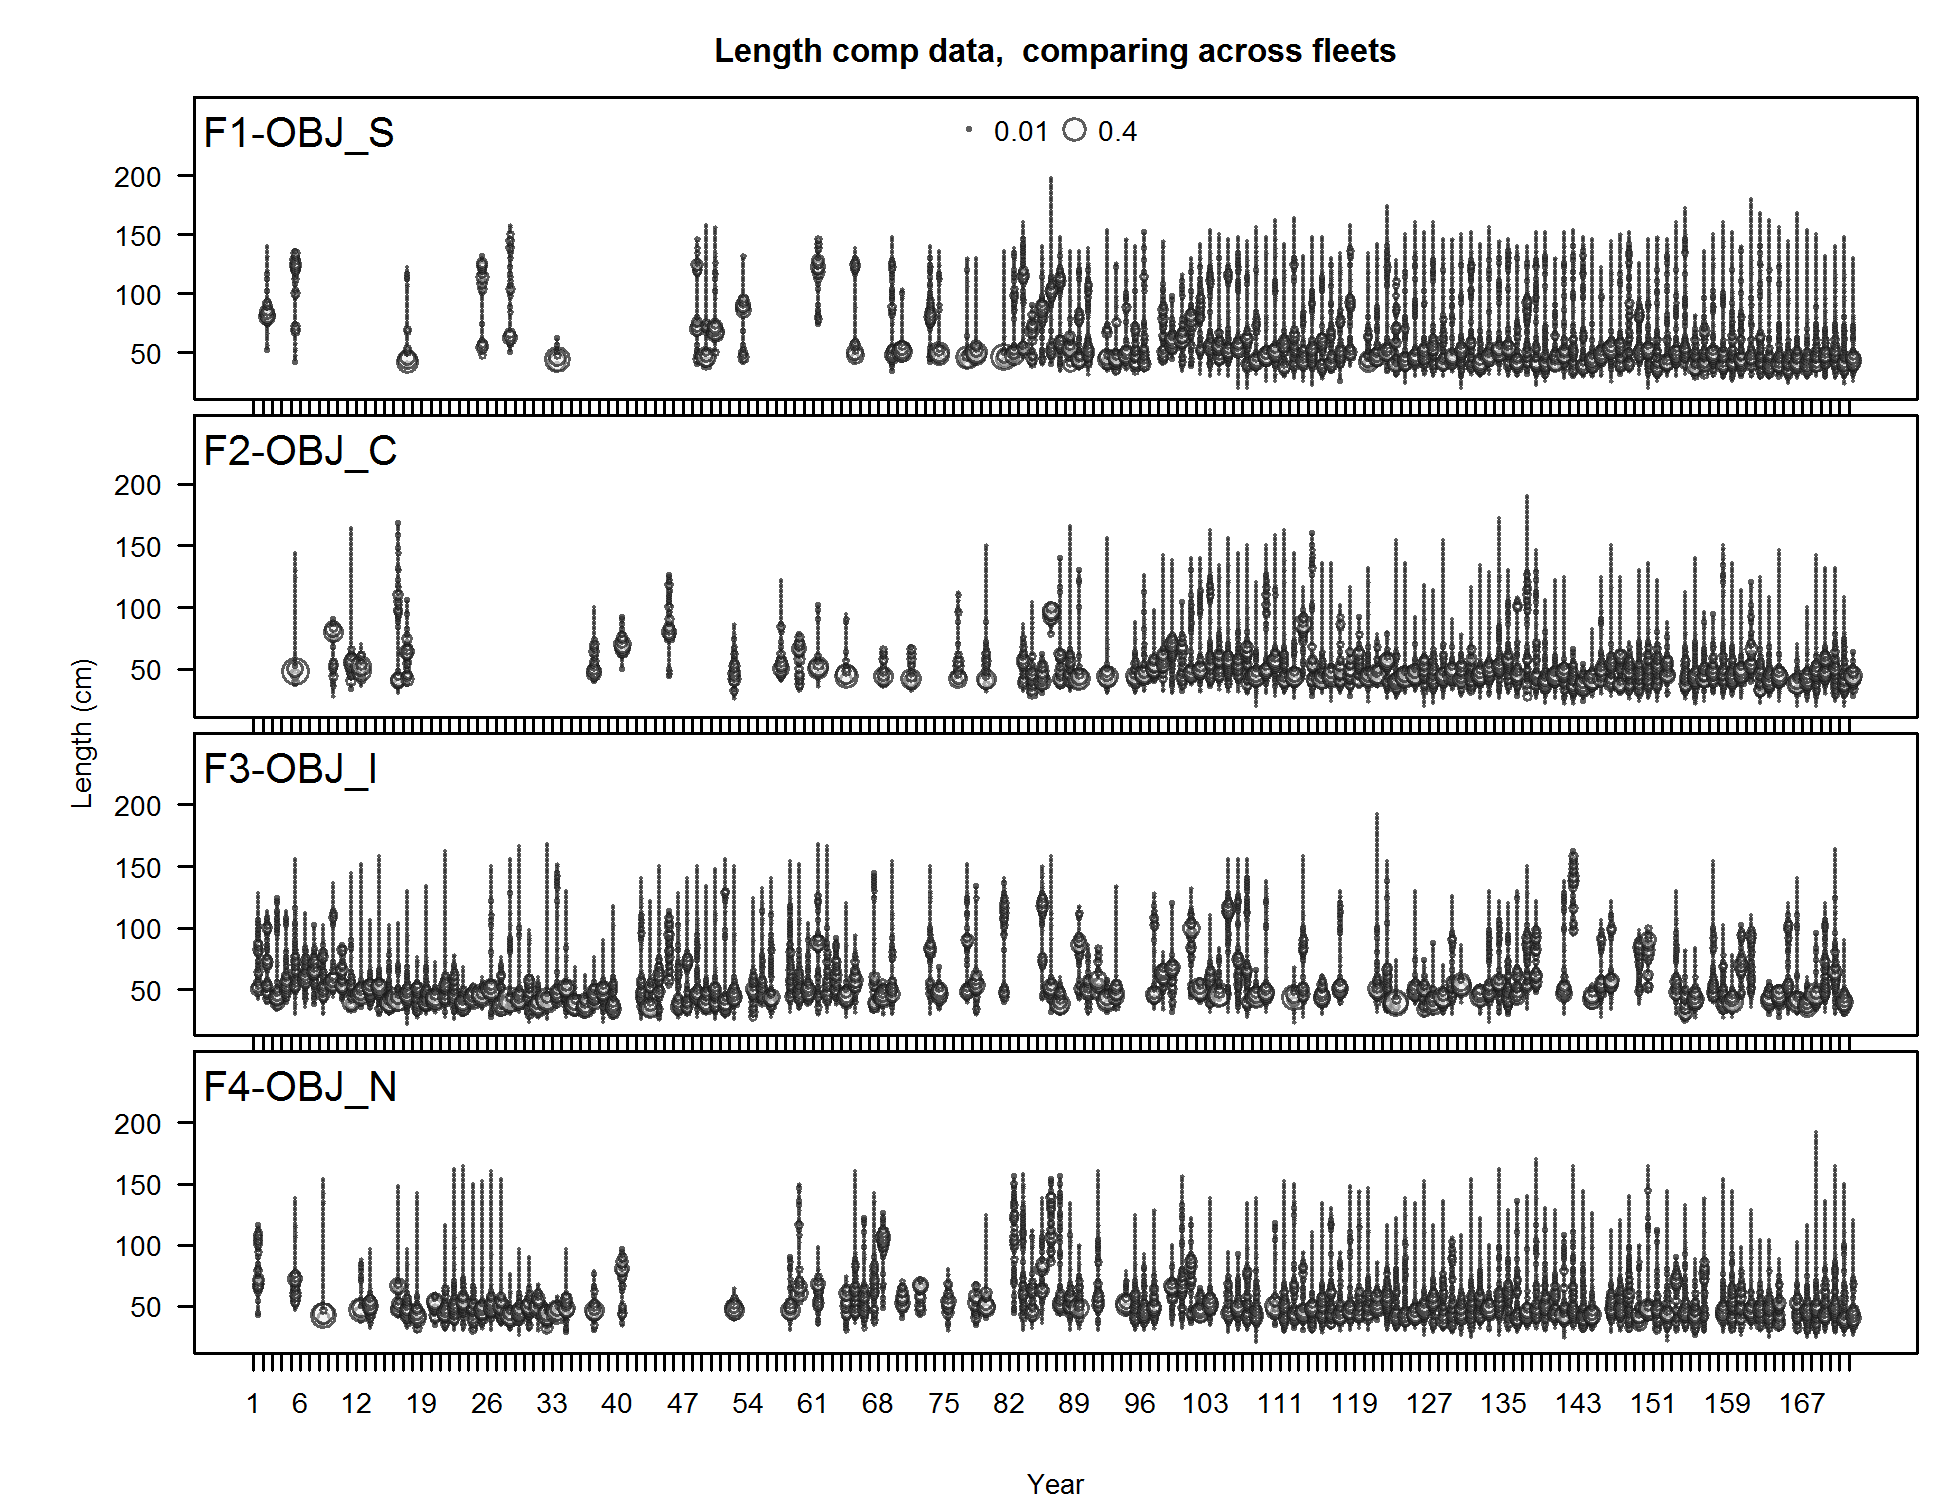
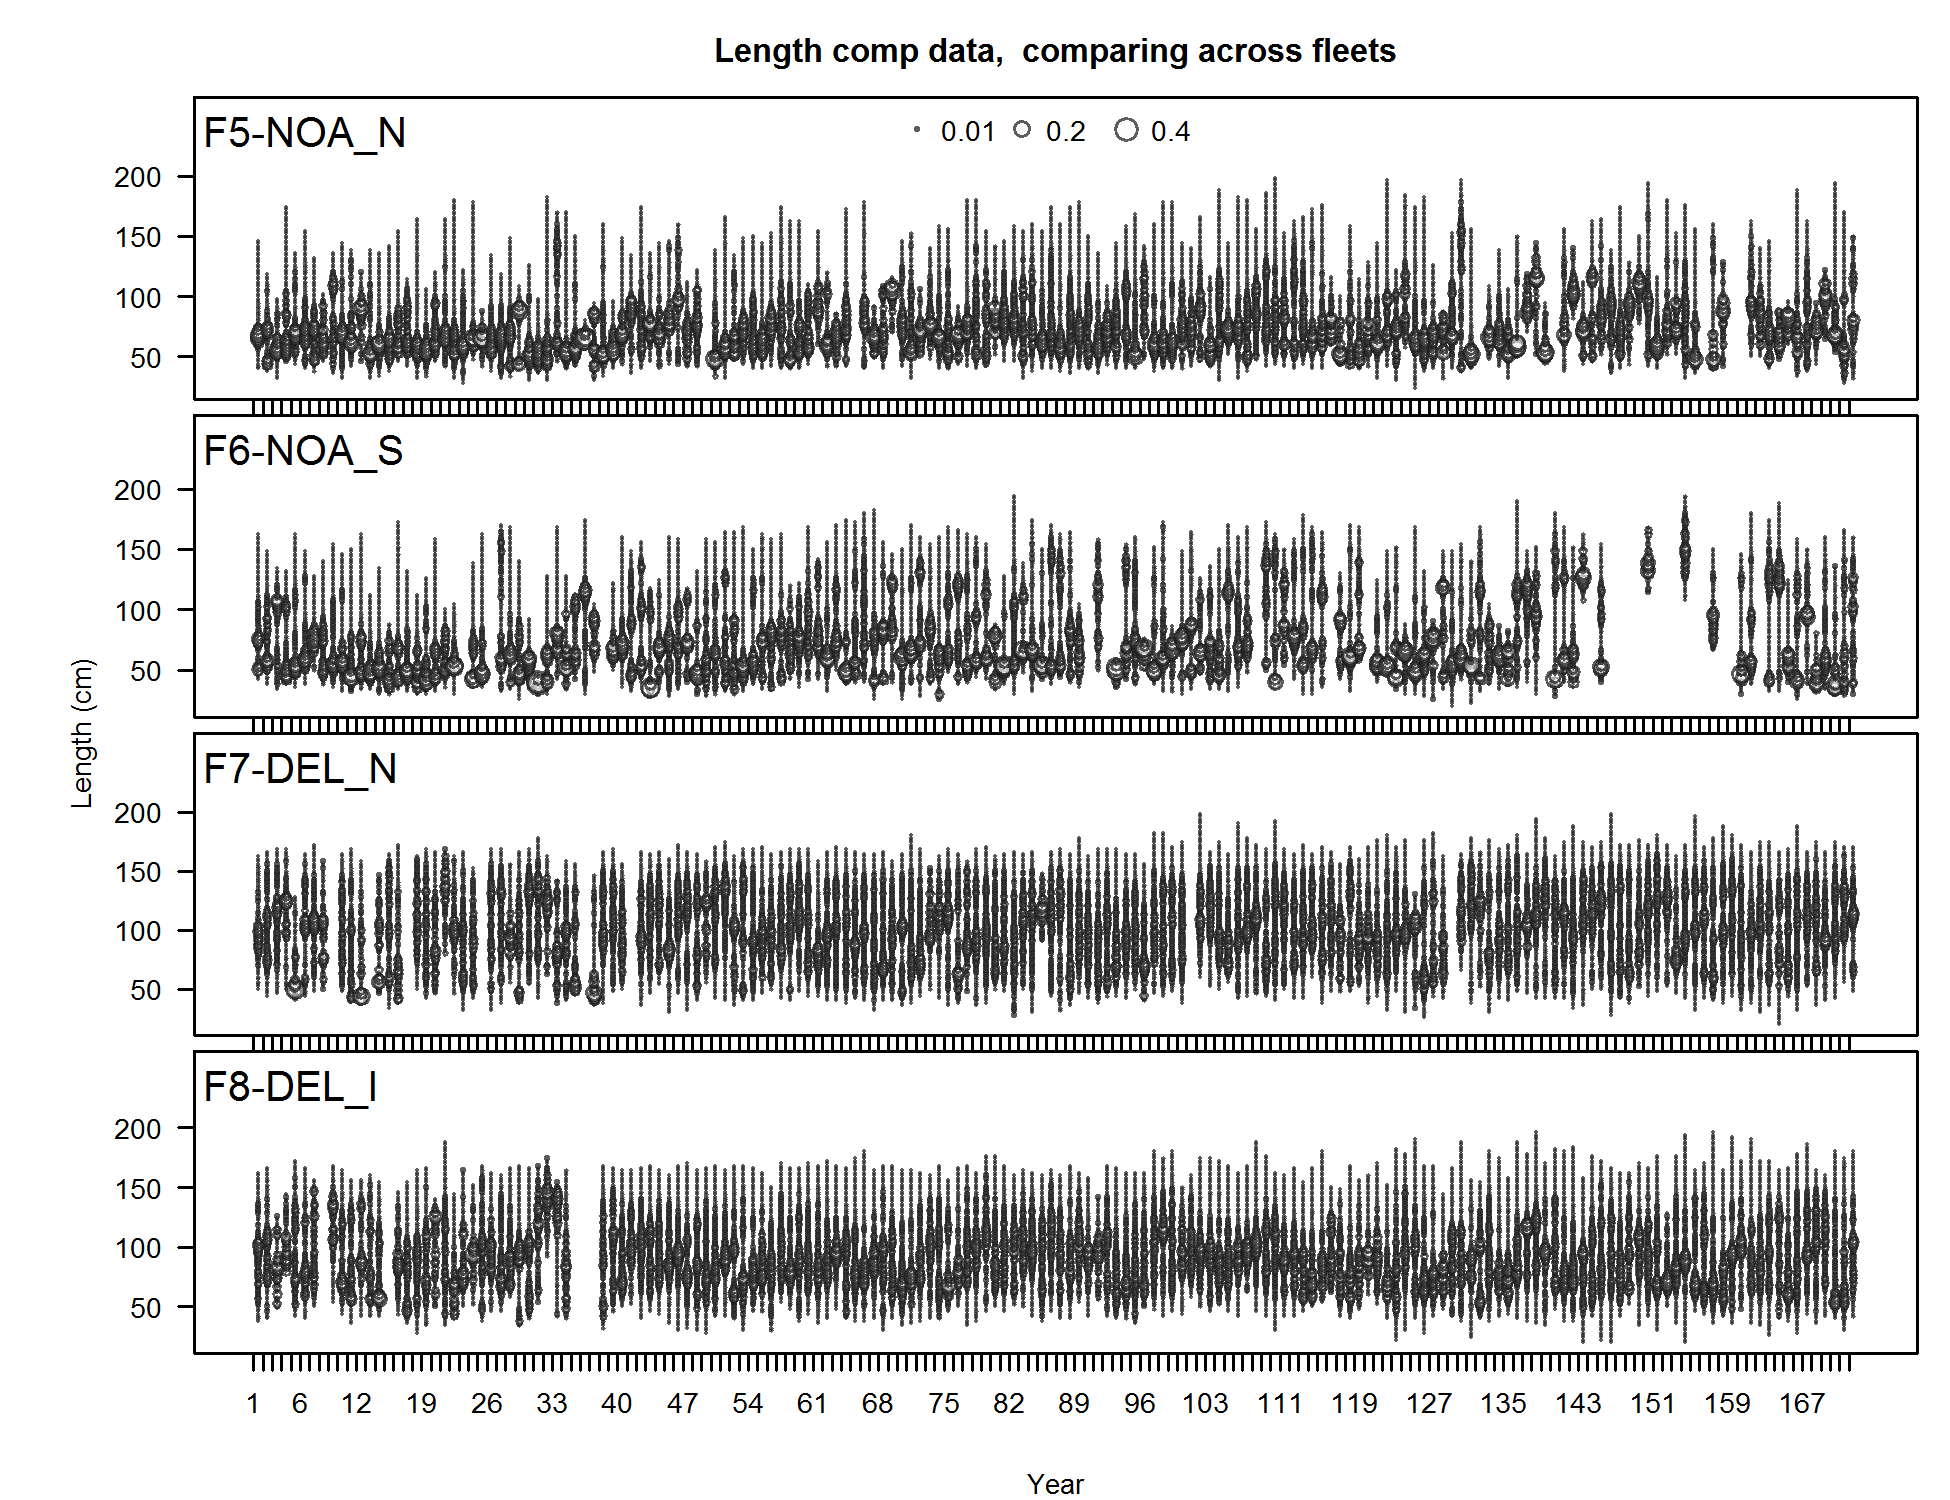
Length comp data, comparing across fleets (plot 1 of 4)
file: comp_lendat__page1_multi-fleet_comparison.png
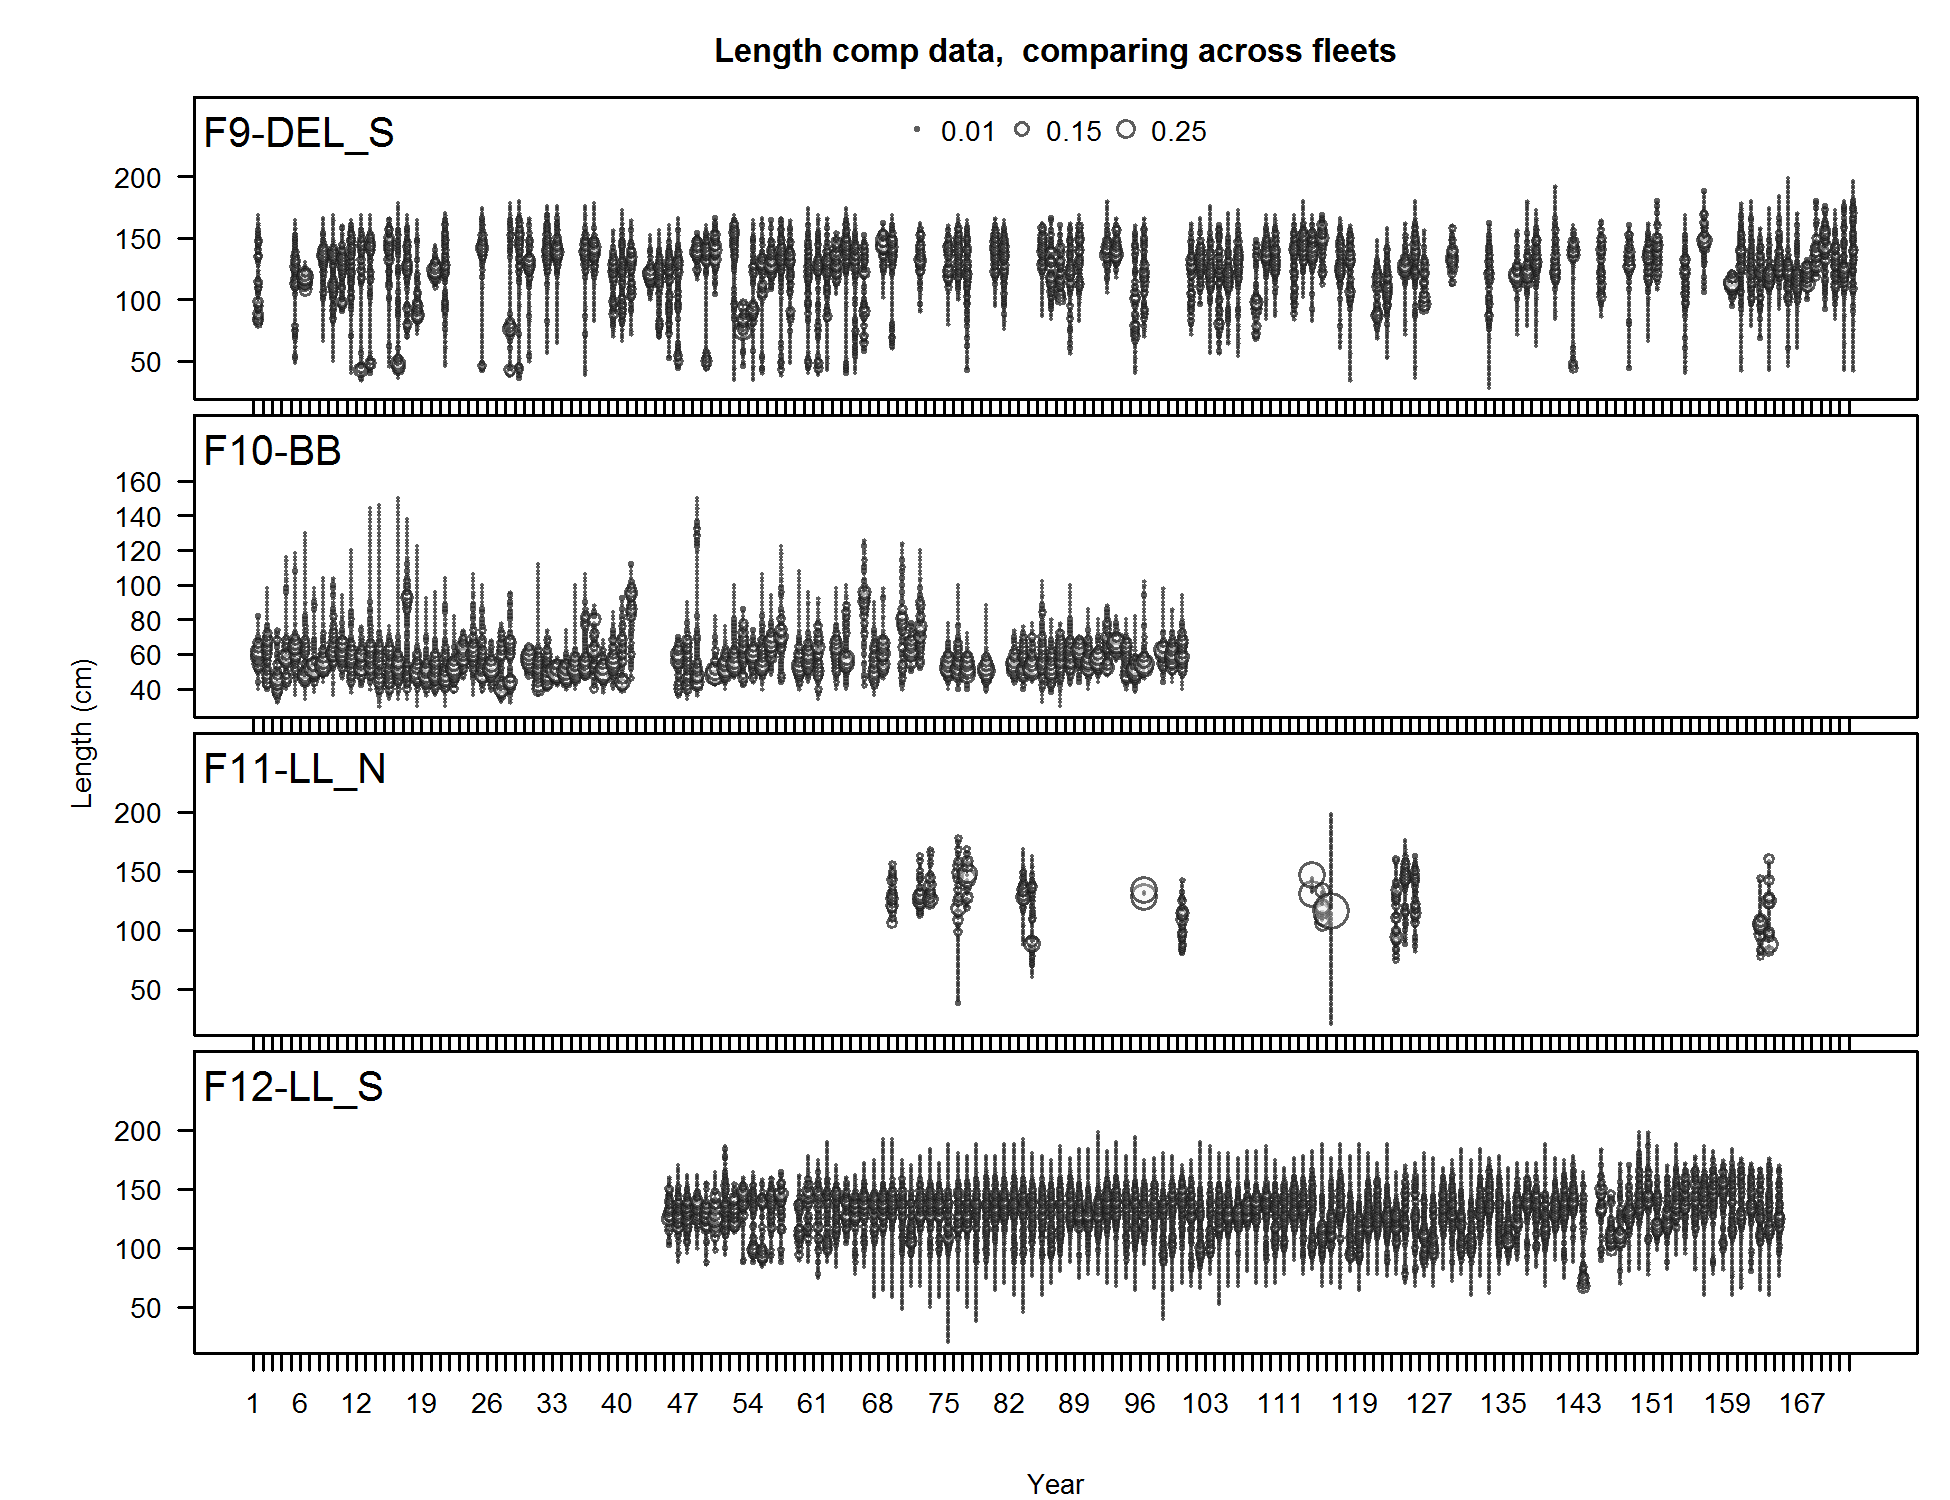
Length comp data, comparing across fleets (plot 2 of 4)
file: comp_lendat__page2_multi-fleet_comparison.png
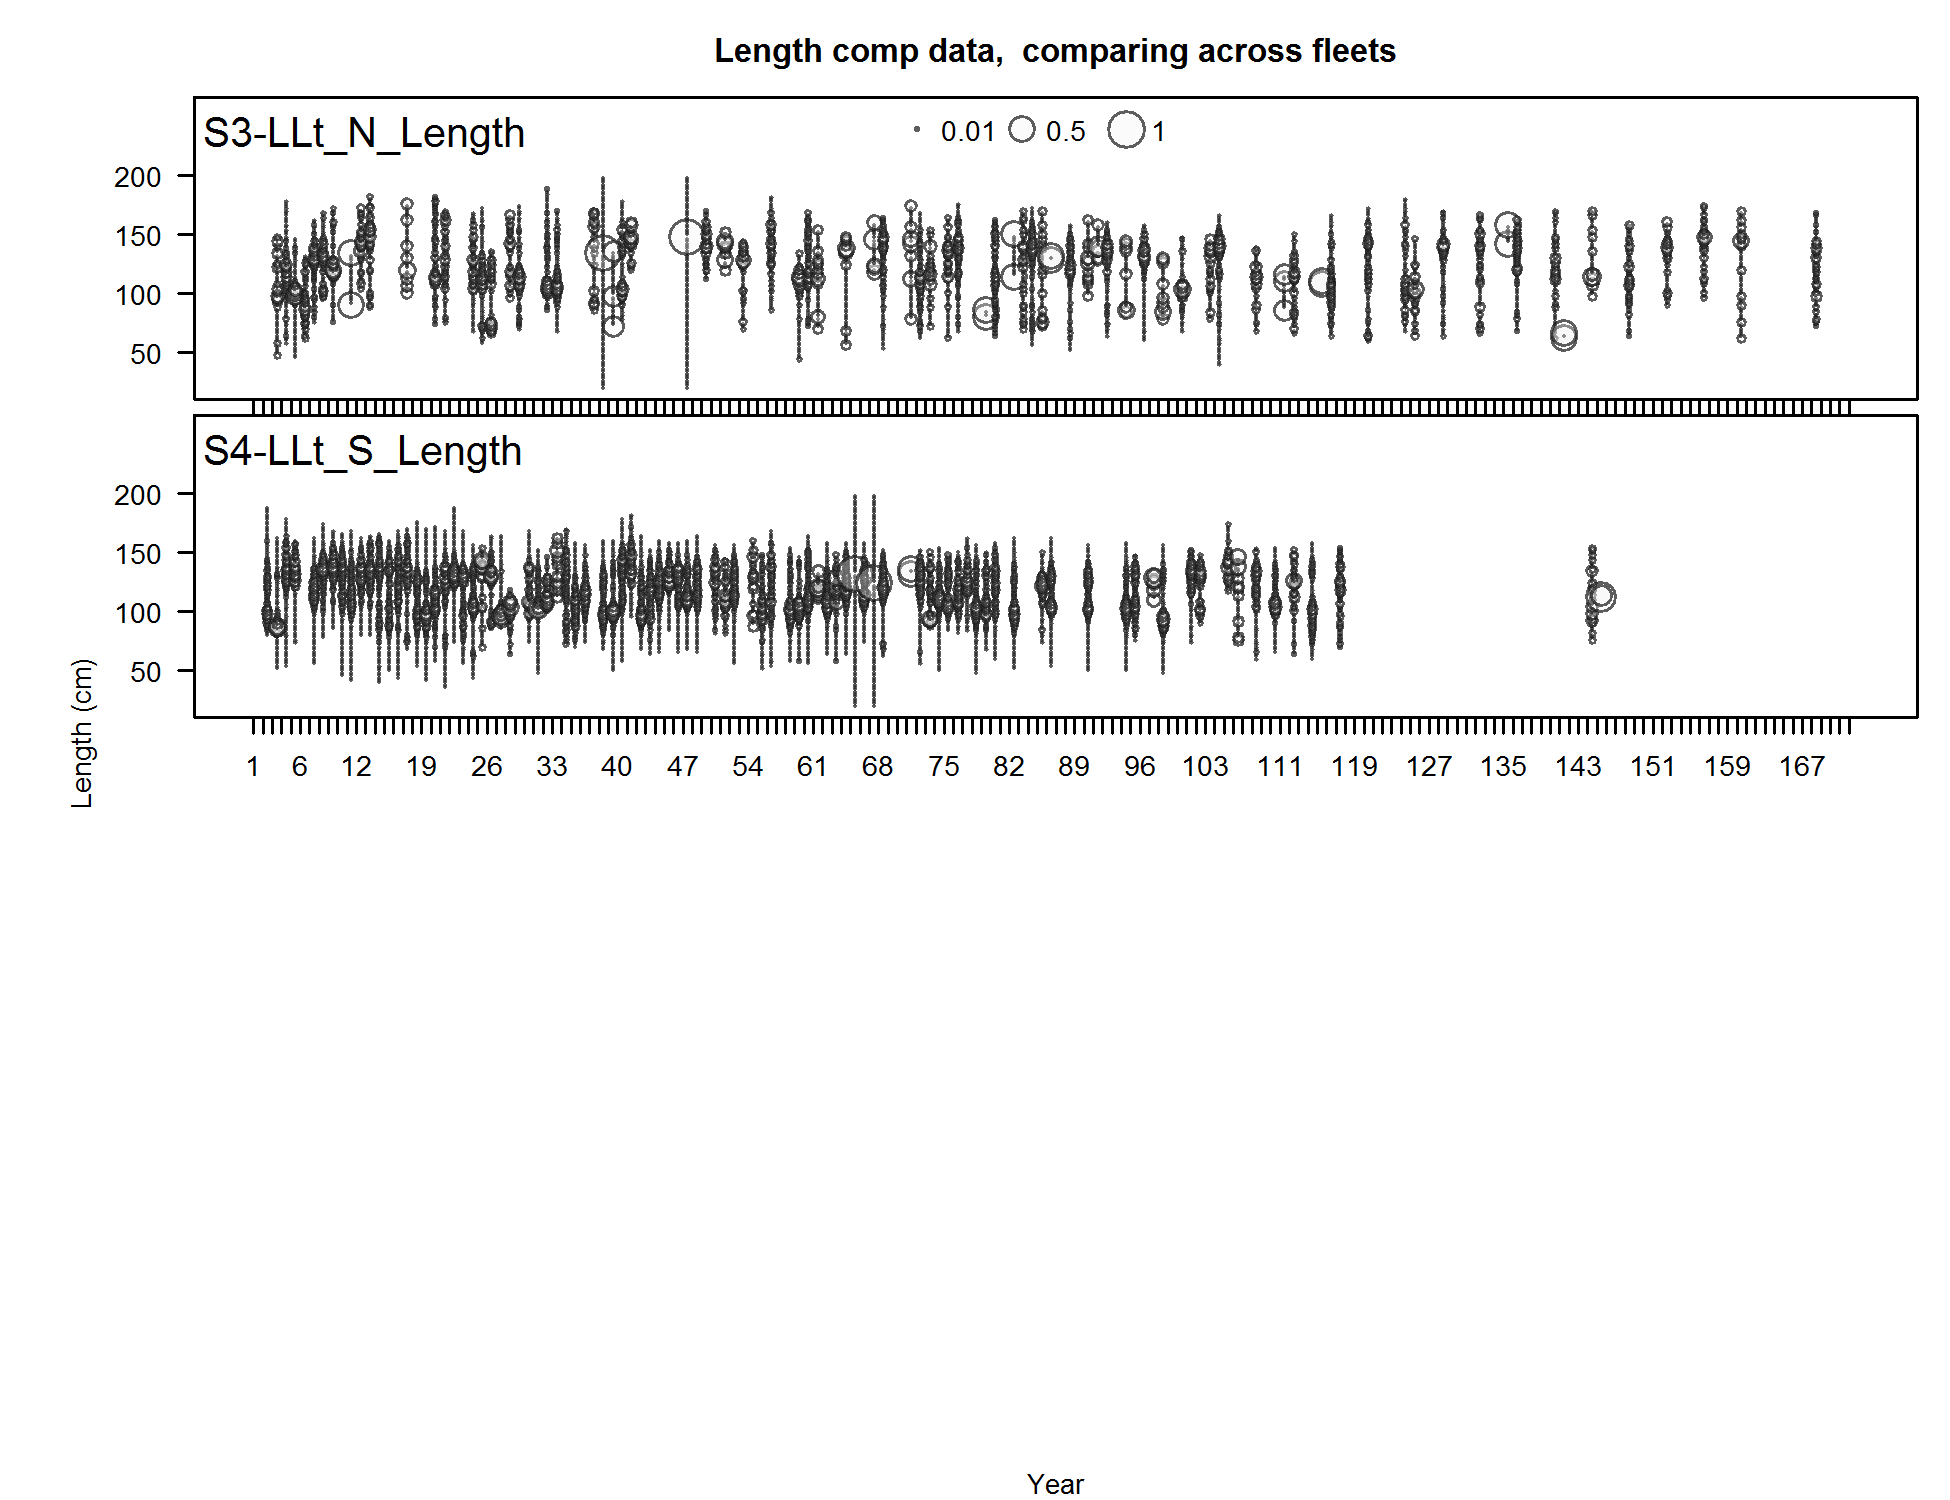
Length comp data, comparing across fleets (plot 3 of 4)
file: comp_lendat__page3_multi-fleet_comparison.png
Length comp data, comparing across fleets (plot 4 of 4)
file: comp_lendat__page4_multi-fleet_comparison.png
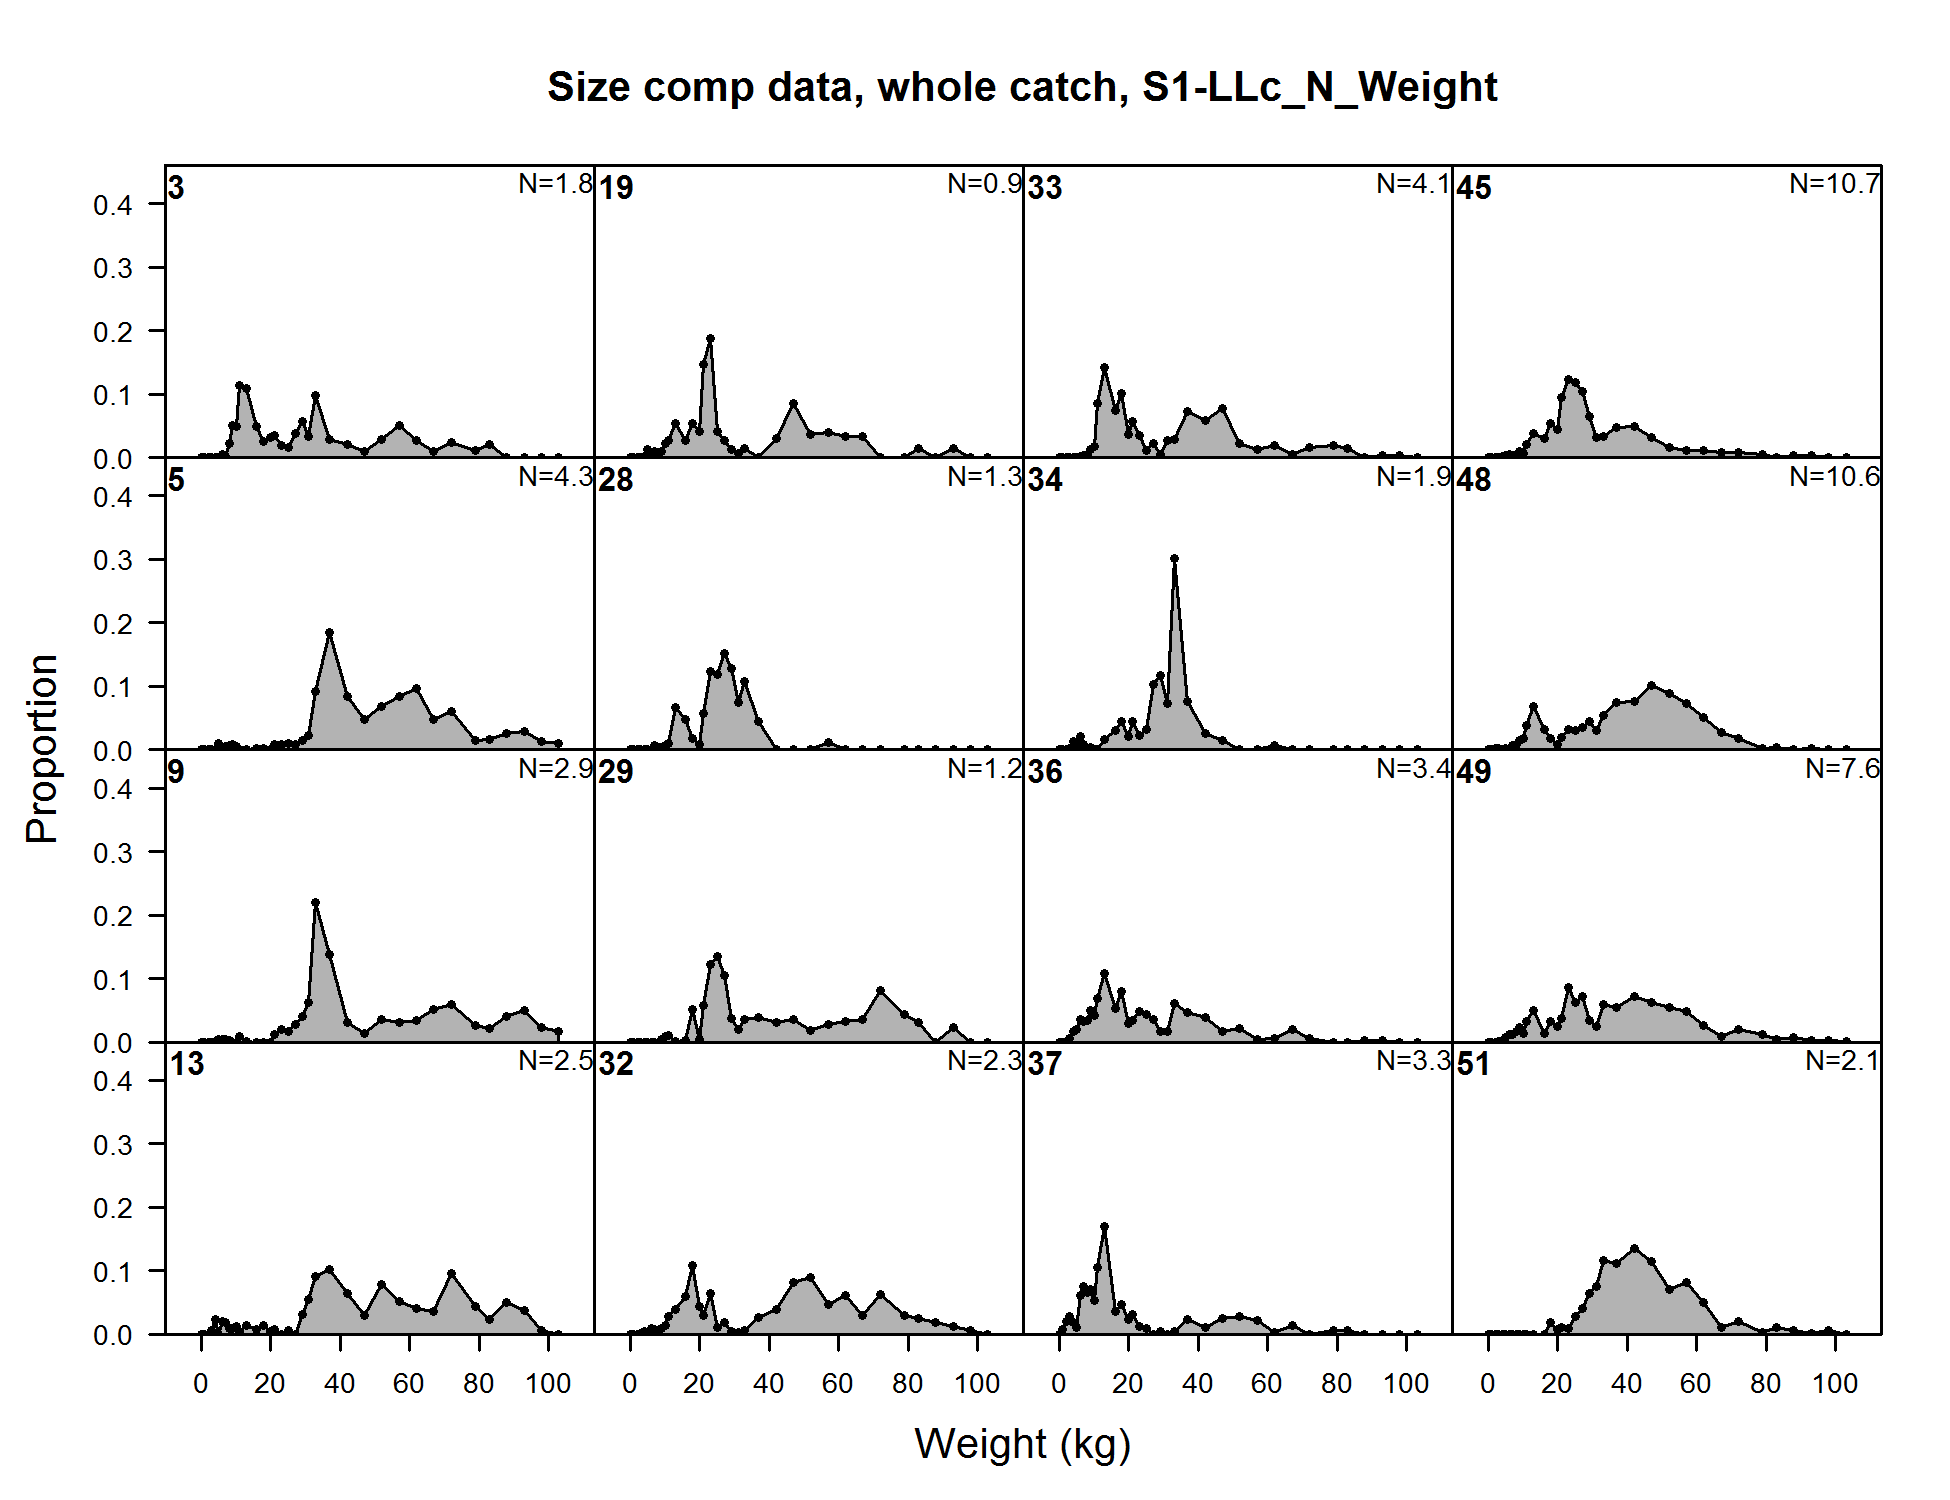
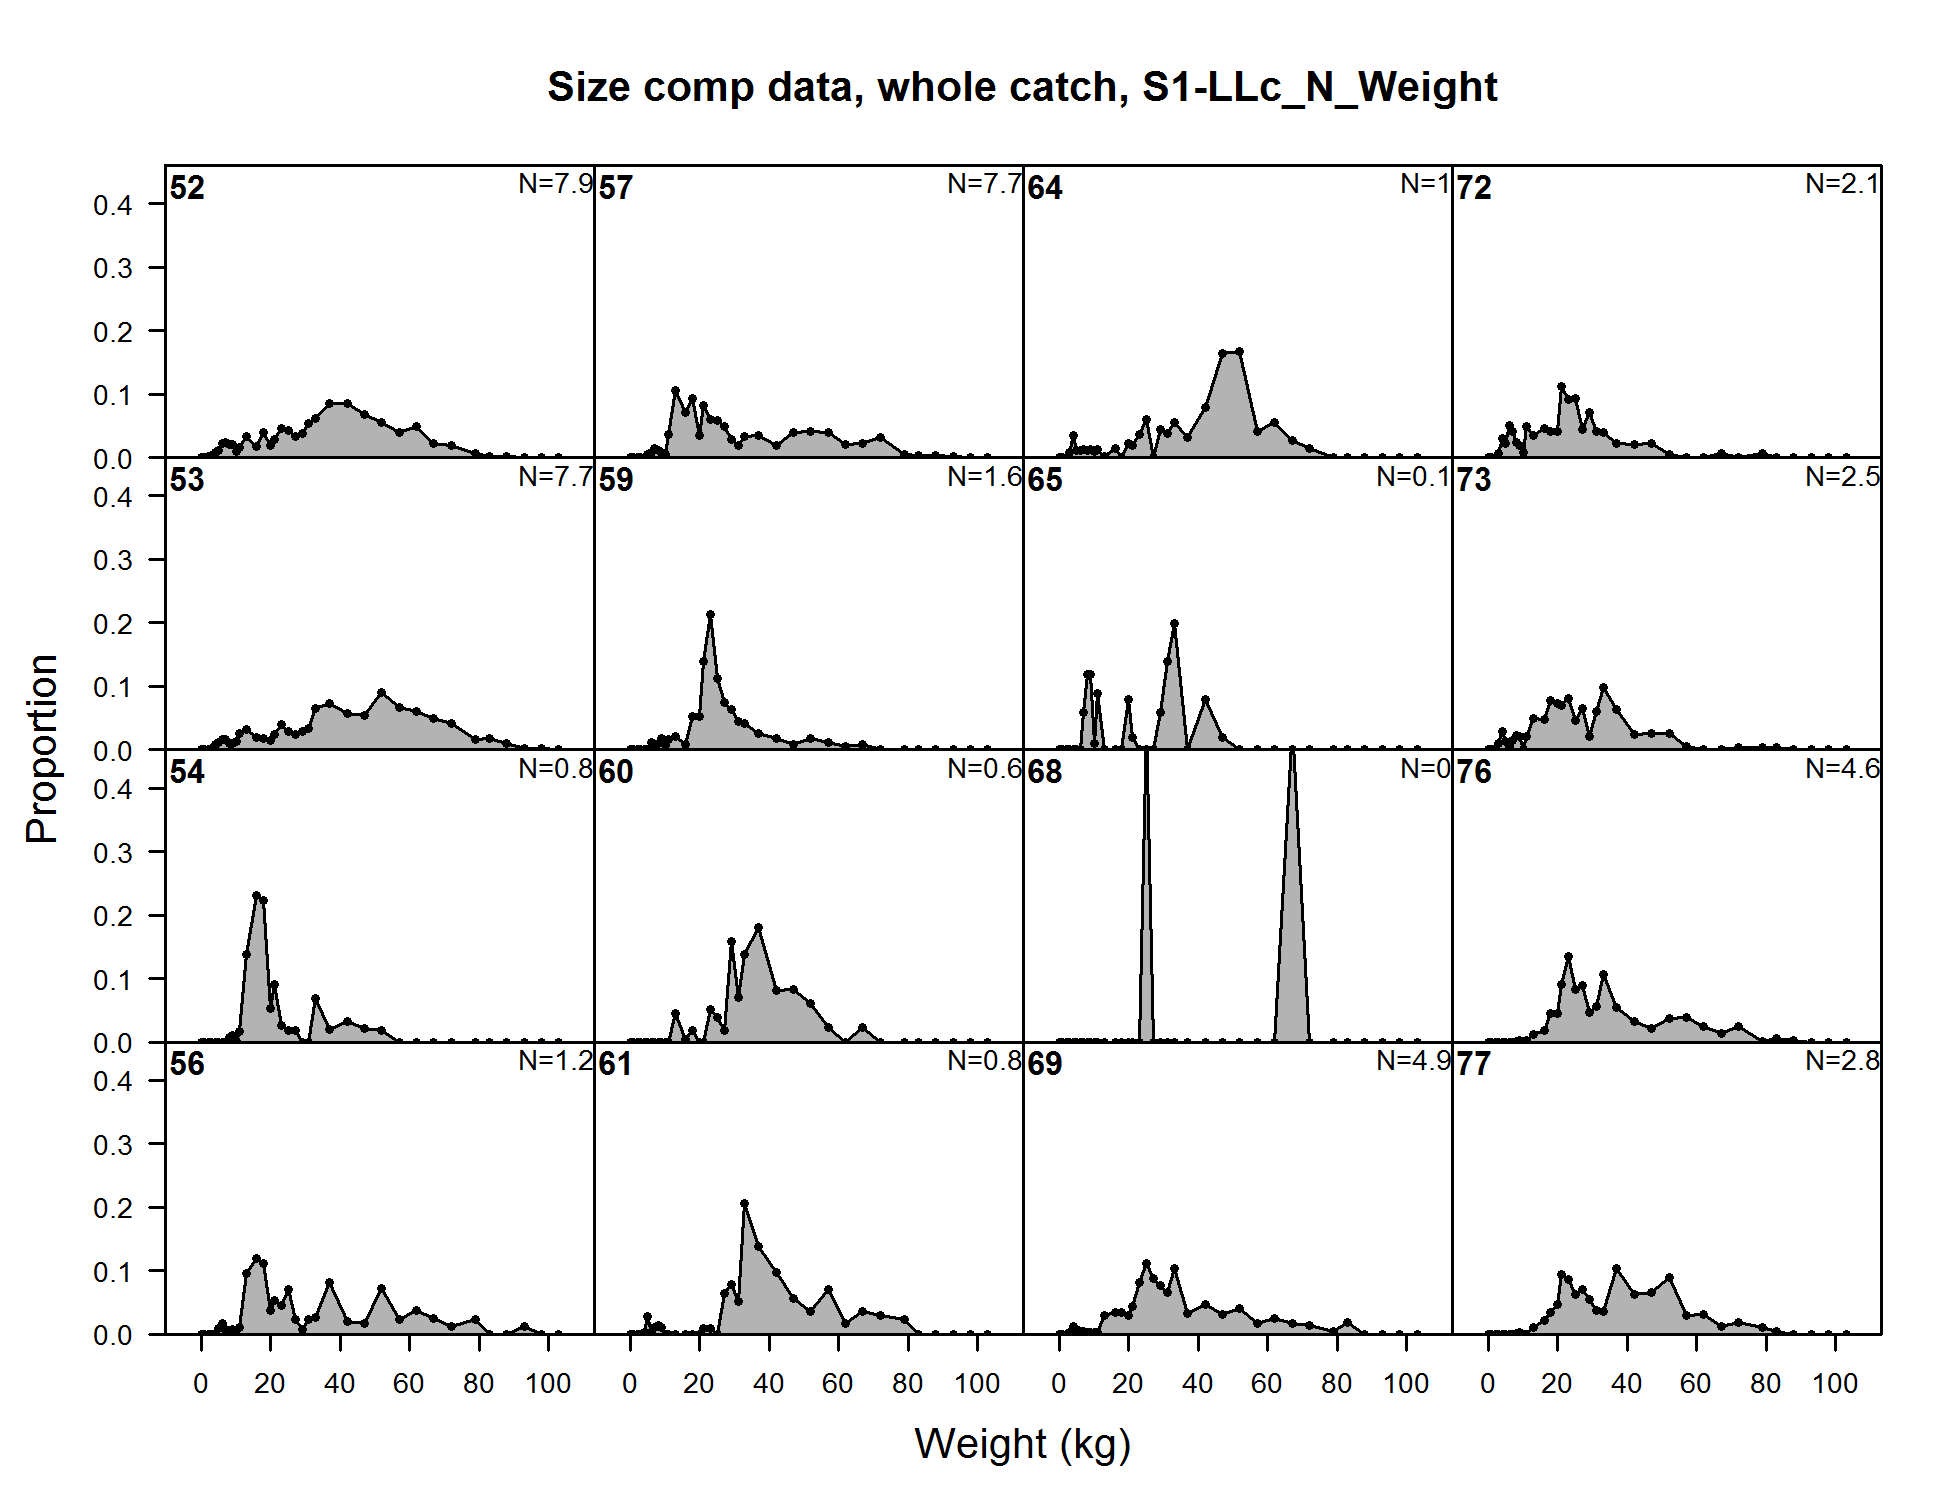
Size comp data, whole catch, S1-LLc_N_Weight (plot 1 of 3)
file: comp_sizedat_flt17mkt0_page1.png
Size comp data, whole catch, S1-LLc_N_Weight (plot 1 of 3) (plot 2 of 3)
file: comp_sizedat_flt17mkt0_page2.png
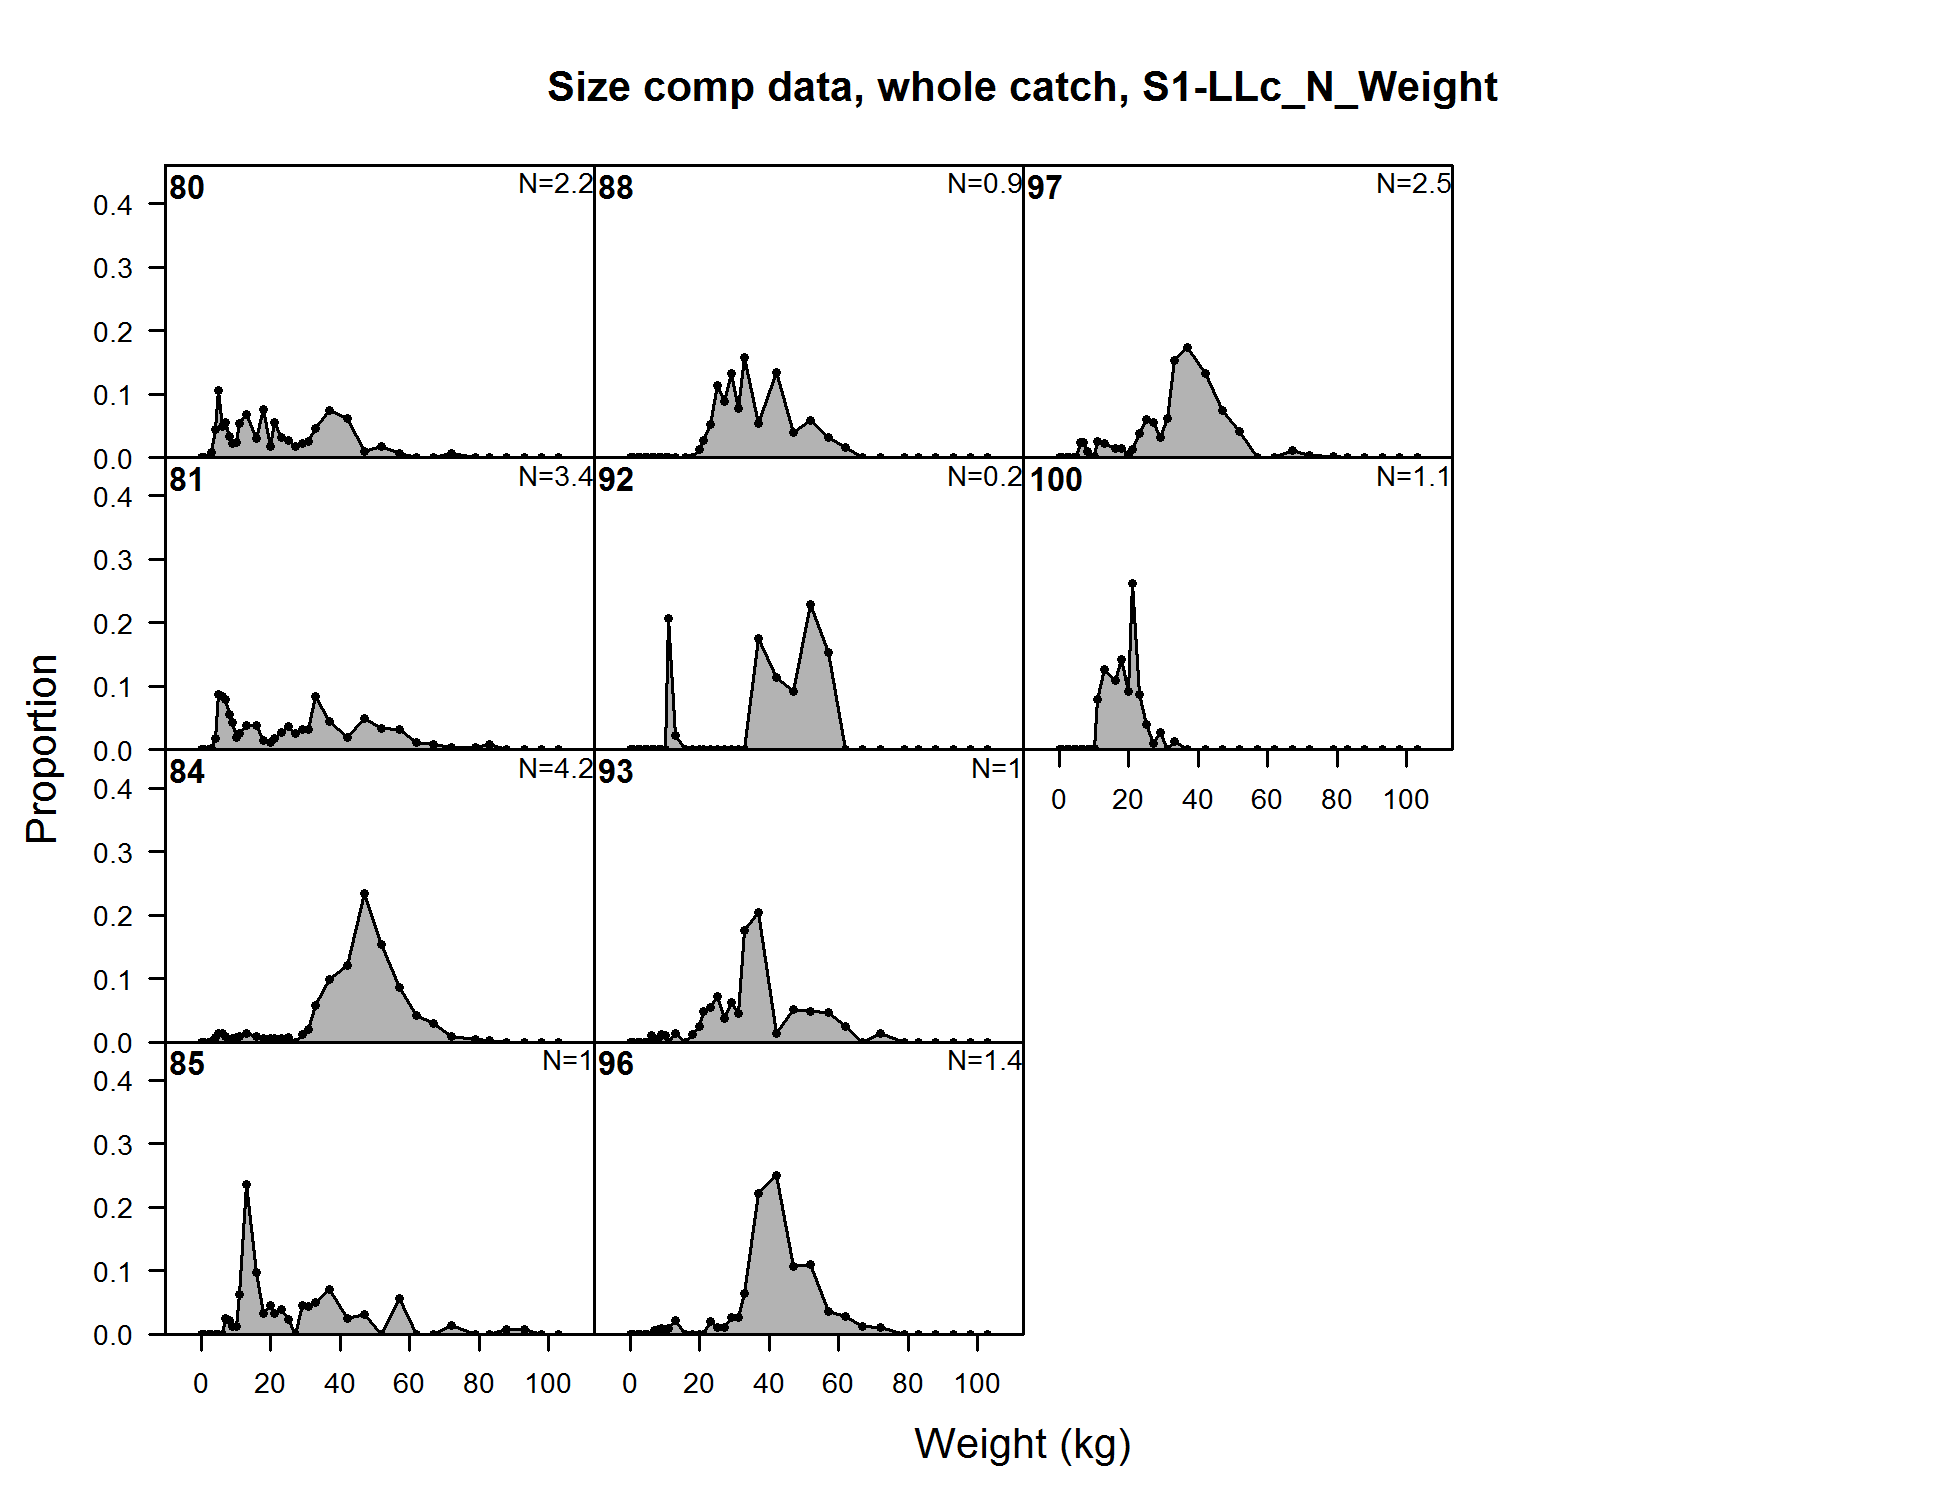
Size comp data, whole catch, S1-LLc_N_Weight (plot 1 of 3) (plot 2 of 3) (plot 3 of 3)
file: comp_sizedat_flt17mkt0_page3.png
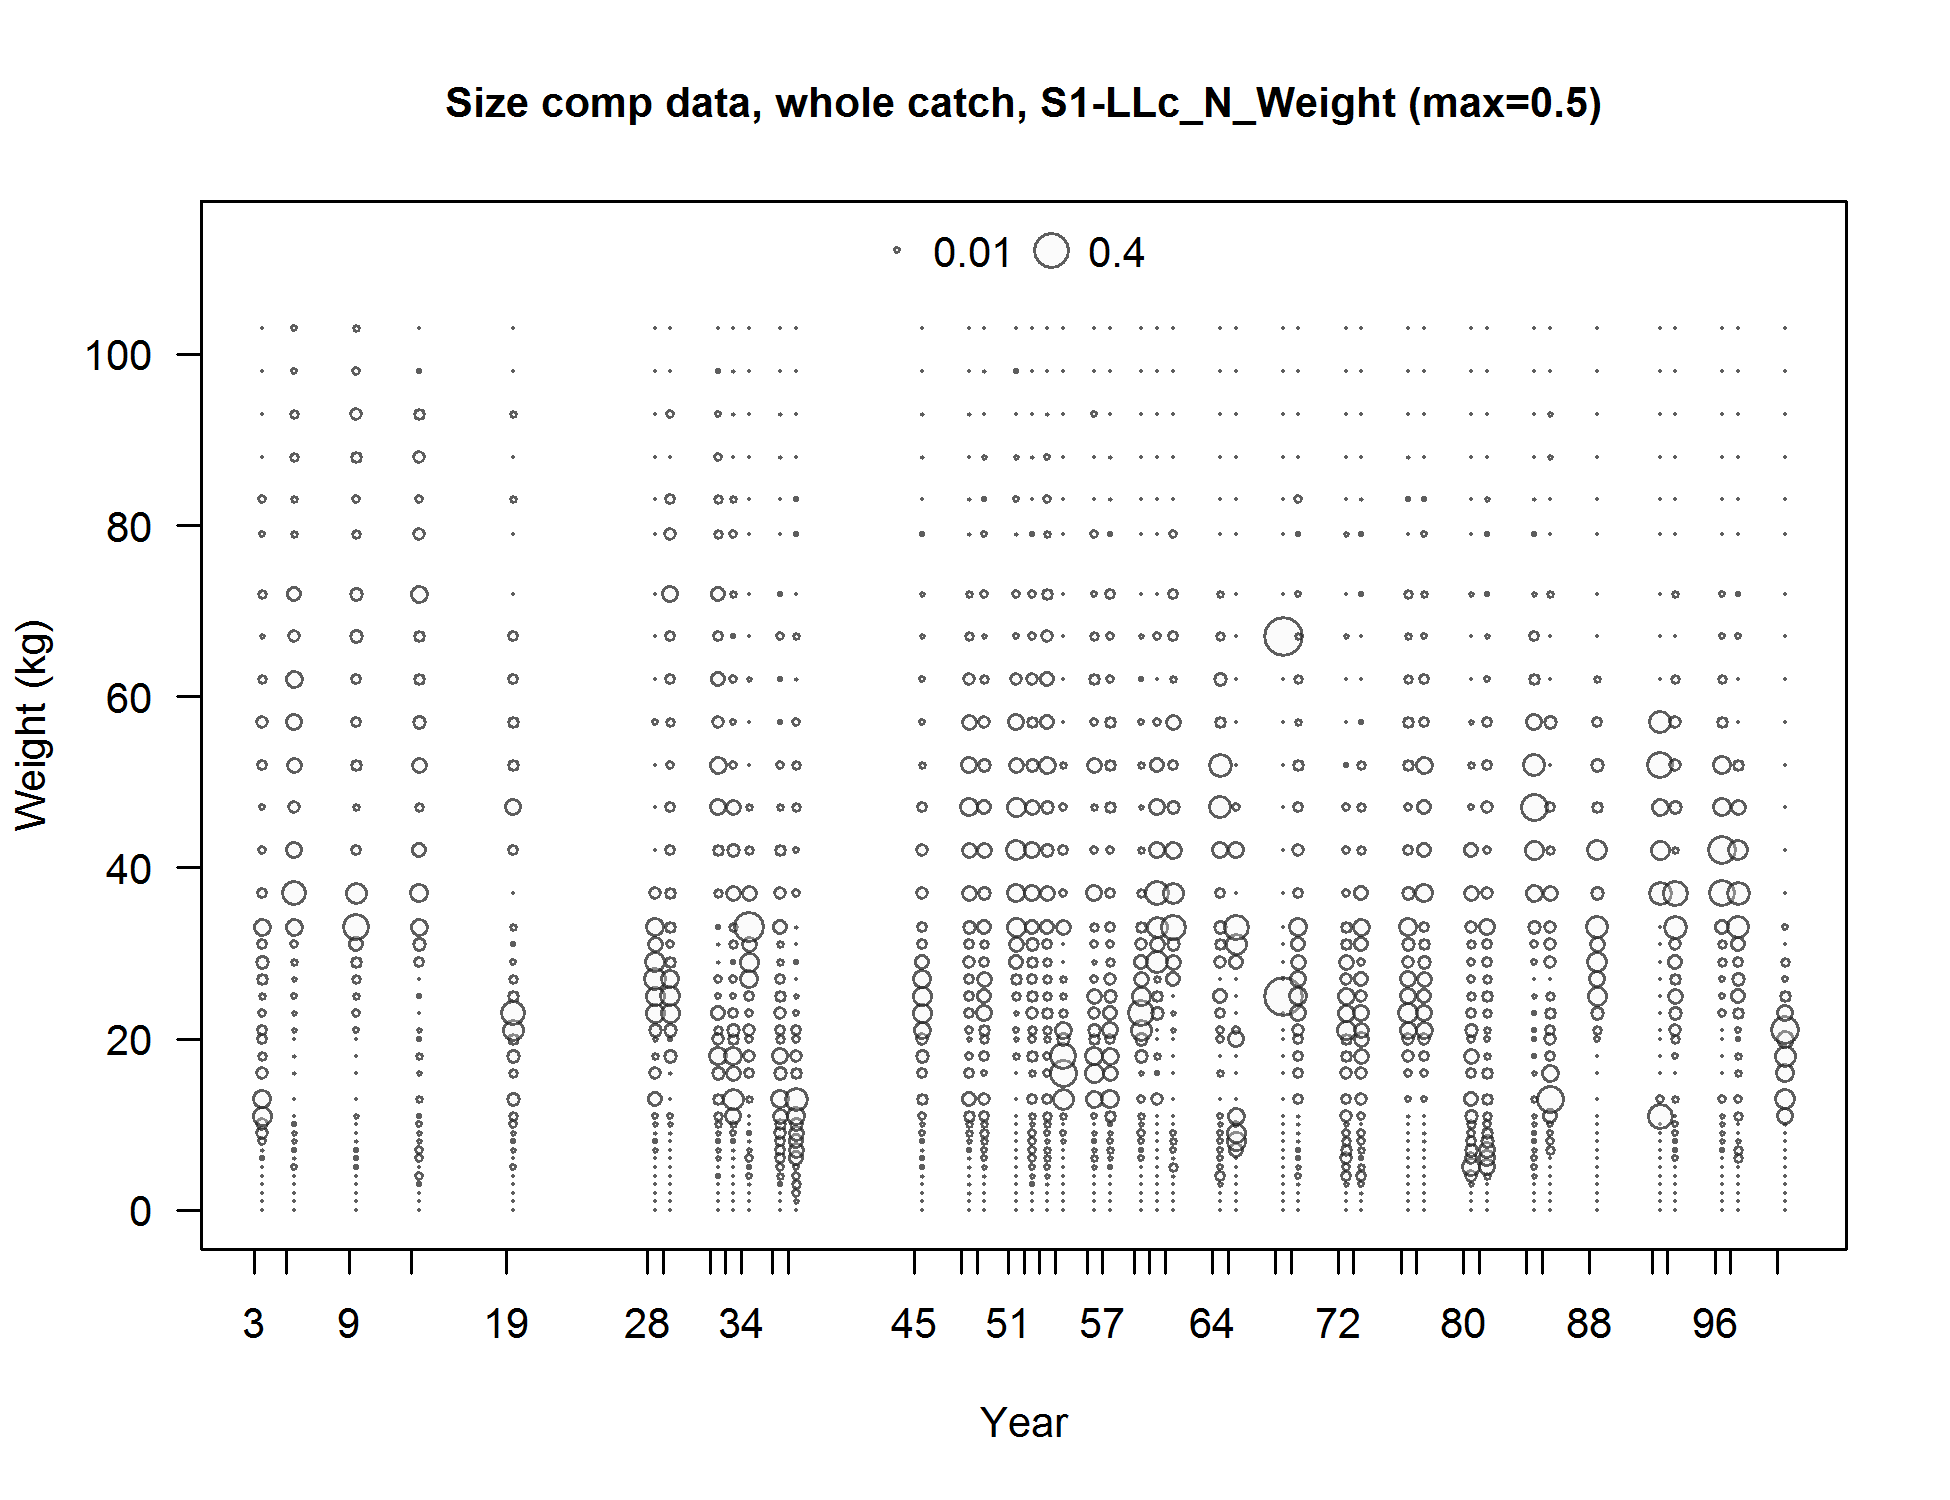
Size comp data, whole catch, S1-LLc_N_Weight (max=0.5) (plot 3 of 3)
file: comp_sizedat_bubflt17mkt0_page3.png
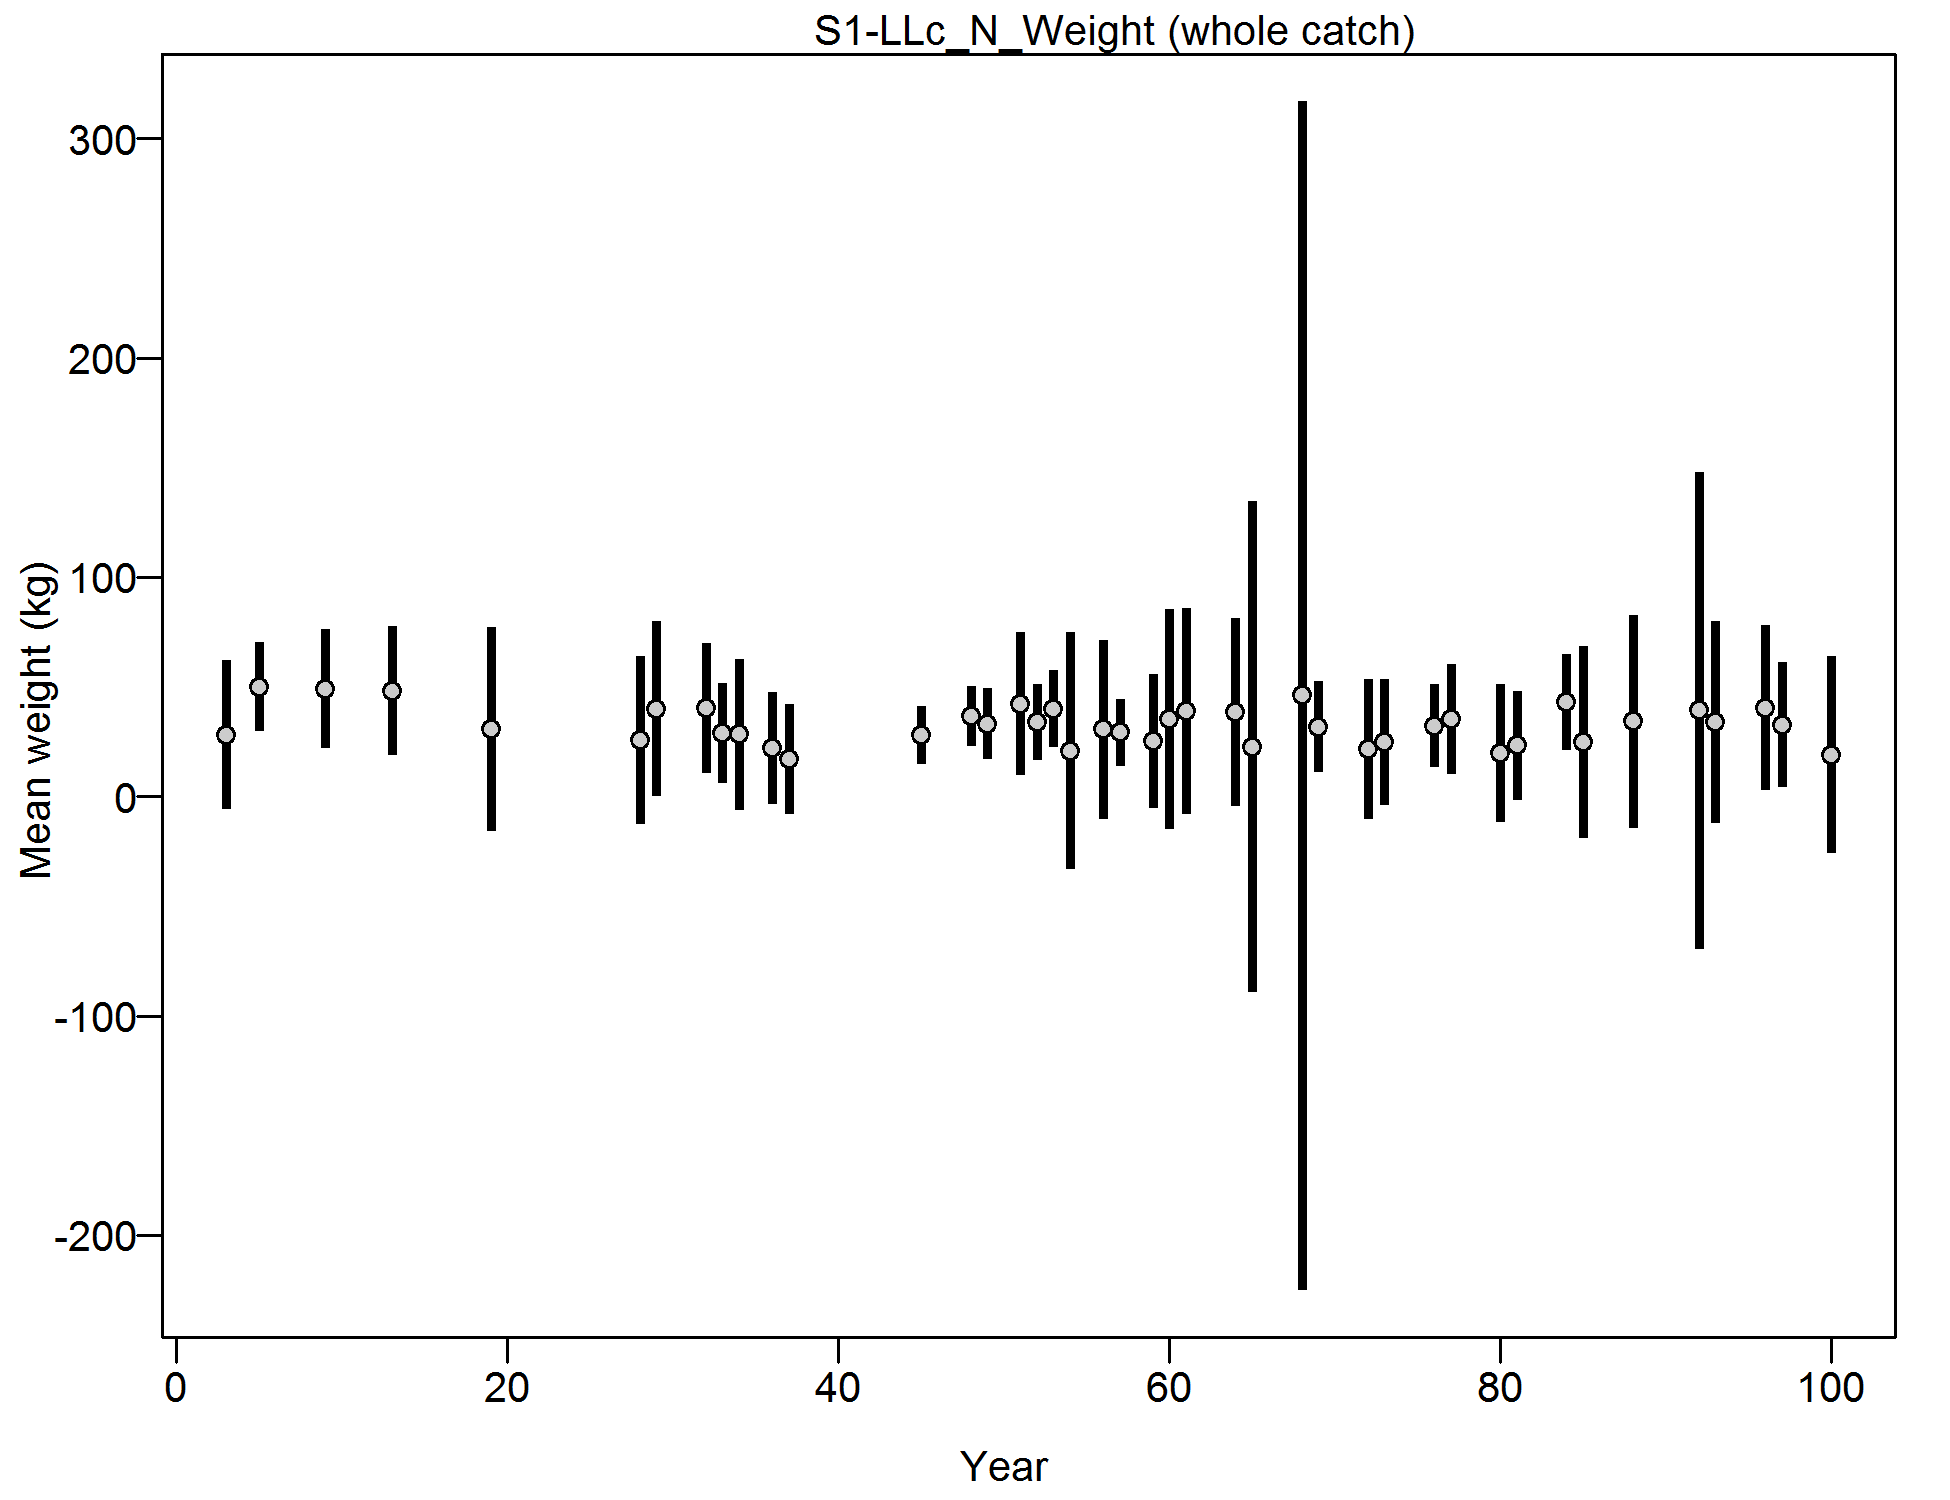
Mean size for S1-LLc_N_Weight with 95% confidence intervals based on current samples sizes.
file: comp_sizedat_data_weighting_TA1.8_S1-LLc_N_Weight.png
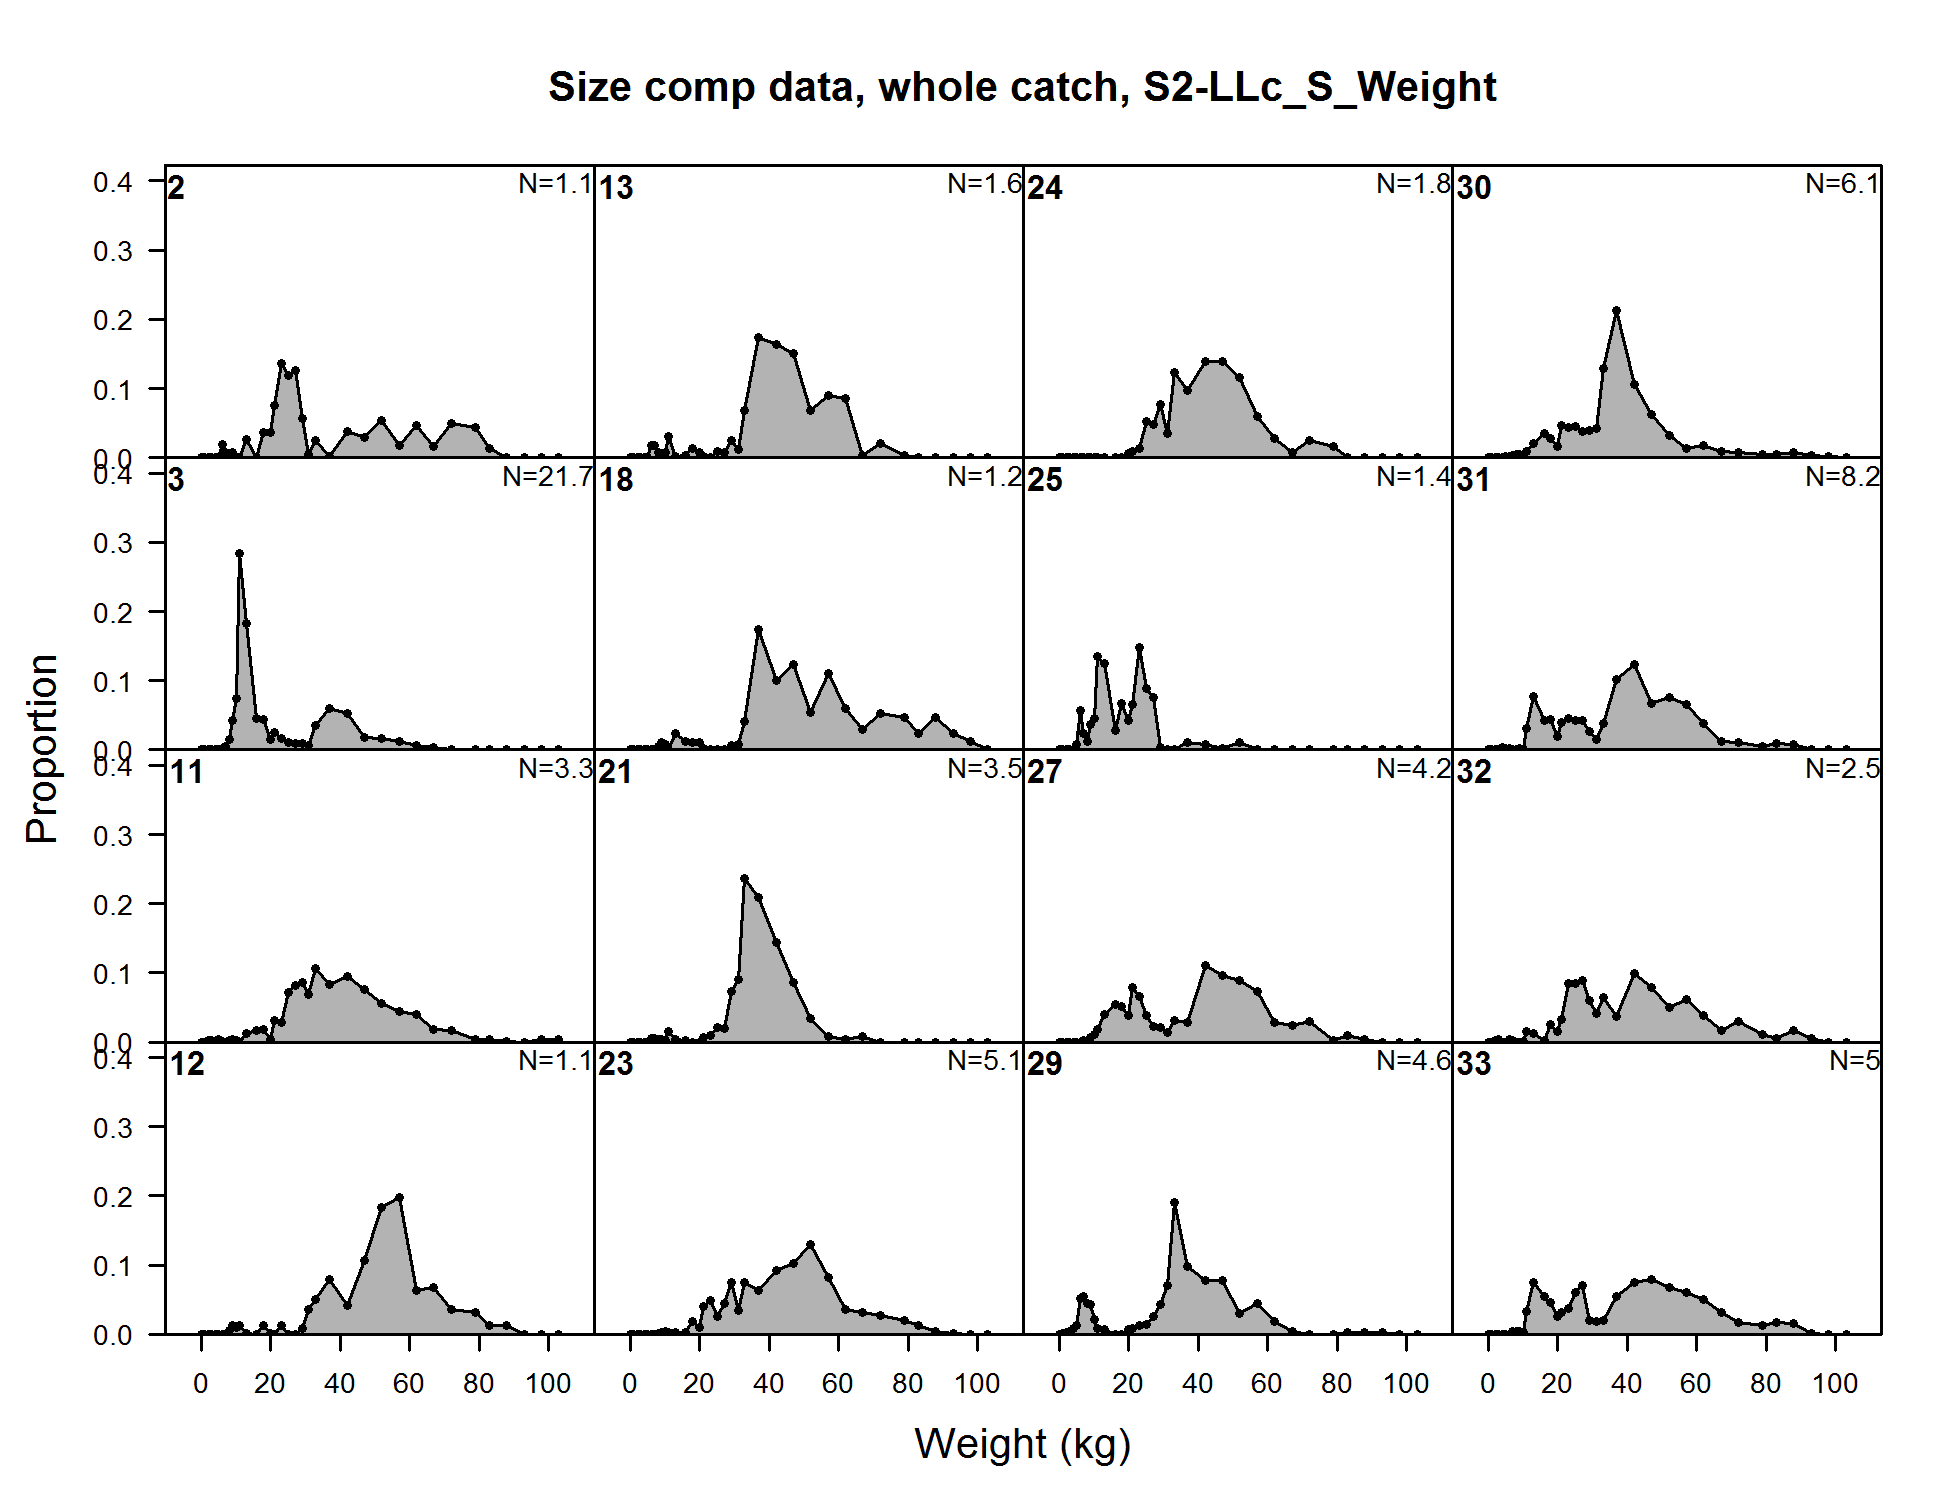
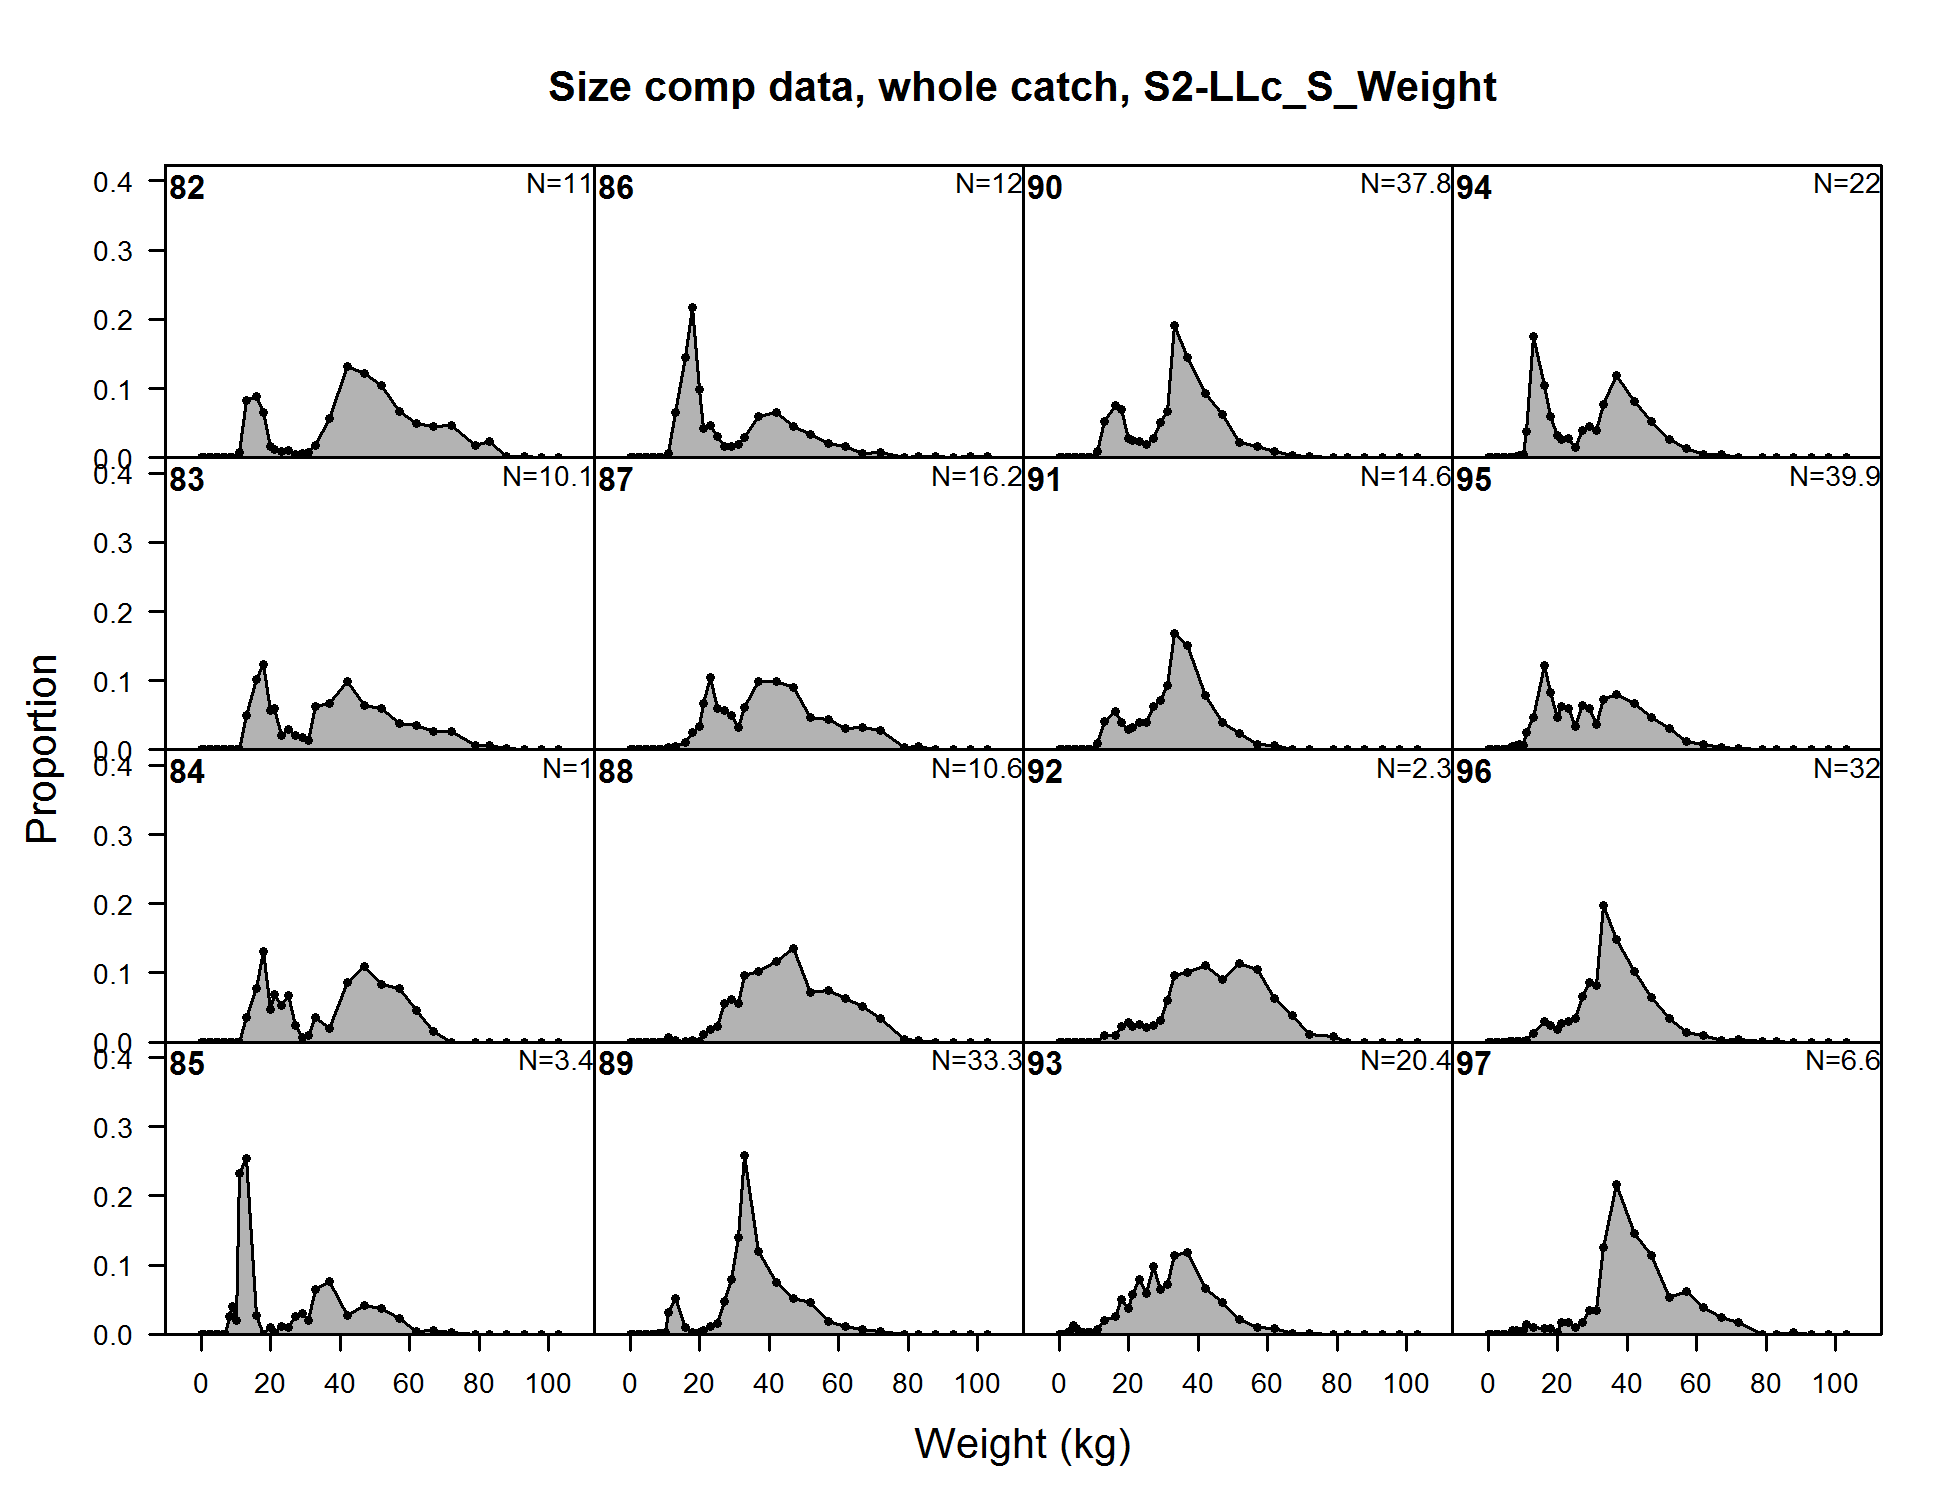
Size comp data, whole catch, S2-LLc_S_Weight (plot 1 of 6)
file: comp_sizedat_flt18mkt0_page1.png
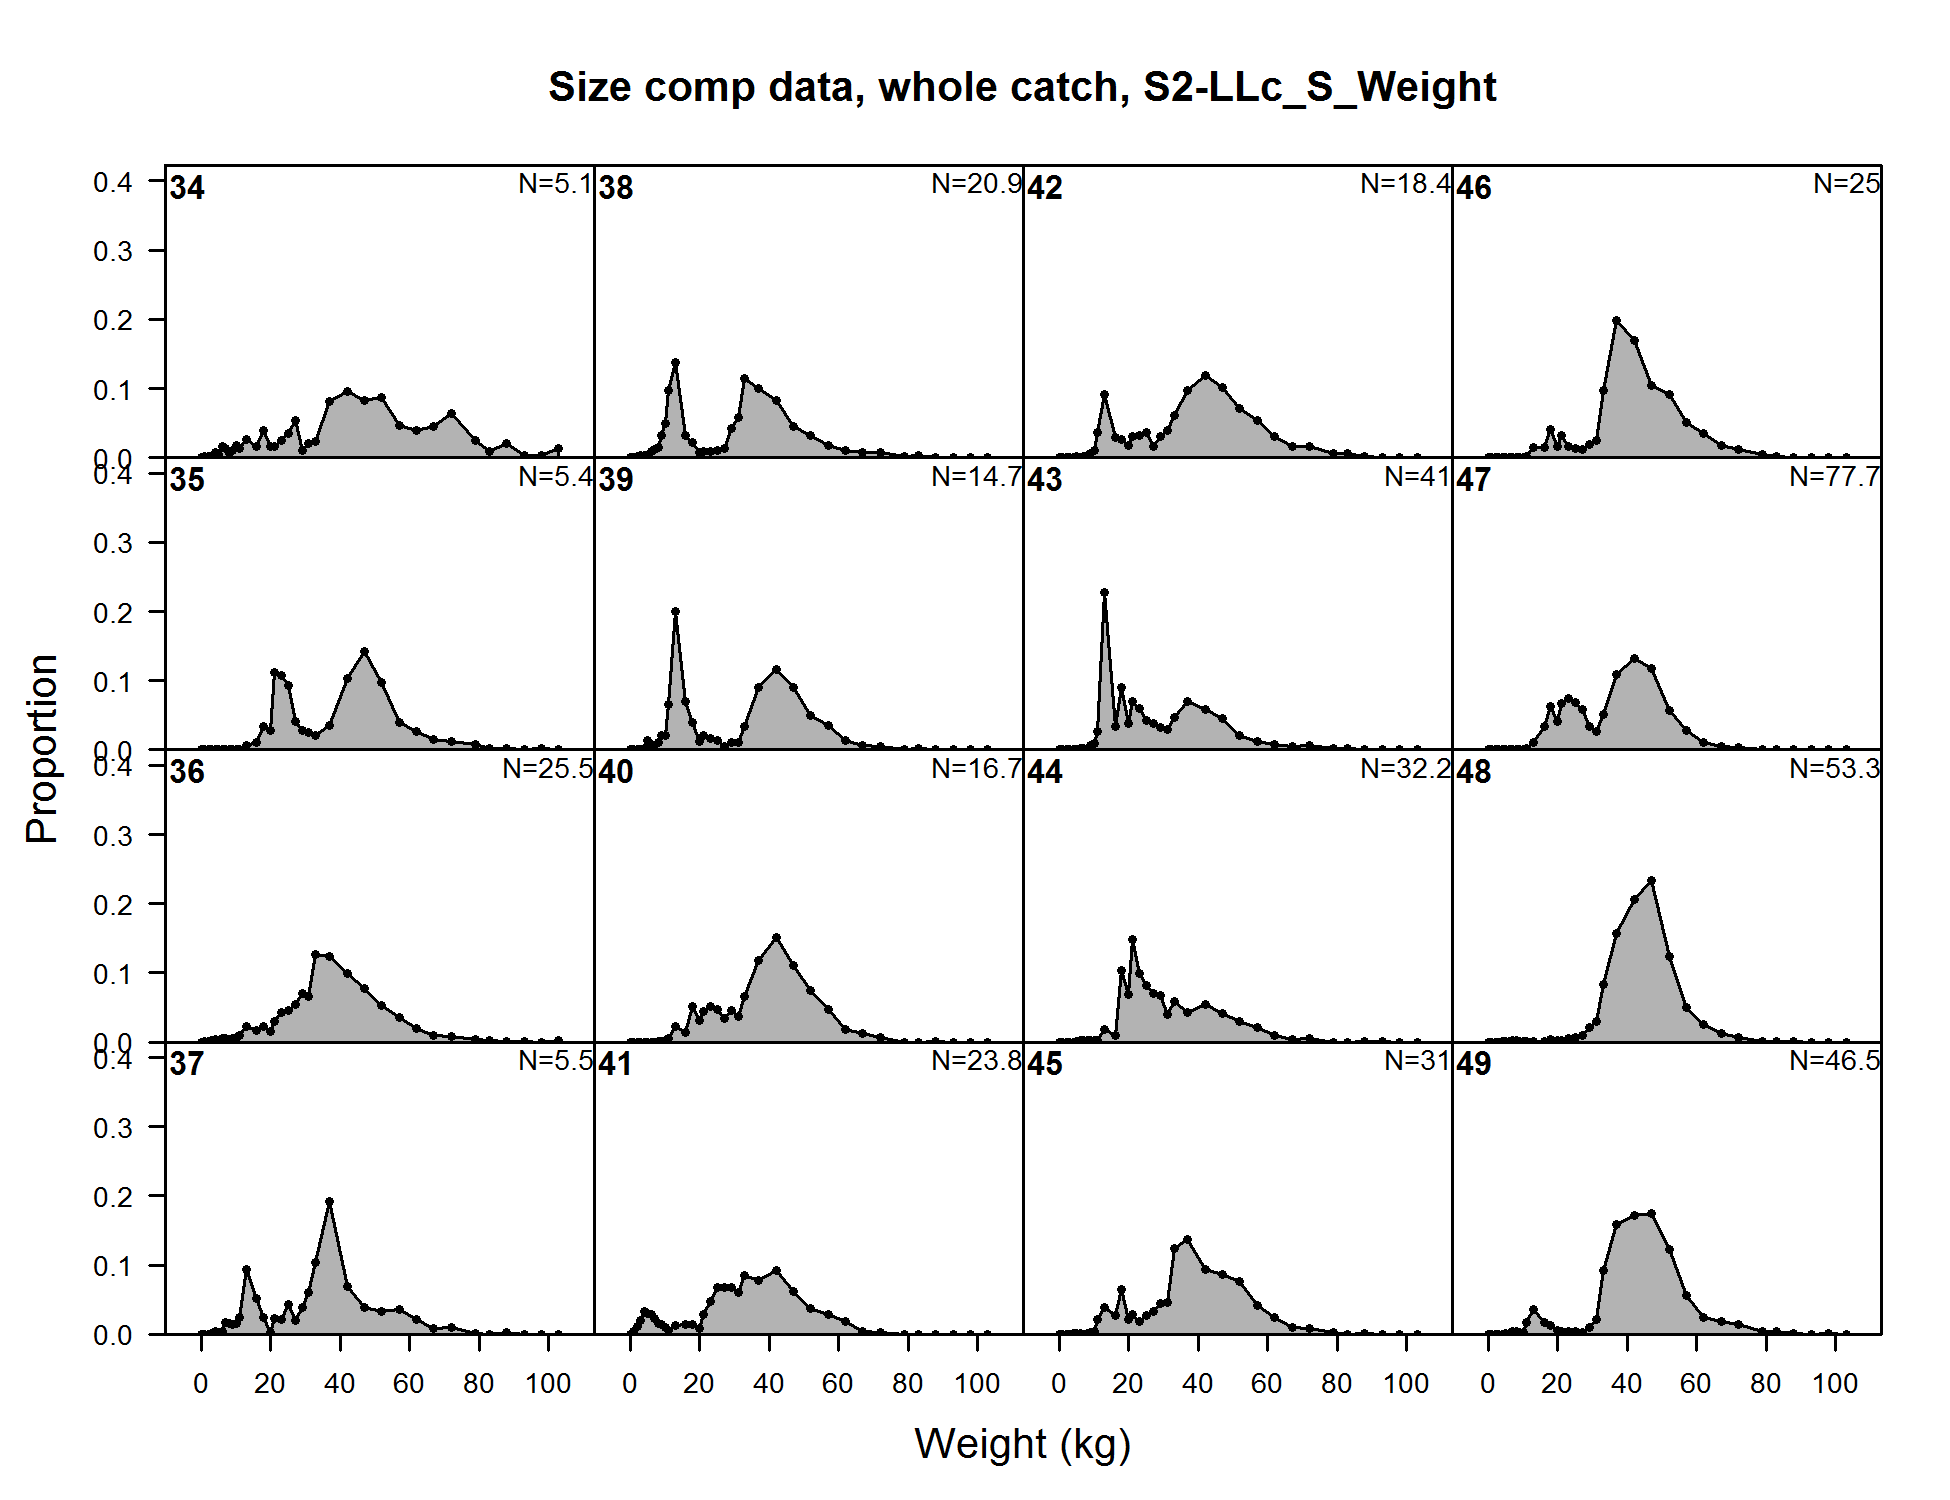
Size comp data, whole catch, S2-LLc_S_Weight (plot 1 of 6) (plot 2 of 6)
file: comp_sizedat_flt18mkt0_page2.png
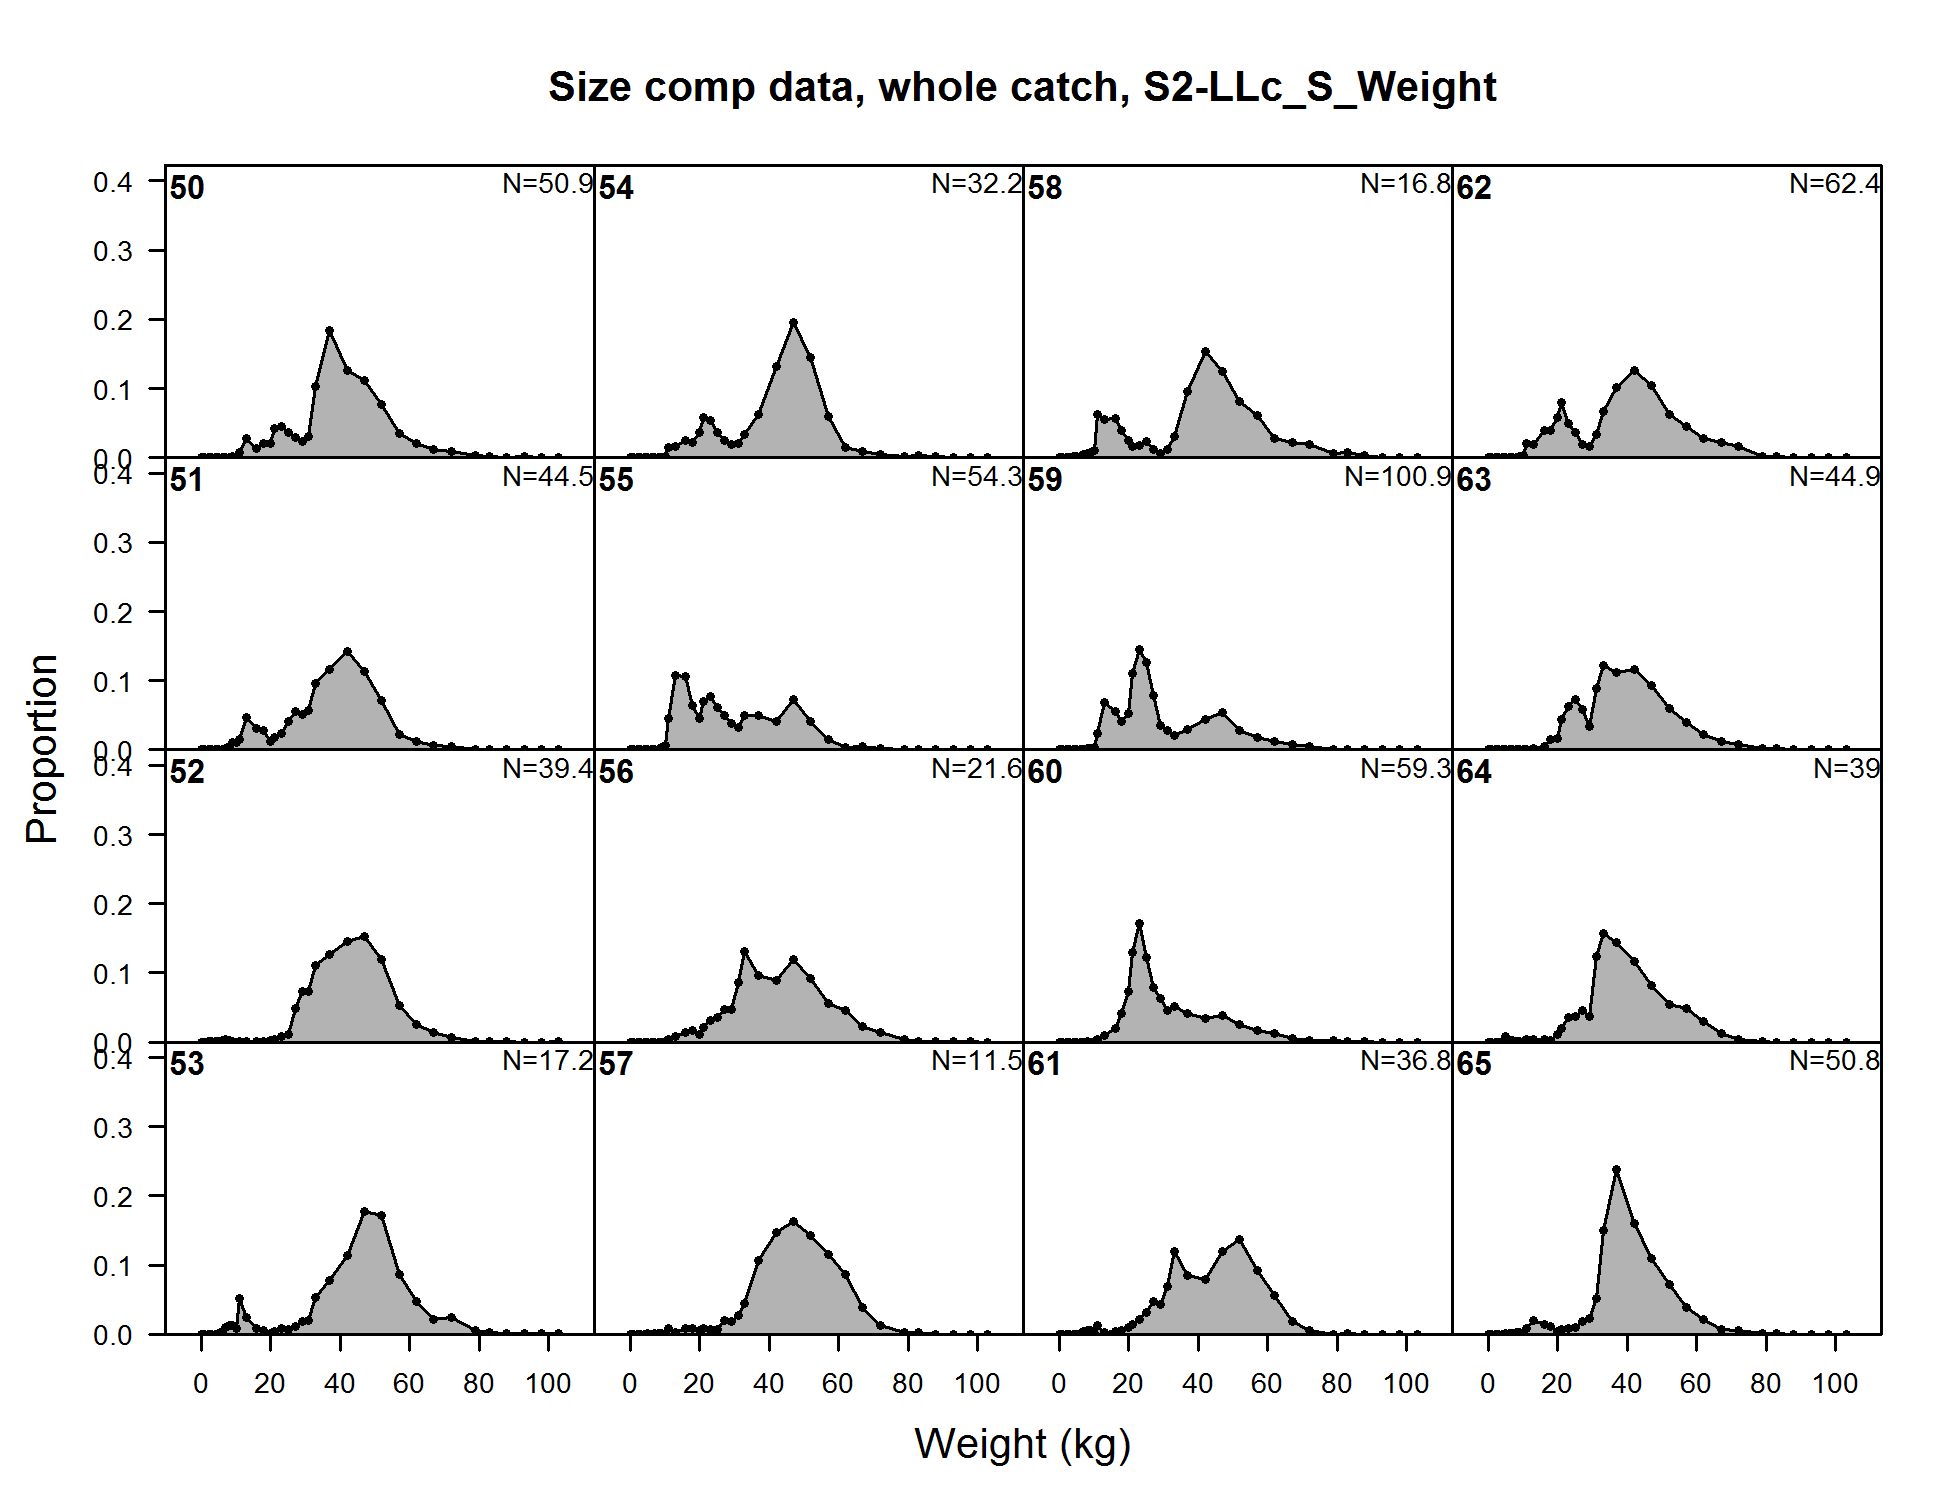
Size comp data, whole catch, S2-LLc_S_Weight (plot 1 of 6) (plot 2 of 6) (plot 3 of 6)
file: comp_sizedat_flt18mkt0_page3.png
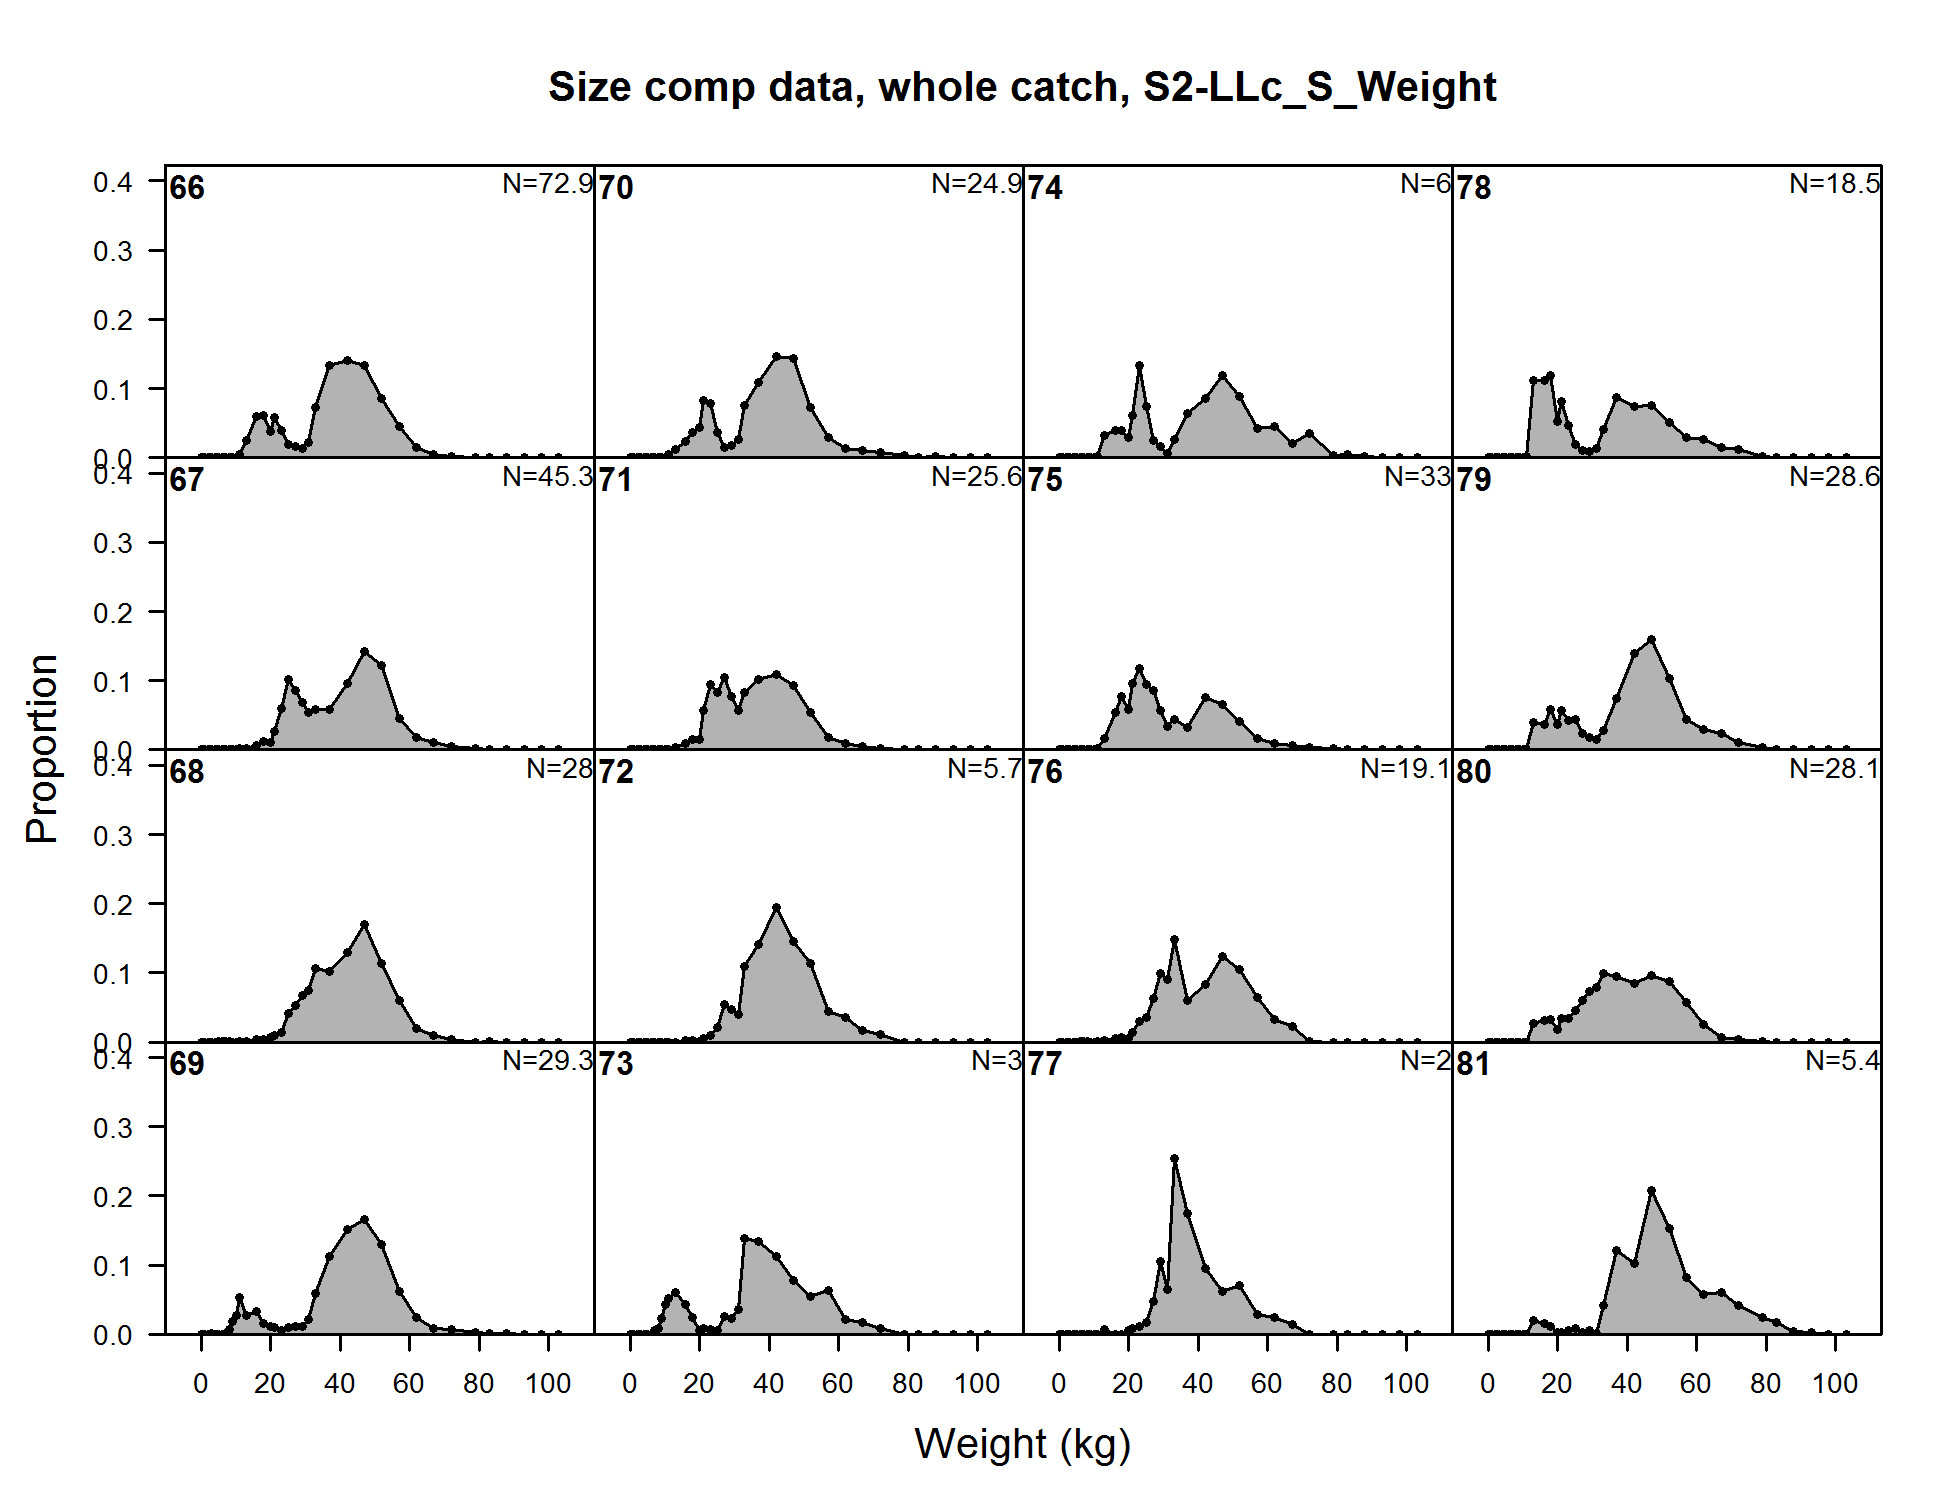
Size comp data, whole catch, S2-LLc_S_Weight (plot 1 of 6) (plot 2 of 6) (plot 3 of 6) (plot 4 of 6)
file: comp_sizedat_flt18mkt0_page4.png
Size comp data, whole catch, S2-LLc_S_Weight (plot 1 of 6) (plot 2 of 6) (plot 3 of 6) (plot 4 of 6) (plot 5 of 6)
file: comp_sizedat_flt18mkt0_page5.png
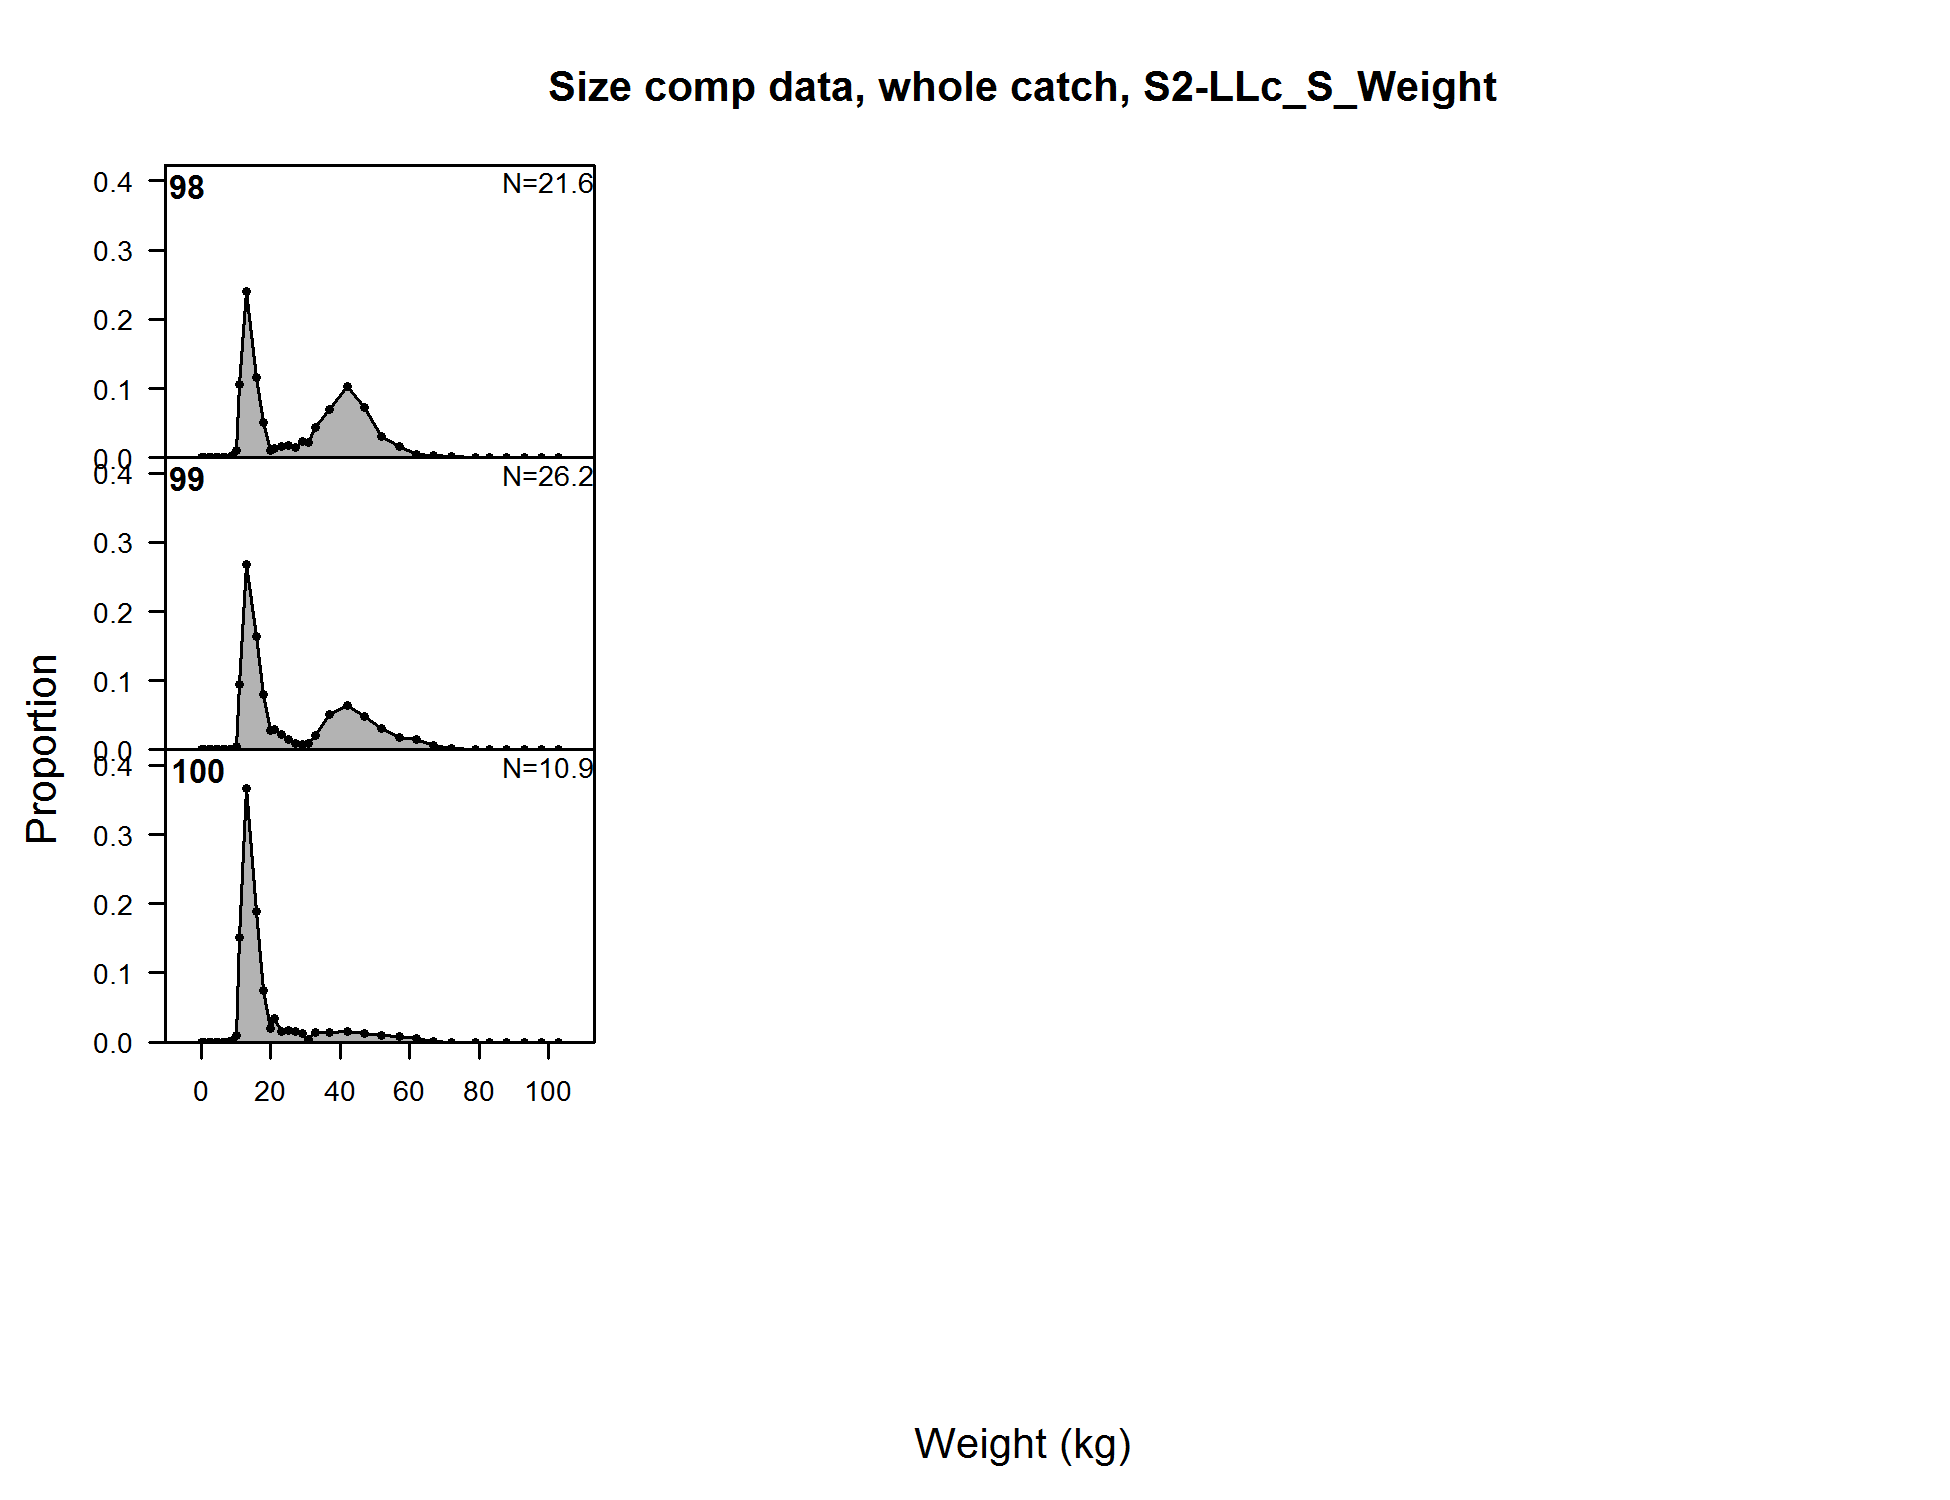
Size comp data, whole catch, S2-LLc_S_Weight (plot 1 of 6) (plot 2 of 6) (plot 3 of 6) (plot 4 of 6) (plot 5 of 6) (plot 6 of 6)
file: comp_sizedat_flt18mkt0_page6.png
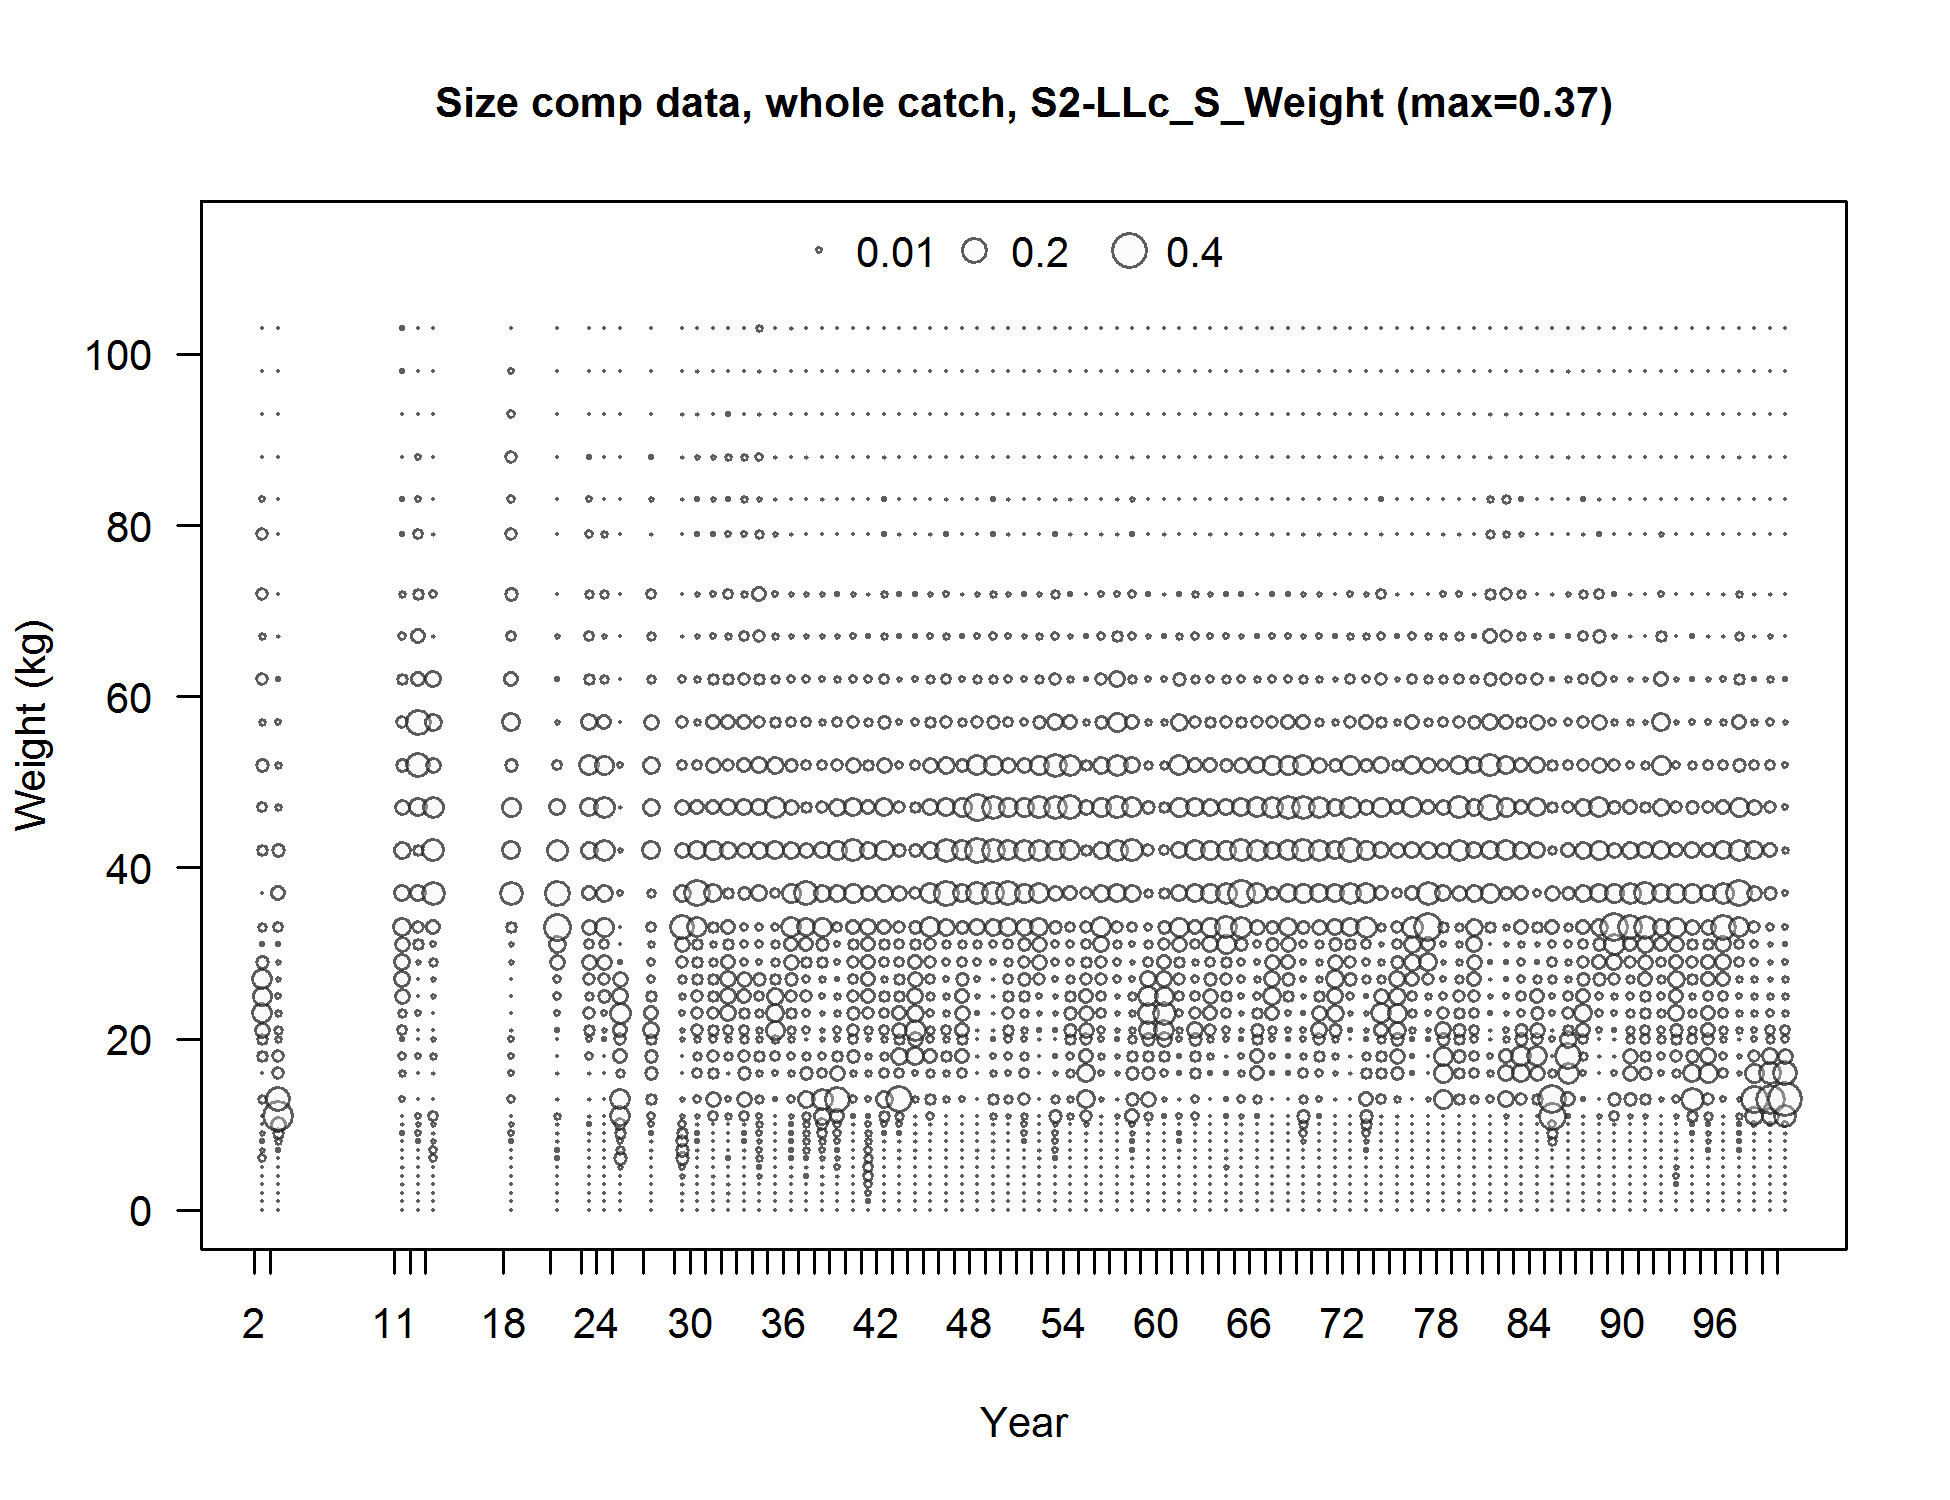
Size comp data, whole catch, S2-LLc_S_Weight (max=0.37) (plot 6 of 6)
file: comp_sizedat_bubflt18mkt0_page6.png
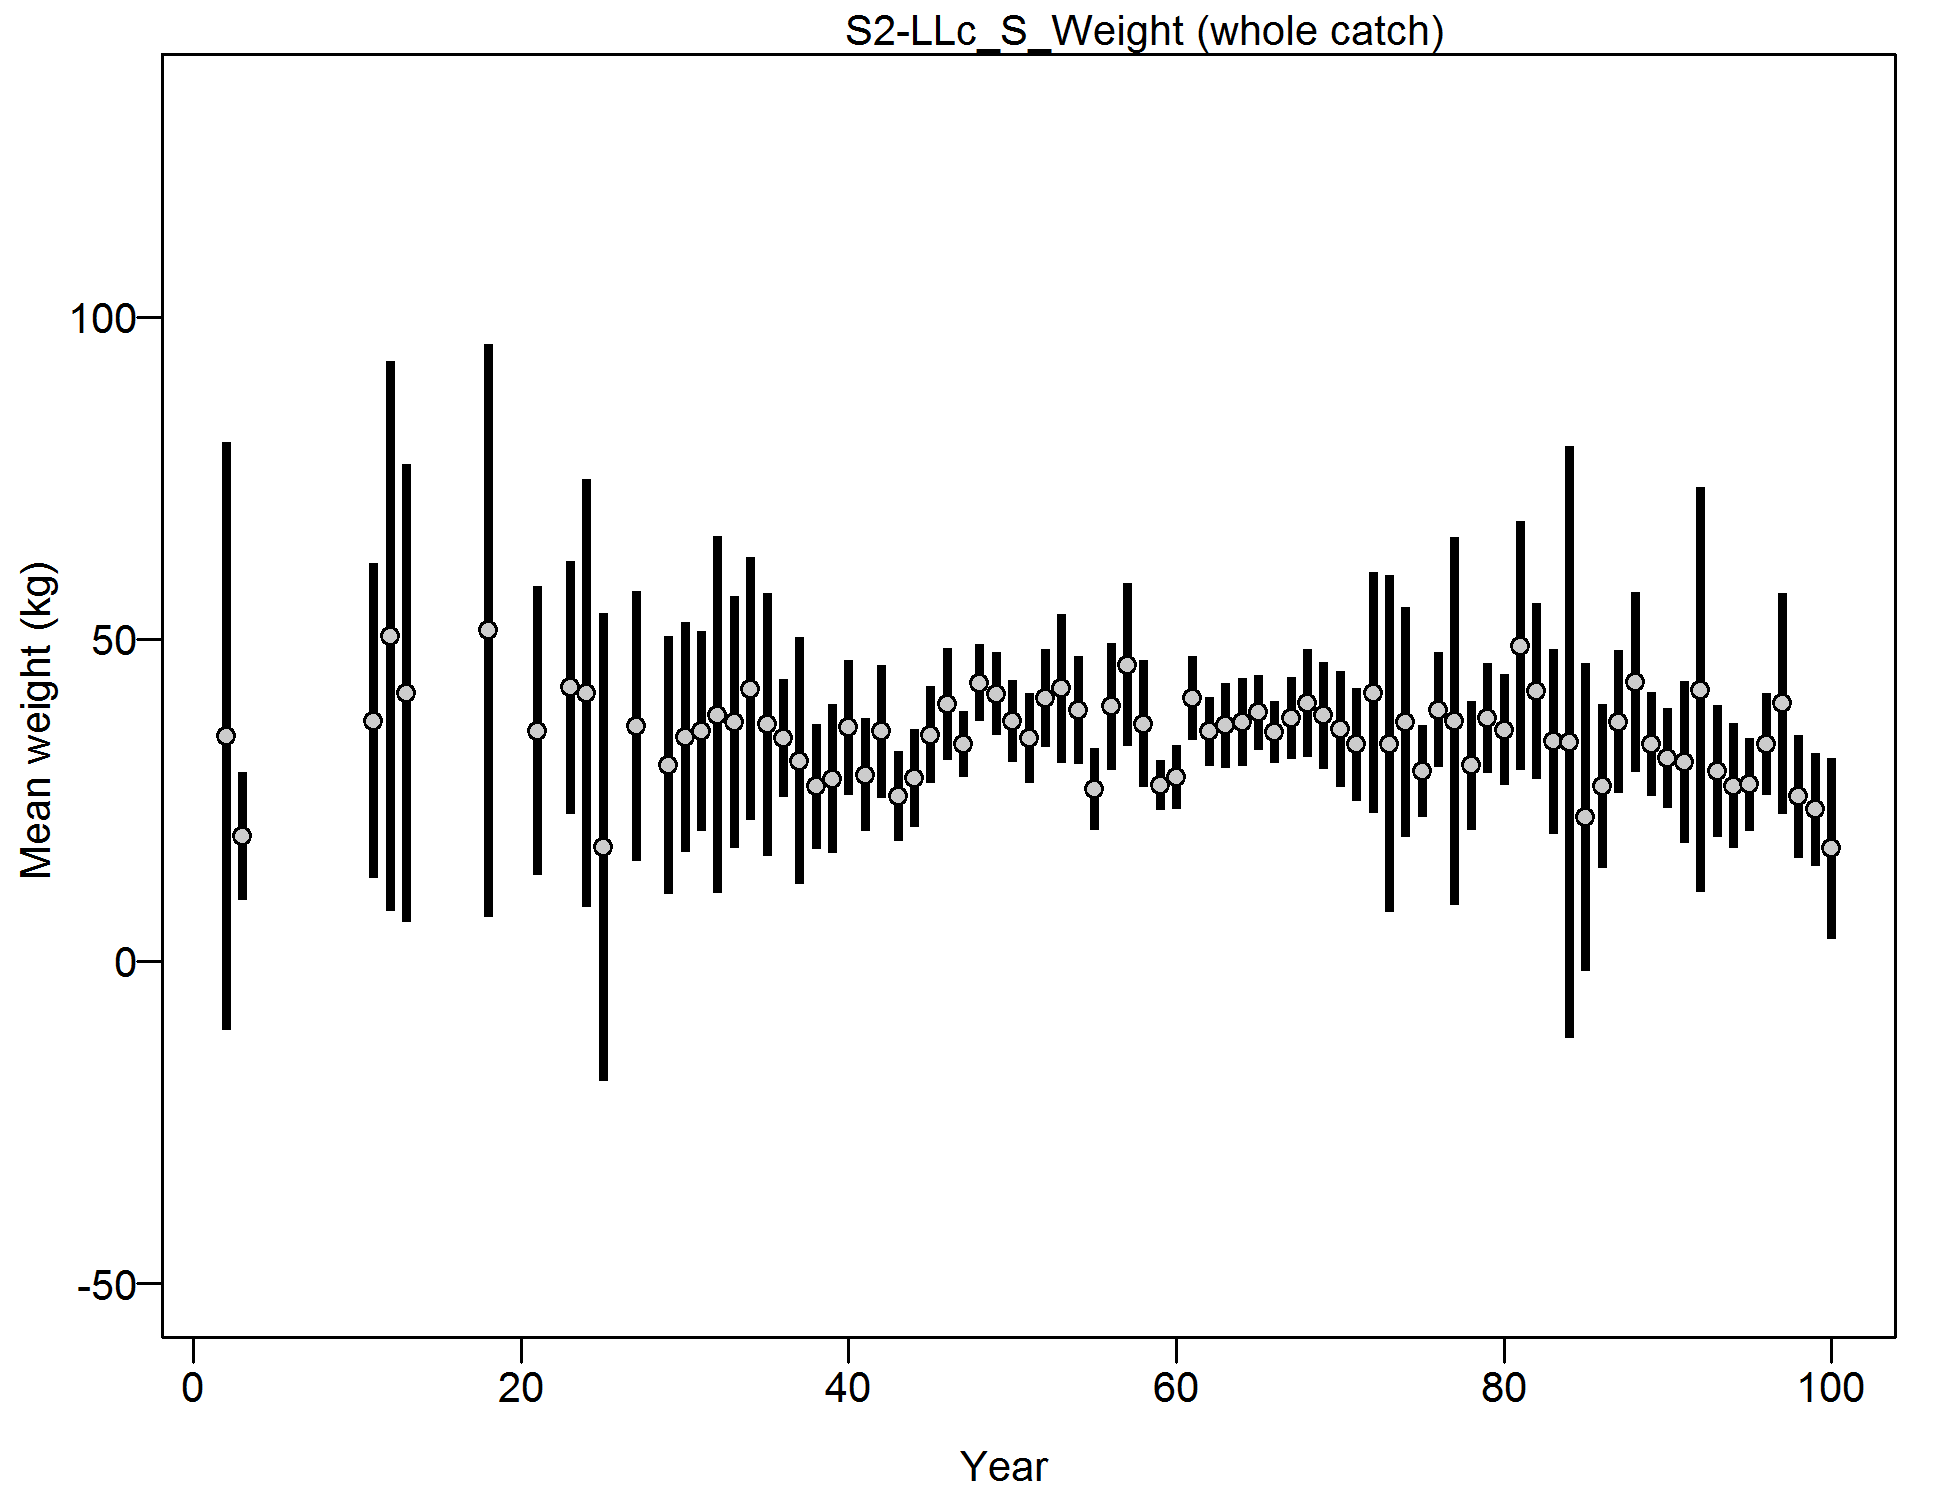
Mean size for S2-LLc_S_Weight with 95% confidence intervals based on current samples sizes.
file: comp_sizedat_data_weighting_TA1.8_S2-LLc_S_Weight.png
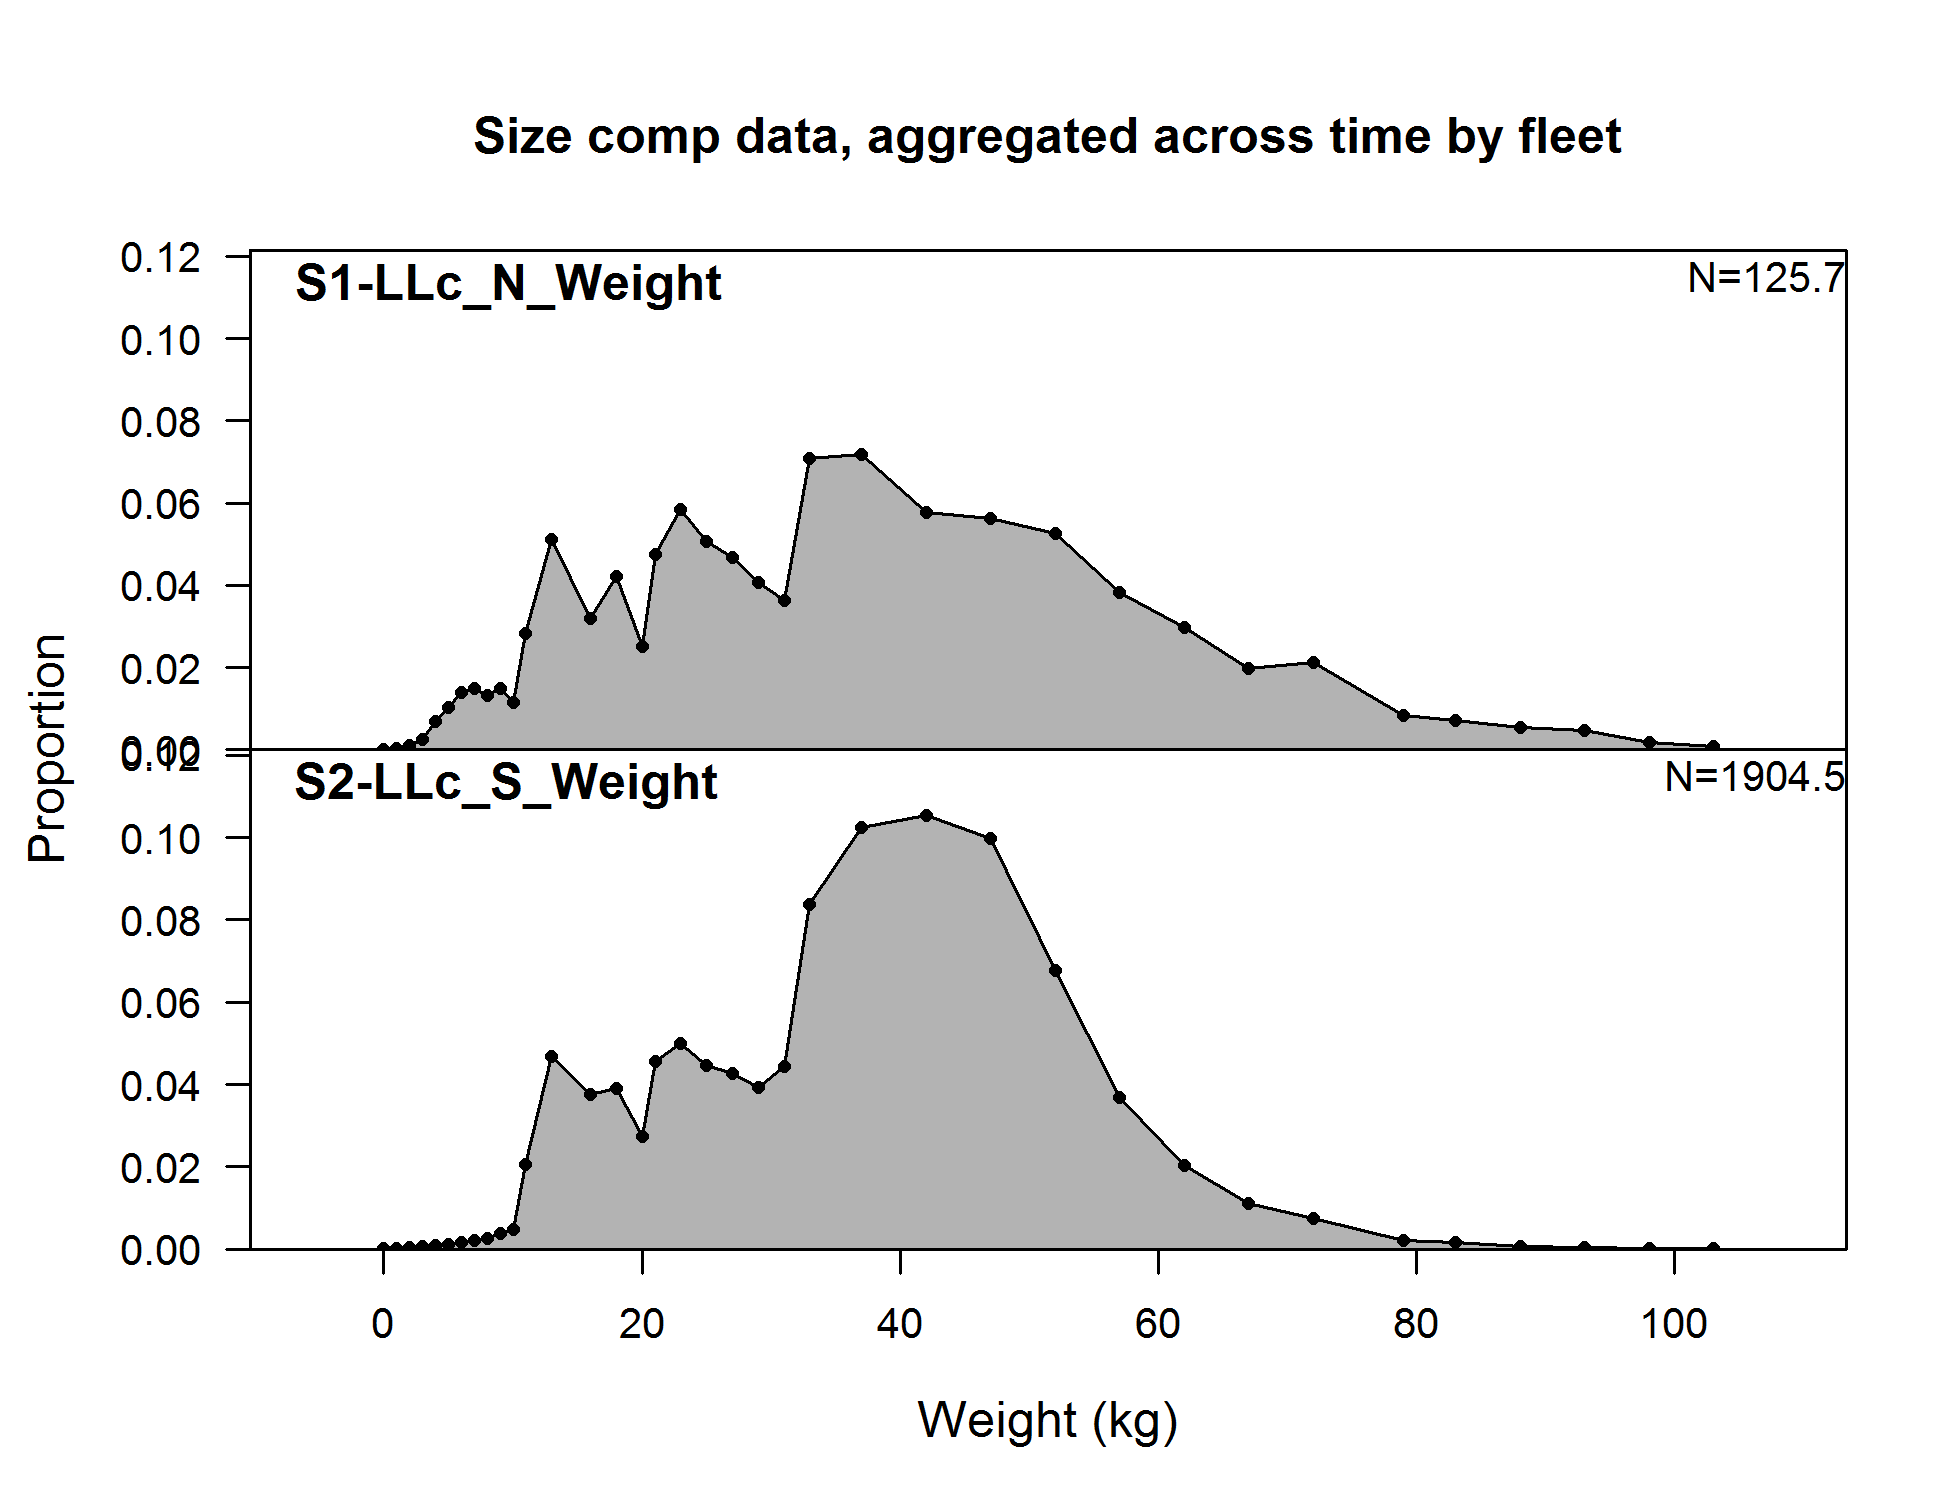
Size comp data, aggregated across time by fleet.
Labels 'retained' and 'discard' indicate discarded or retained sampled for each fleet. Panels without this designation represent the whole catch.
file: comp_sizedat__aggregated_across_time.png
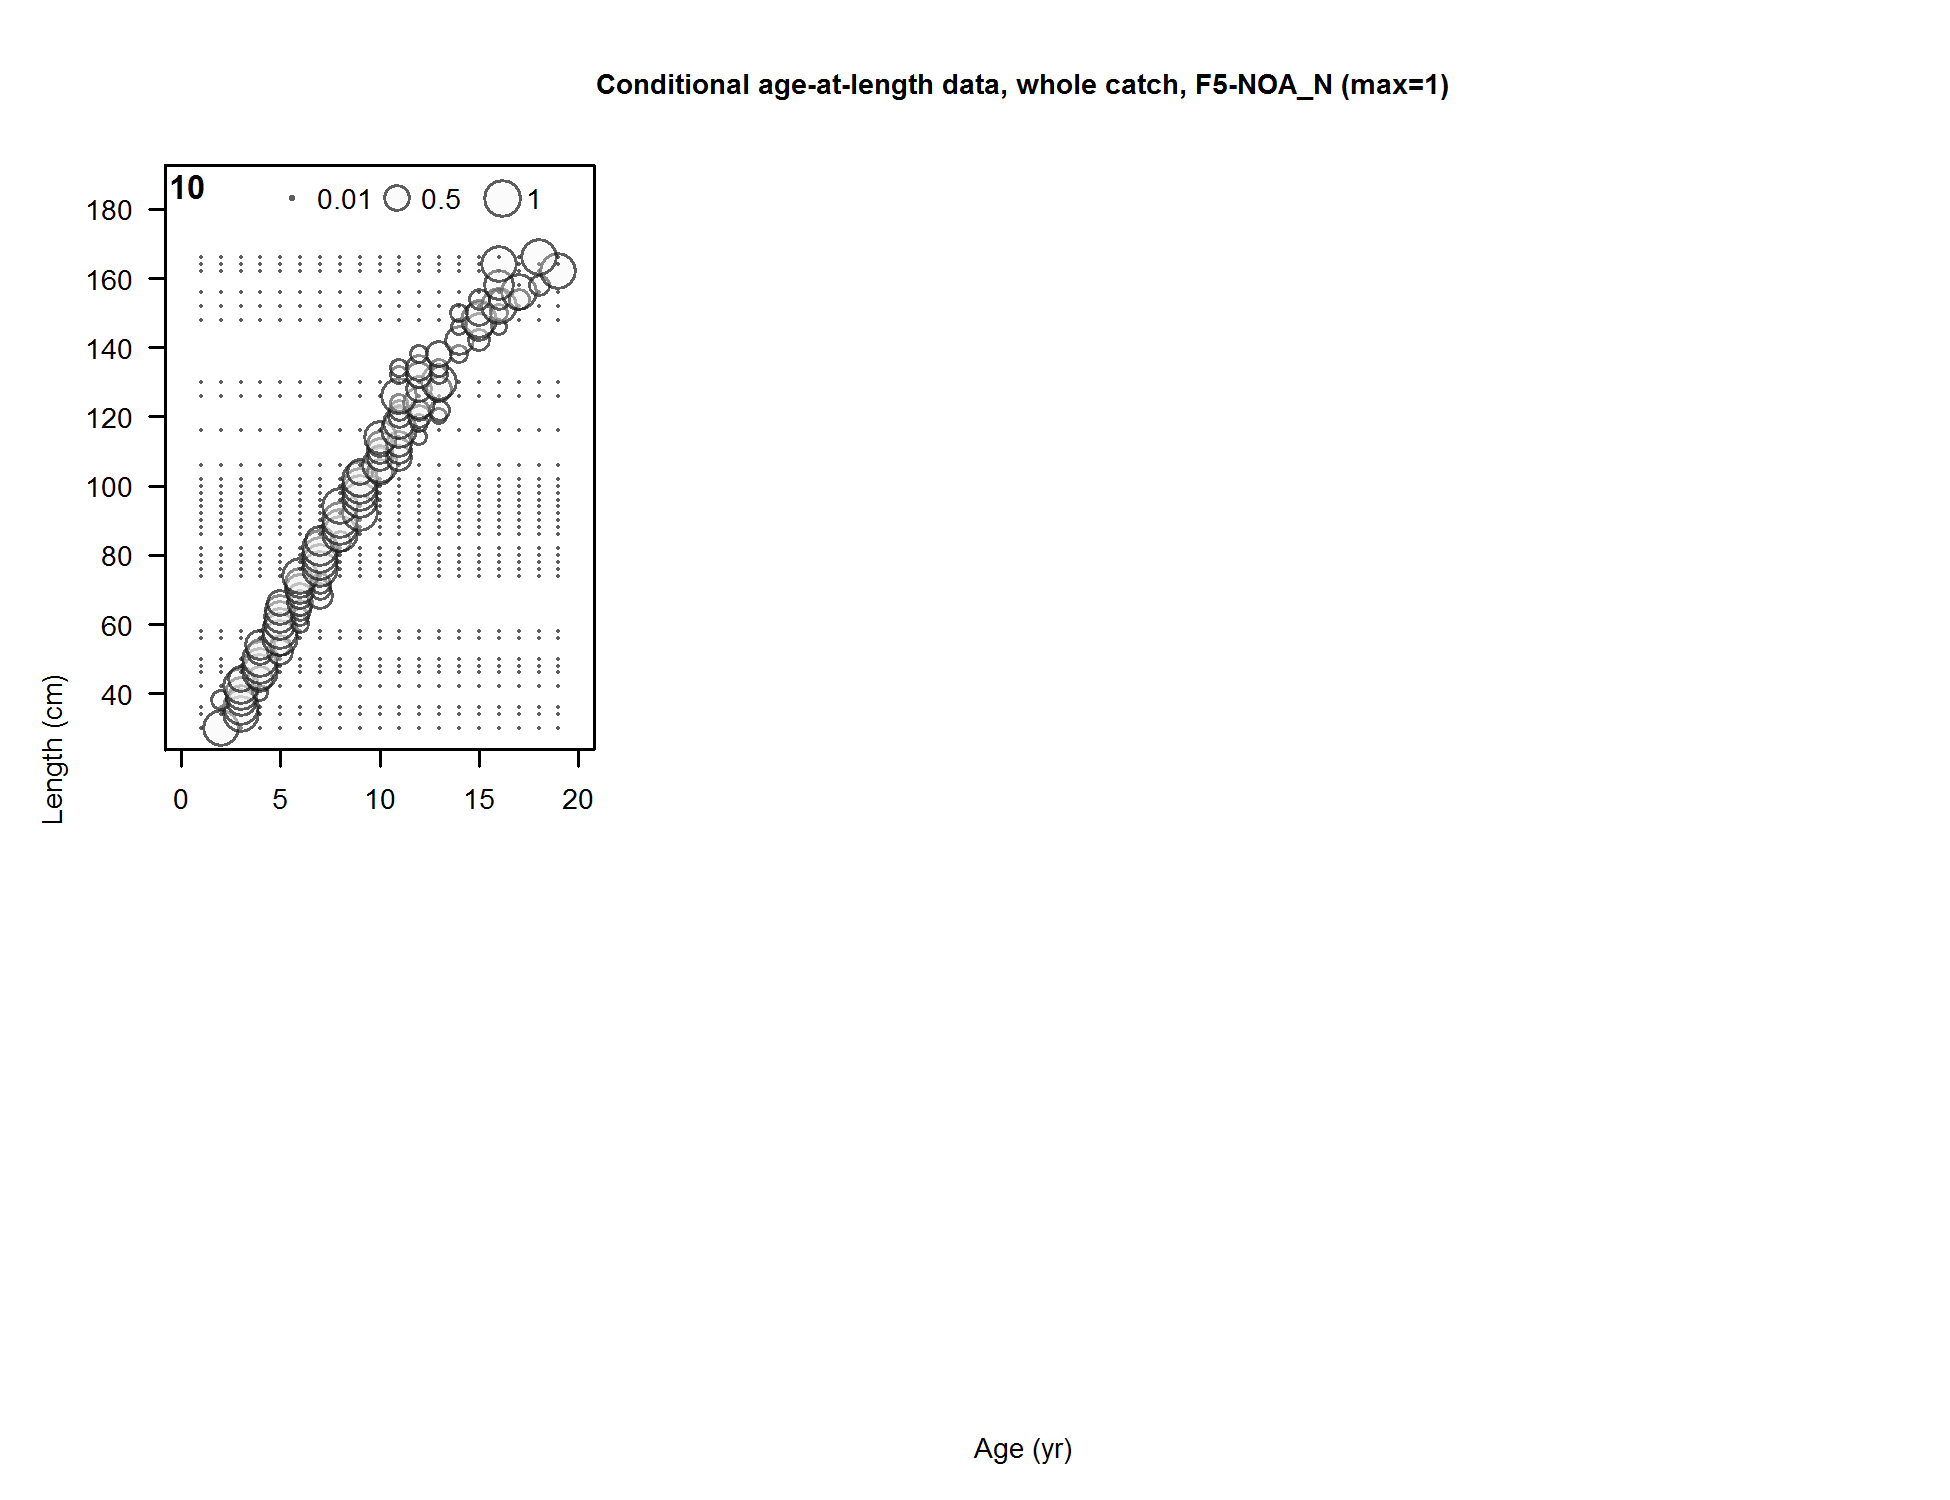
Conditional age-at-length data, whole catch, F5-NOA_N (max=1)
file: comp_condAALdat_bubflt5mkt0.png

Mean age from conditional data (aggregated across length bins) for F5-NOA_N with 95% confidence intervals based on current samples sizes.
file: comp_condAALdat_data_weighting_TA1.8_condAgeF5-NOA_N.png
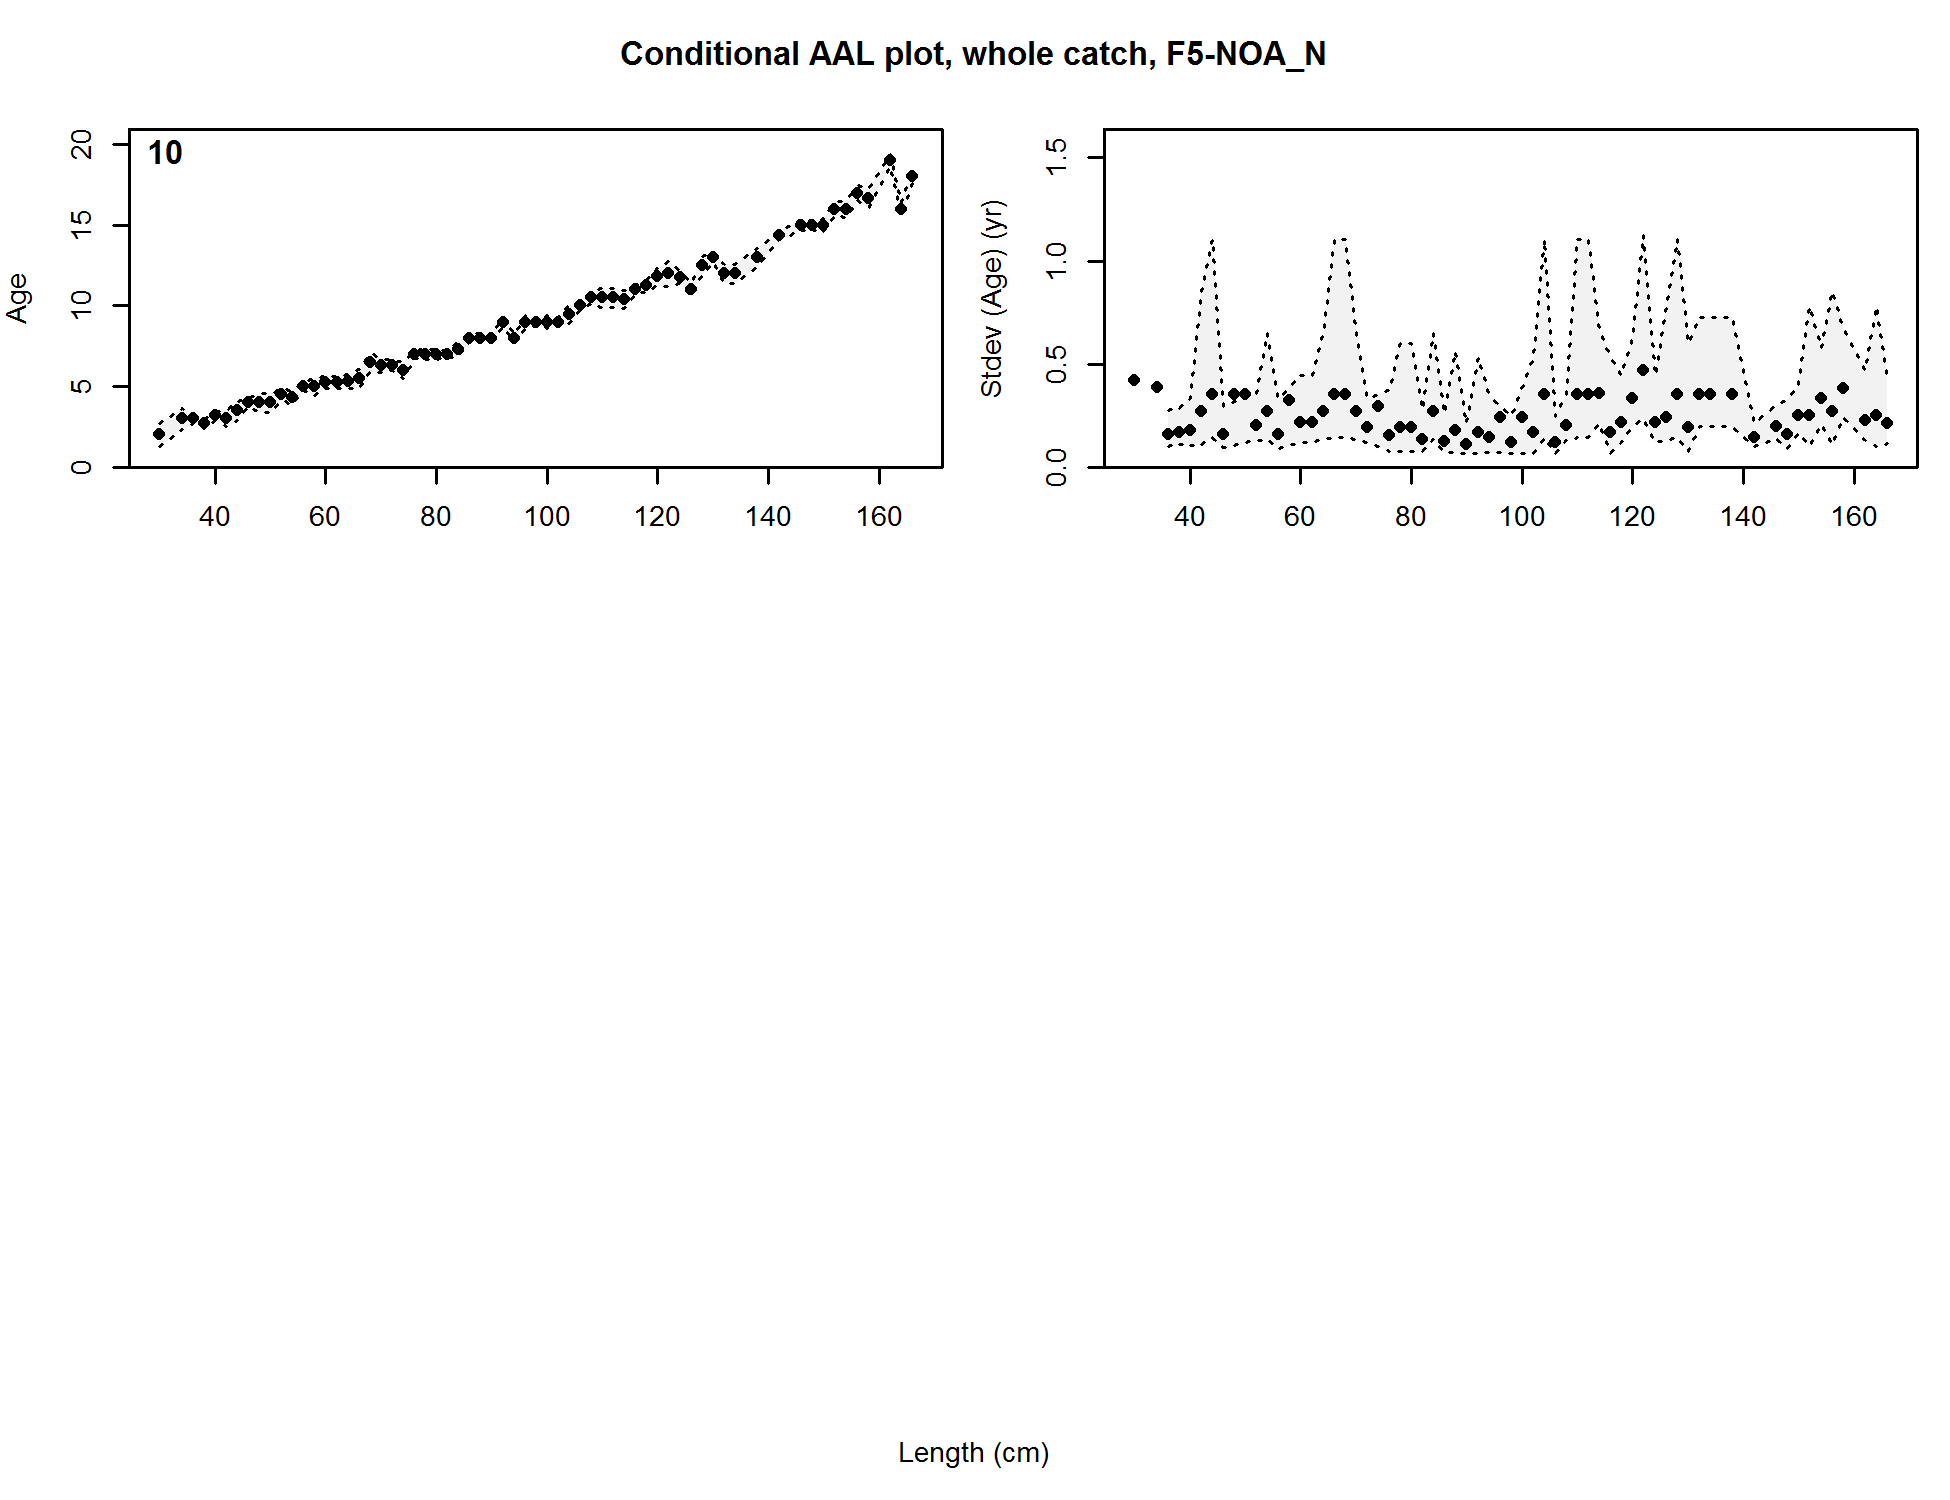
Conditional AAL plot, whole catch, F5-NOA_N
These plots show mean age and std. dev. in conditional A@L.
Left plots are mean A@L by size-class (obs. and pred.) with 90% CIs based on adding 1.64 SE of mean to the data.
Right plots in each pair are SE of mean A@L (obs. and pred.) with 90% CIs based on the chi-square distribution.
file: comp_condAALdat_Andre_plotsflt5mkt0.png