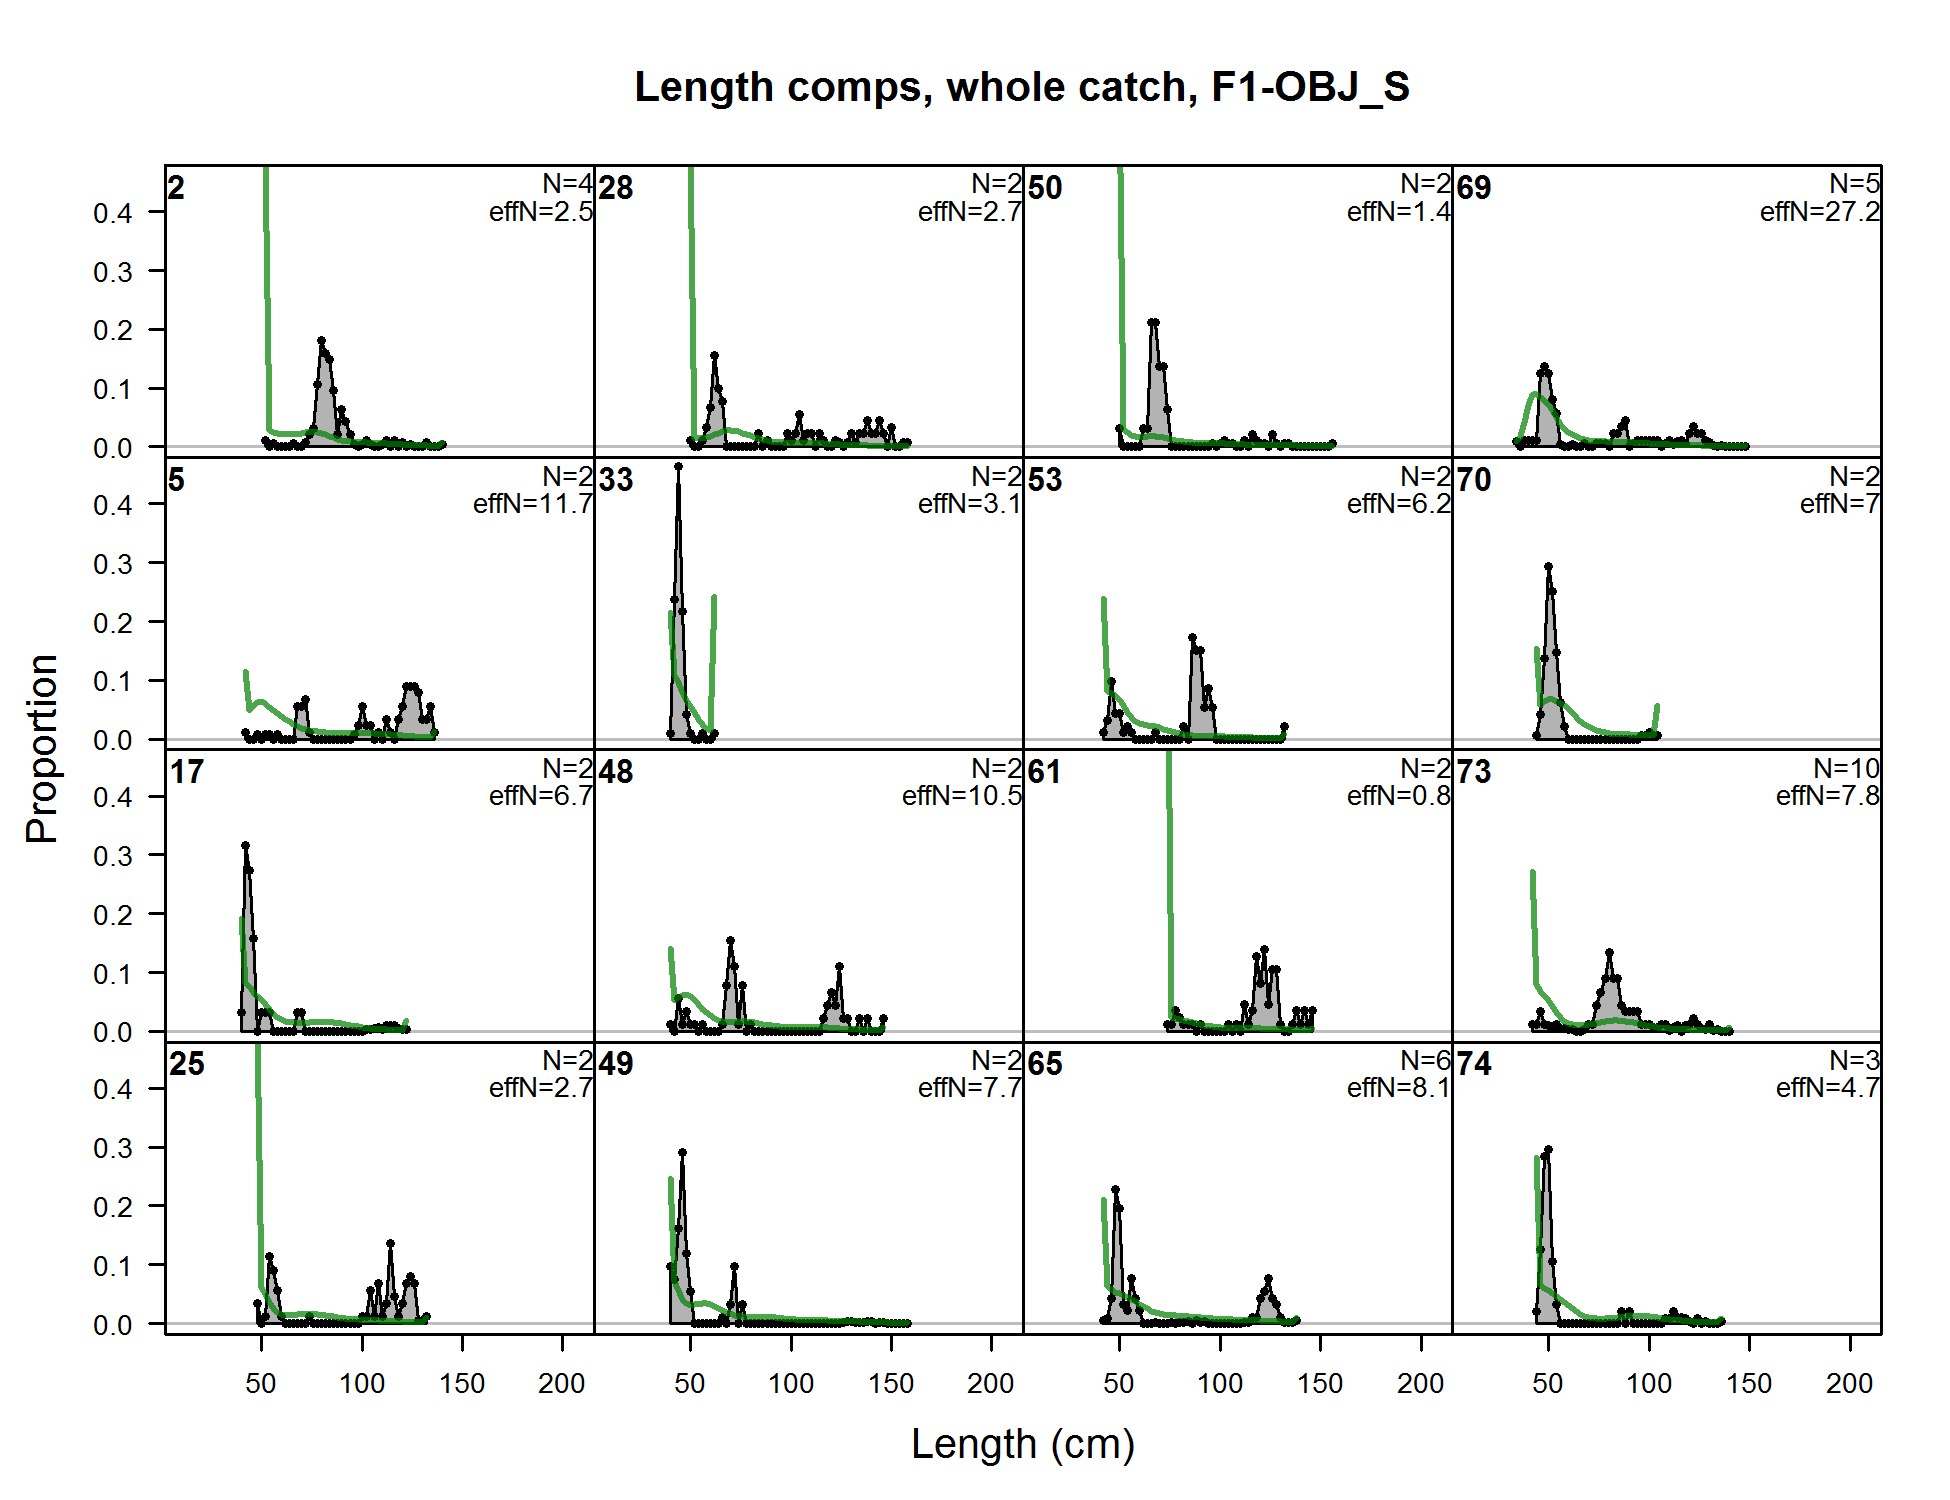
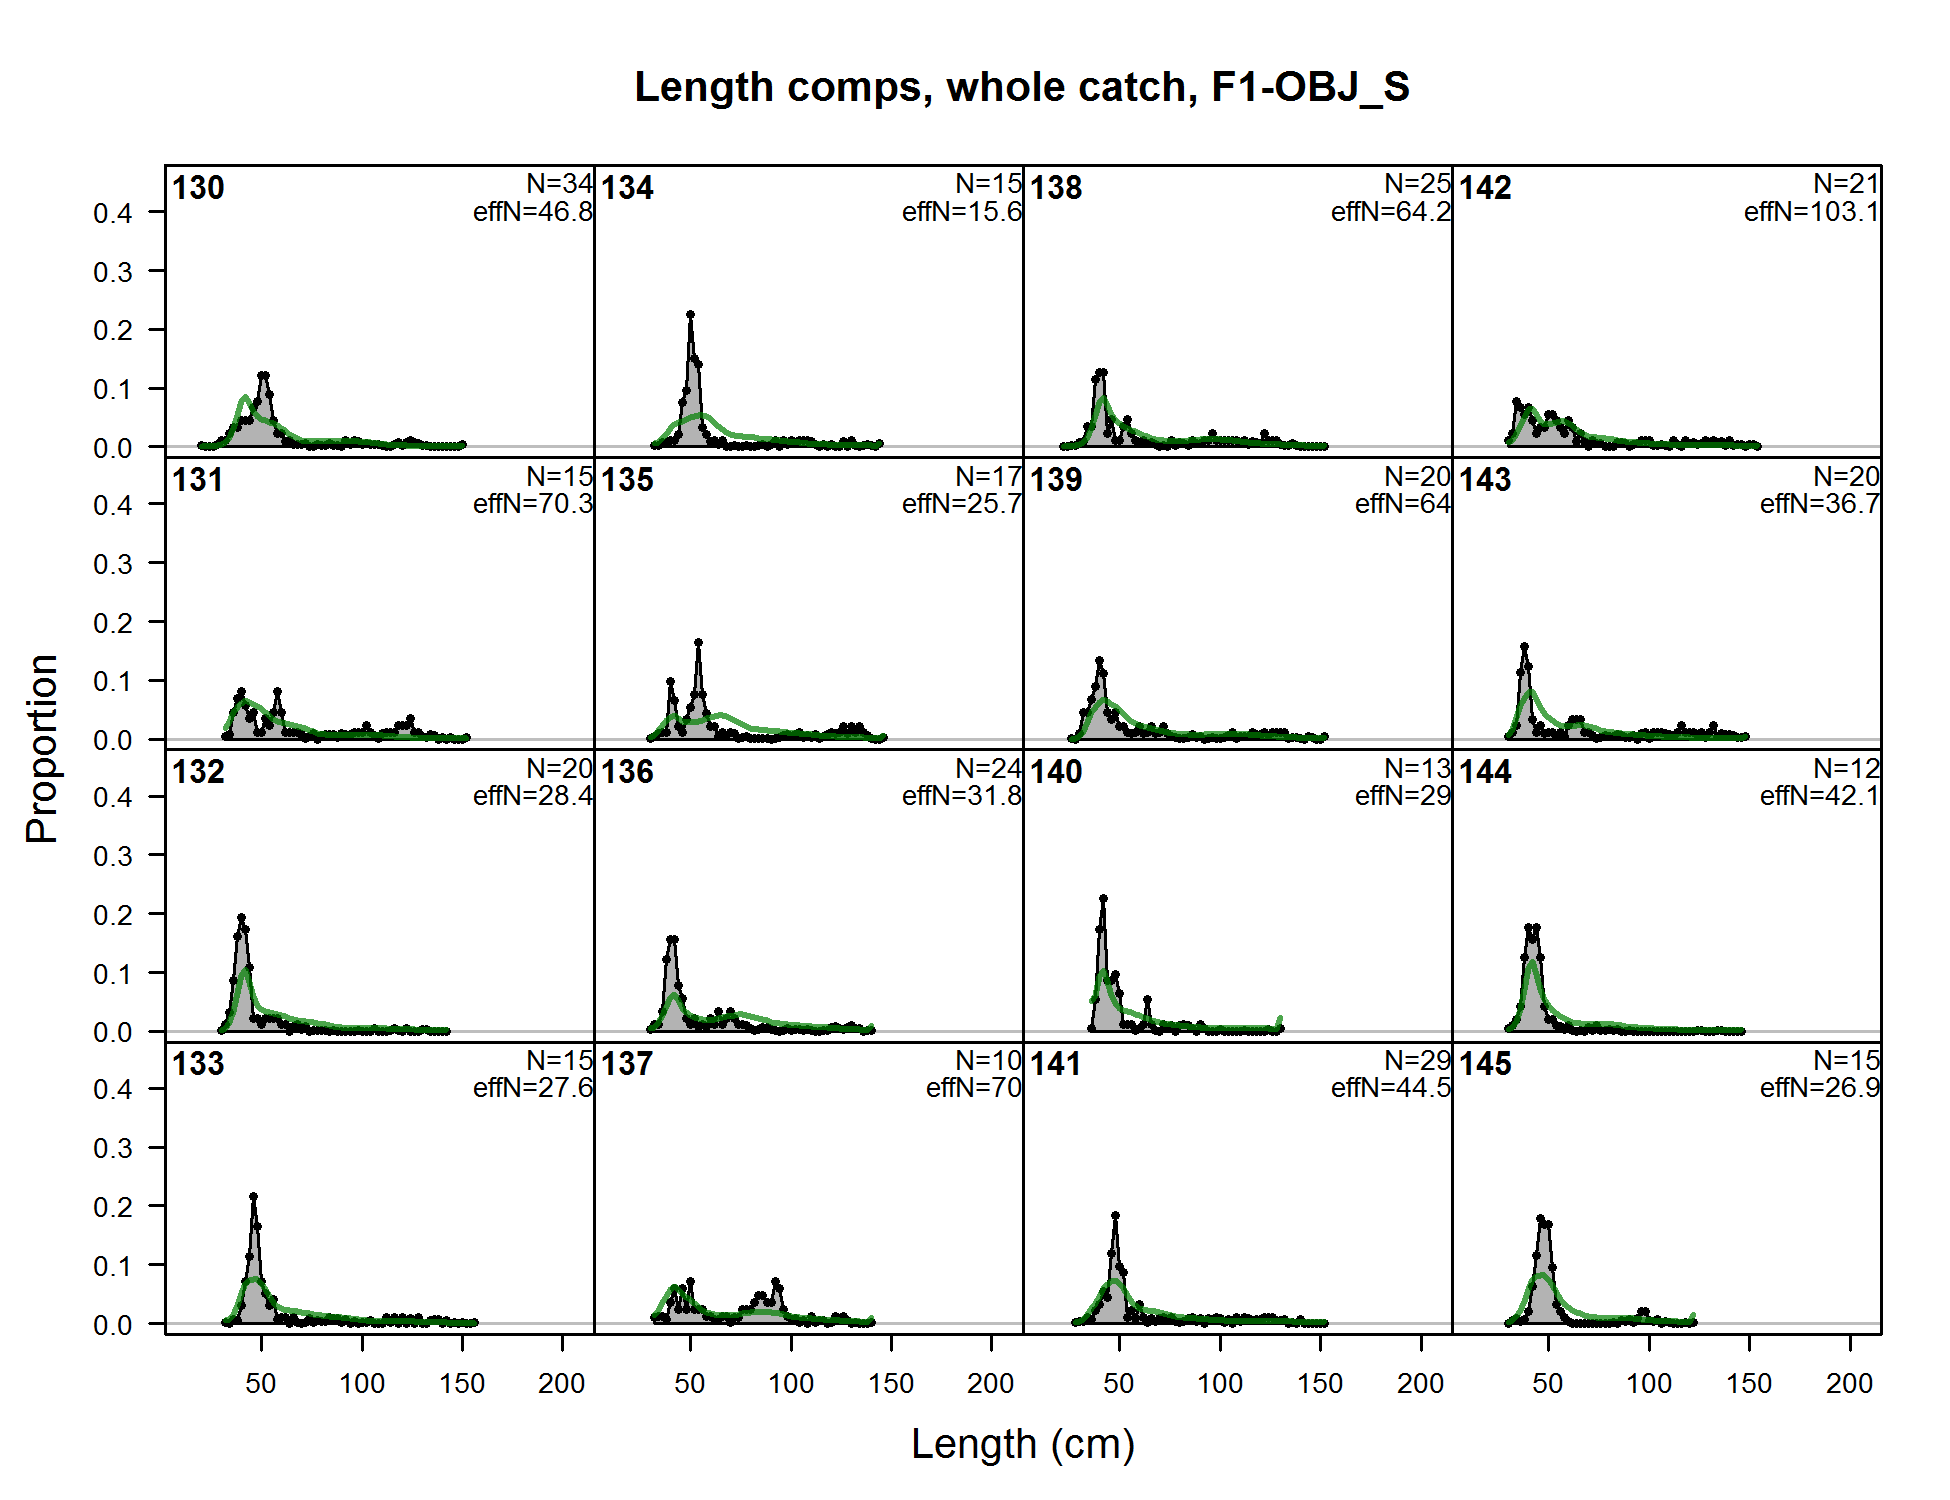
Length comps, whole catch, F1-OBJ_S (plot 1 of 7)
file: comp_lenfit_flt1mkt0_page1.png
Length comps, whole catch, F1-OBJ_S (plot 1 of 7)
file: comp_lenfit_flt1mkt0_page1.png
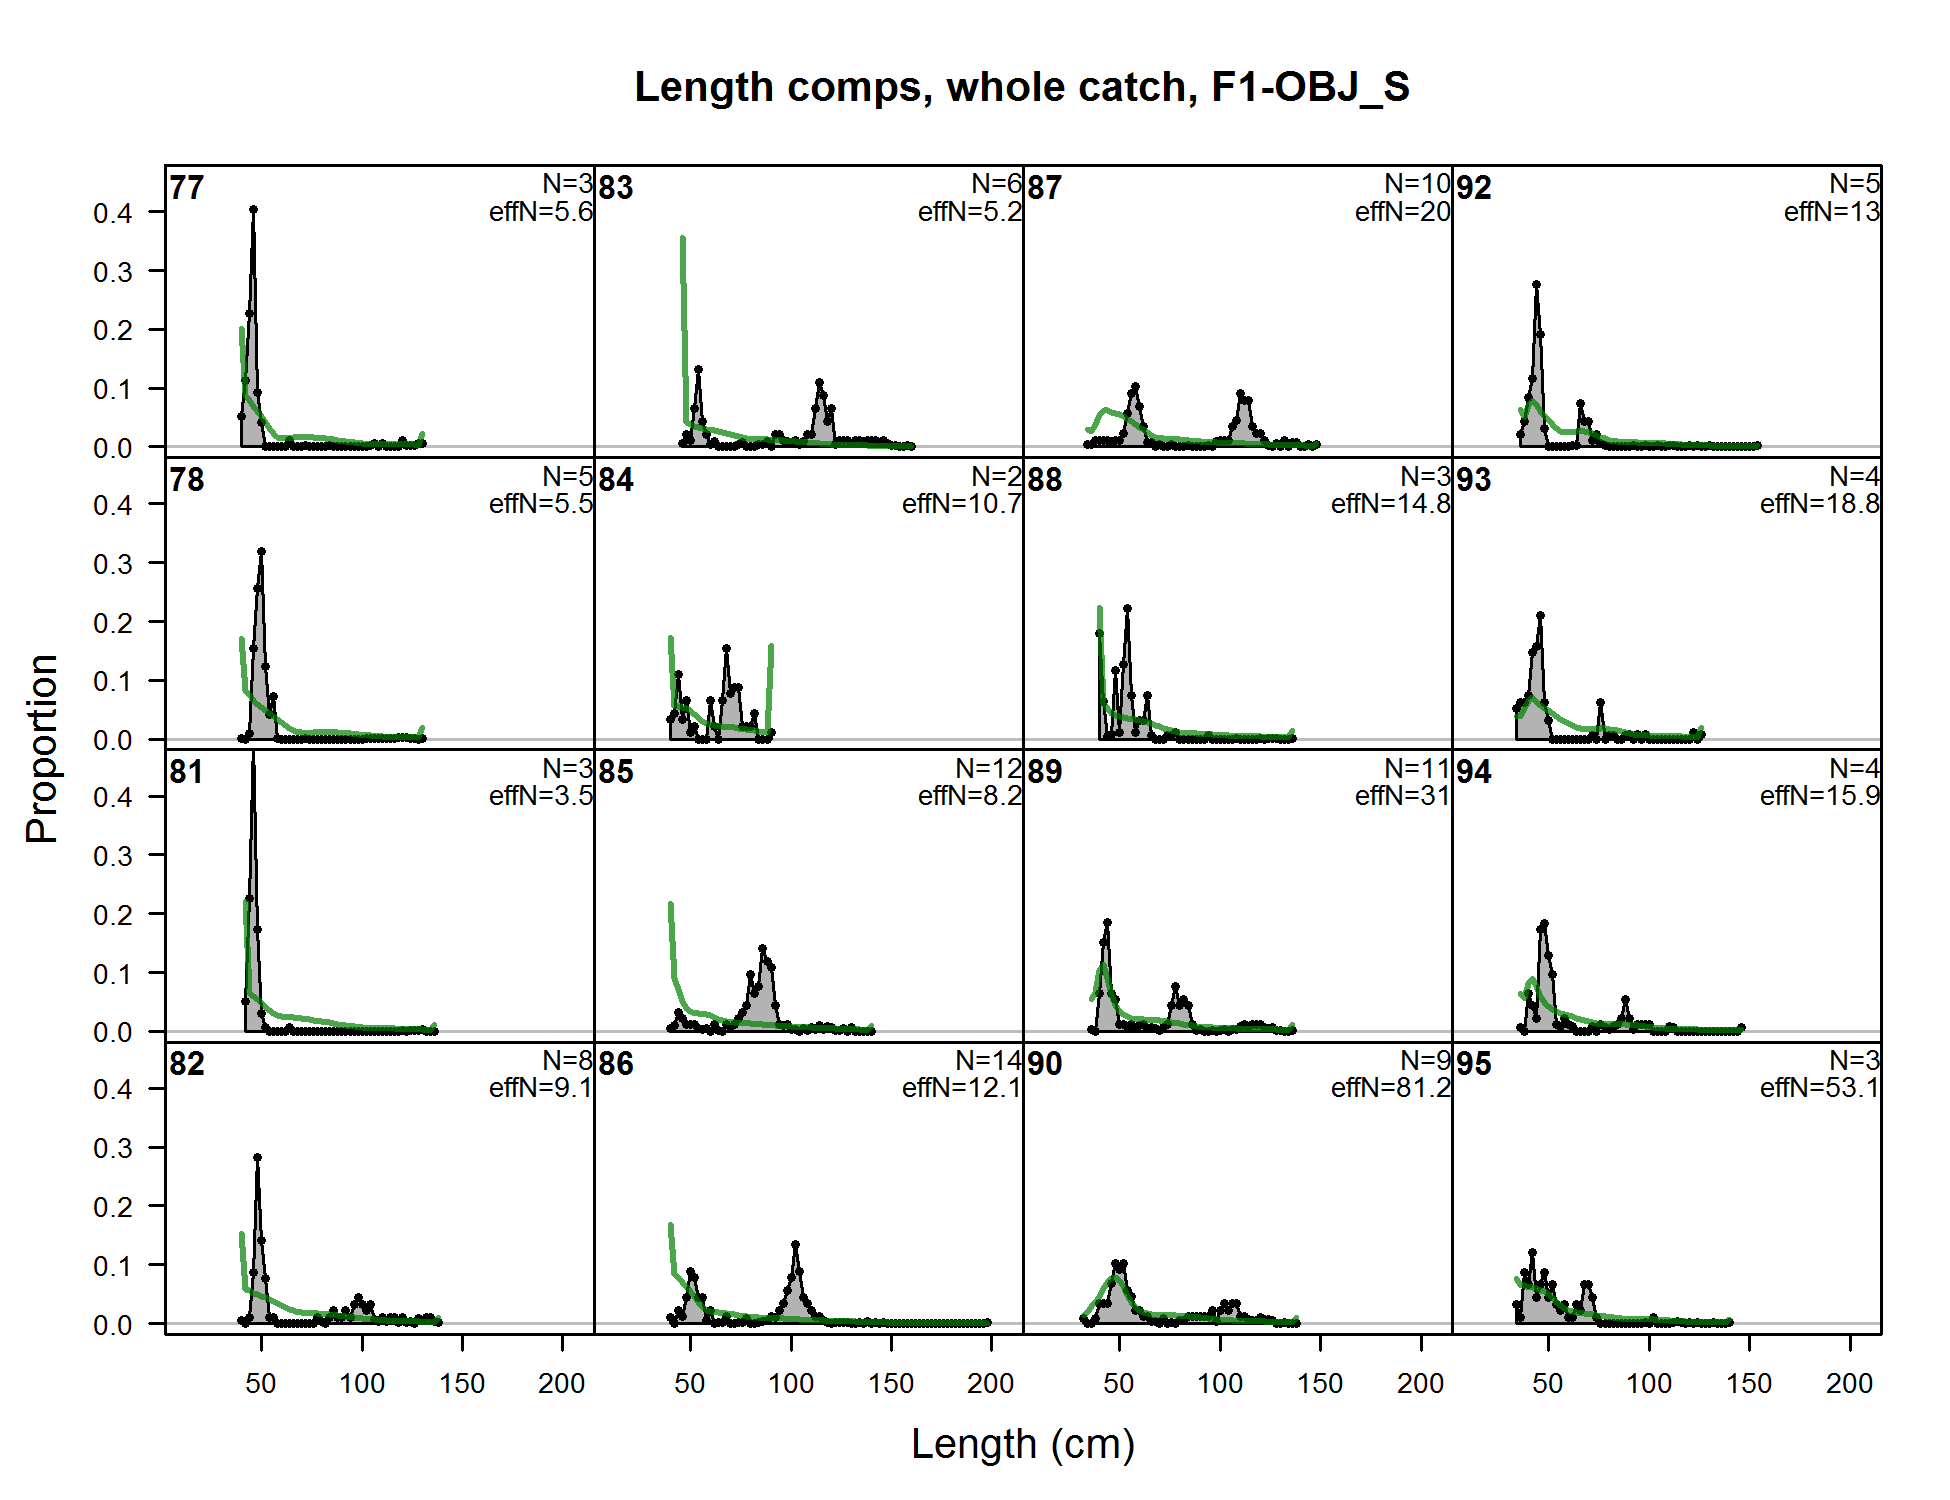
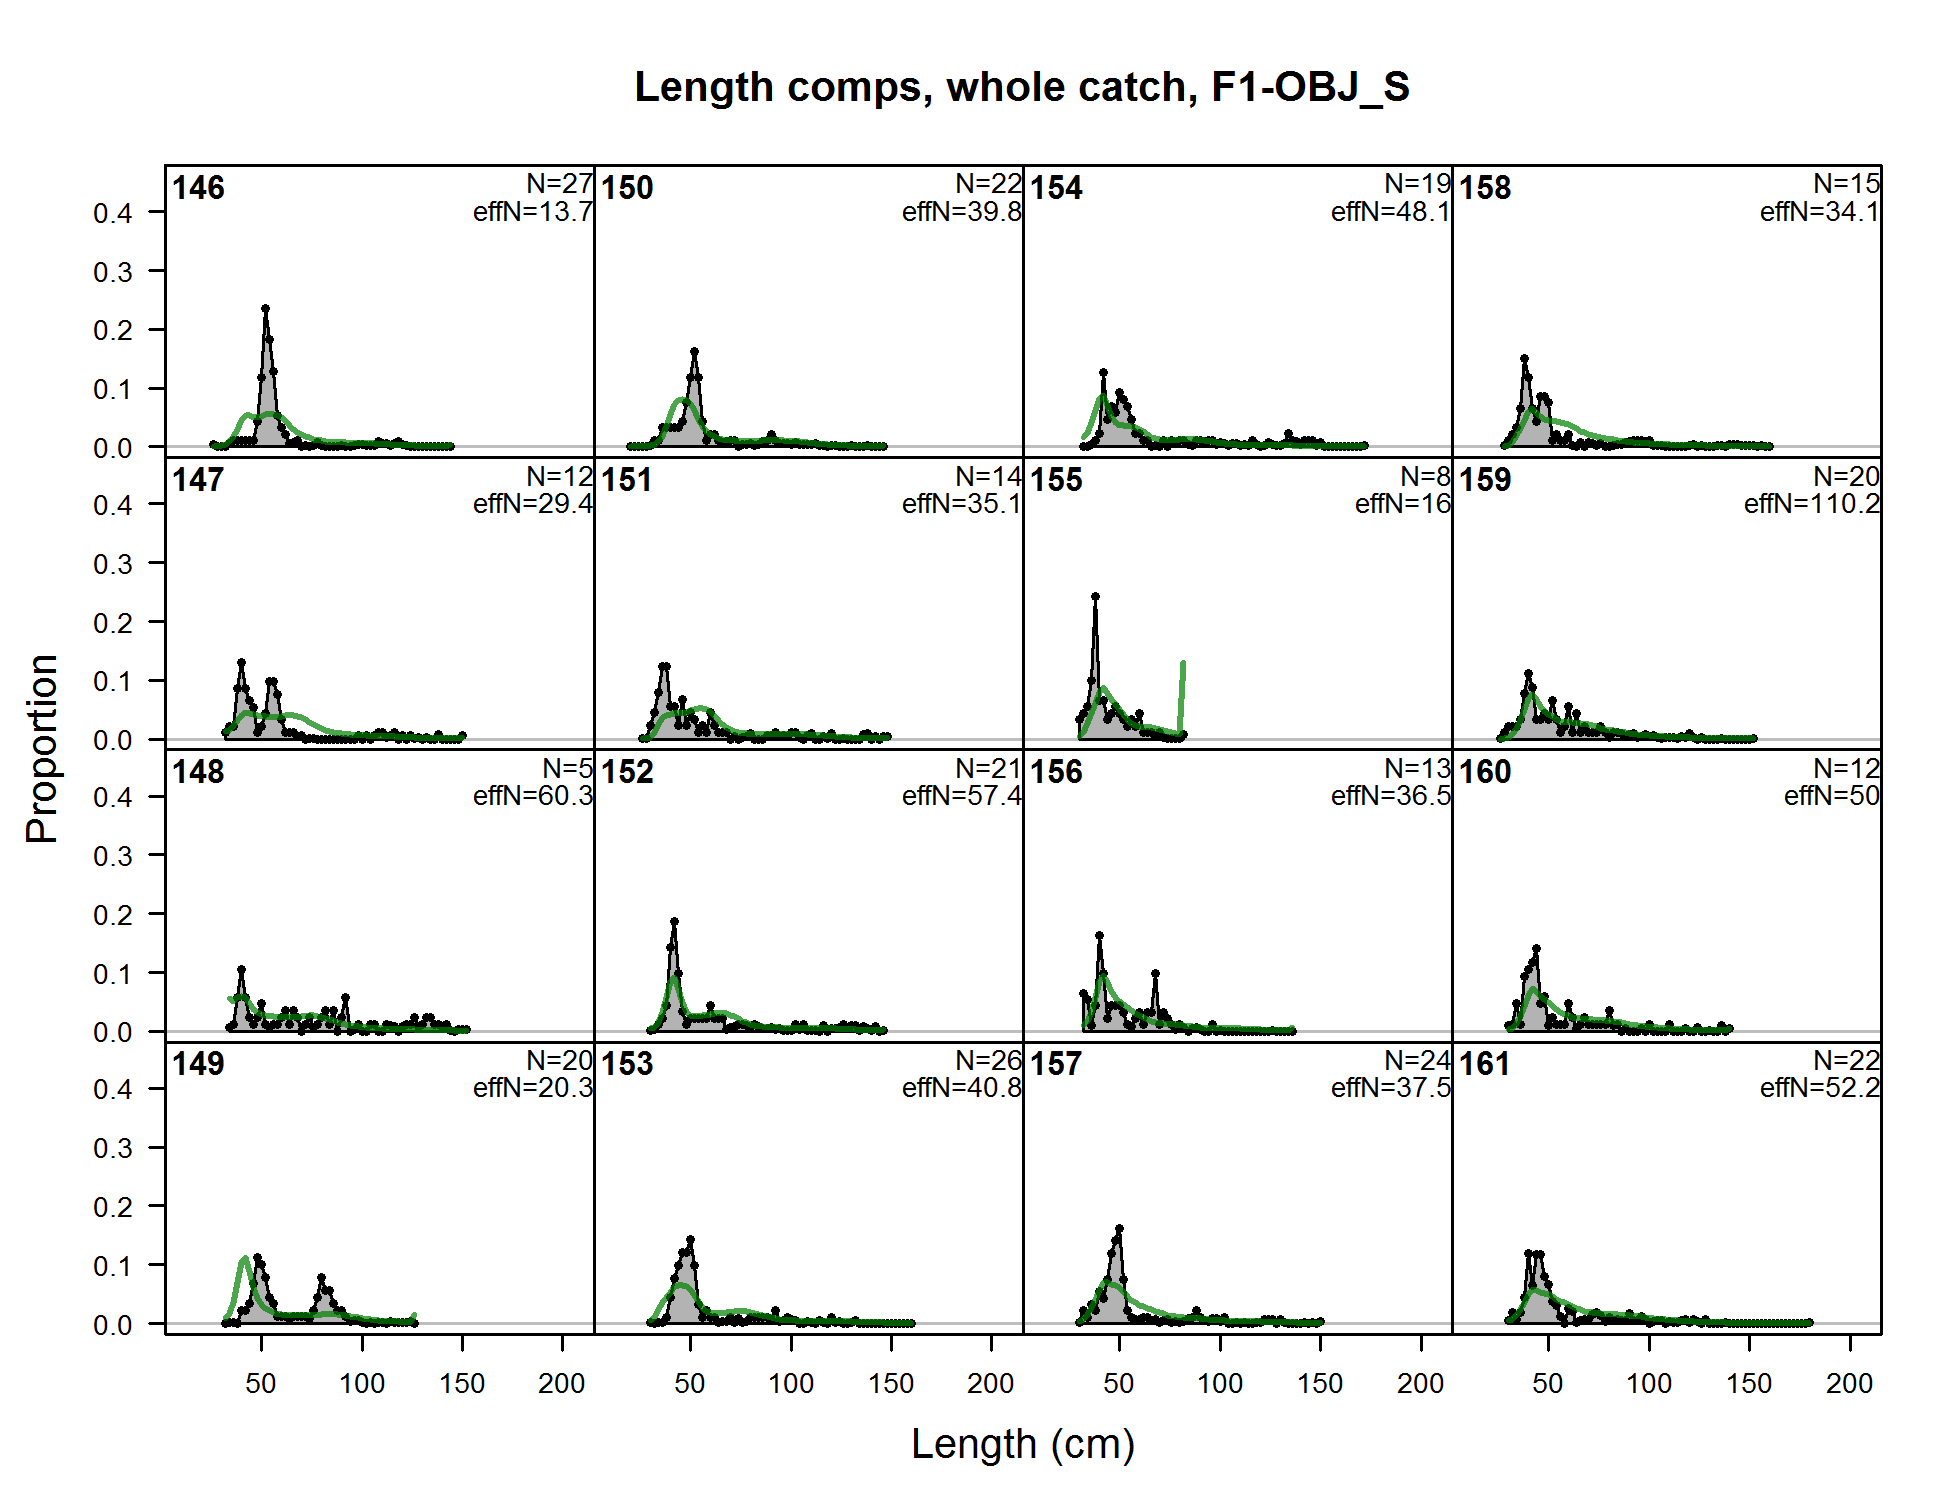
Length comps, whole catch, F1-OBJ_S (plot 1 of 7) (plot 2 of 7)
file: comp_lenfit_flt1mkt0_page2.png
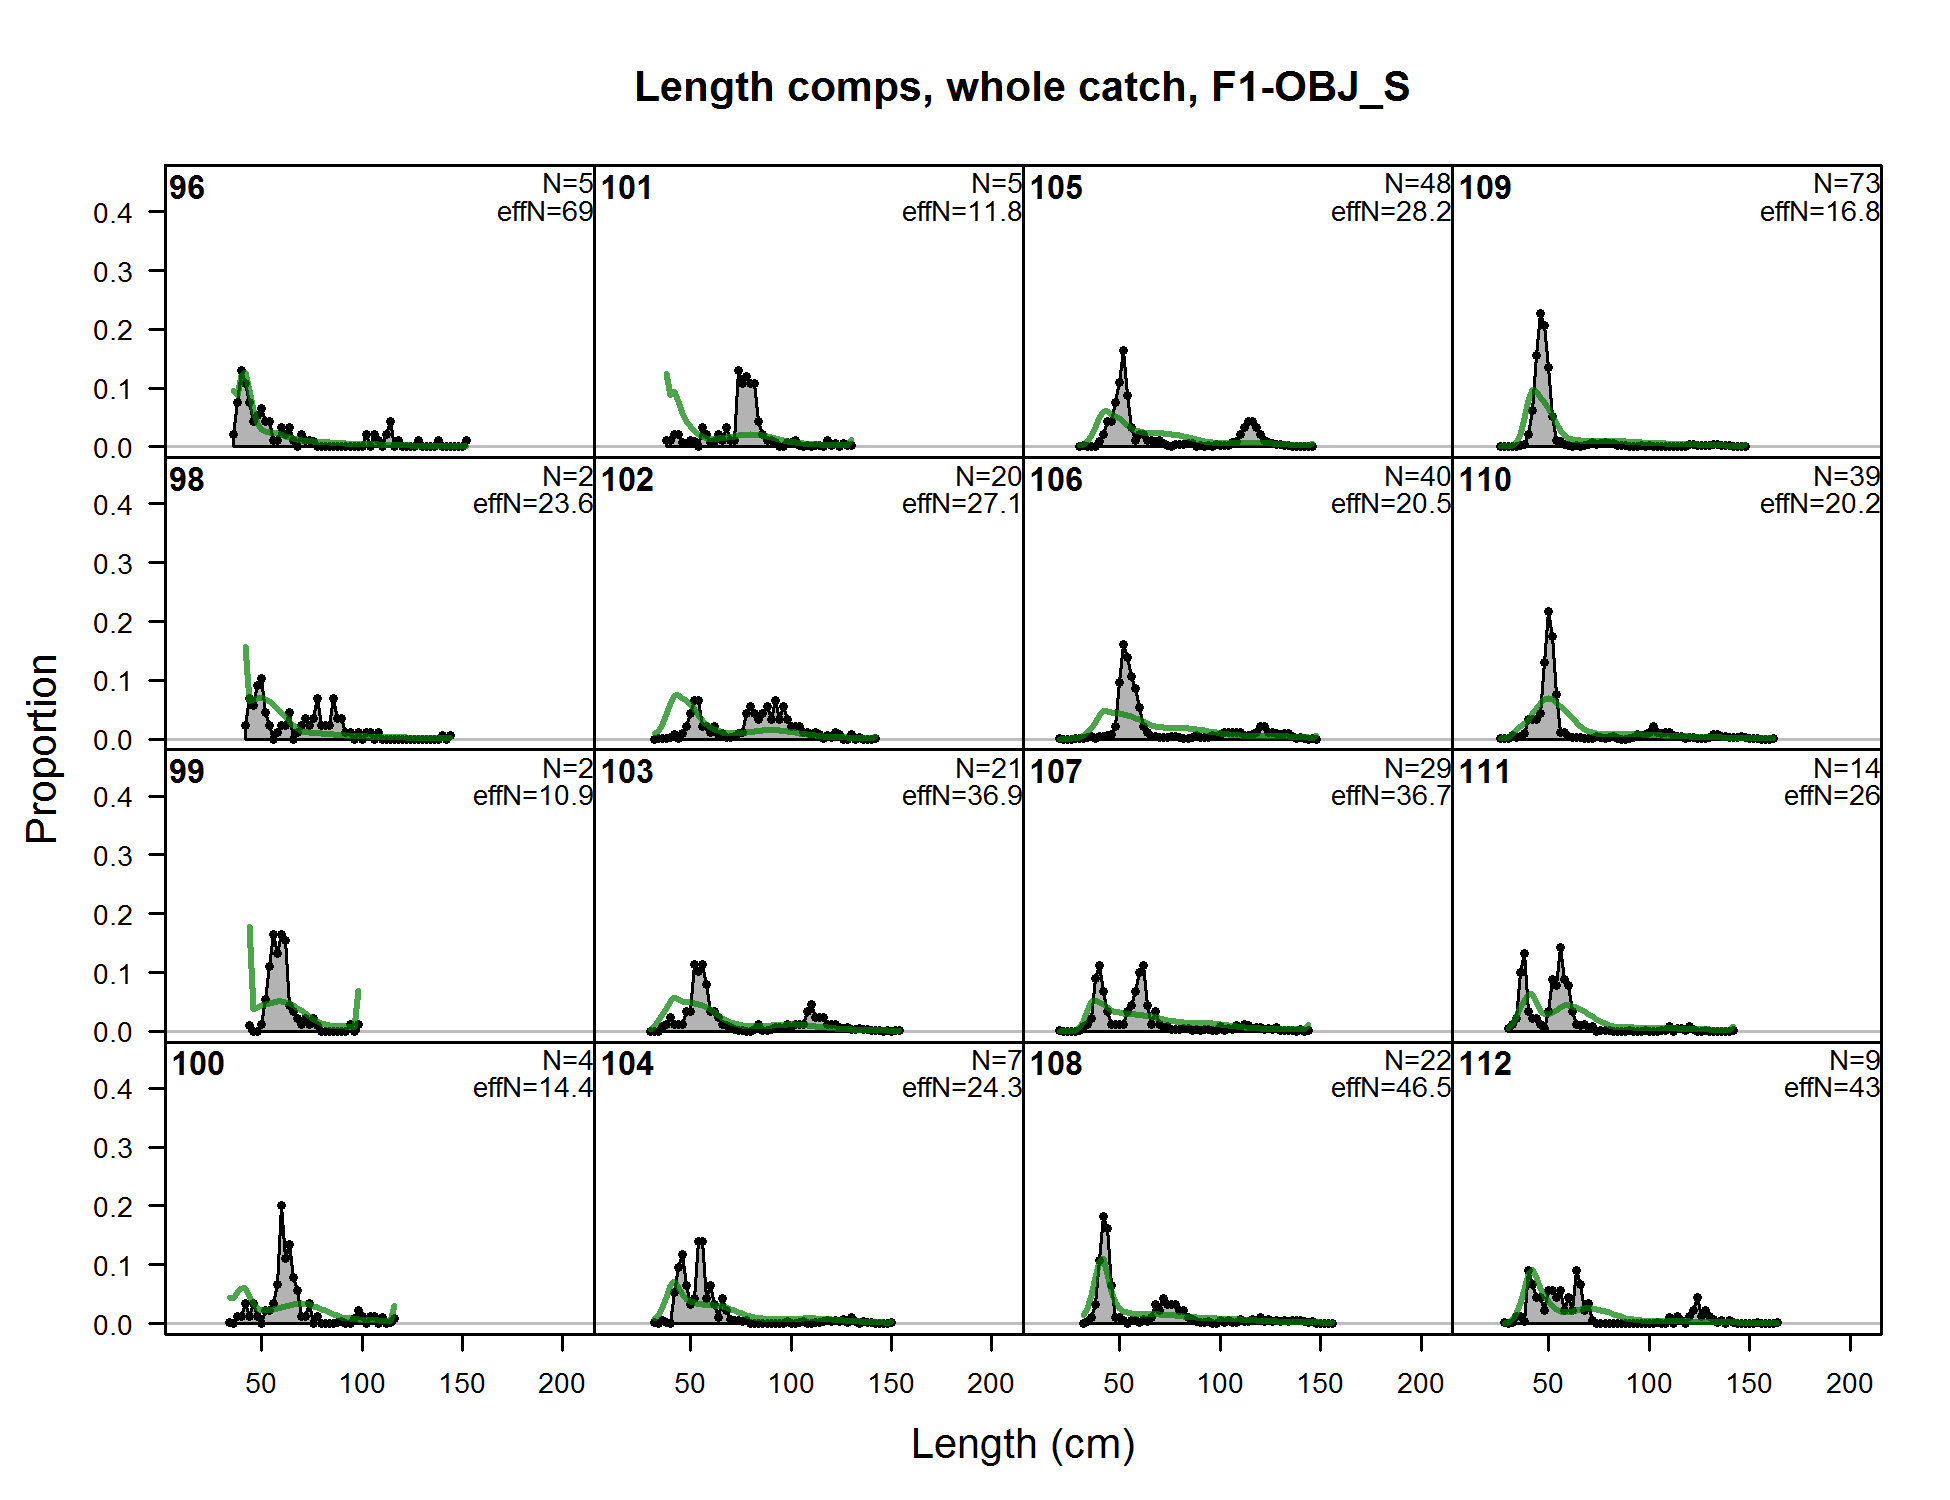
Length comps, whole catch, F1-OBJ_S (plot 1 of 7) (plot 2 of 7) (plot 3 of 7)
file: comp_lenfit_flt1mkt0_page3.png
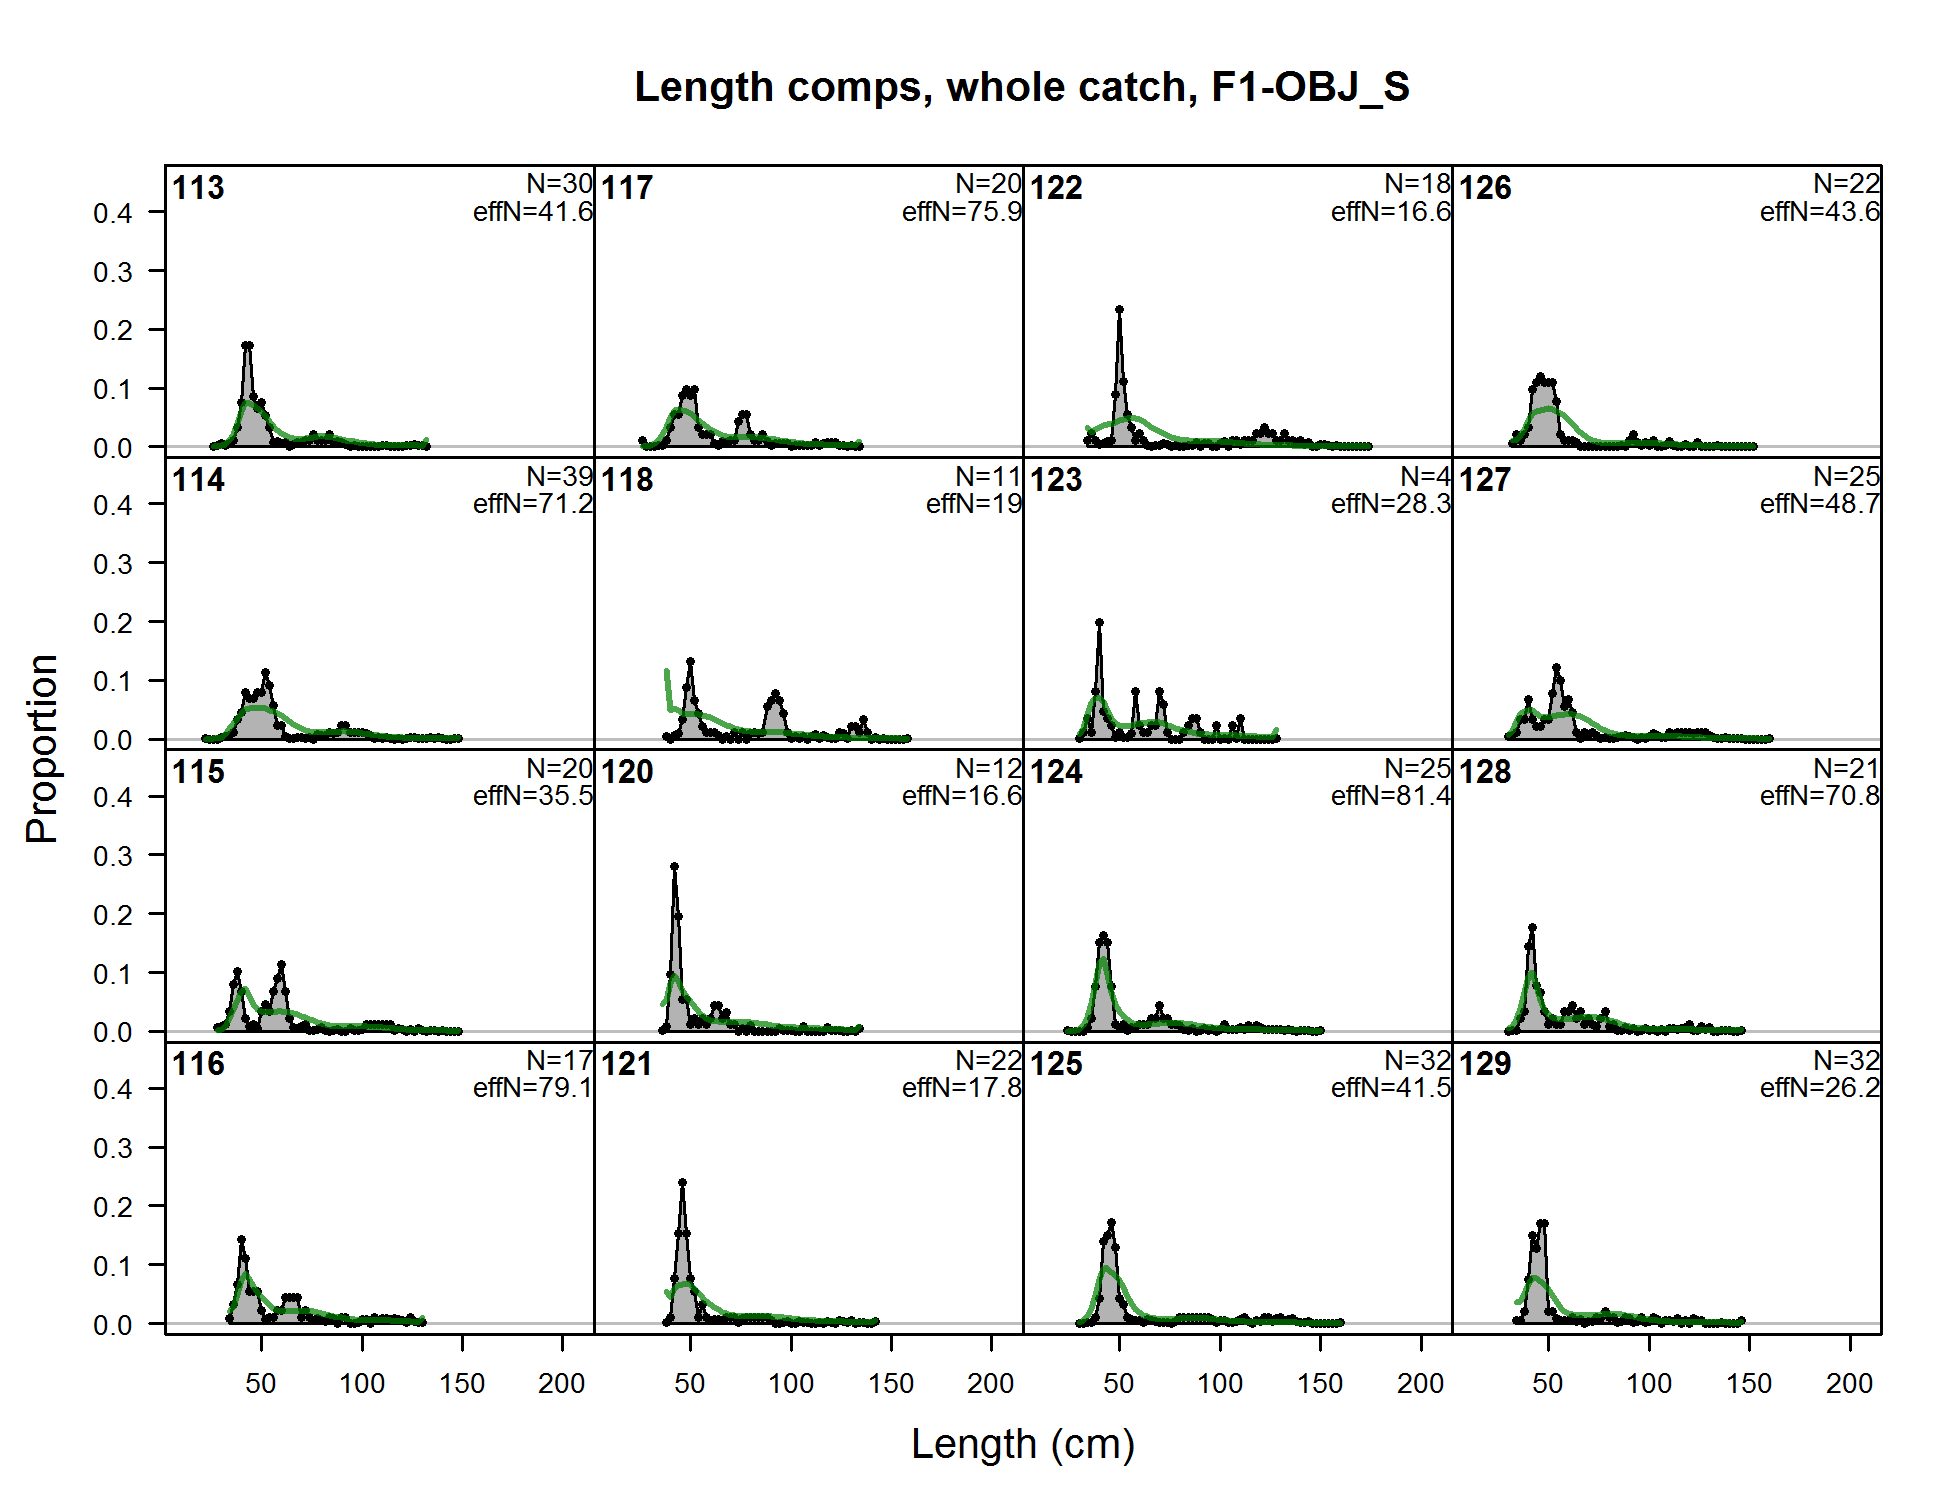
Length comps, whole catch, F1-OBJ_S (plot 1 of 7) (plot 2 of 7) (plot 3 of 7) (plot 4 of 7)
file: comp_lenfit_flt1mkt0_page4.png
Length comps, whole catch, F1-OBJ_S (plot 1 of 7) (plot 2 of 7) (plot 3 of 7) (plot 4 of 7) (plot 5 of 7)
file: comp_lenfit_flt1mkt0_page5.png
Length comps, whole catch, F1-OBJ_S (plot 1 of 7) (plot 2 of 7) (plot 3 of 7) (plot 4 of 7) (plot 5 of 7) (plot 6 of 7)
file: comp_lenfit_flt1mkt0_page6.png
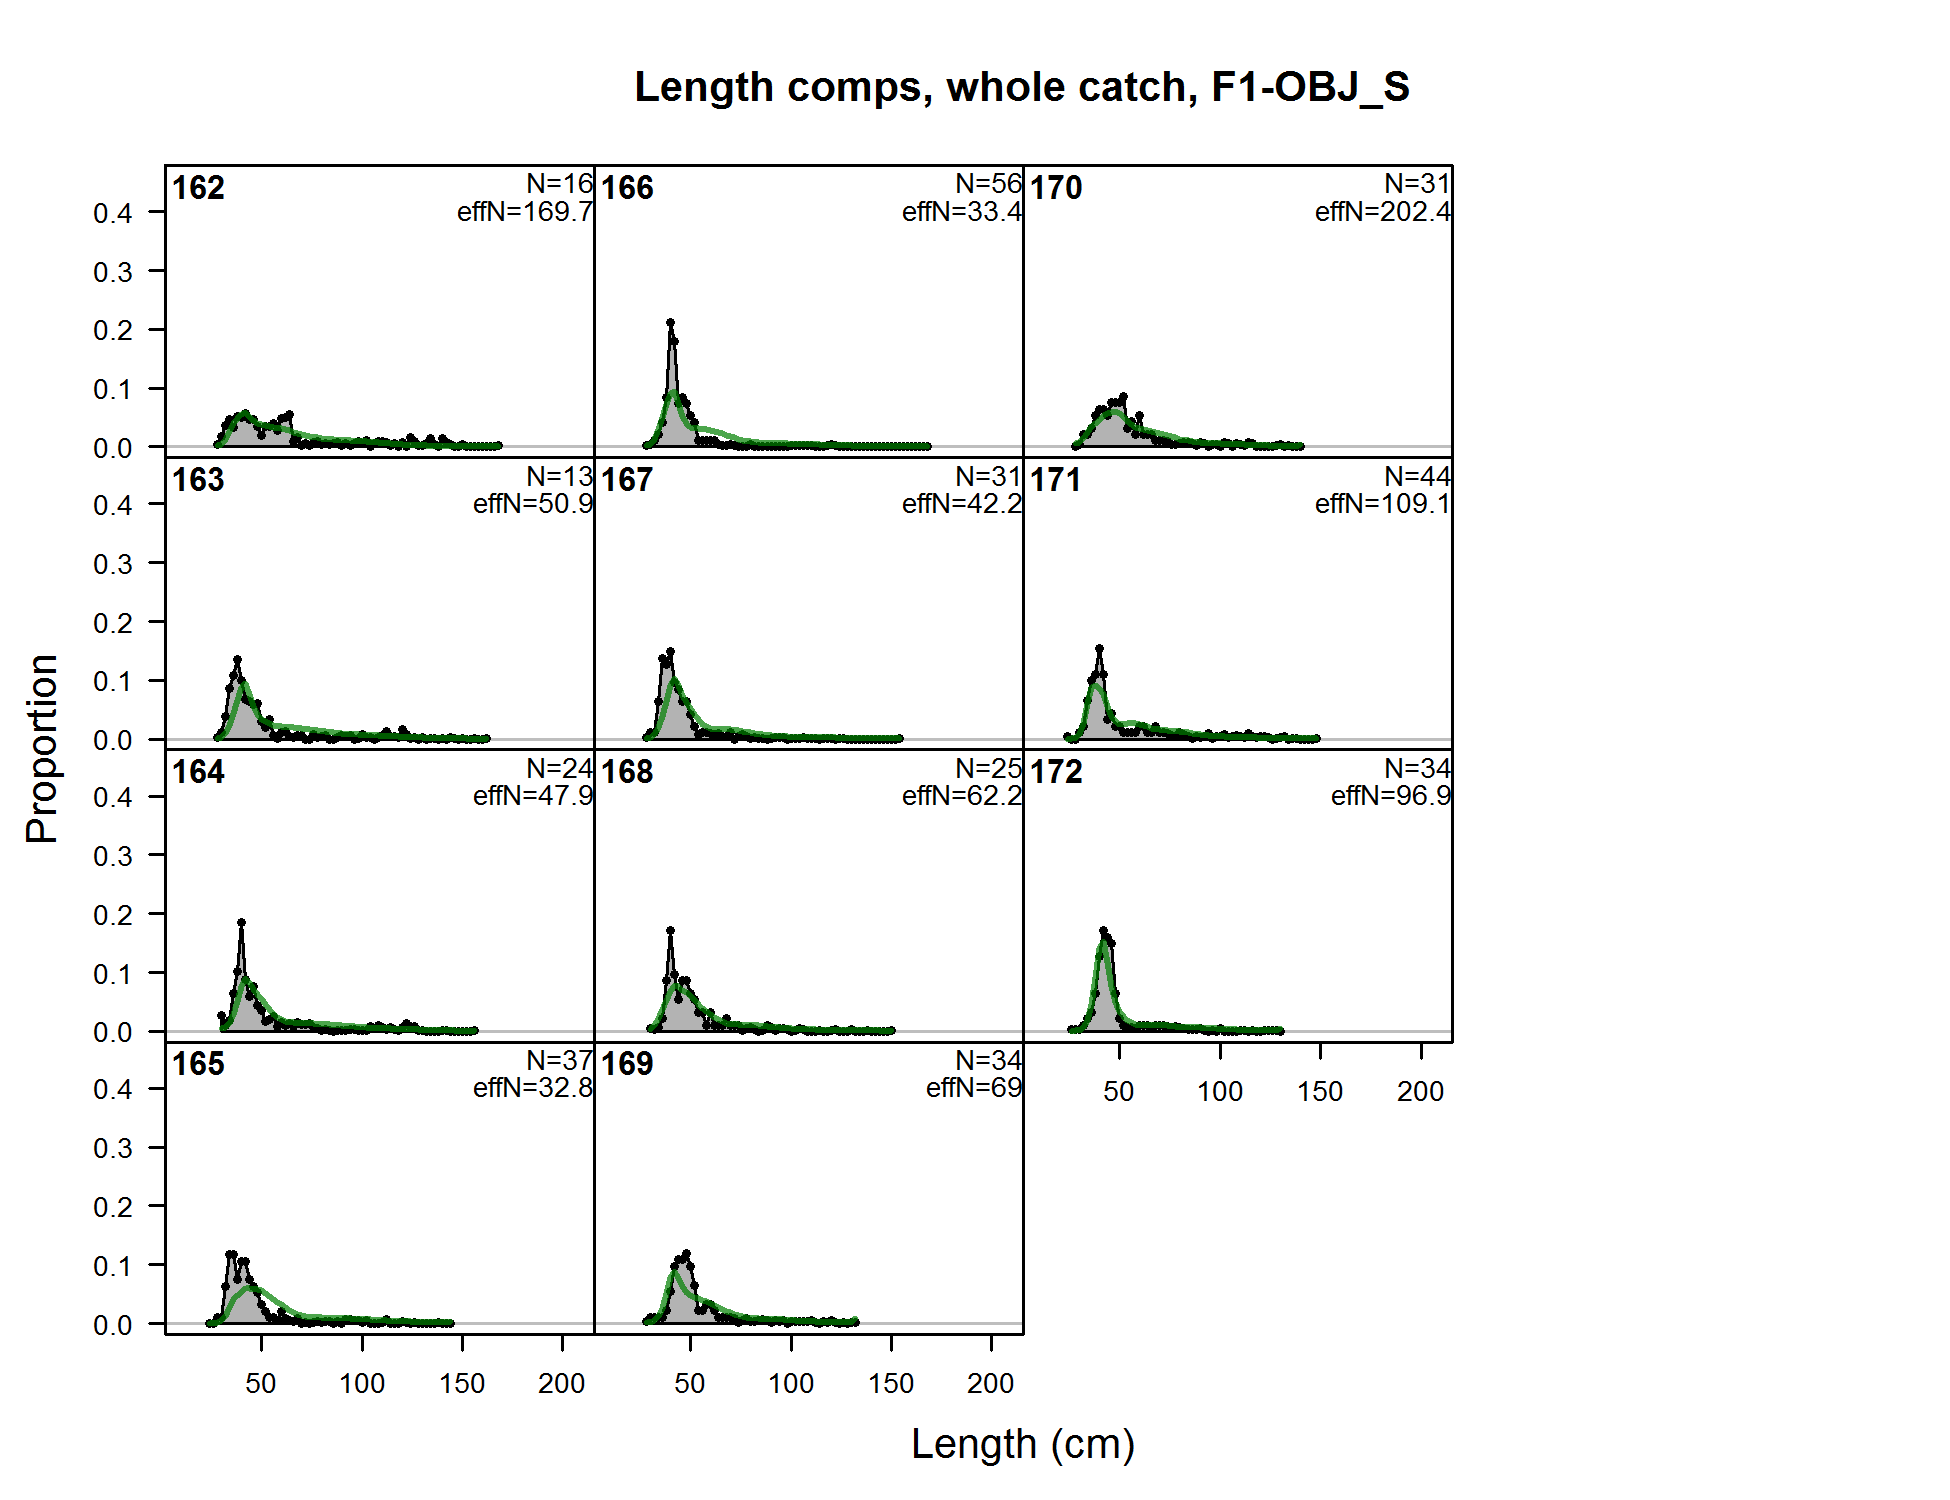
Length comps, whole catch, F1-OBJ_S (plot 1 of 7) (plot 2 of 7) (plot 3 of 7) (plot 4 of 7) (plot 5 of 7) (plot 6 of 7) (plot 7 of 7)
file: comp_lenfit_flt1mkt0_page7.png
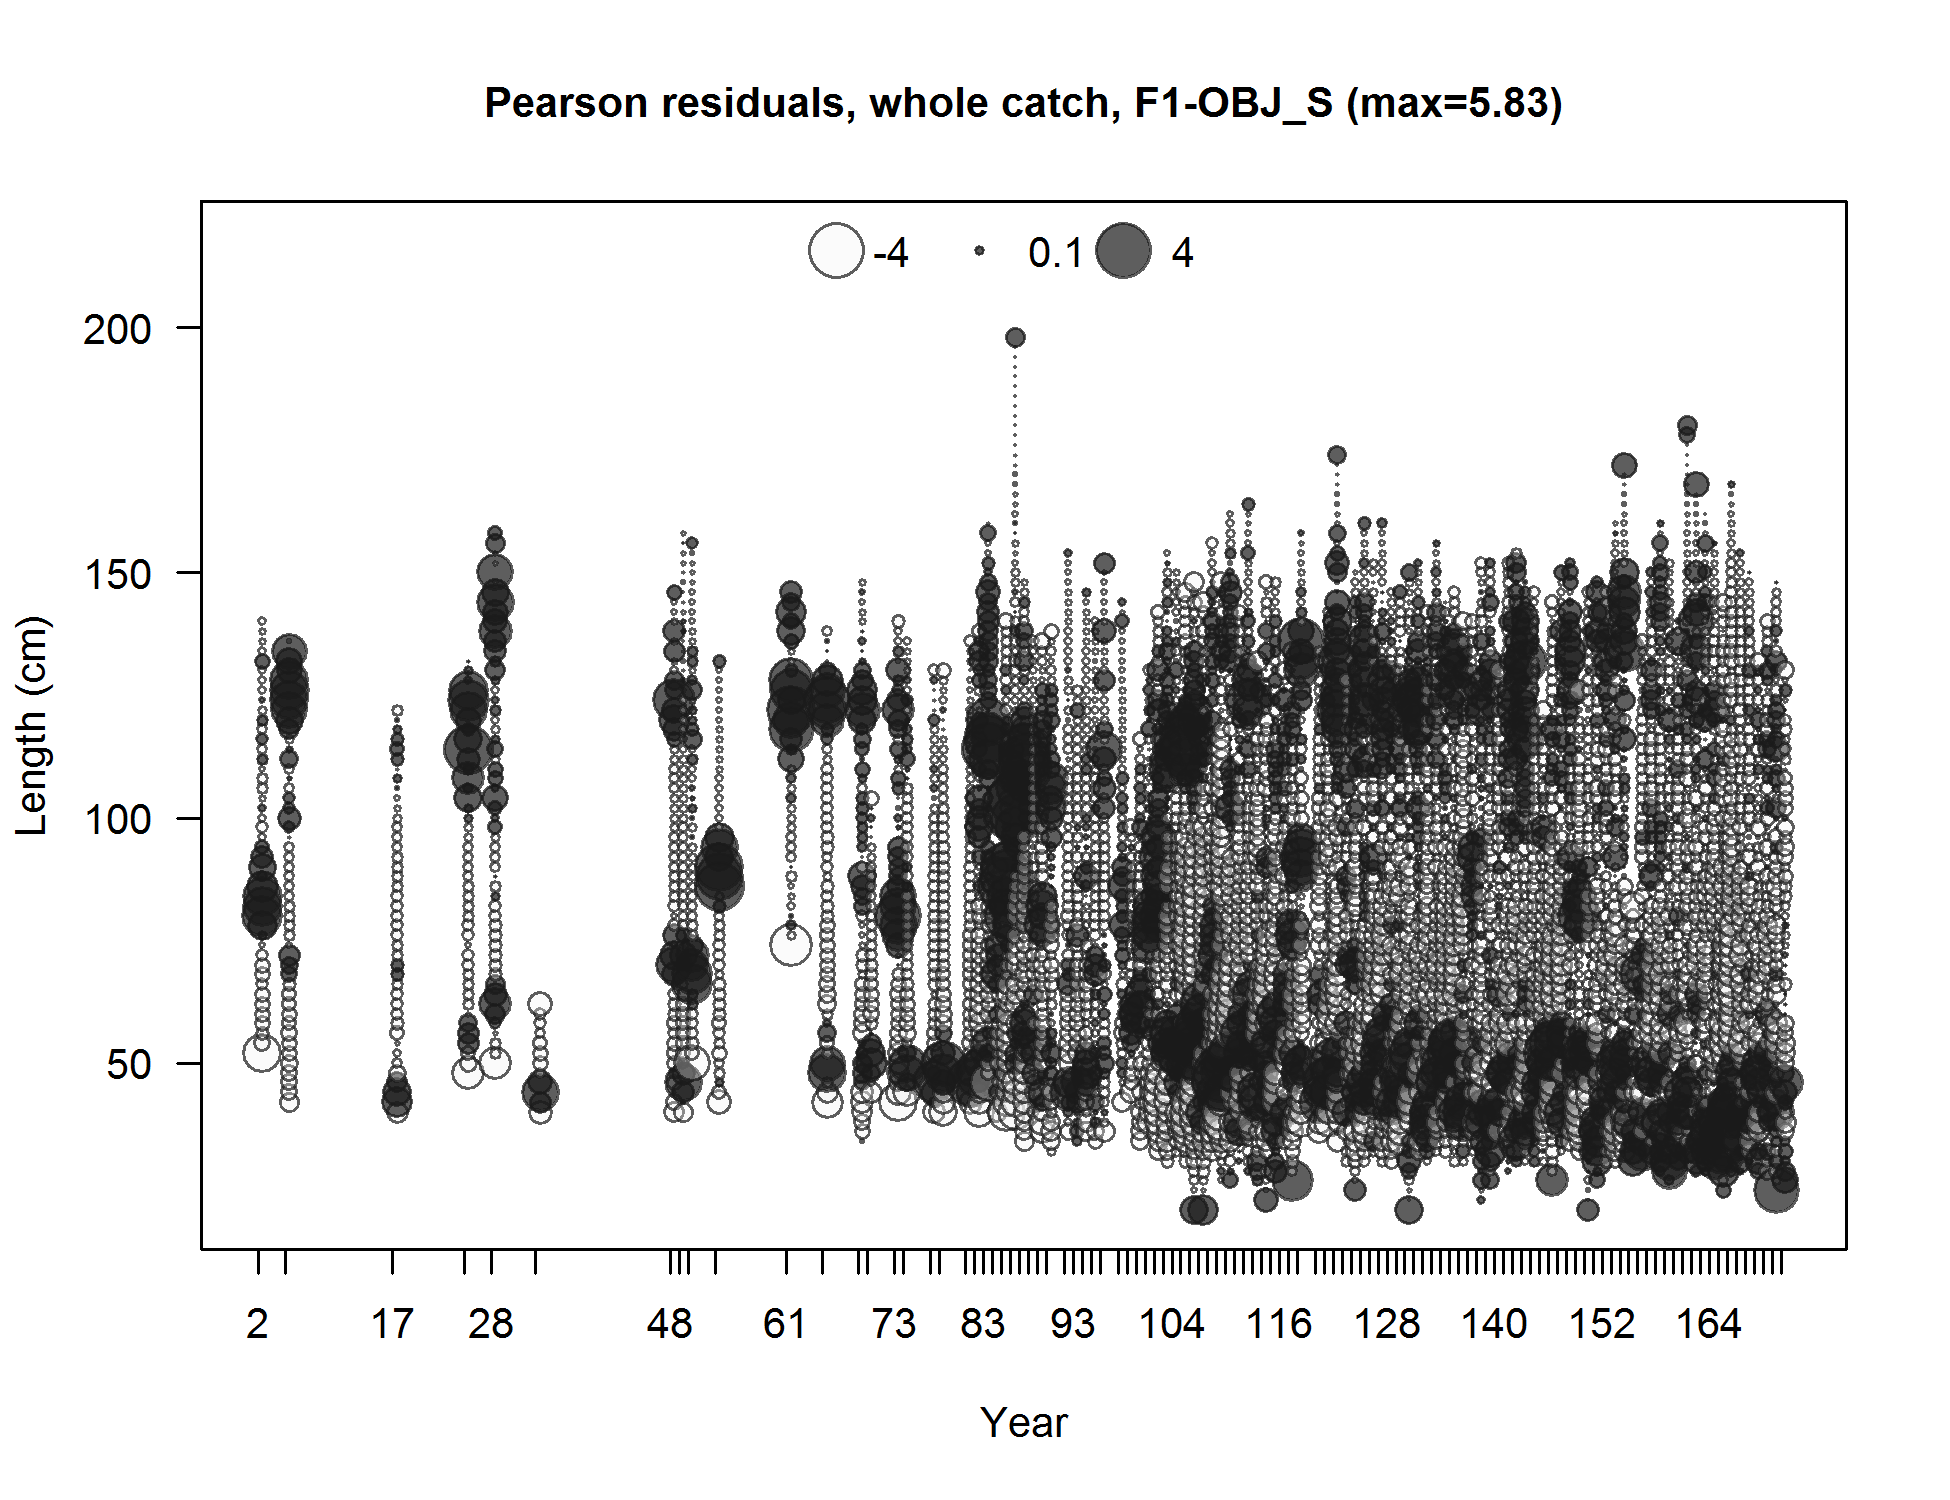
Pearson residuals, whole catch, F1-OBJ_S (max=5.83) (plot 7 of 7)
Closed bubbles are positive residuals (observed > expected) and open bubbles are negative residuals (observed < expected).
file: comp_lenfit_residsflt1mkt0_page7.png
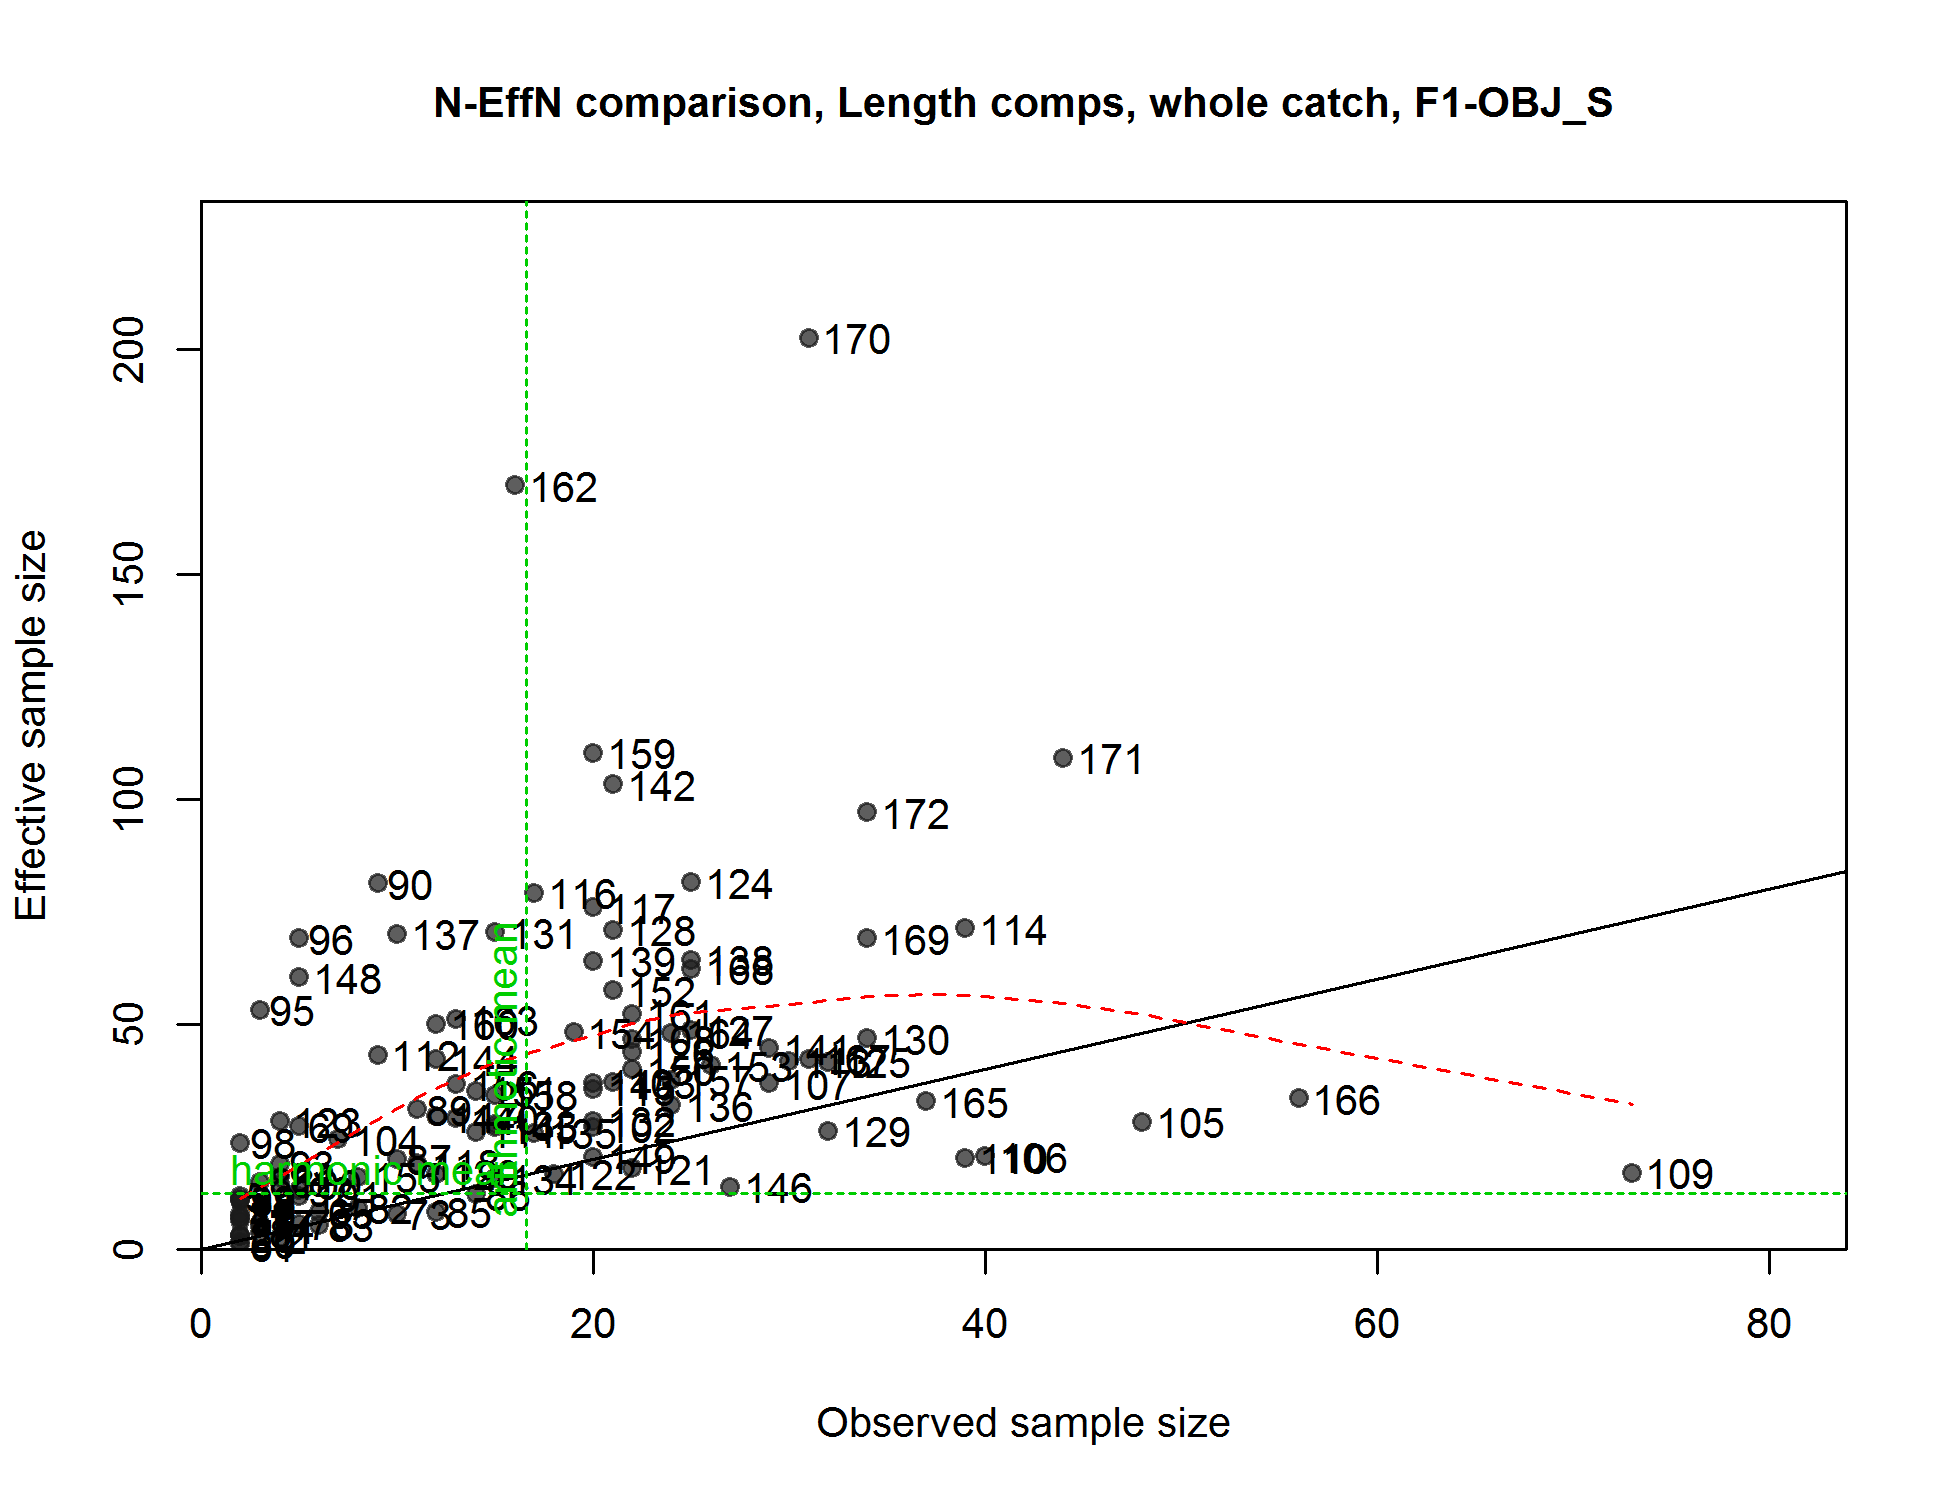
N-EffN comparison, Length comps, whole catch, F1-OBJ_S
file: comp_lenfit_sampsize_flt1mkt0.png
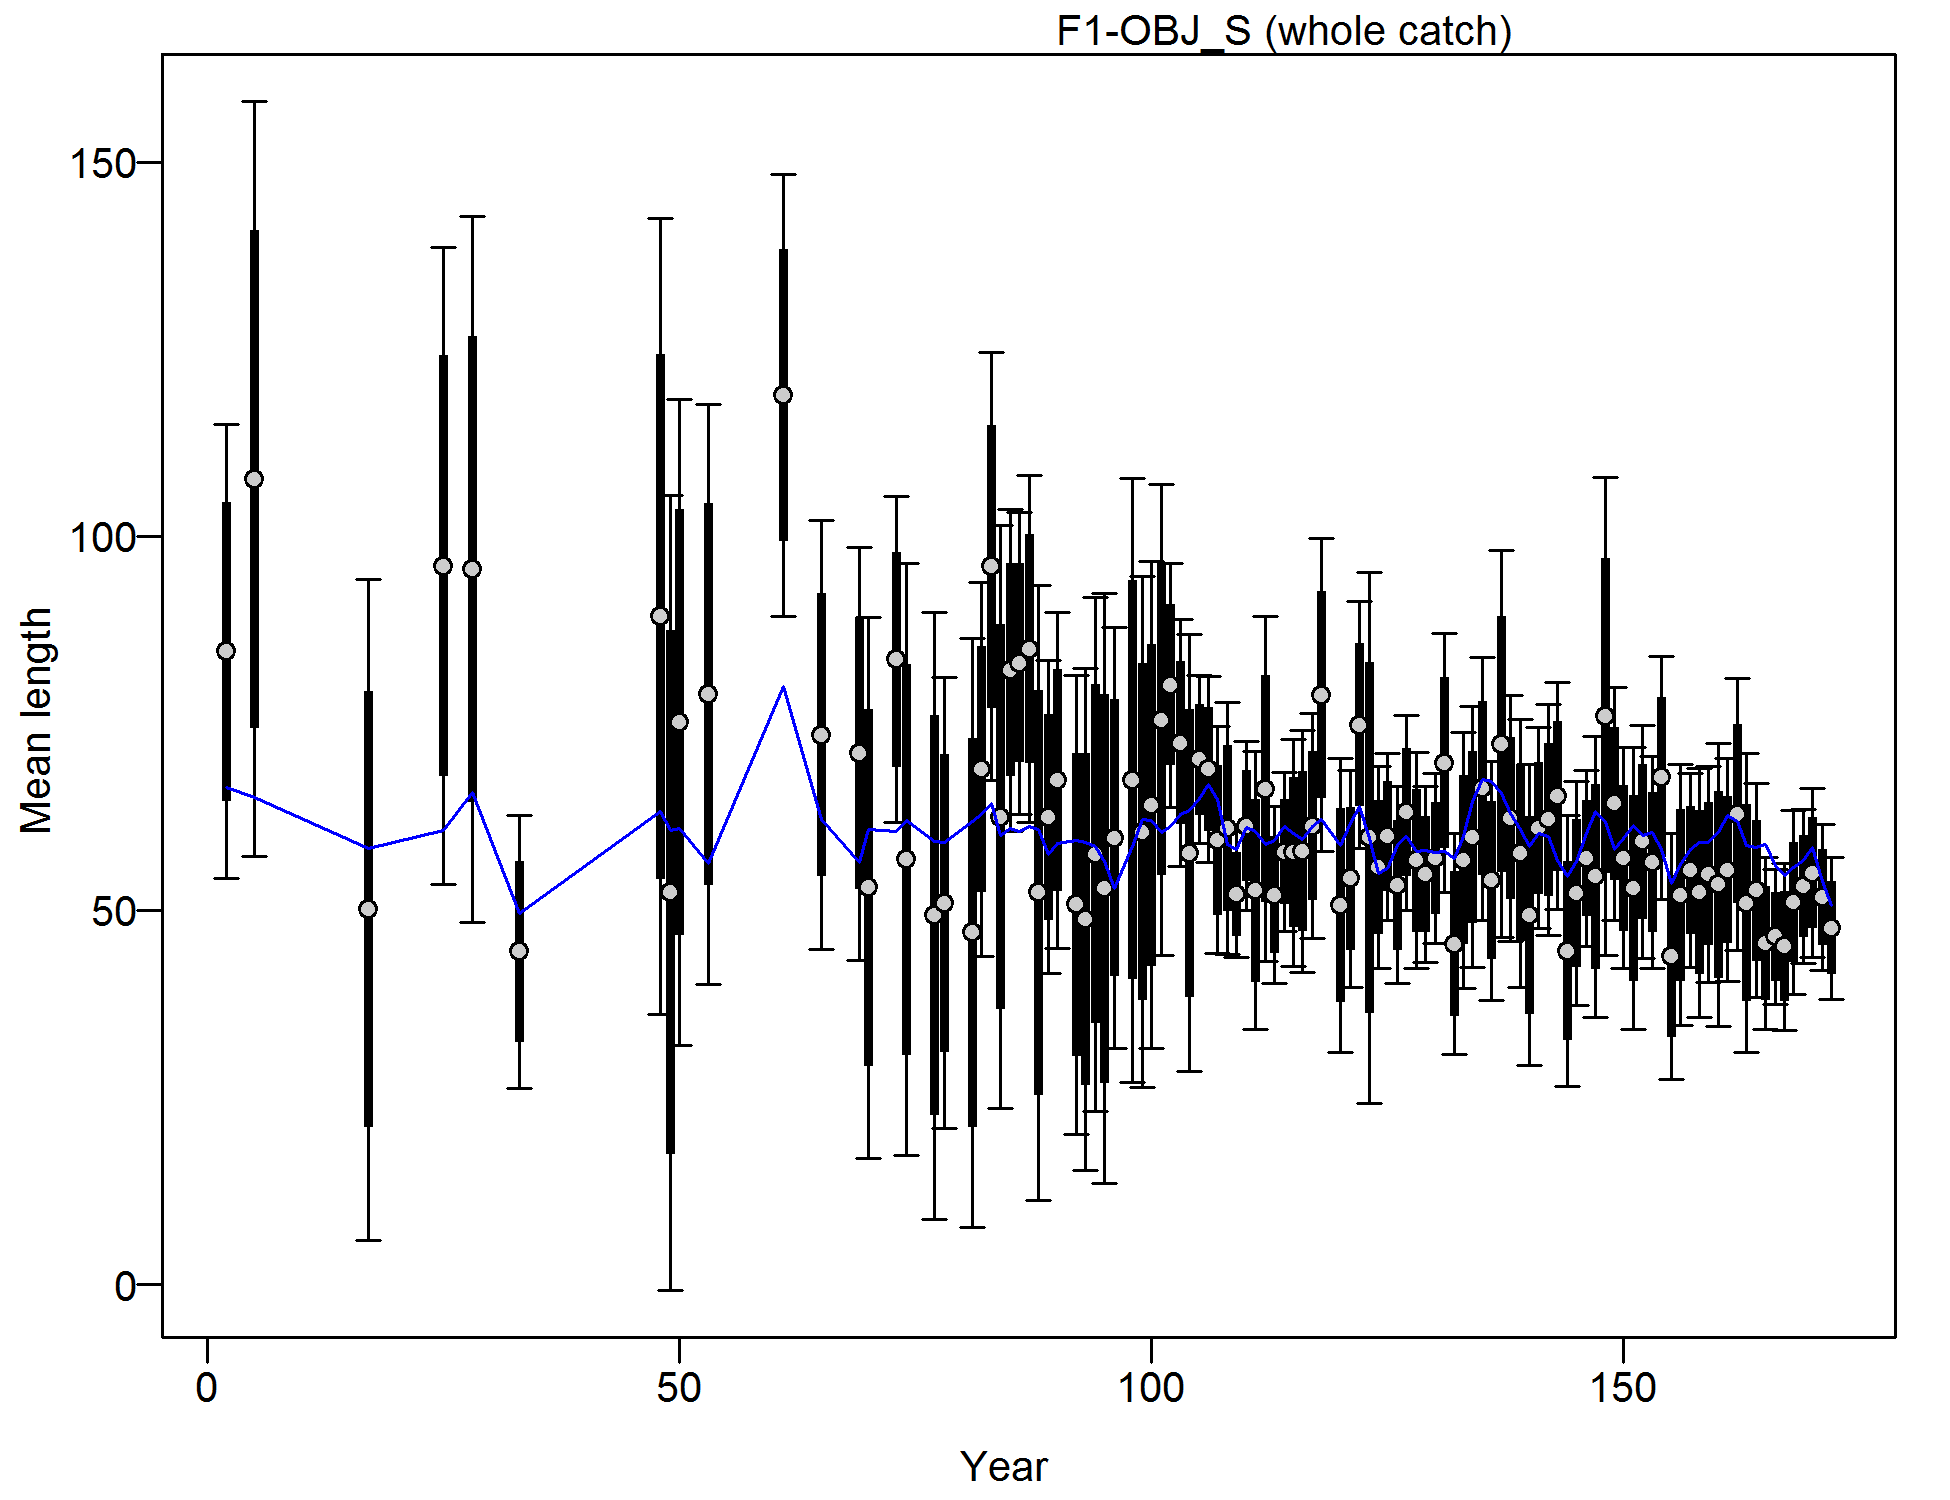
Mean length for F1-OBJ_S with 95% confidence intervals based on current samples sizes.
Francis data weighting method TA1.8: thinner intervals (with capped ends) show result of further adjusting sample sizes based on suggested multiplier (with 95% interval) for len data from F1-OBJ_S:
0.4354 (0.3407-0.5824)
For more info, see
Francis, R.I.C.C. (2011). Data weighting in statistical fisheries stock assessment models. Can. J. Fish. Aquat. Sci. 68: 1124-1138.
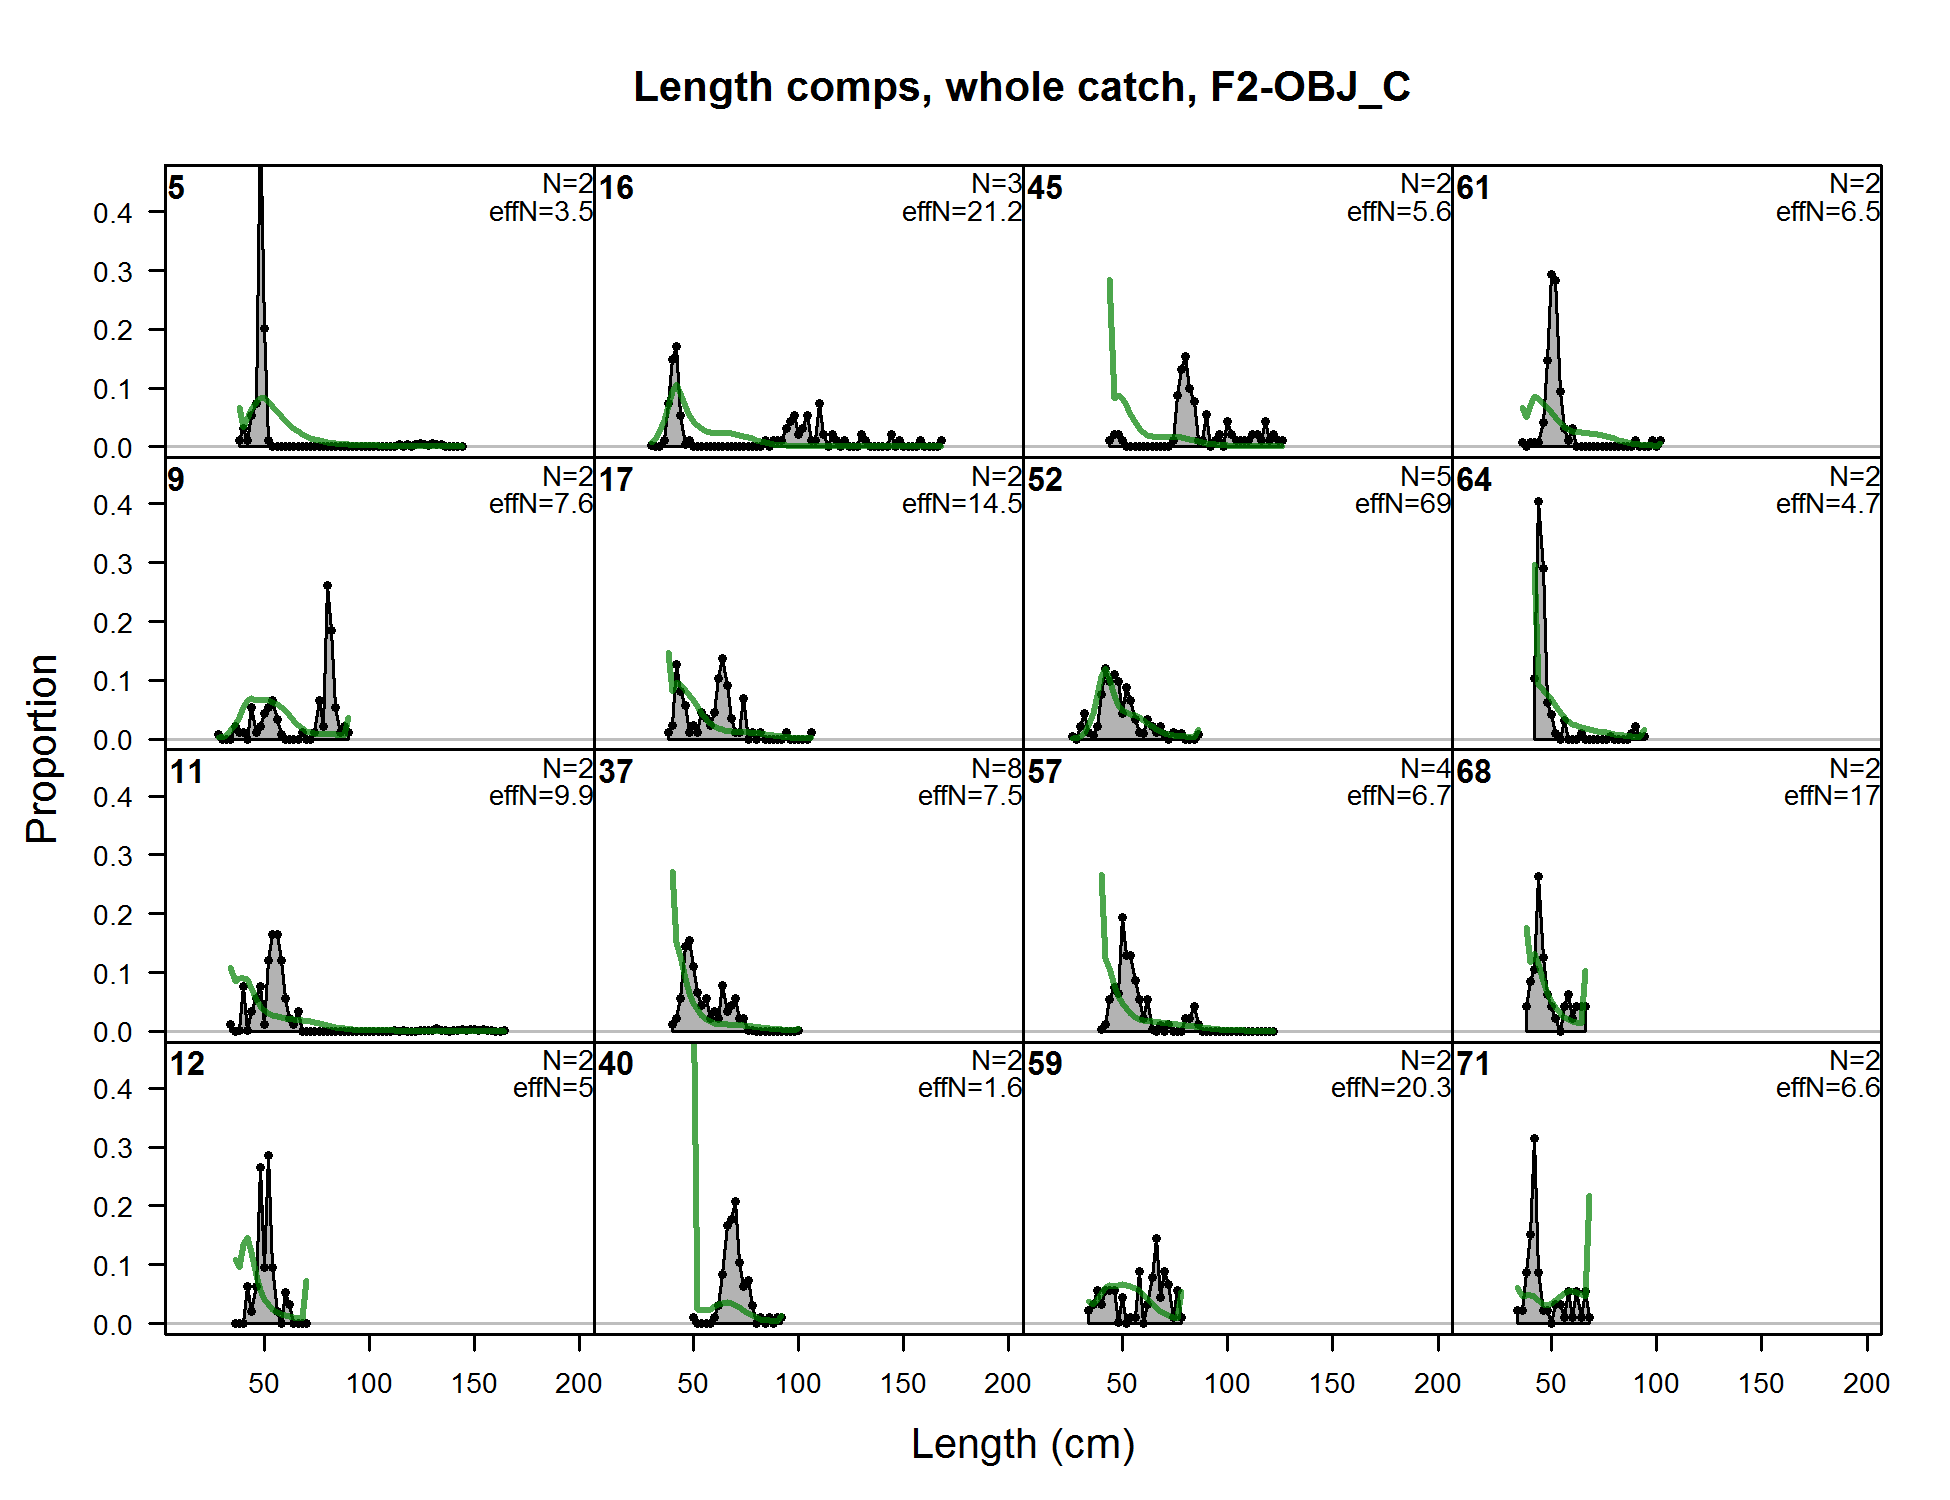
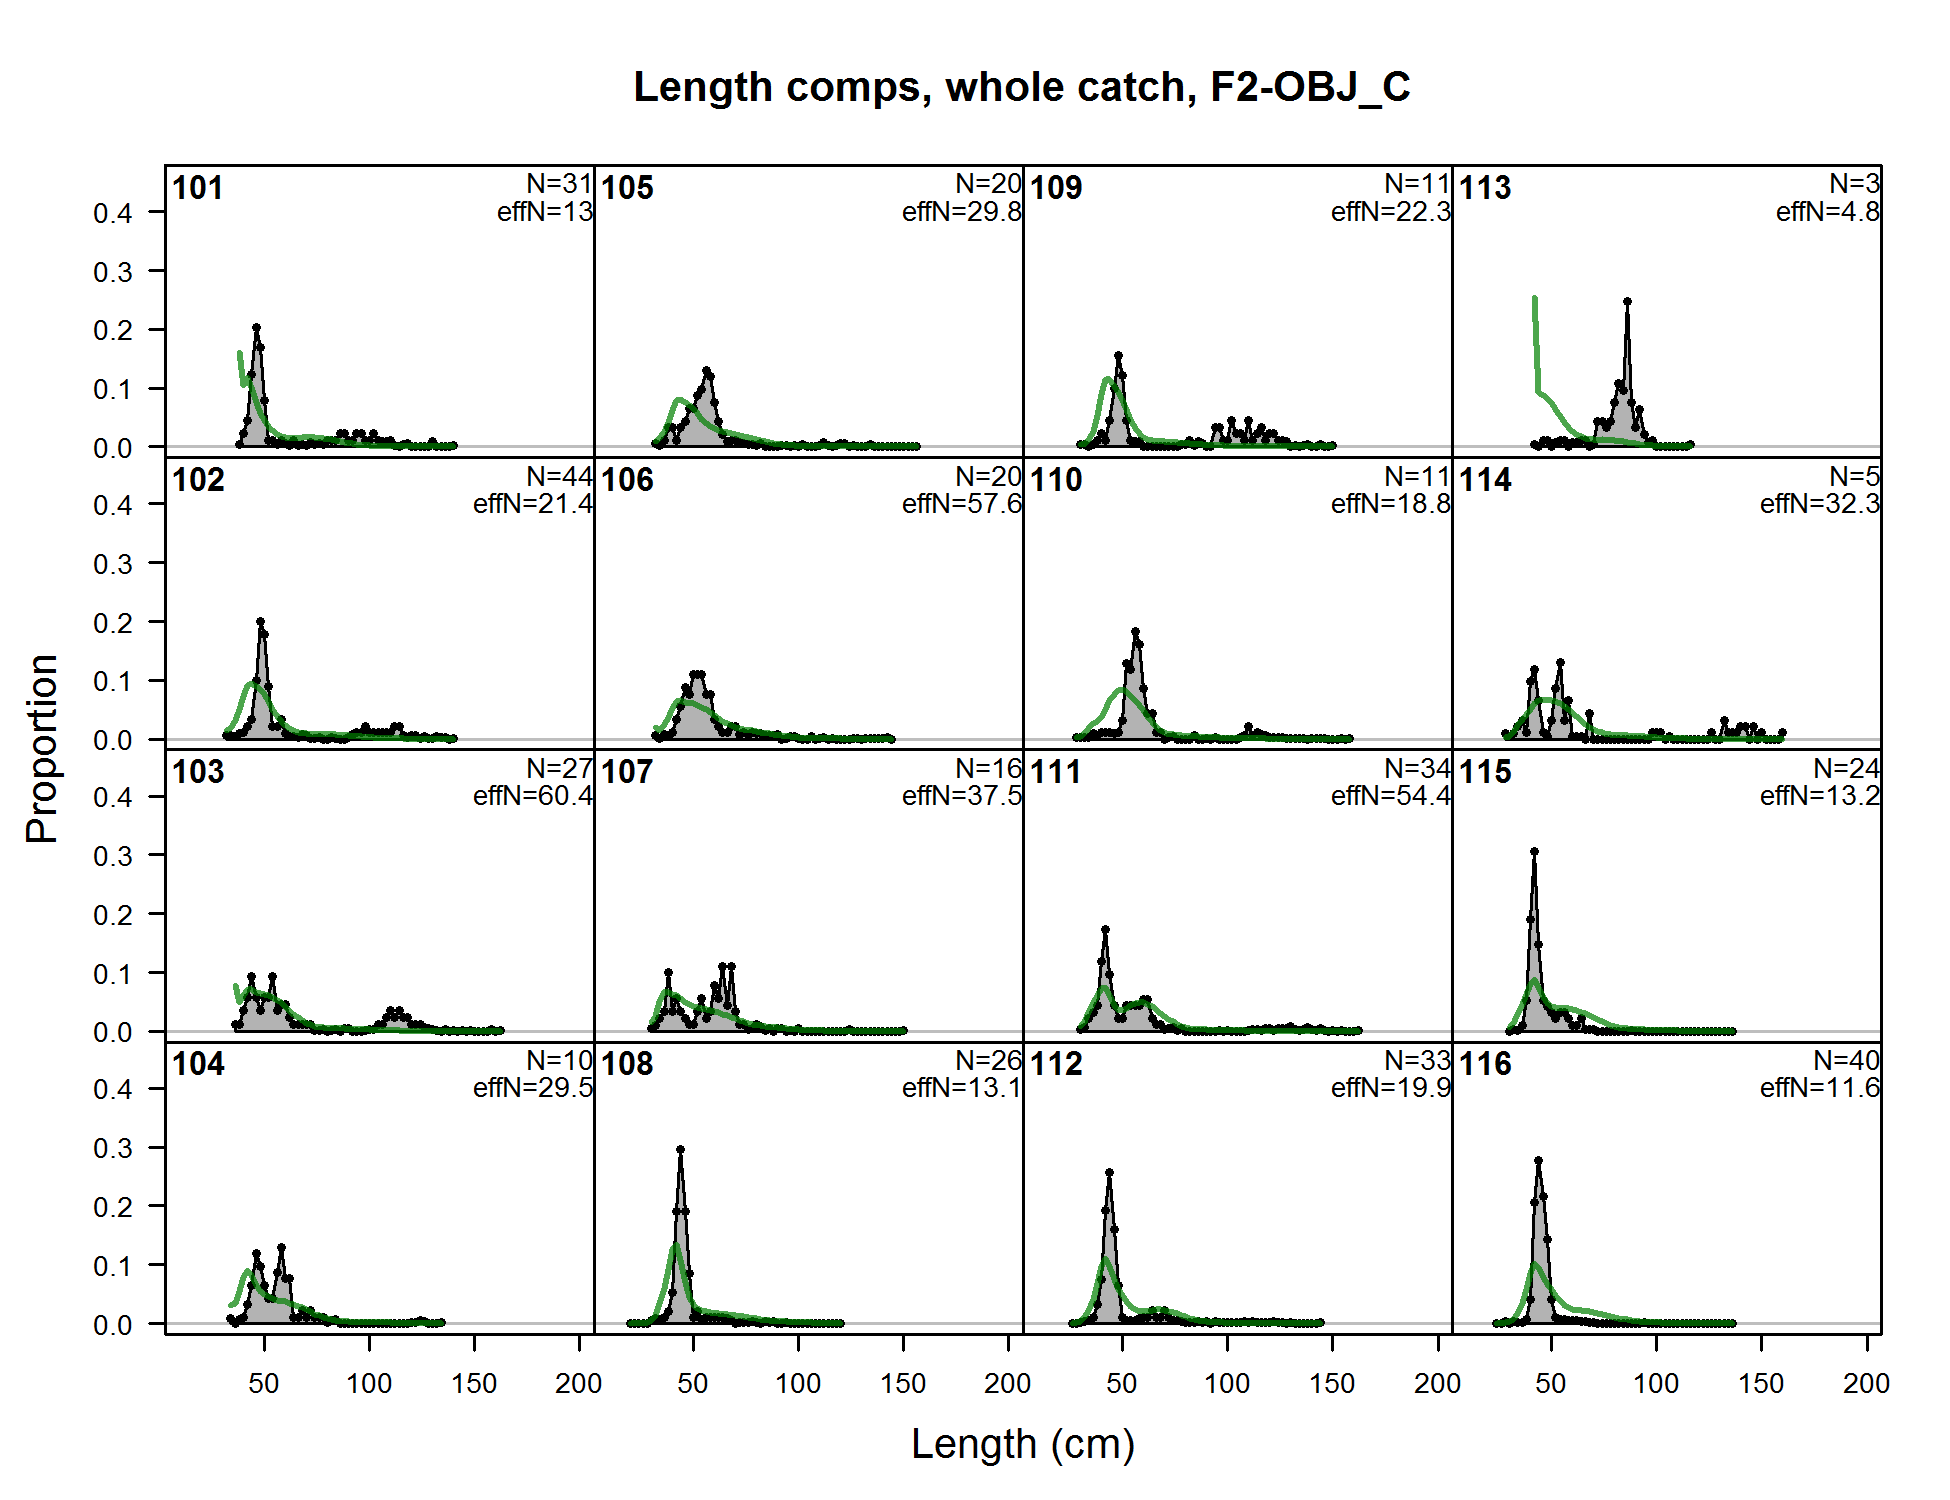
Length comps, whole catch, F2-OBJ_C (plot 1 of 7)
file: comp_lenfit_flt2mkt0_page1.png
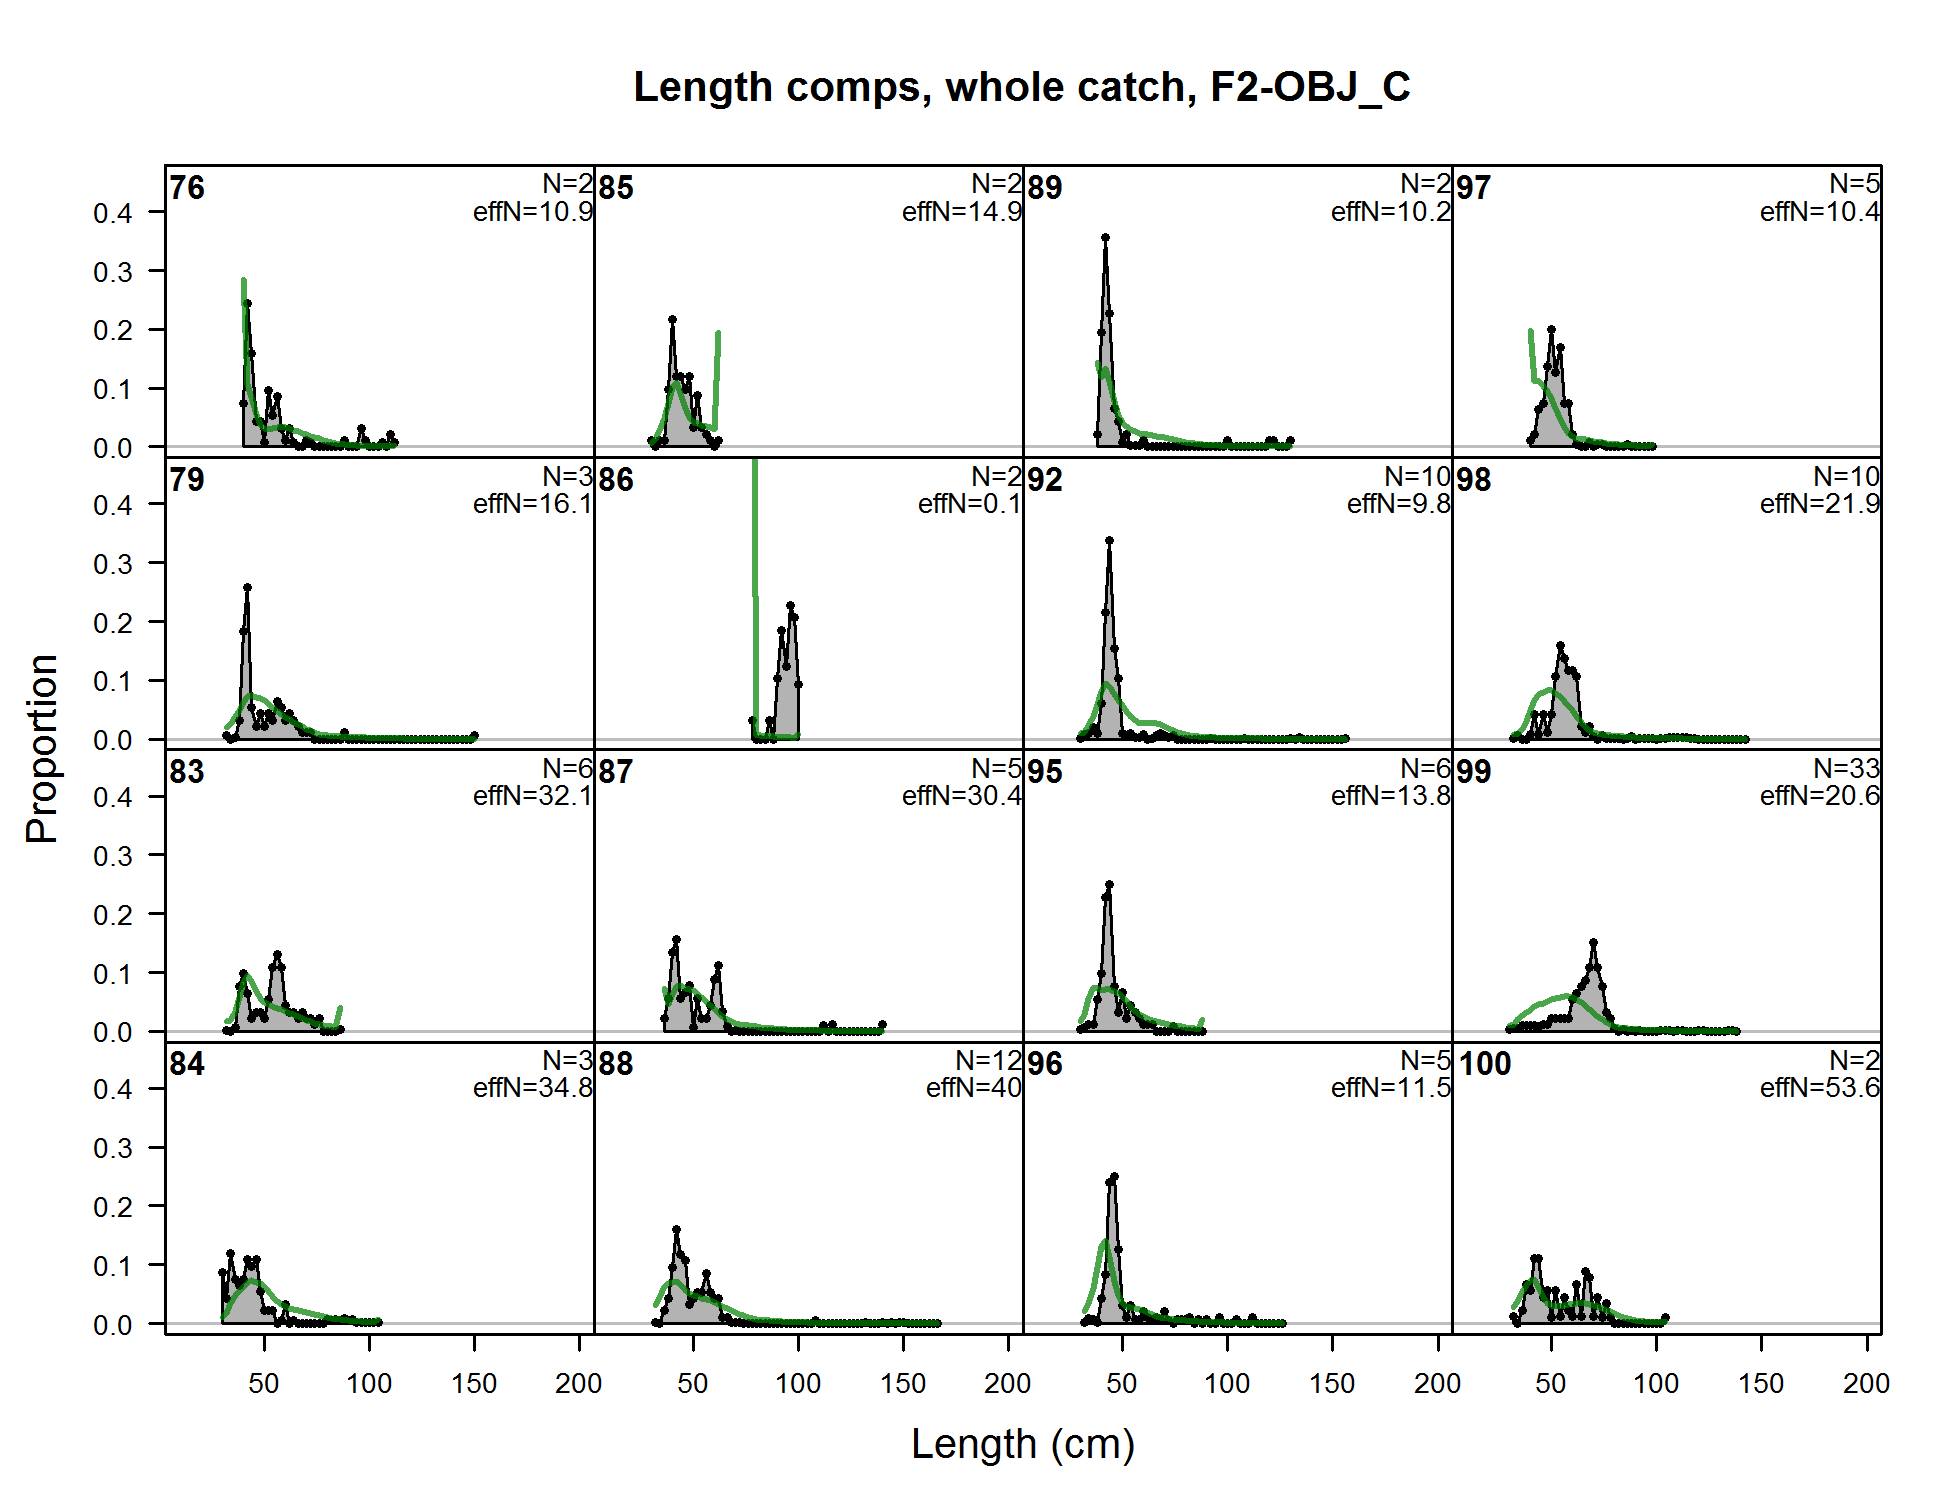
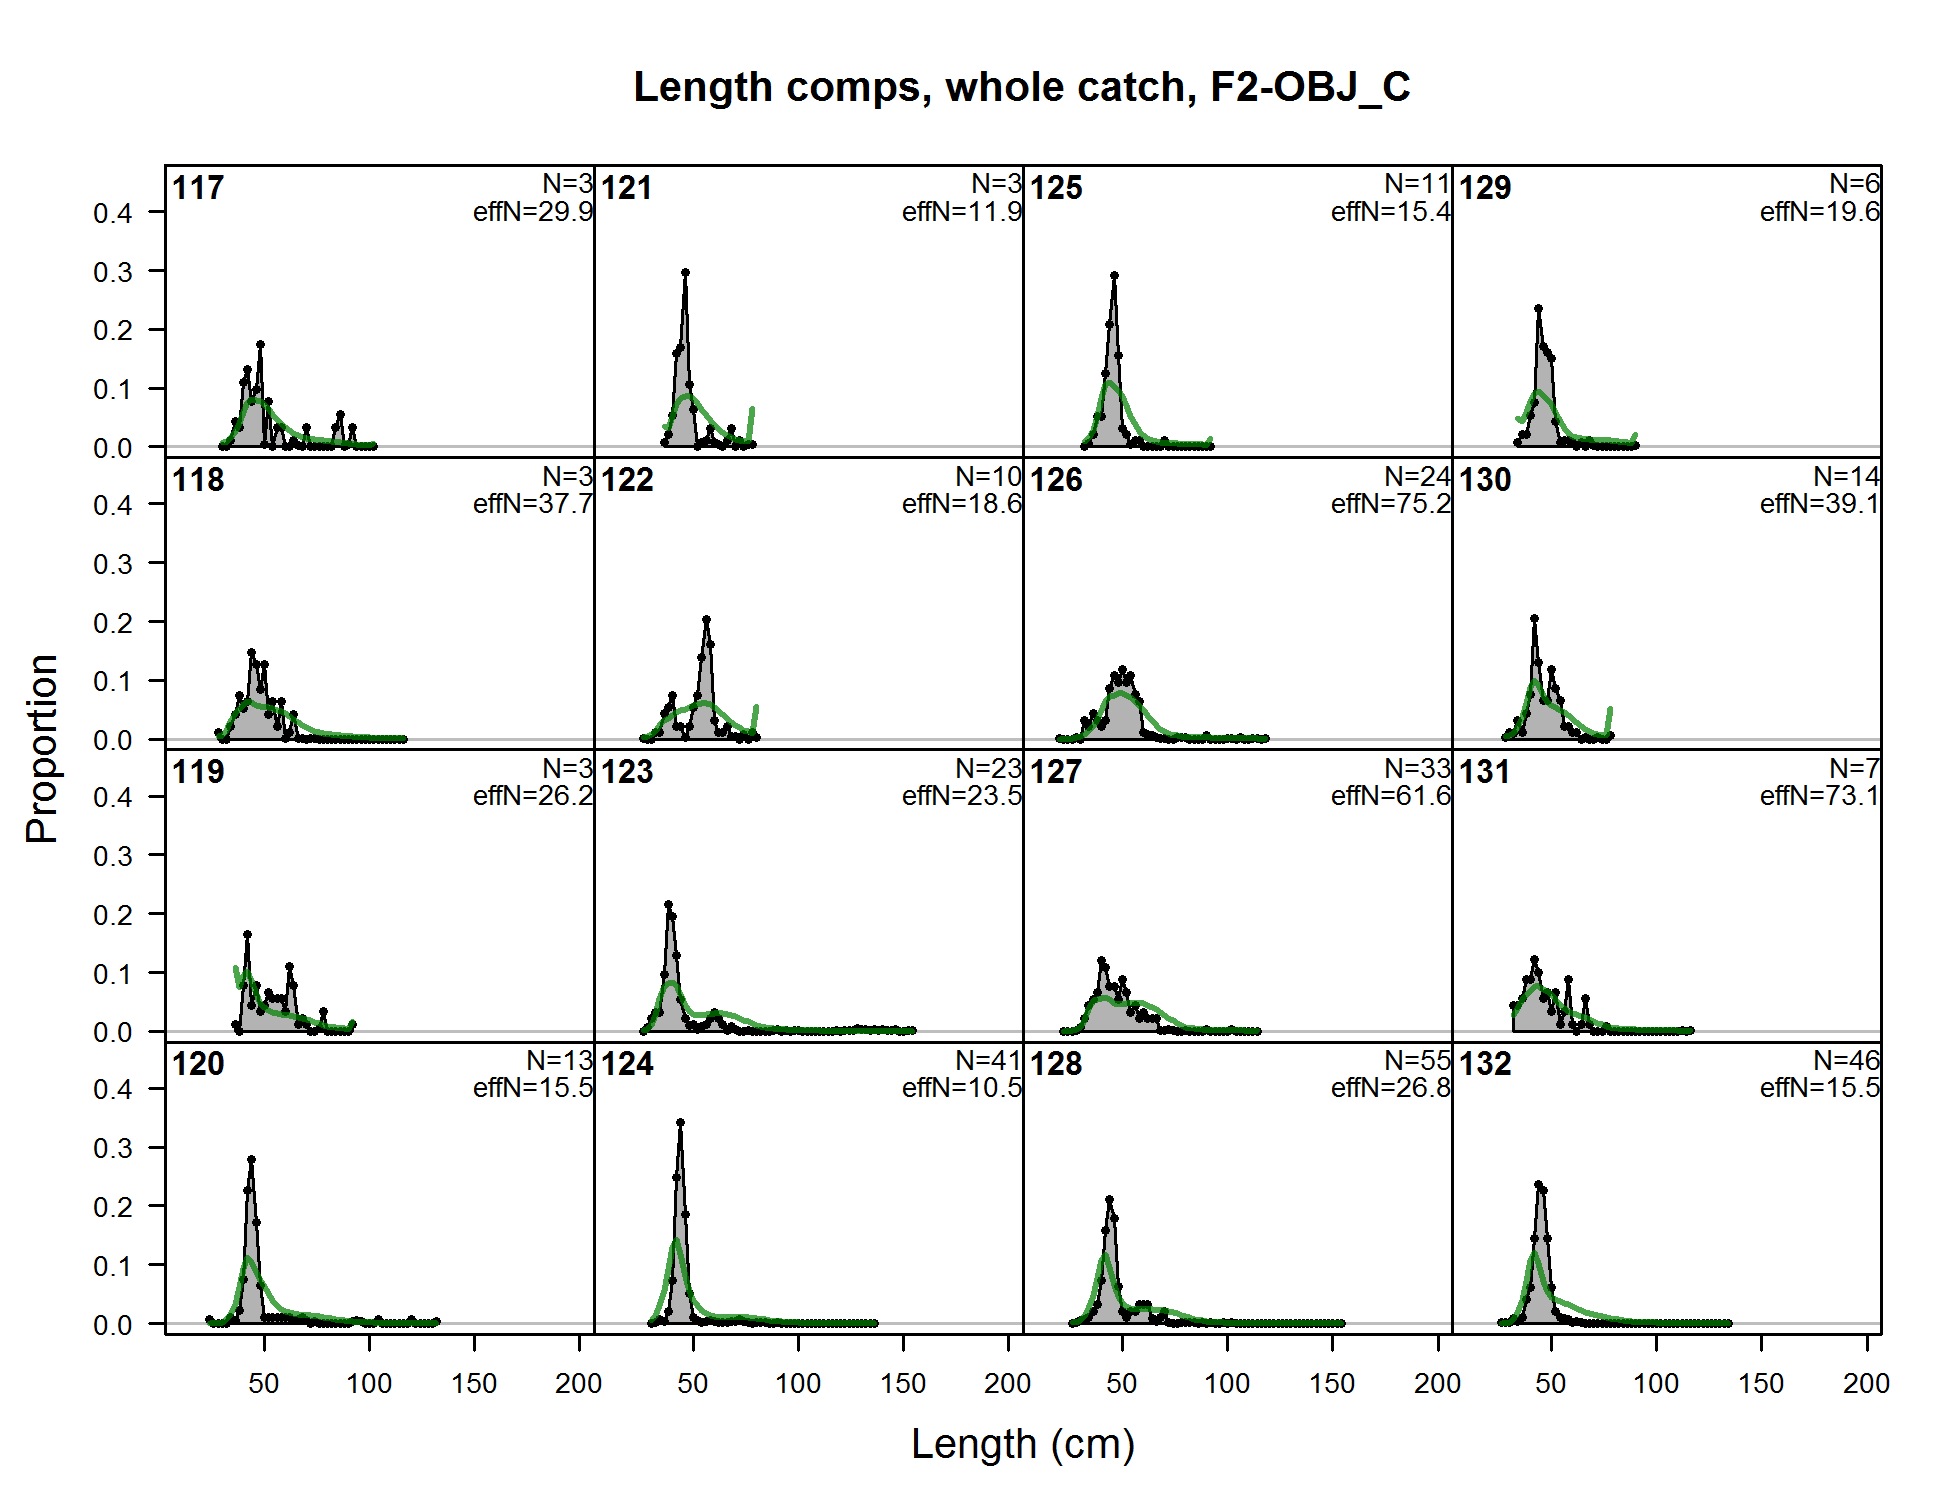
Length comps, whole catch, F2-OBJ_C (plot 1 of 7) (plot 2 of 7)
file: comp_lenfit_flt2mkt0_page2.png
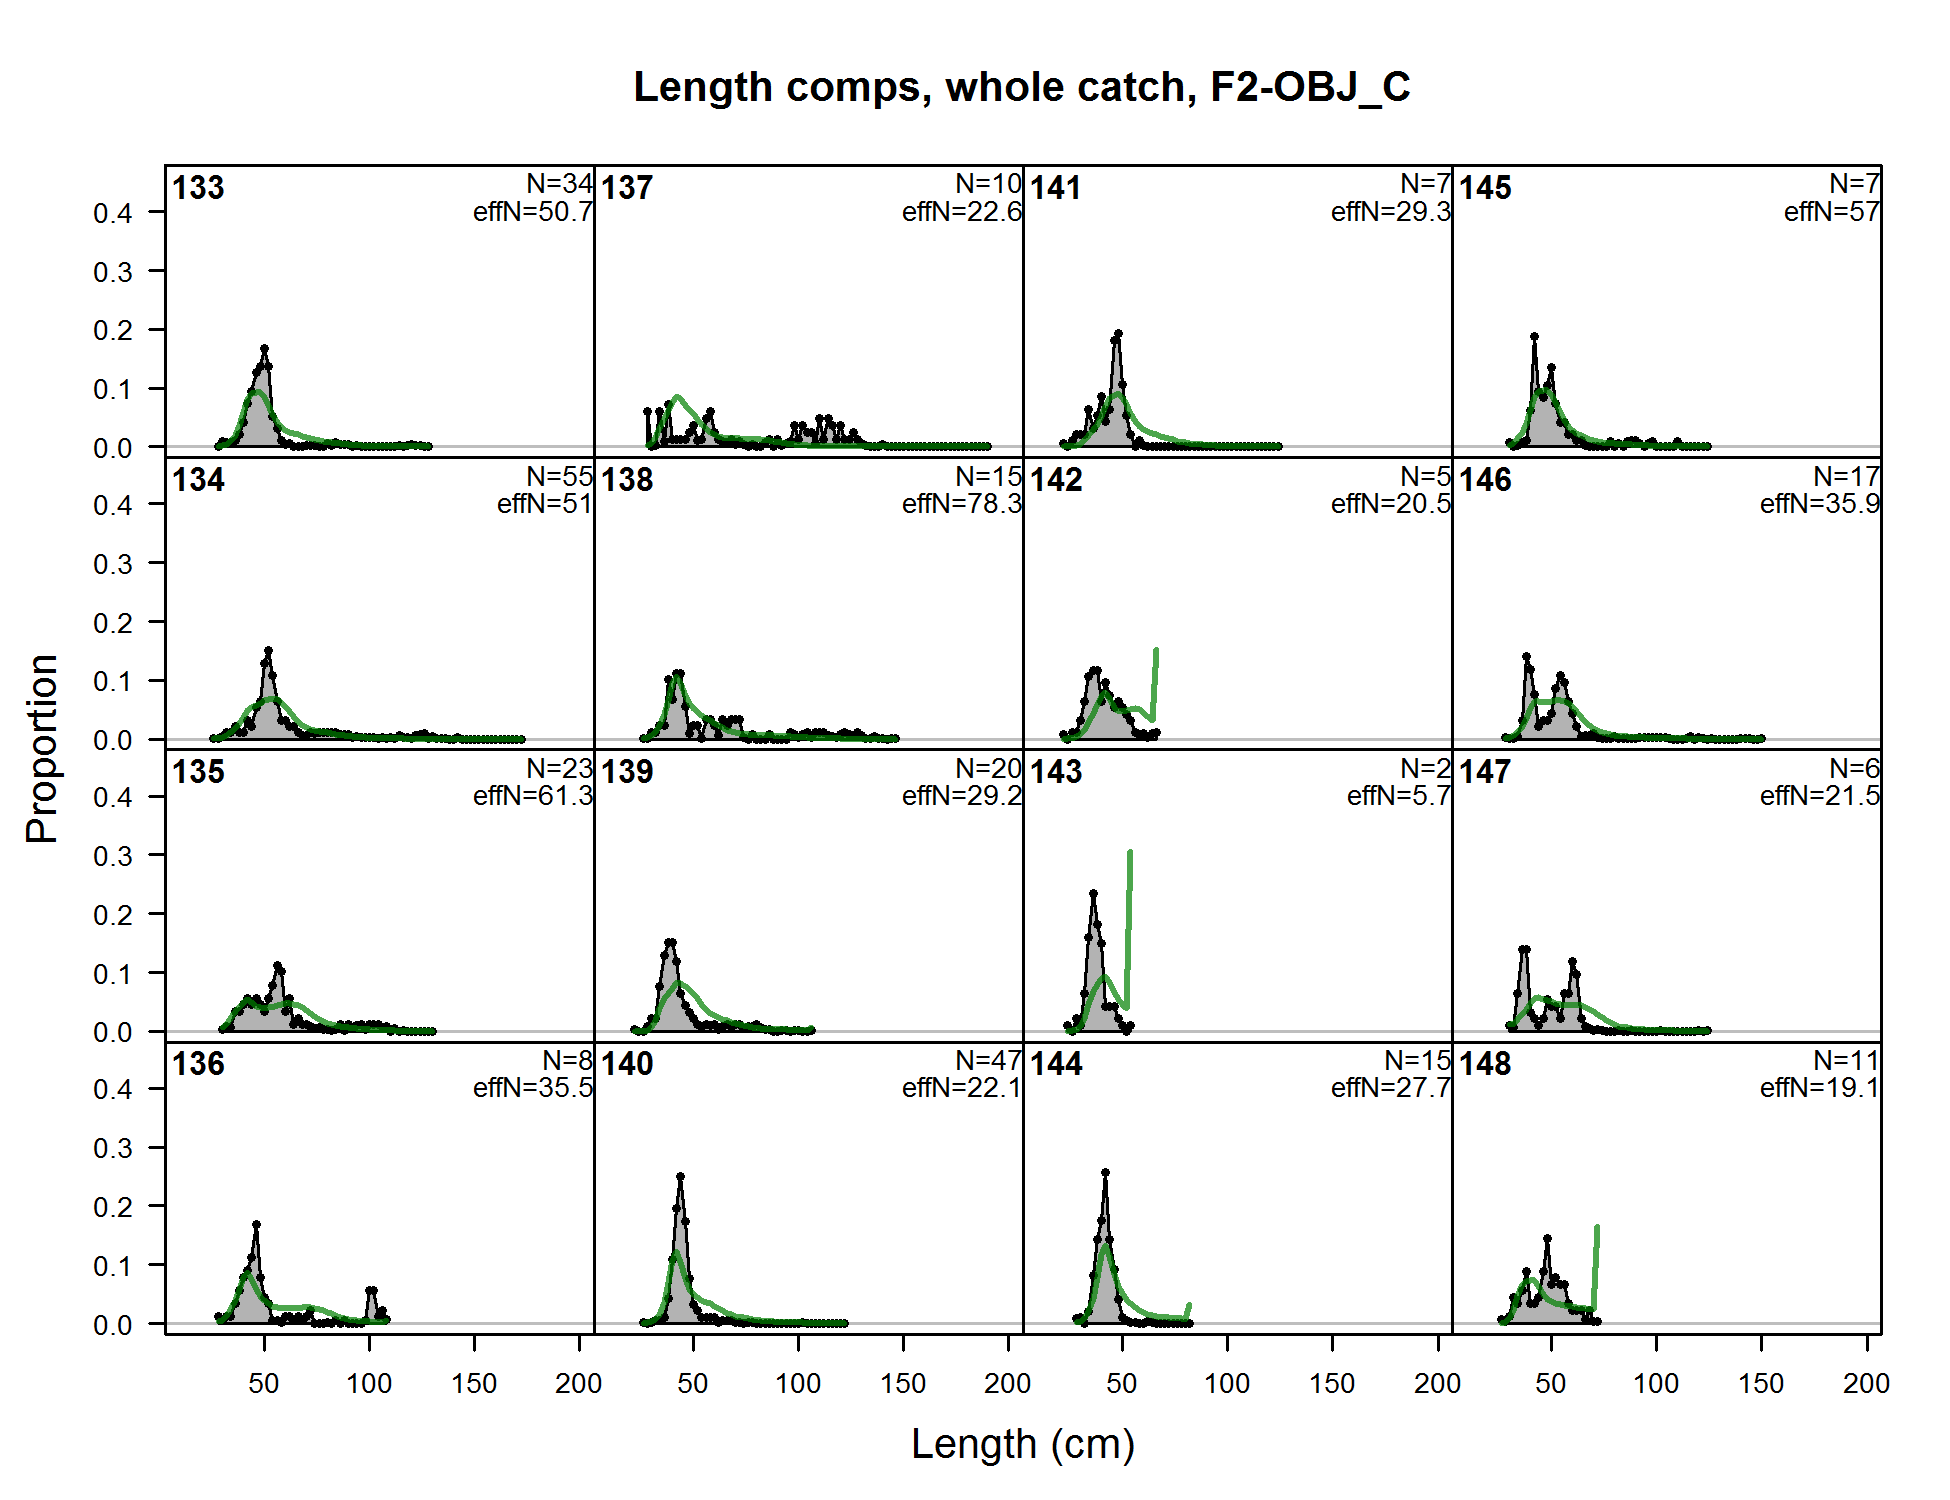
Length comps, whole catch, F2-OBJ_C (plot 1 of 7) (plot 2 of 7) (plot 3 of 7)
file: comp_lenfit_flt2mkt0_page3.png
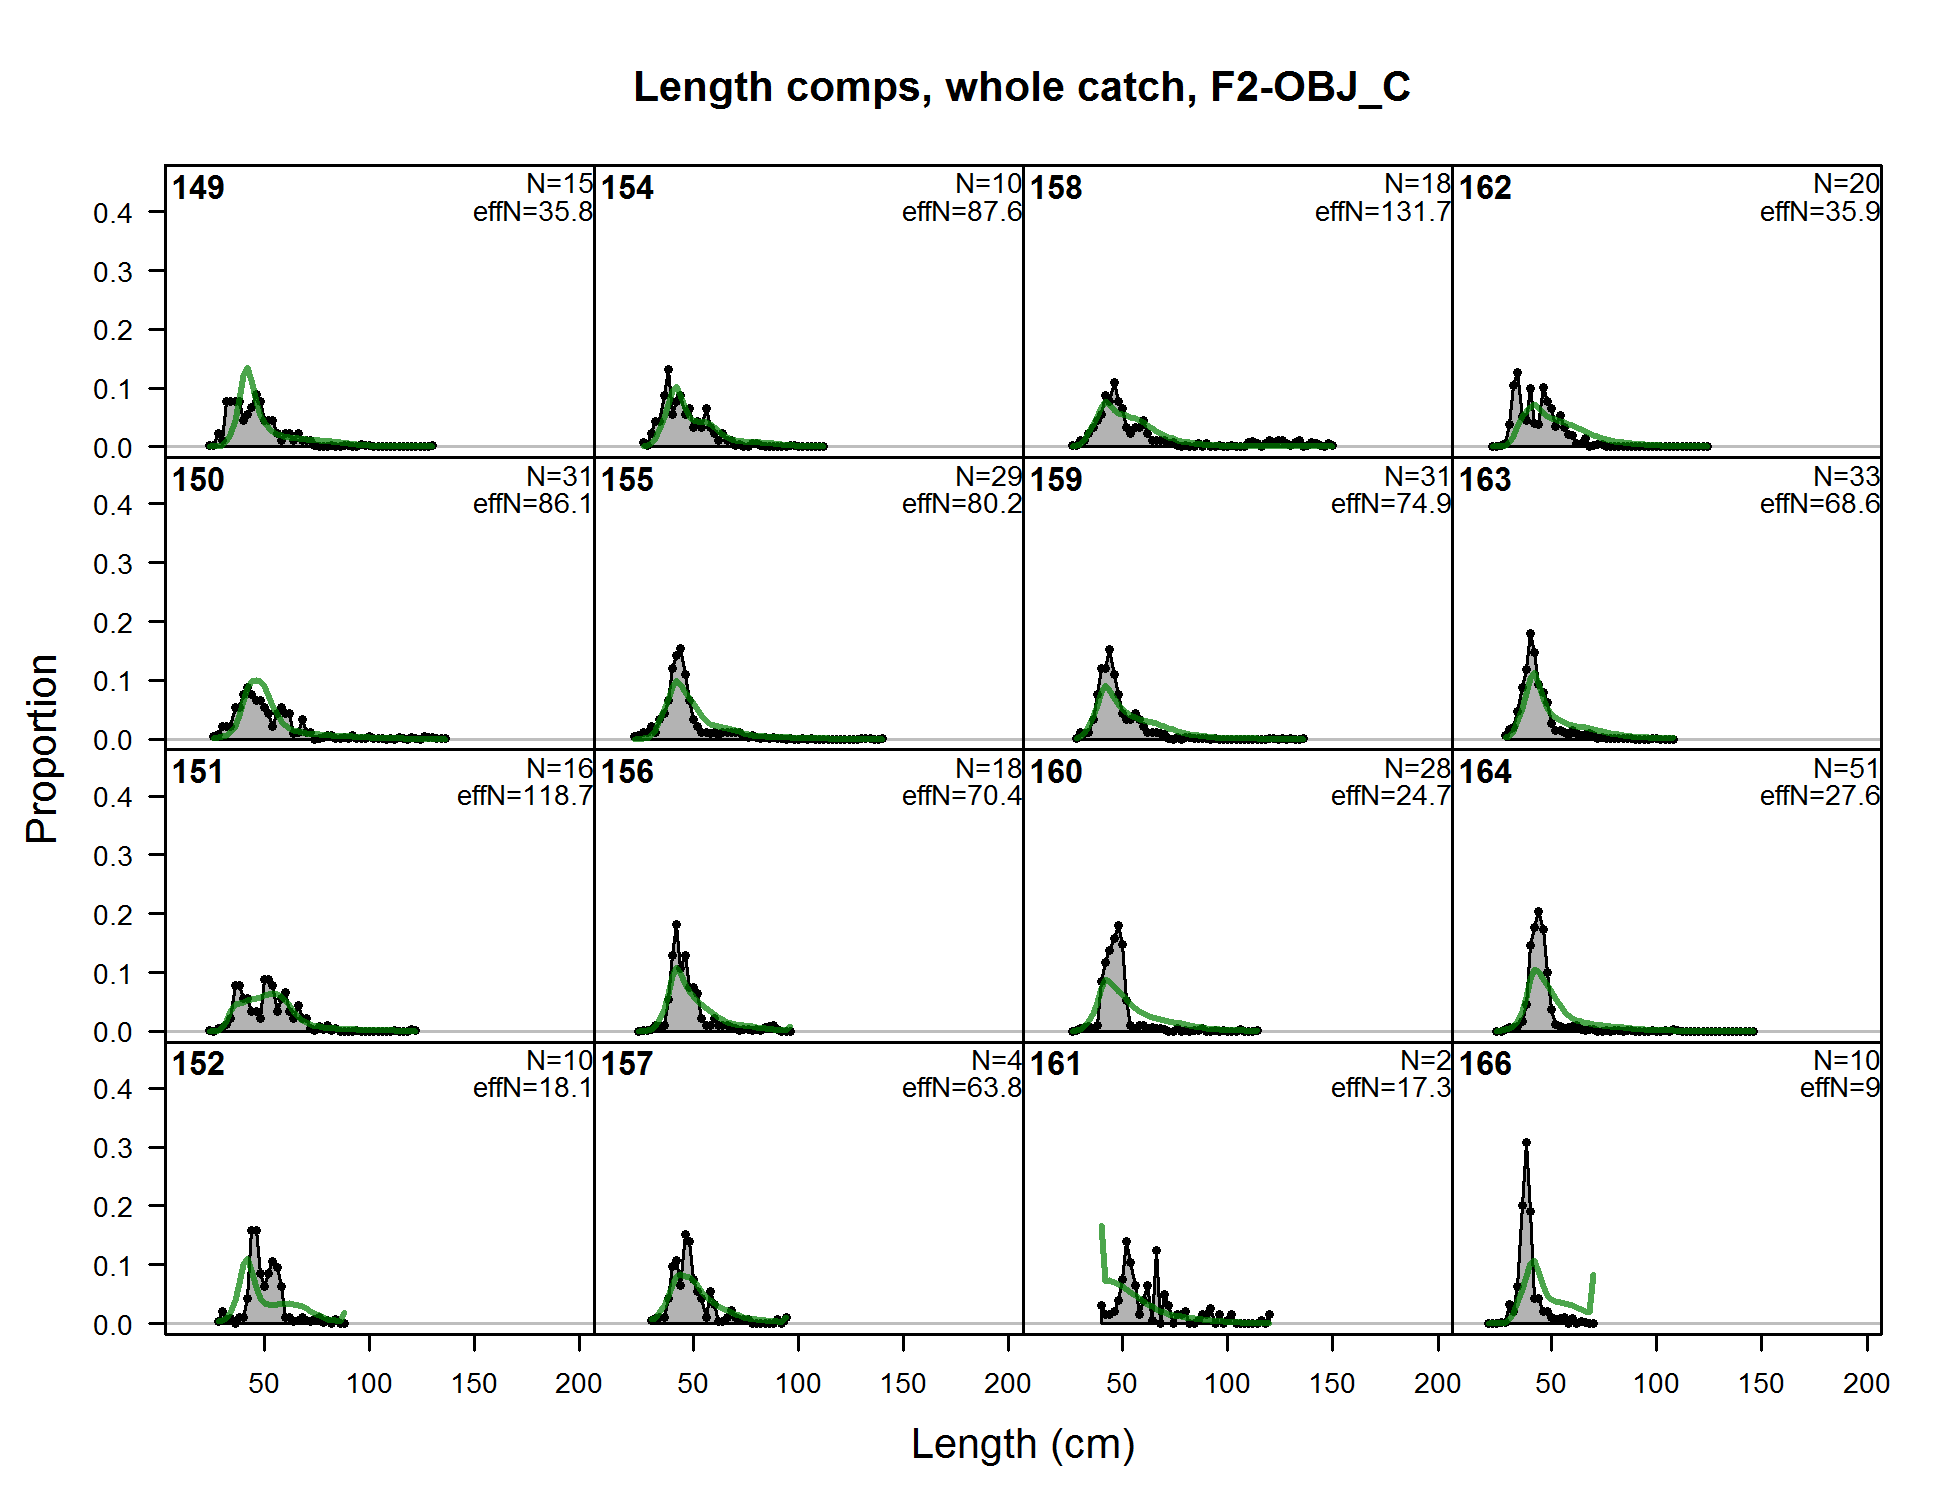
Length comps, whole catch, F2-OBJ_C (plot 1 of 7) (plot 2 of 7) (plot 3 of 7) (plot 4 of 7)
file: comp_lenfit_flt2mkt0_page4.png
Length comps, whole catch, F2-OBJ_C (plot 1 of 7) (plot 2 of 7) (plot 3 of 7) (plot 4 of 7) (plot 5 of 7)
file: comp_lenfit_flt2mkt0_page5.png
Length comps, whole catch, F2-OBJ_C (plot 1 of 7) (plot 2 of 7) (plot 3 of 7) (plot 4 of 7) (plot 5 of 7) (plot 6 of 7)
file: comp_lenfit_flt2mkt0_page6.png
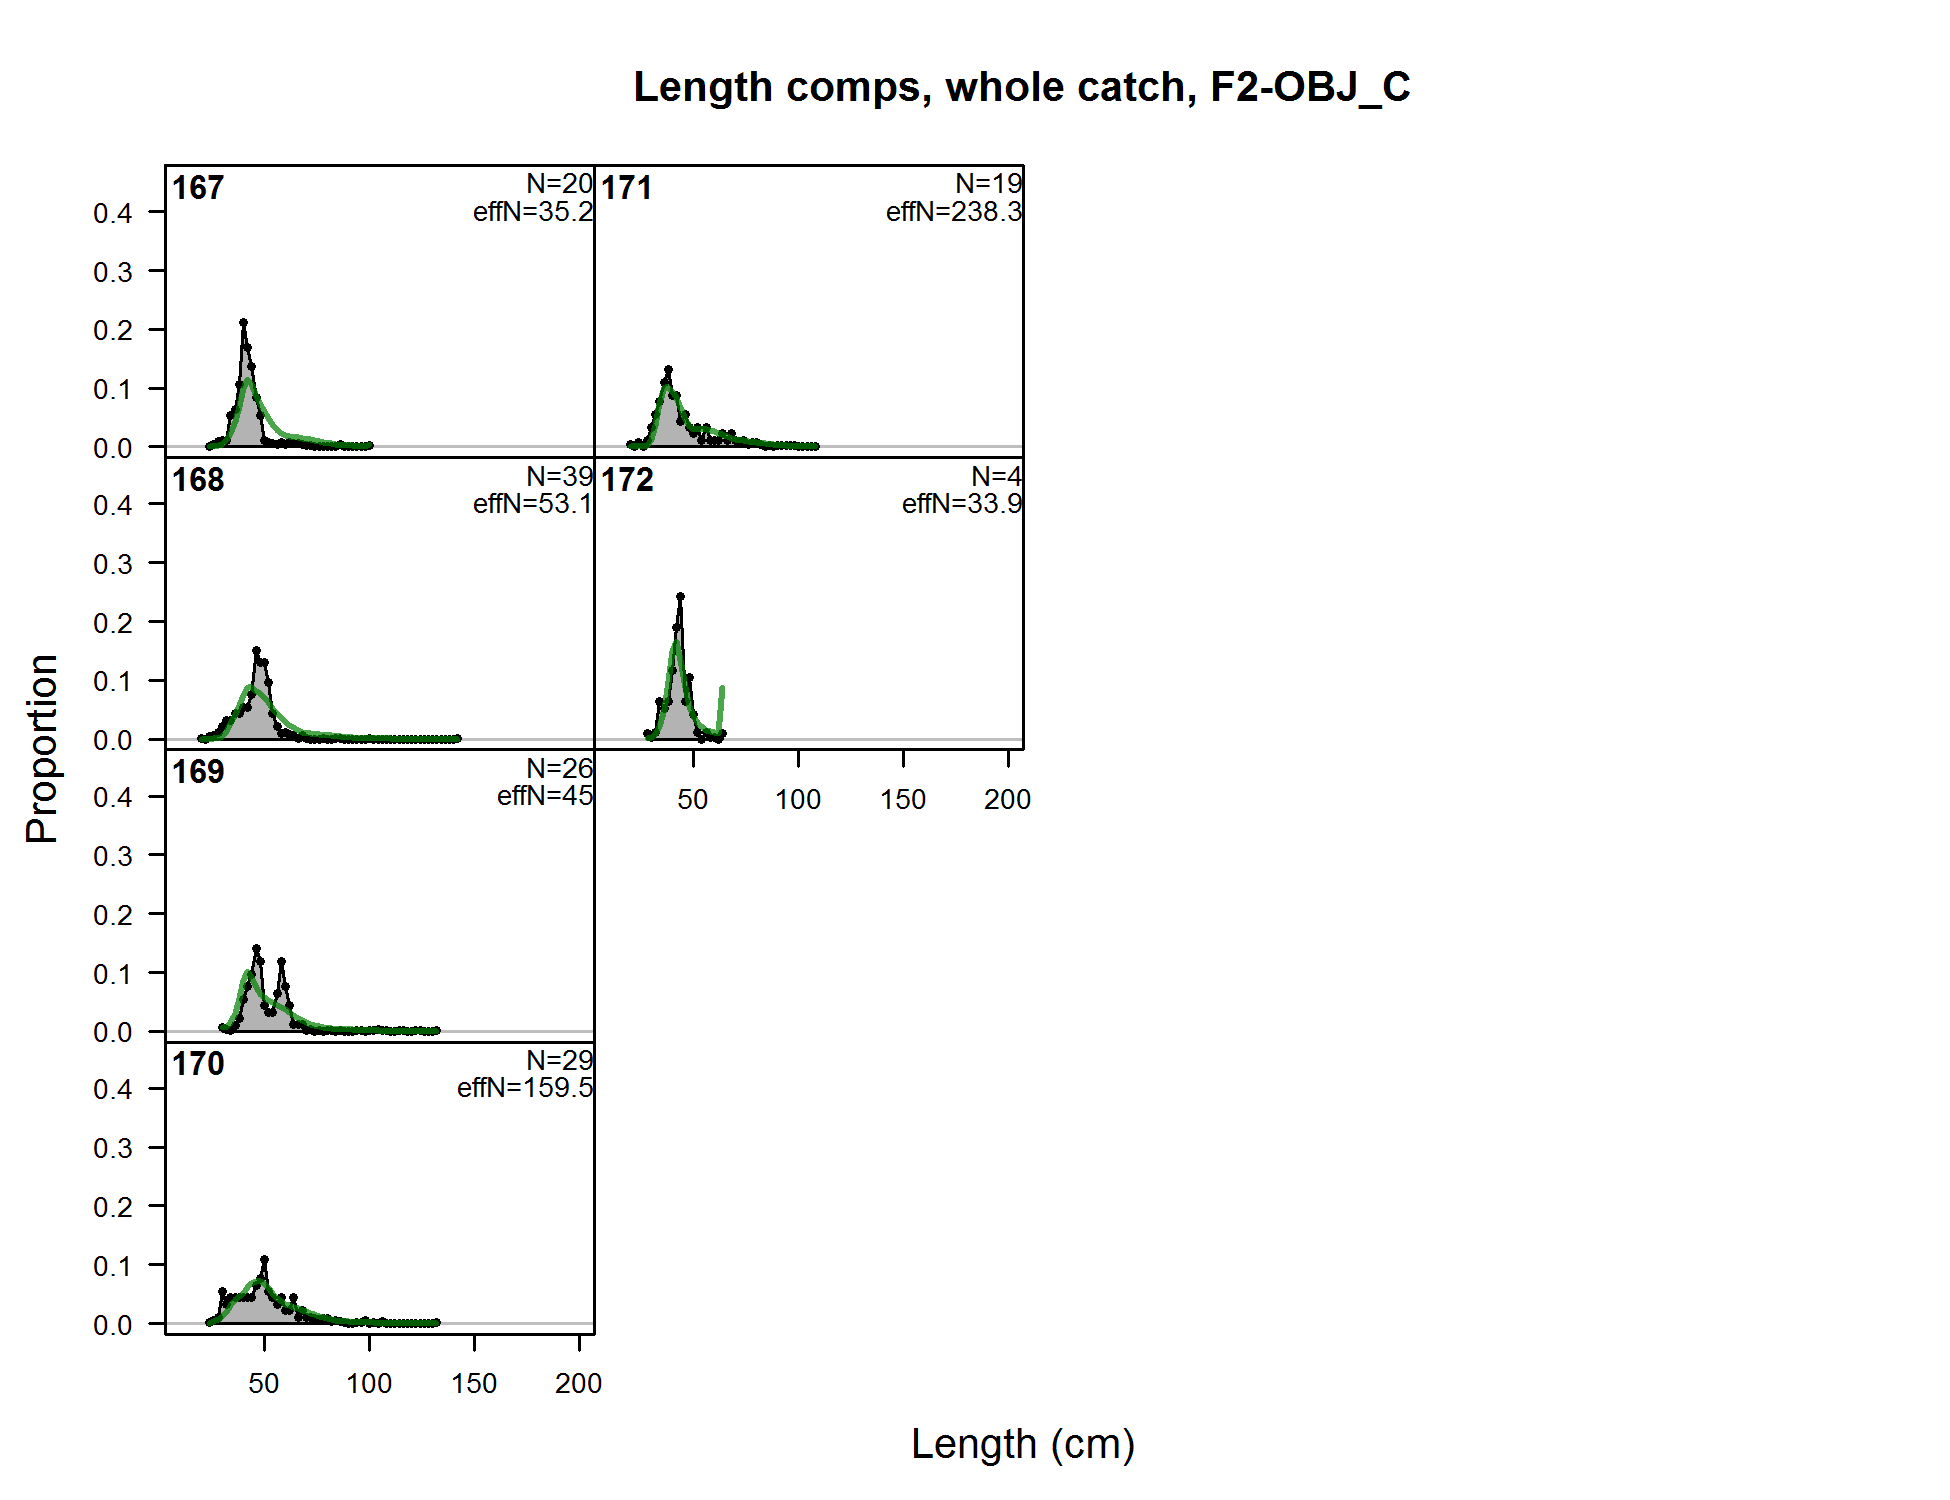
Length comps, whole catch, F2-OBJ_C (plot 1 of 7) (plot 2 of 7) (plot 3 of 7) (plot 4 of 7) (plot 5 of 7) (plot 6 of 7) (plot 7 of 7)
file: comp_lenfit_flt2mkt0_page7.png
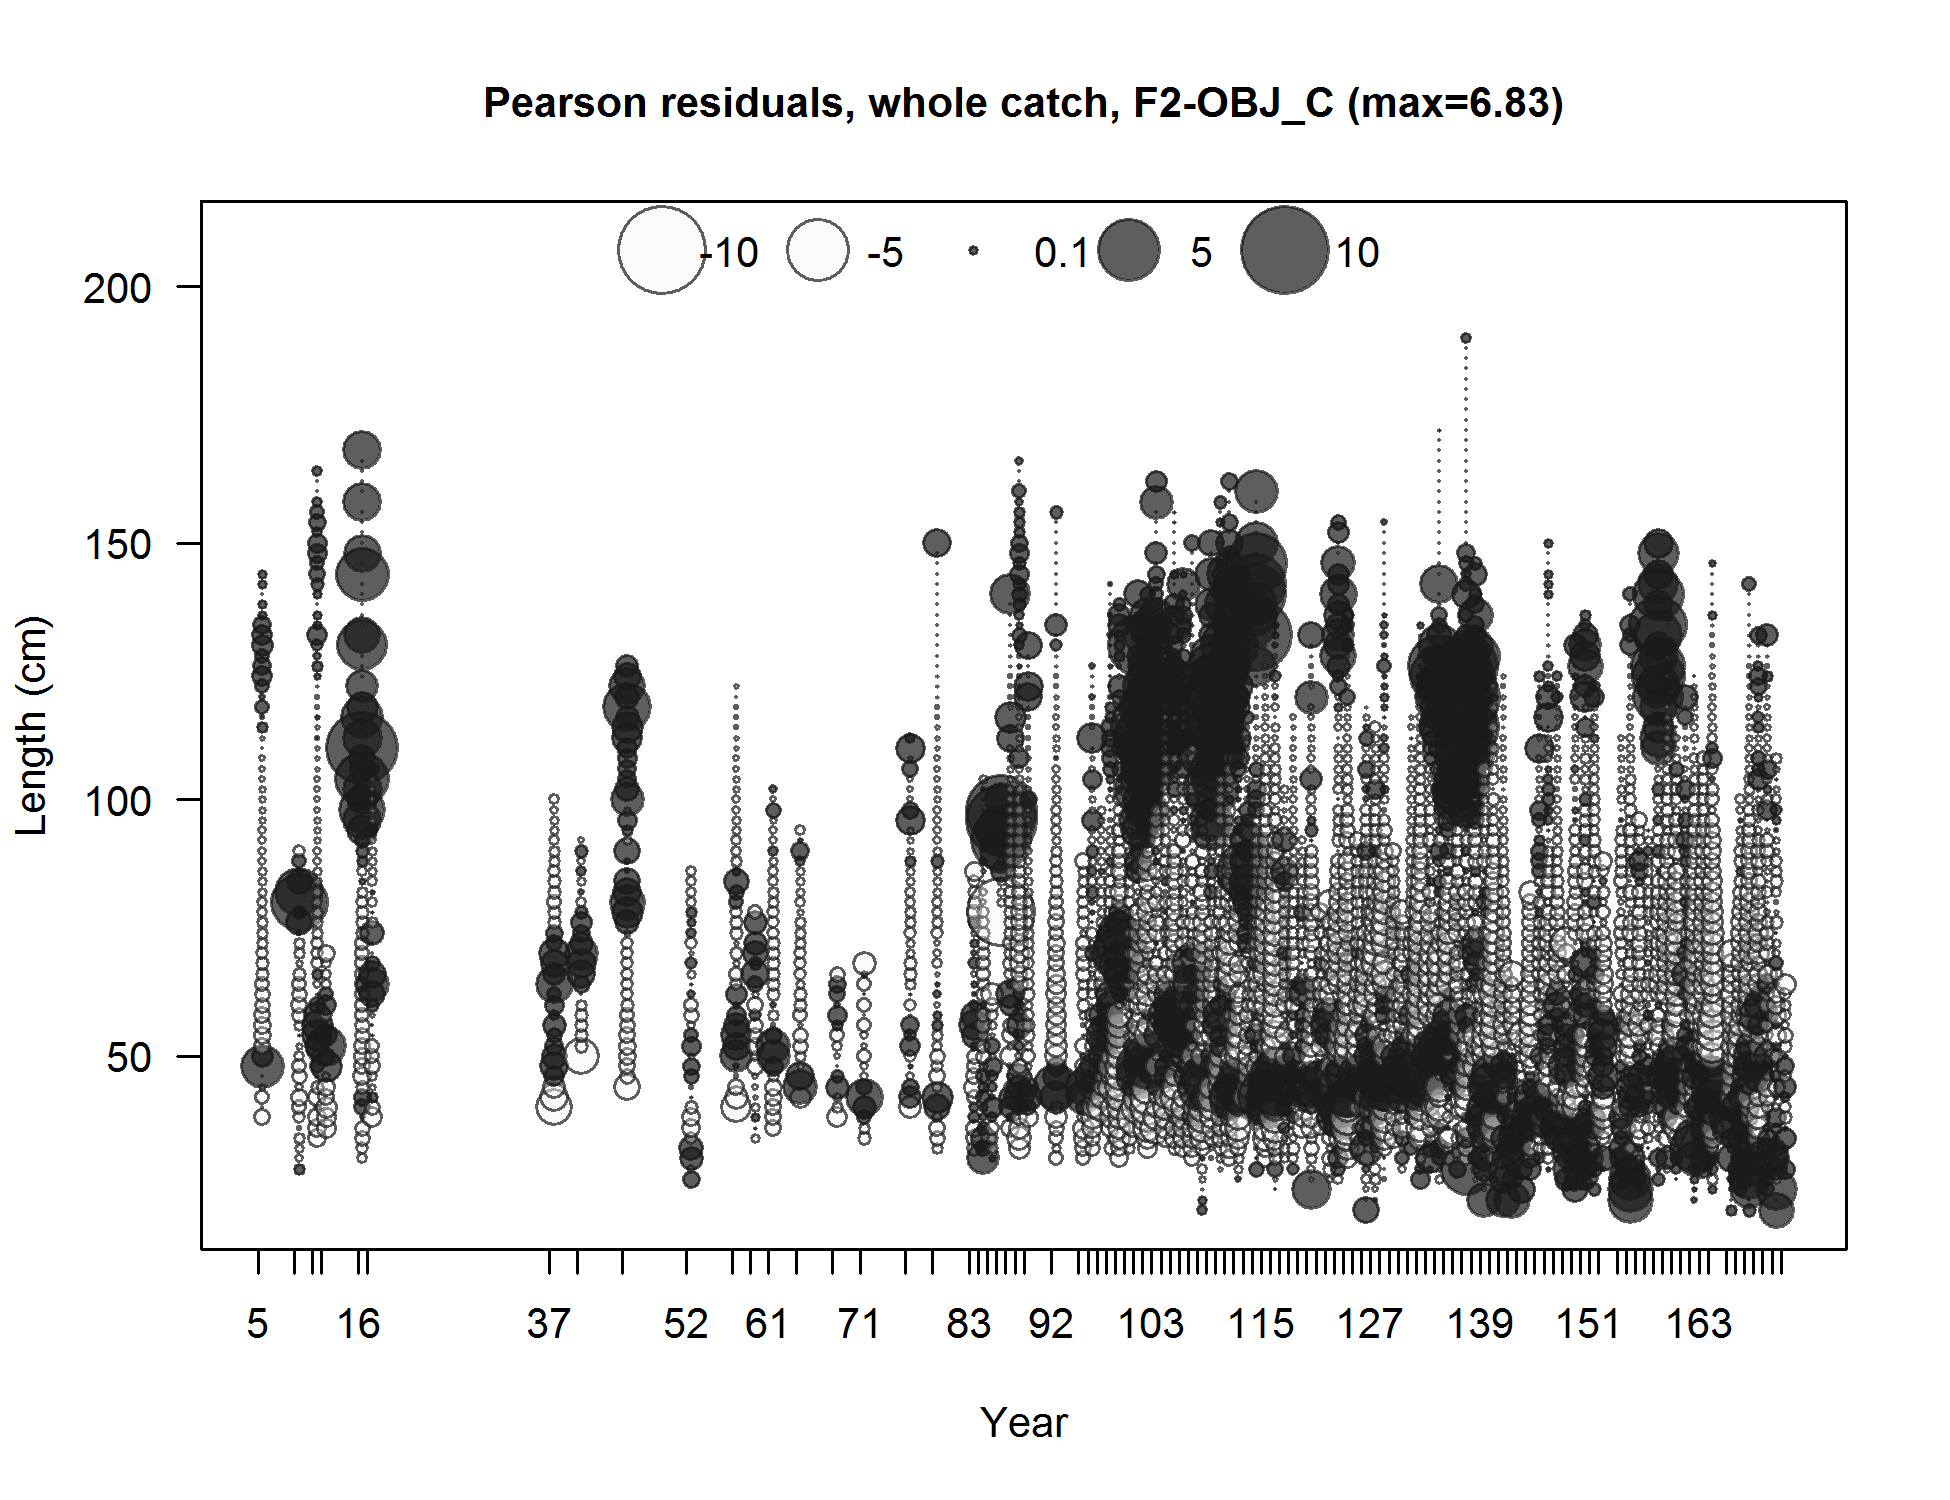
Pearson residuals, whole catch, F2-OBJ_C (max=6.83) (plot 7 of 7)
Closed bubbles are positive residuals (observed > expected) and open bubbles are negative residuals (observed < expected).
file: comp_lenfit_residsflt2mkt0_page7.png
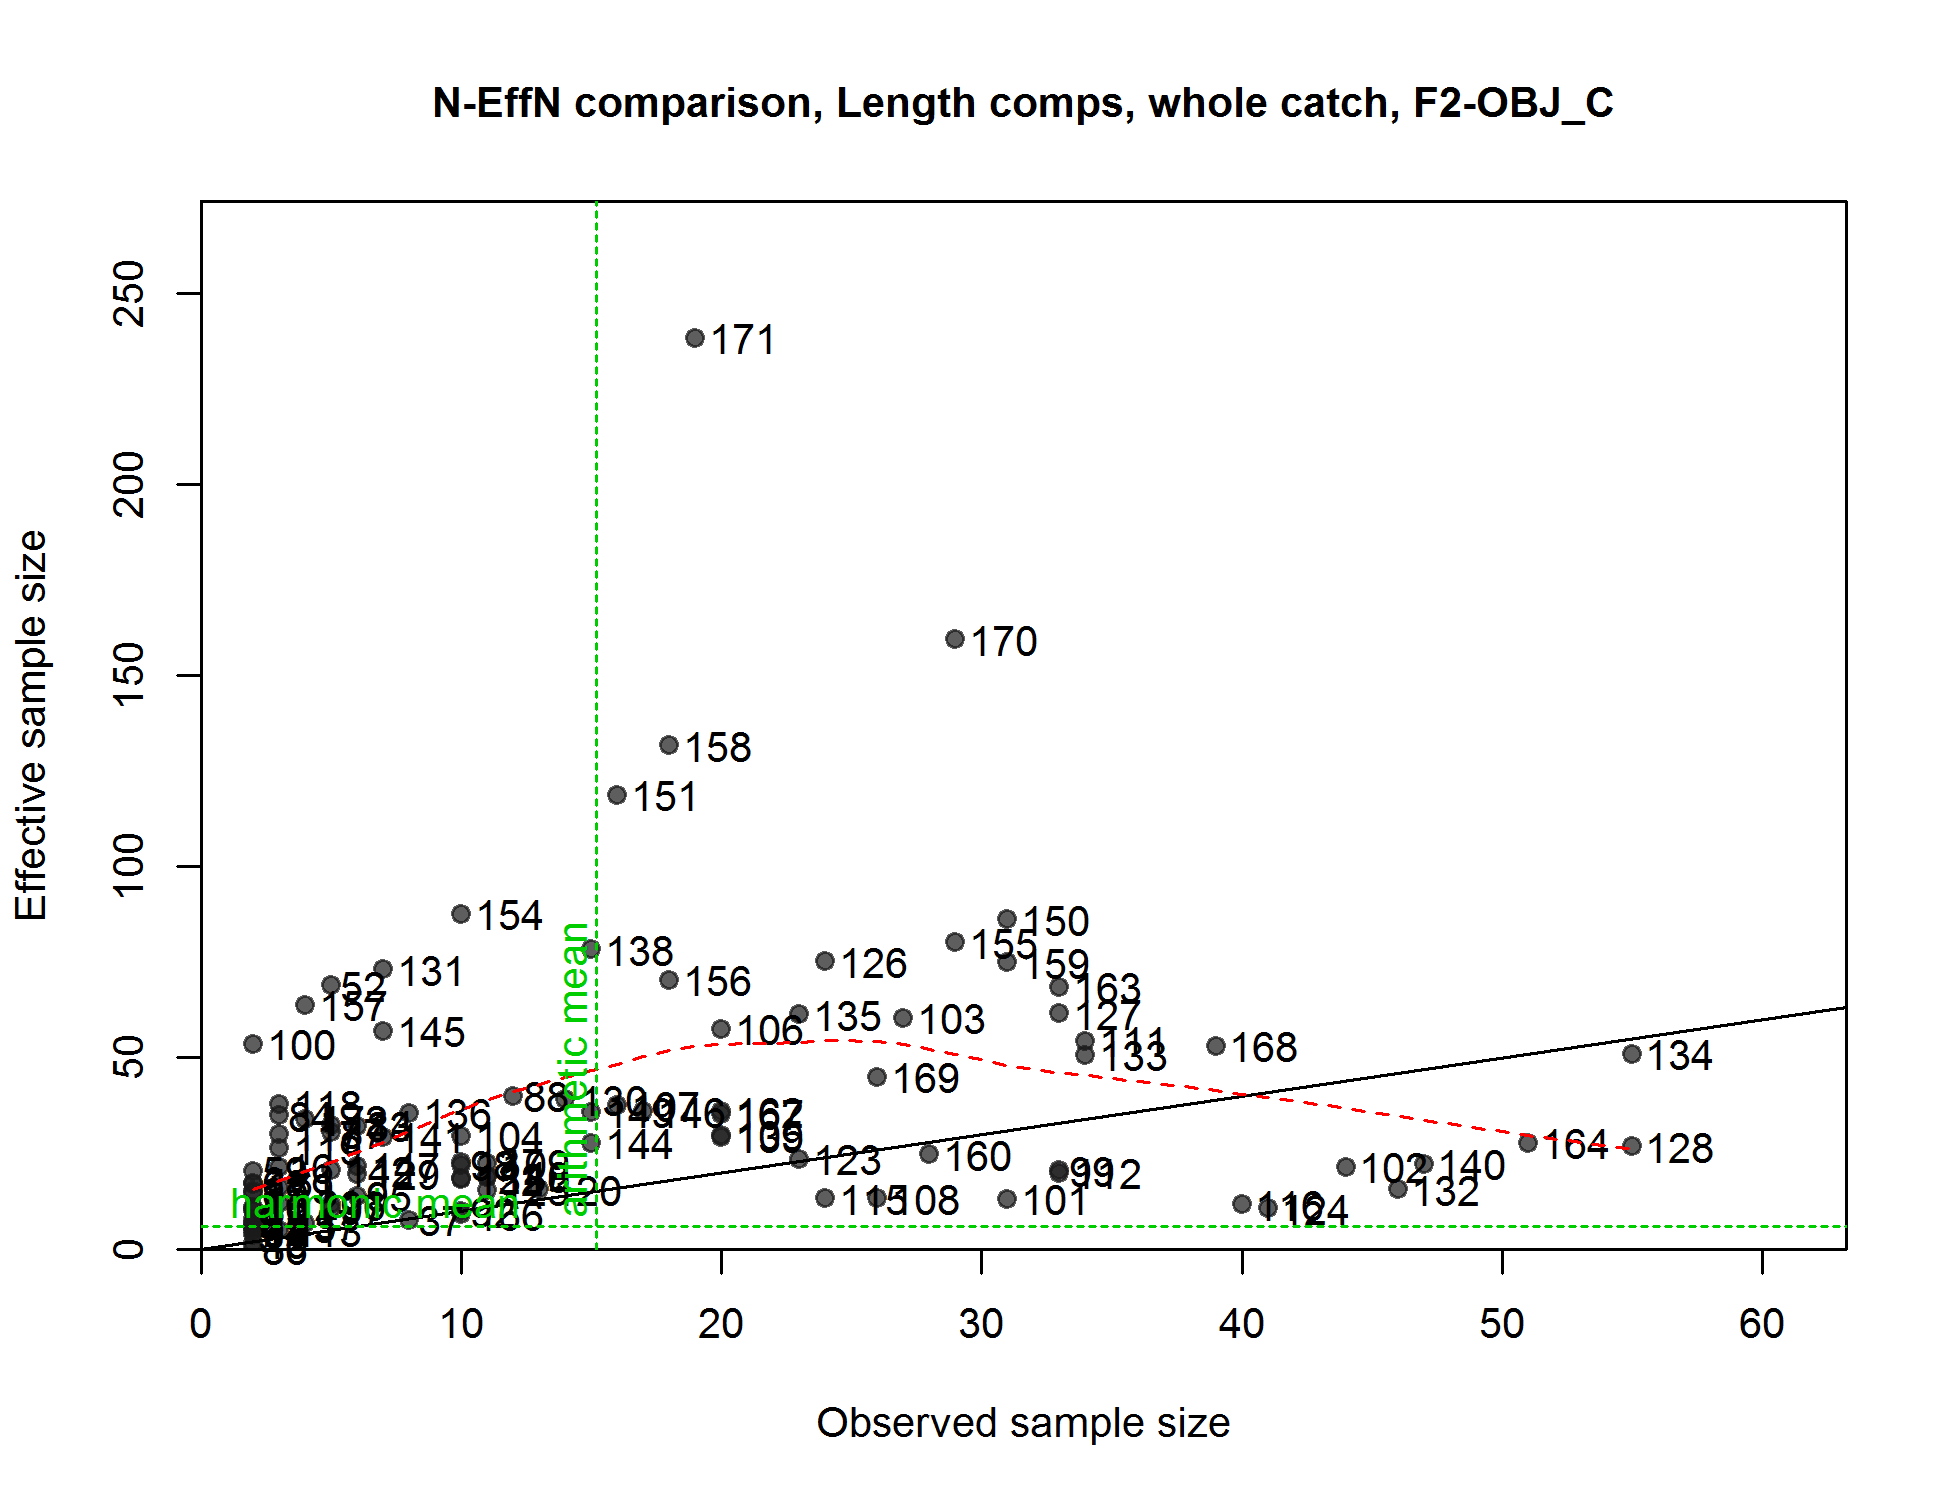
N-EffN comparison, Length comps, whole catch, F2-OBJ_C
file: comp_lenfit_sampsize_flt2mkt0.png
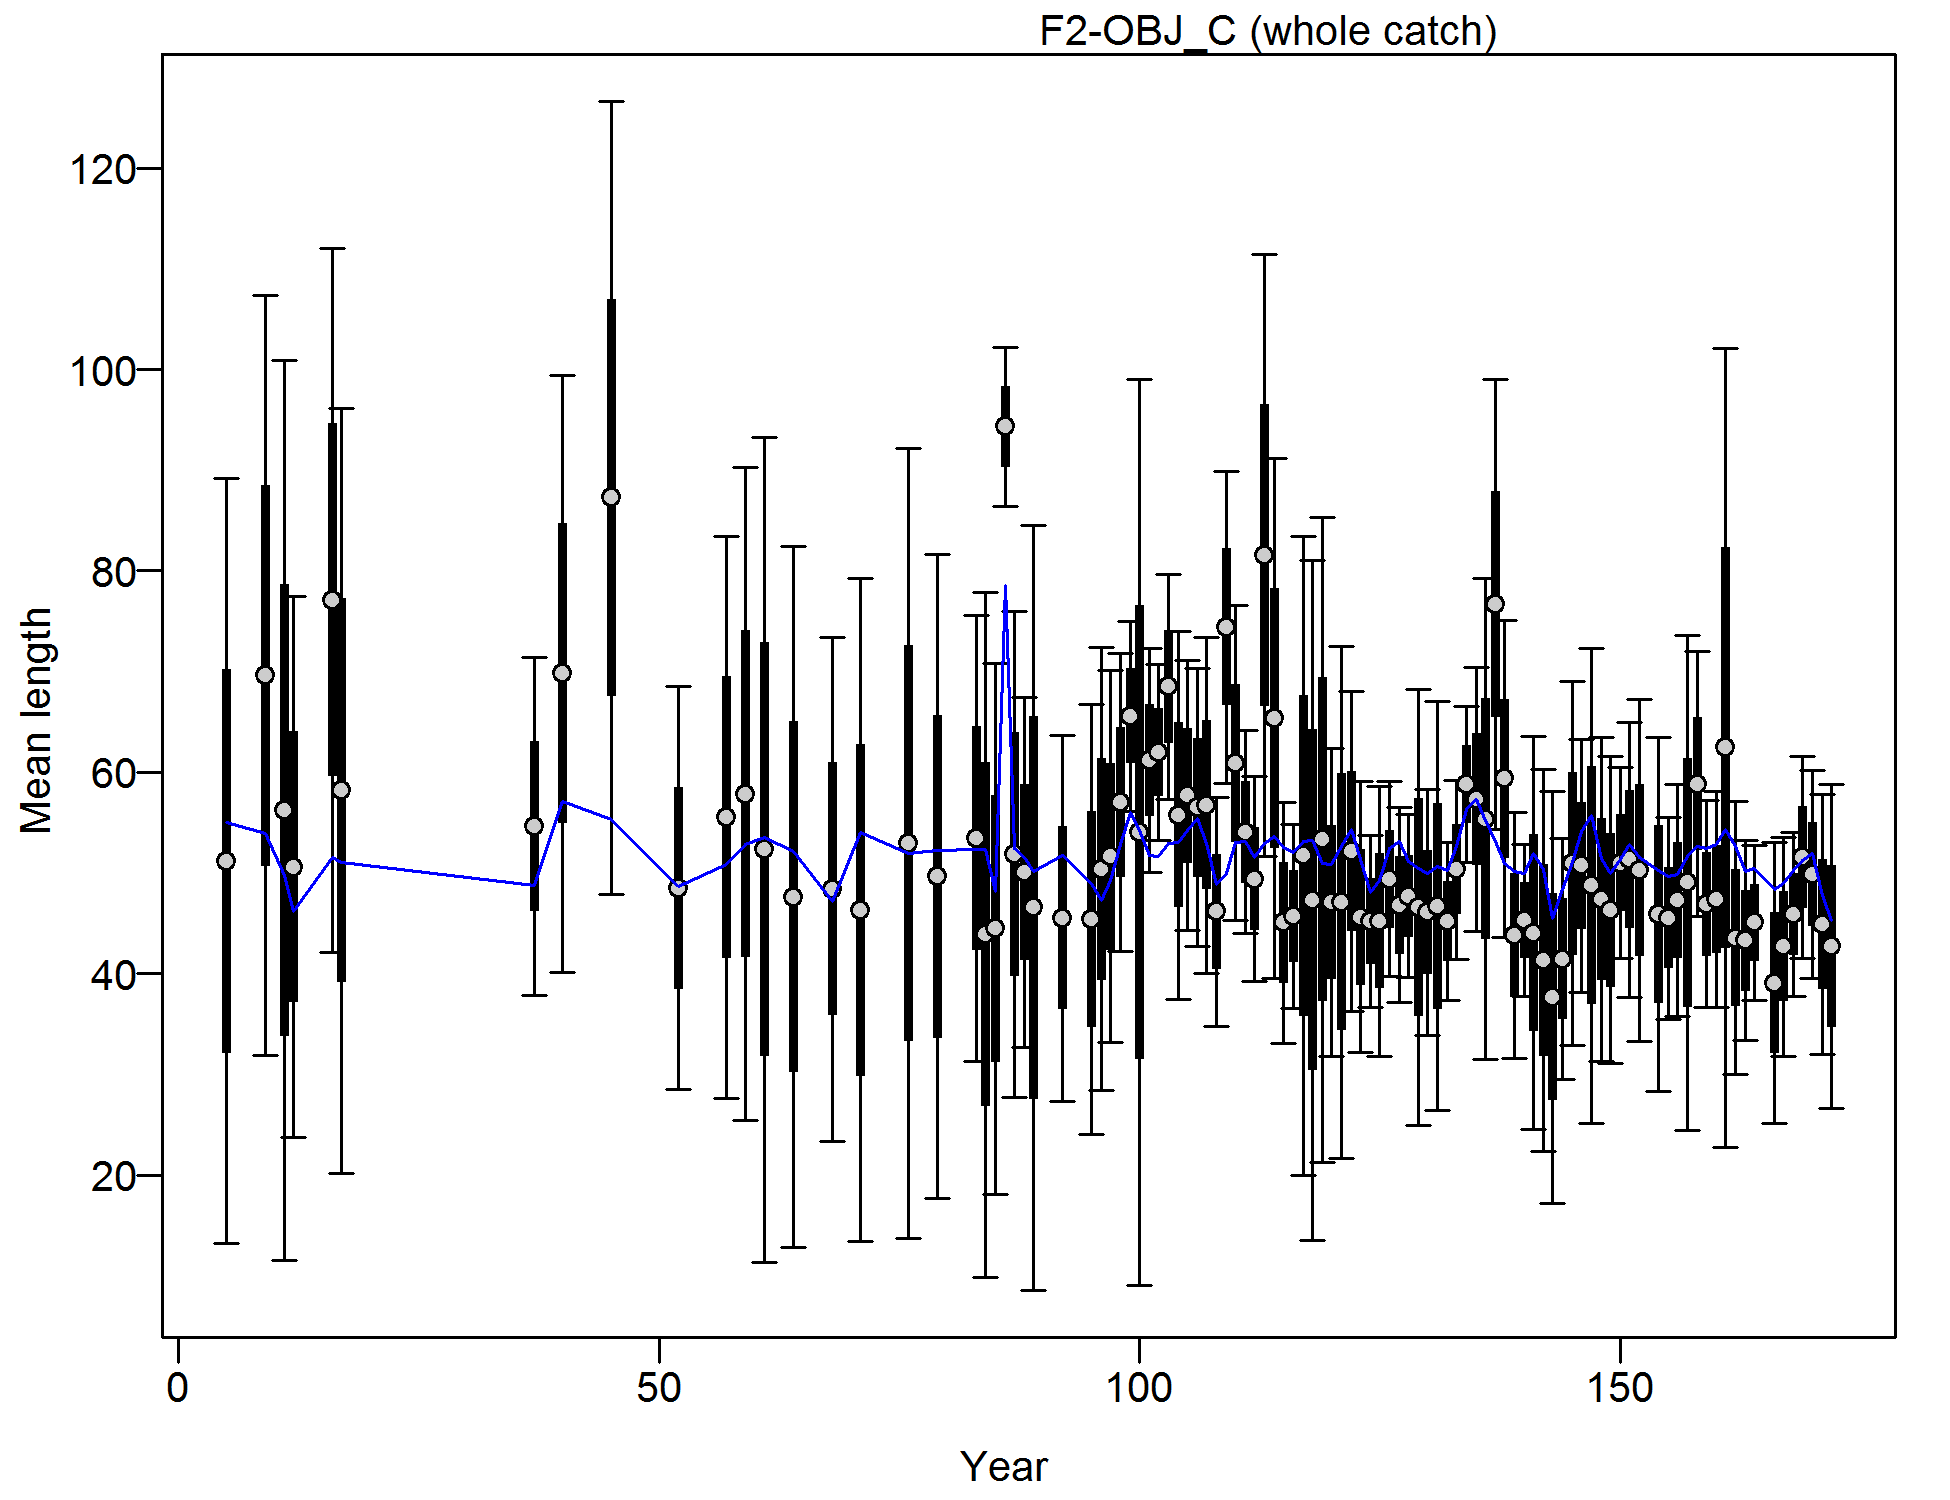
Mean length for F2-OBJ_C with 95% confidence intervals based on current samples sizes.
Francis data weighting method TA1.8: thinner intervals (with capped ends) show result of further adjusting sample sizes based on suggested multiplier (with 95% interval) for len data from F2-OBJ_C:
0.2517 (0.1744-0.409)
For more info, see
Francis, R.I.C.C. (2011). Data weighting in statistical fisheries stock assessment models. Can. J. Fish. Aquat. Sci. 68: 1124-1138.
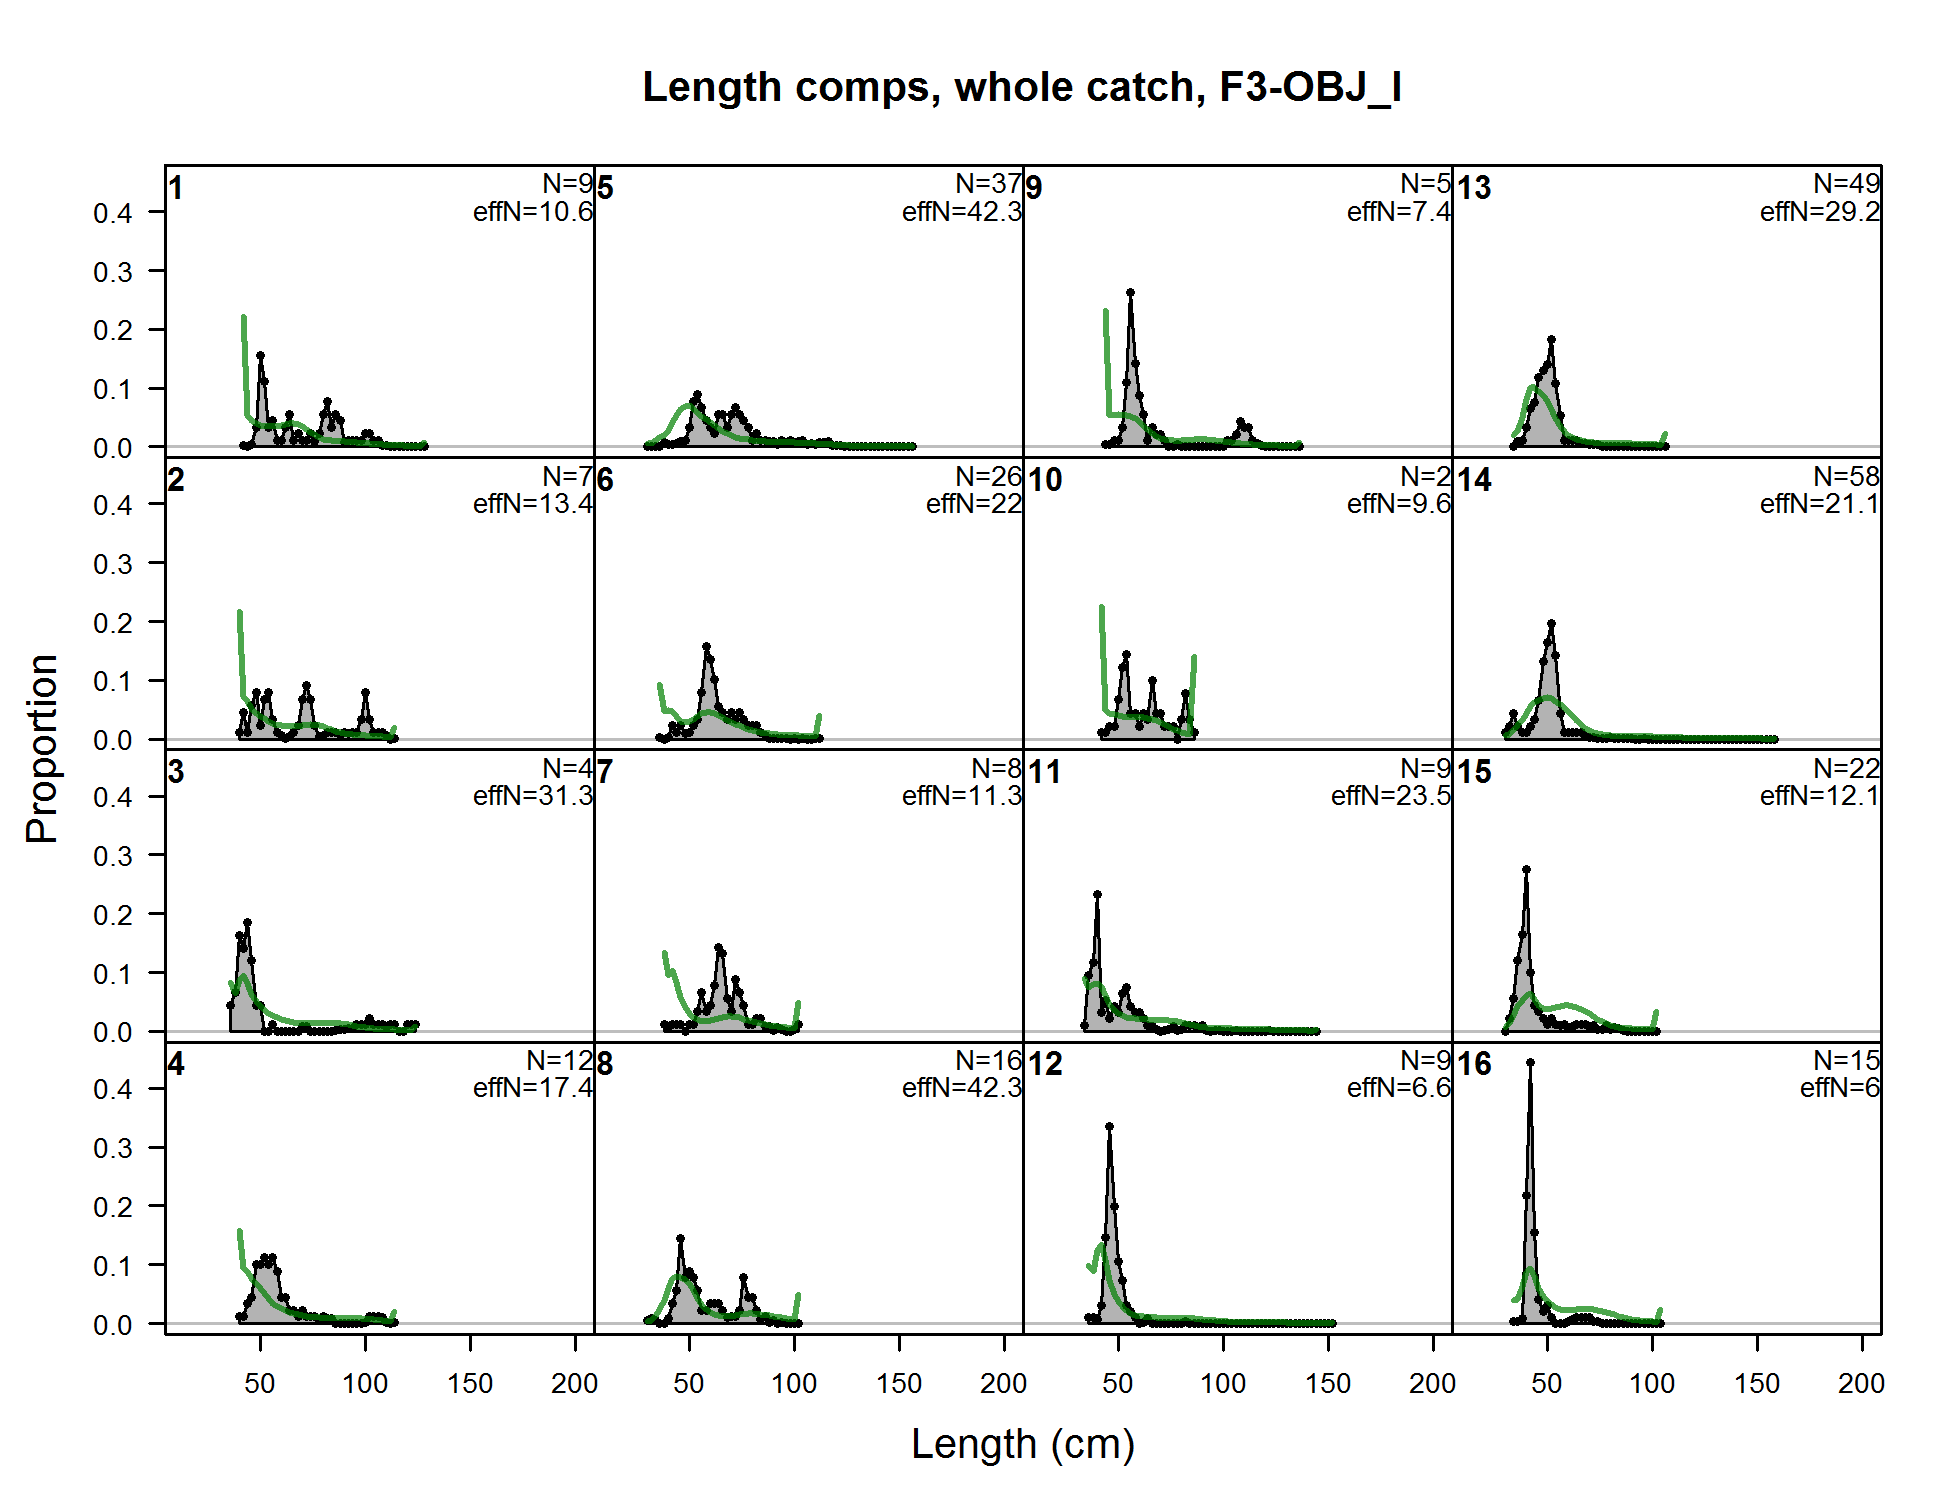
Length comps, whole catch, F3-OBJ_I (plot 1 of 9)
file: comp_lenfit_flt3mkt0_page1.png
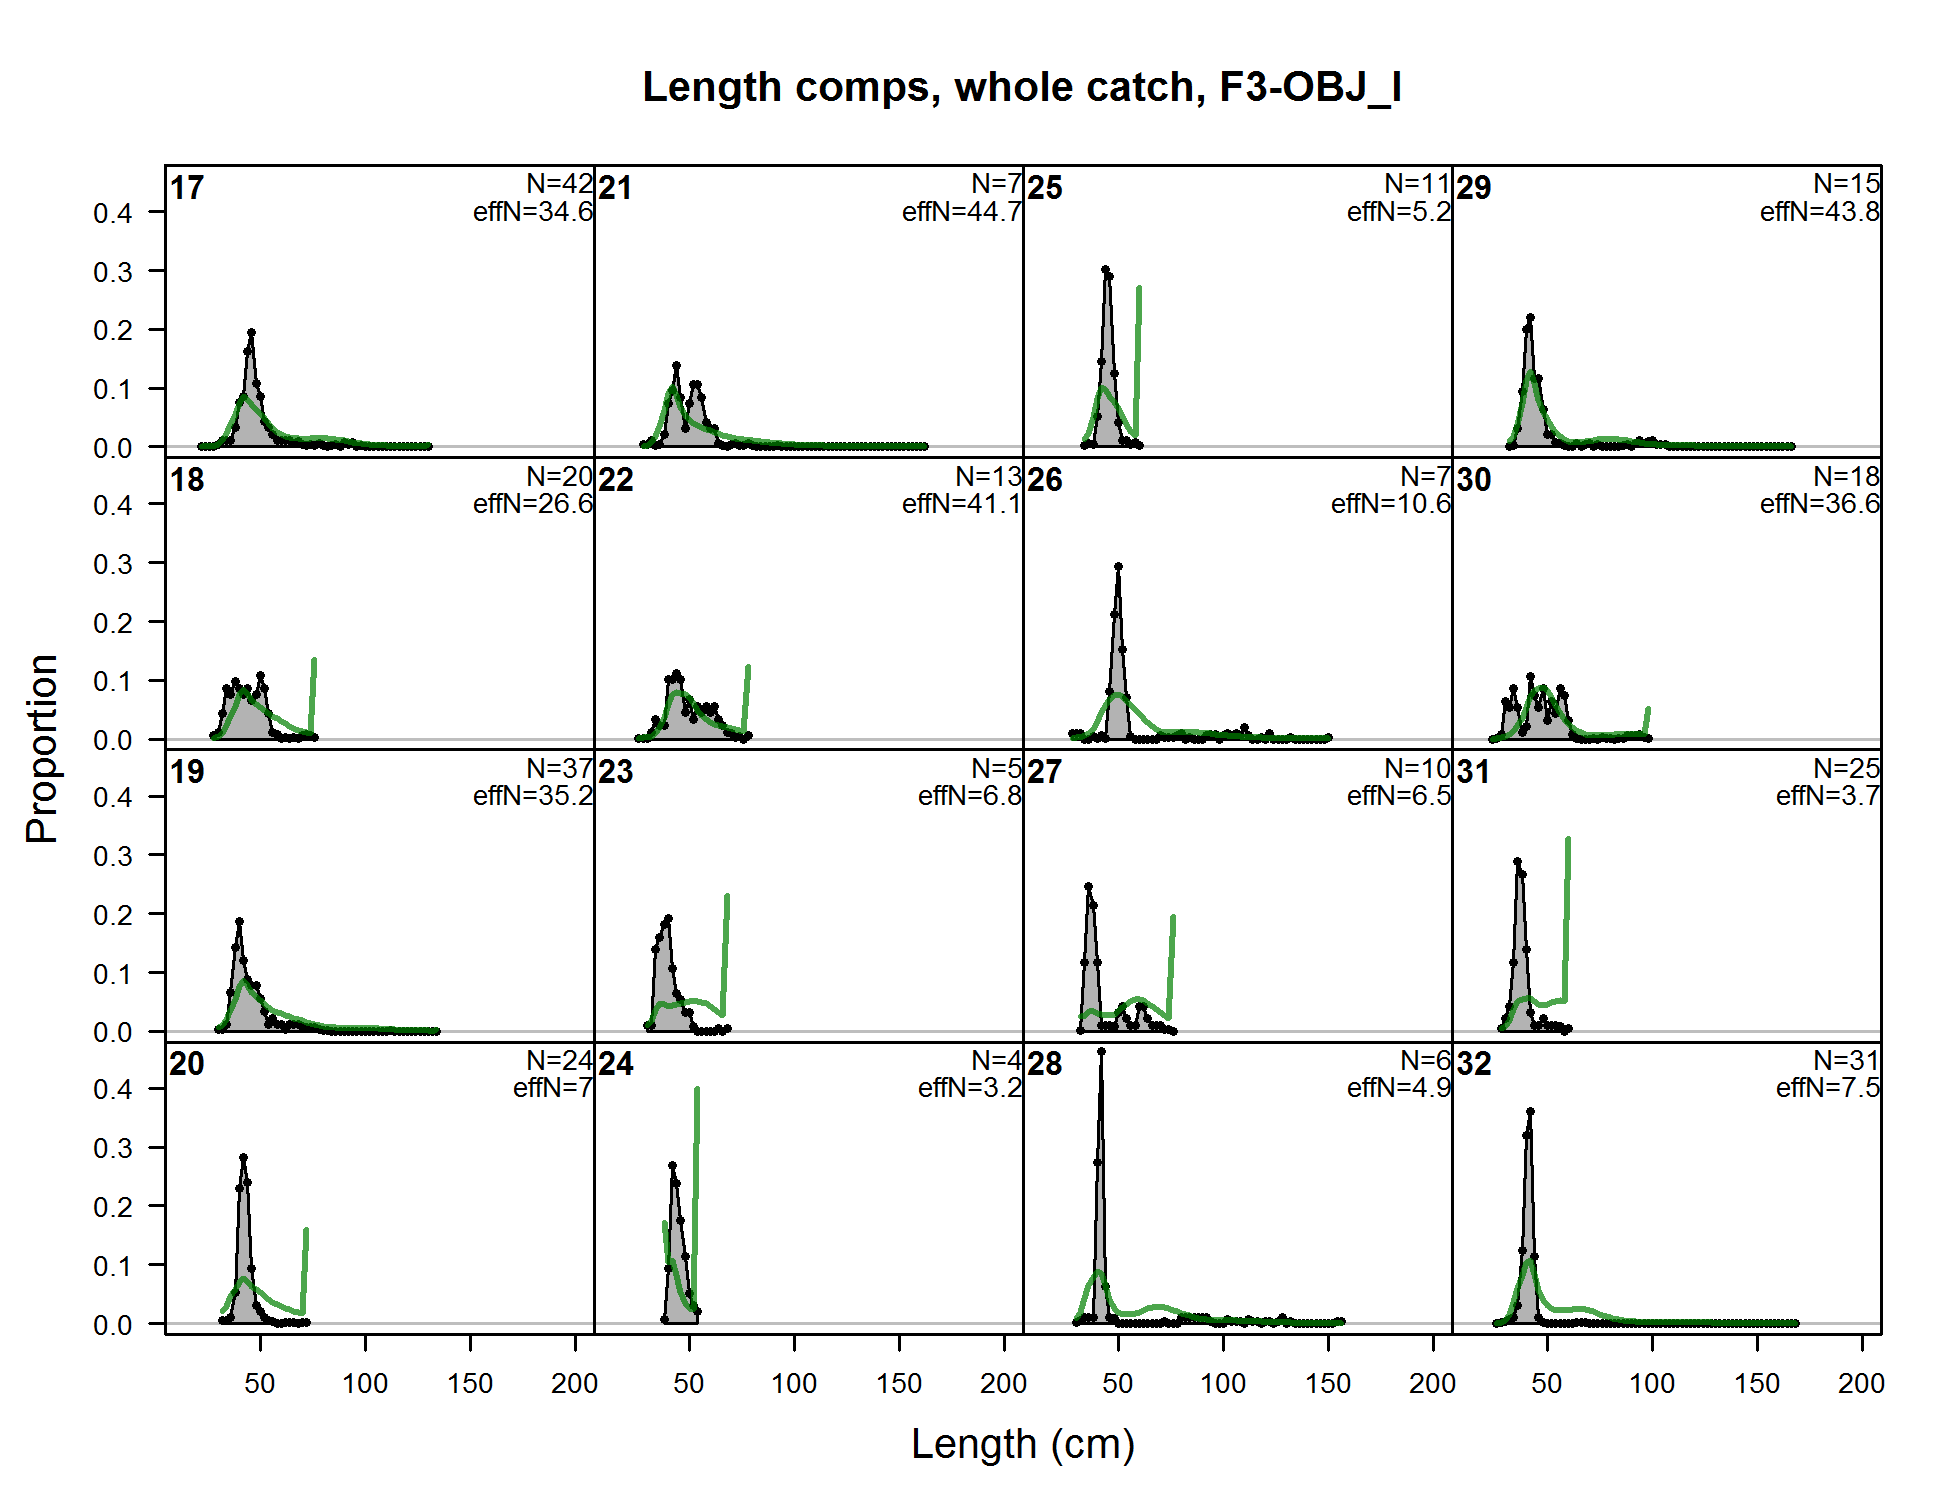
Length comps, whole catch, F3-OBJ_I (plot 1 of 9) (plot 2 of 9)
file: comp_lenfit_flt3mkt0_page2.png
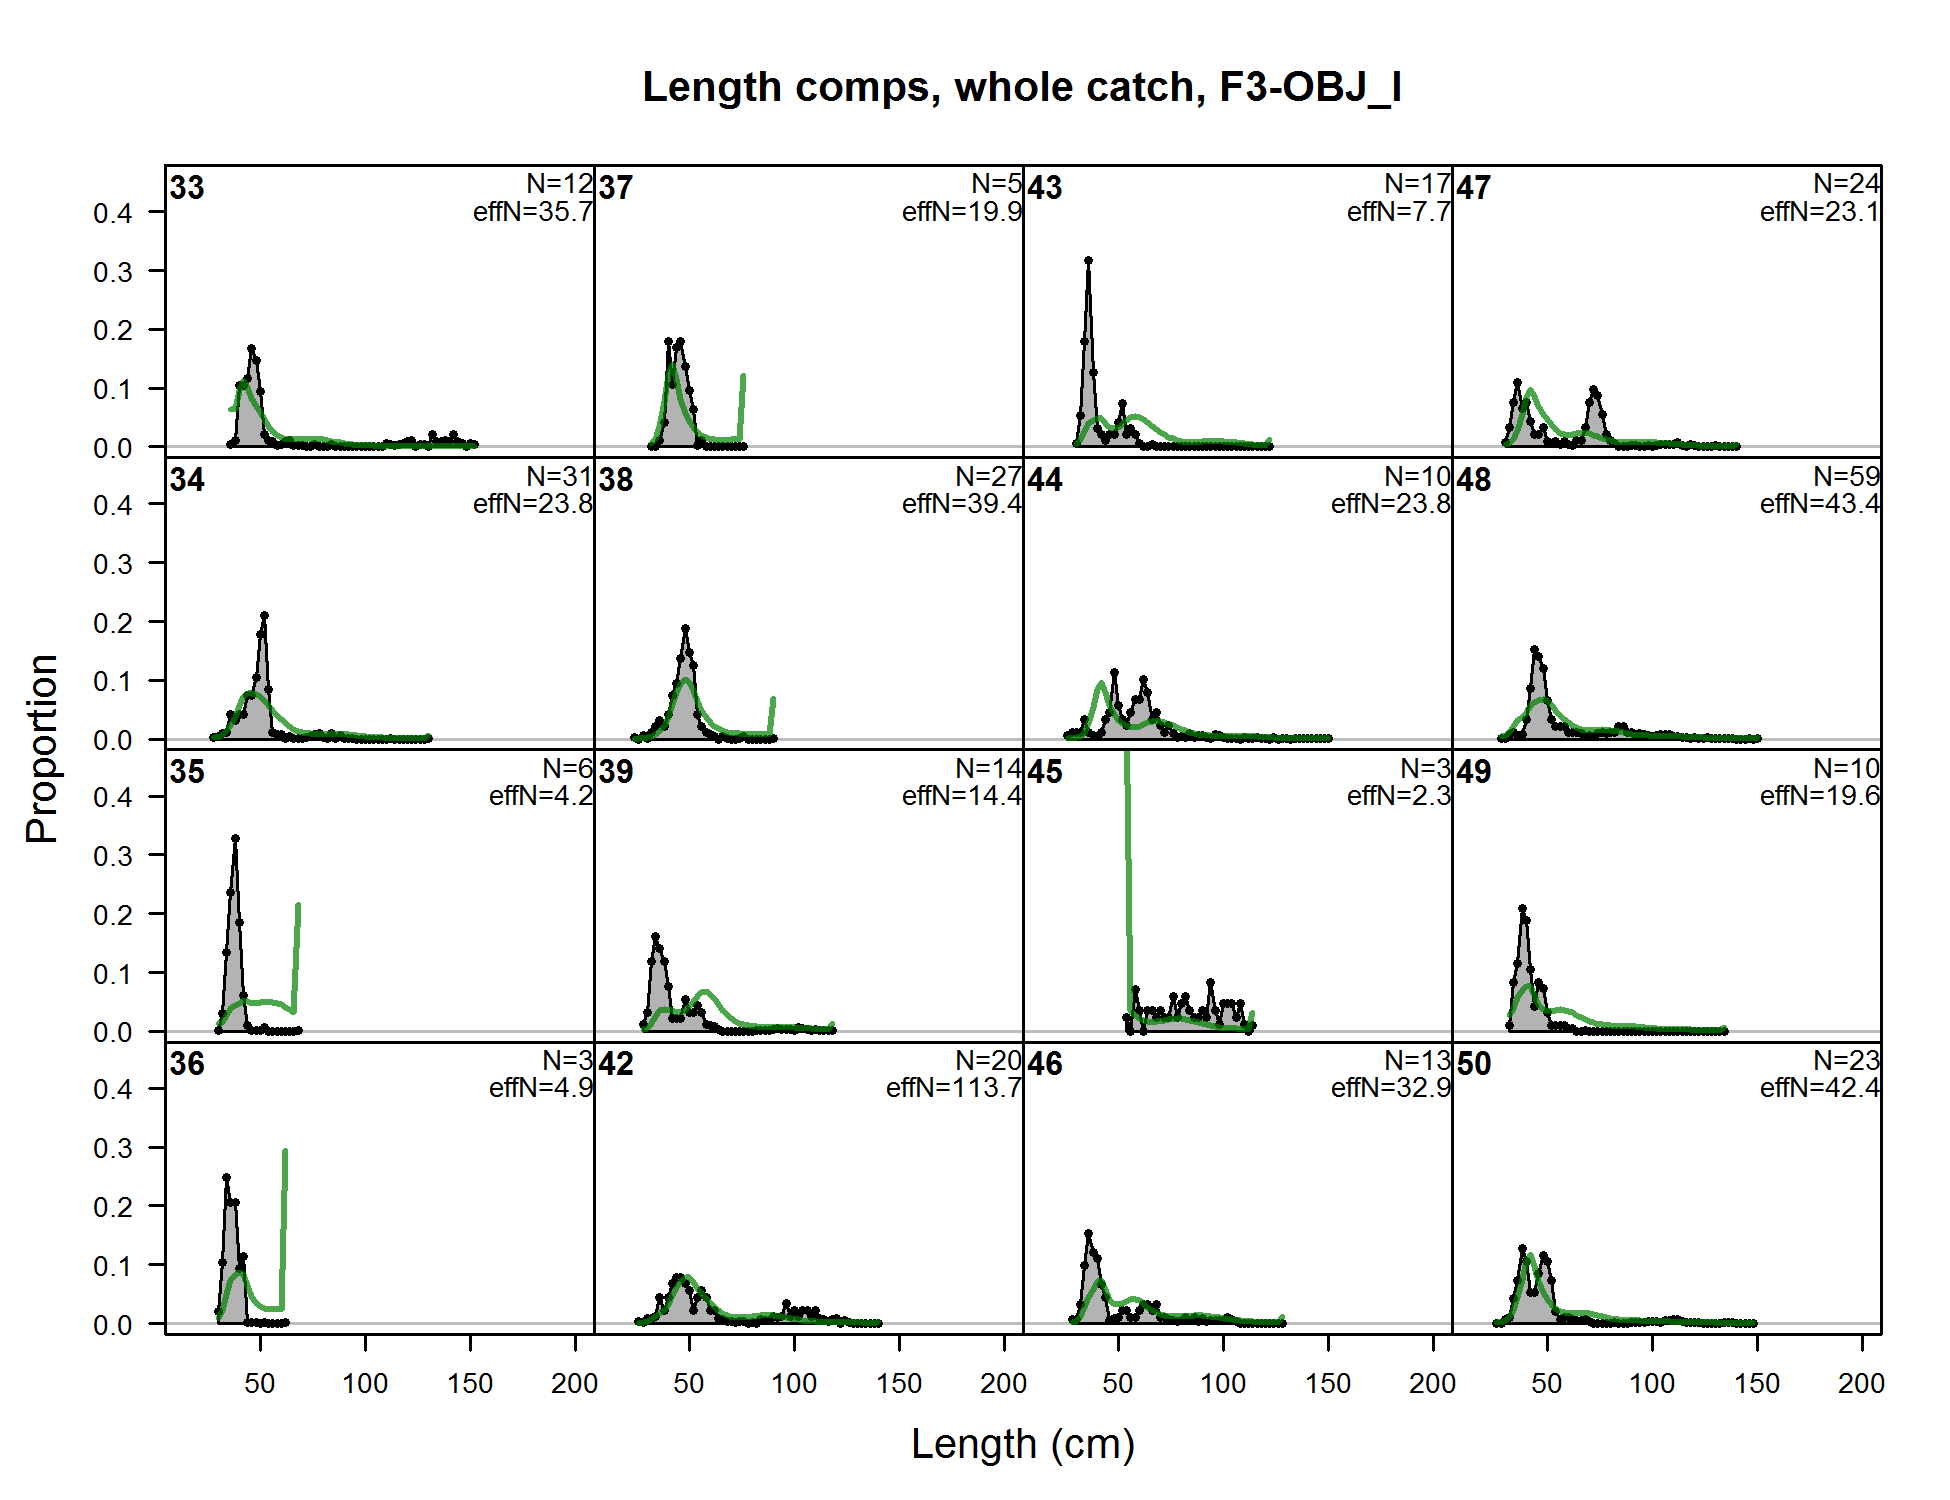
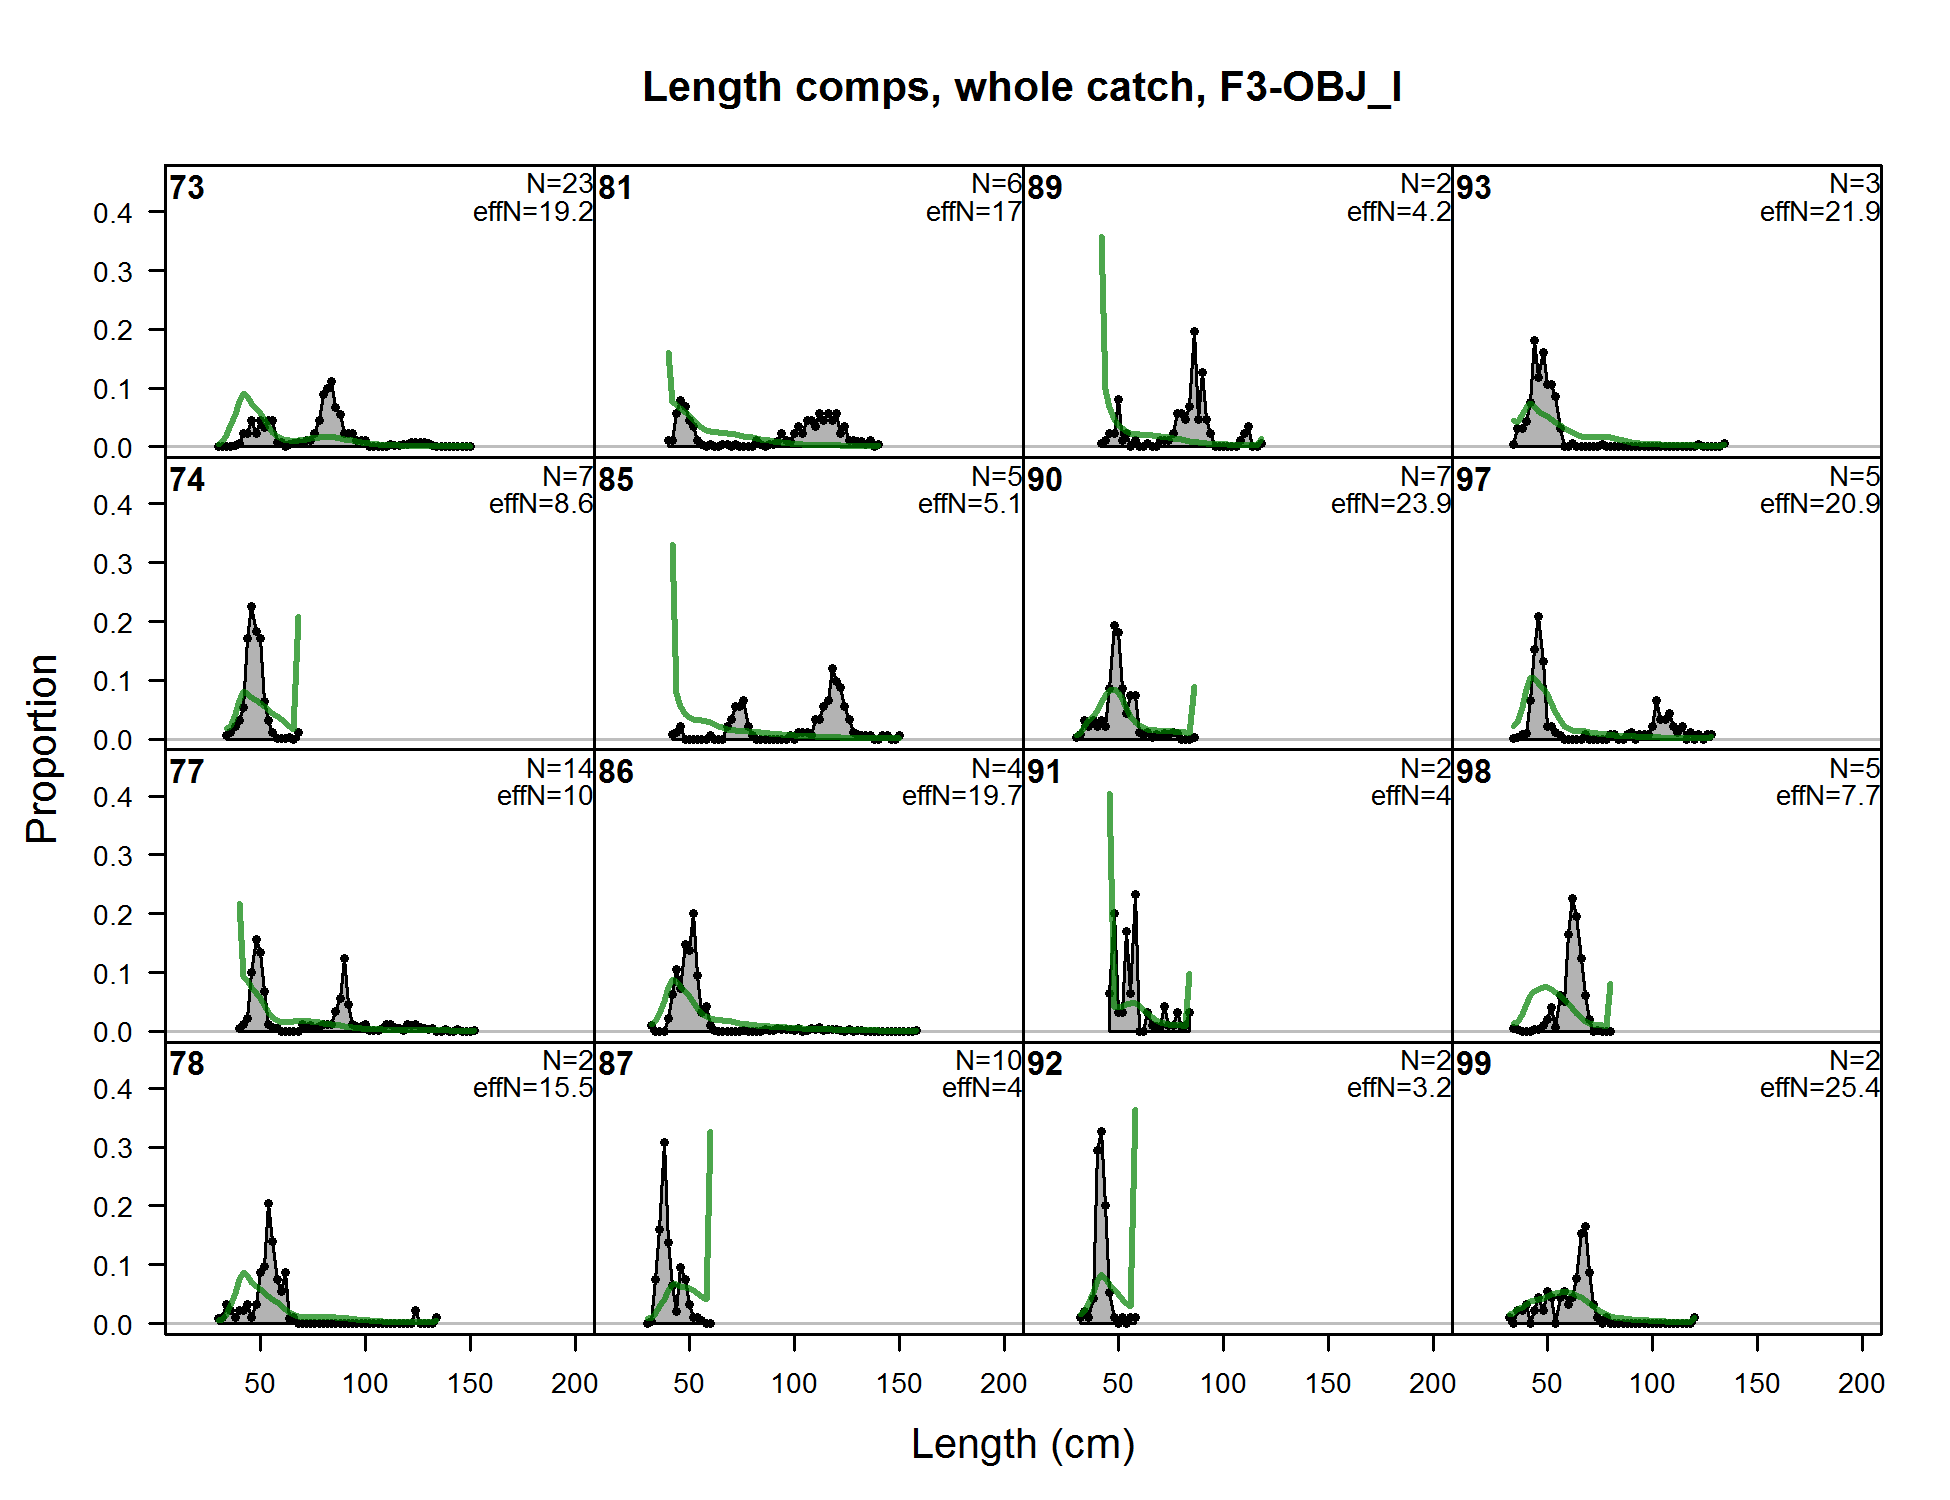
Length comps, whole catch, F3-OBJ_I (plot 1 of 9) (plot 2 of 9) (plot 3 of 9)
file: comp_lenfit_flt3mkt0_page3.png
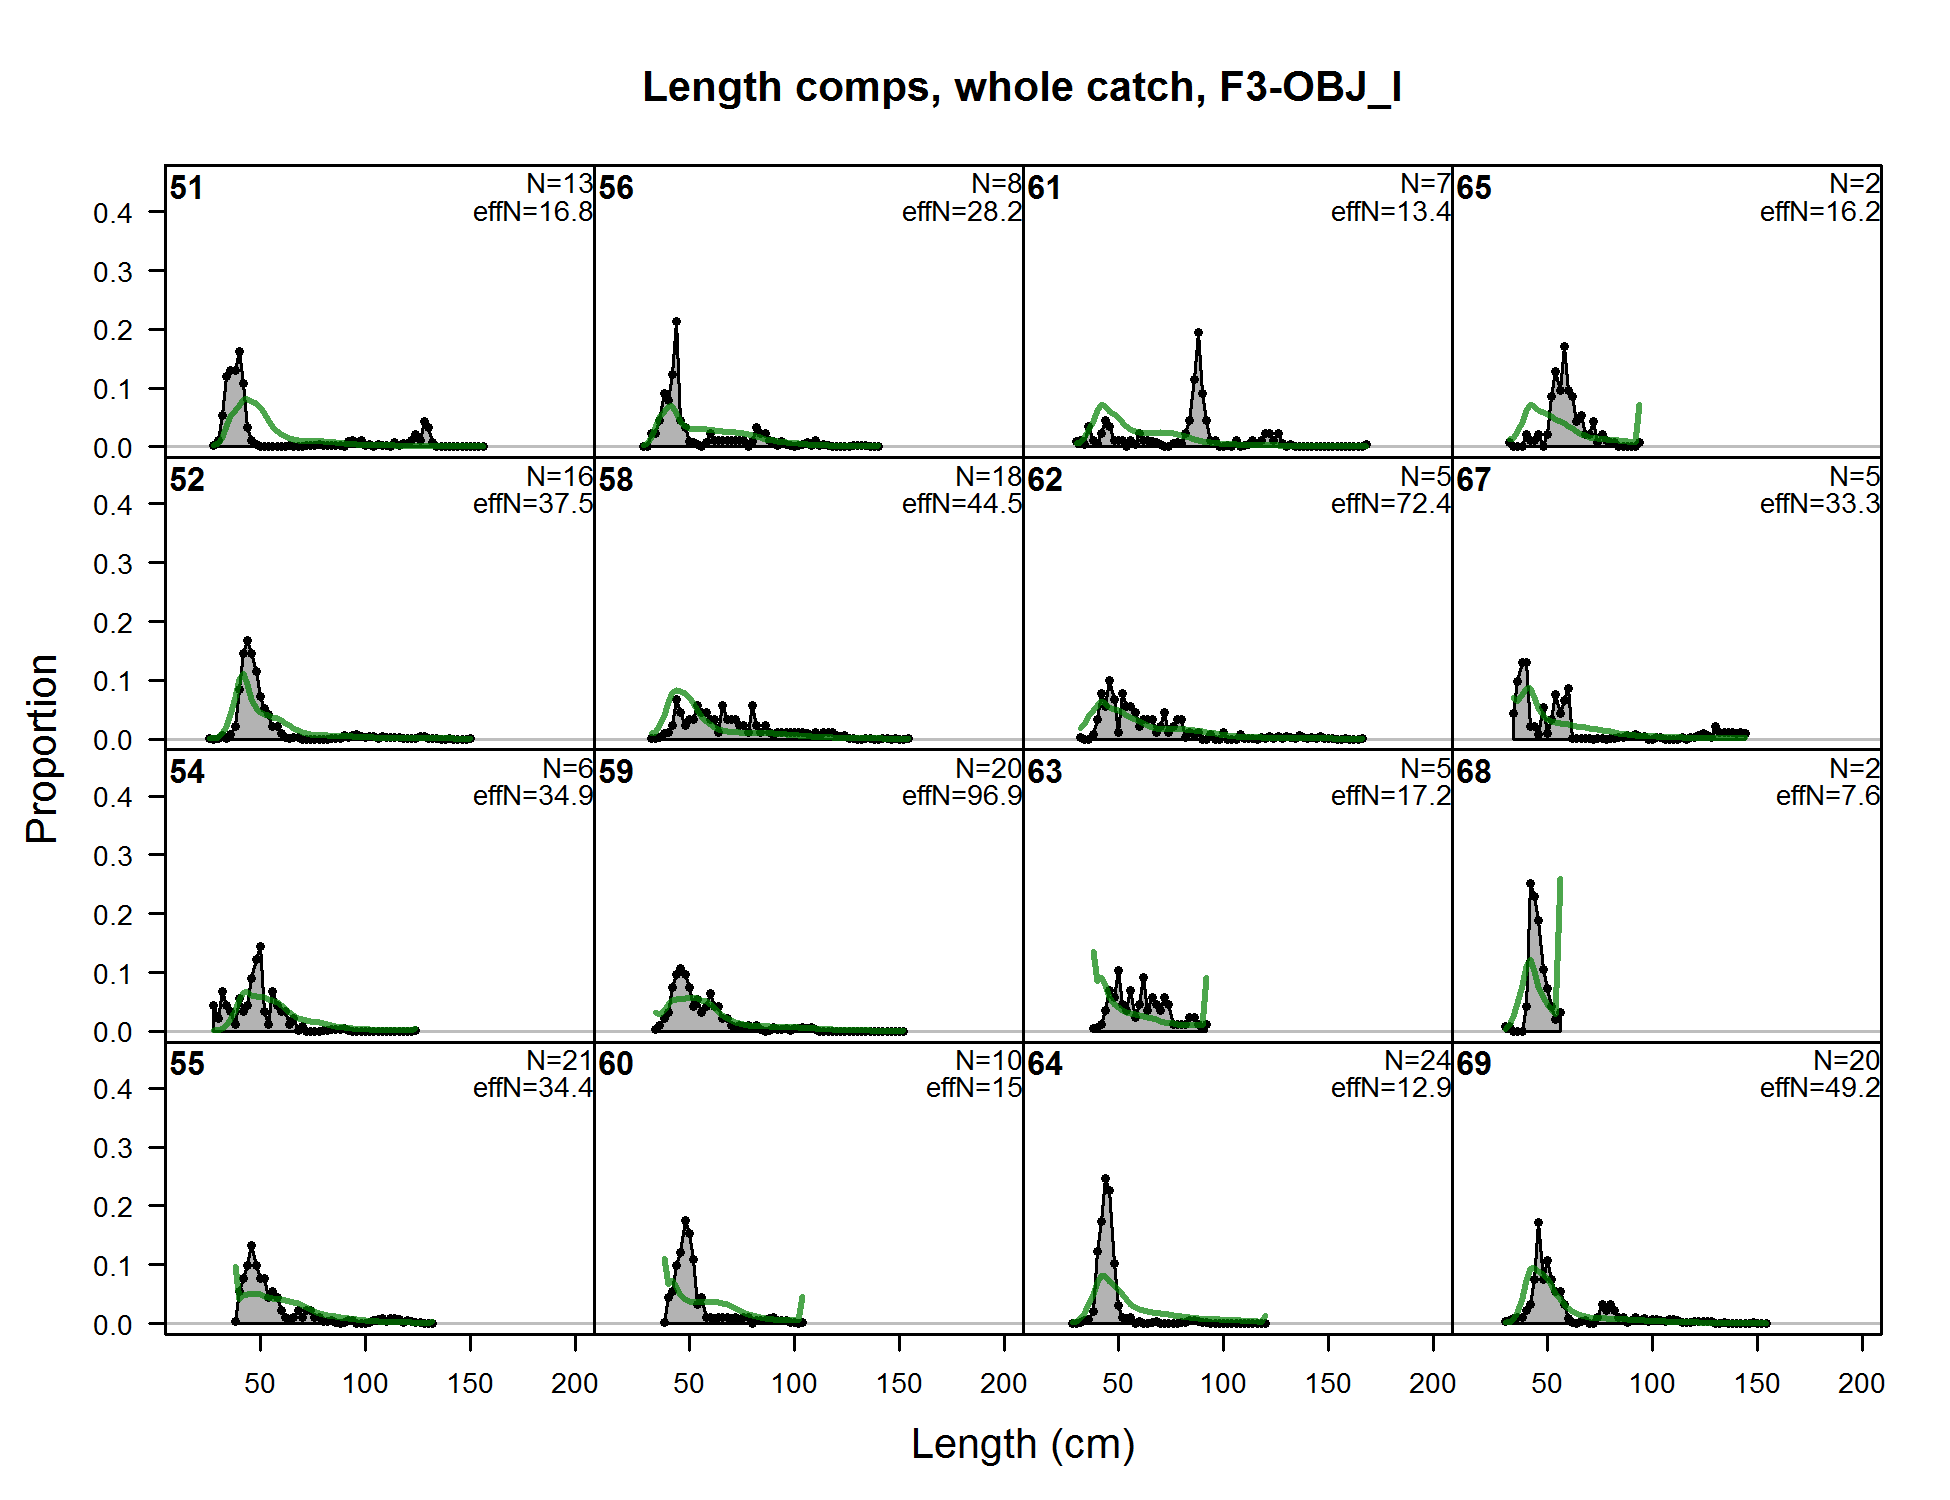
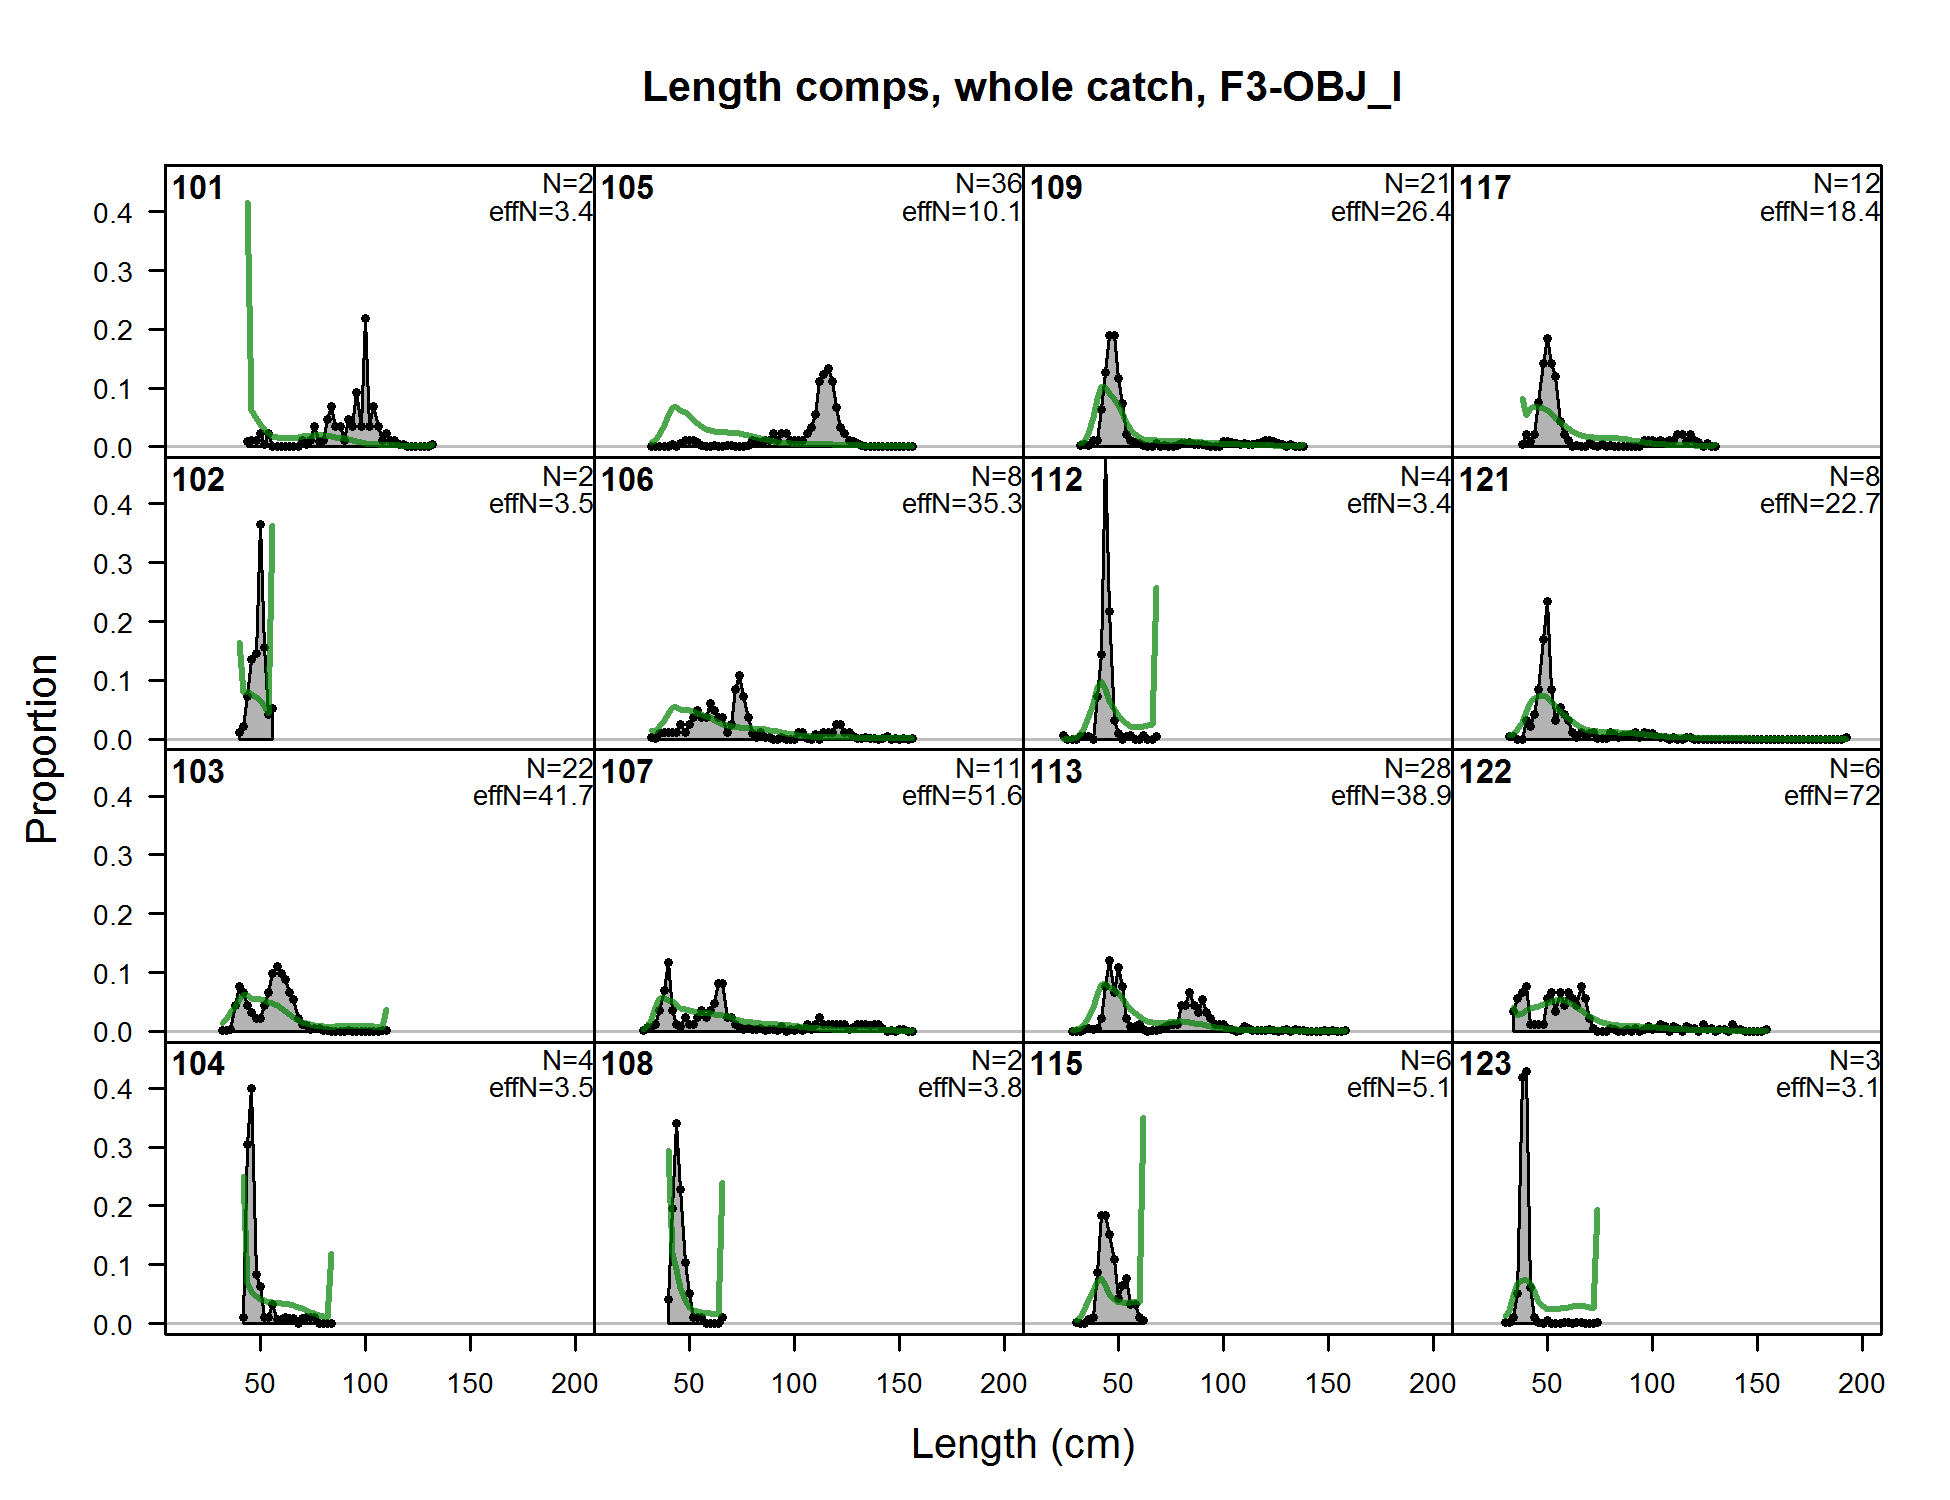
Length comps, whole catch, F3-OBJ_I (plot 1 of 9) (plot 2 of 9) (plot 3 of 9) (plot 4 of 9)
file: comp_lenfit_flt3mkt0_page4.png
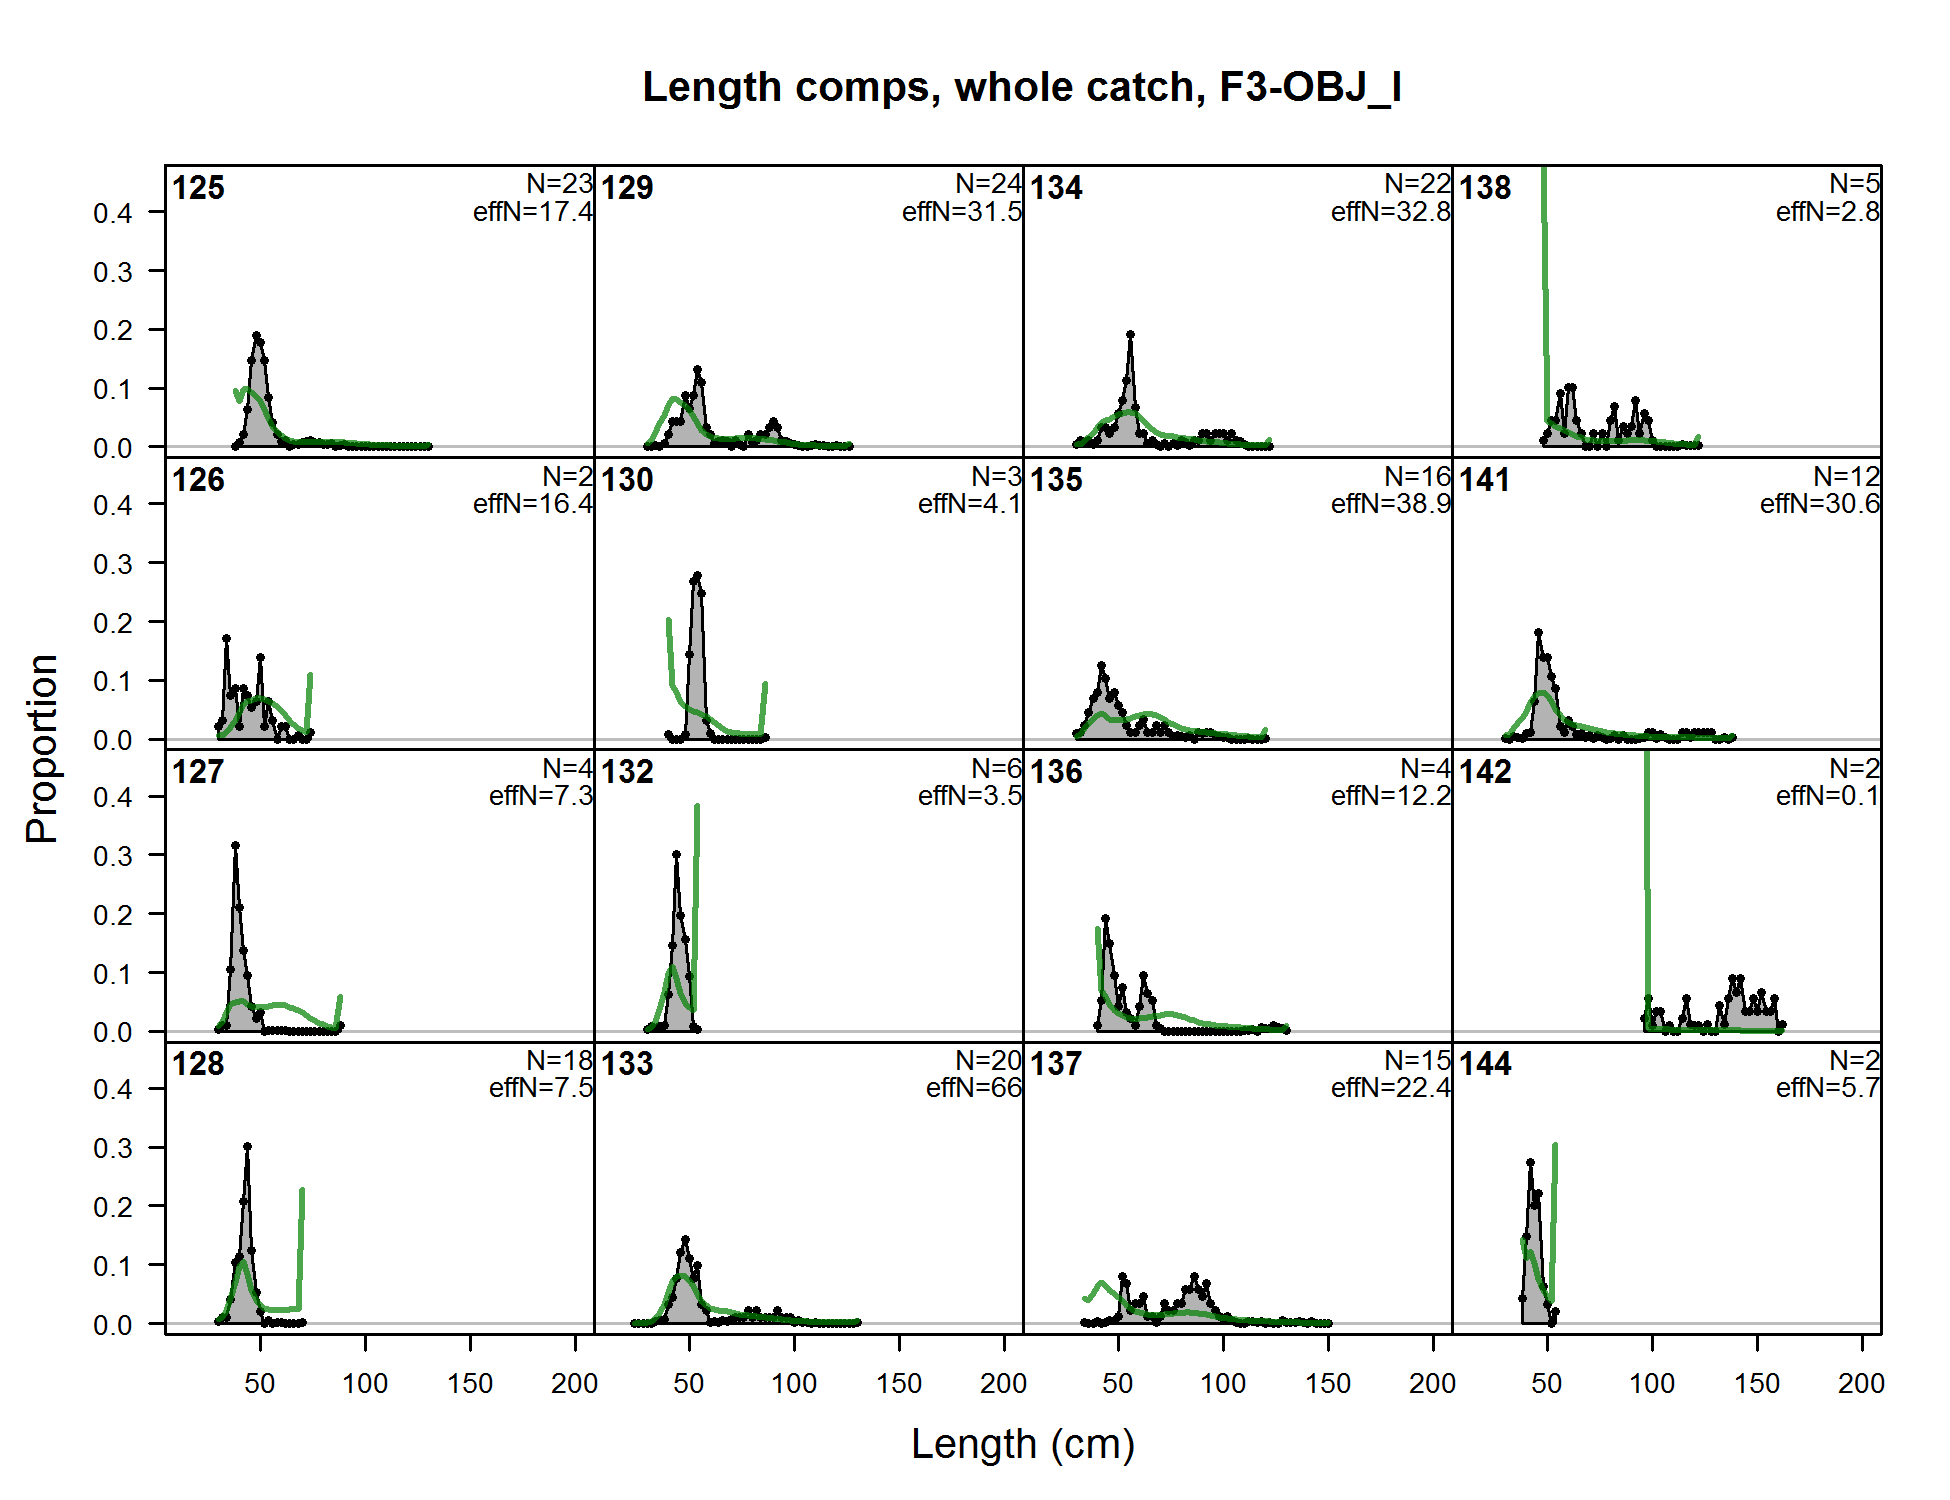
Length comps, whole catch, F3-OBJ_I (plot 1 of 9) (plot 2 of 9) (plot 3 of 9) (plot 4 of 9) (plot 5 of 9)
file: comp_lenfit_flt3mkt0_page5.png
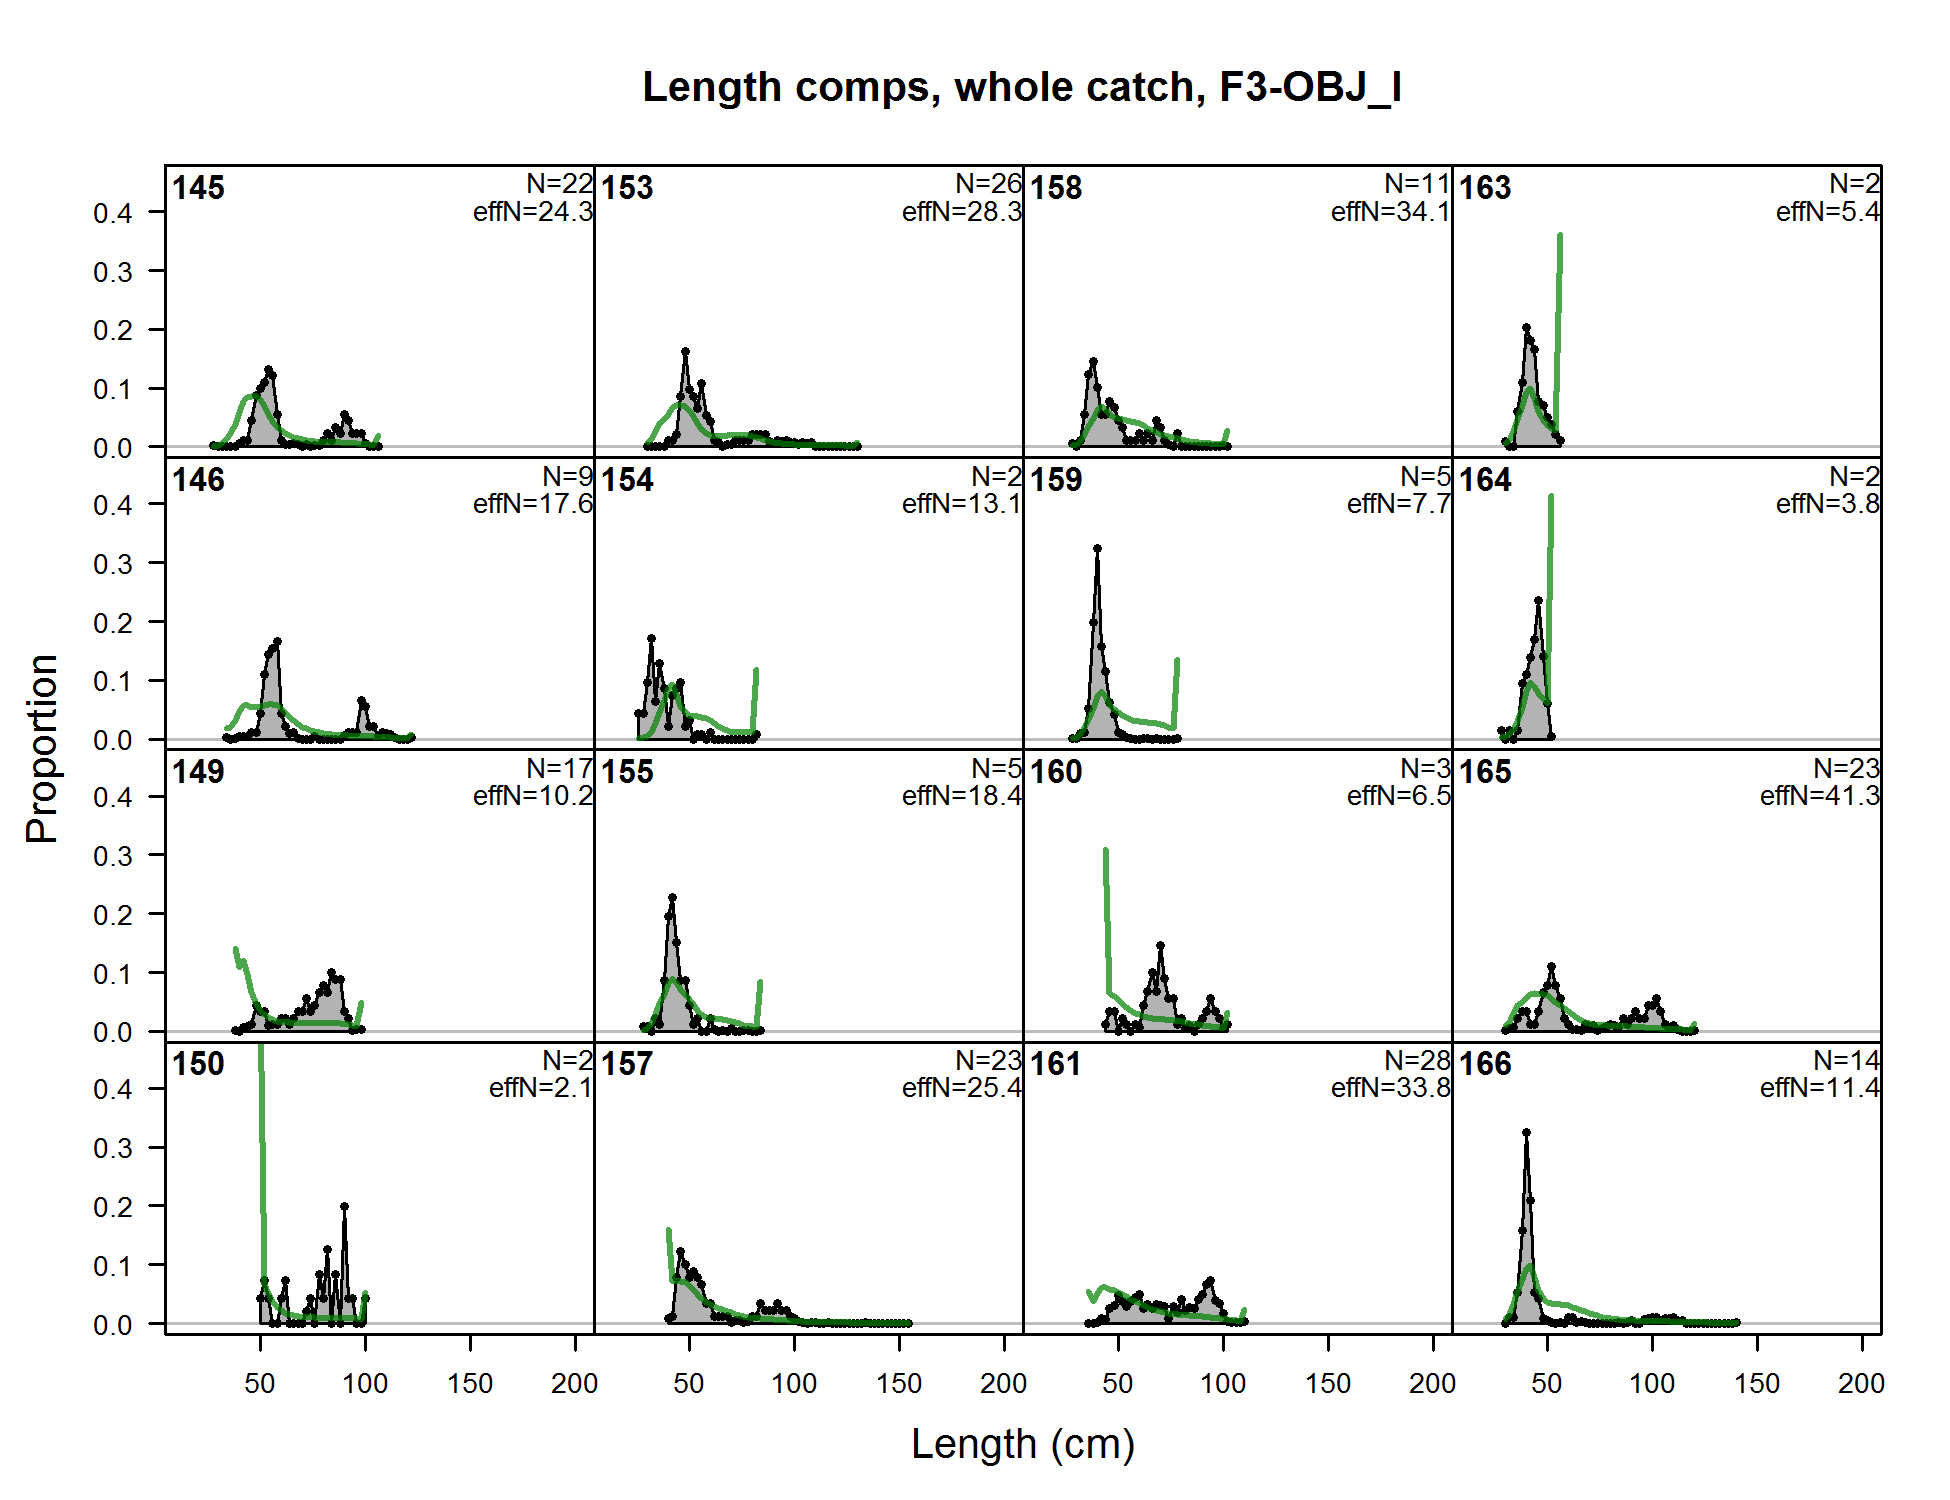
Length comps, whole catch, F3-OBJ_I (plot 1 of 9) (plot 2 of 9) (plot 3 of 9) (plot 4 of 9) (plot 5 of 9) (plot 6 of 9)
file: comp_lenfit_flt3mkt0_page6.png
Length comps, whole catch, F3-OBJ_I (plot 1 of 9) (plot 2 of 9) (plot 3 of 9) (plot 4 of 9) (plot 5 of 9) (plot 6 of 9) (plot 7 of 9)
file: comp_lenfit_flt3mkt0_page7.png
Length comps, whole catch, F3-OBJ_I (plot 1 of 9) (plot 2 of 9) (plot 3 of 9) (plot 4 of 9) (plot 5 of 9) (plot 6 of 9) (plot 7 of 9) (plot 8 of 9)
file: comp_lenfit_flt3mkt0_page8.png
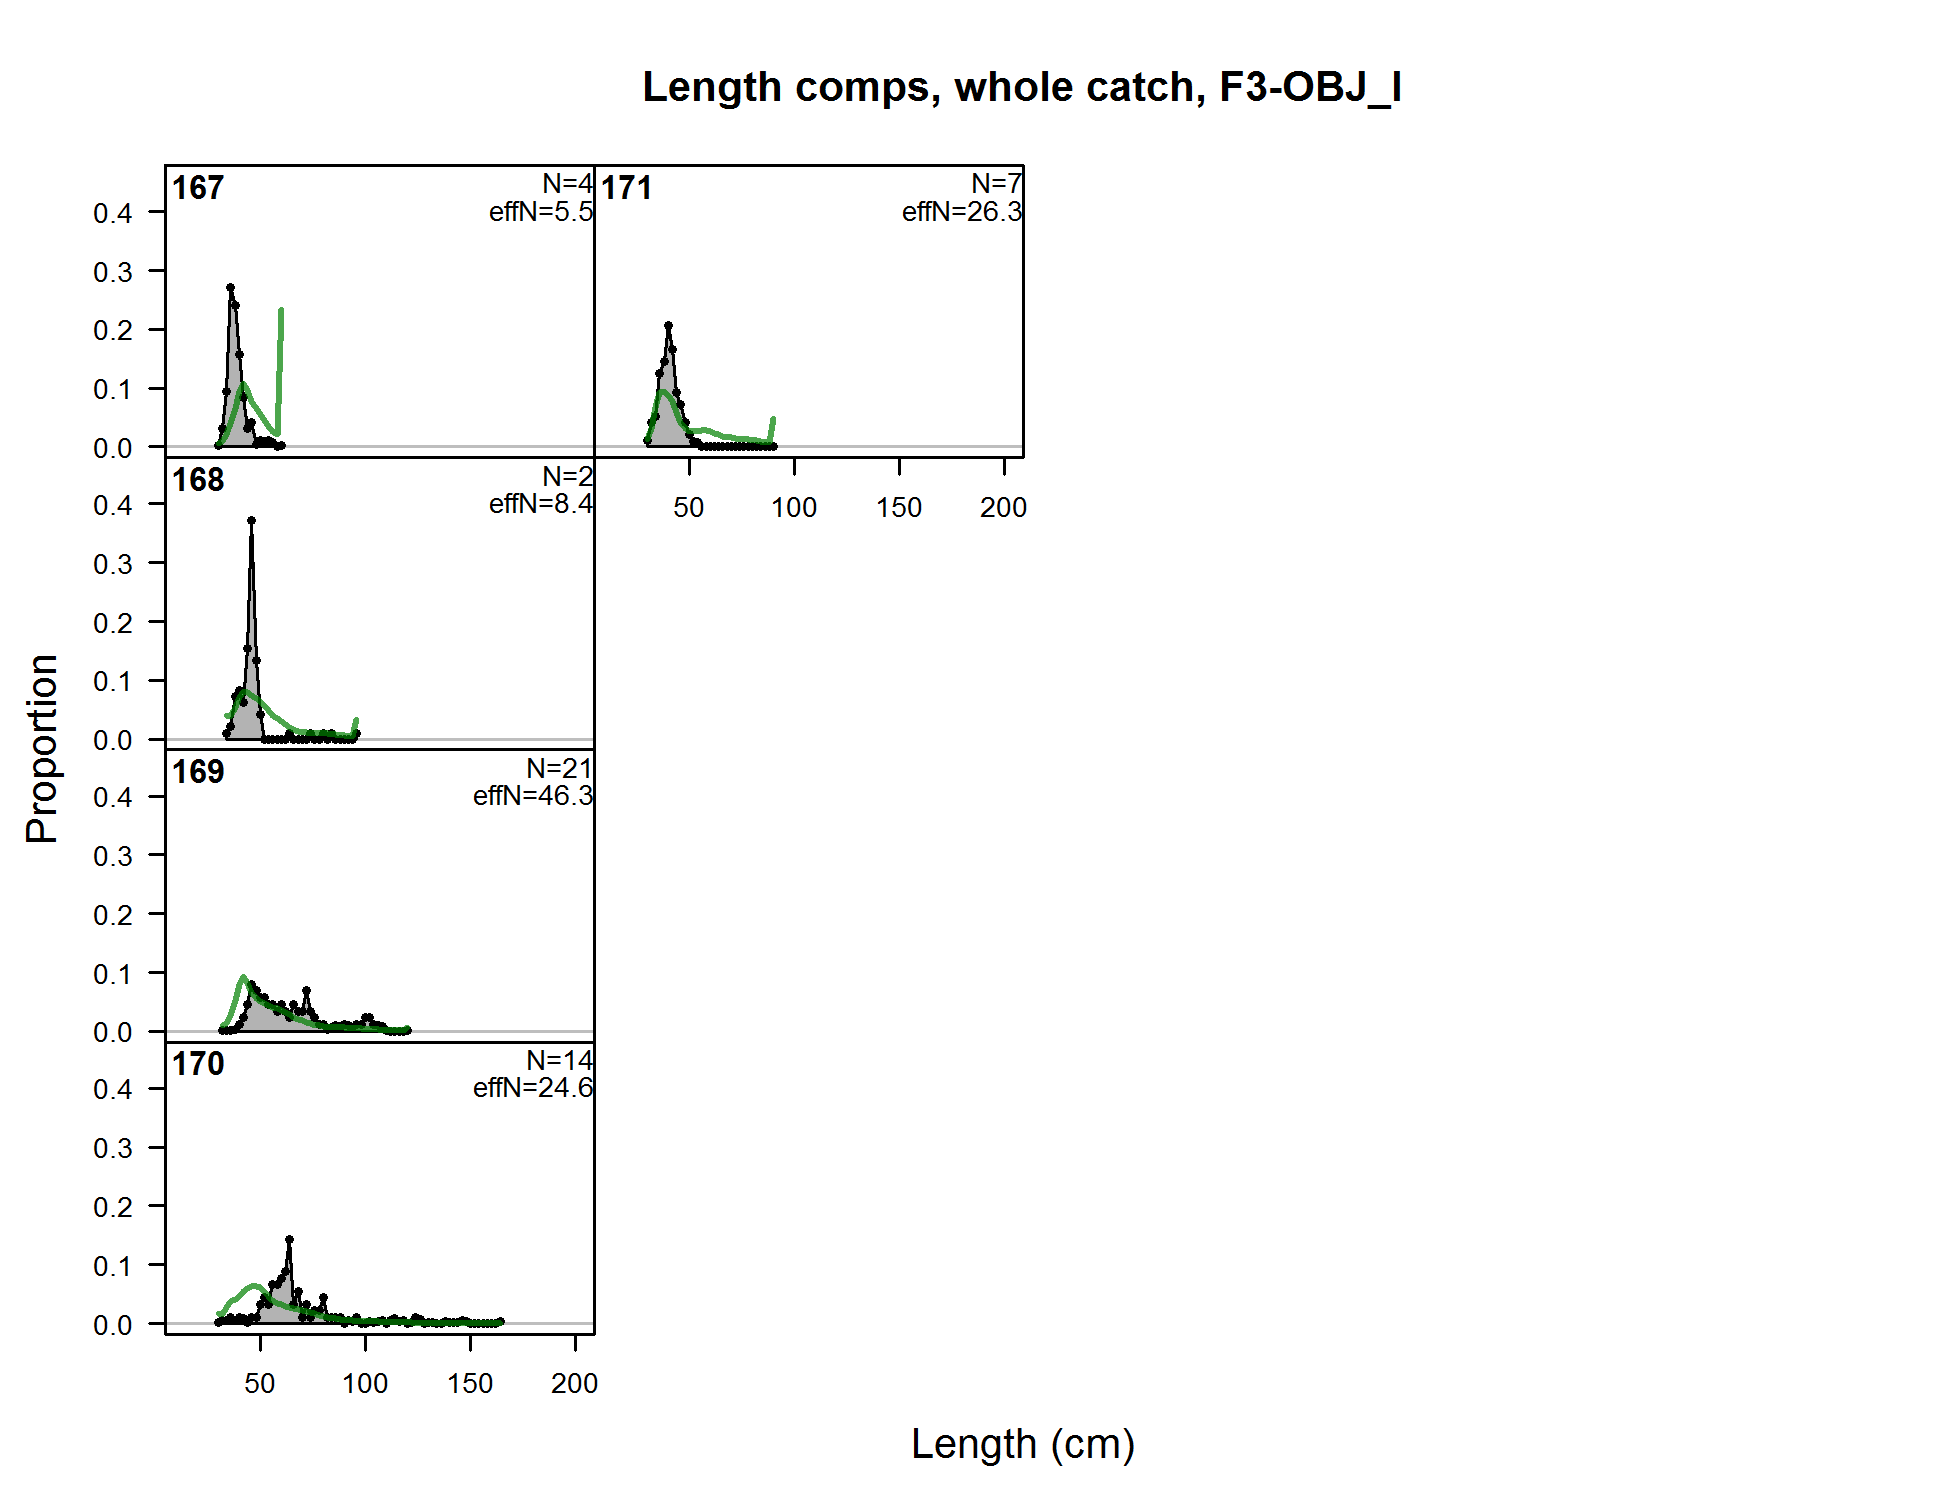
Length comps, whole catch, F3-OBJ_I (plot 1 of 9) (plot 2 of 9) (plot 3 of 9) (plot 4 of 9) (plot 5 of 9) (plot 6 of 9) (plot 7 of 9) (plot 8 of 9) (plot 9 of 9)
file: comp_lenfit_flt3mkt0_page9.png
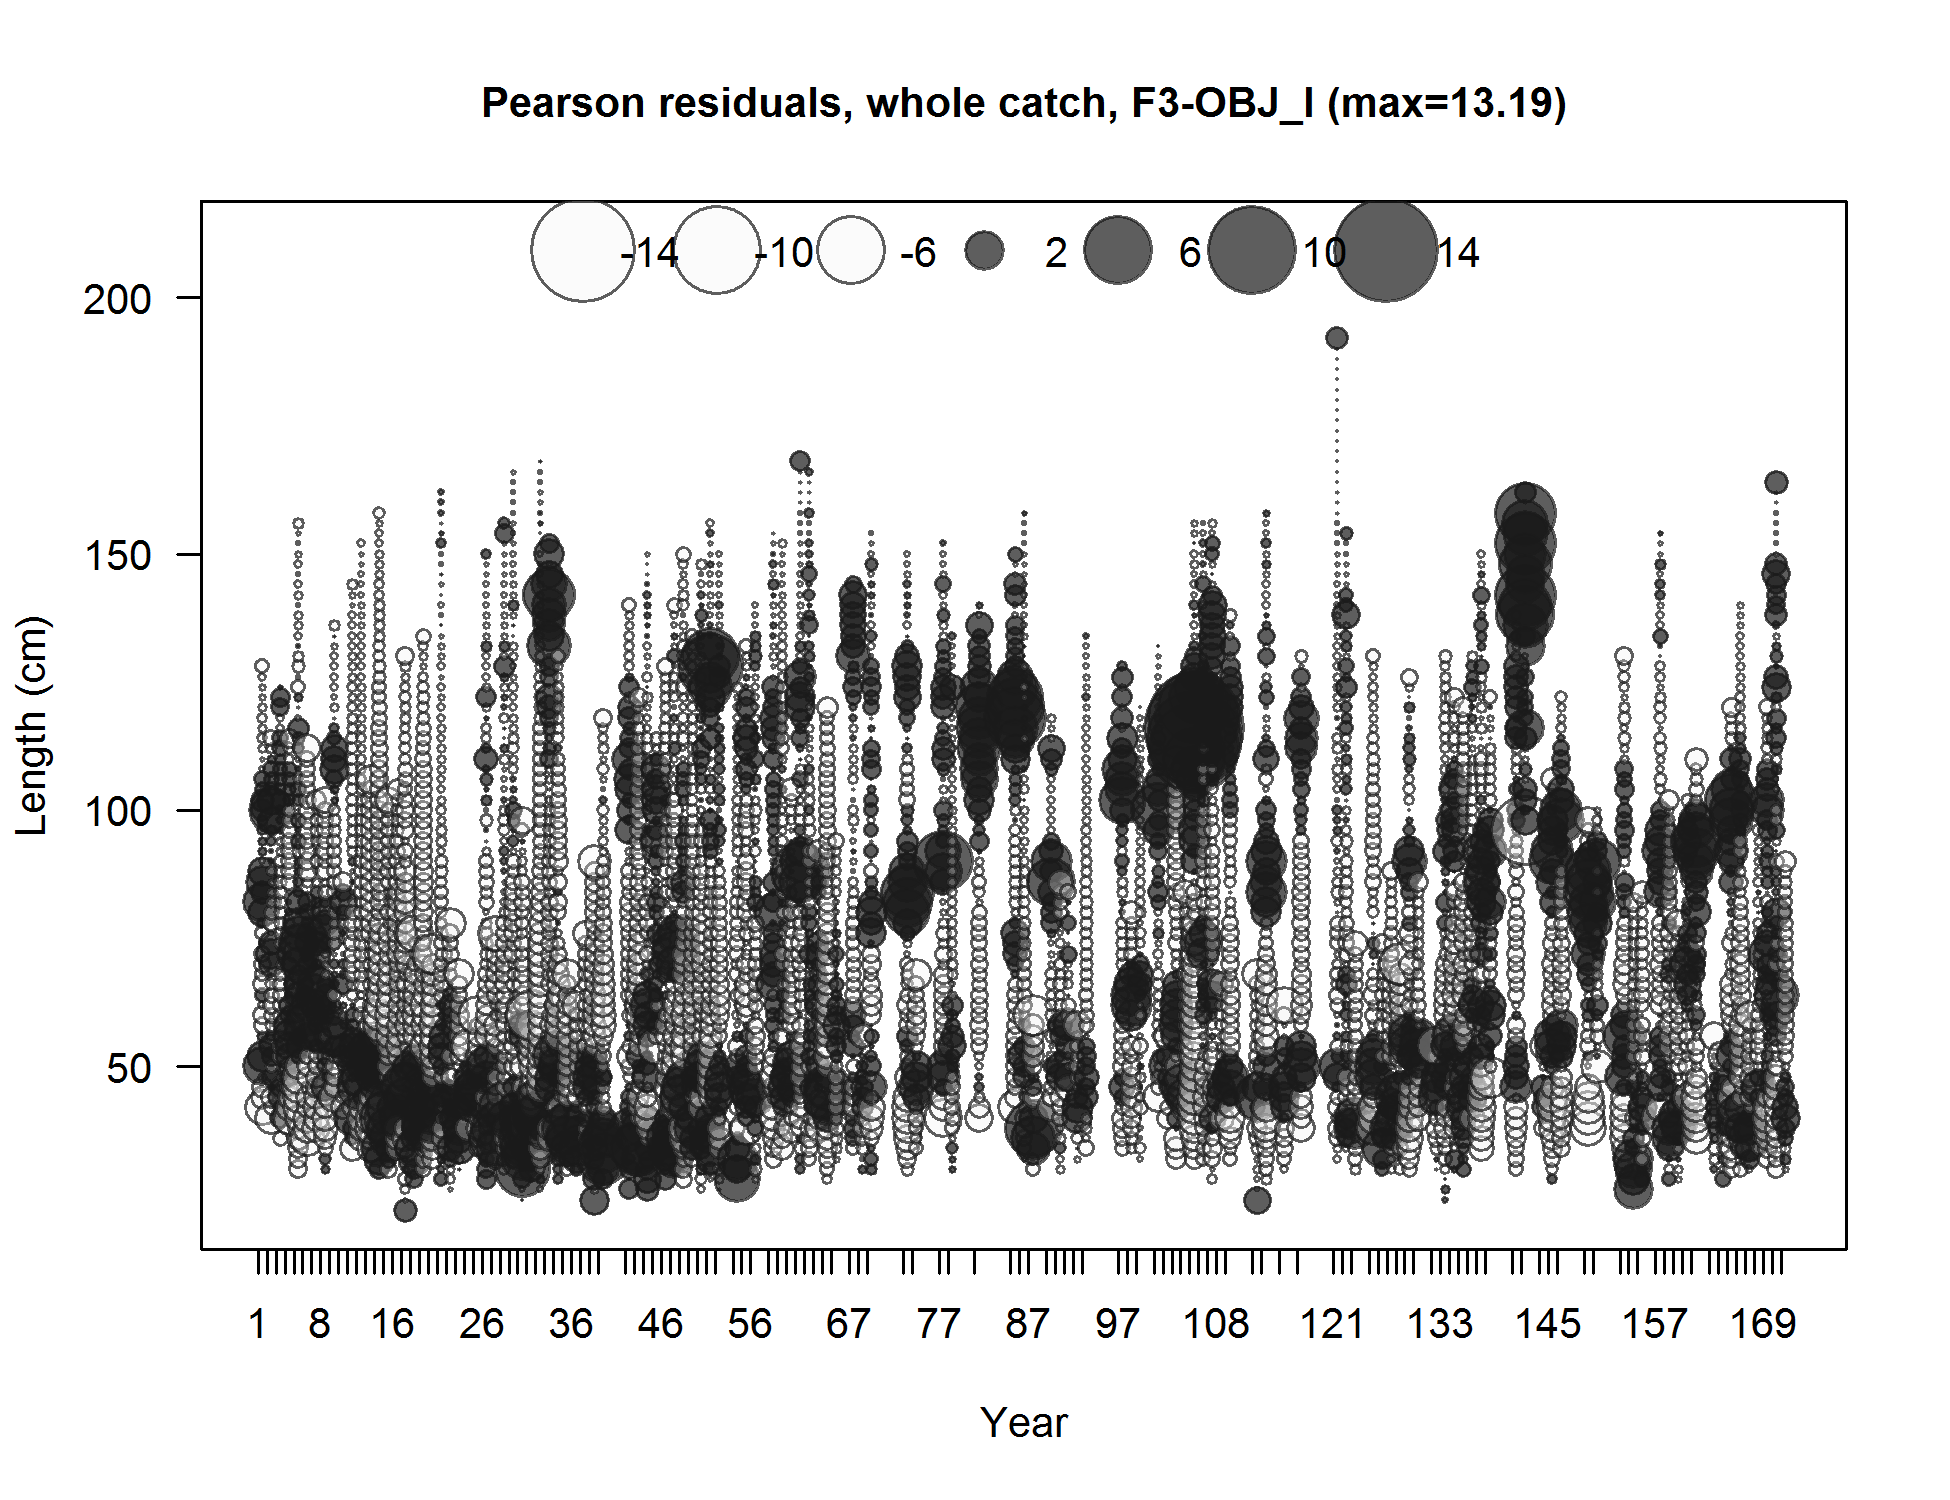
Pearson residuals, whole catch, F3-OBJ_I (max=13.19) (plot 9 of 9)
Closed bubbles are positive residuals (observed > expected) and open bubbles are negative residuals (observed < expected).
file: comp_lenfit_residsflt3mkt0_page9.png
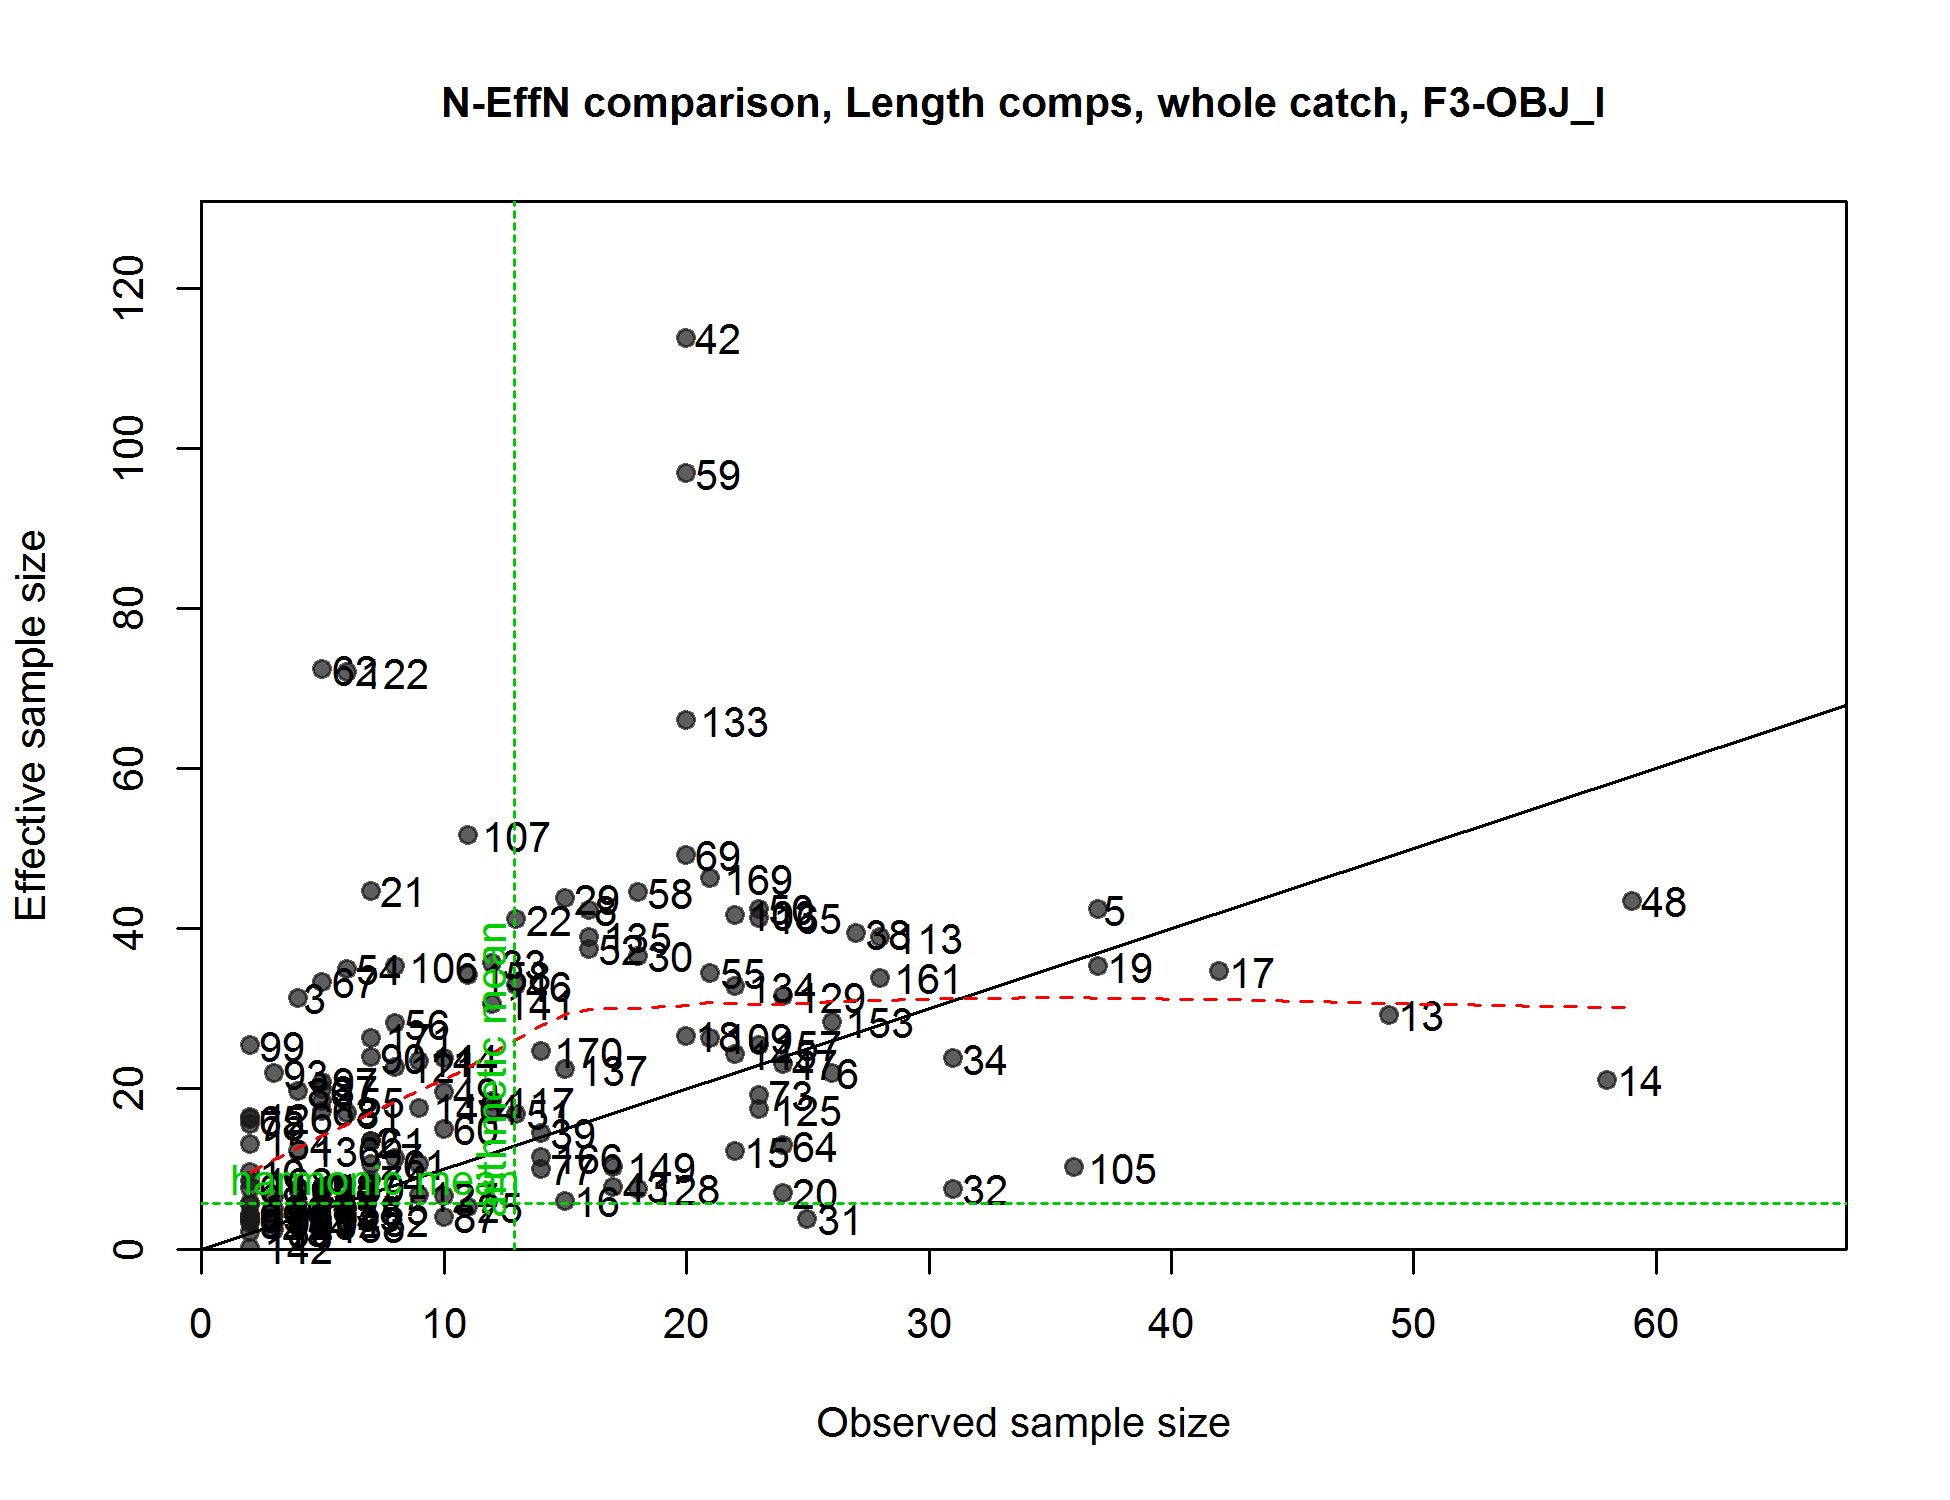
N-EffN comparison, Length comps, whole catch, F3-OBJ_I
file: comp_lenfit_sampsize_flt3mkt0.png
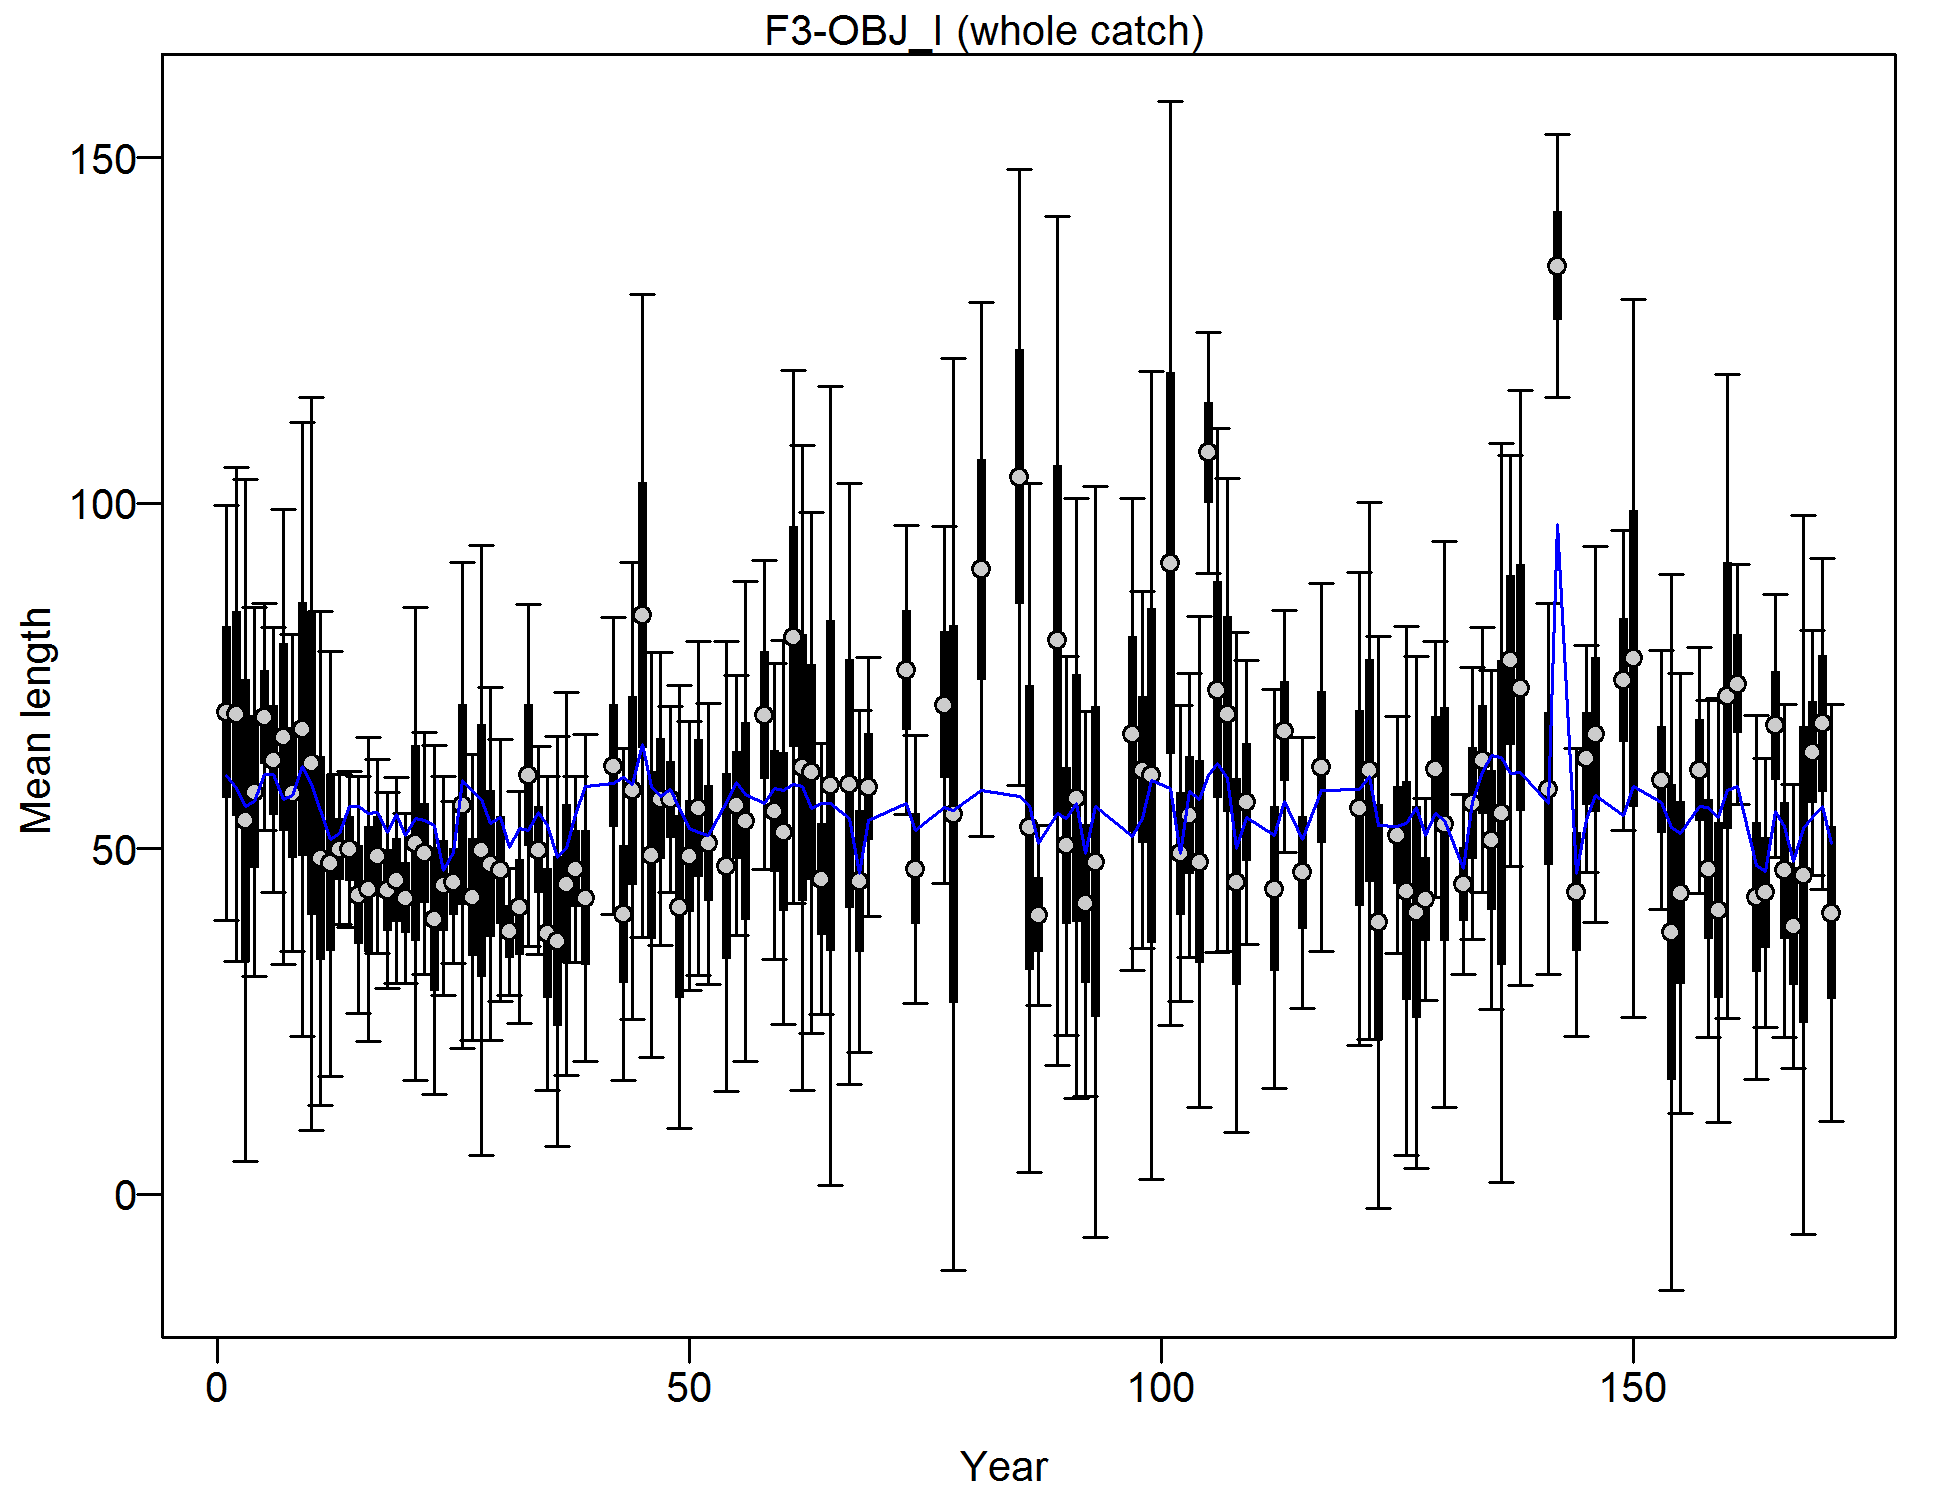
Mean length for F3-OBJ_I with 95% confidence intervals based on current samples sizes.
Francis data weighting method TA1.8: thinner intervals (with capped ends) show result of further adjusting sample sizes based on suggested multiplier (with 95% interval) for len data from F3-OBJ_I:
0.1714 (0.1063-0.3066)
For more info, see
Francis, R.I.C.C. (2011). Data weighting in statistical fisheries stock assessment models. Can. J. Fish. Aquat. Sci. 68: 1124-1138.
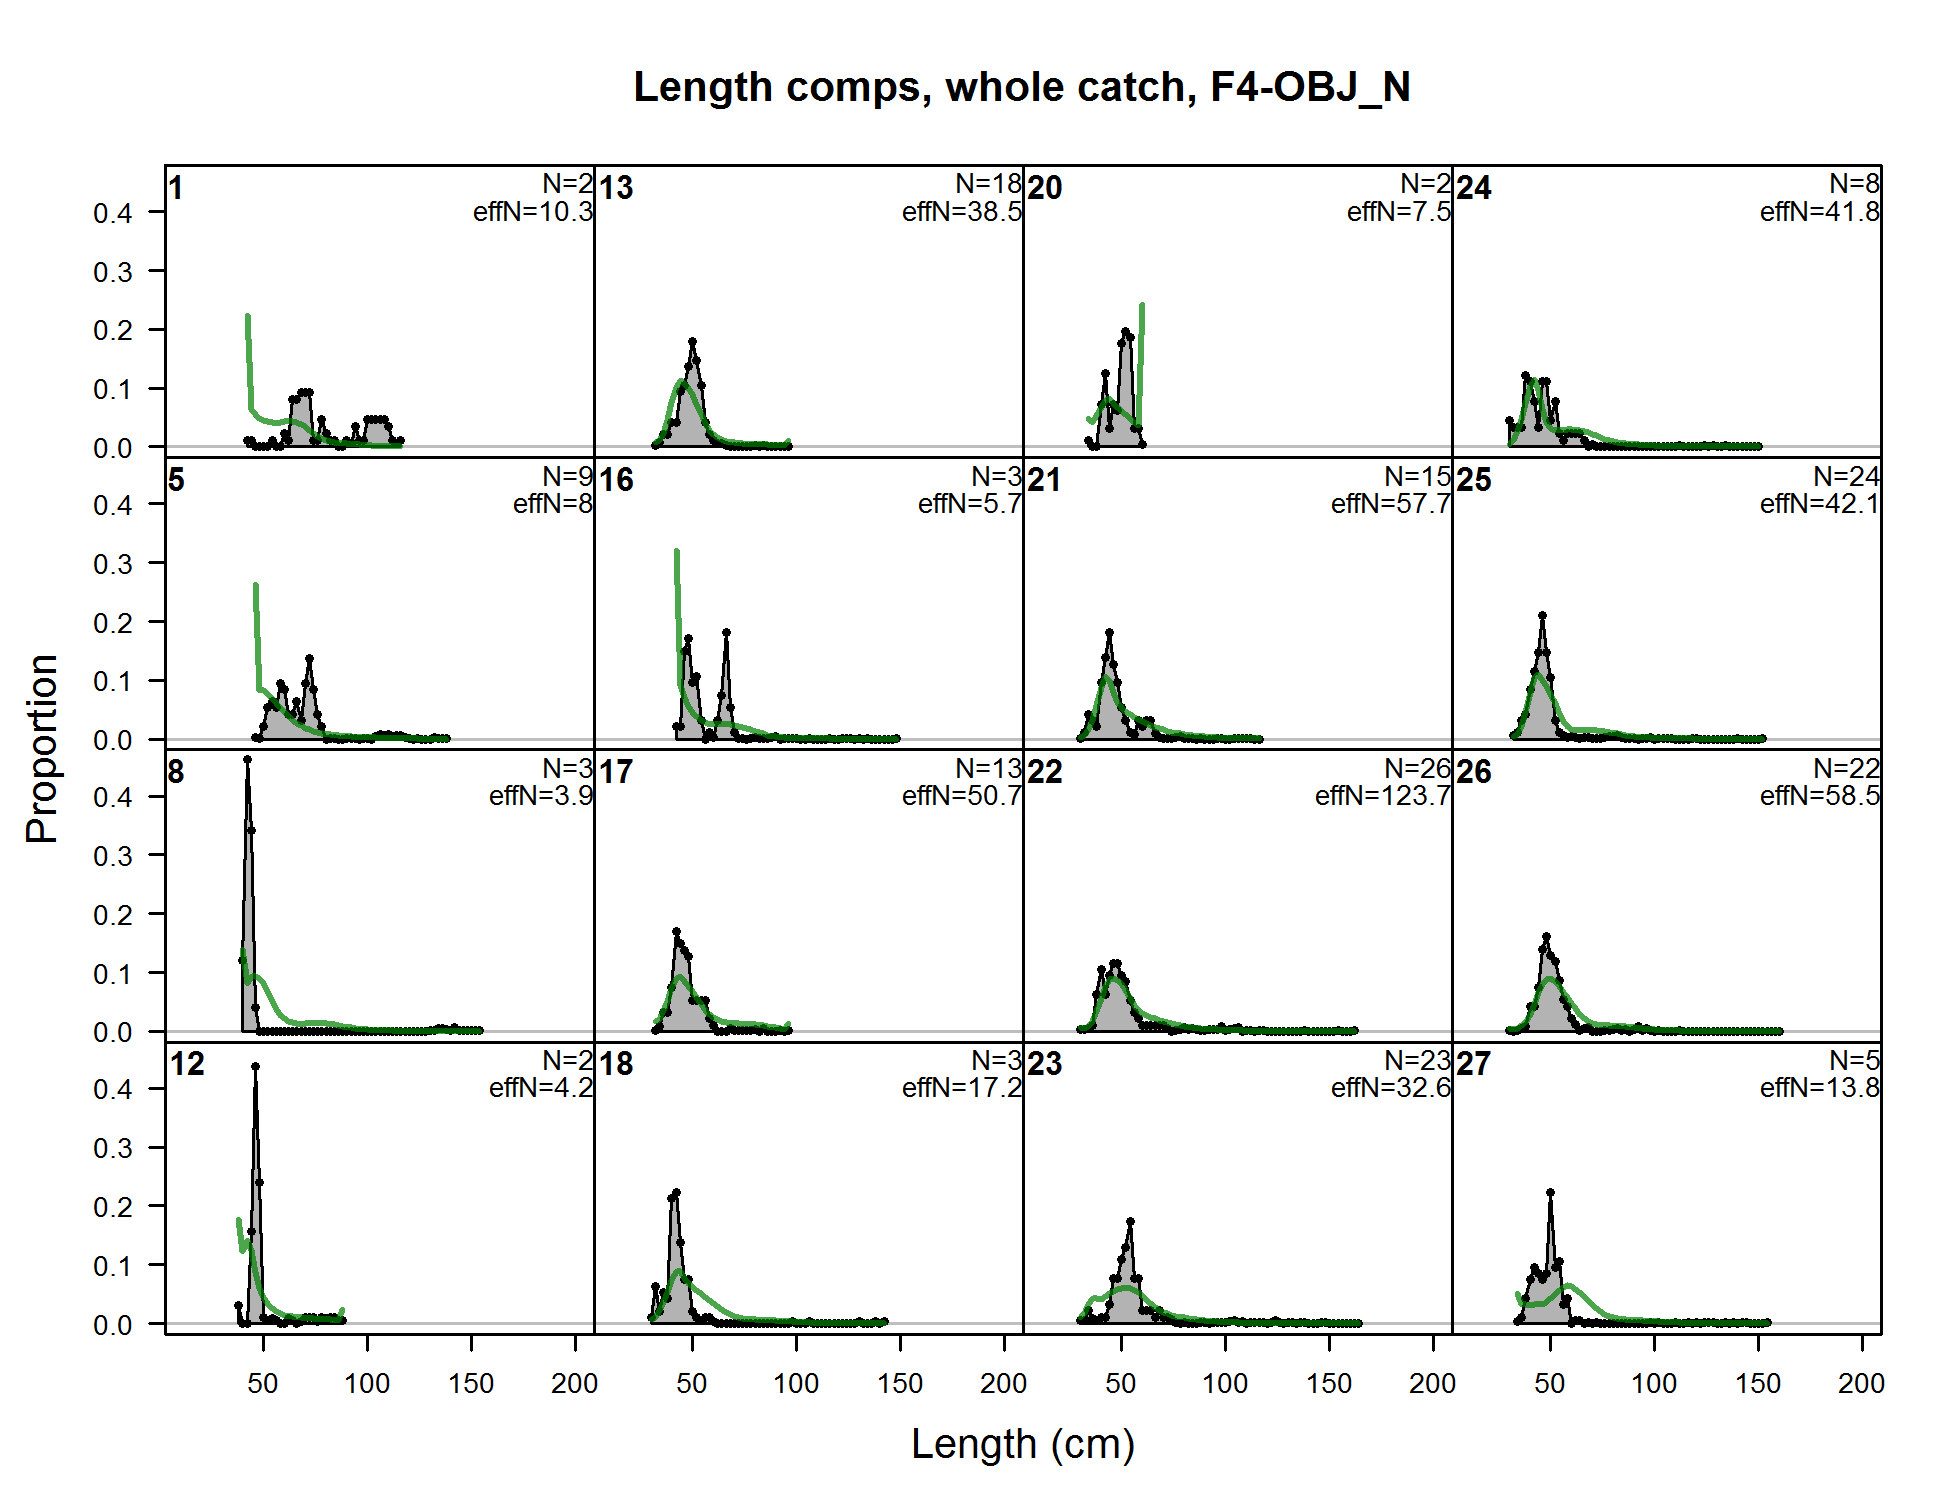
Length comps, whole catch, F4-OBJ_N (plot 1 of 8)
file: comp_lenfit_flt4mkt0_page1.png
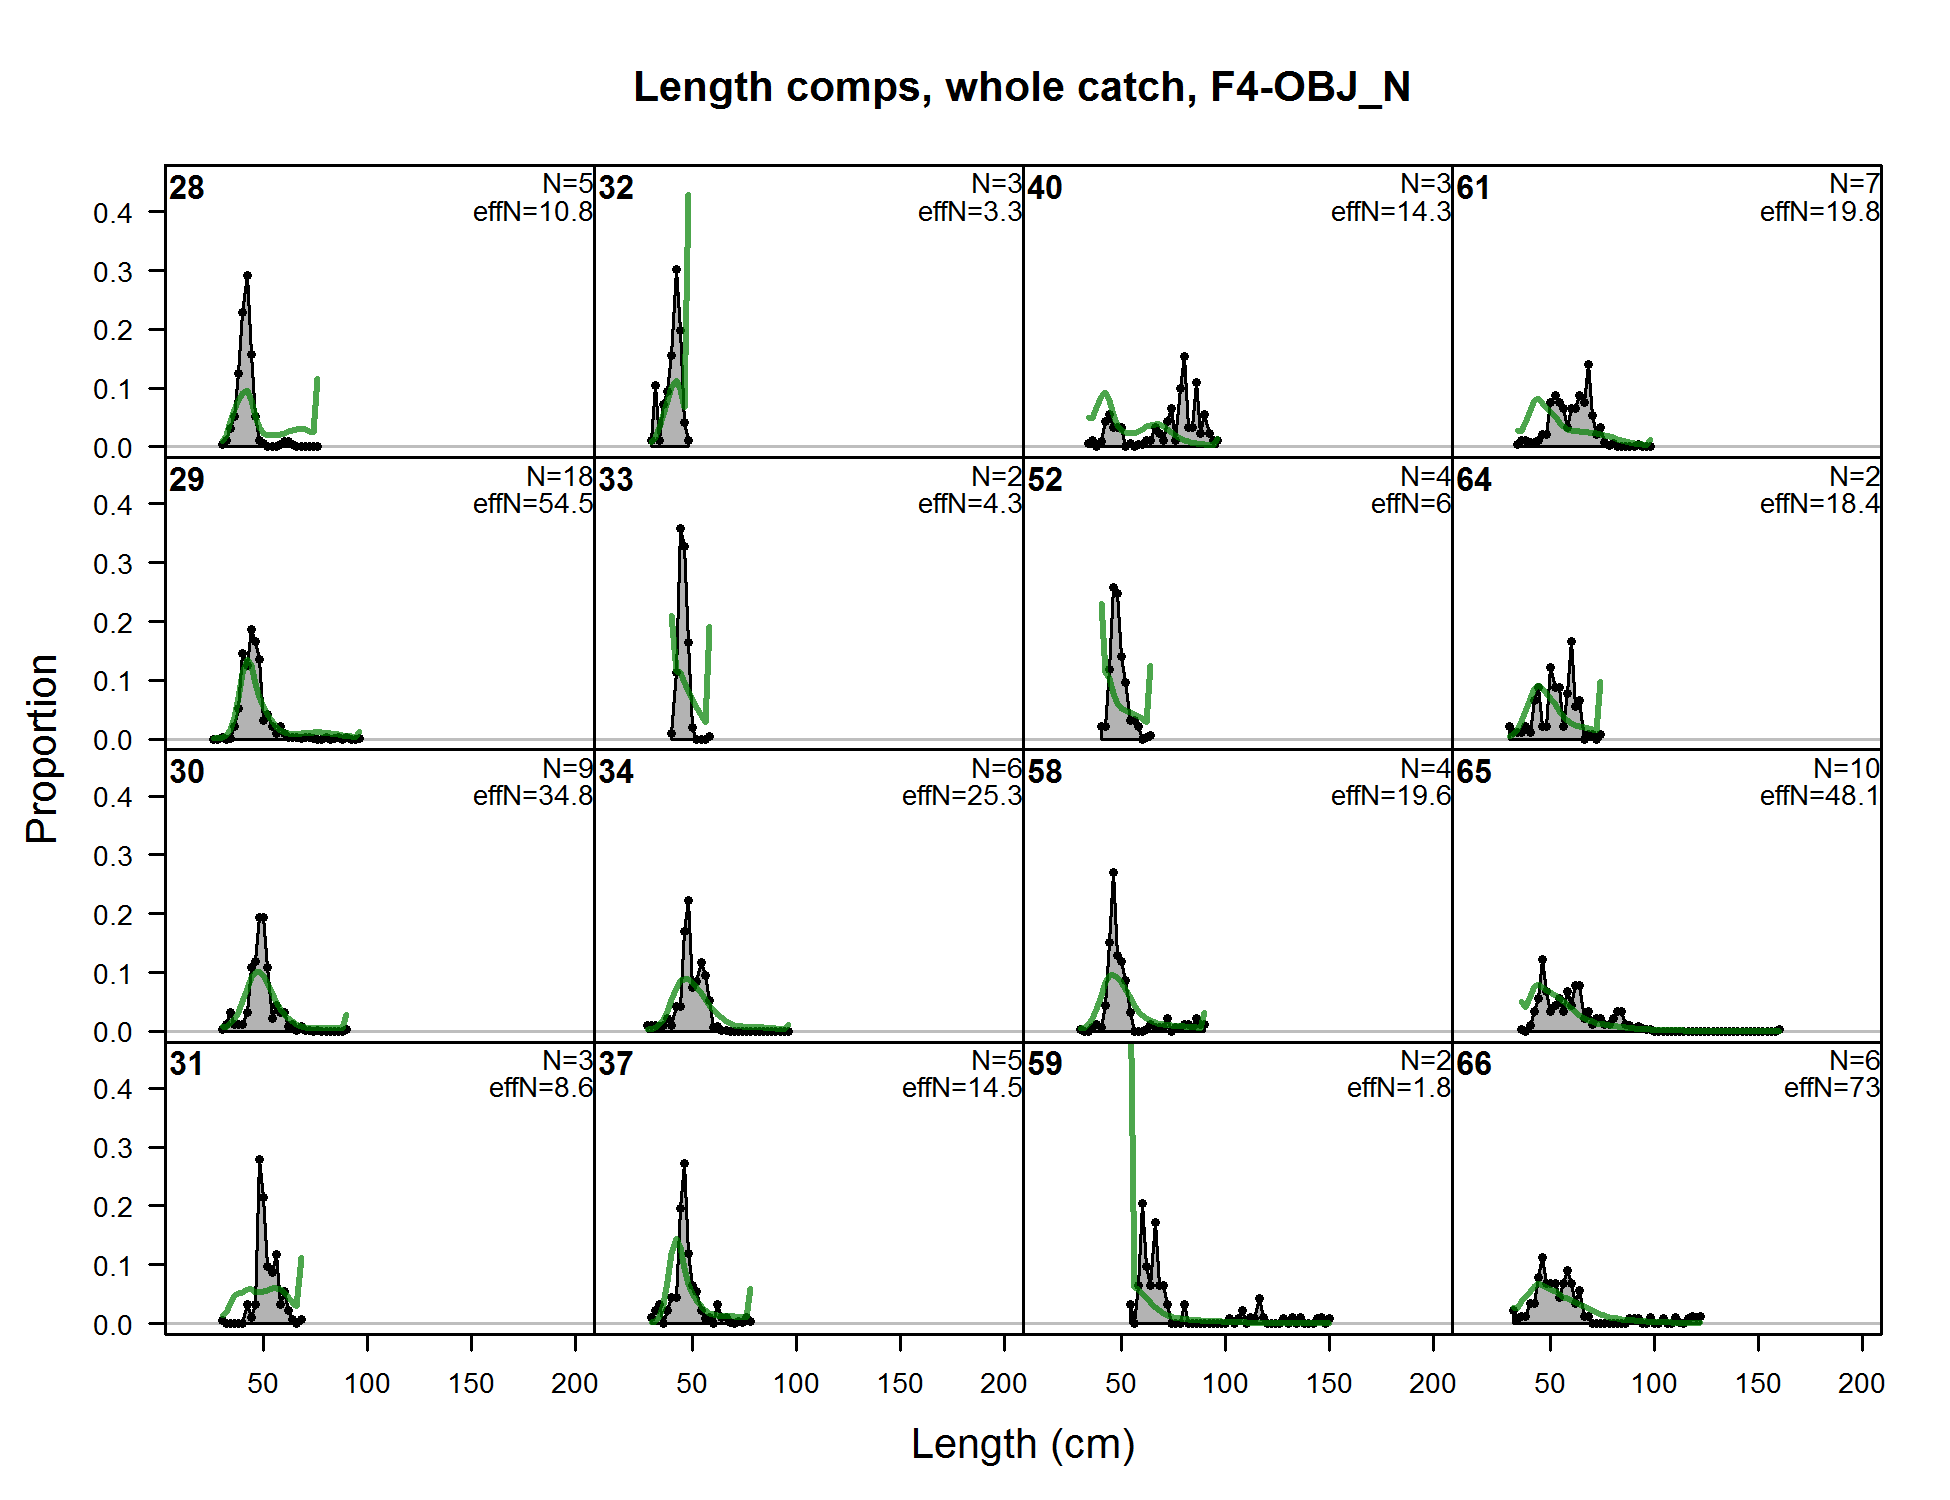
Length comps, whole catch, F4-OBJ_N (plot 1 of 8) (plot 2 of 8)
file: comp_lenfit_flt4mkt0_page2.png
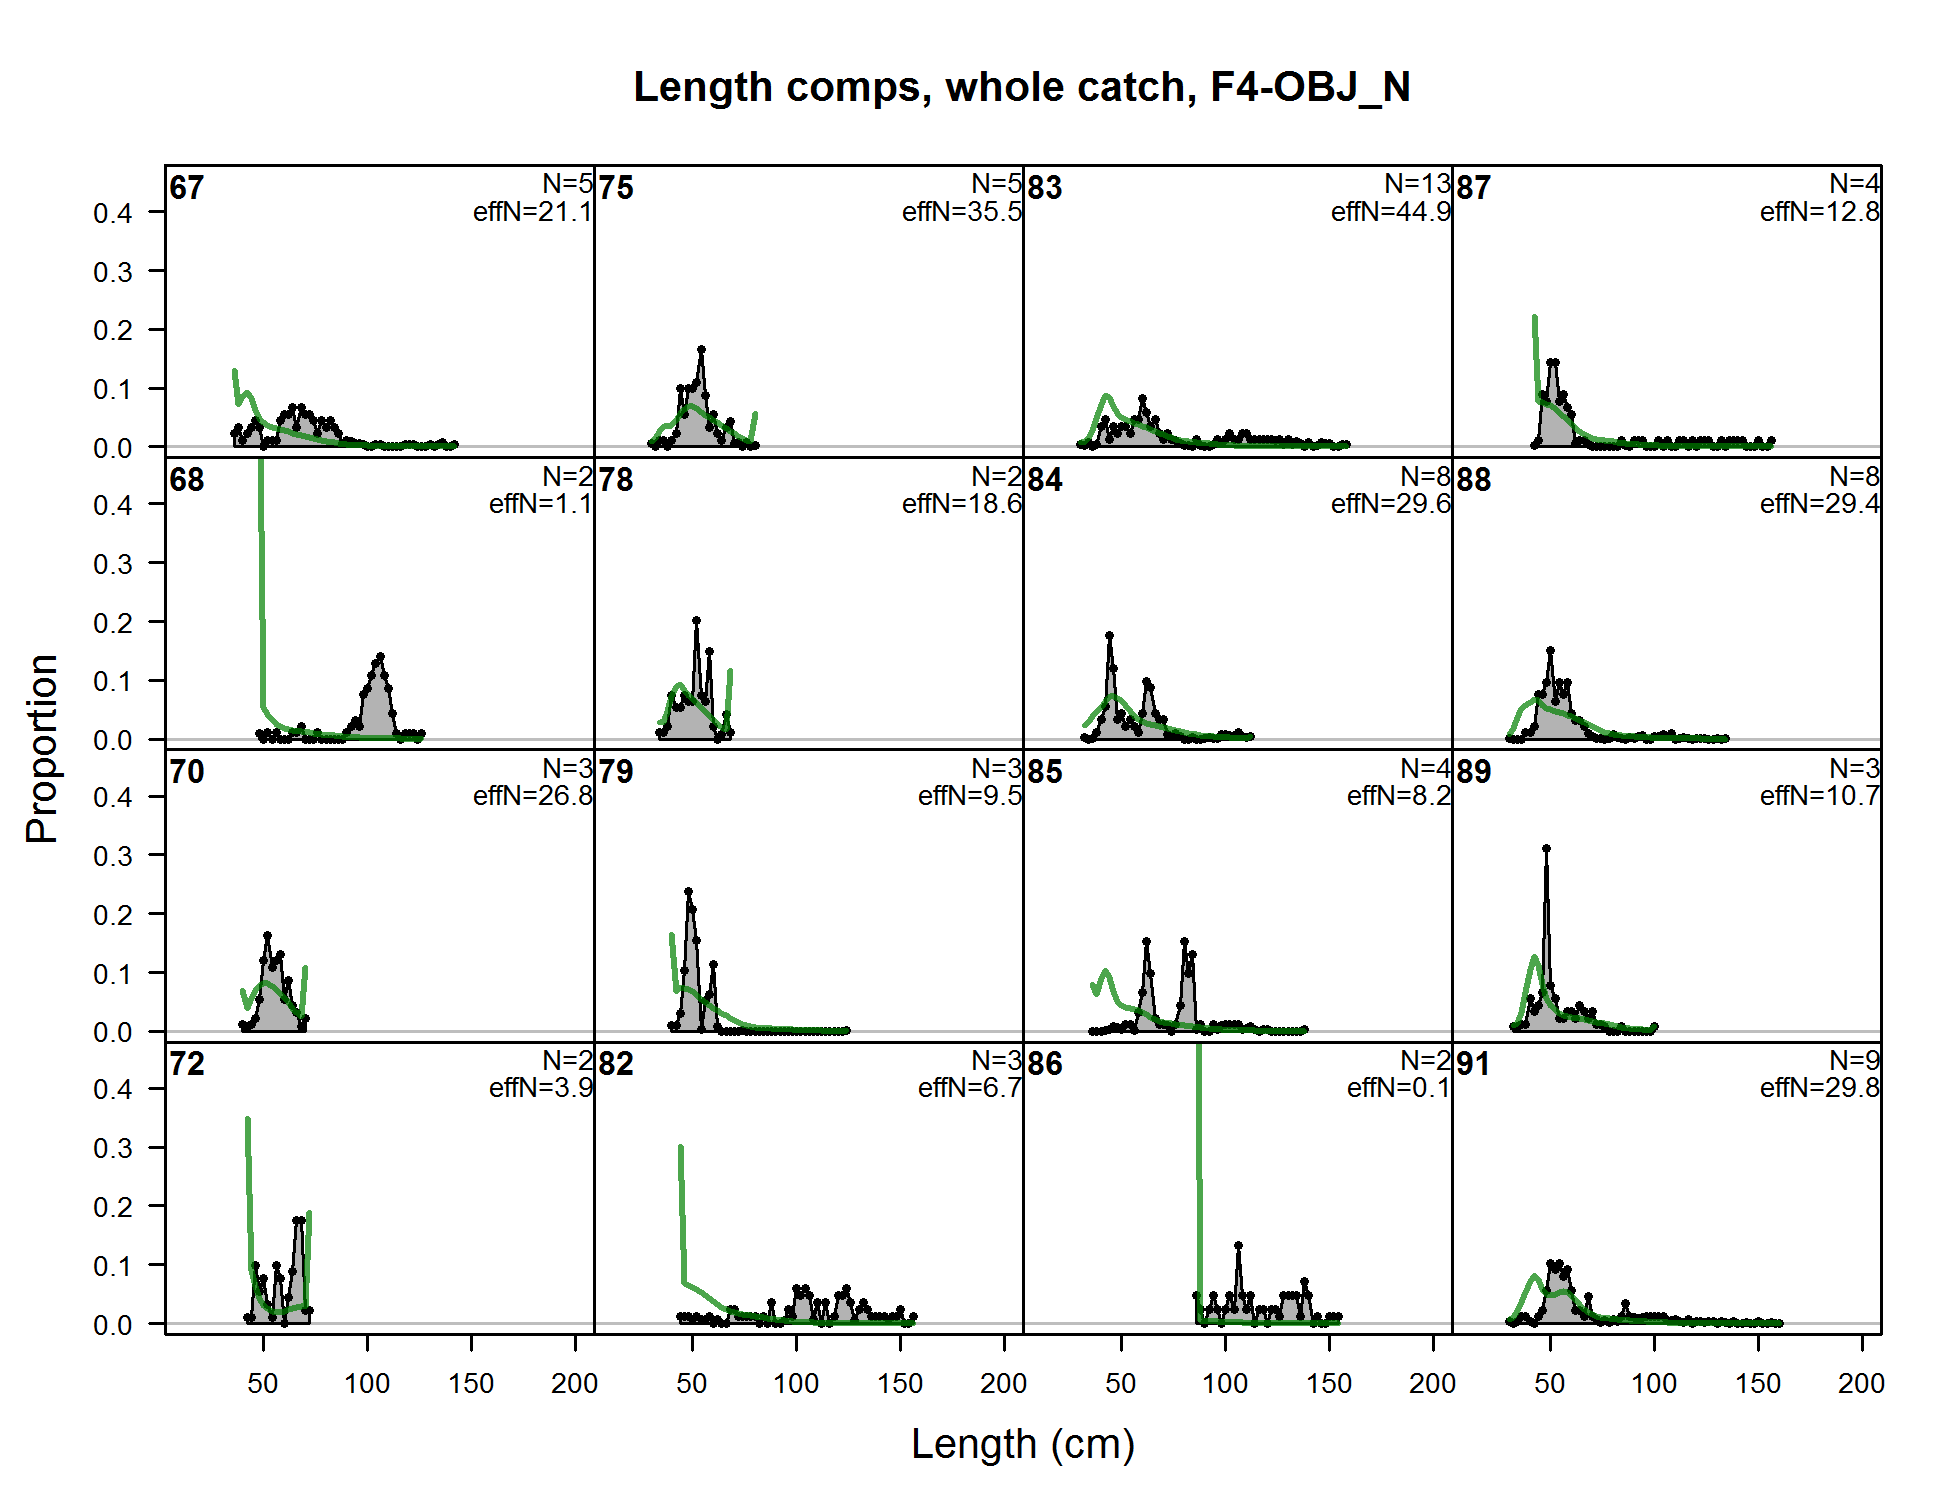
Length comps, whole catch, F4-OBJ_N (plot 1 of 8) (plot 2 of 8) (plot 3 of 8)
file: comp_lenfit_flt4mkt0_page3.png
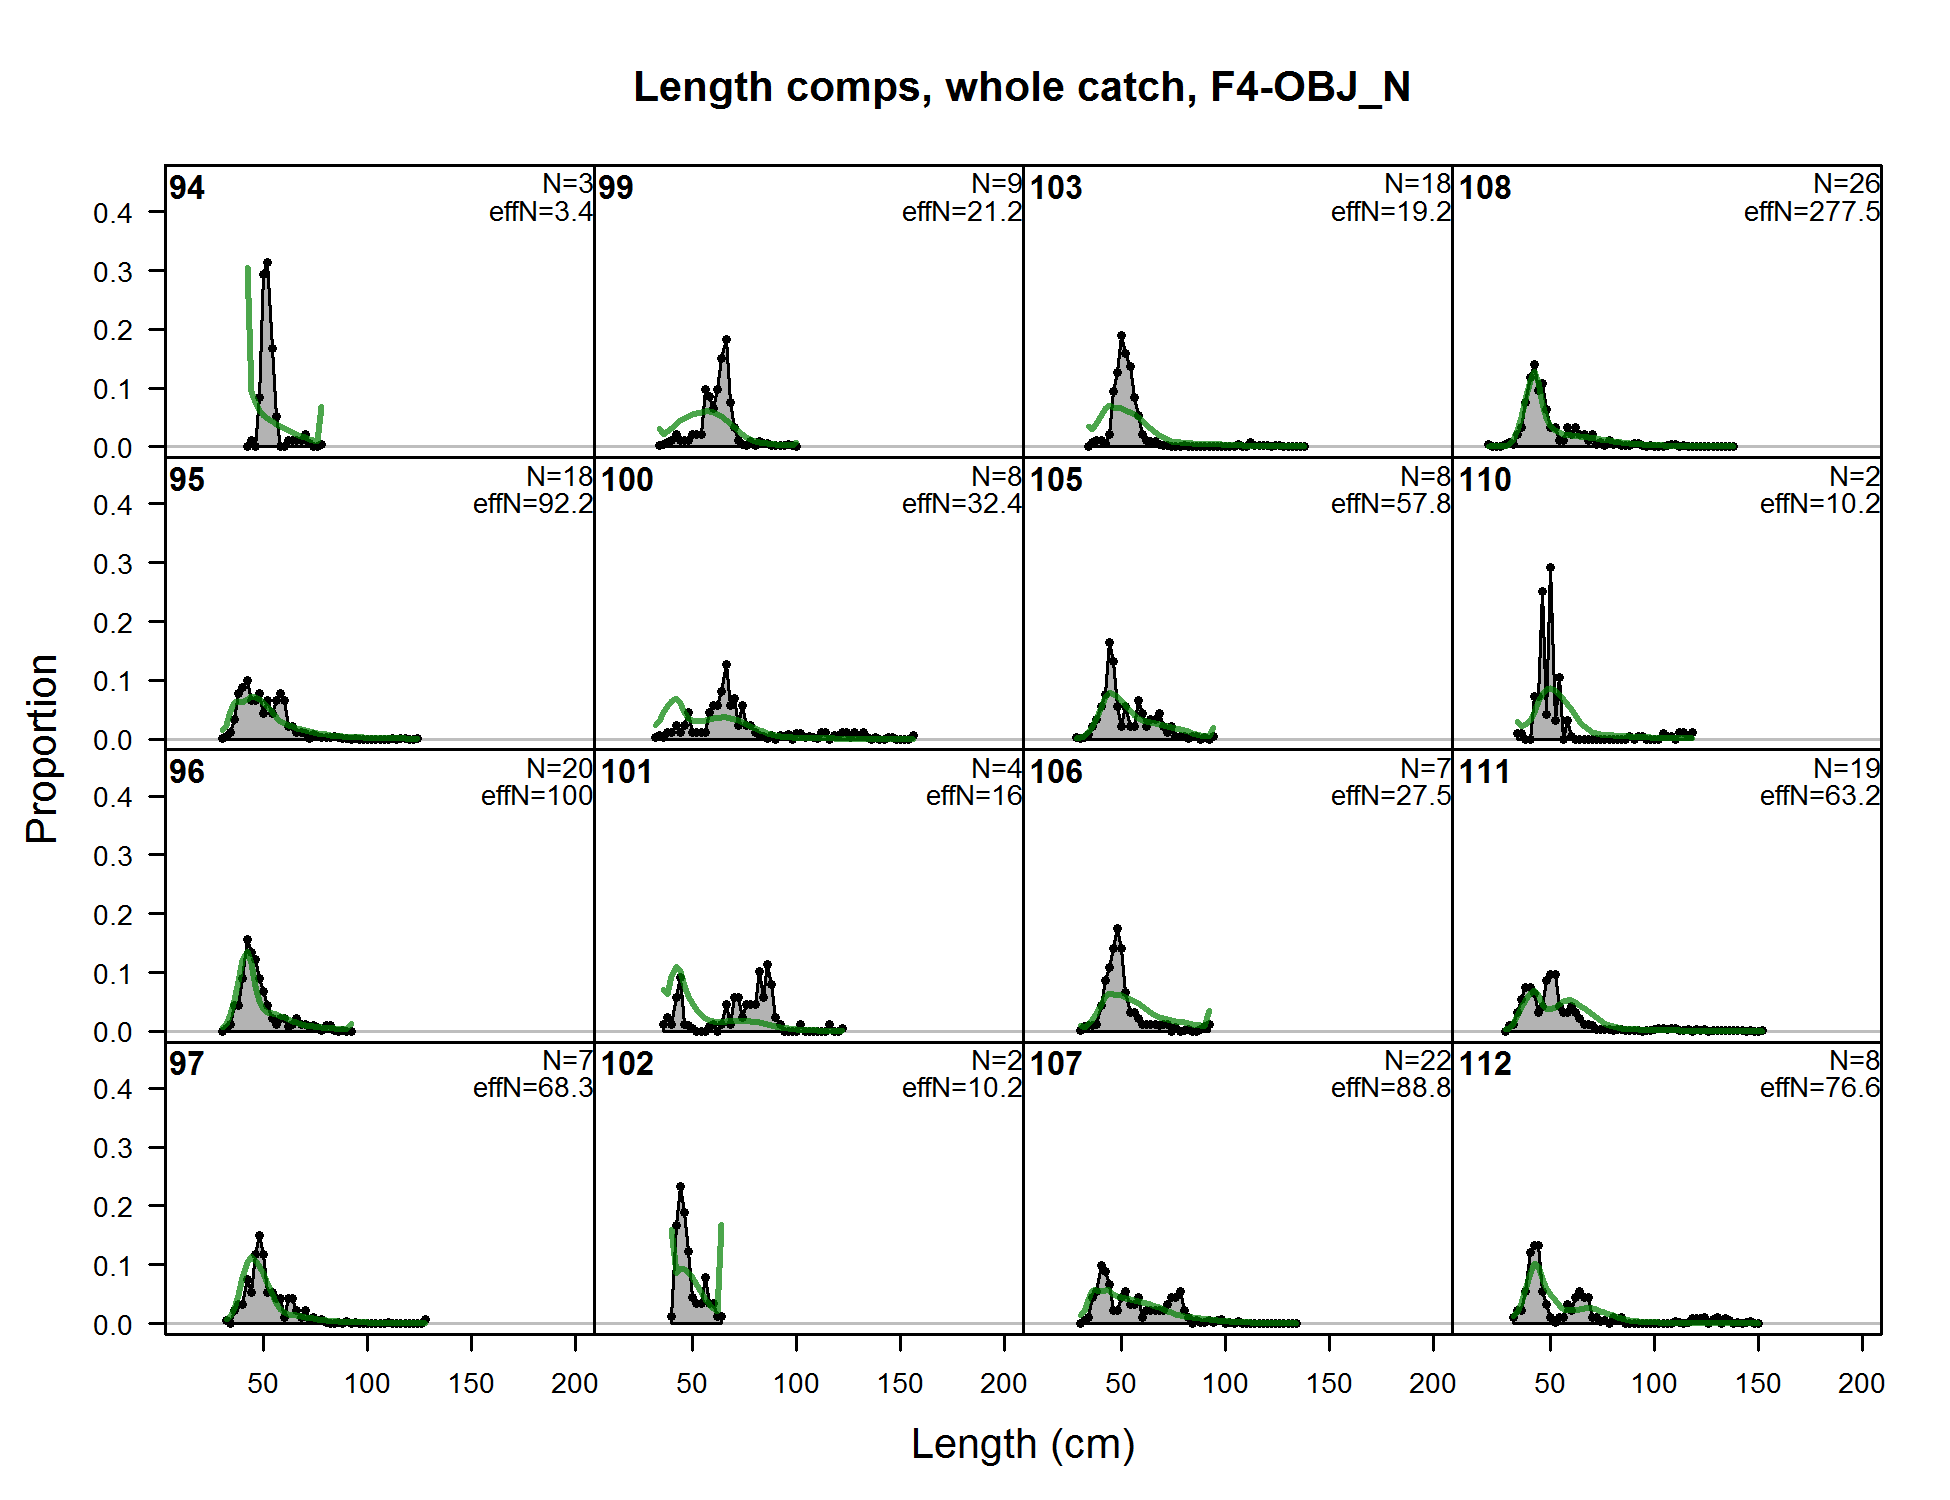
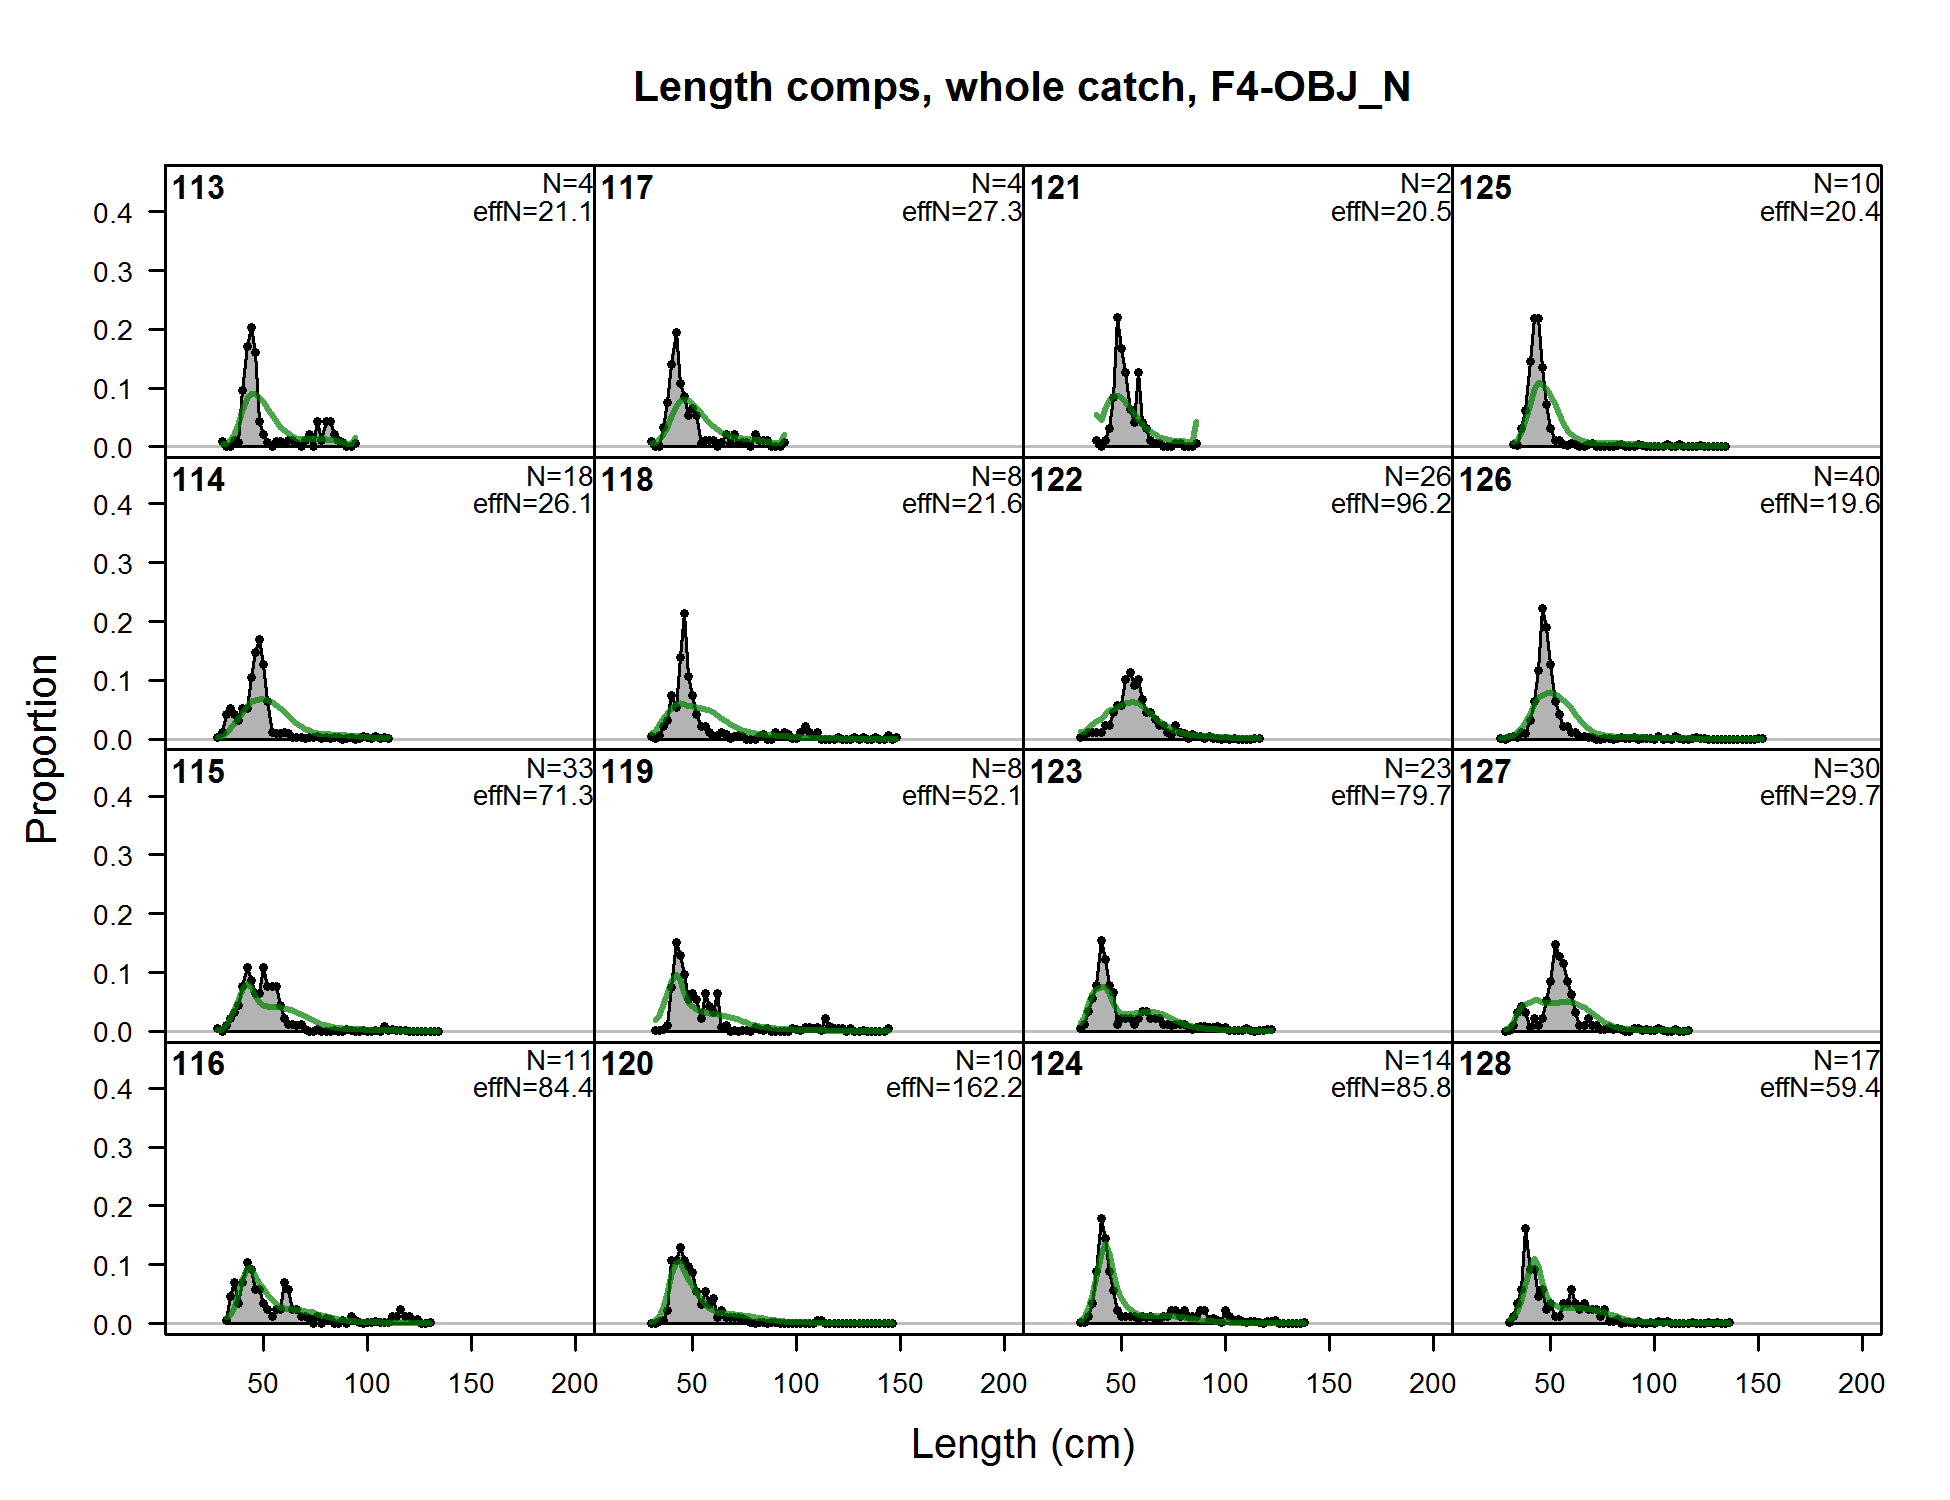
Length comps, whole catch, F4-OBJ_N (plot 1 of 8) (plot 2 of 8) (plot 3 of 8) (plot 4 of 8)
file: comp_lenfit_flt4mkt0_page4.png
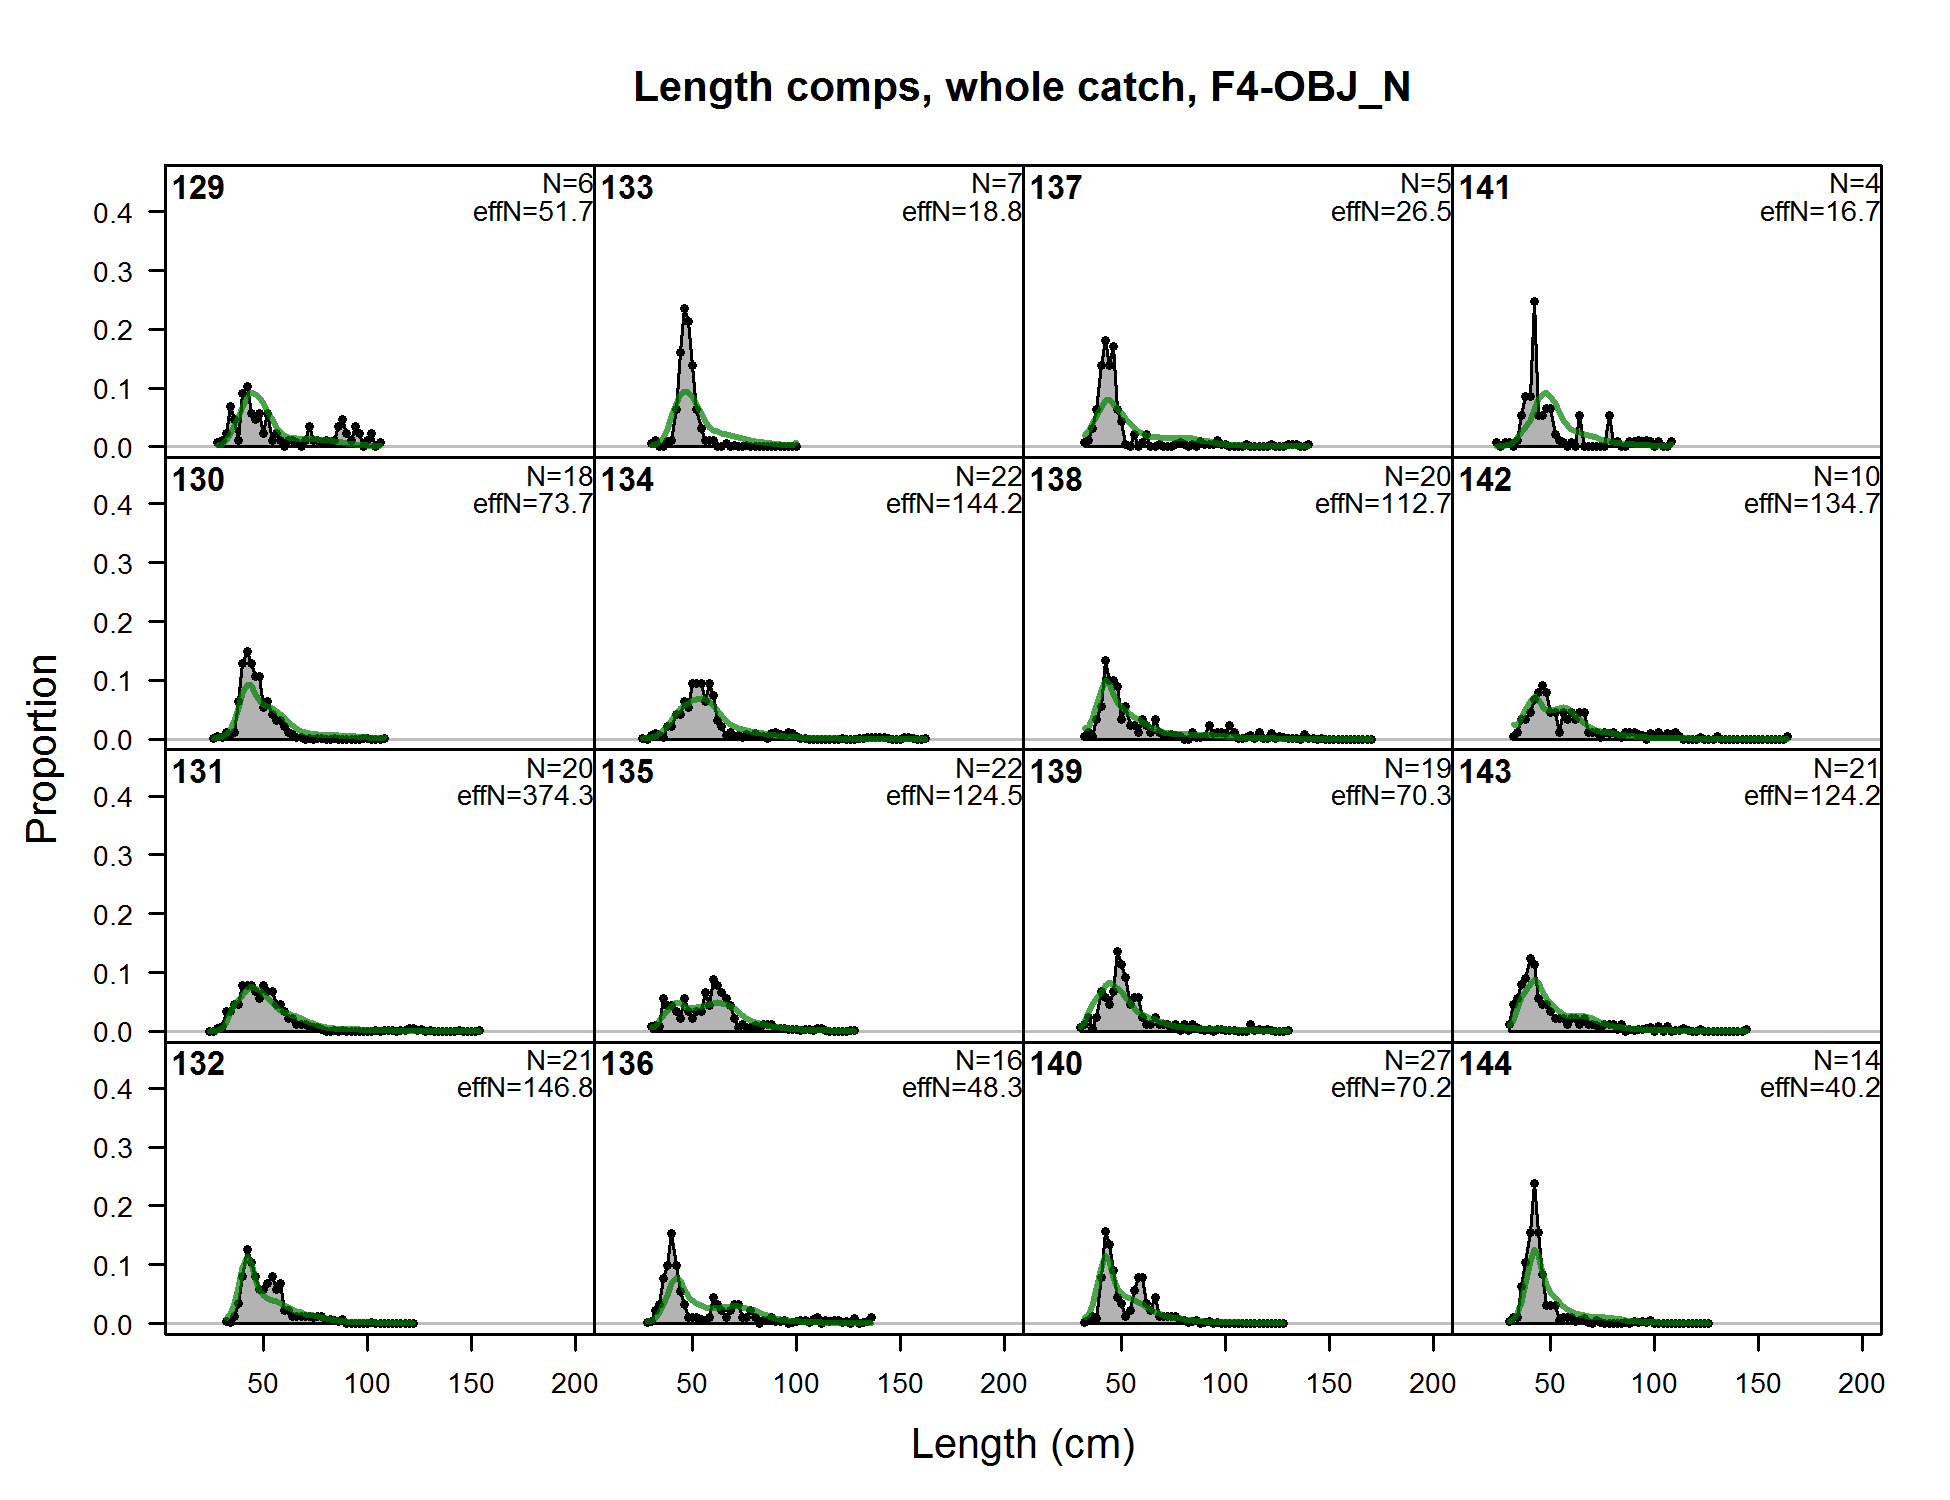
Length comps, whole catch, F4-OBJ_N (plot 1 of 8) (plot 2 of 8) (plot 3 of 8) (plot 4 of 8) (plot 5 of 8)
file: comp_lenfit_flt4mkt0_page5.png
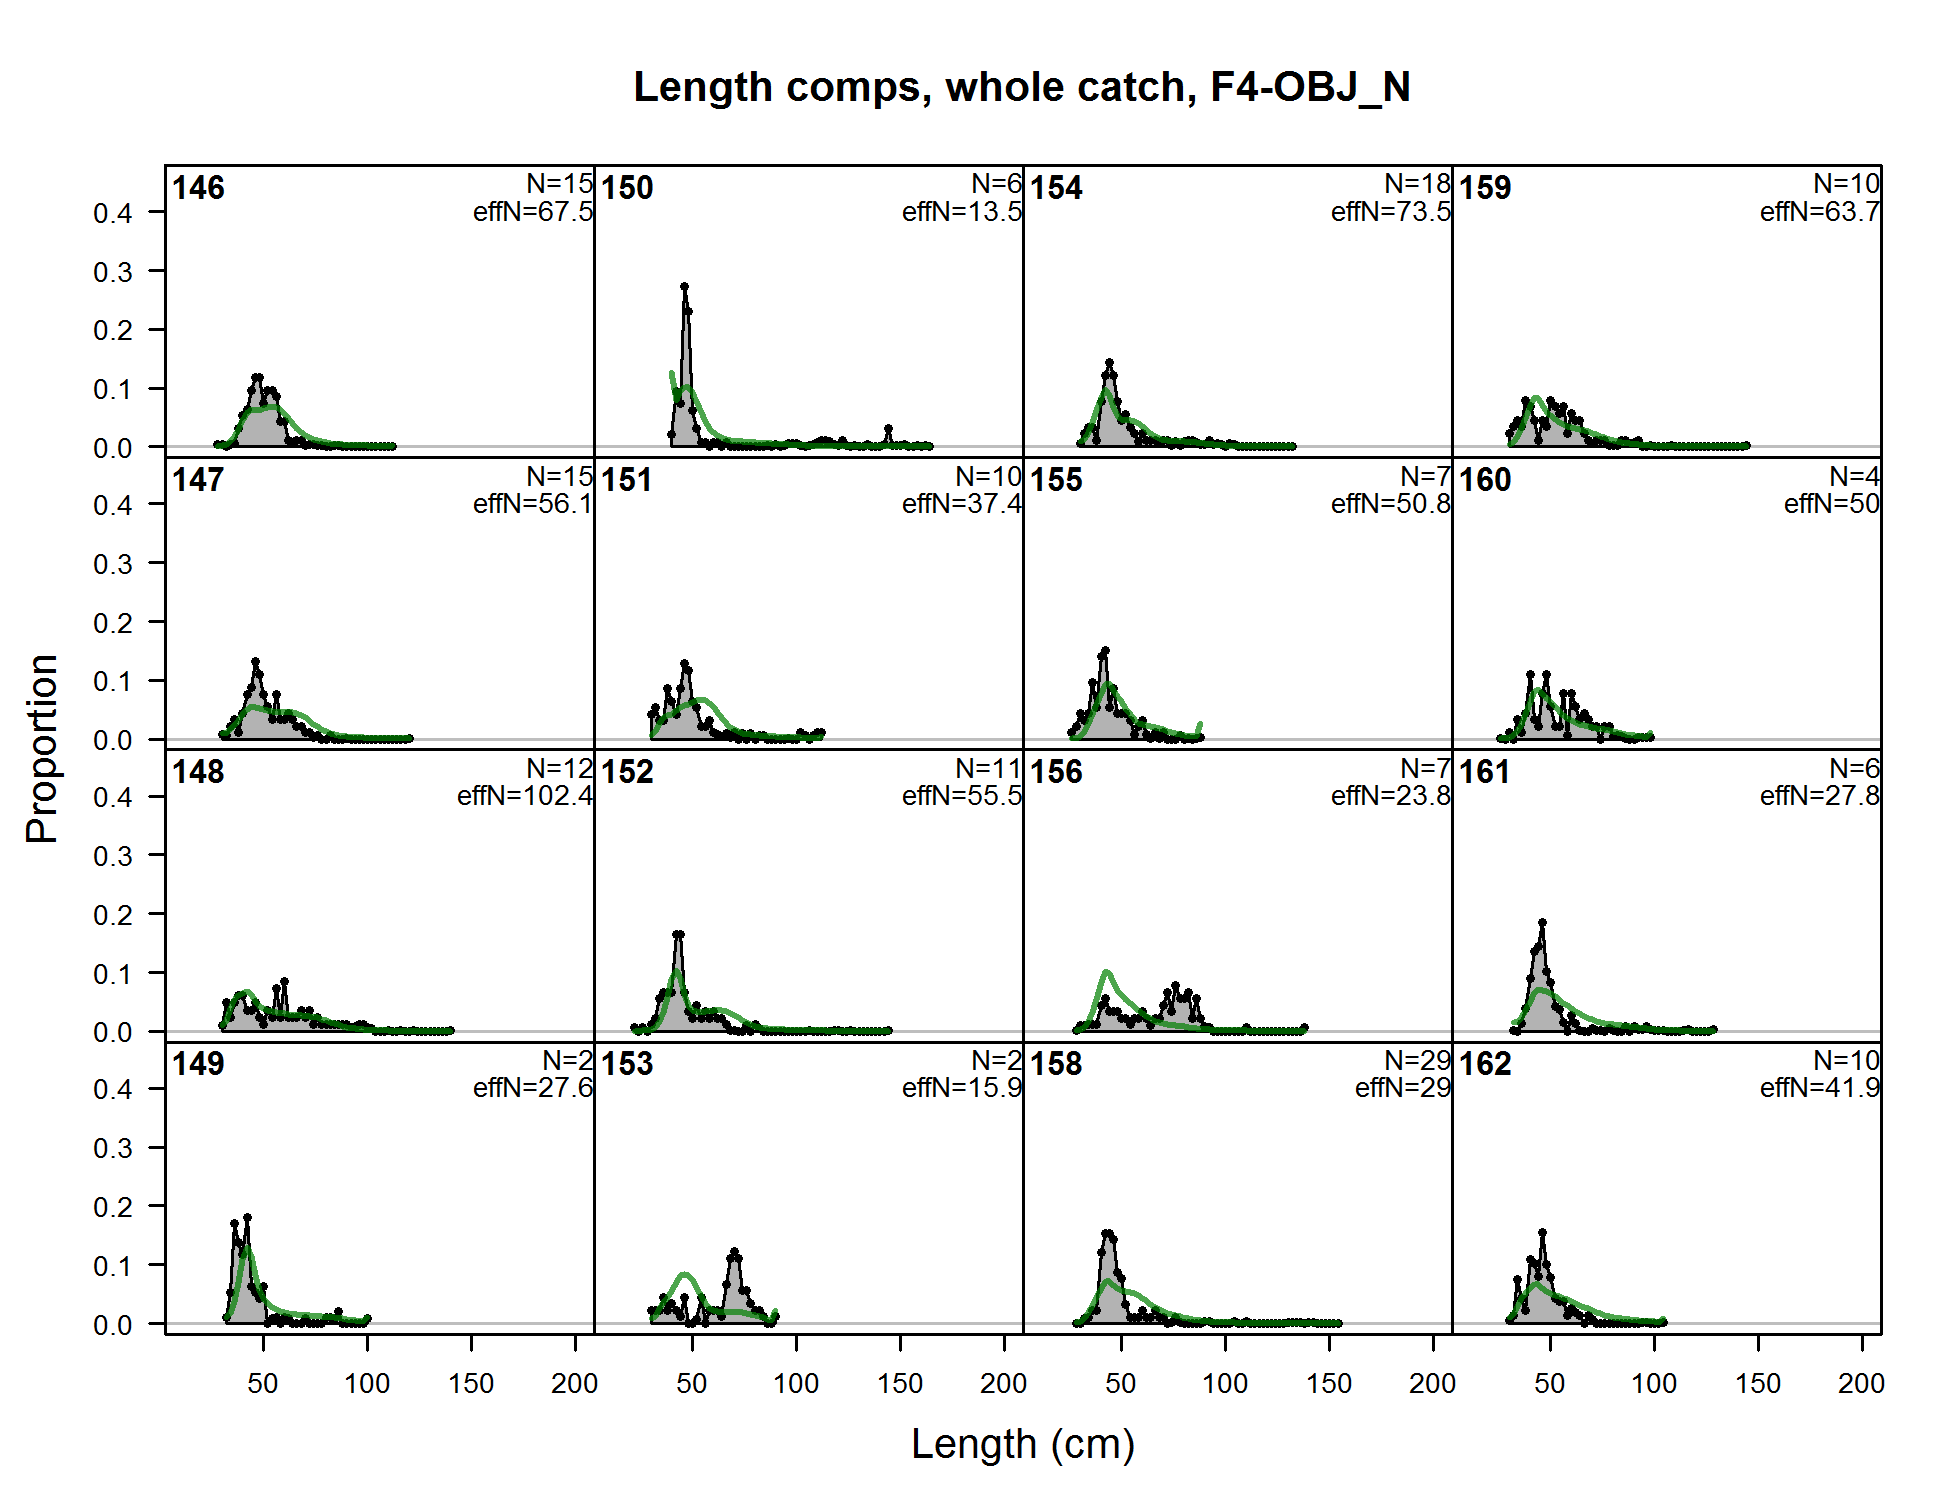
Length comps, whole catch, F4-OBJ_N (plot 1 of 8) (plot 2 of 8) (plot 3 of 8) (plot 4 of 8) (plot 5 of 8) (plot 6 of 8)
file: comp_lenfit_flt4mkt0_page6.png
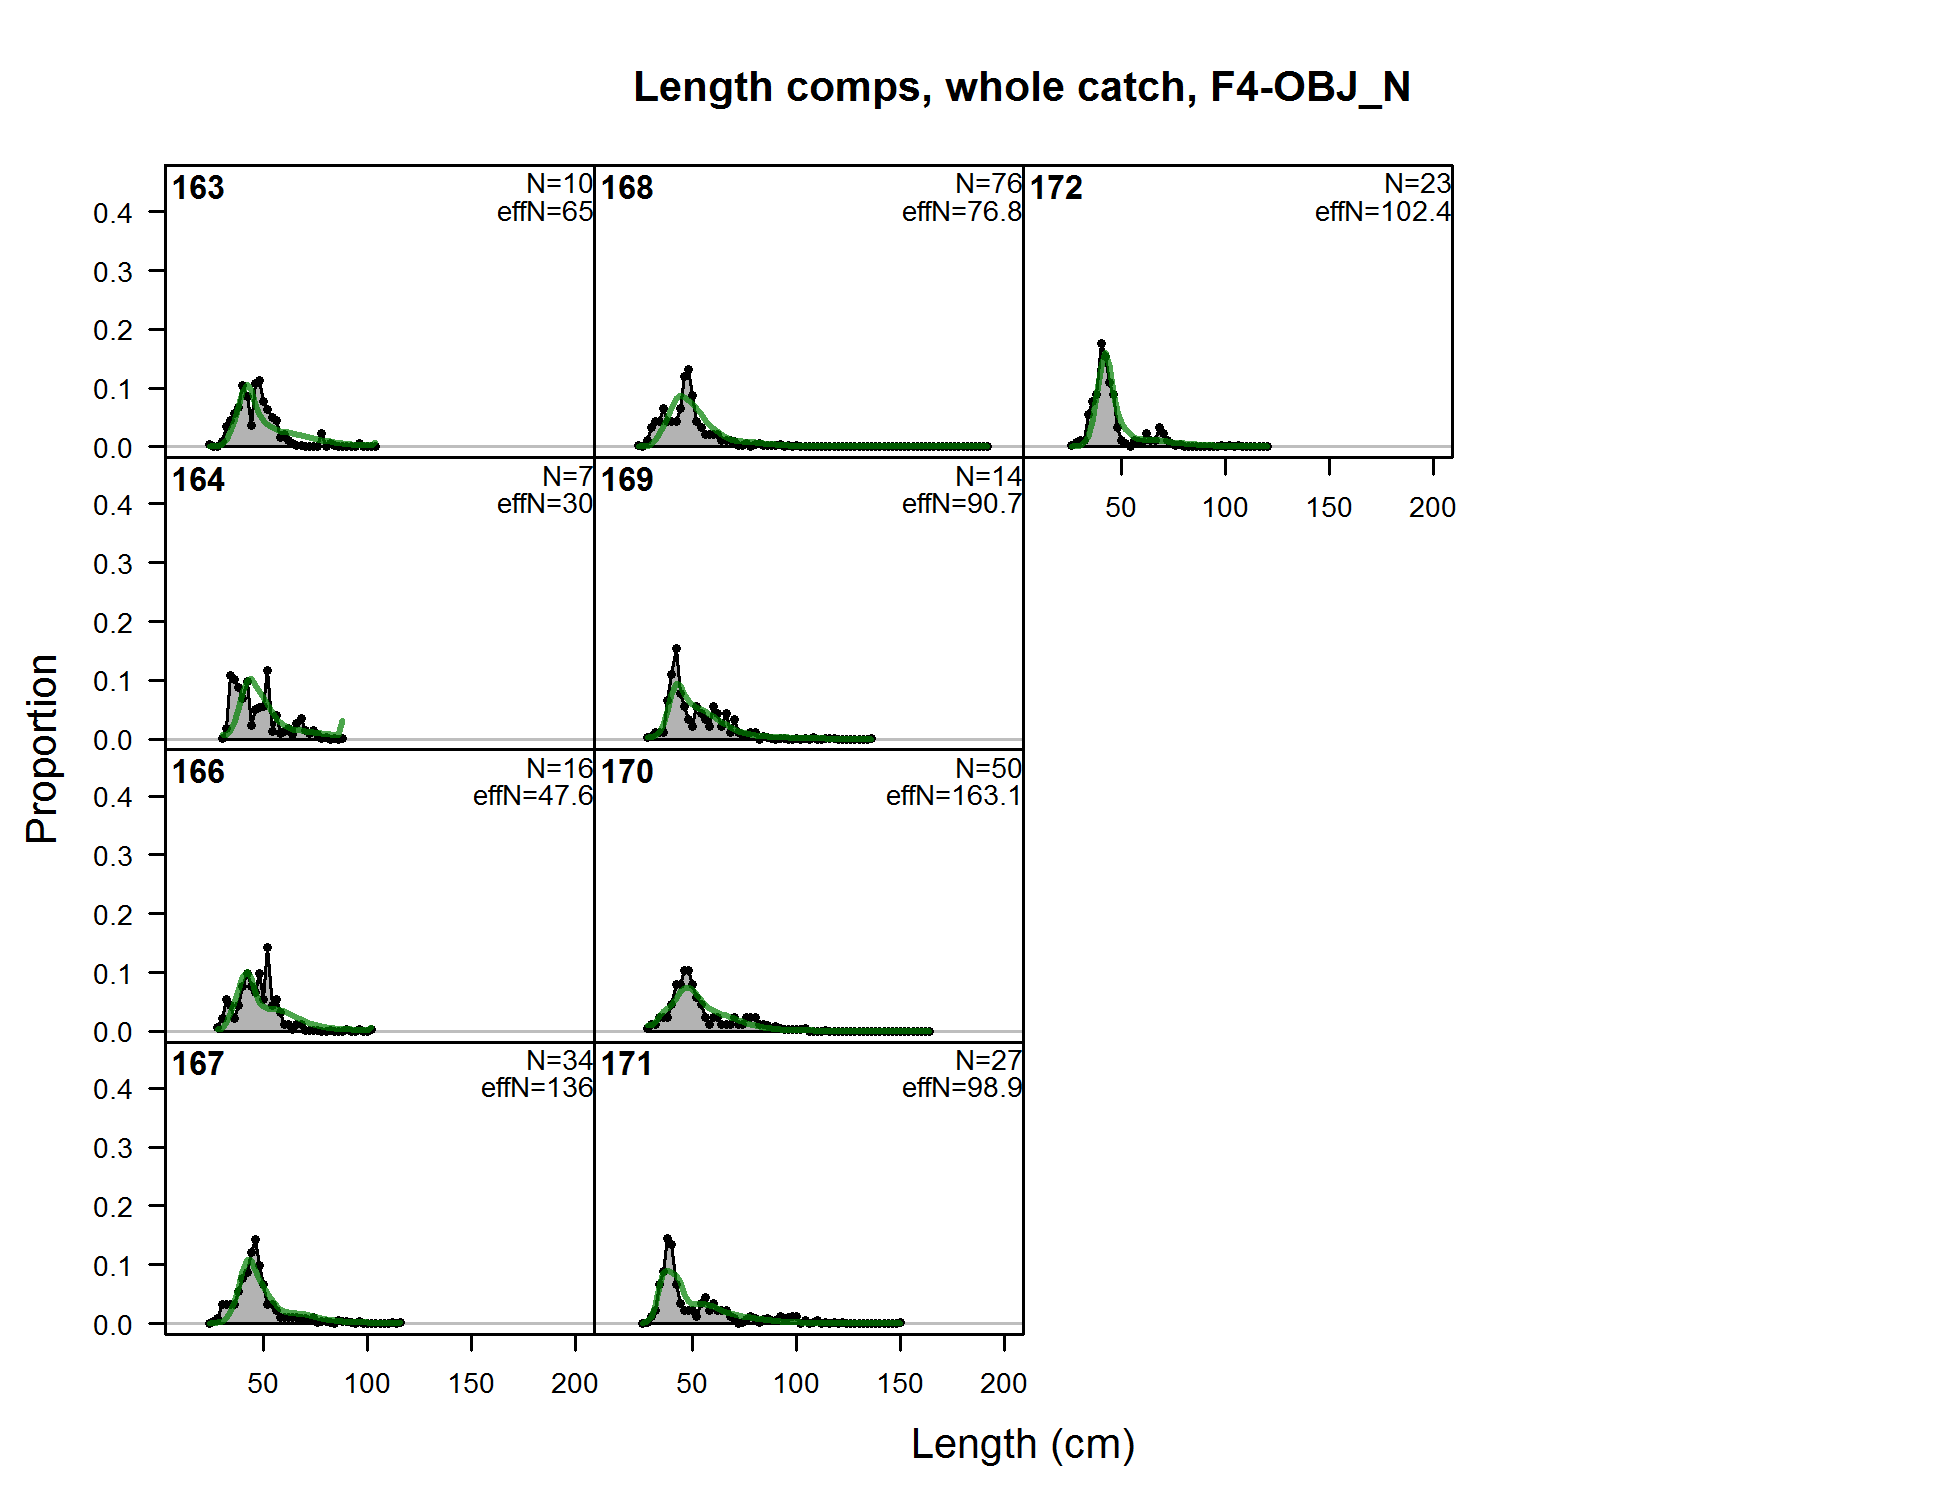
Length comps, whole catch, F4-OBJ_N (plot 1 of 8) (plot 2 of 8) (plot 3 of 8) (plot 4 of 8) (plot 5 of 8) (plot 6 of 8) (plot 7 of 8)
file: comp_lenfit_flt4mkt0_page7.png
Length comps, whole catch, F4-OBJ_N (plot 1 of 8) (plot 2 of 8) (plot 3 of 8) (plot 4 of 8) (plot 5 of 8) (plot 6 of 8) (plot 7 of 8) (plot 8 of 8)
file: comp_lenfit_flt4mkt0_page8.png
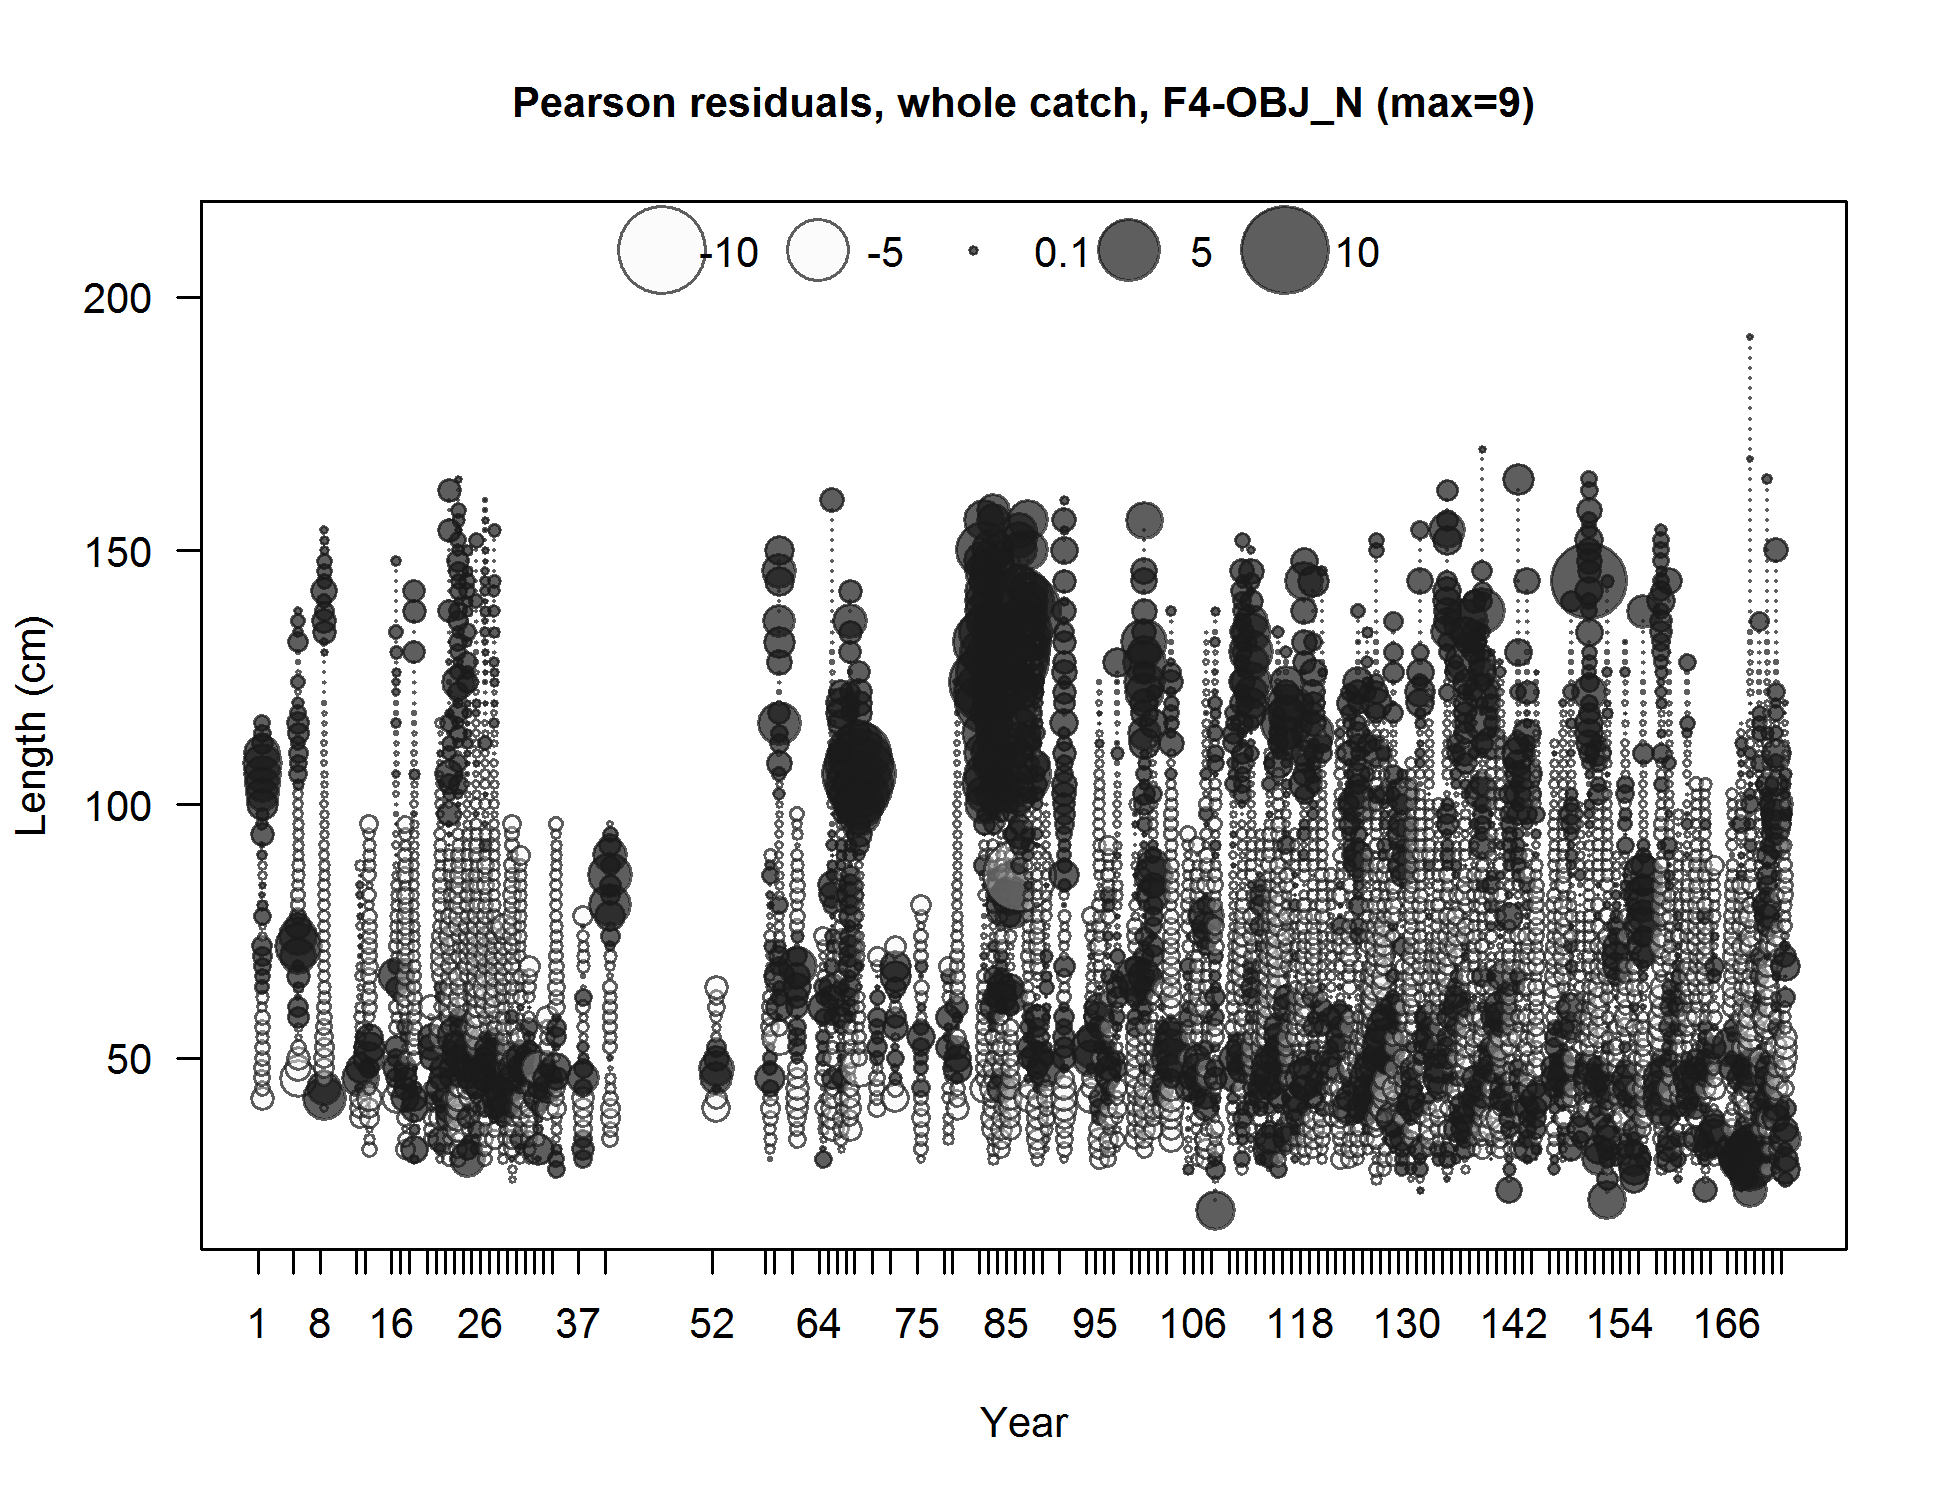
Pearson residuals, whole catch, F4-OBJ_N (max=9) (plot 8 of 8)
Closed bubbles are positive residuals (observed > expected) and open bubbles are negative residuals (observed < expected).
file: comp_lenfit_residsflt4mkt0_page8.png
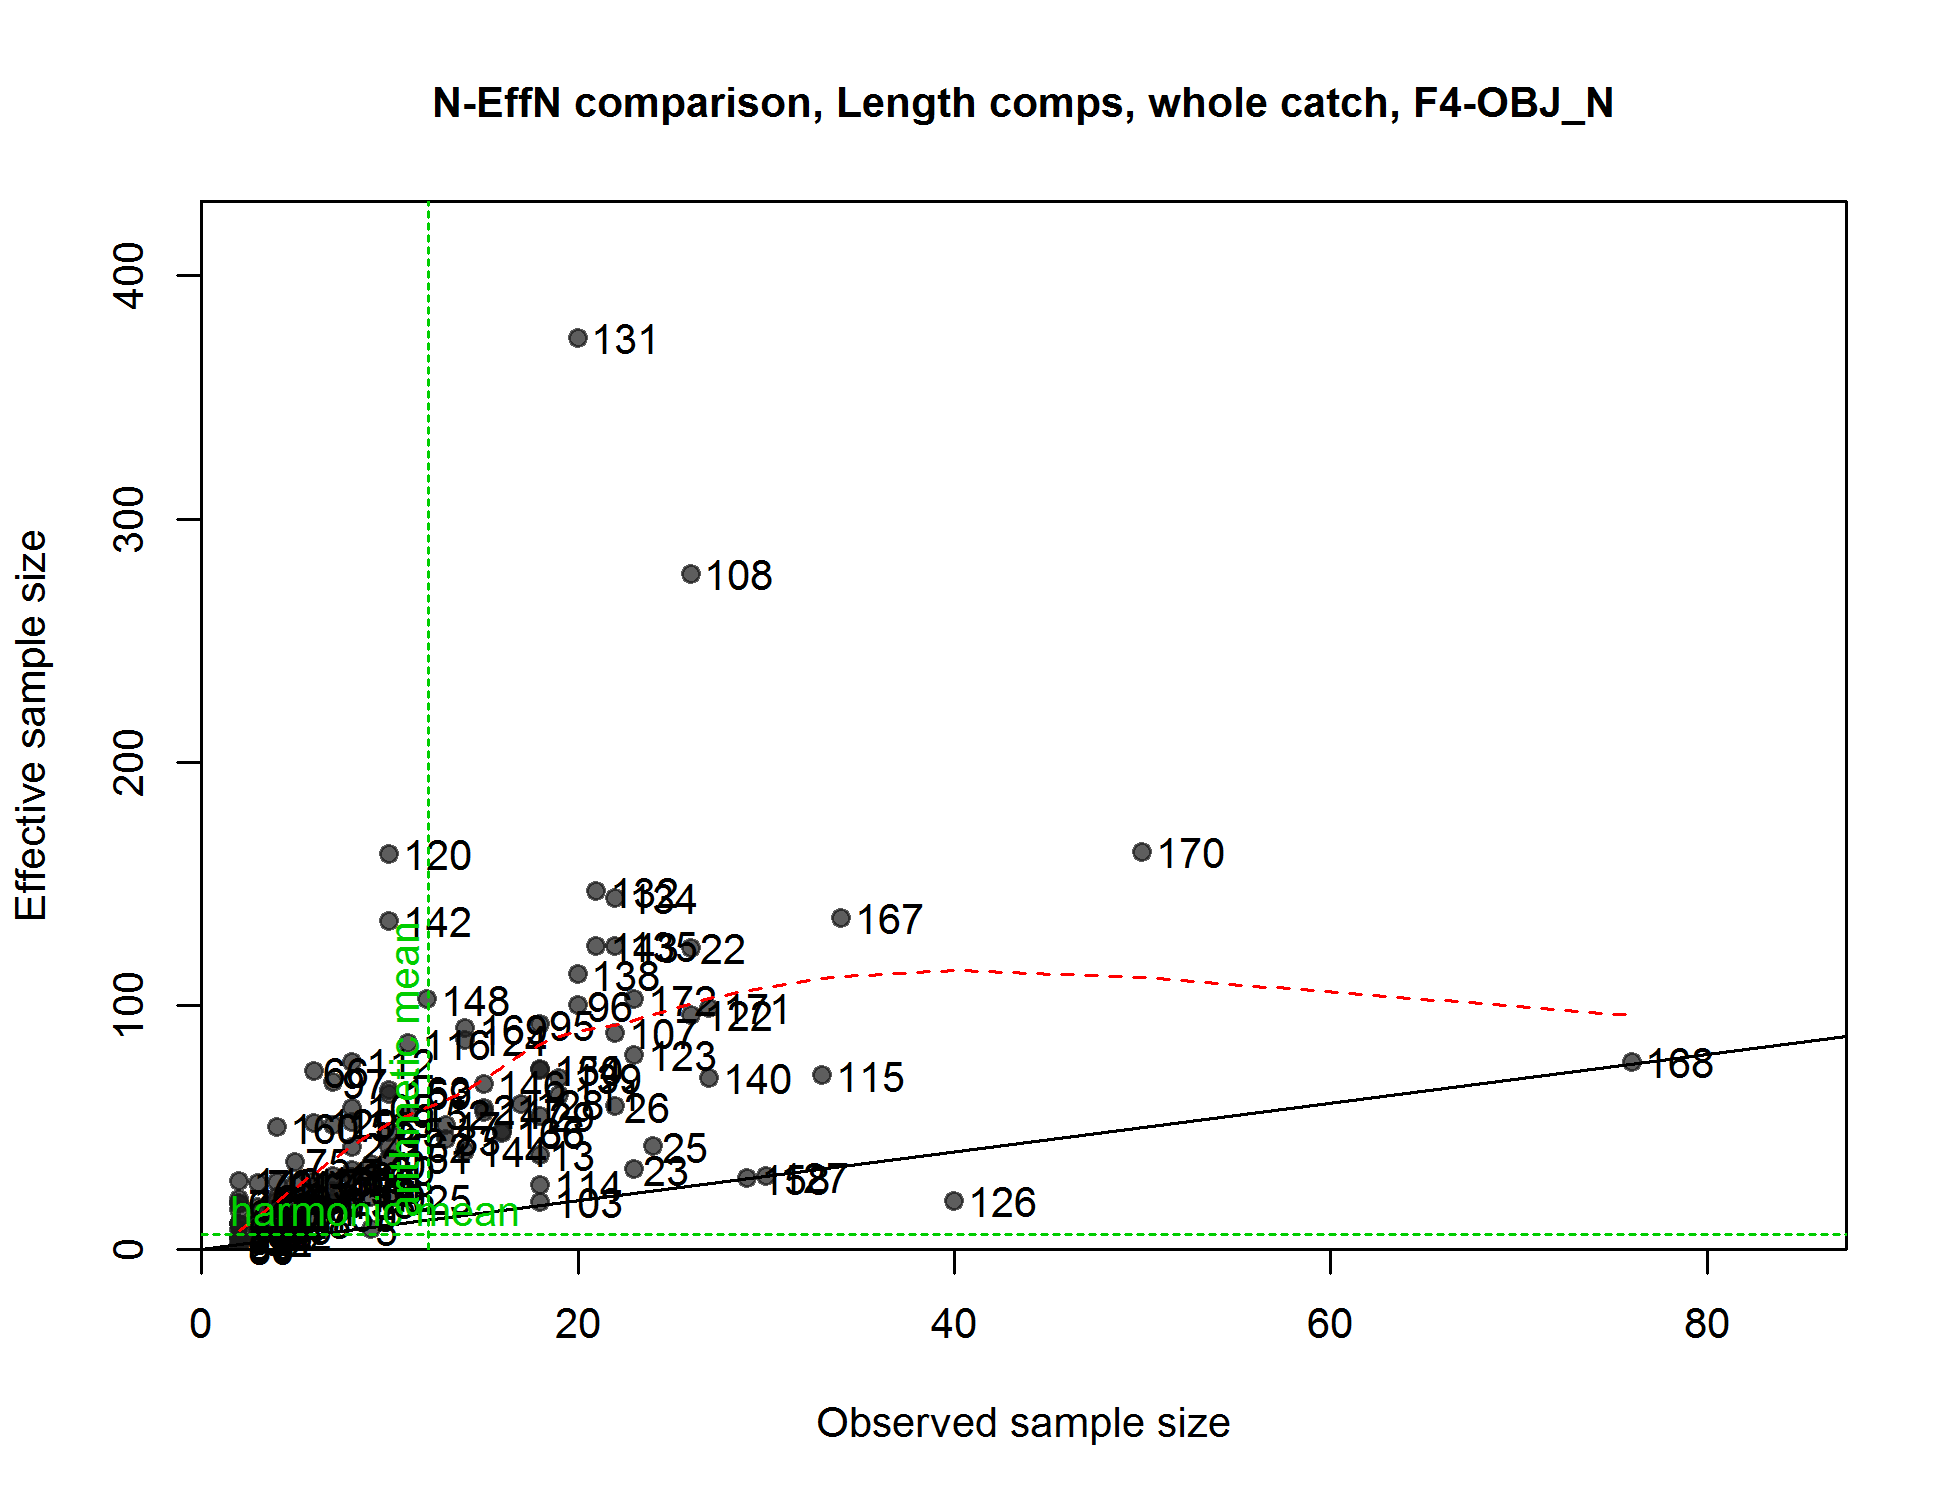
N-EffN comparison, Length comps, whole catch, F4-OBJ_N
file: comp_lenfit_sampsize_flt4mkt0.png
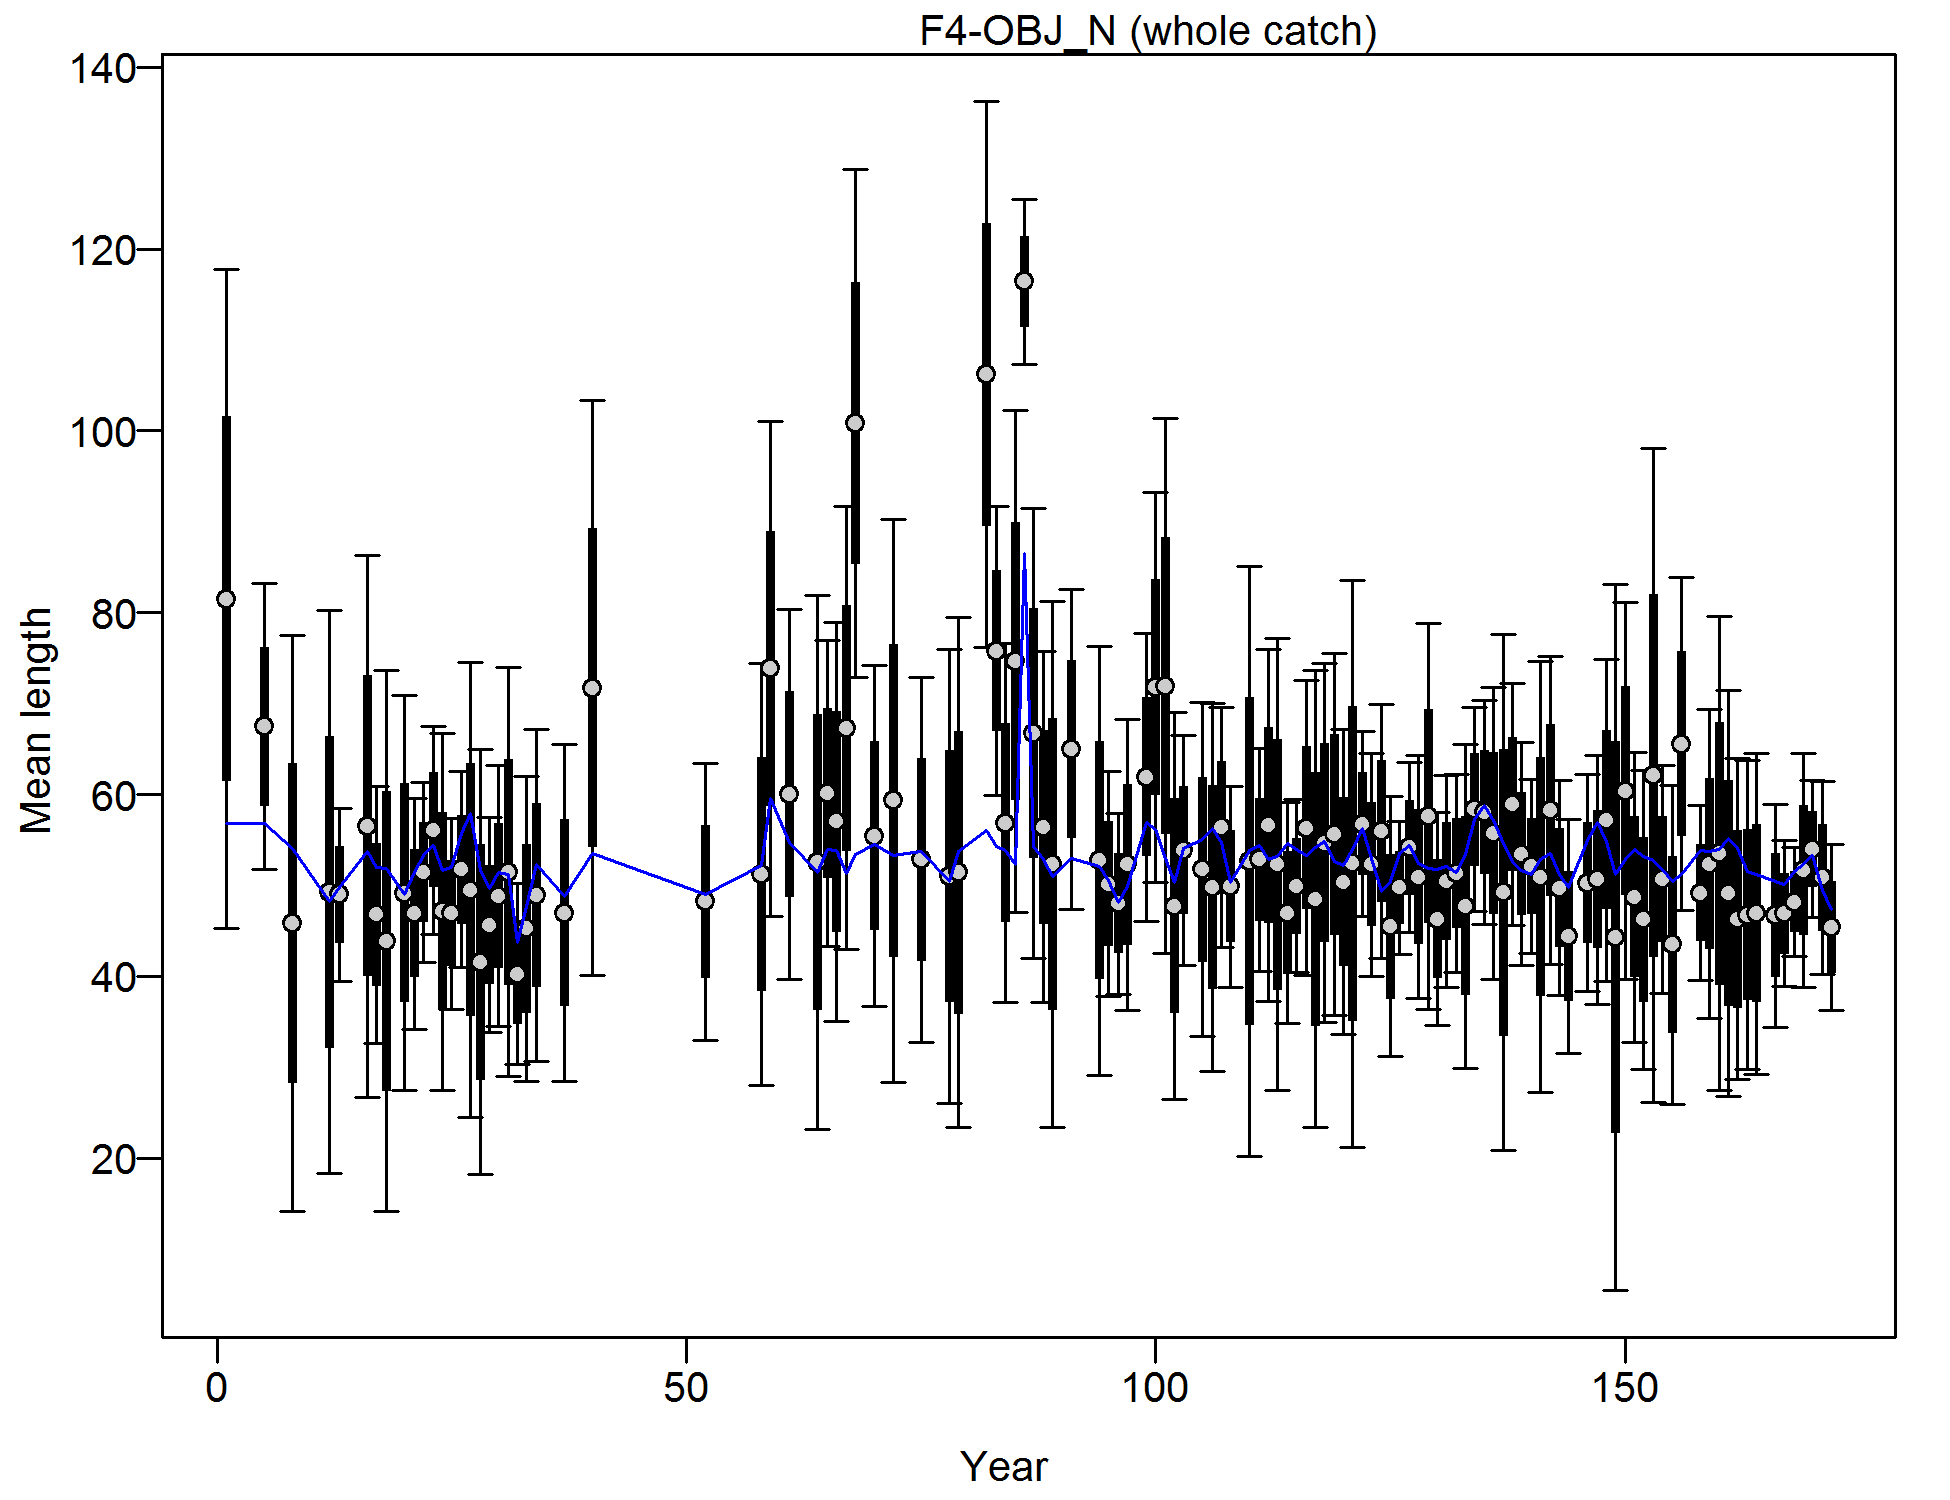
Mean length for F4-OBJ_N with 95% confidence intervals based on current samples sizes.
Francis data weighting method TA1.8: thinner intervals (with capped ends) show result of further adjusting sample sizes based on suggested multiplier (with 95% interval) for len data from F4-OBJ_N:
0.3078 (0.165-0.6992)
For more info, see
Francis, R.I.C.C. (2011). Data weighting in statistical fisheries stock assessment models. Can. J. Fish. Aquat. Sci. 68: 1124-1138.
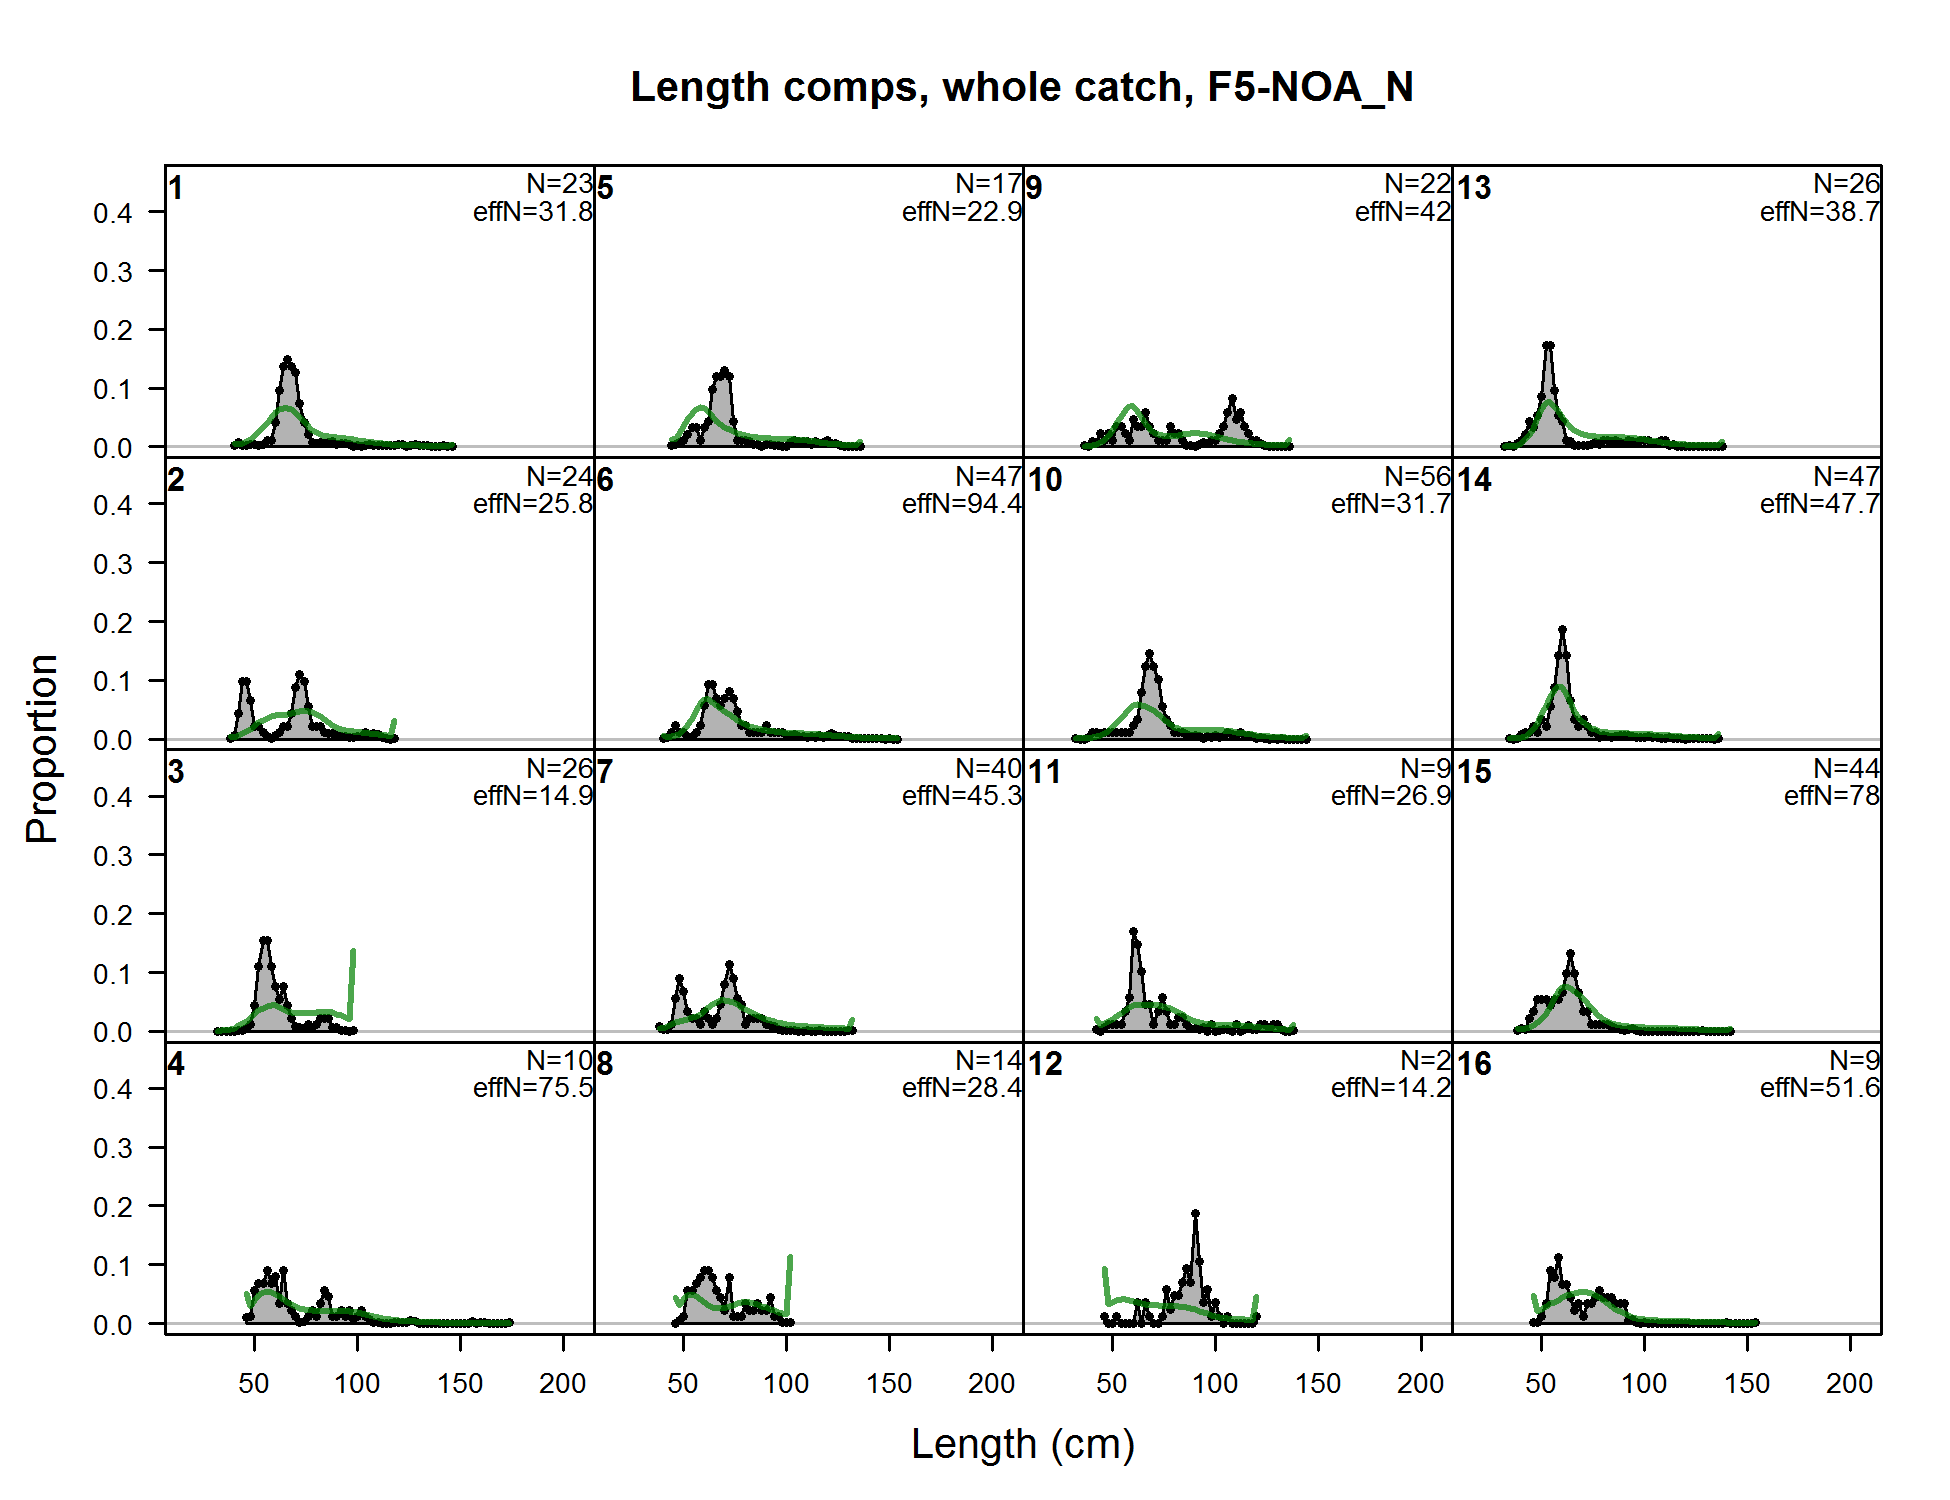
Length comps, whole catch, F5-NOA_N (plot 1 of 11)
file: comp_lenfit_flt5mkt0_page1.png
Length comps, whole catch, F5-NOA_N (plot 1 of 11) (plot 2 of 11)
file: comp_lenfit_flt5mkt0_page2.png
Length comps, whole catch, F5-NOA_N (plot 1 of 11) (plot 2 of 11) (plot 3 of 11)
file: comp_lenfit_flt5mkt0_page3.png
Length comps, whole catch, F5-NOA_N (plot 1 of 11) (plot 2 of 11) (plot 3 of 11) (plot 4 of 11)
file: comp_lenfit_flt5mkt0_page4.png
Length comps, whole catch, F5-NOA_N (plot 1 of 11) (plot 2 of 11) (plot 3 of 11) (plot 4 of 11) (plot 5 of 11)
file: comp_lenfit_flt5mkt0_page5.png
Length comps, whole catch, F5-NOA_N (plot 1 of 11) (plot 2 of 11) (plot 3 of 11) (plot 4 of 11) (plot 5 of 11) (plot 6 of 11)
file: comp_lenfit_flt5mkt0_page6.png
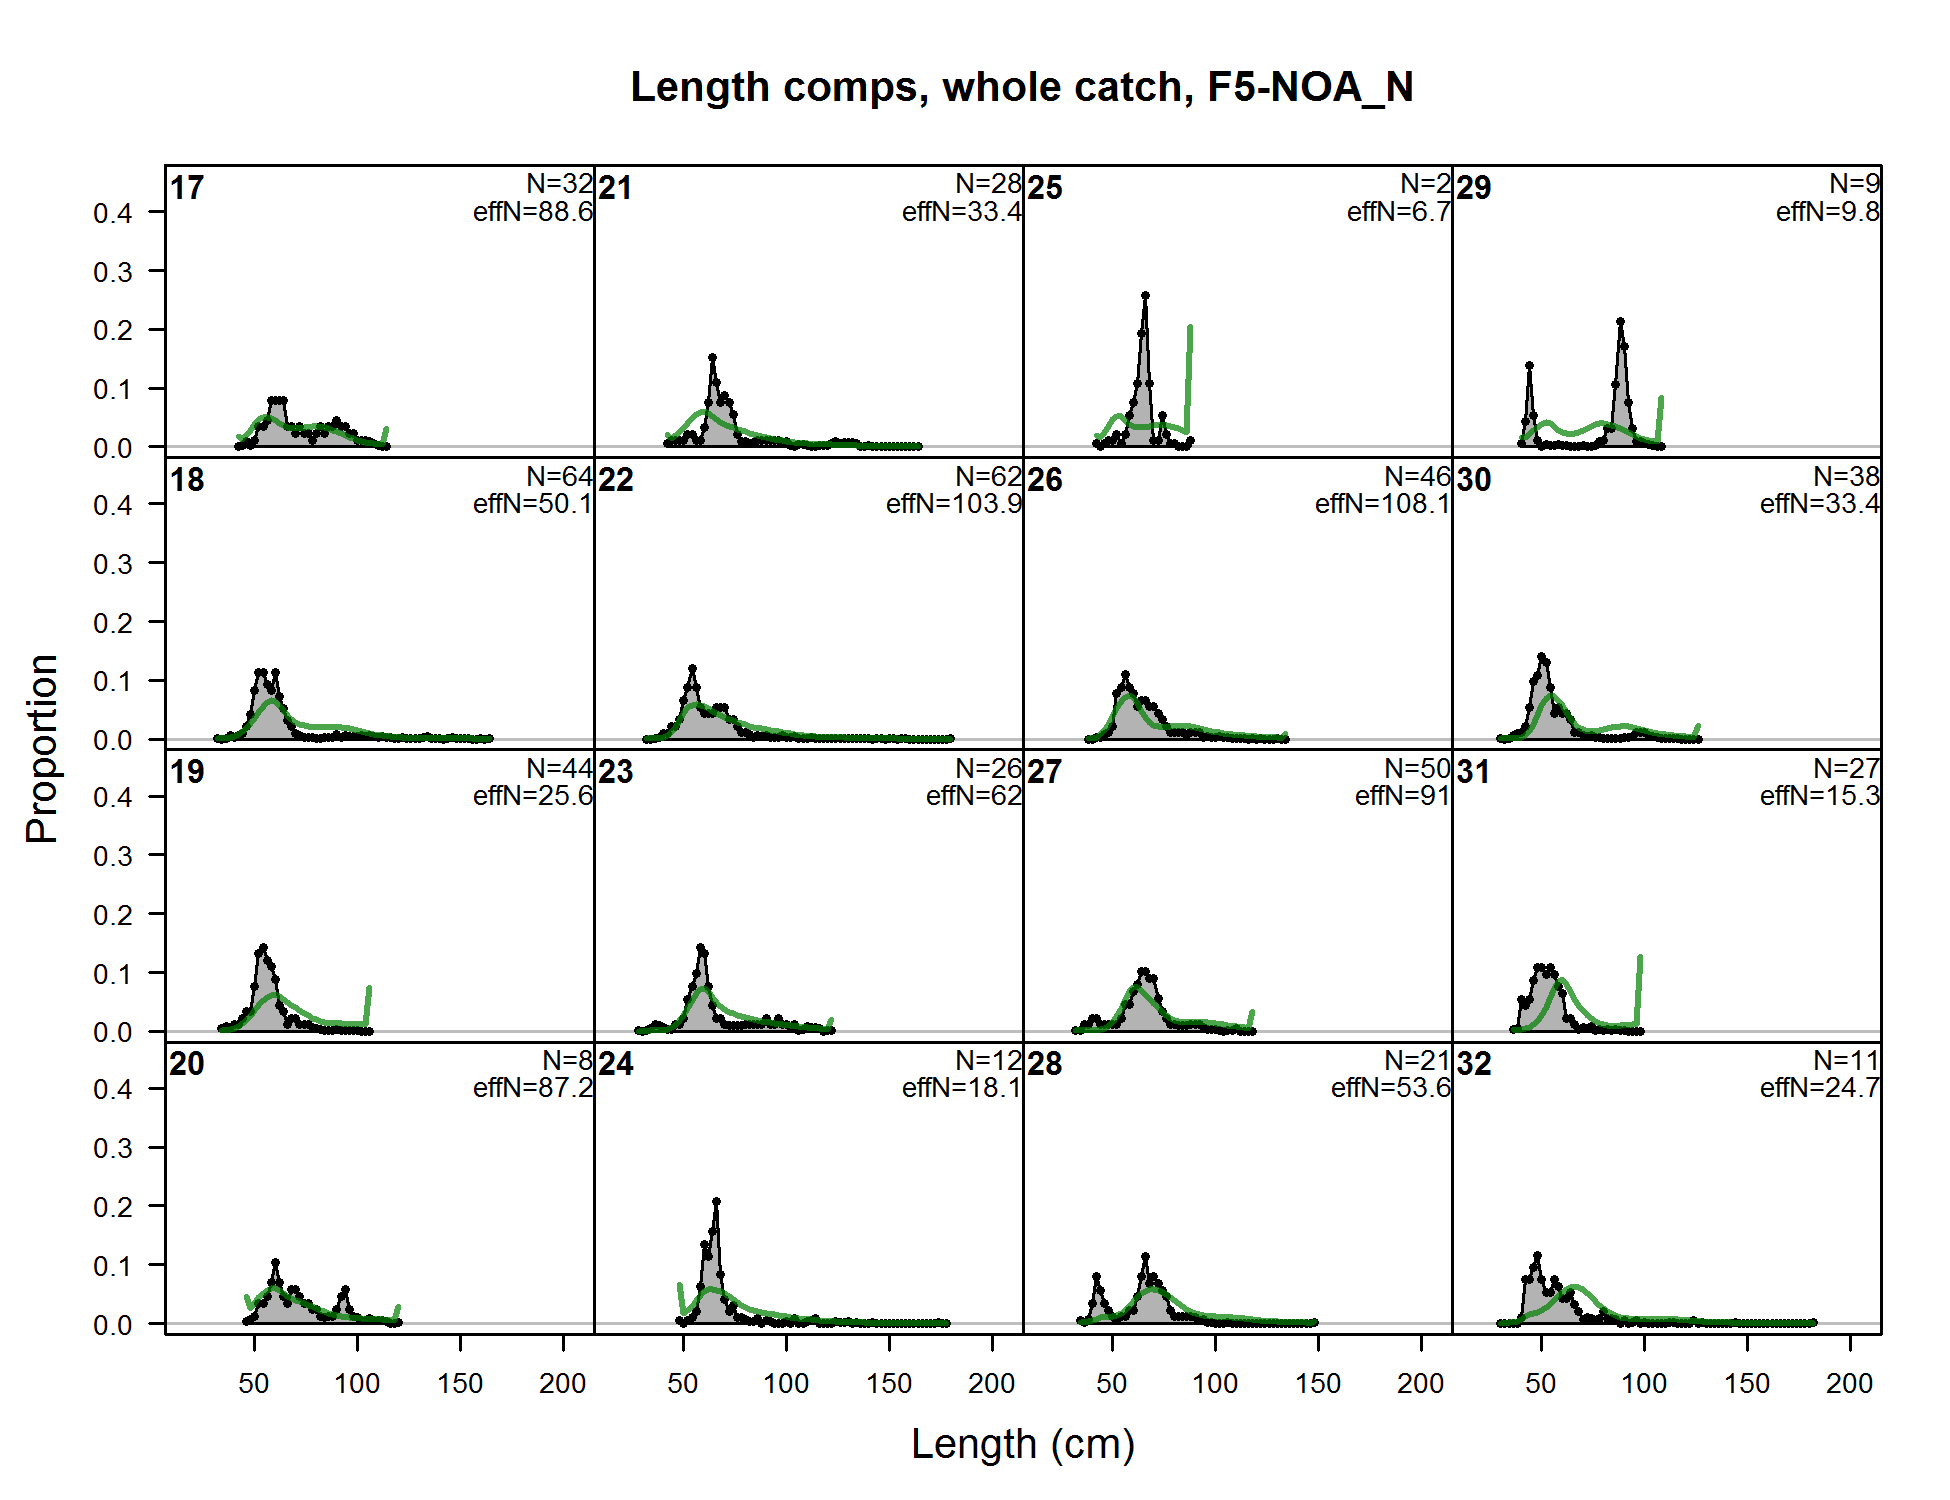
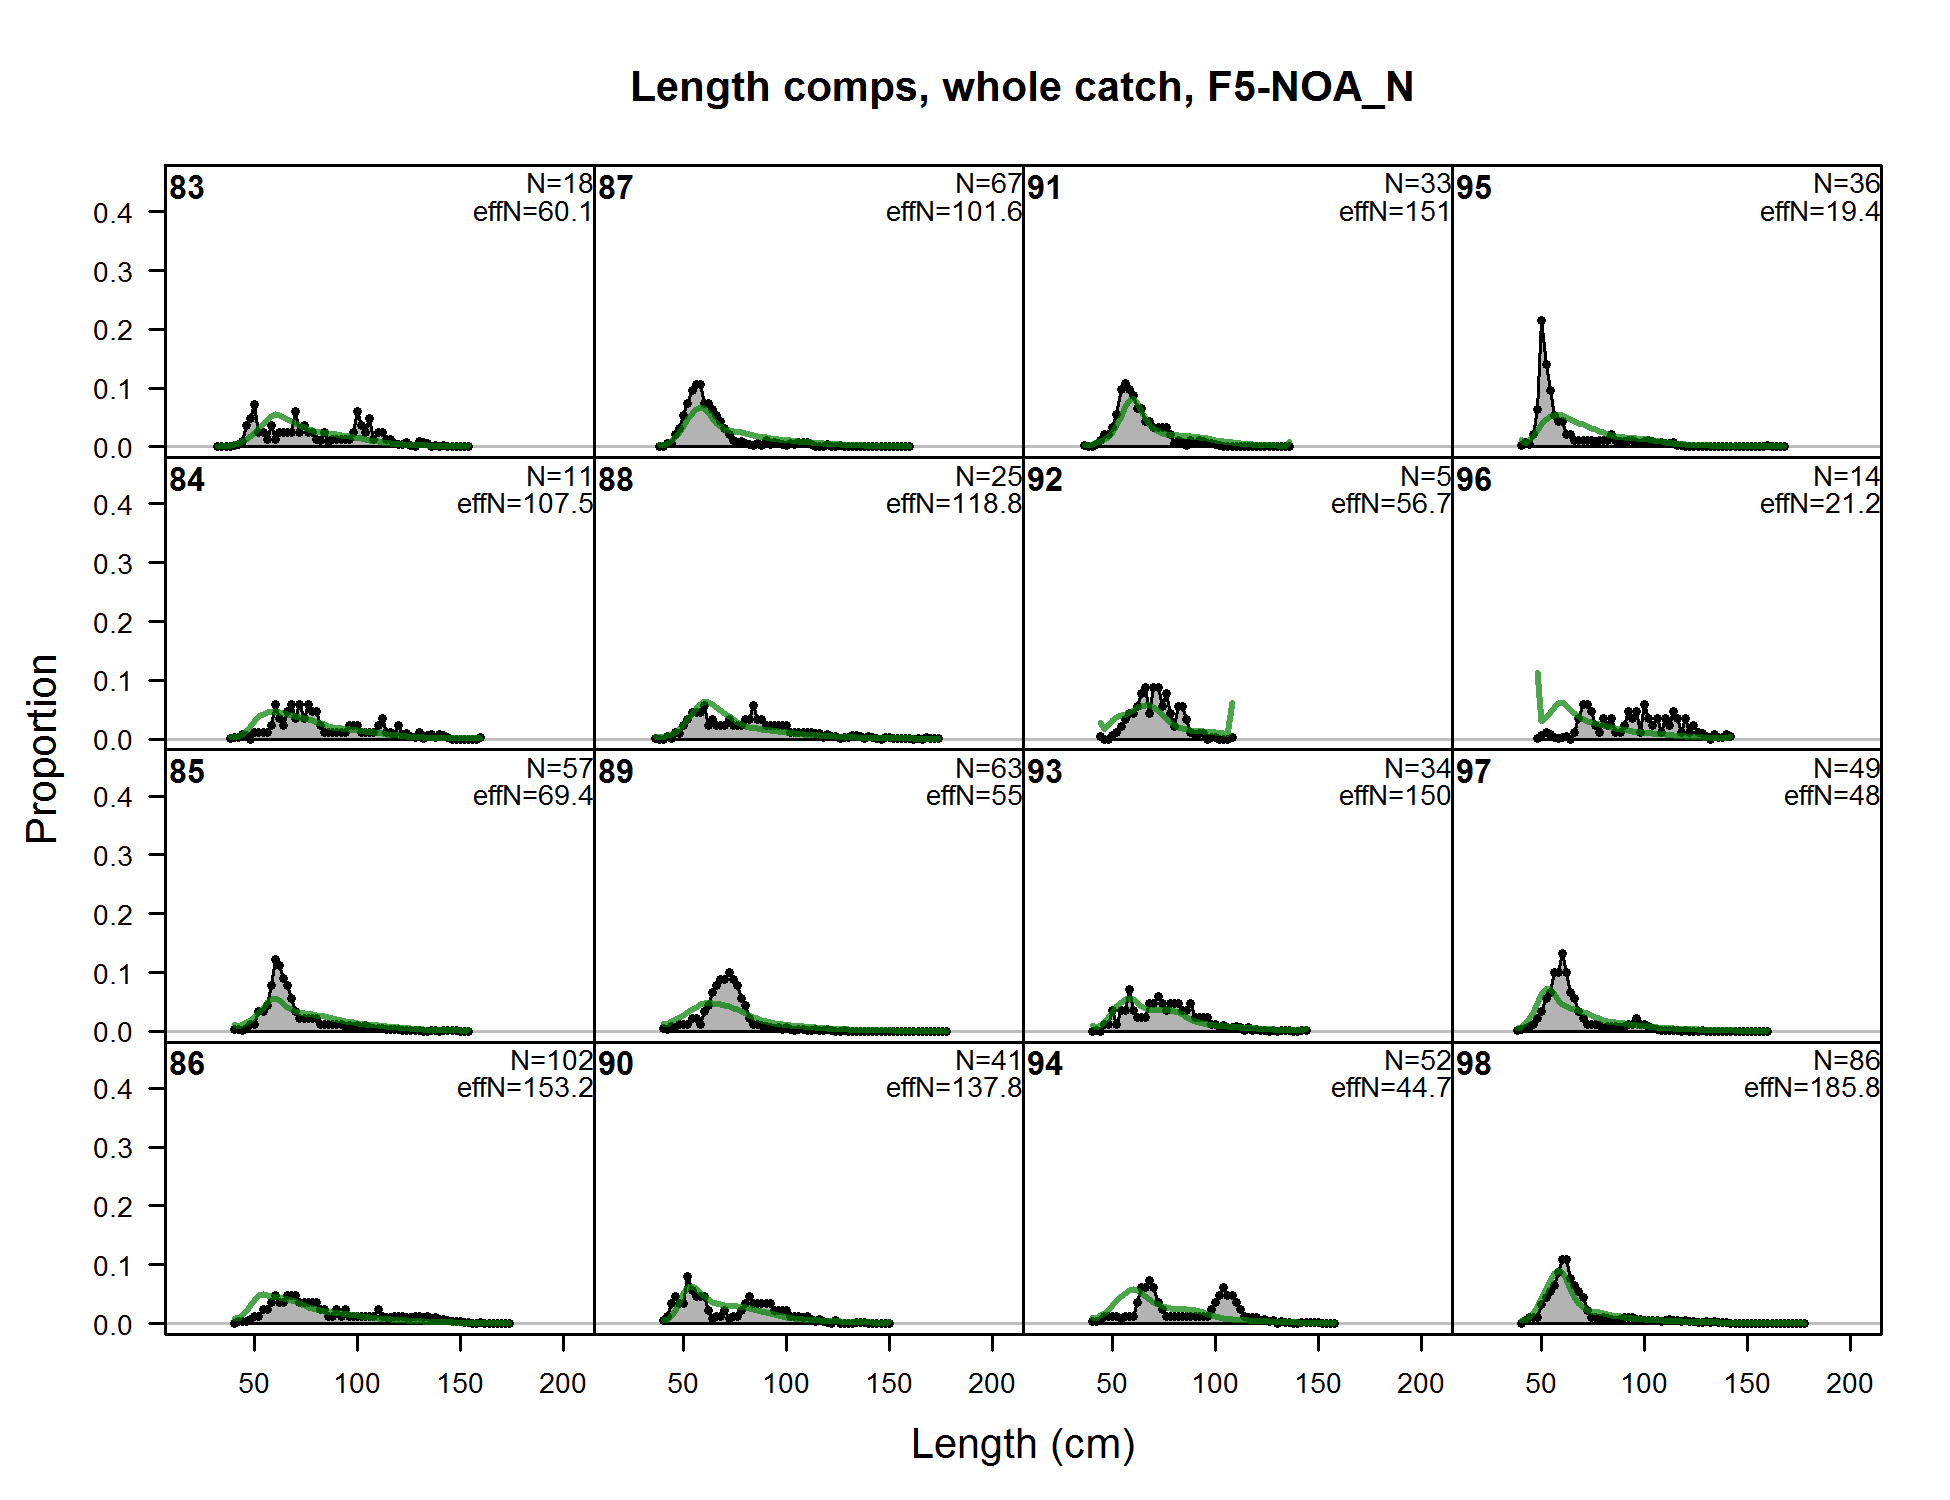
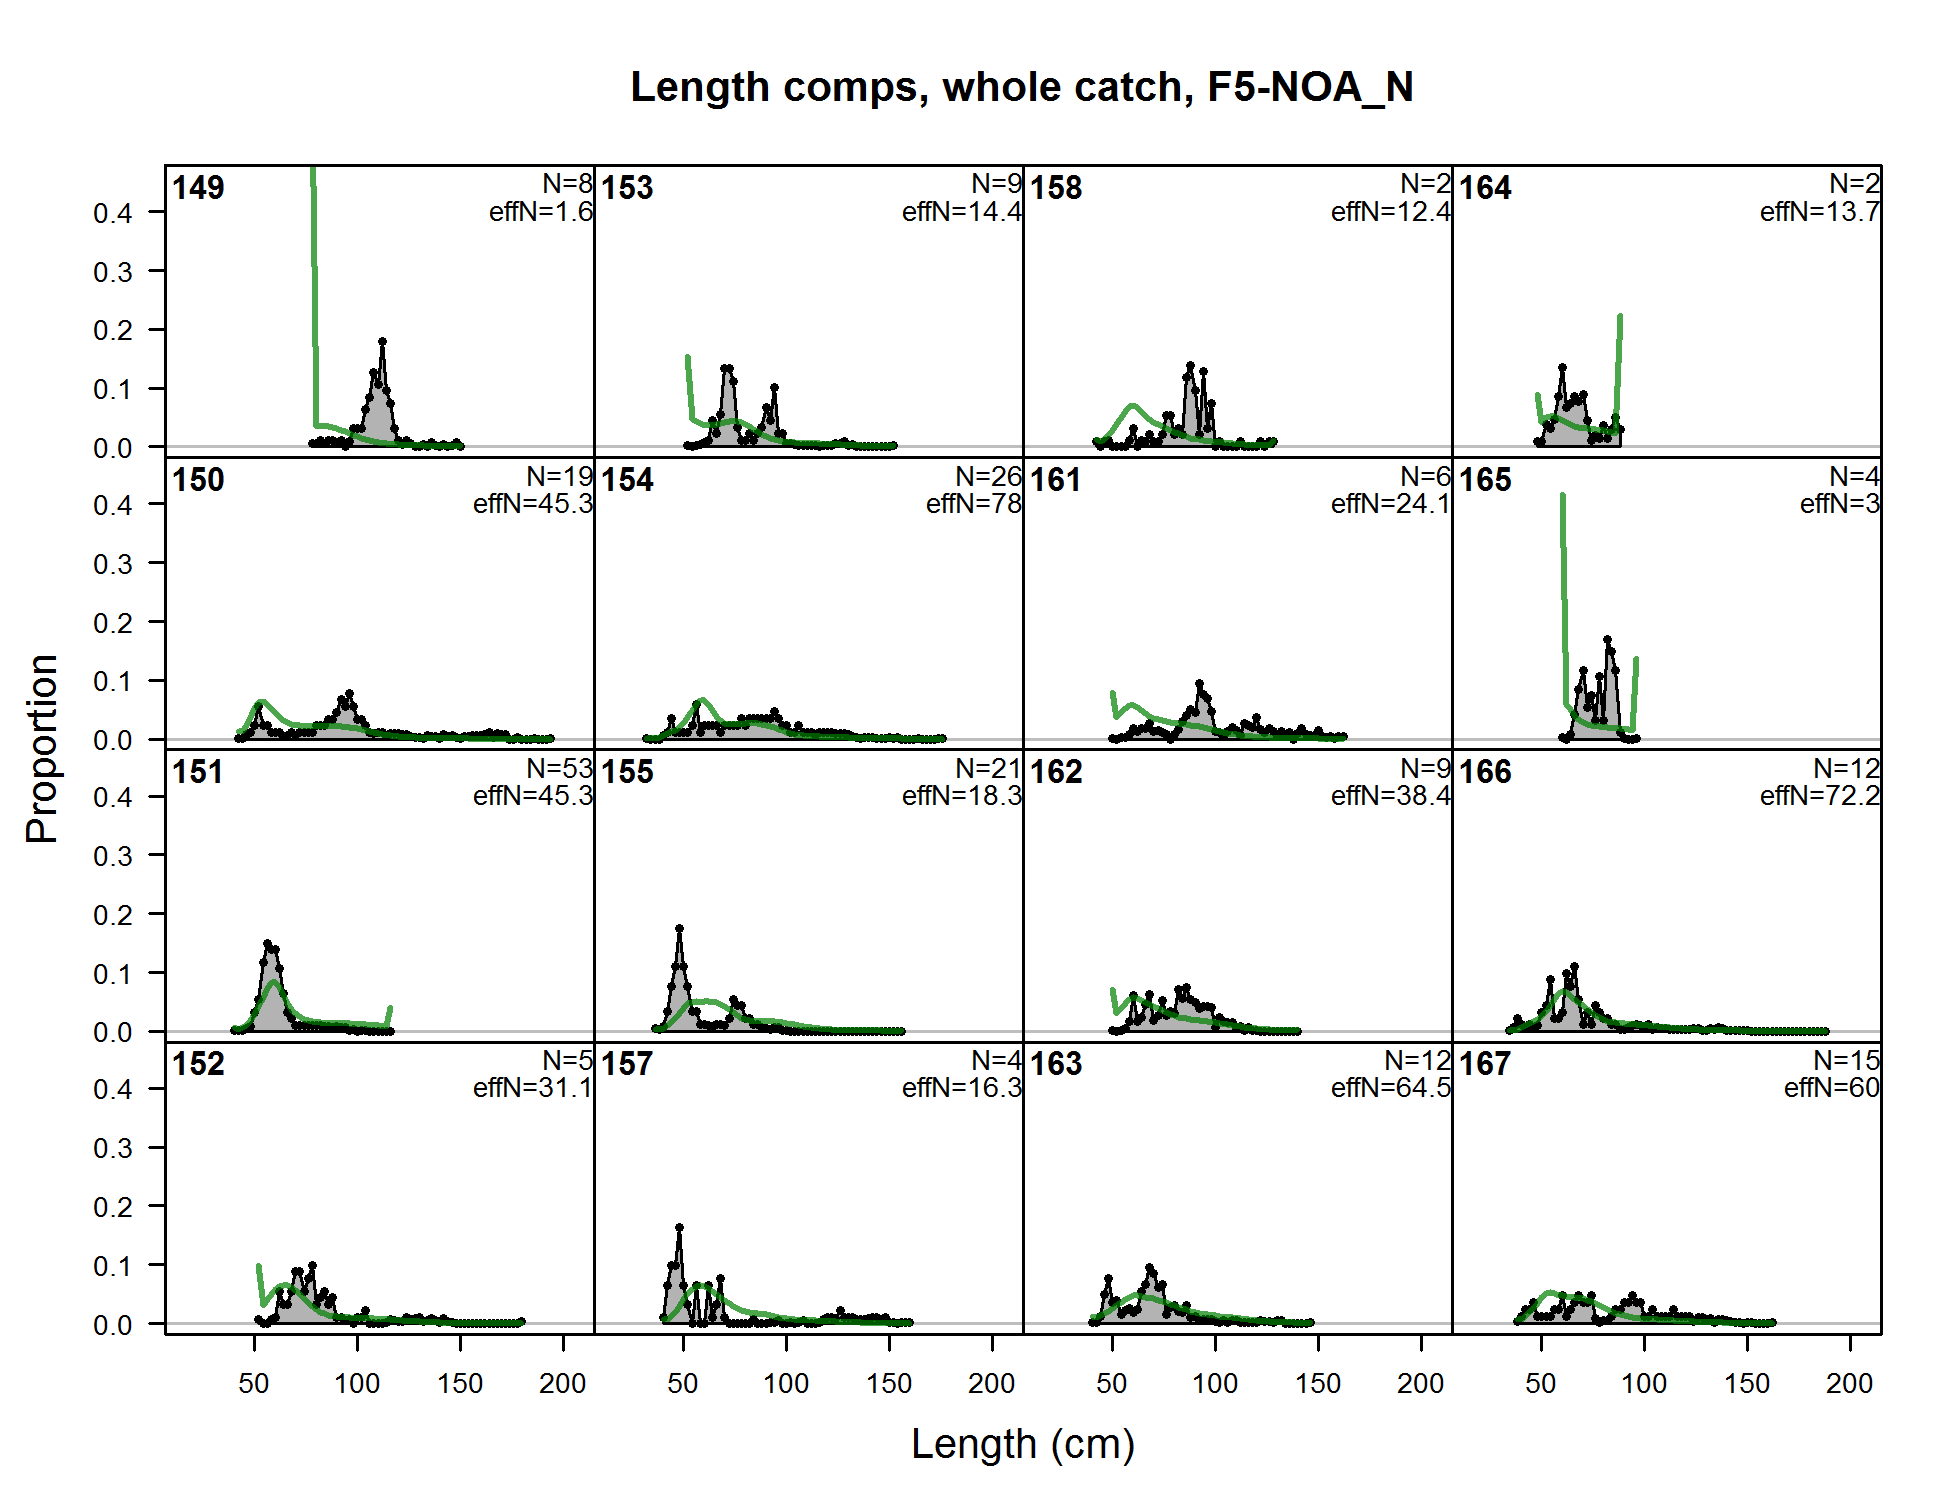
Length comps, whole catch, F5-NOA_N (plot 1 of 11) (plot 2 of 11) (plot 3 of 11) (plot 4 of 11) (plot 5 of 11) (plot 6 of 11) (plot 7 of 11)
file: comp_lenfit_flt5mkt0_page7.png
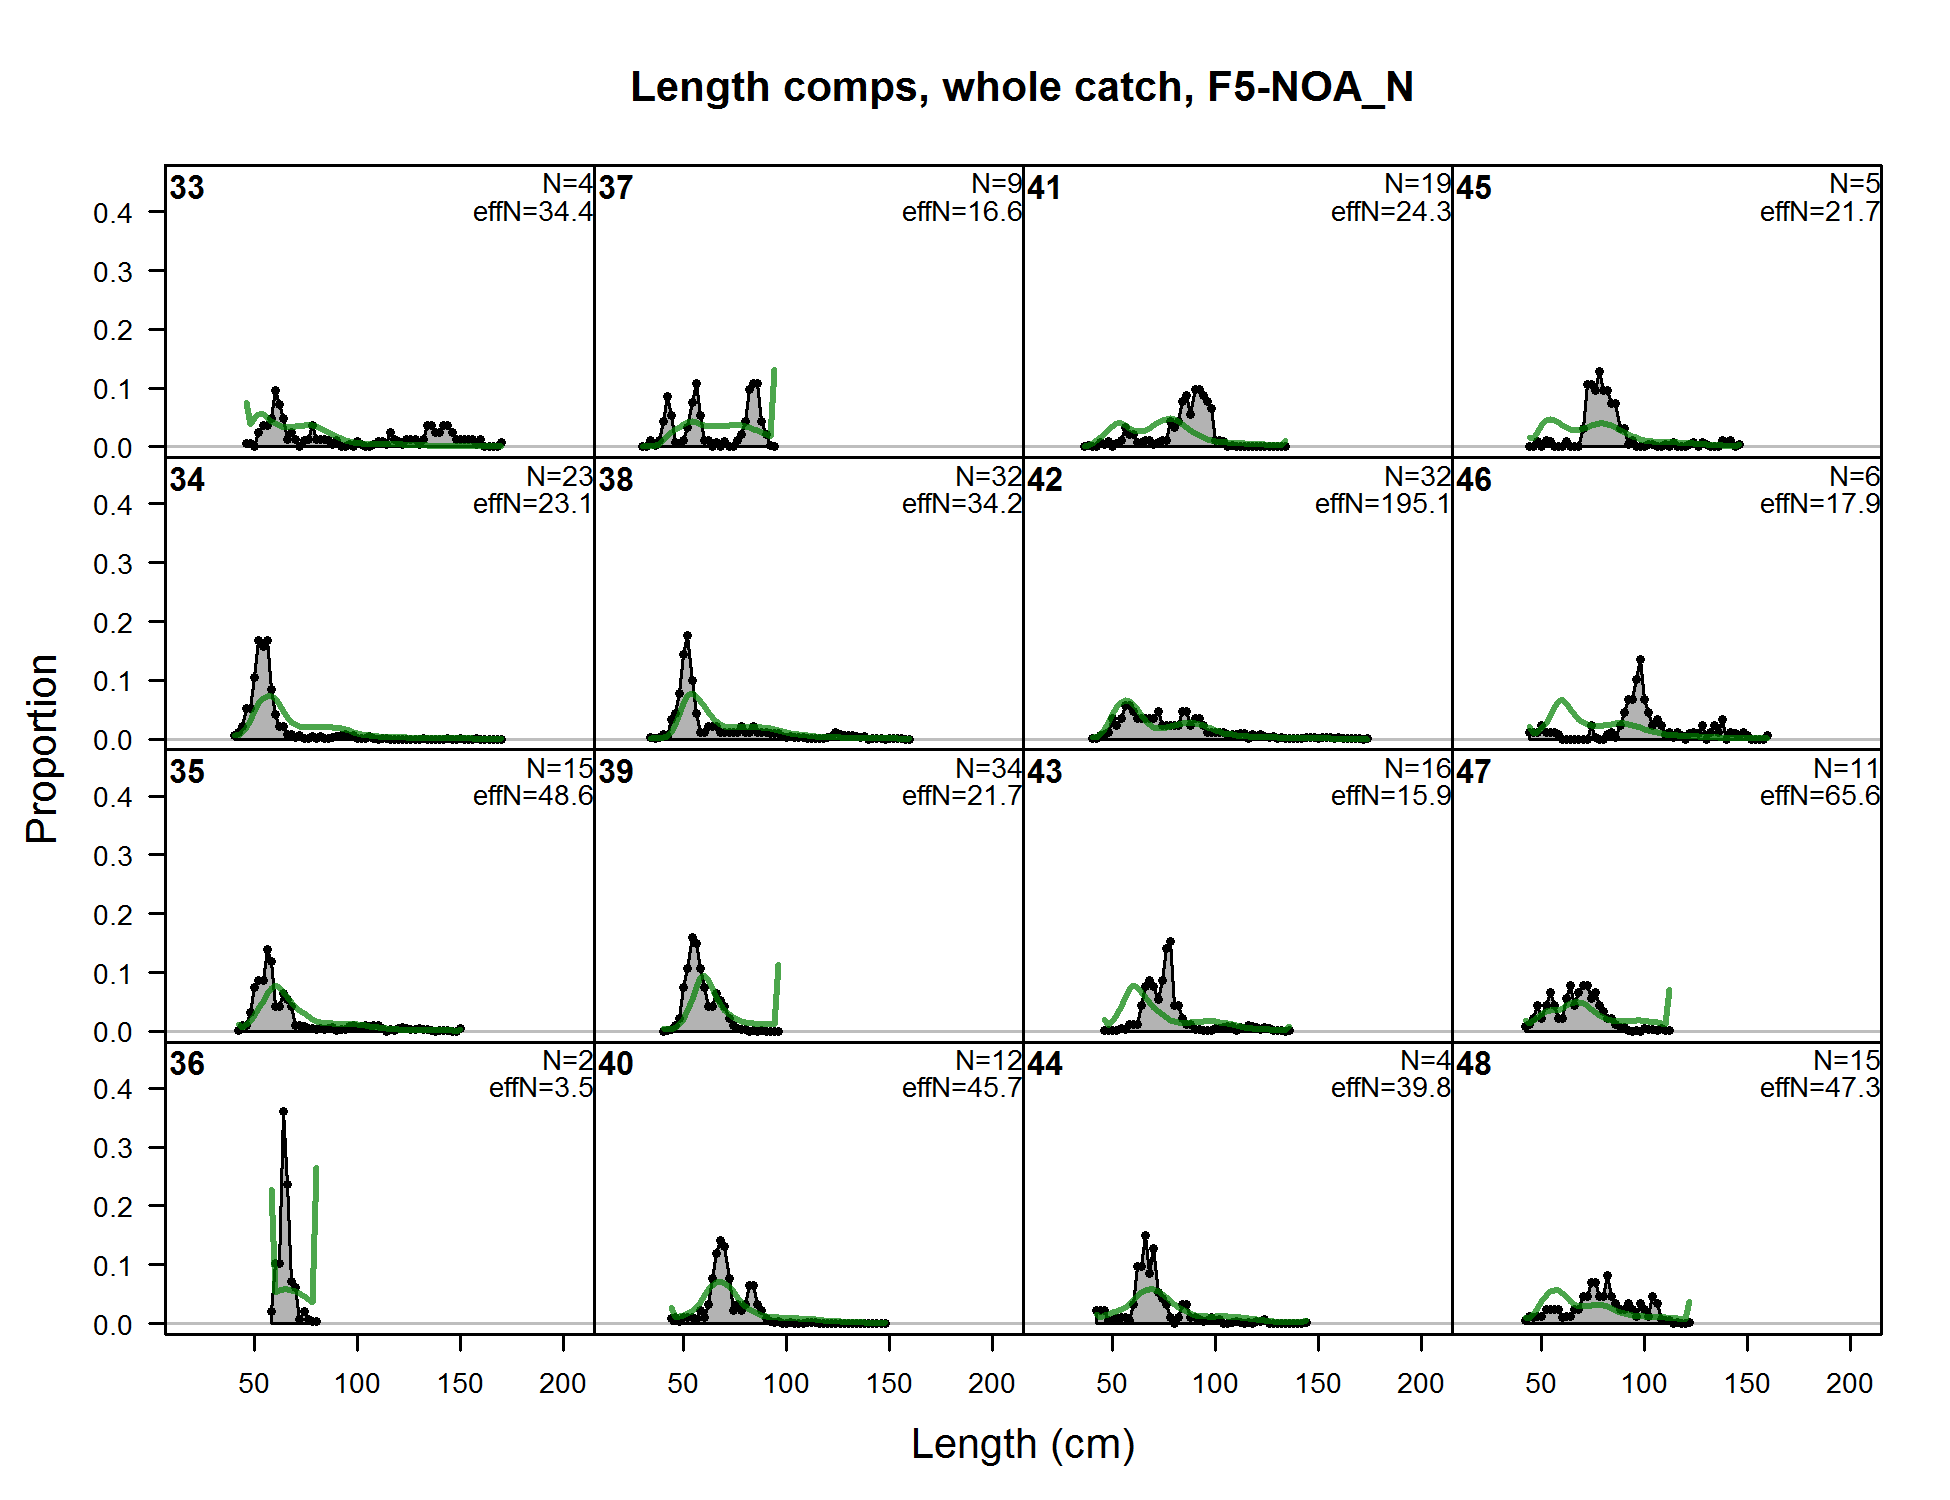
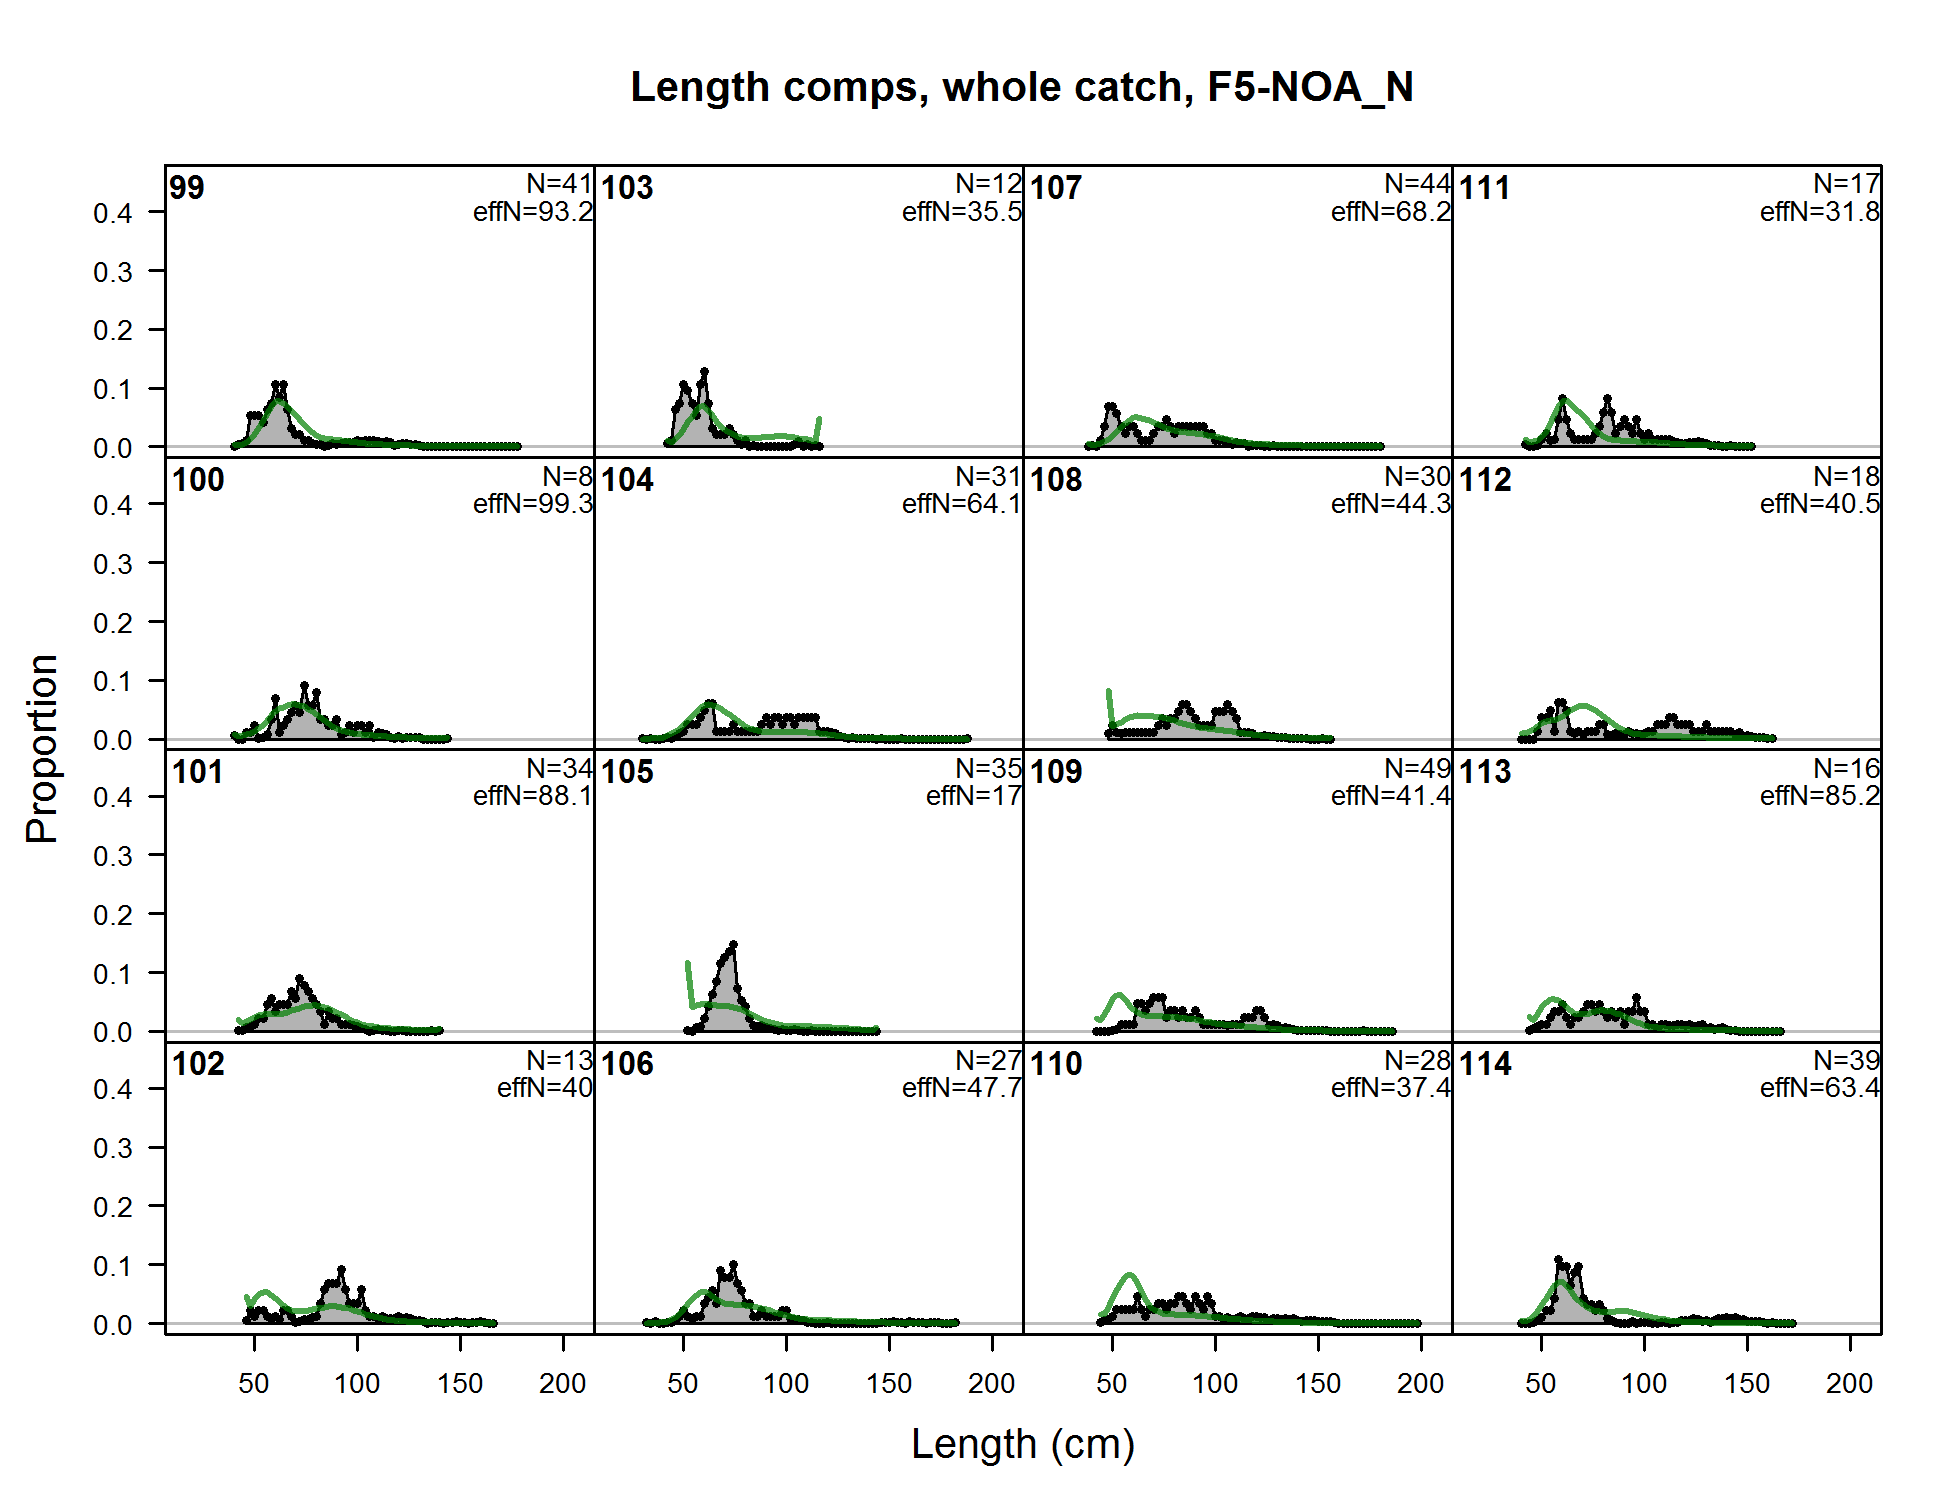
Length comps, whole catch, F5-NOA_N (plot 1 of 11) (plot 2 of 11) (plot 3 of 11) (plot 4 of 11) (plot 5 of 11) (plot 6 of 11) (plot 7 of 11) (plot 8 of 11)
file: comp_lenfit_flt5mkt0_page8.png
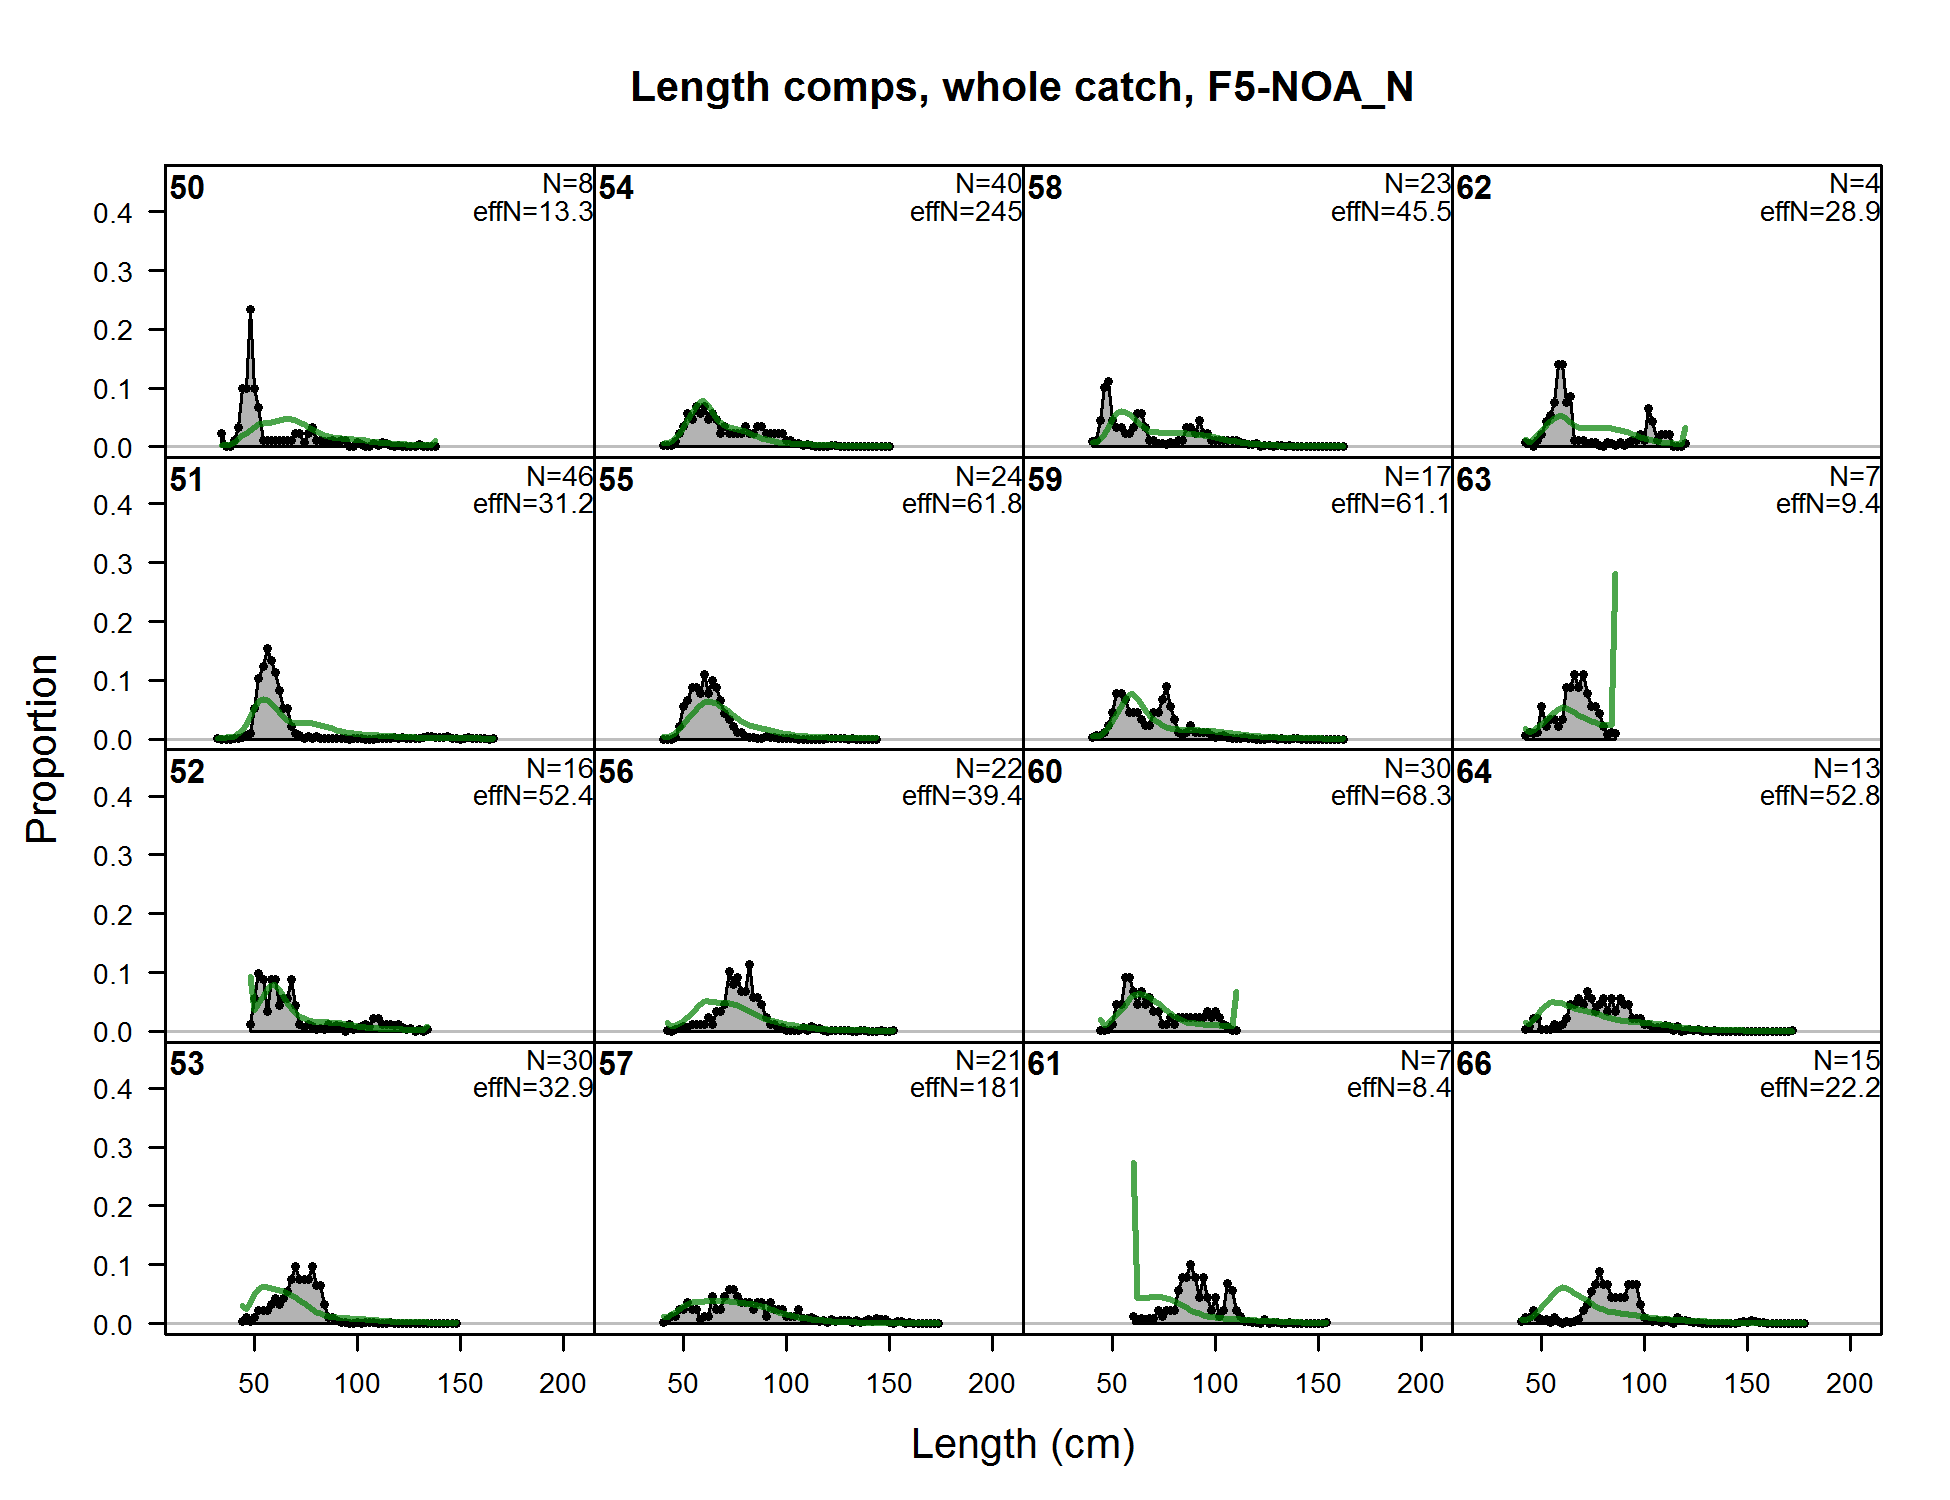
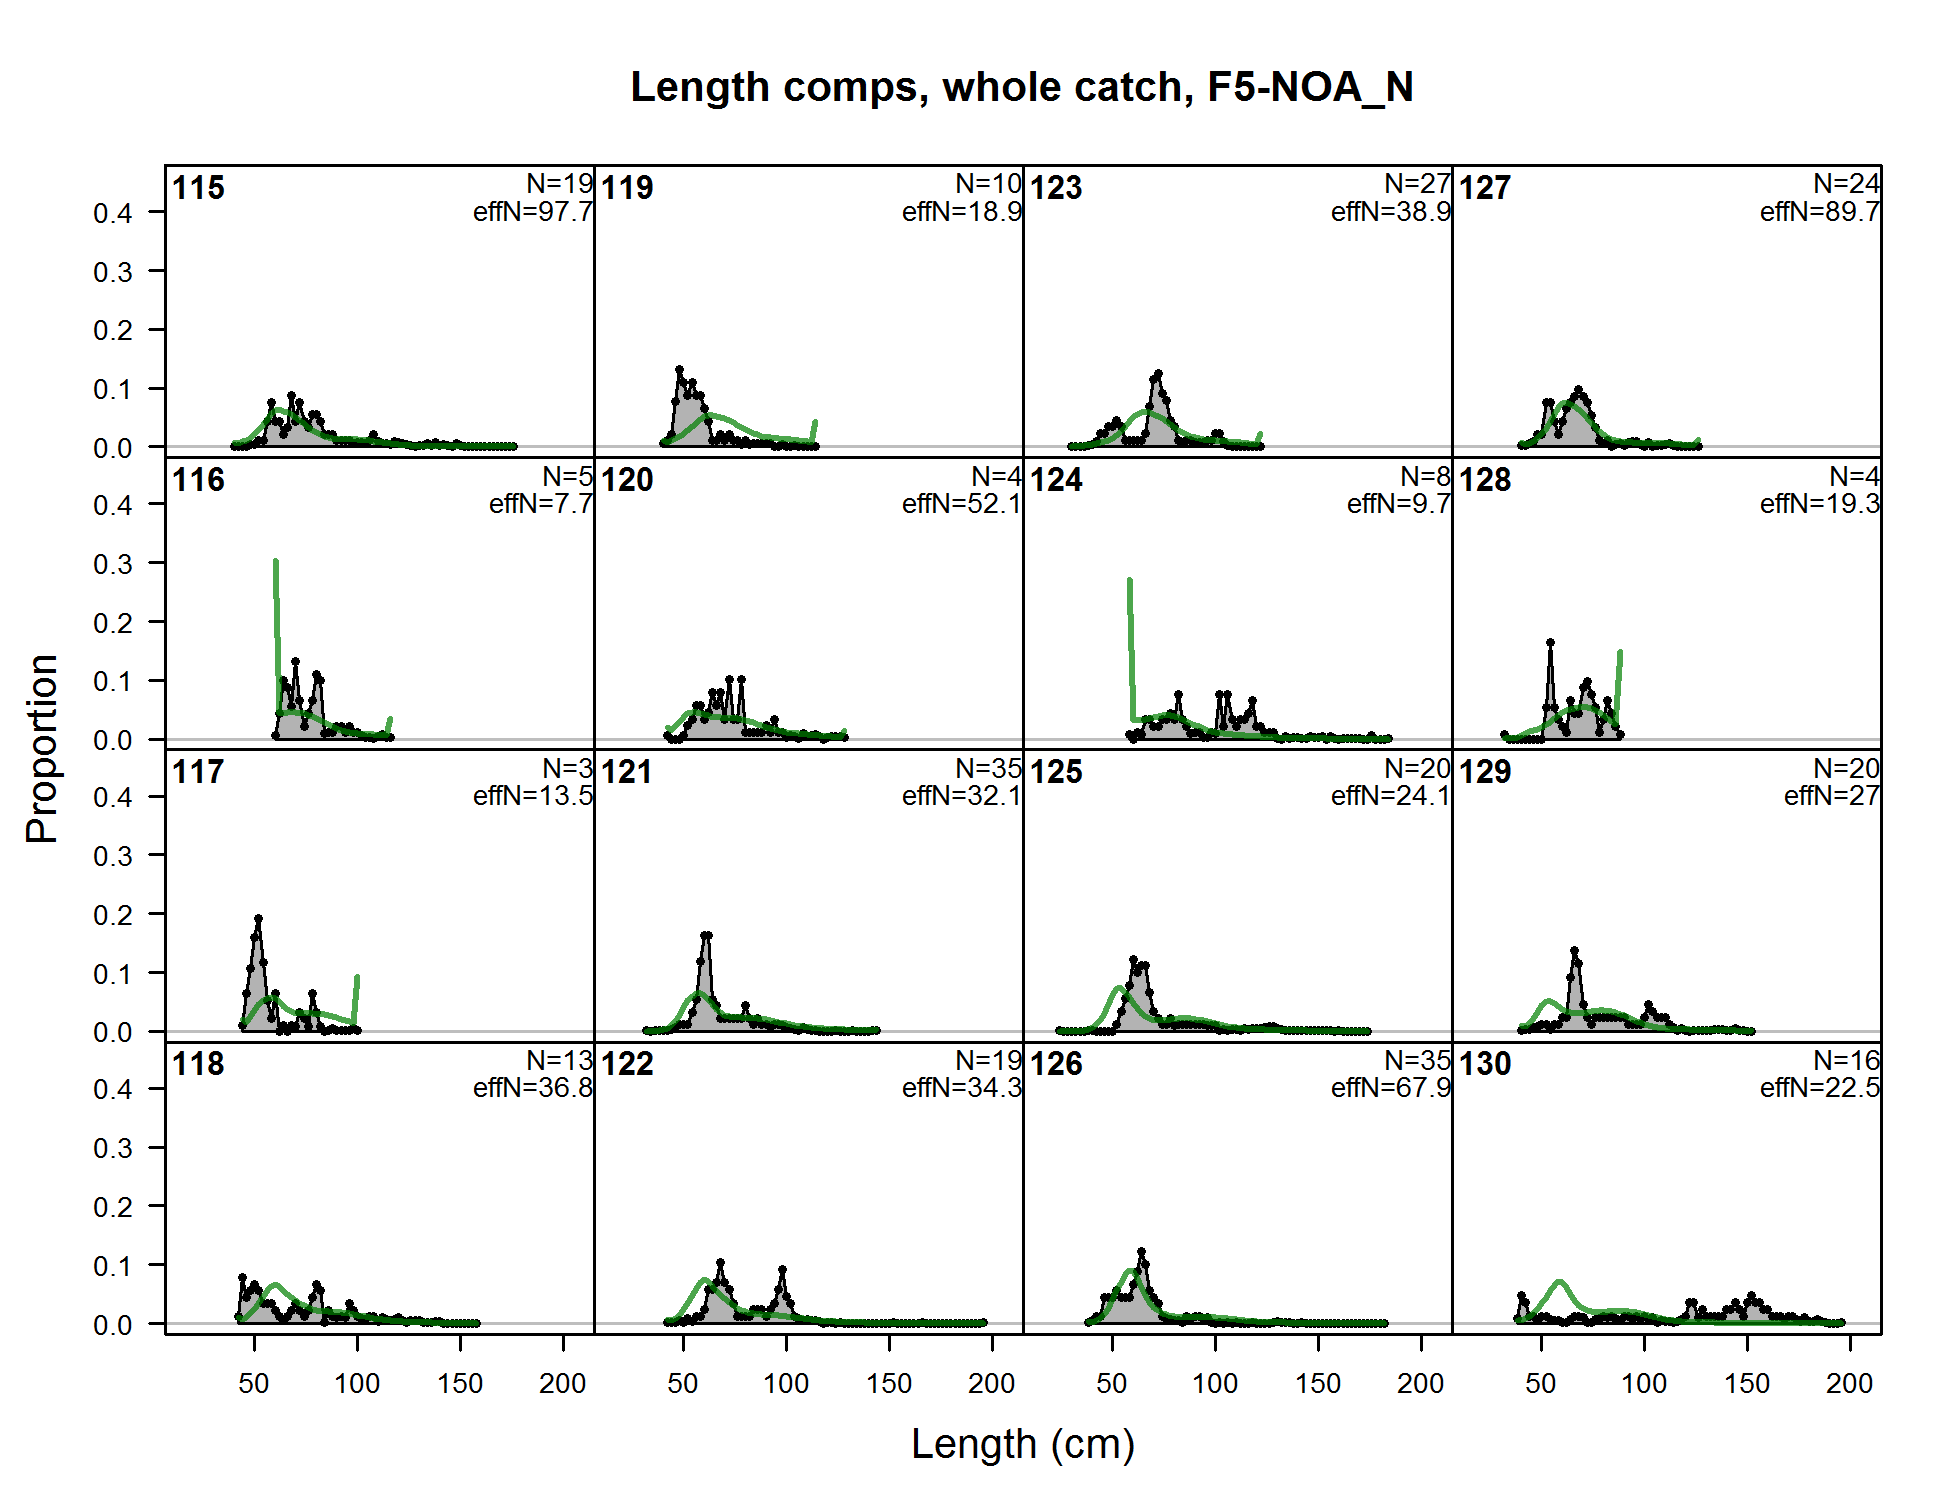
Length comps, whole catch, F5-NOA_N (plot 1 of 11) (plot 2 of 11) (plot 3 of 11) (plot 4 of 11) (plot 5 of 11) (plot 6 of 11) (plot 7 of 11) (plot 8 of 11) (plot 9 of 11)
file: comp_lenfit_flt5mkt0_page9.png
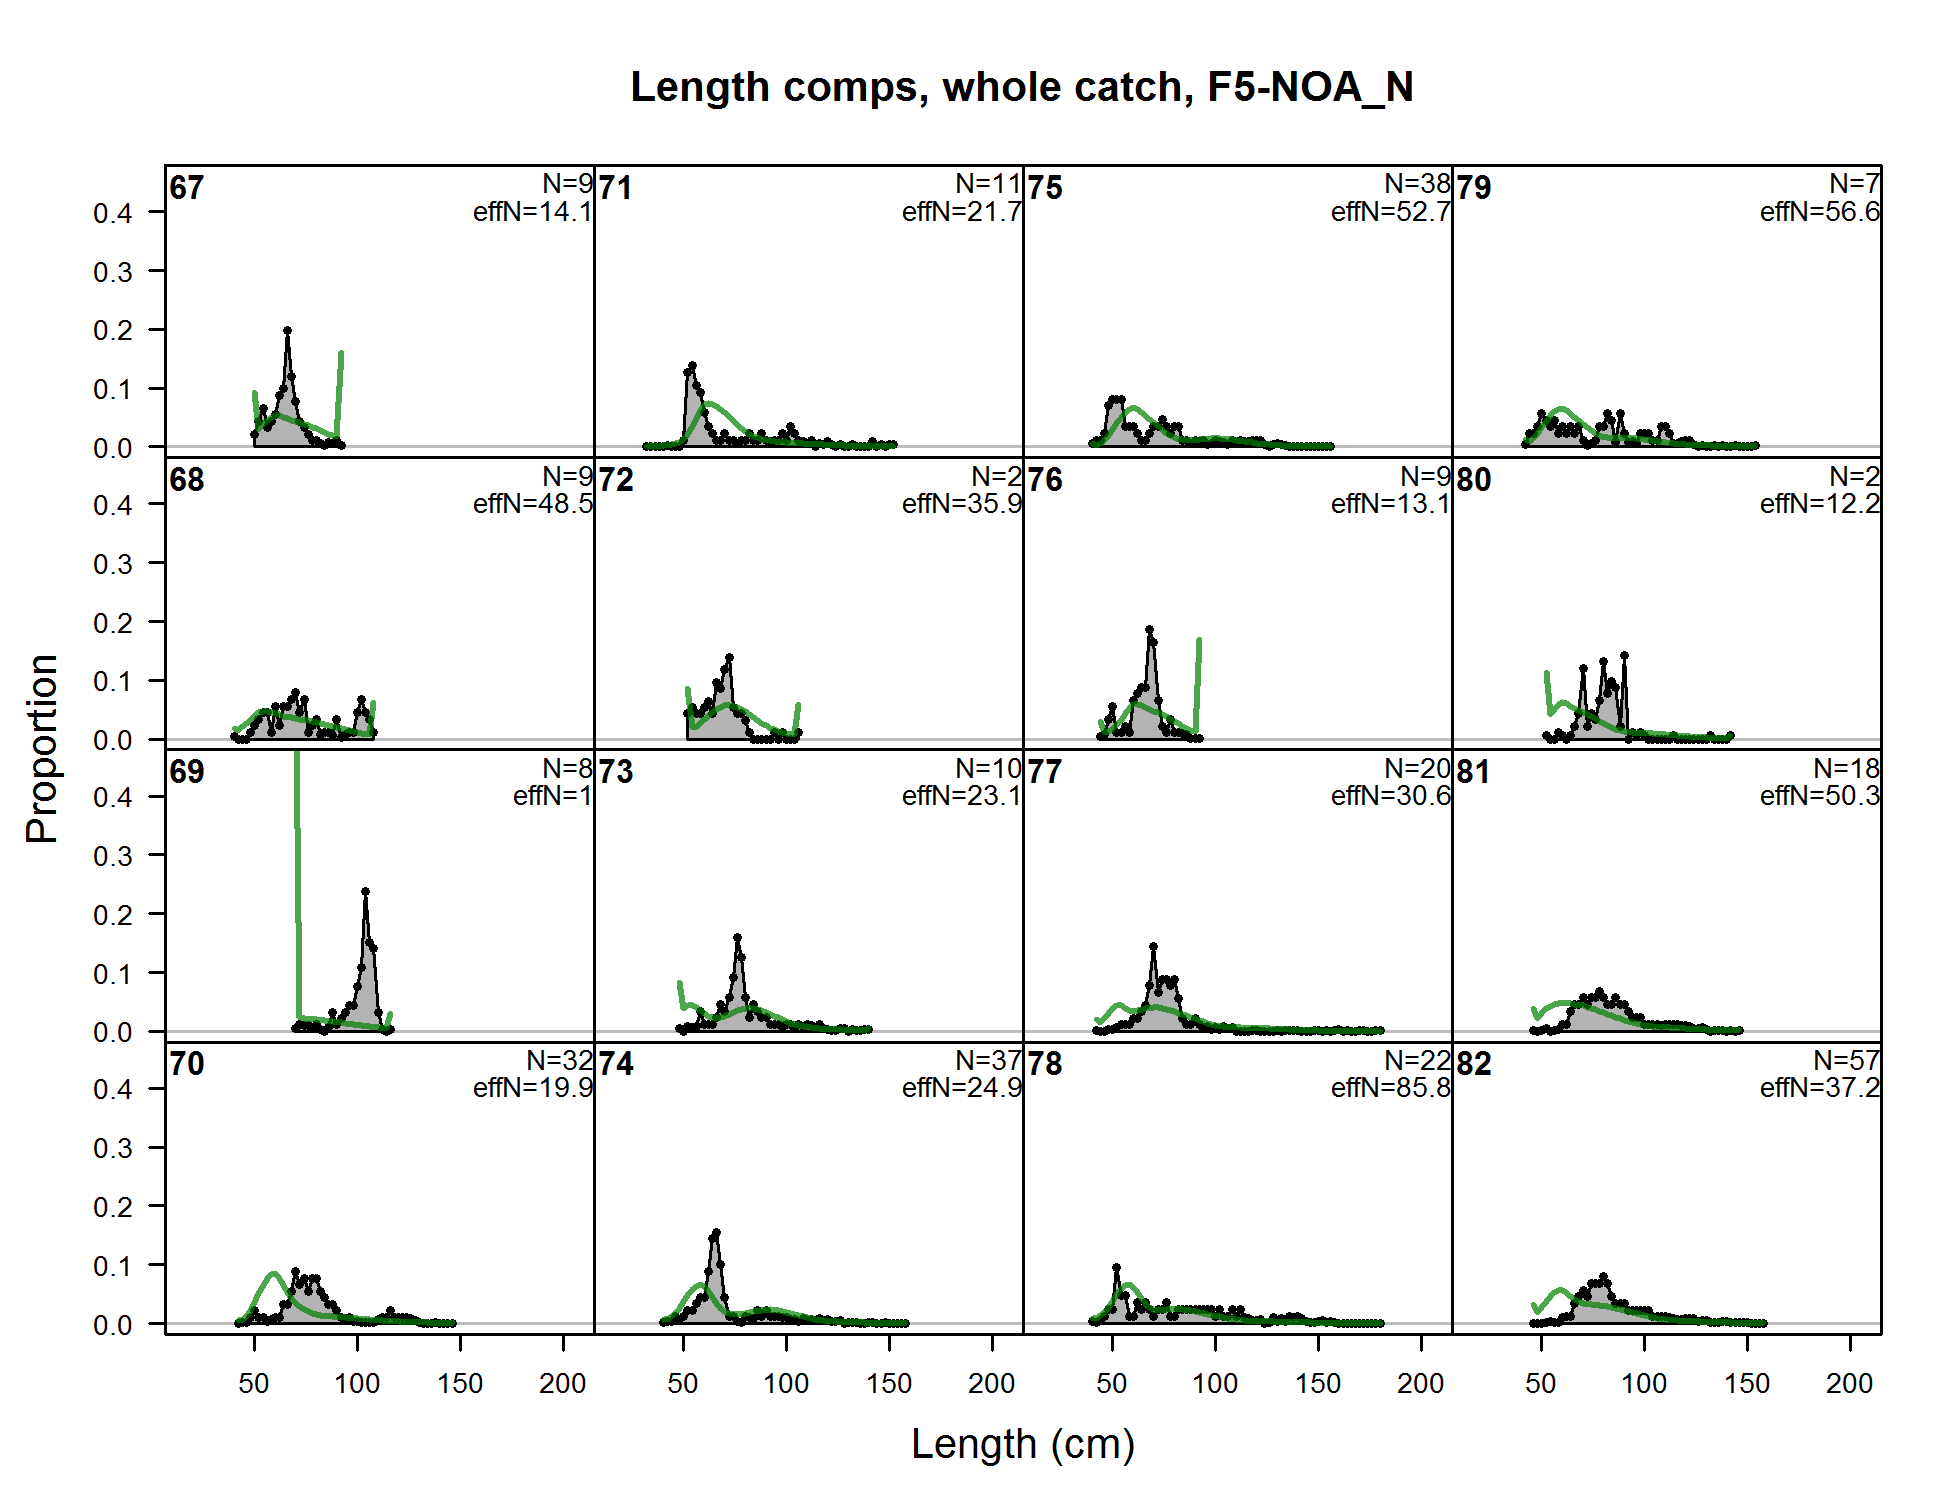
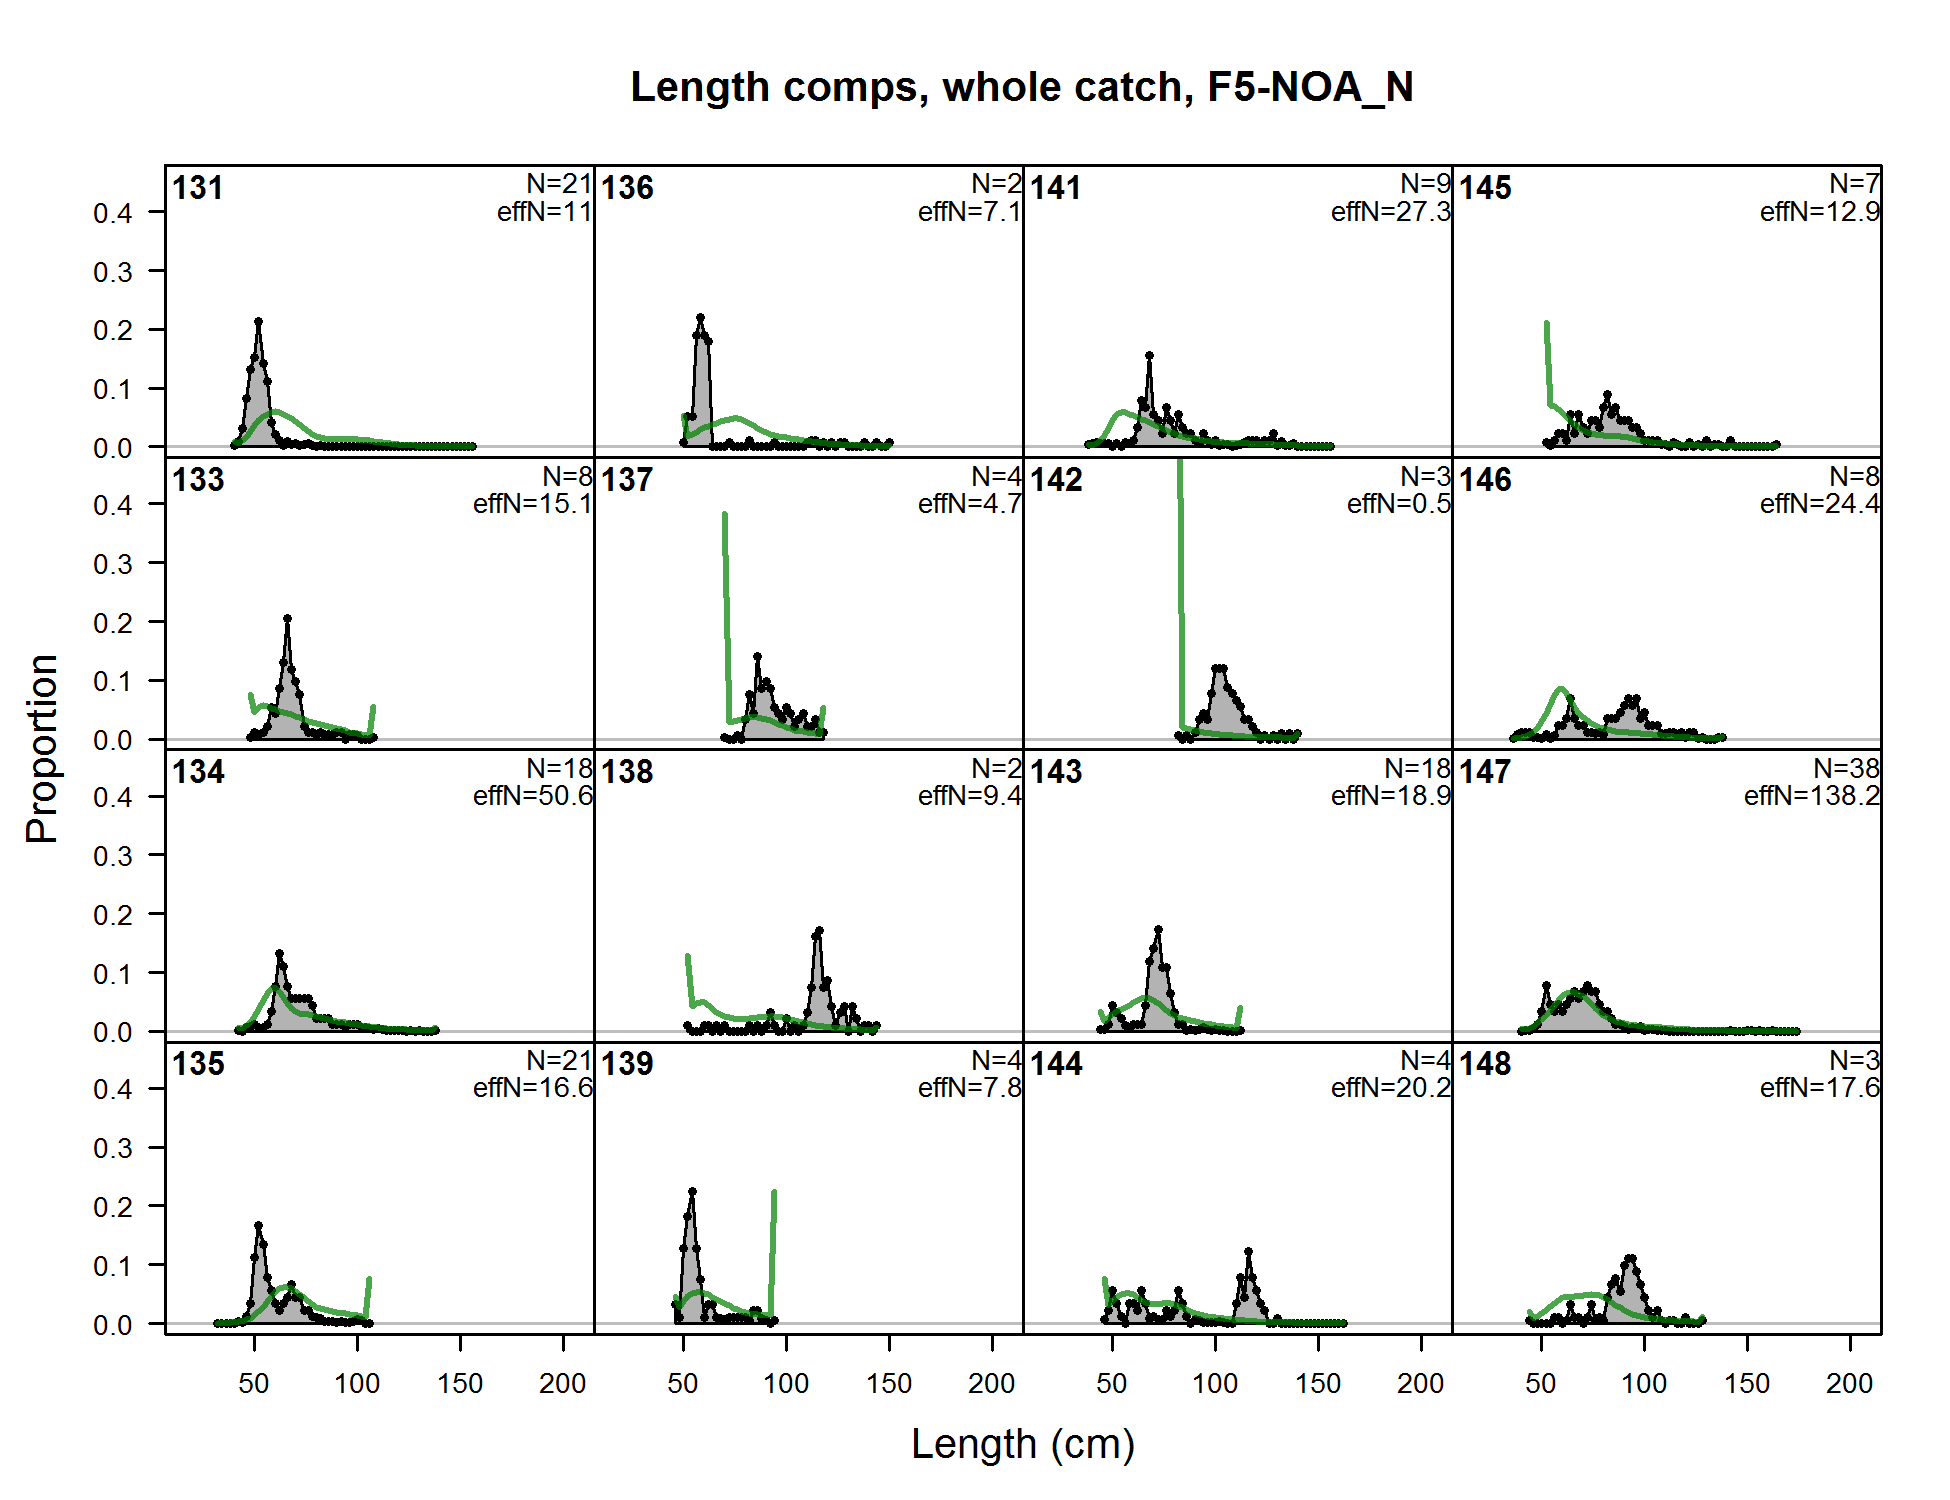
Length comps, whole catch, F5-NOA_N (plot 1 of 11) (plot 2 of 11) (plot 3 of 11) (plot 4 of 11) (plot 5 of 11) (plot 6 of 11) (plot 7 of 11) (plot 8 of 11) (plot 9 of 11) (plot 10 of 11)
file: comp_lenfit_flt5mkt0_page10.png
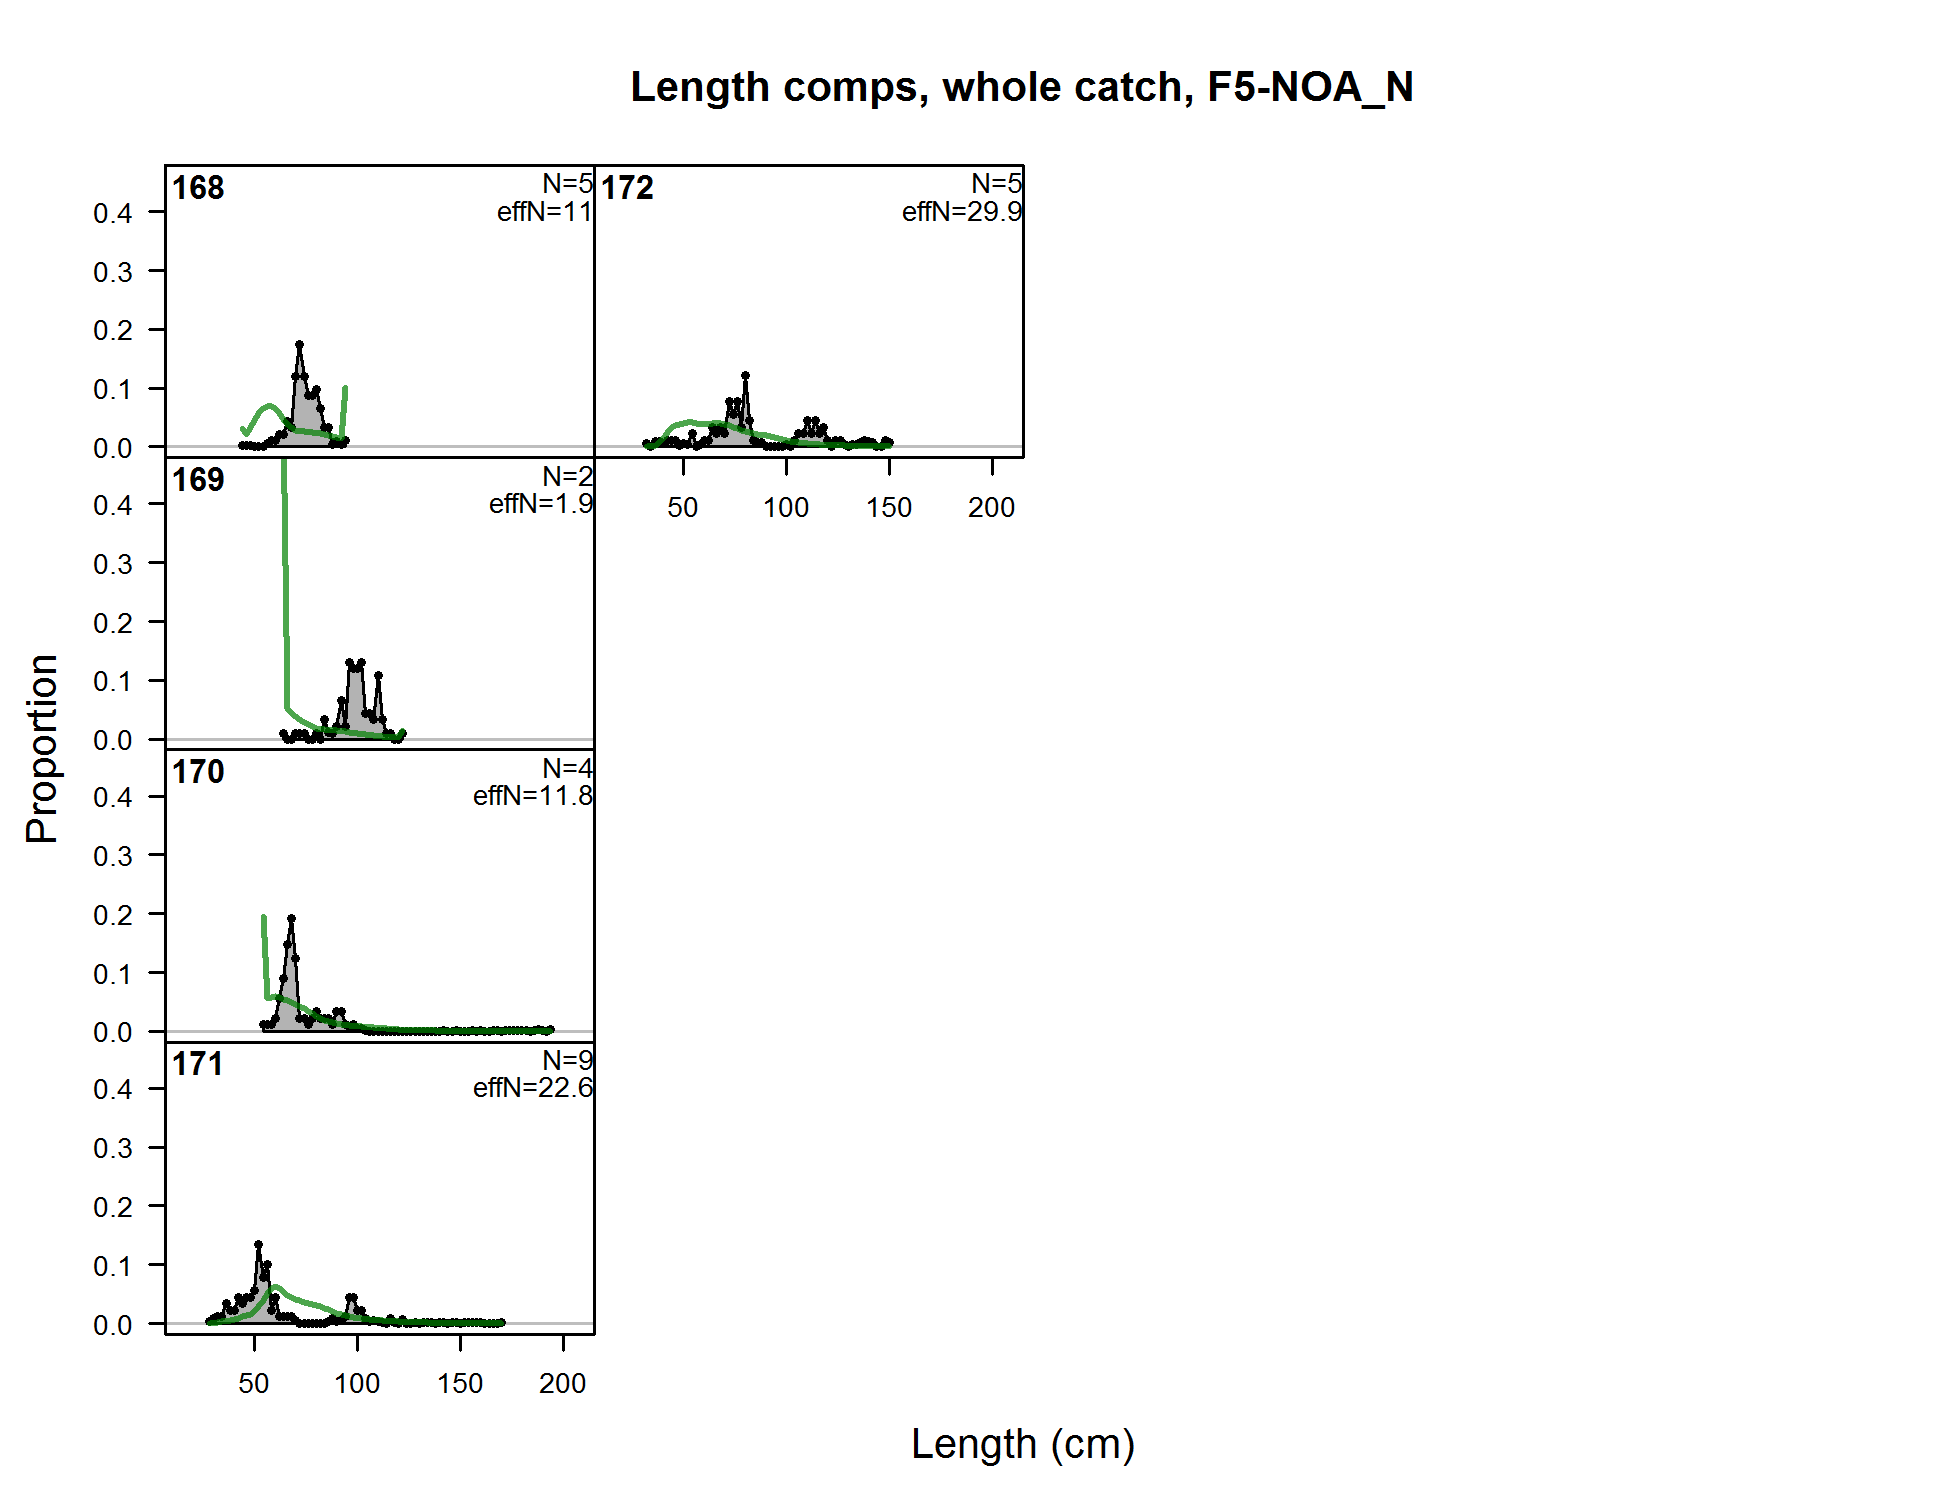
Length comps, whole catch, F5-NOA_N (plot 1 of 11) (plot 2 of 11) (plot 3 of 11) (plot 4 of 11) (plot 5 of 11) (plot 6 of 11) (plot 7 of 11) (plot 8 of 11) (plot 9 of 11) (plot 10 of 11) (plot 11 of 11)
file: comp_lenfit_flt5mkt0_page11.png
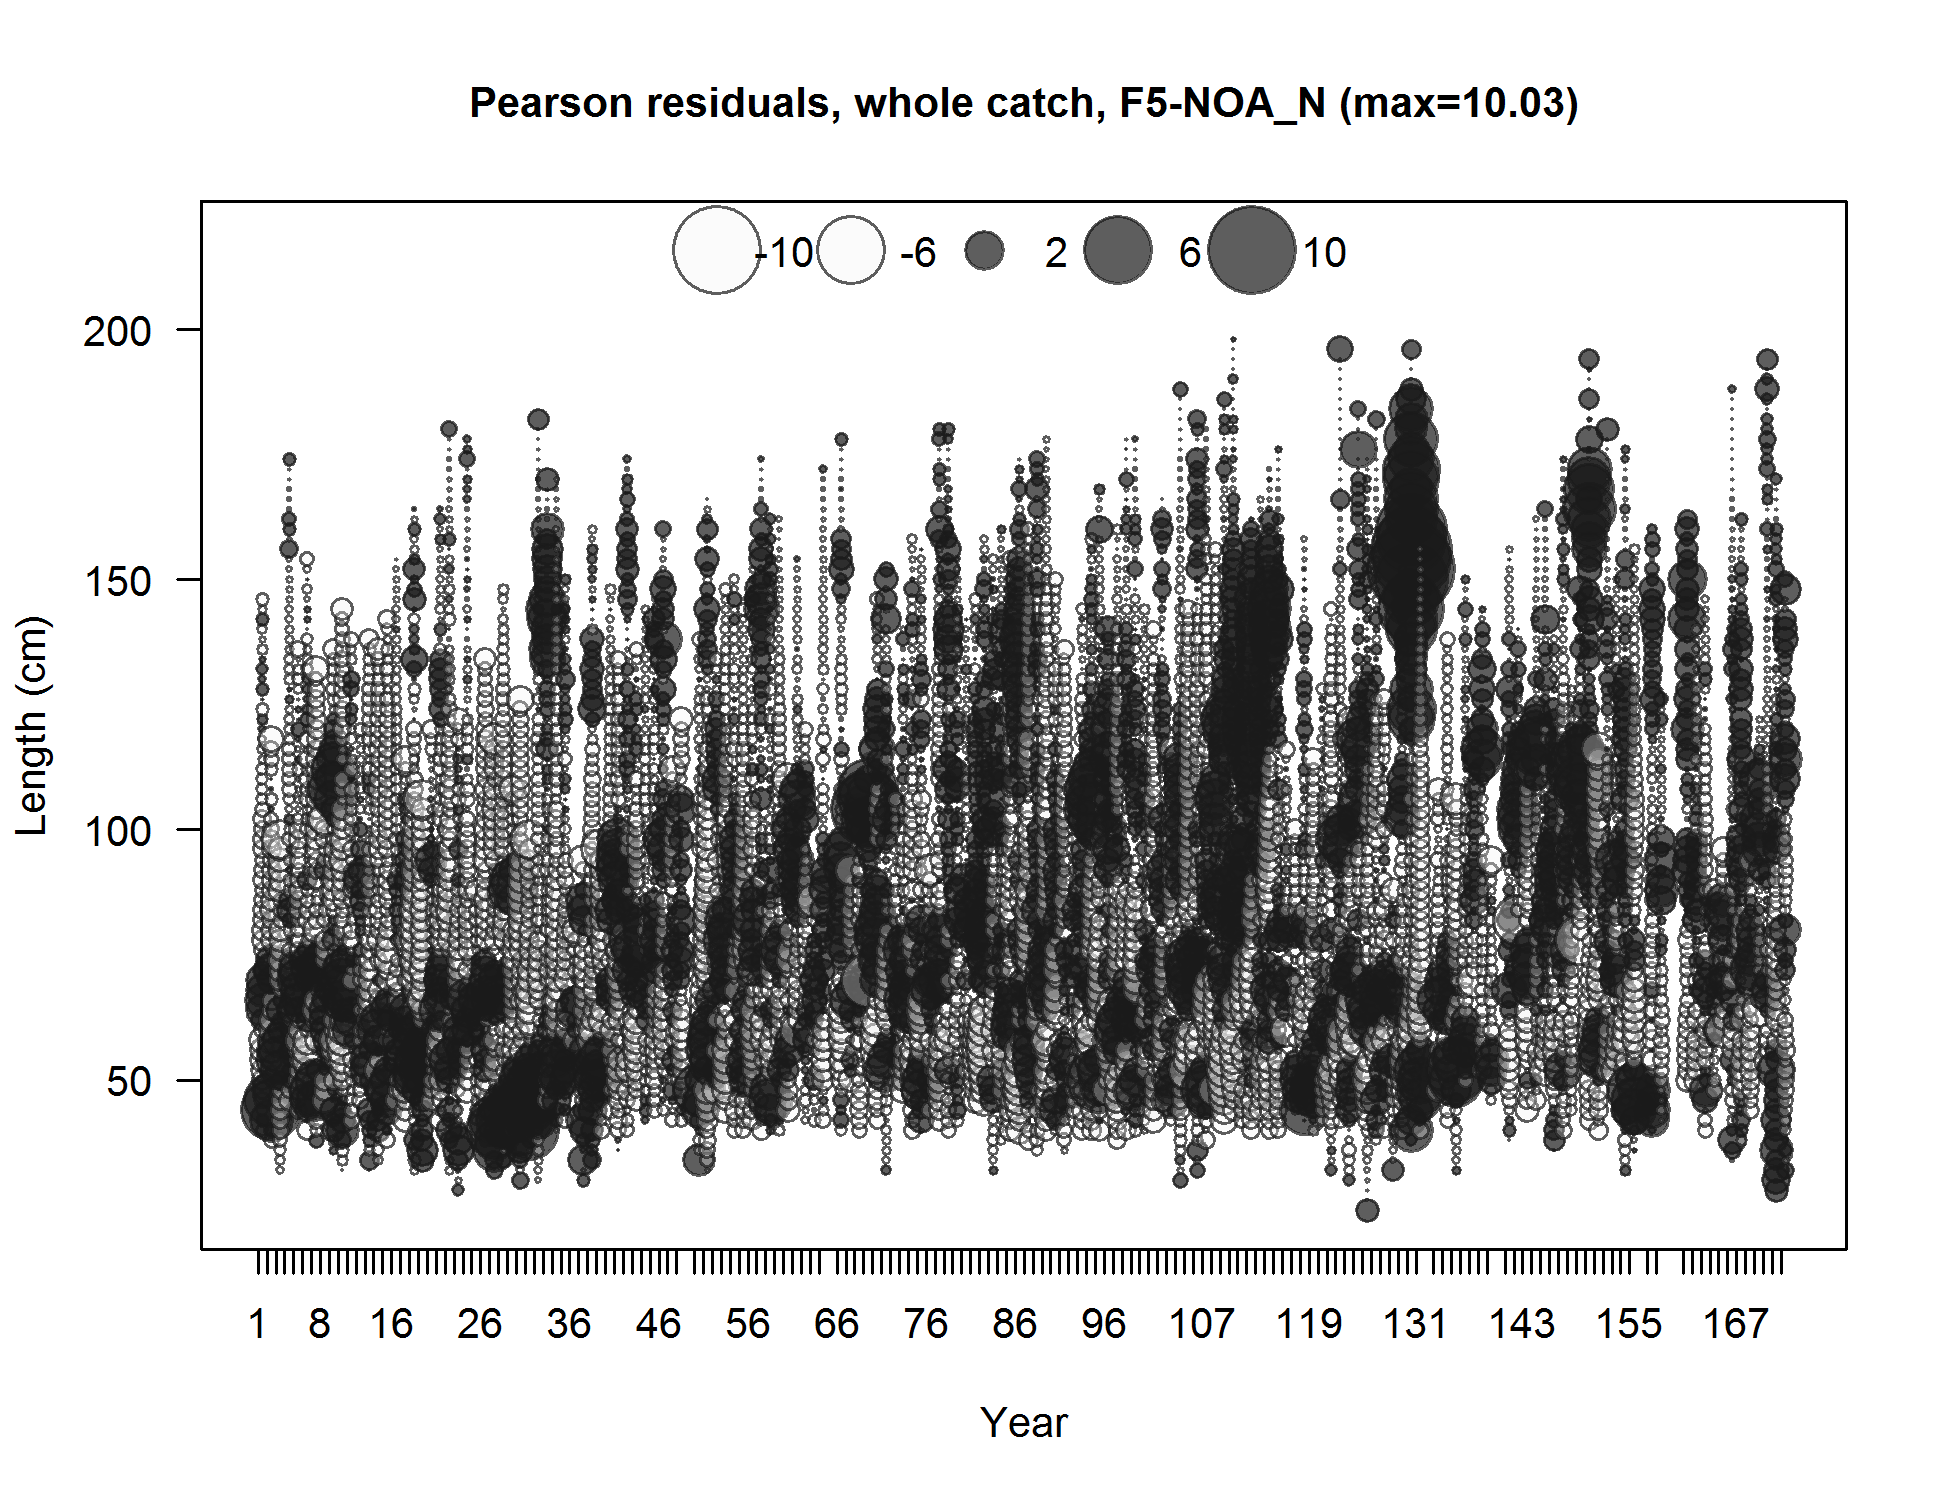
Pearson residuals, whole catch, F5-NOA_N (max=10.03) (plot 11 of 11)
Closed bubbles are positive residuals (observed > expected) and open bubbles are negative residuals (observed < expected).
file: comp_lenfit_residsflt5mkt0_page11.png
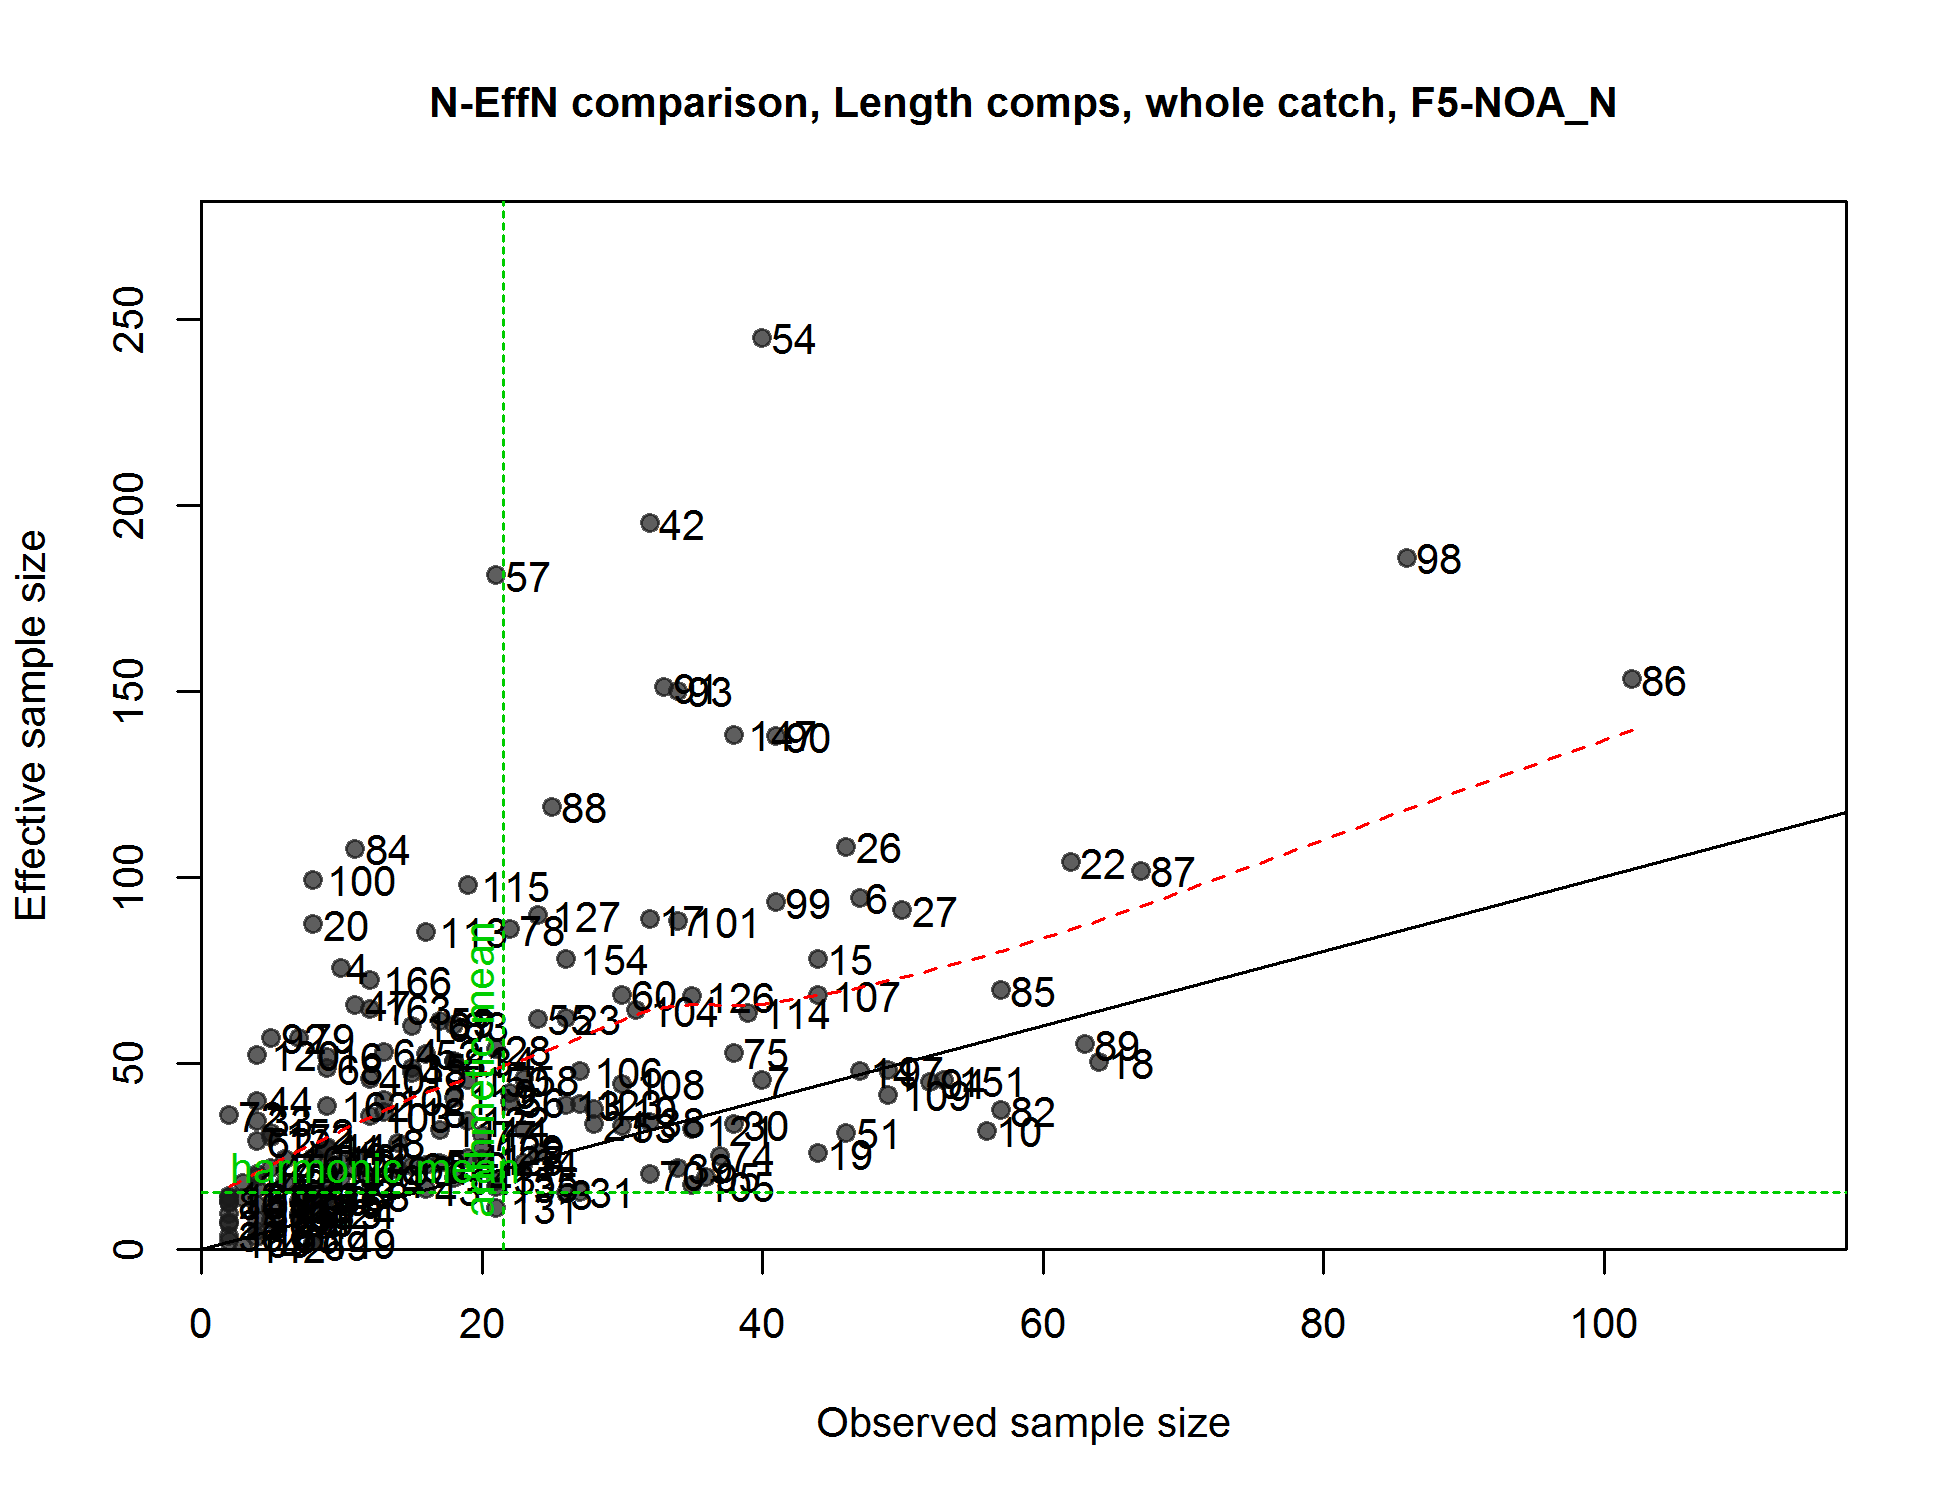
N-EffN comparison, Length comps, whole catch, F5-NOA_N
file: comp_lenfit_sampsize_flt5mkt0.png
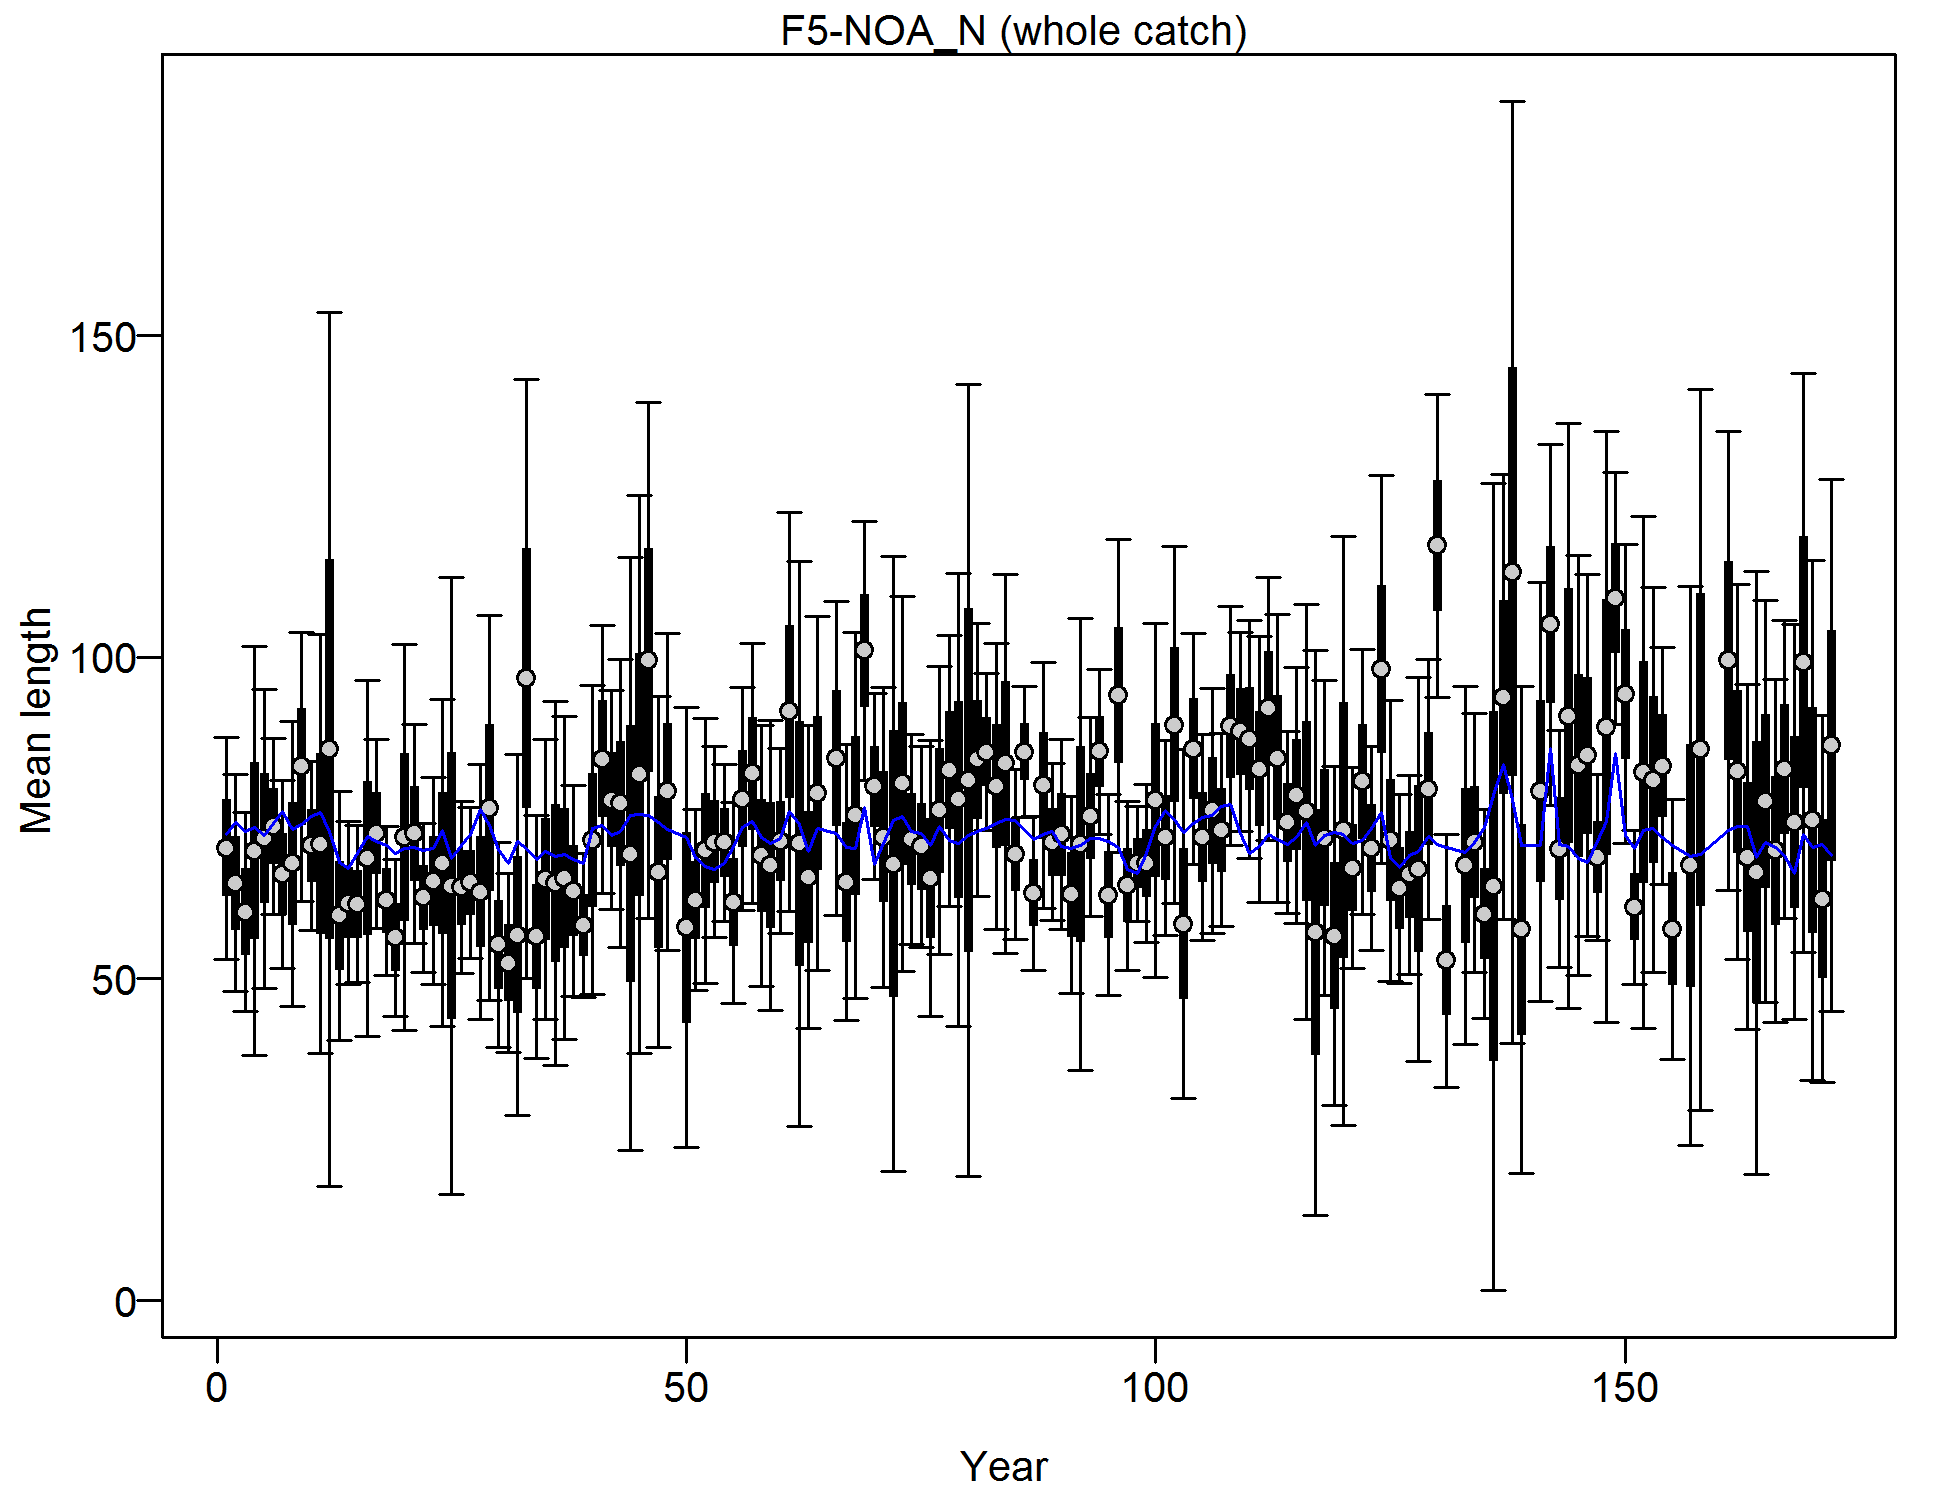
Mean length for F5-NOA_N with 95% confidence intervals based on current samples sizes.
Francis data weighting method TA1.8: thinner intervals (with capped ends) show result of further adjusting sample sizes based on suggested multiplier (with 95% interval) for len data from F5-NOA_N:
0.1886 (0.1484-0.2426)
For more info, see
Francis, R.I.C.C. (2011). Data weighting in statistical fisheries stock assessment models. Can. J. Fish. Aquat. Sci. 68: 1124-1138.
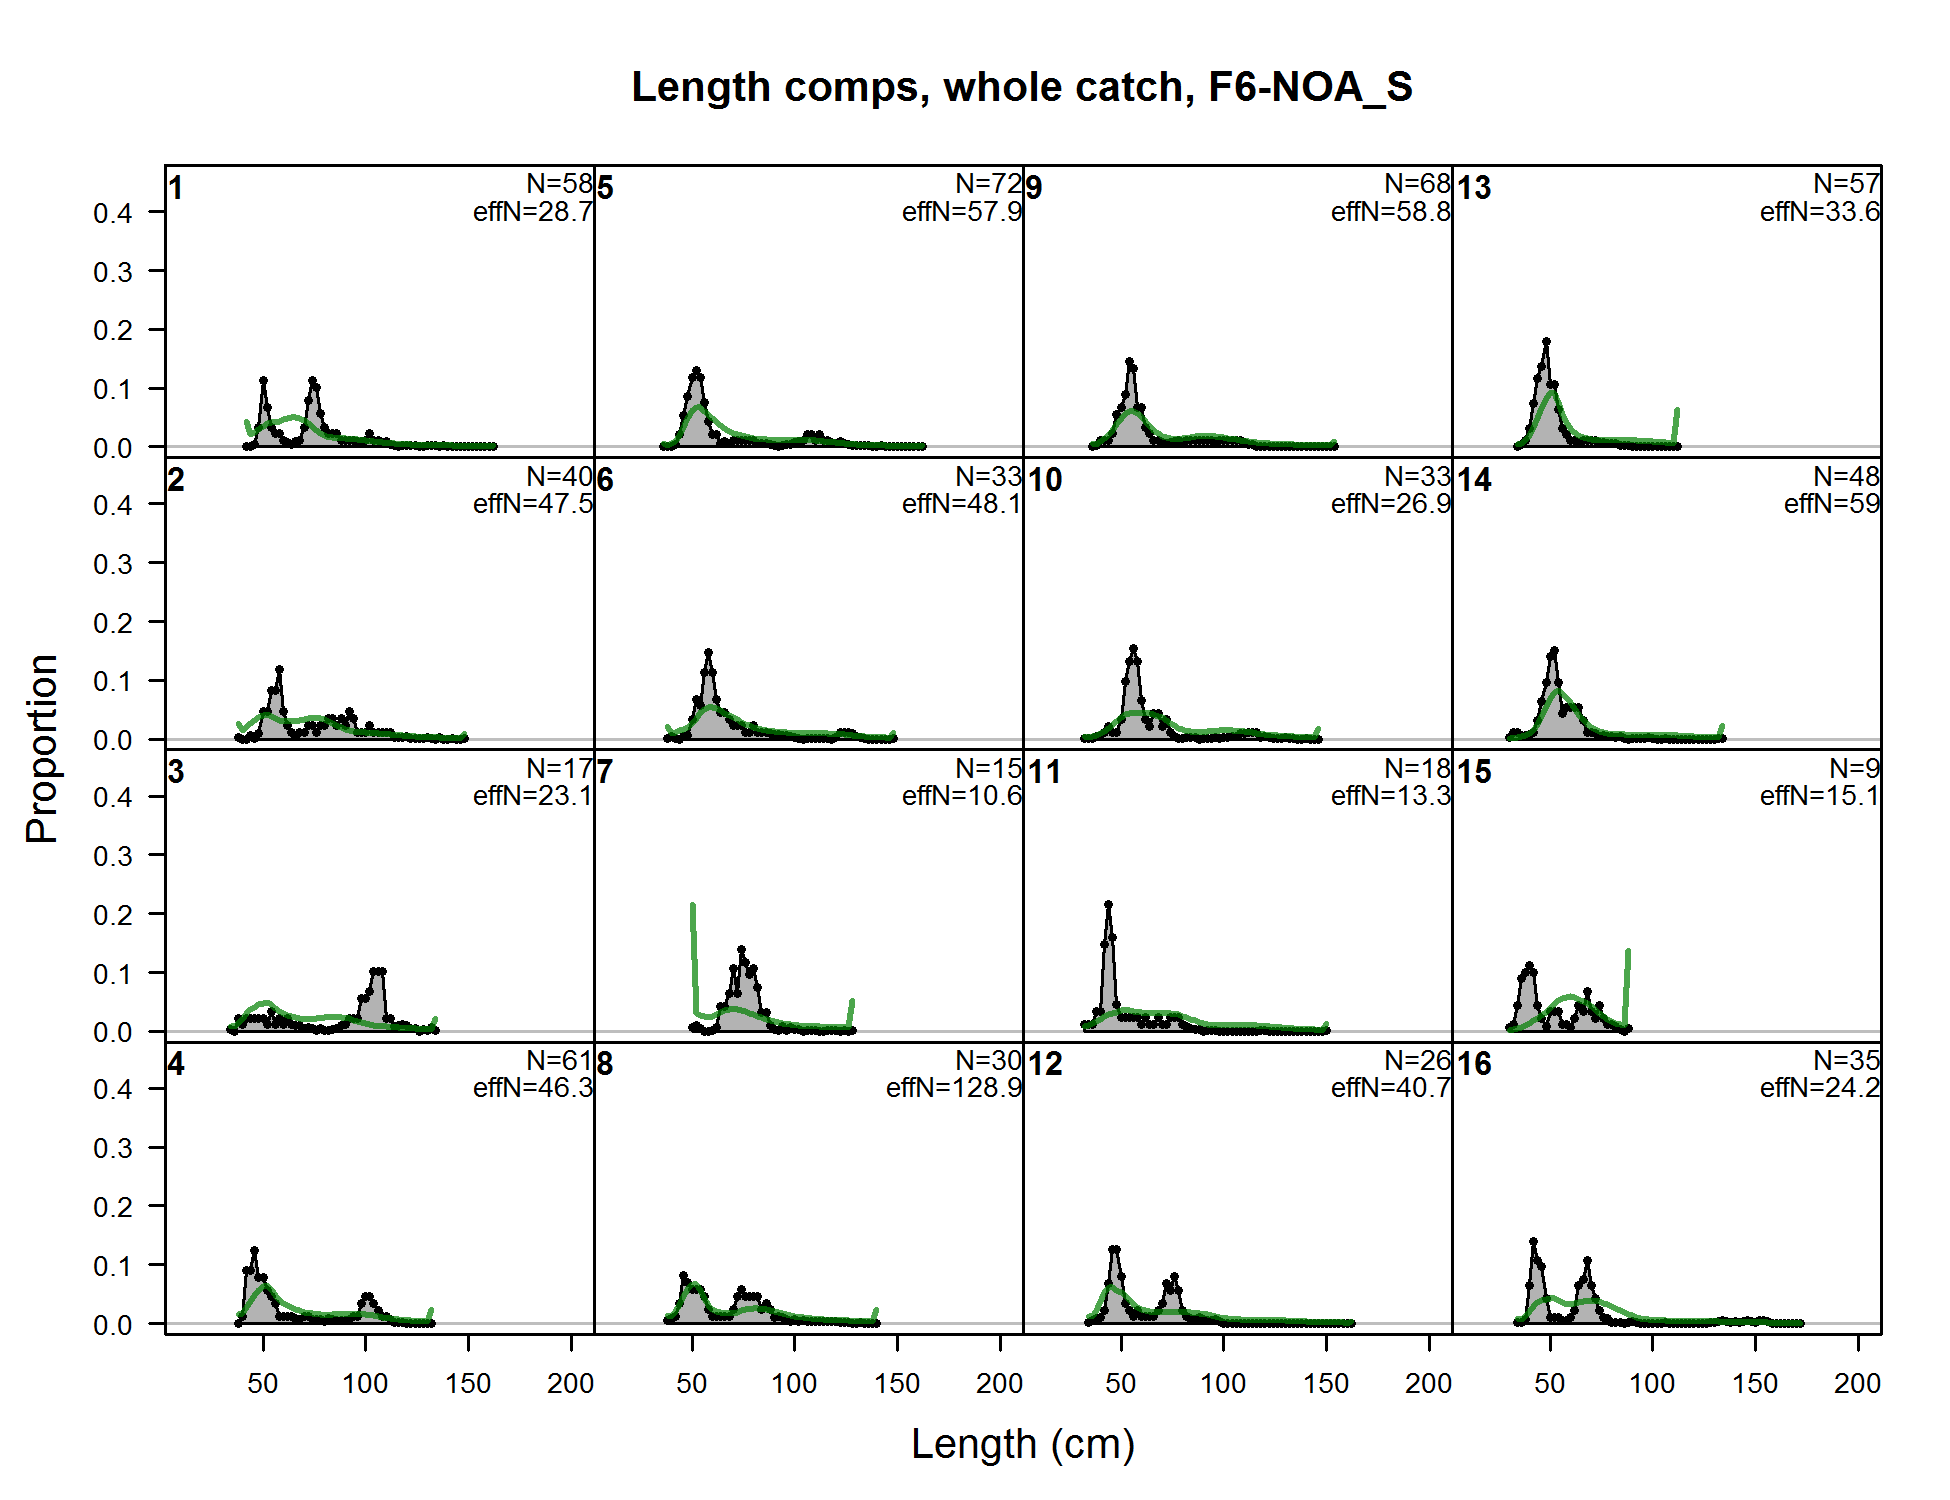
Length comps, whole catch, F6-NOA_S (plot 1 of 10)
file: comp_lenfit_flt6mkt0_page1.png
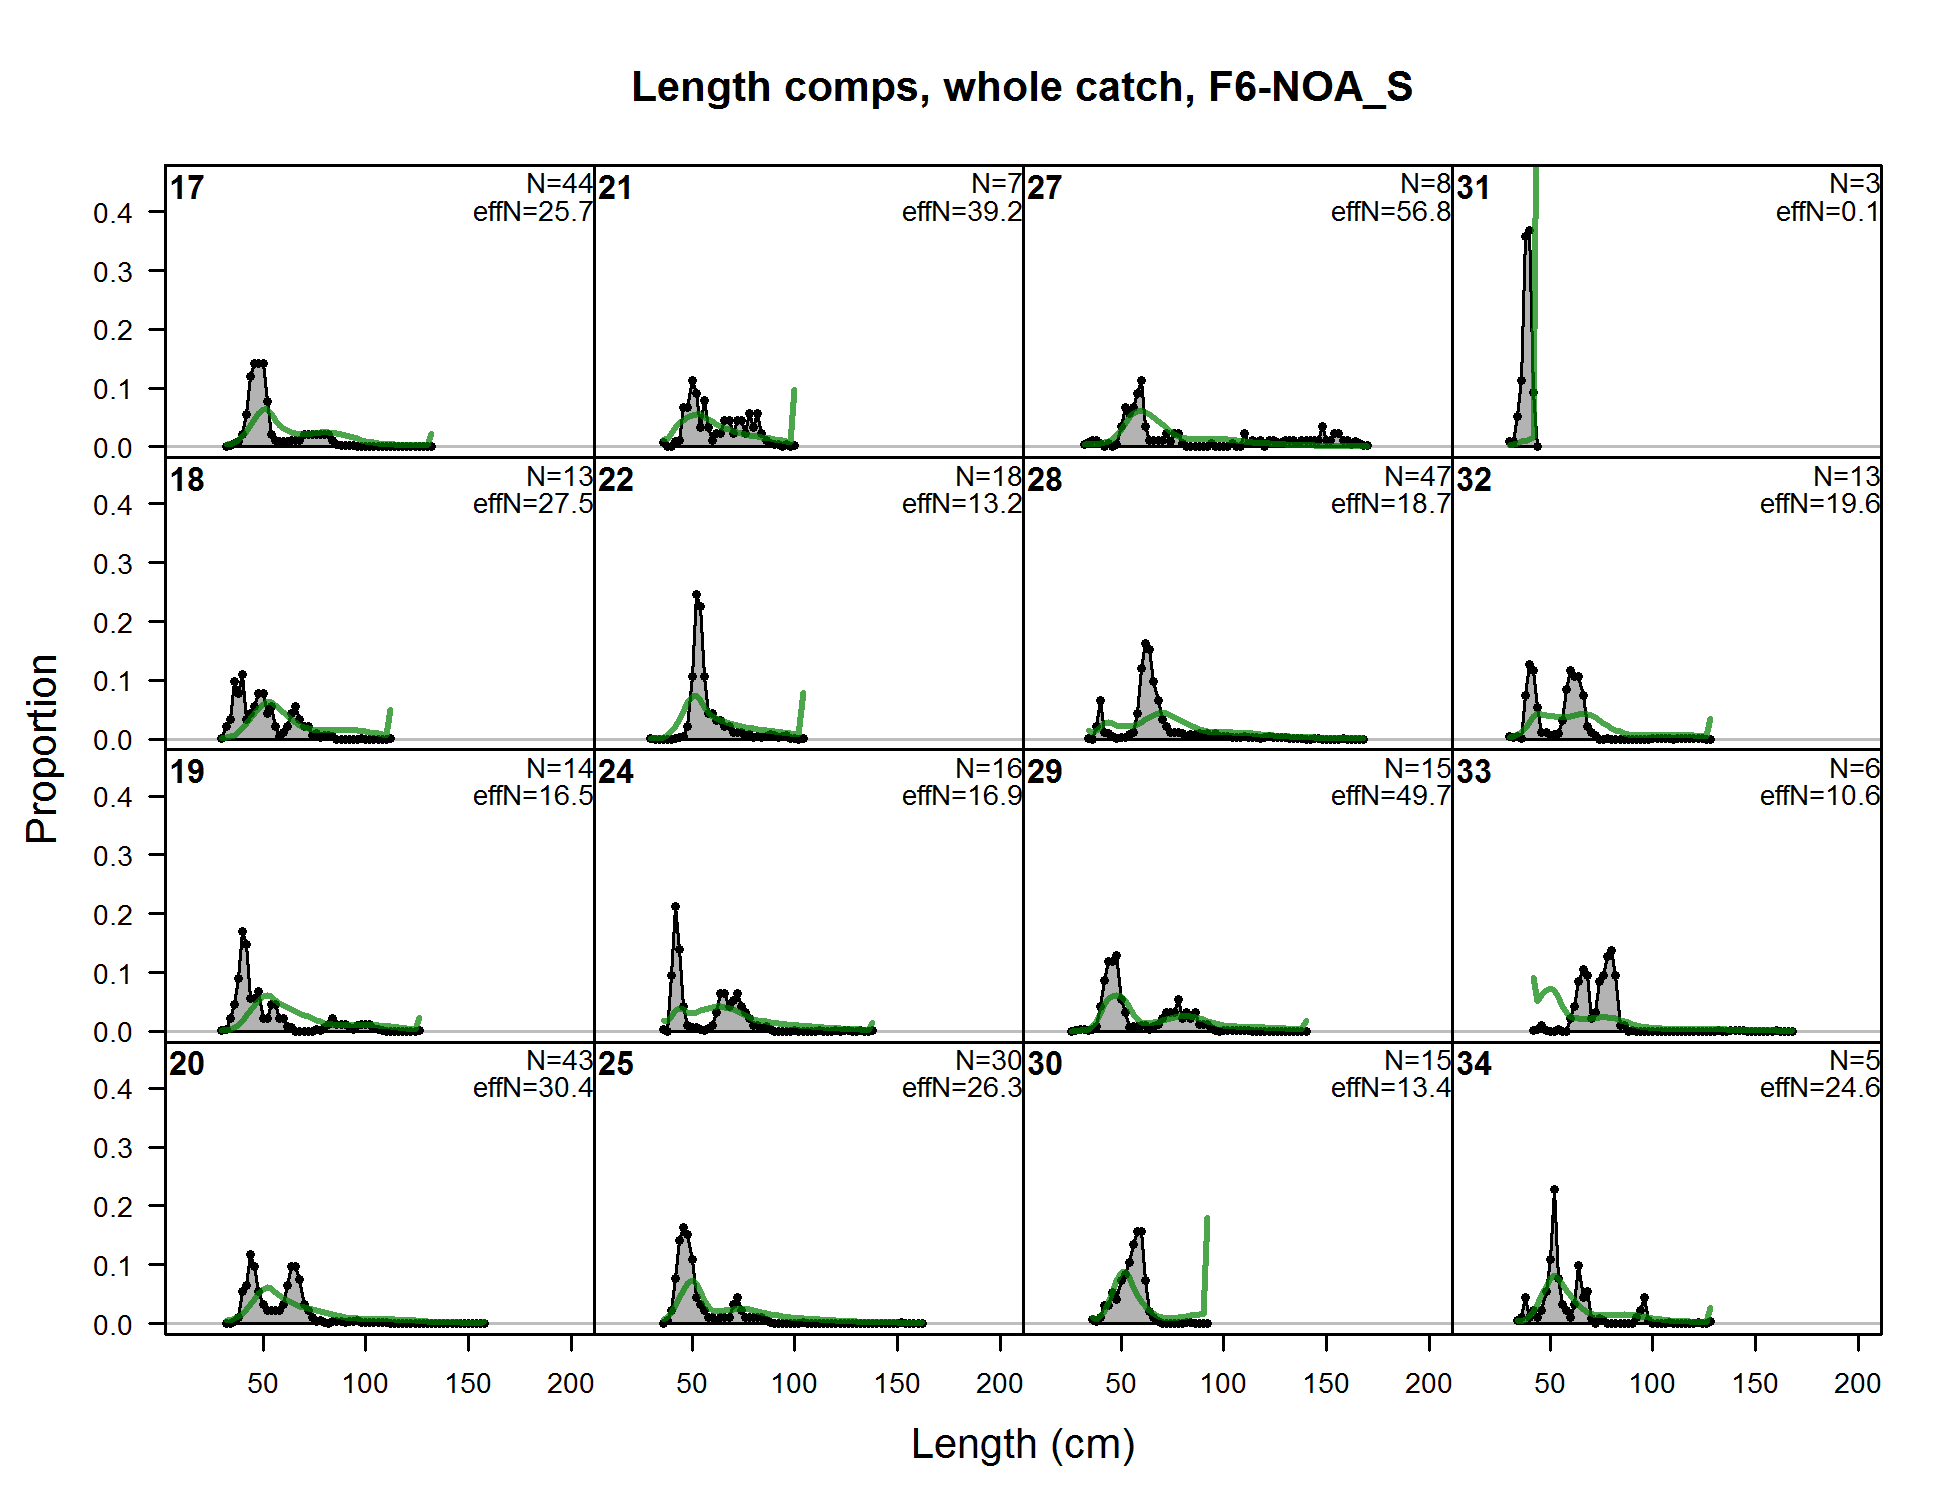
Length comps, whole catch, F6-NOA_S (plot 1 of 10) (plot 2 of 10)
file: comp_lenfit_flt6mkt0_page2.png
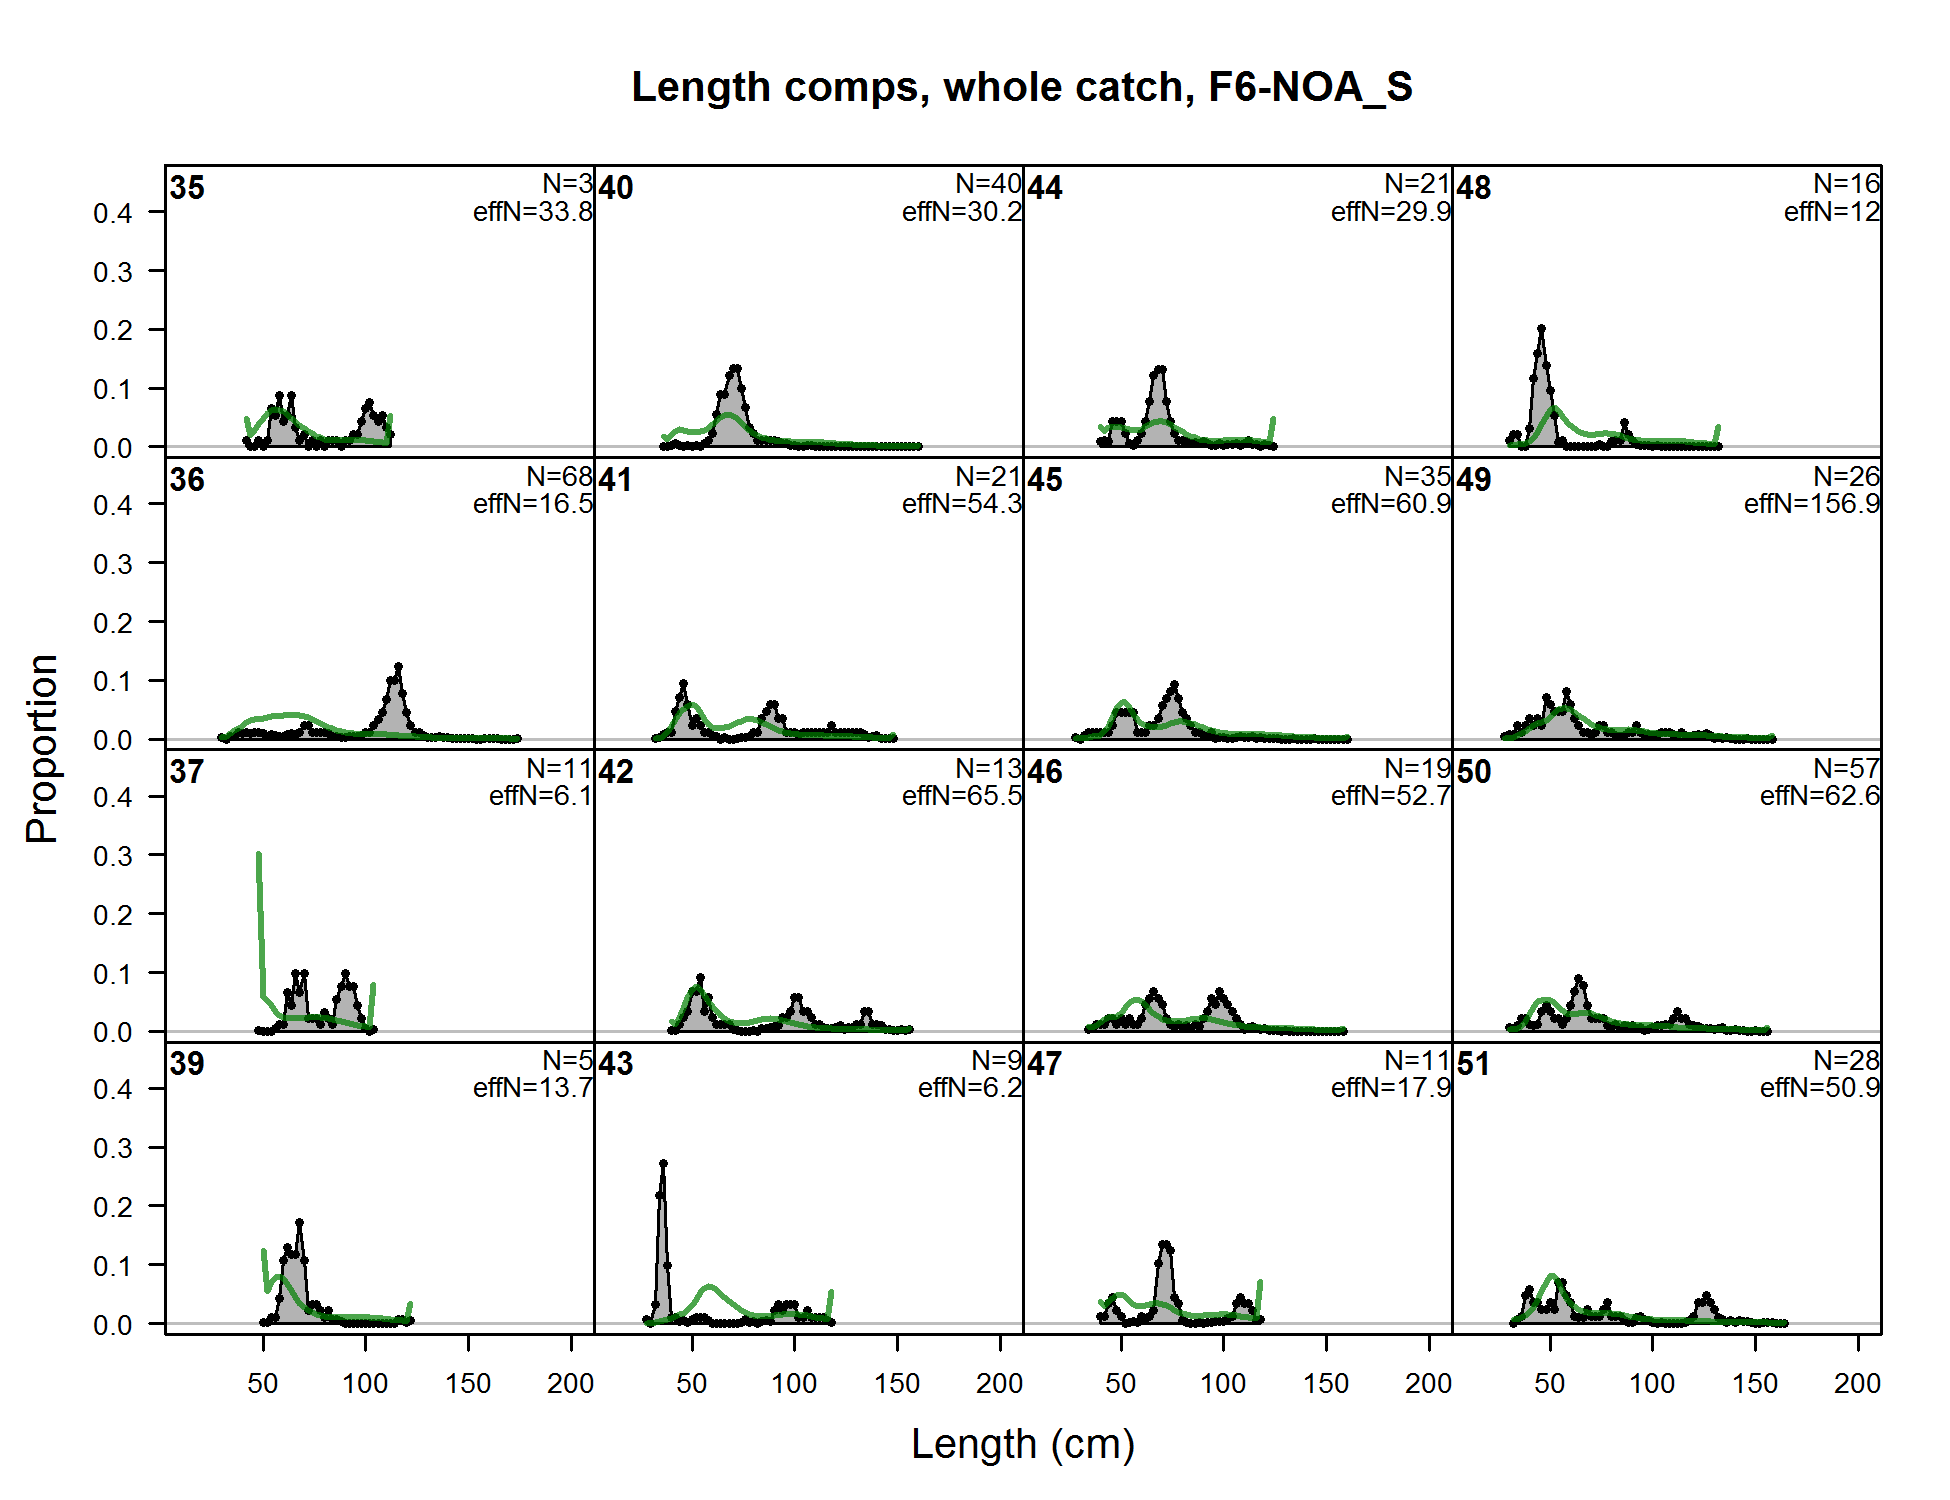
Length comps, whole catch, F6-NOA_S (plot 1 of 10) (plot 2 of 10) (plot 3 of 10)
file: comp_lenfit_flt6mkt0_page3.png
Length comps, whole catch, F6-NOA_S (plot 1 of 10) (plot 2 of 10) (plot 3 of 10) (plot 4 of 10)
file: comp_lenfit_flt6mkt0_page4.png
Length comps, whole catch, F6-NOA_S (plot 1 of 10) (plot 2 of 10) (plot 3 of 10) (plot 4 of 10) (plot 5 of 10)
file: comp_lenfit_flt6mkt0_page5.png
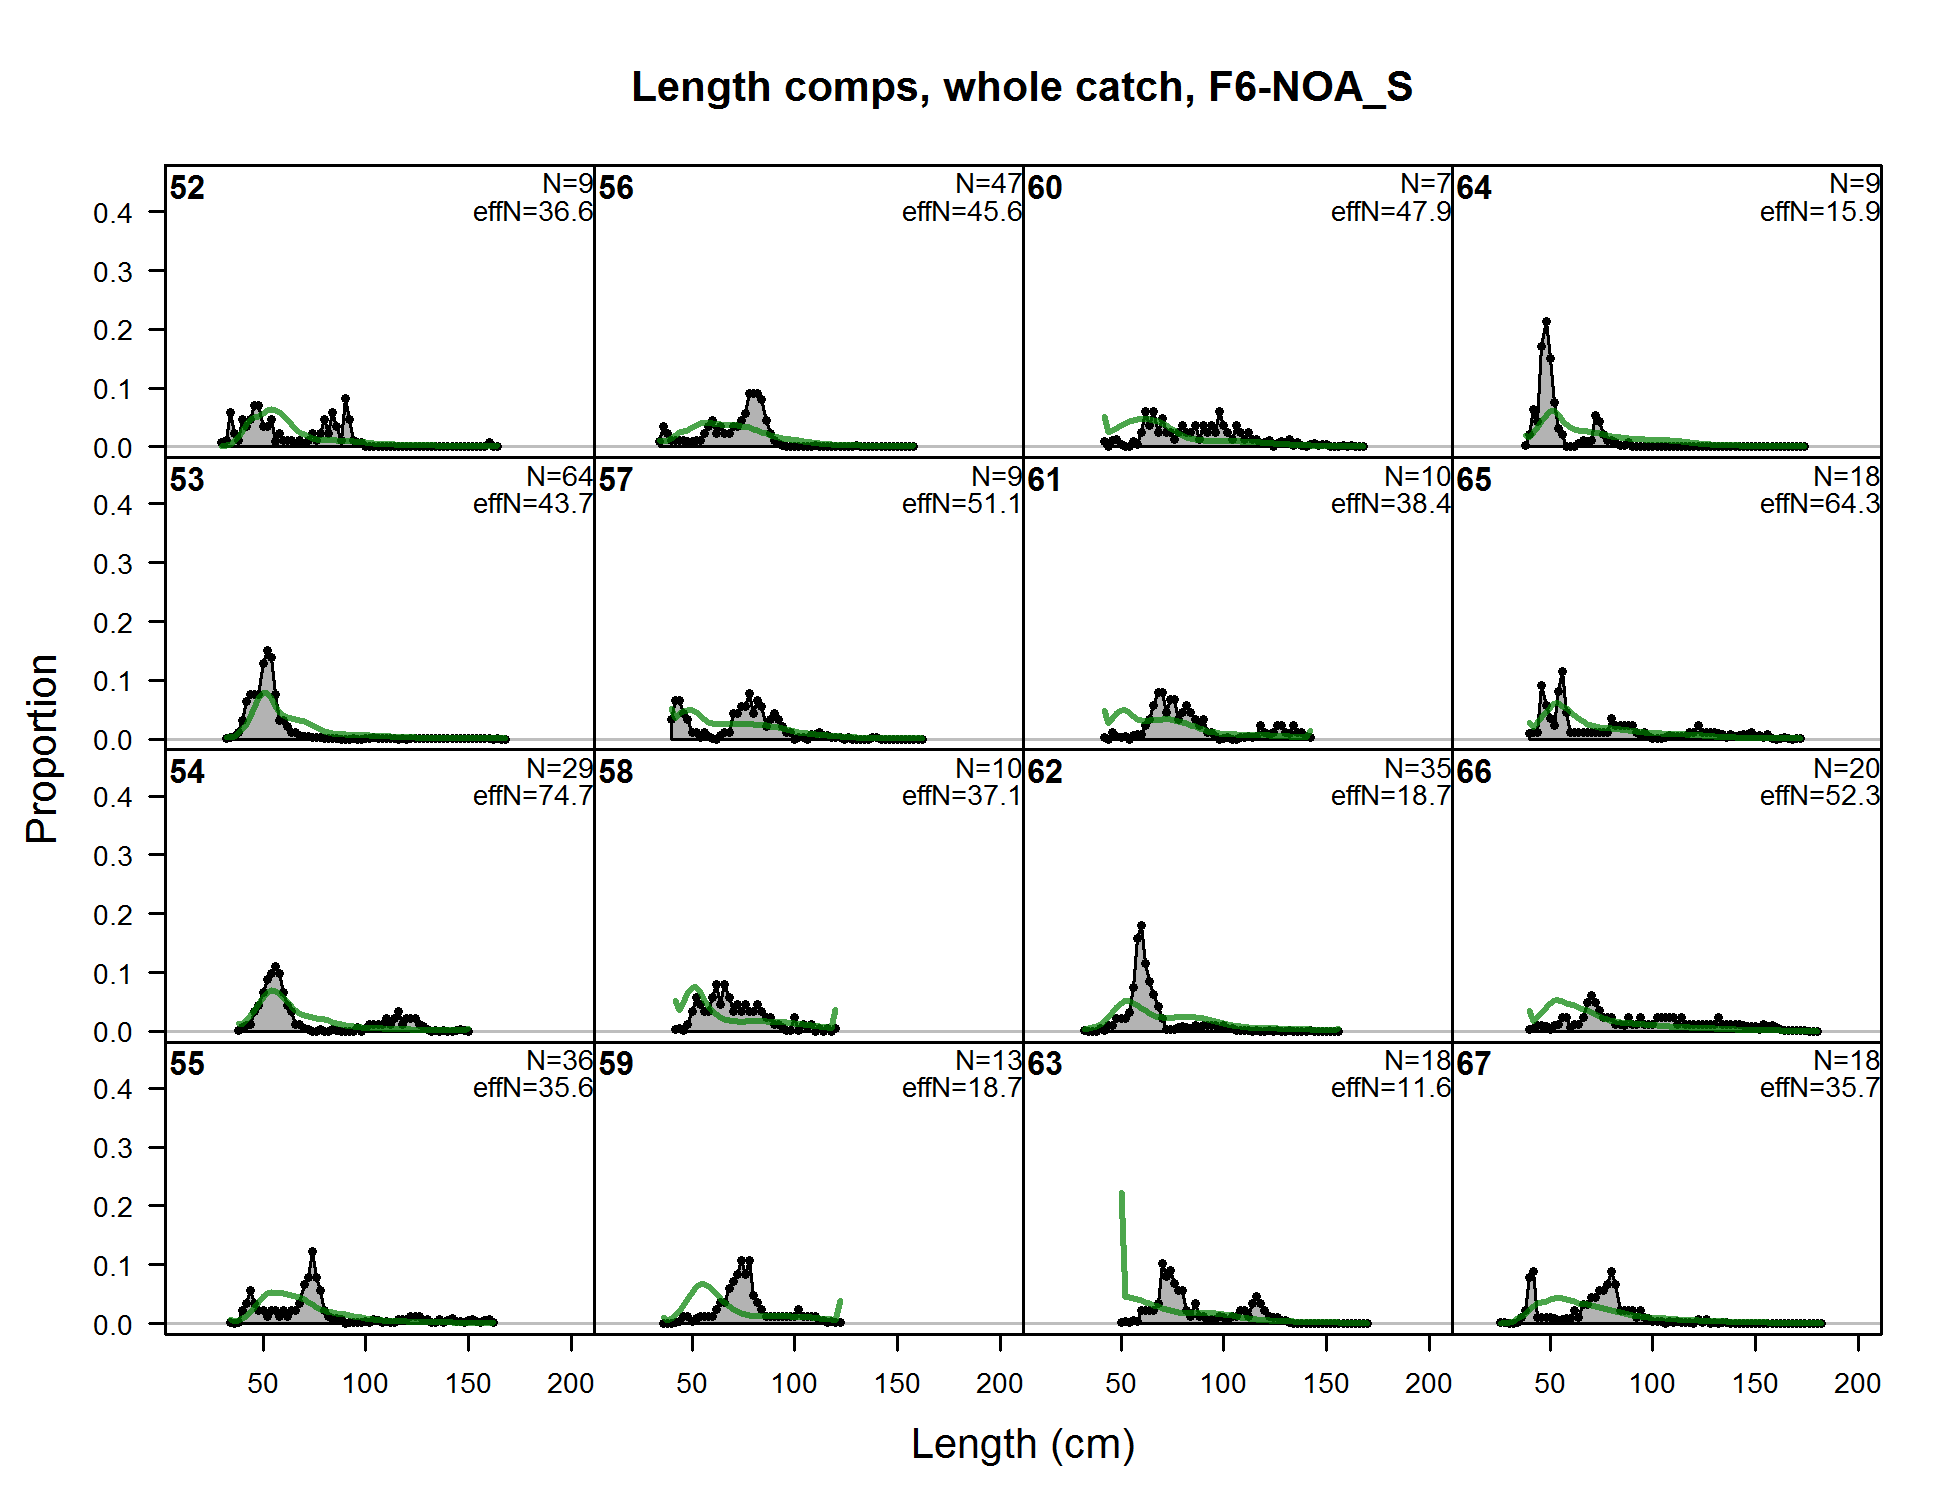
Length comps, whole catch, F6-NOA_S (plot 1 of 10) (plot 2 of 10) (plot 3 of 10) (plot 4 of 10) (plot 5 of 10) (plot 6 of 10)
file: comp_lenfit_flt6mkt0_page6.png
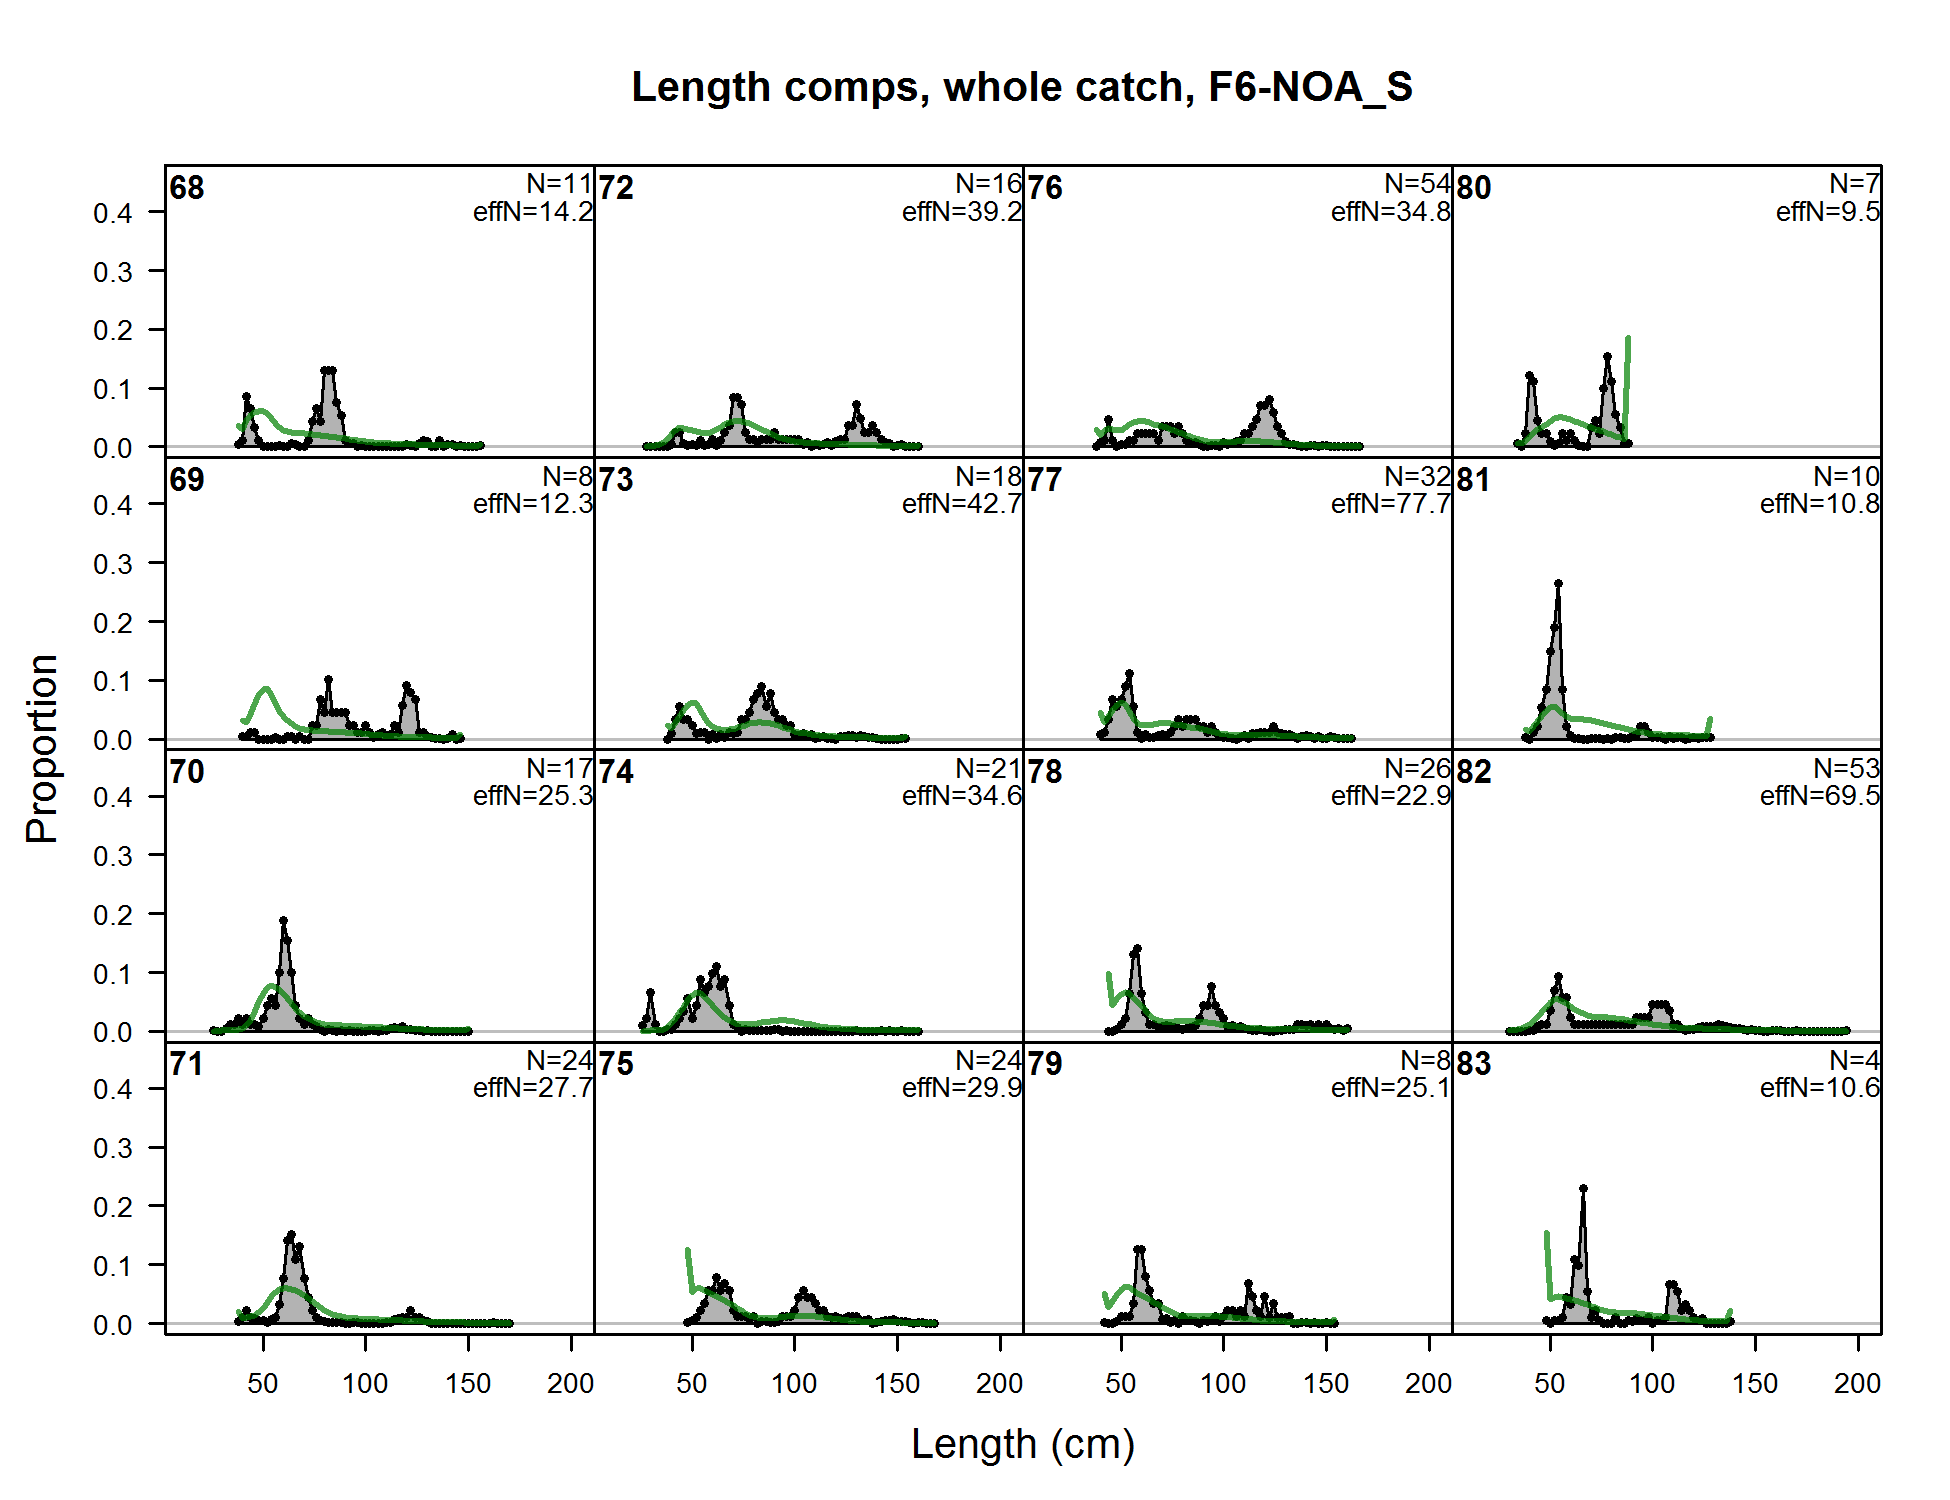
Length comps, whole catch, F6-NOA_S (plot 1 of 10) (plot 2 of 10) (plot 3 of 10) (plot 4 of 10) (plot 5 of 10) (plot 6 of 10) (plot 7 of 10)
file: comp_lenfit_flt6mkt0_page7.png
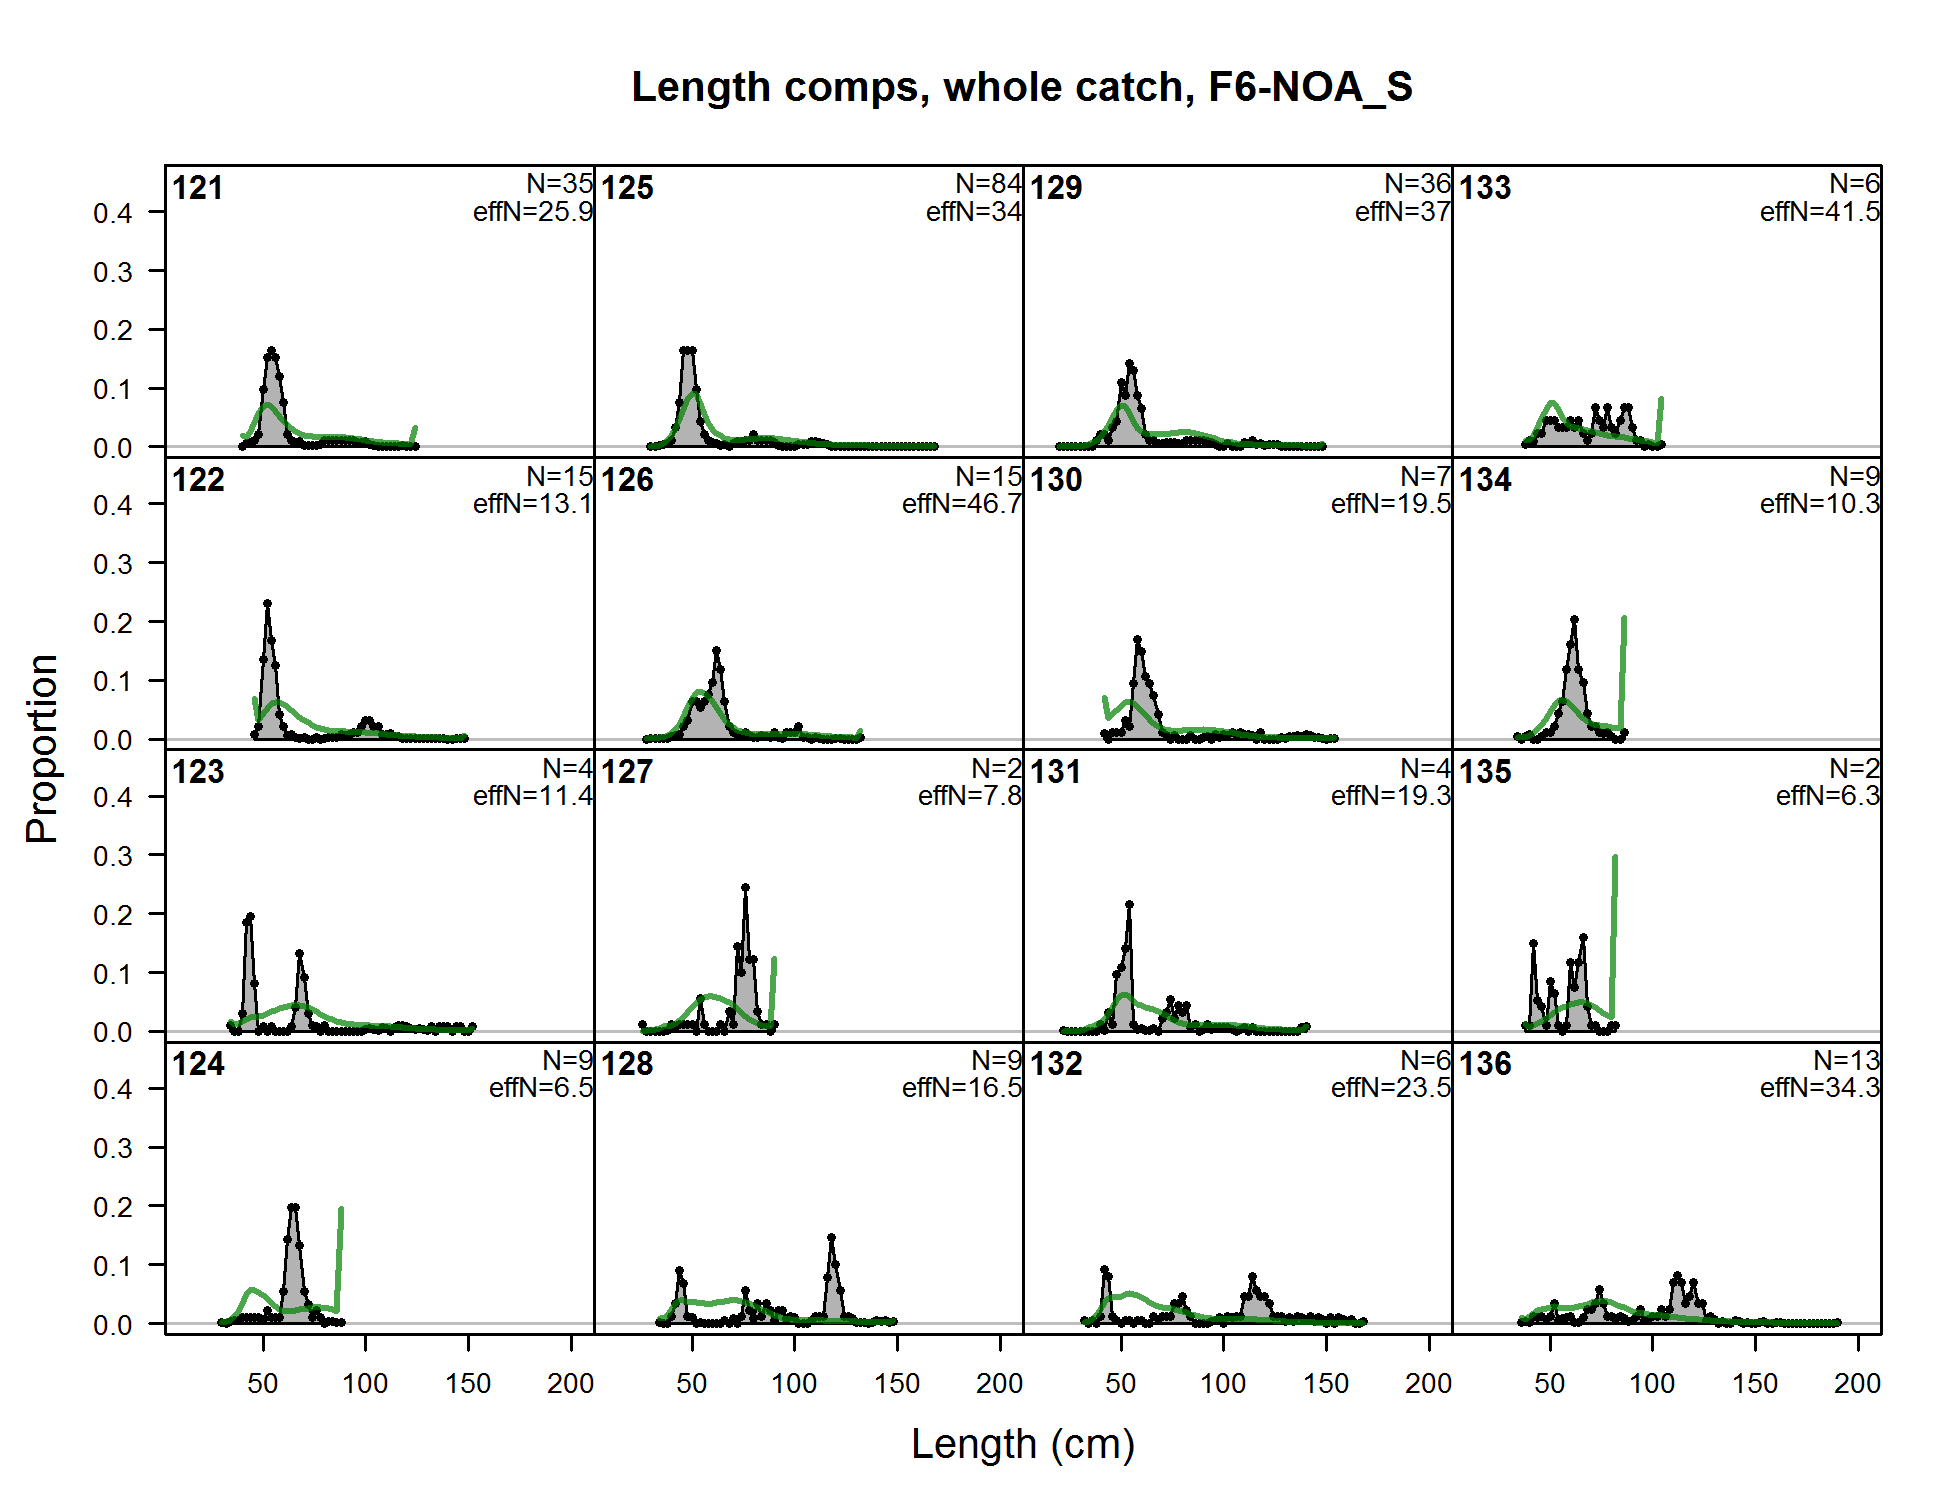
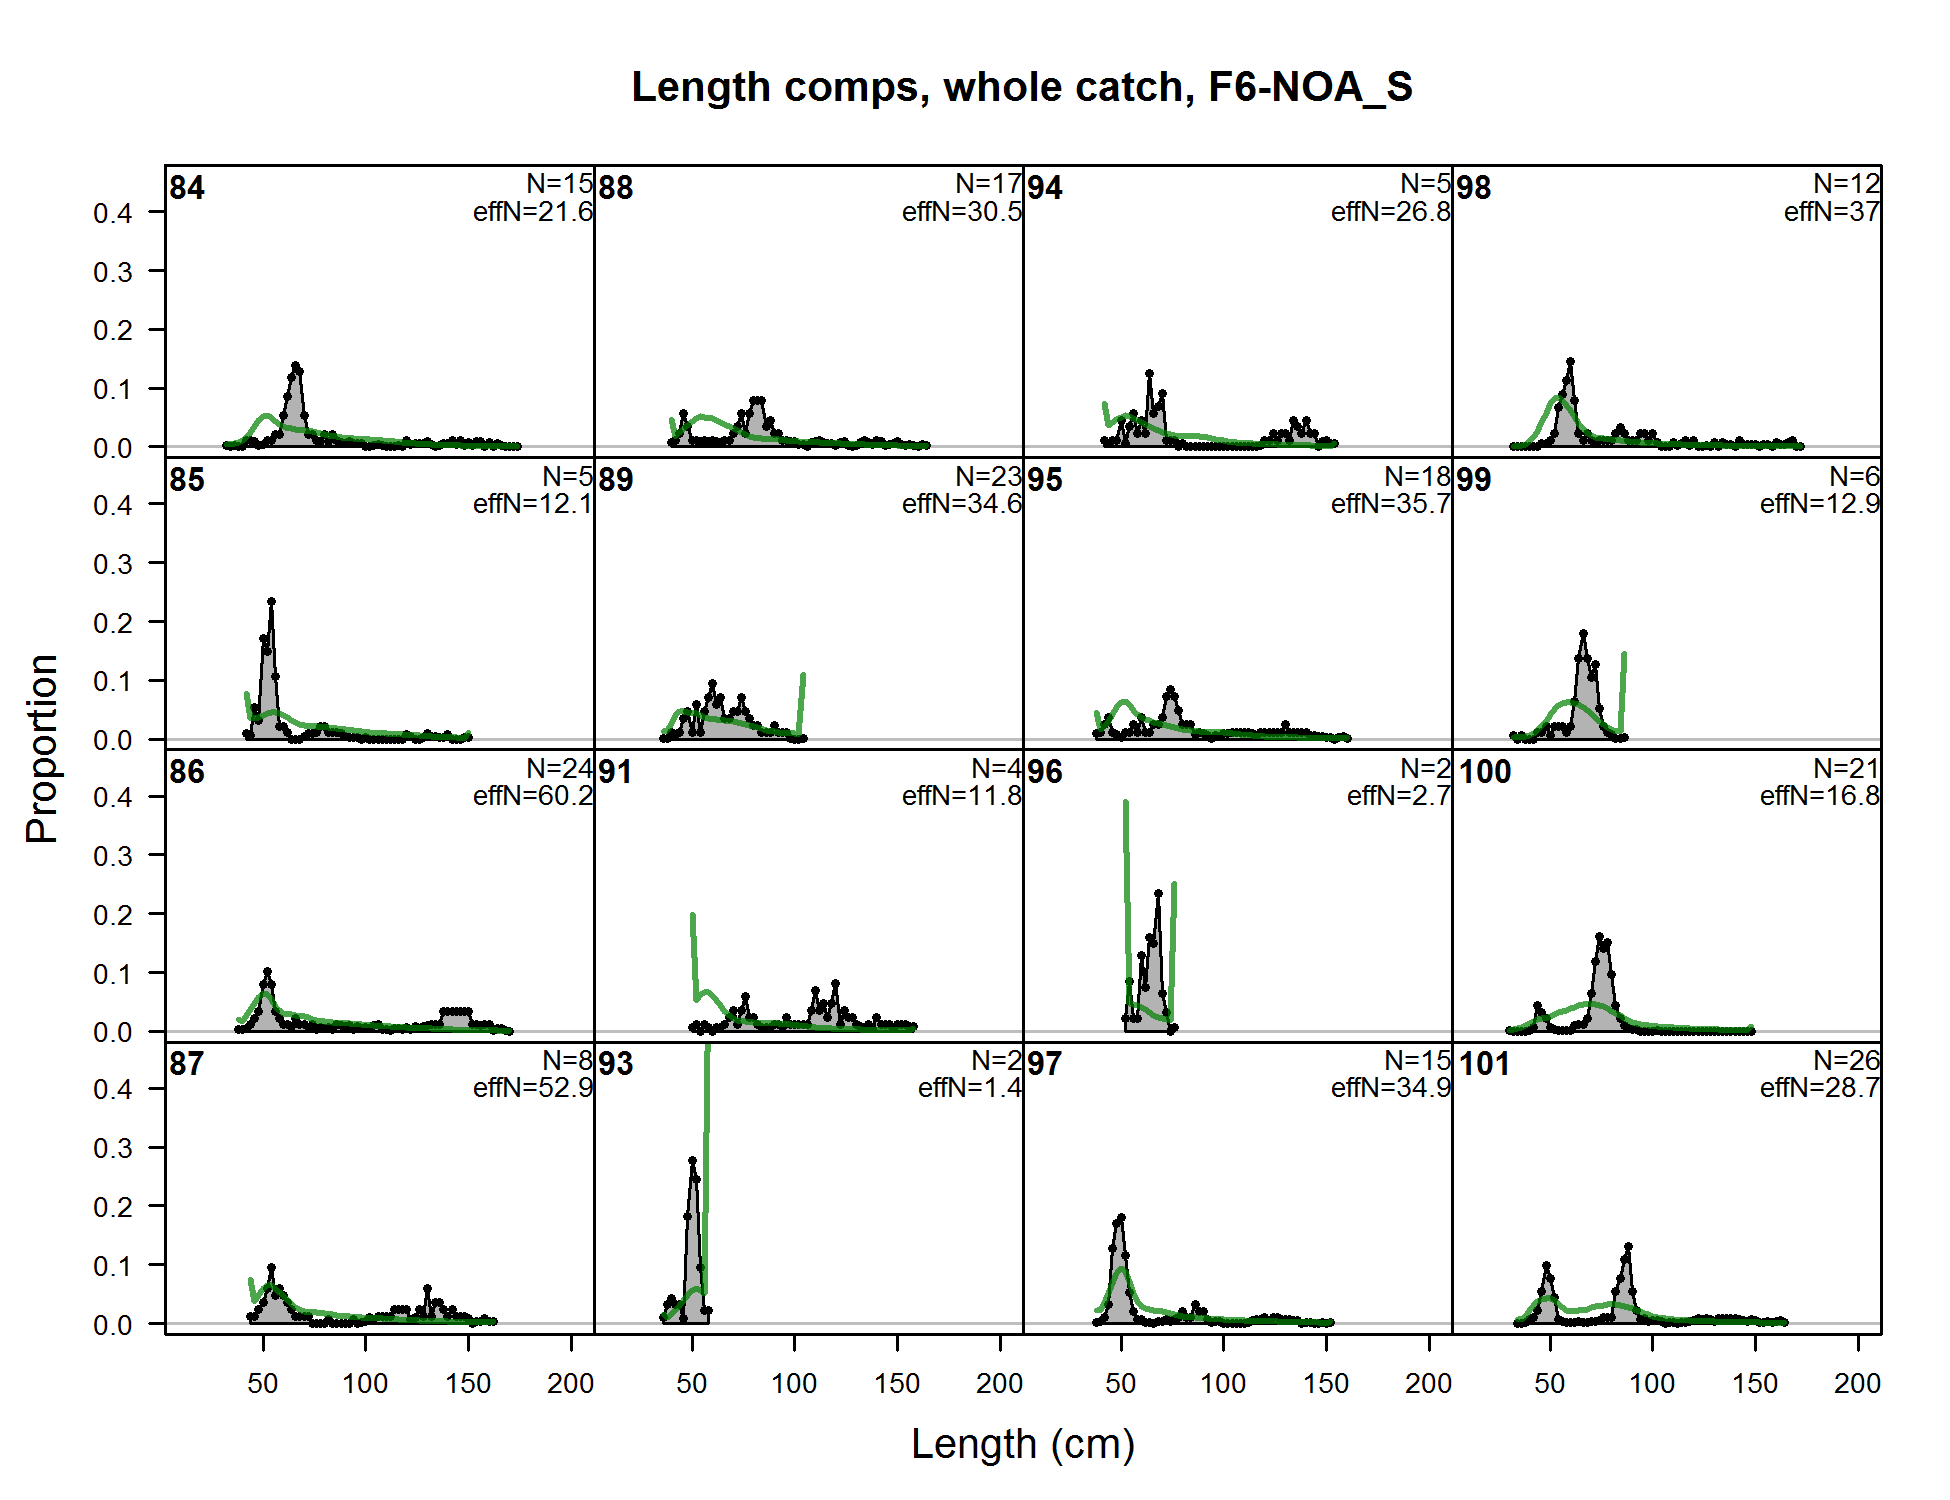
Length comps, whole catch, F6-NOA_S (plot 1 of 10) (plot 2 of 10) (plot 3 of 10) (plot 4 of 10) (plot 5 of 10) (plot 6 of 10) (plot 7 of 10) (plot 8 of 10)
file: comp_lenfit_flt6mkt0_page8.png
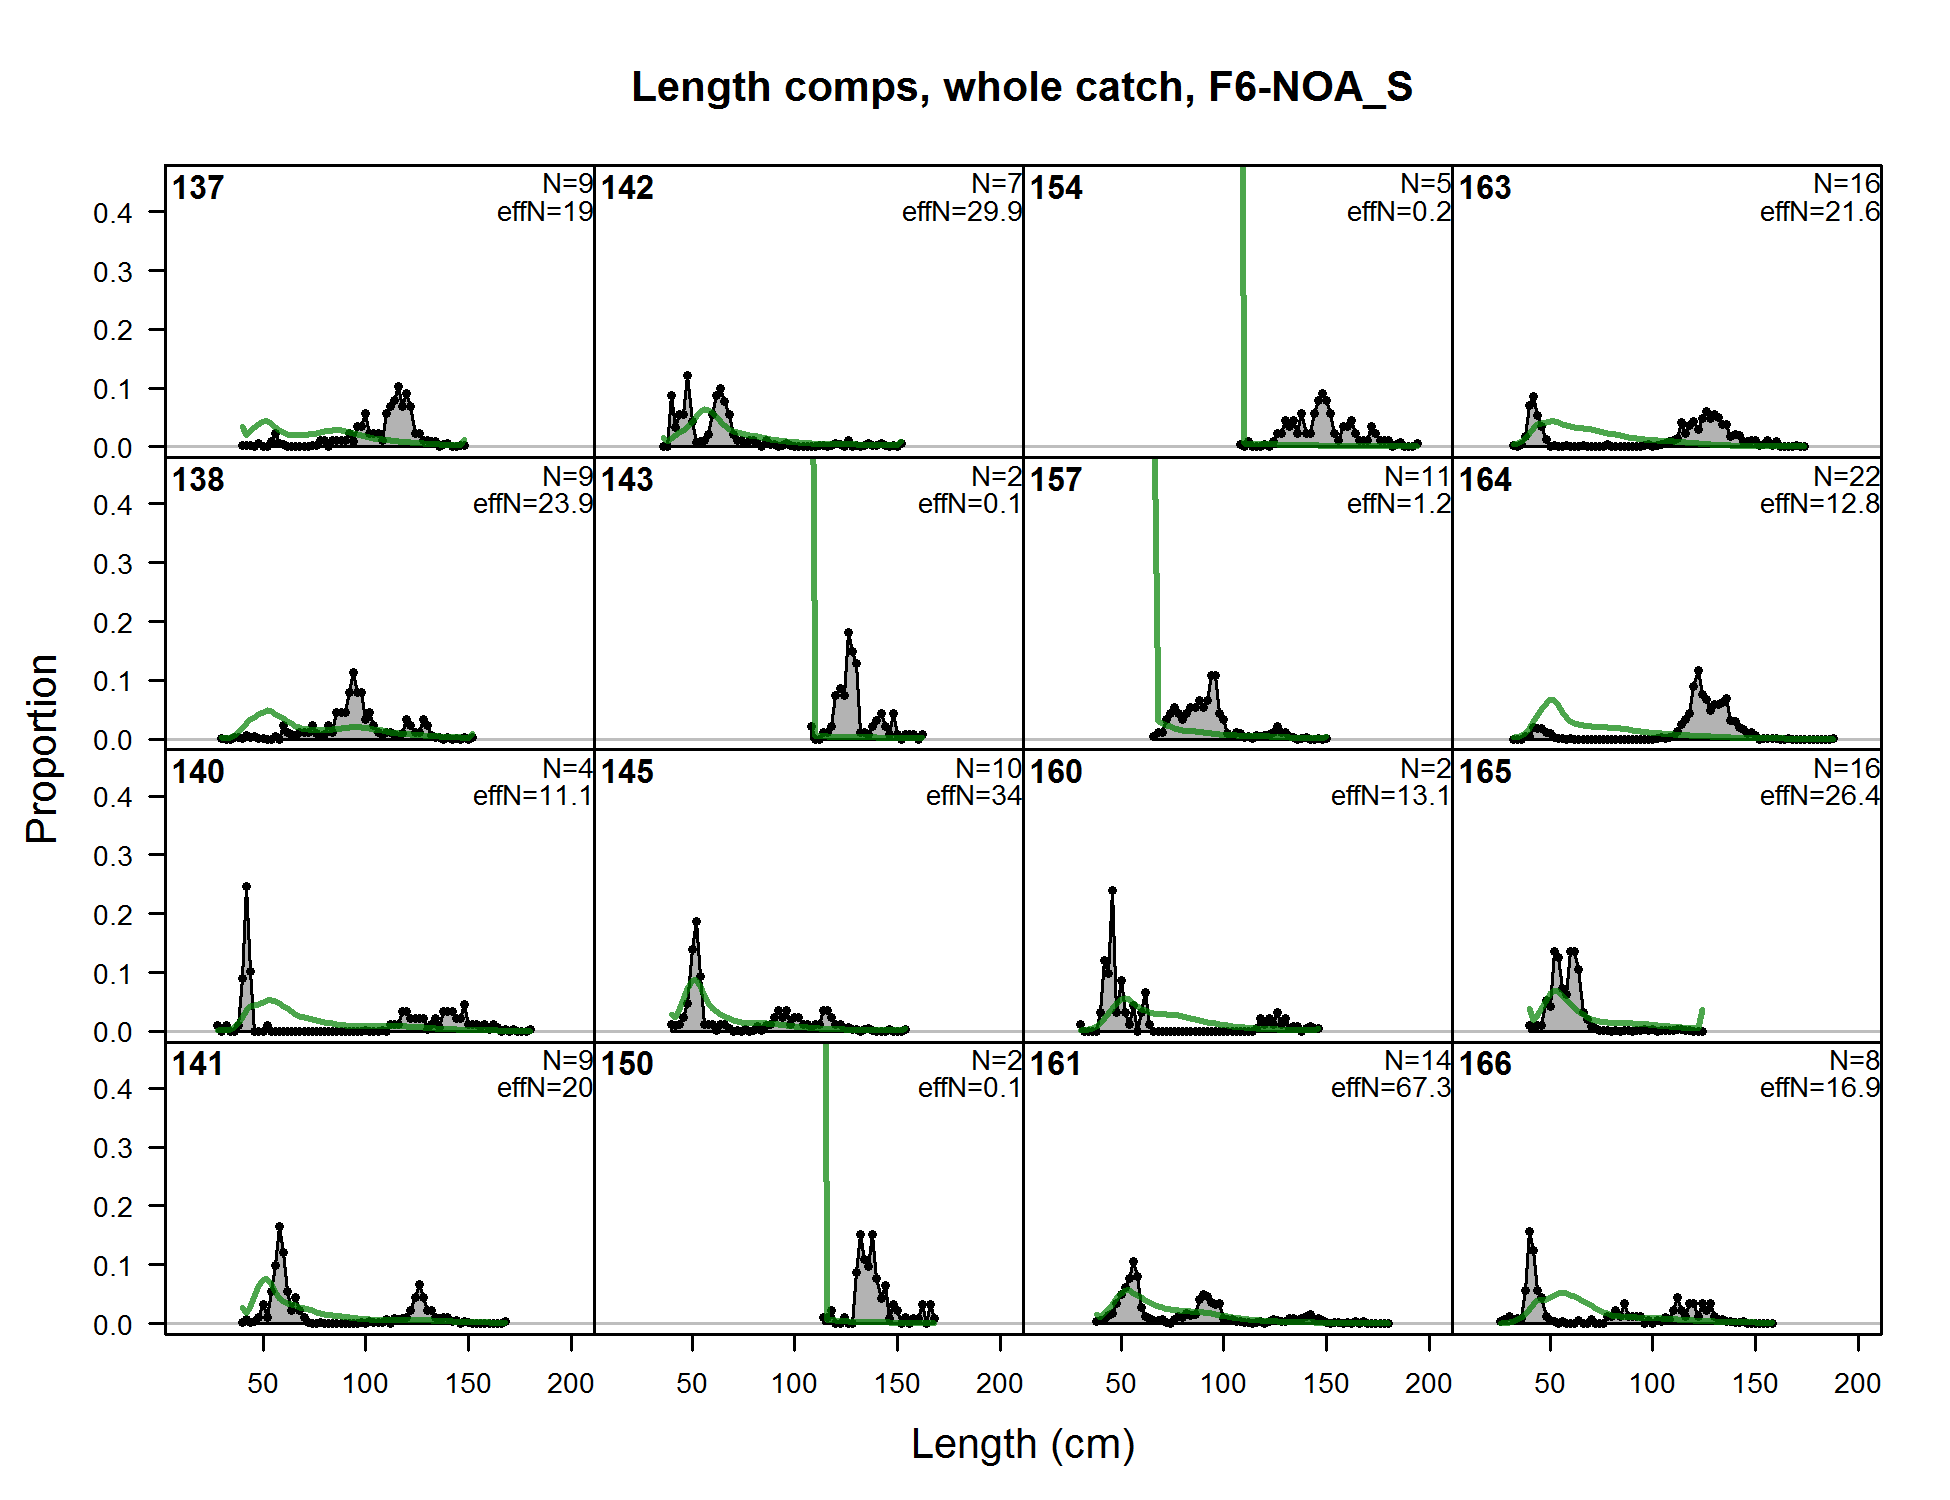
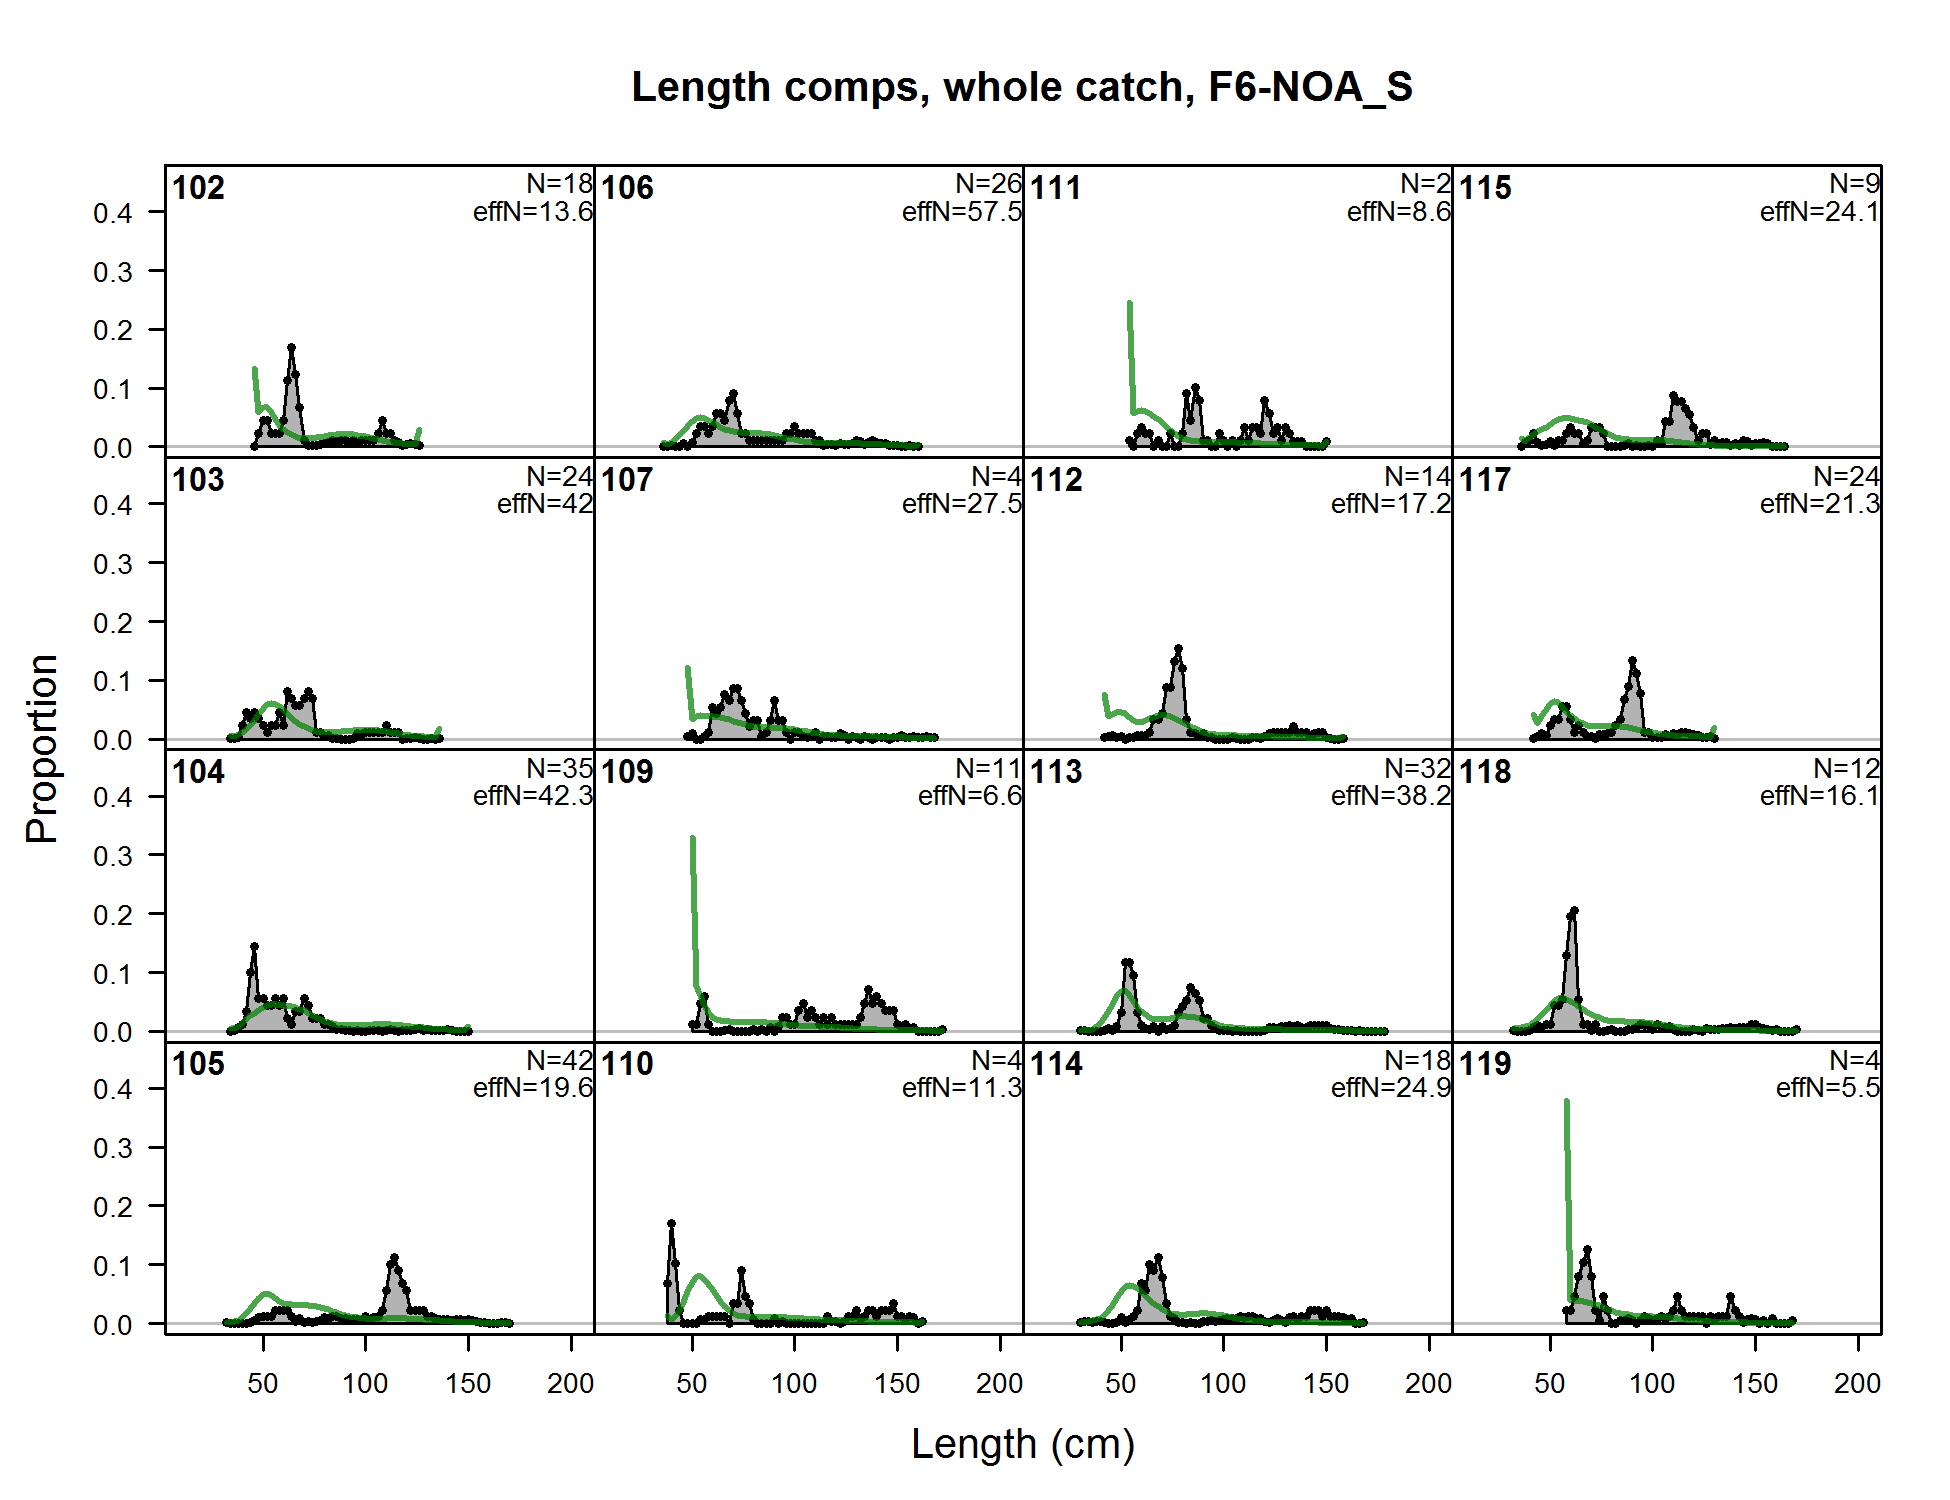
Length comps, whole catch, F6-NOA_S (plot 1 of 10) (plot 2 of 10) (plot 3 of 10) (plot 4 of 10) (plot 5 of 10) (plot 6 of 10) (plot 7 of 10) (plot 8 of 10) (plot 9 of 10)
file: comp_lenfit_flt6mkt0_page9.png
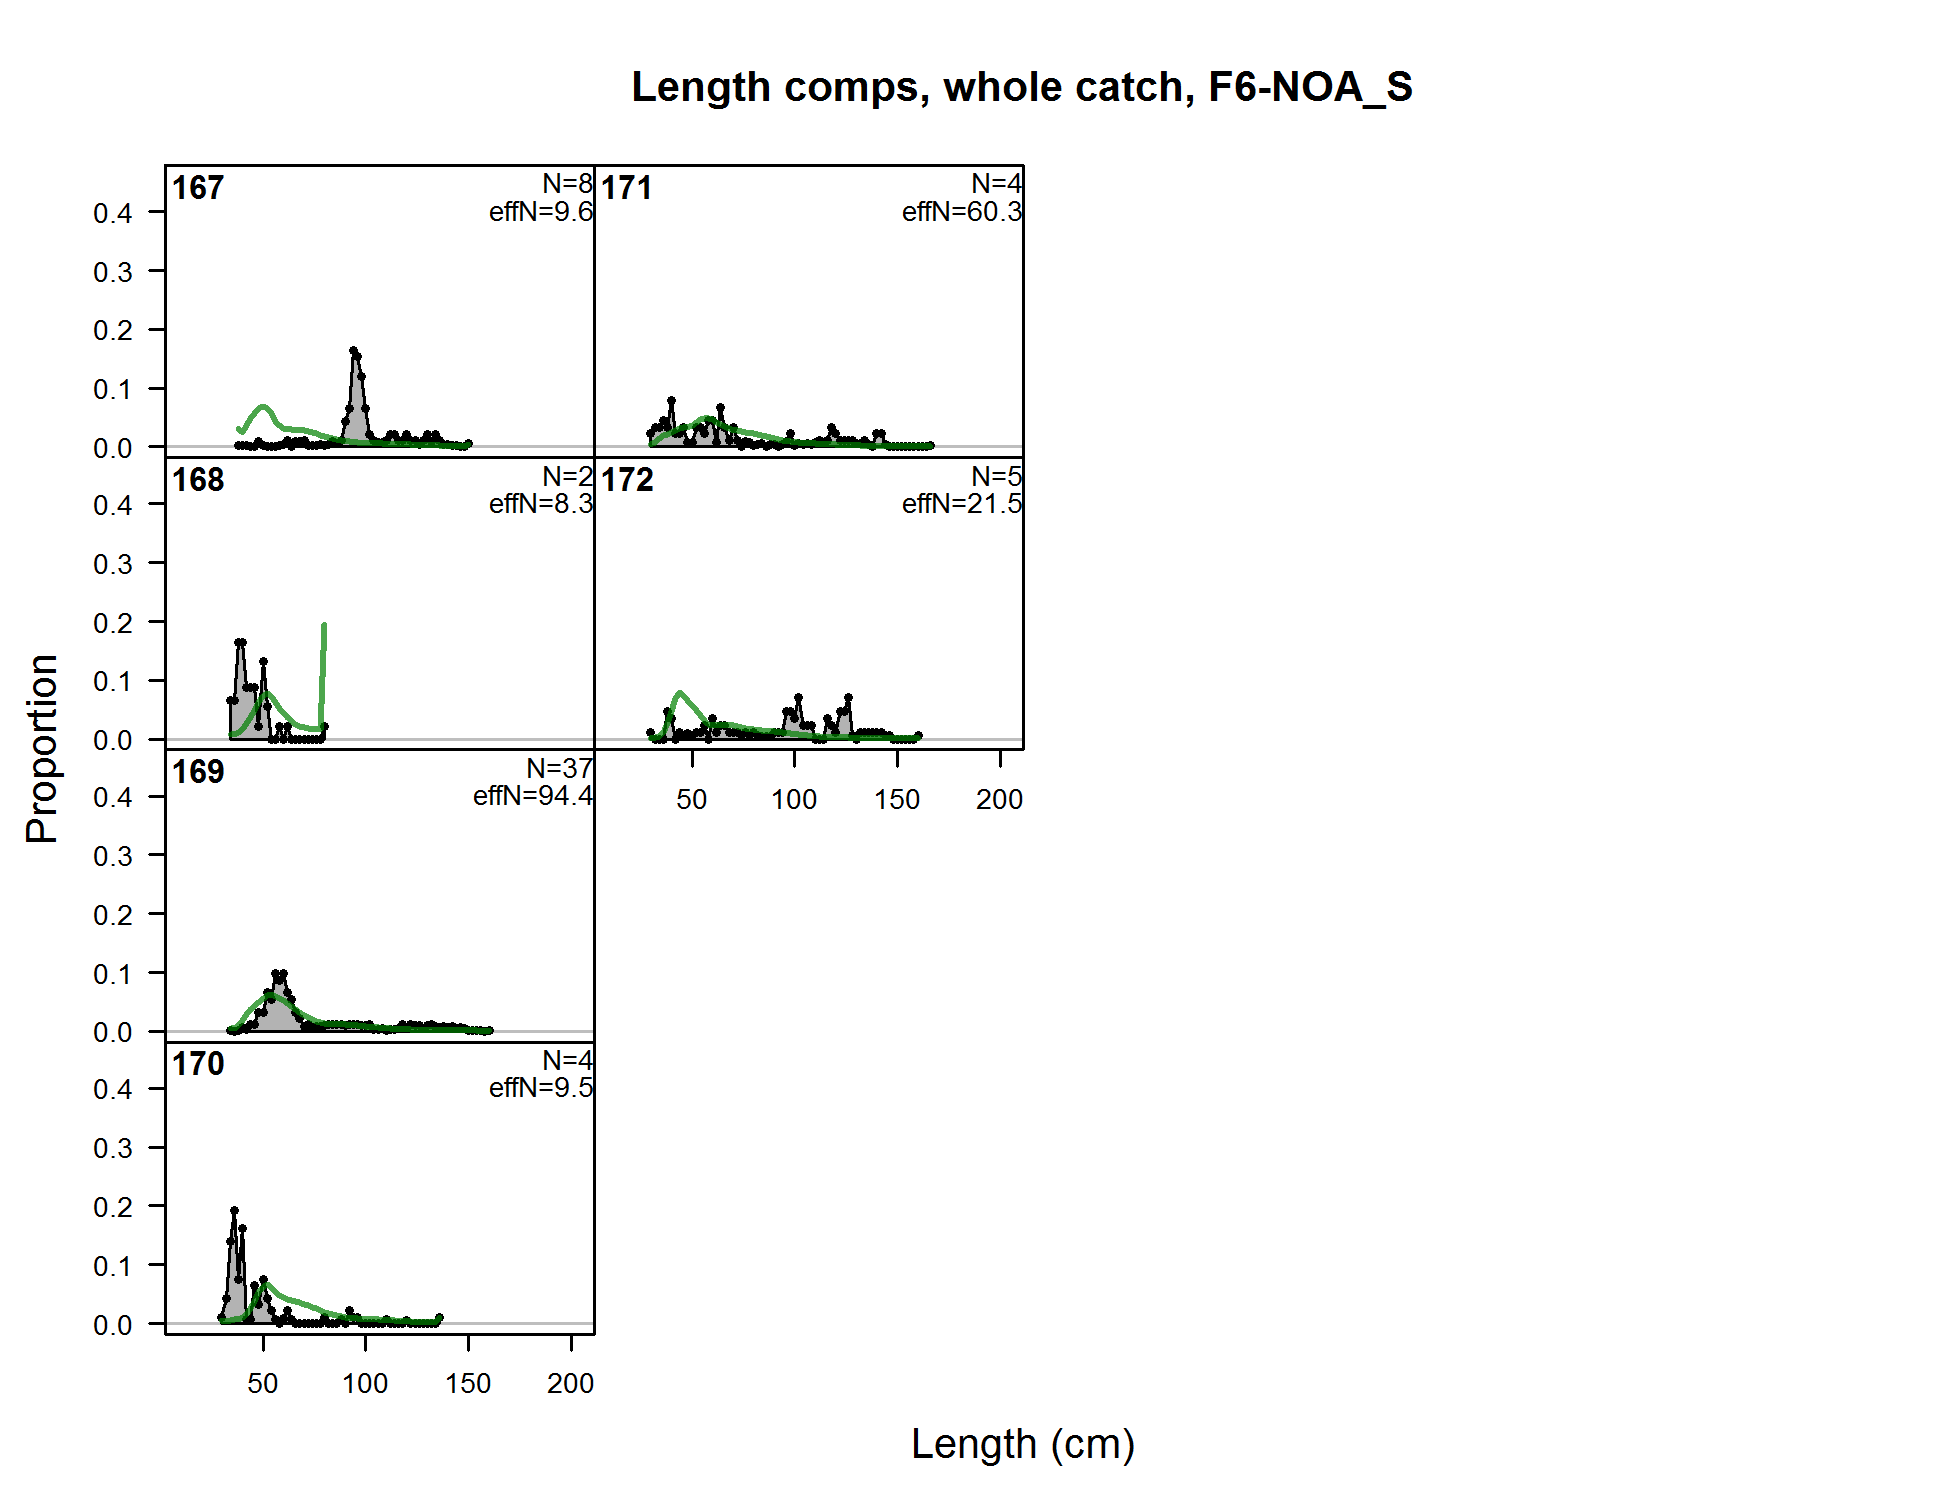
Length comps, whole catch, F6-NOA_S (plot 1 of 10) (plot 2 of 10) (plot 3 of 10) (plot 4 of 10) (plot 5 of 10) (plot 6 of 10) (plot 7 of 10) (plot 8 of 10) (plot 9 of 10) (plot 10 of 10)
file: comp_lenfit_flt6mkt0_page10.png
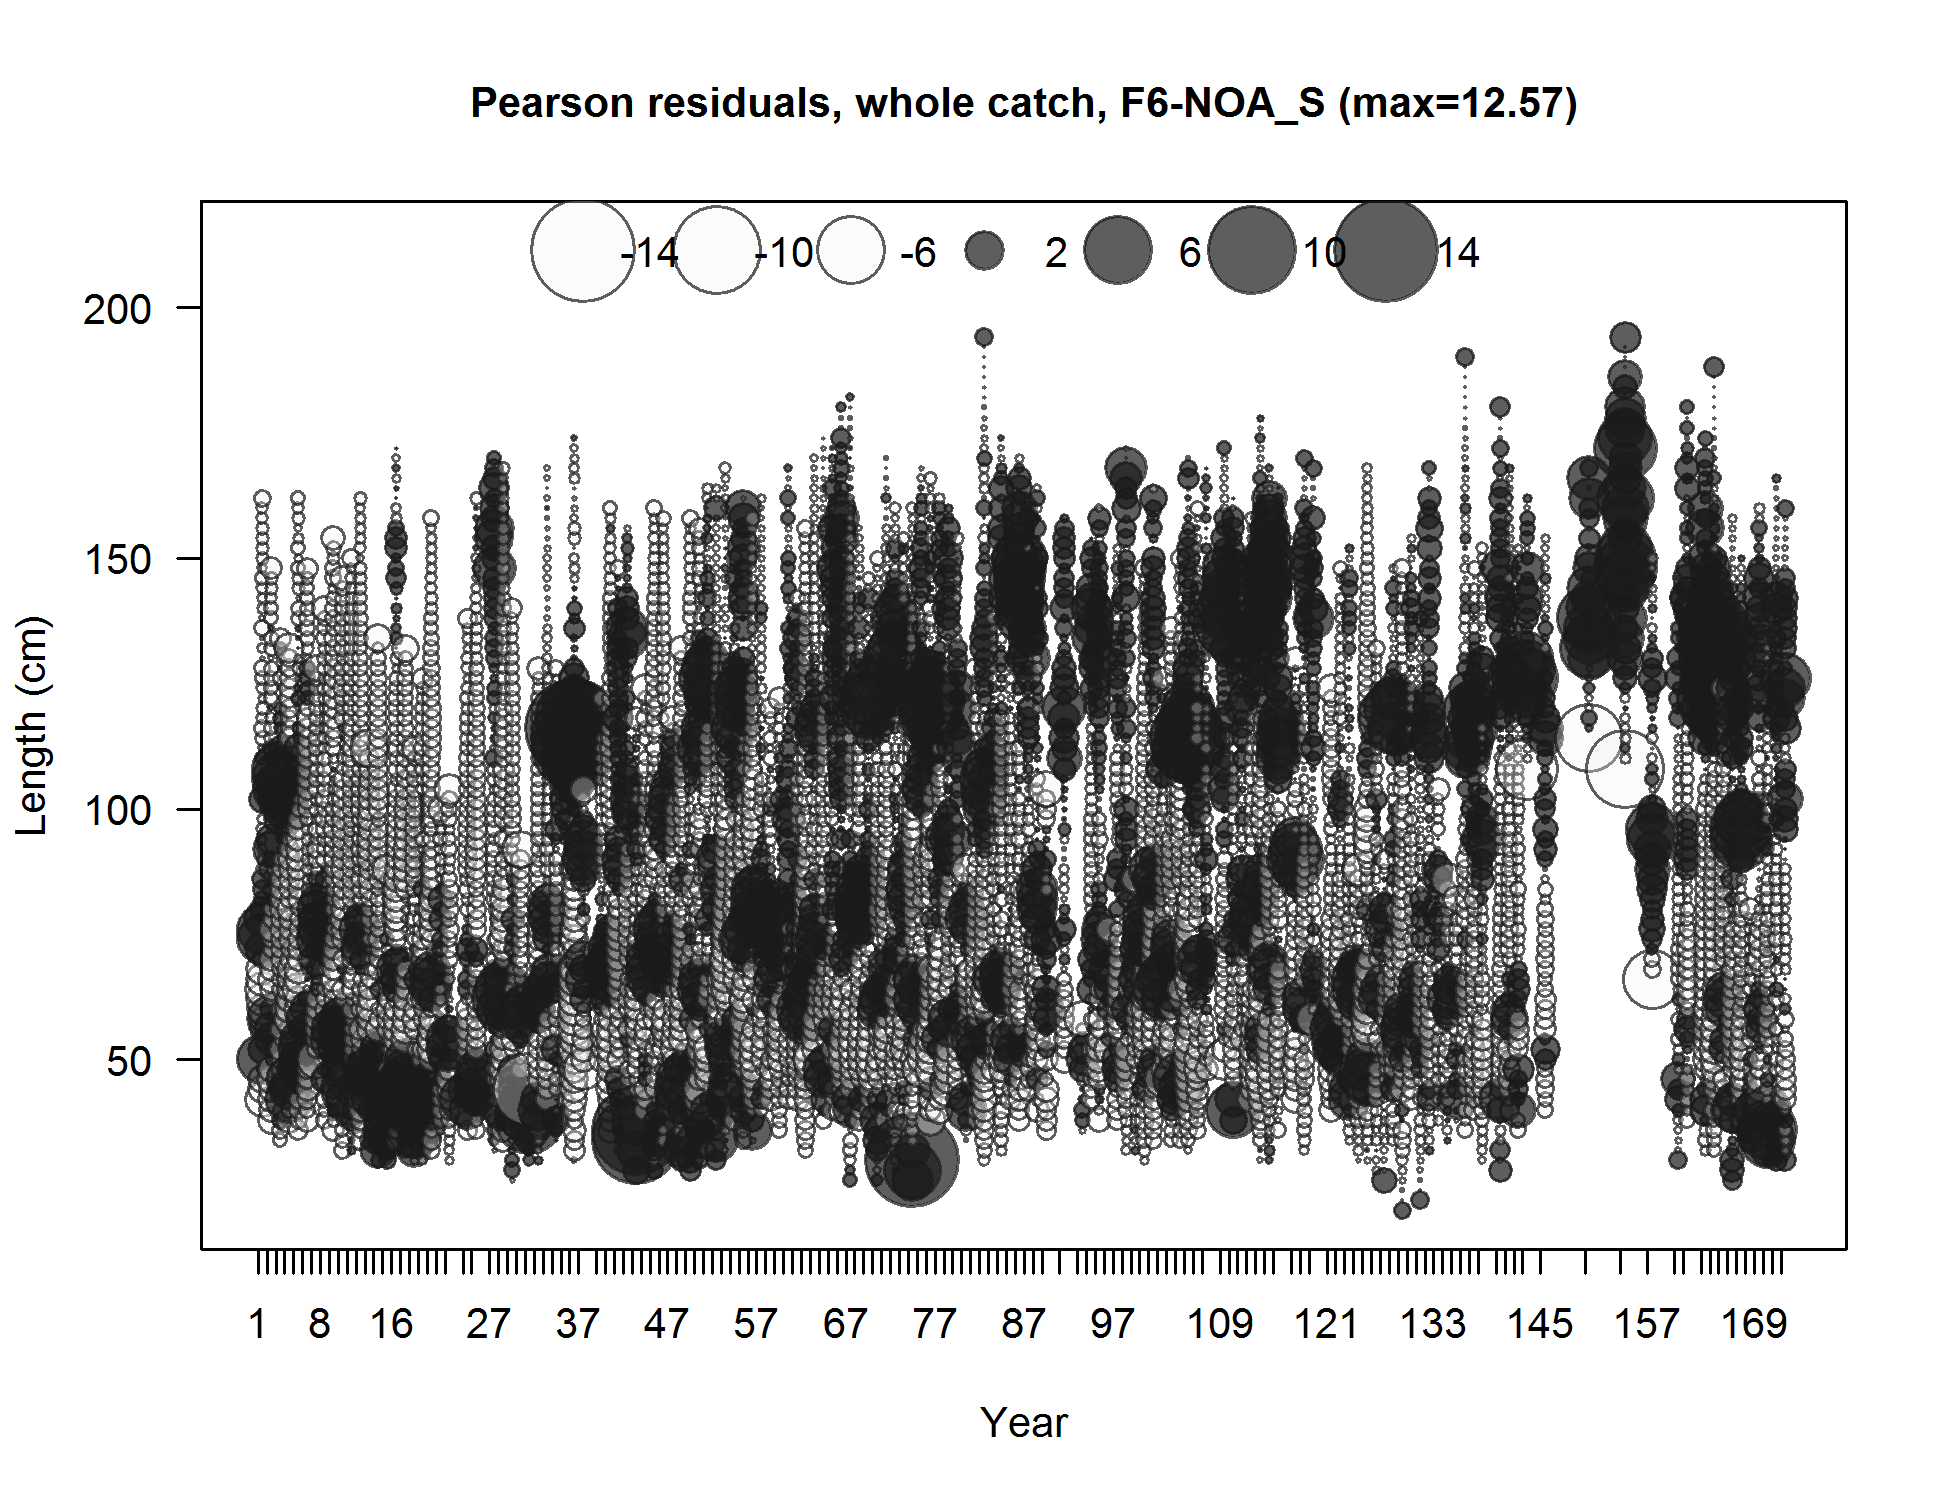
Pearson residuals, whole catch, F6-NOA_S (max=12.57) (plot 10 of 10)
Closed bubbles are positive residuals (observed > expected) and open bubbles are negative residuals (observed < expected).
file: comp_lenfit_residsflt6mkt0_page10.png
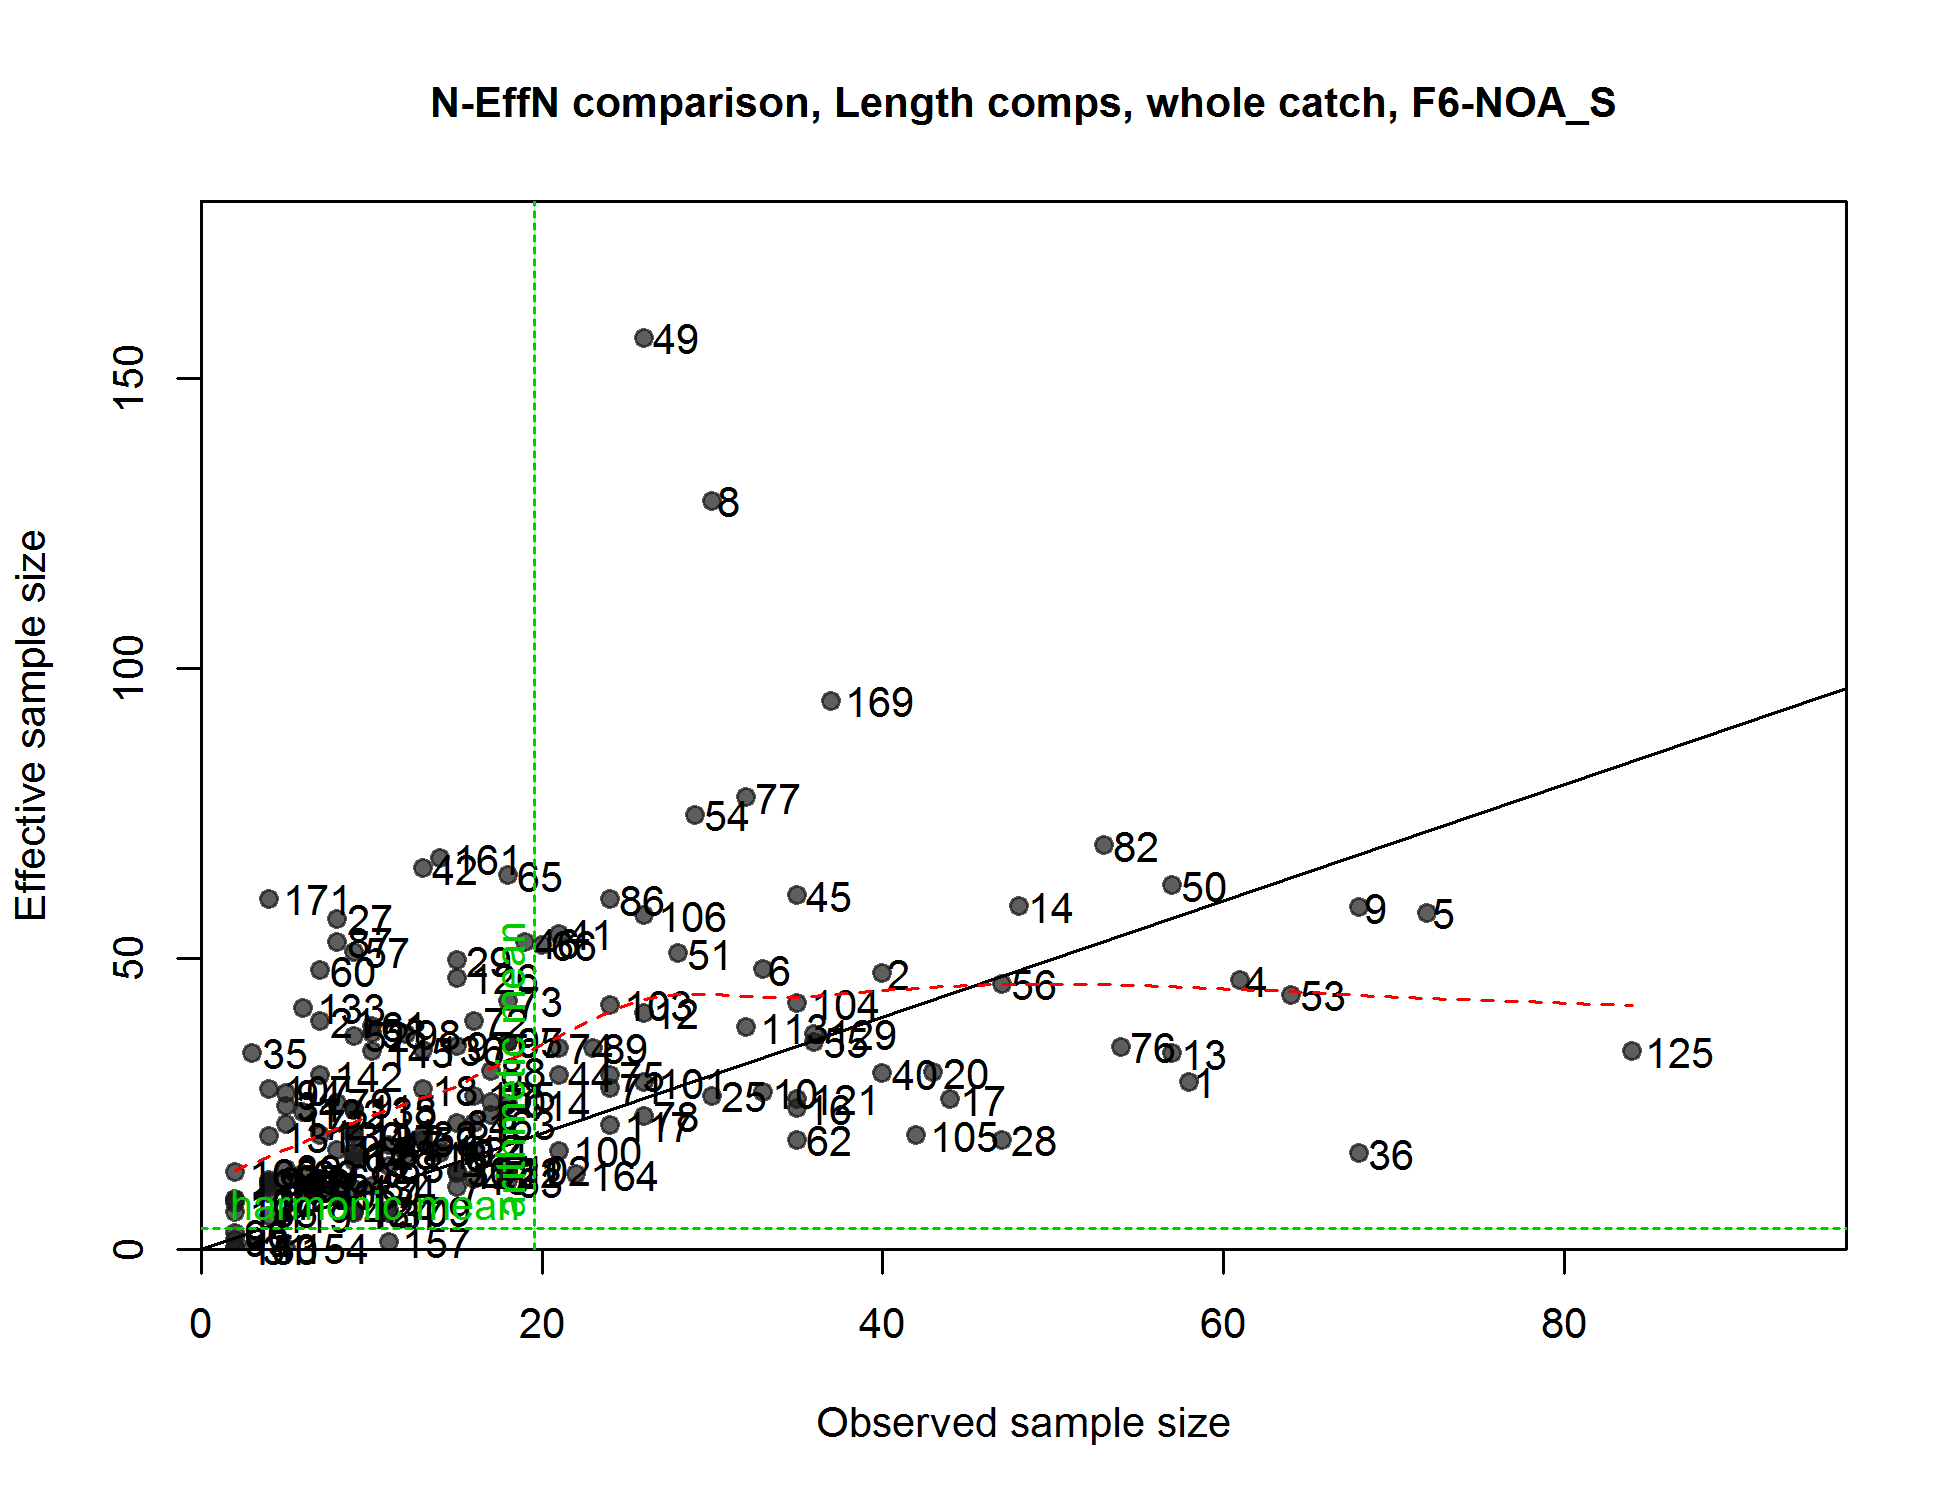
N-EffN comparison, Length comps, whole catch, F6-NOA_S
file: comp_lenfit_sampsize_flt6mkt0.png
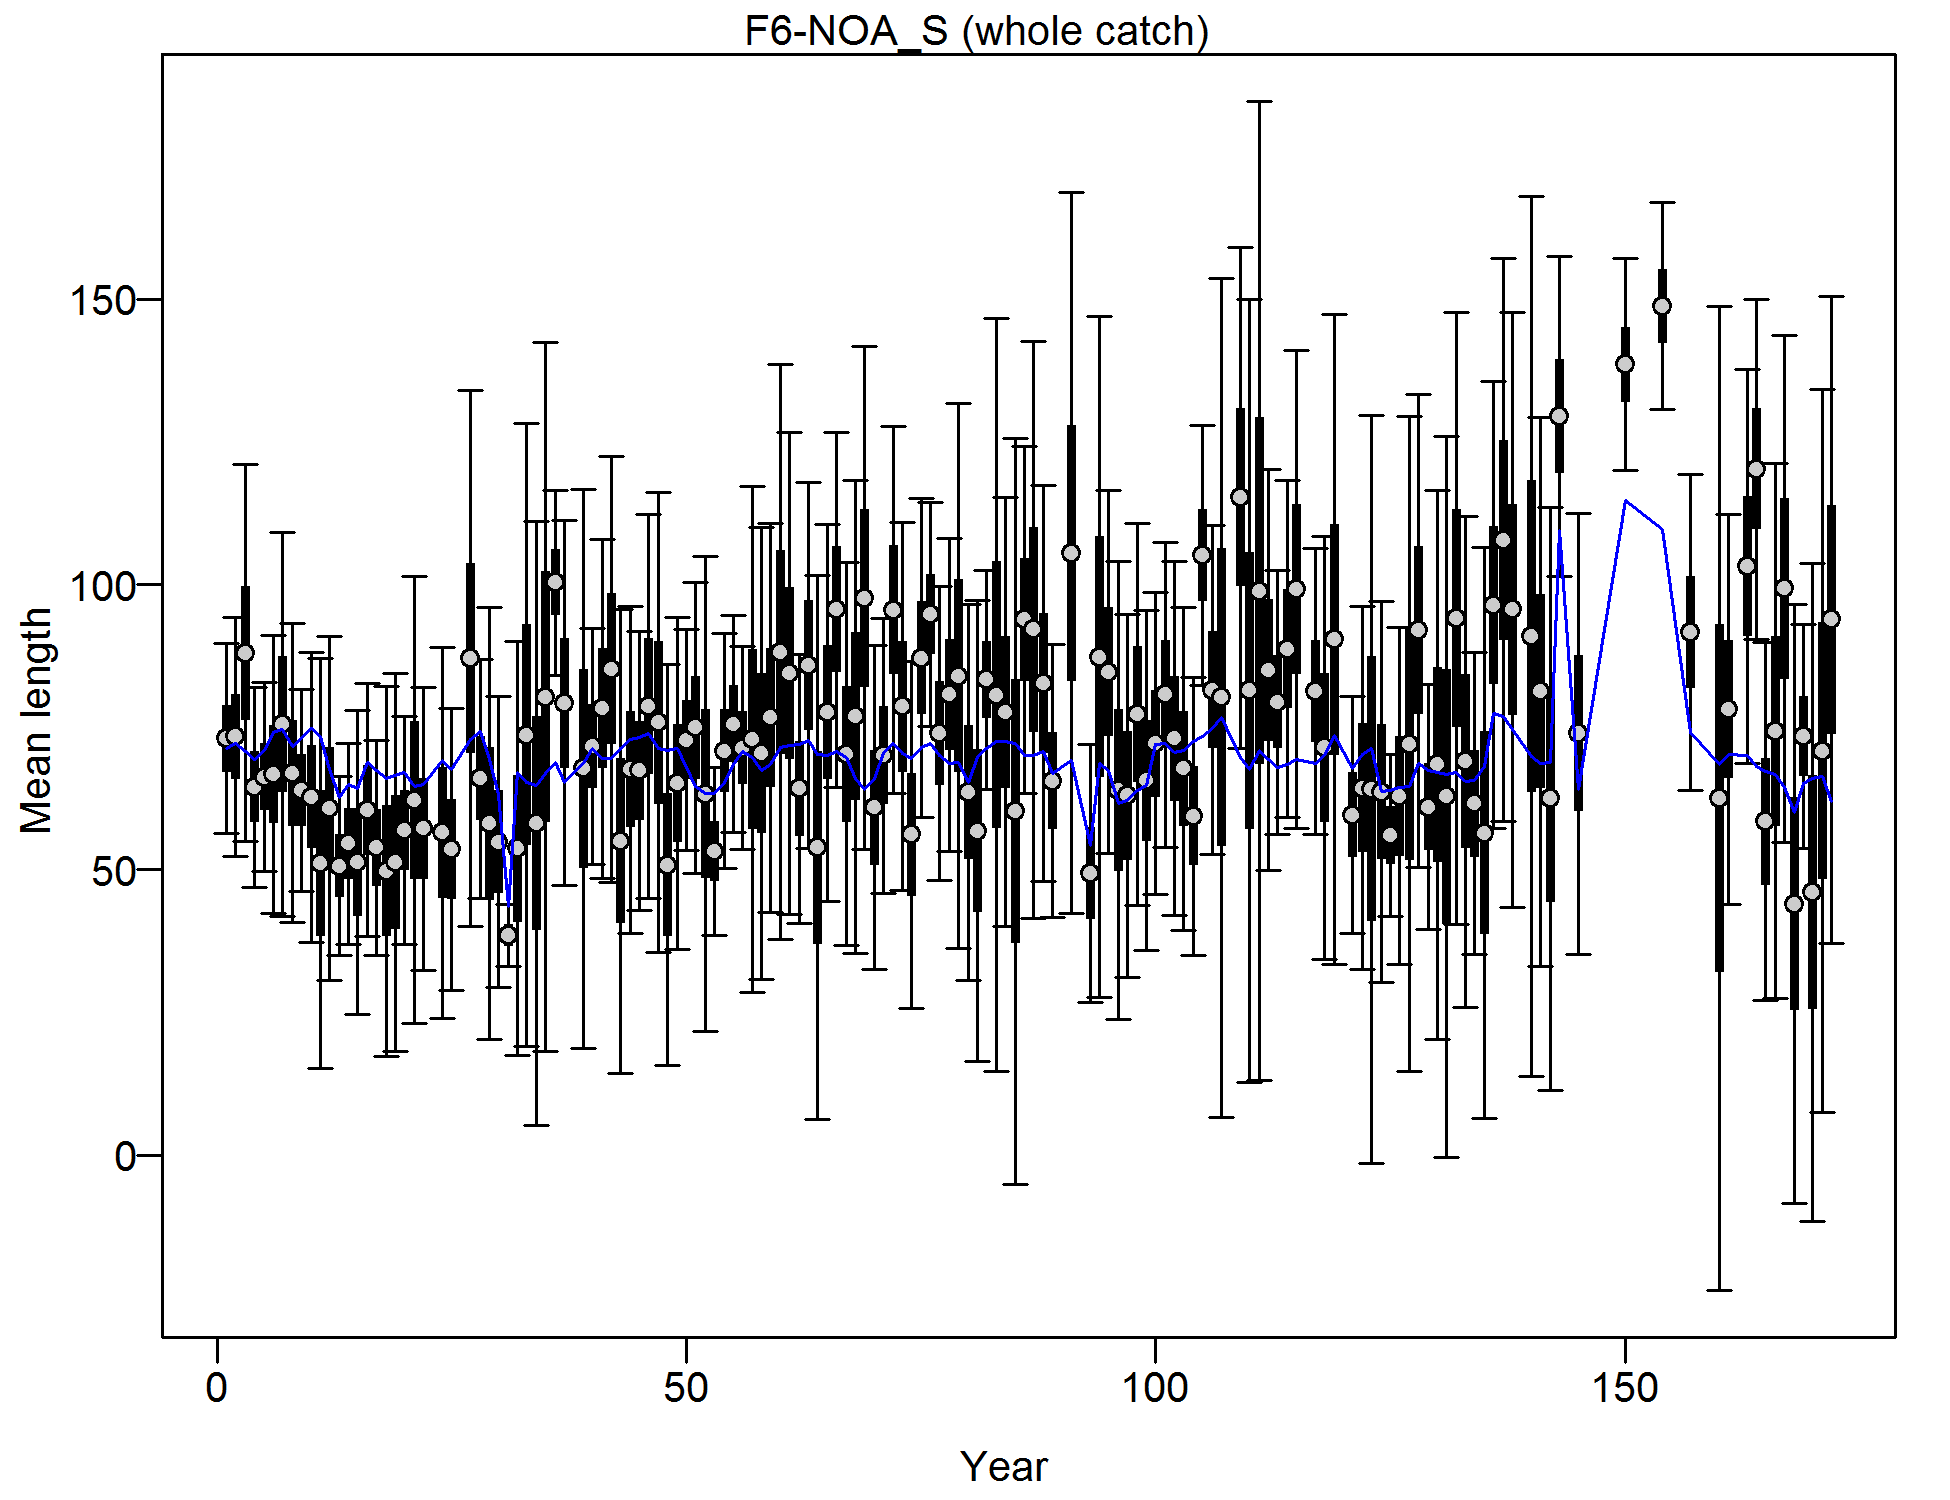
Mean length for F6-NOA_S with 95% confidence intervals based on current samples sizes.
Francis data weighting method TA1.8: thinner intervals (with capped ends) show result of further adjusting sample sizes based on suggested multiplier (with 95% interval) for len data from F6-NOA_S:
0.1257 (0.0936-0.1863)
For more info, see
Francis, R.I.C.C. (2011). Data weighting in statistical fisheries stock assessment models. Can. J. Fish. Aquat. Sci. 68: 1124-1138.
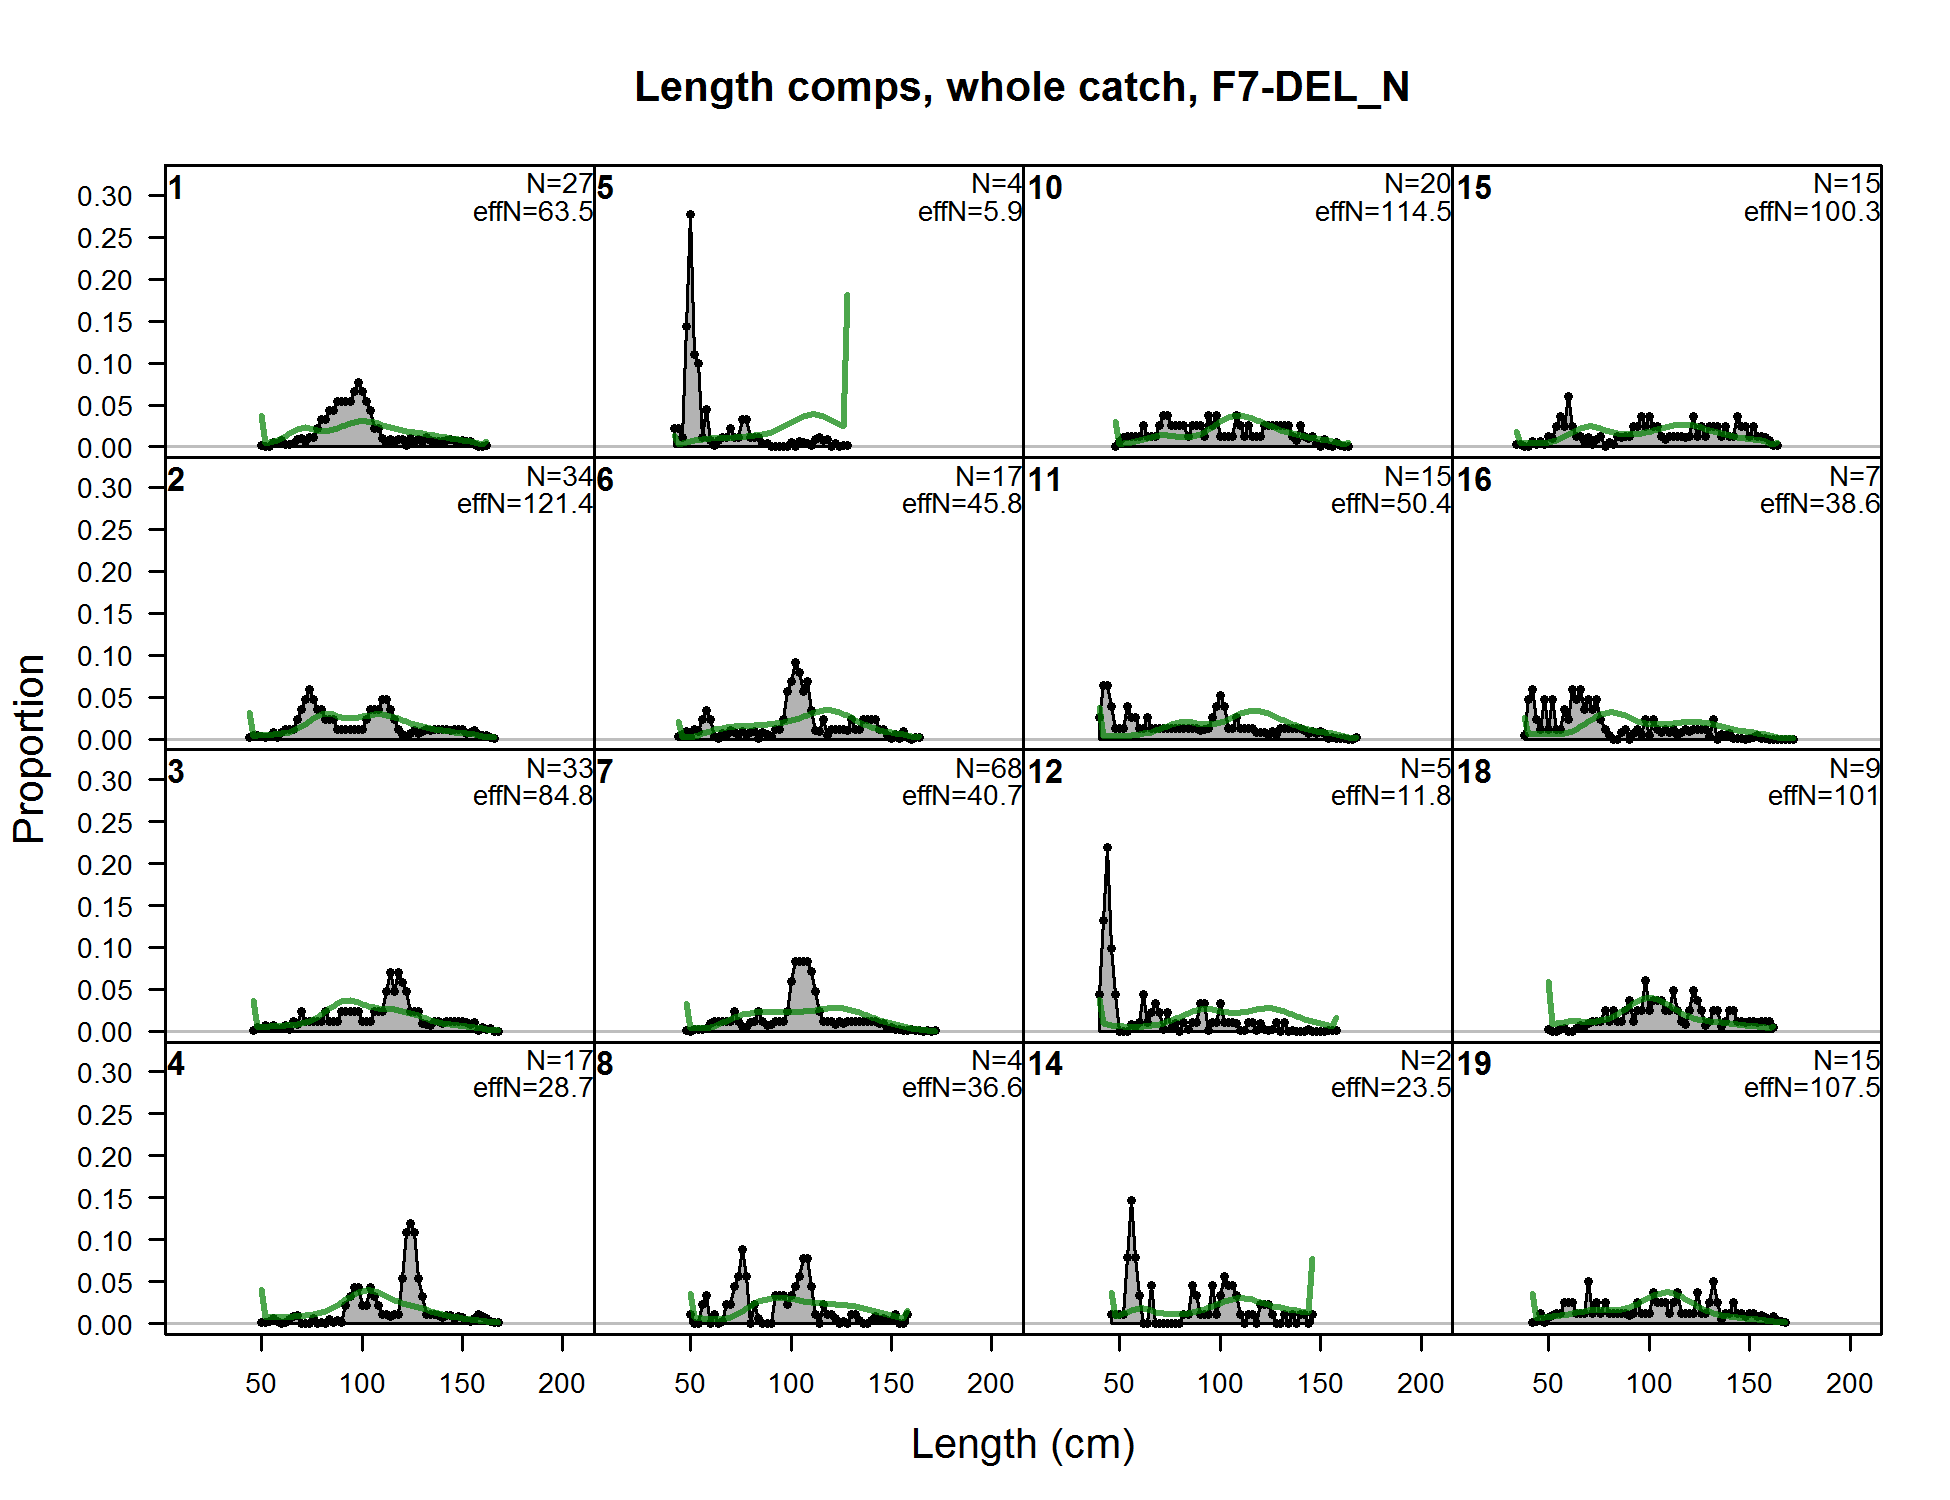
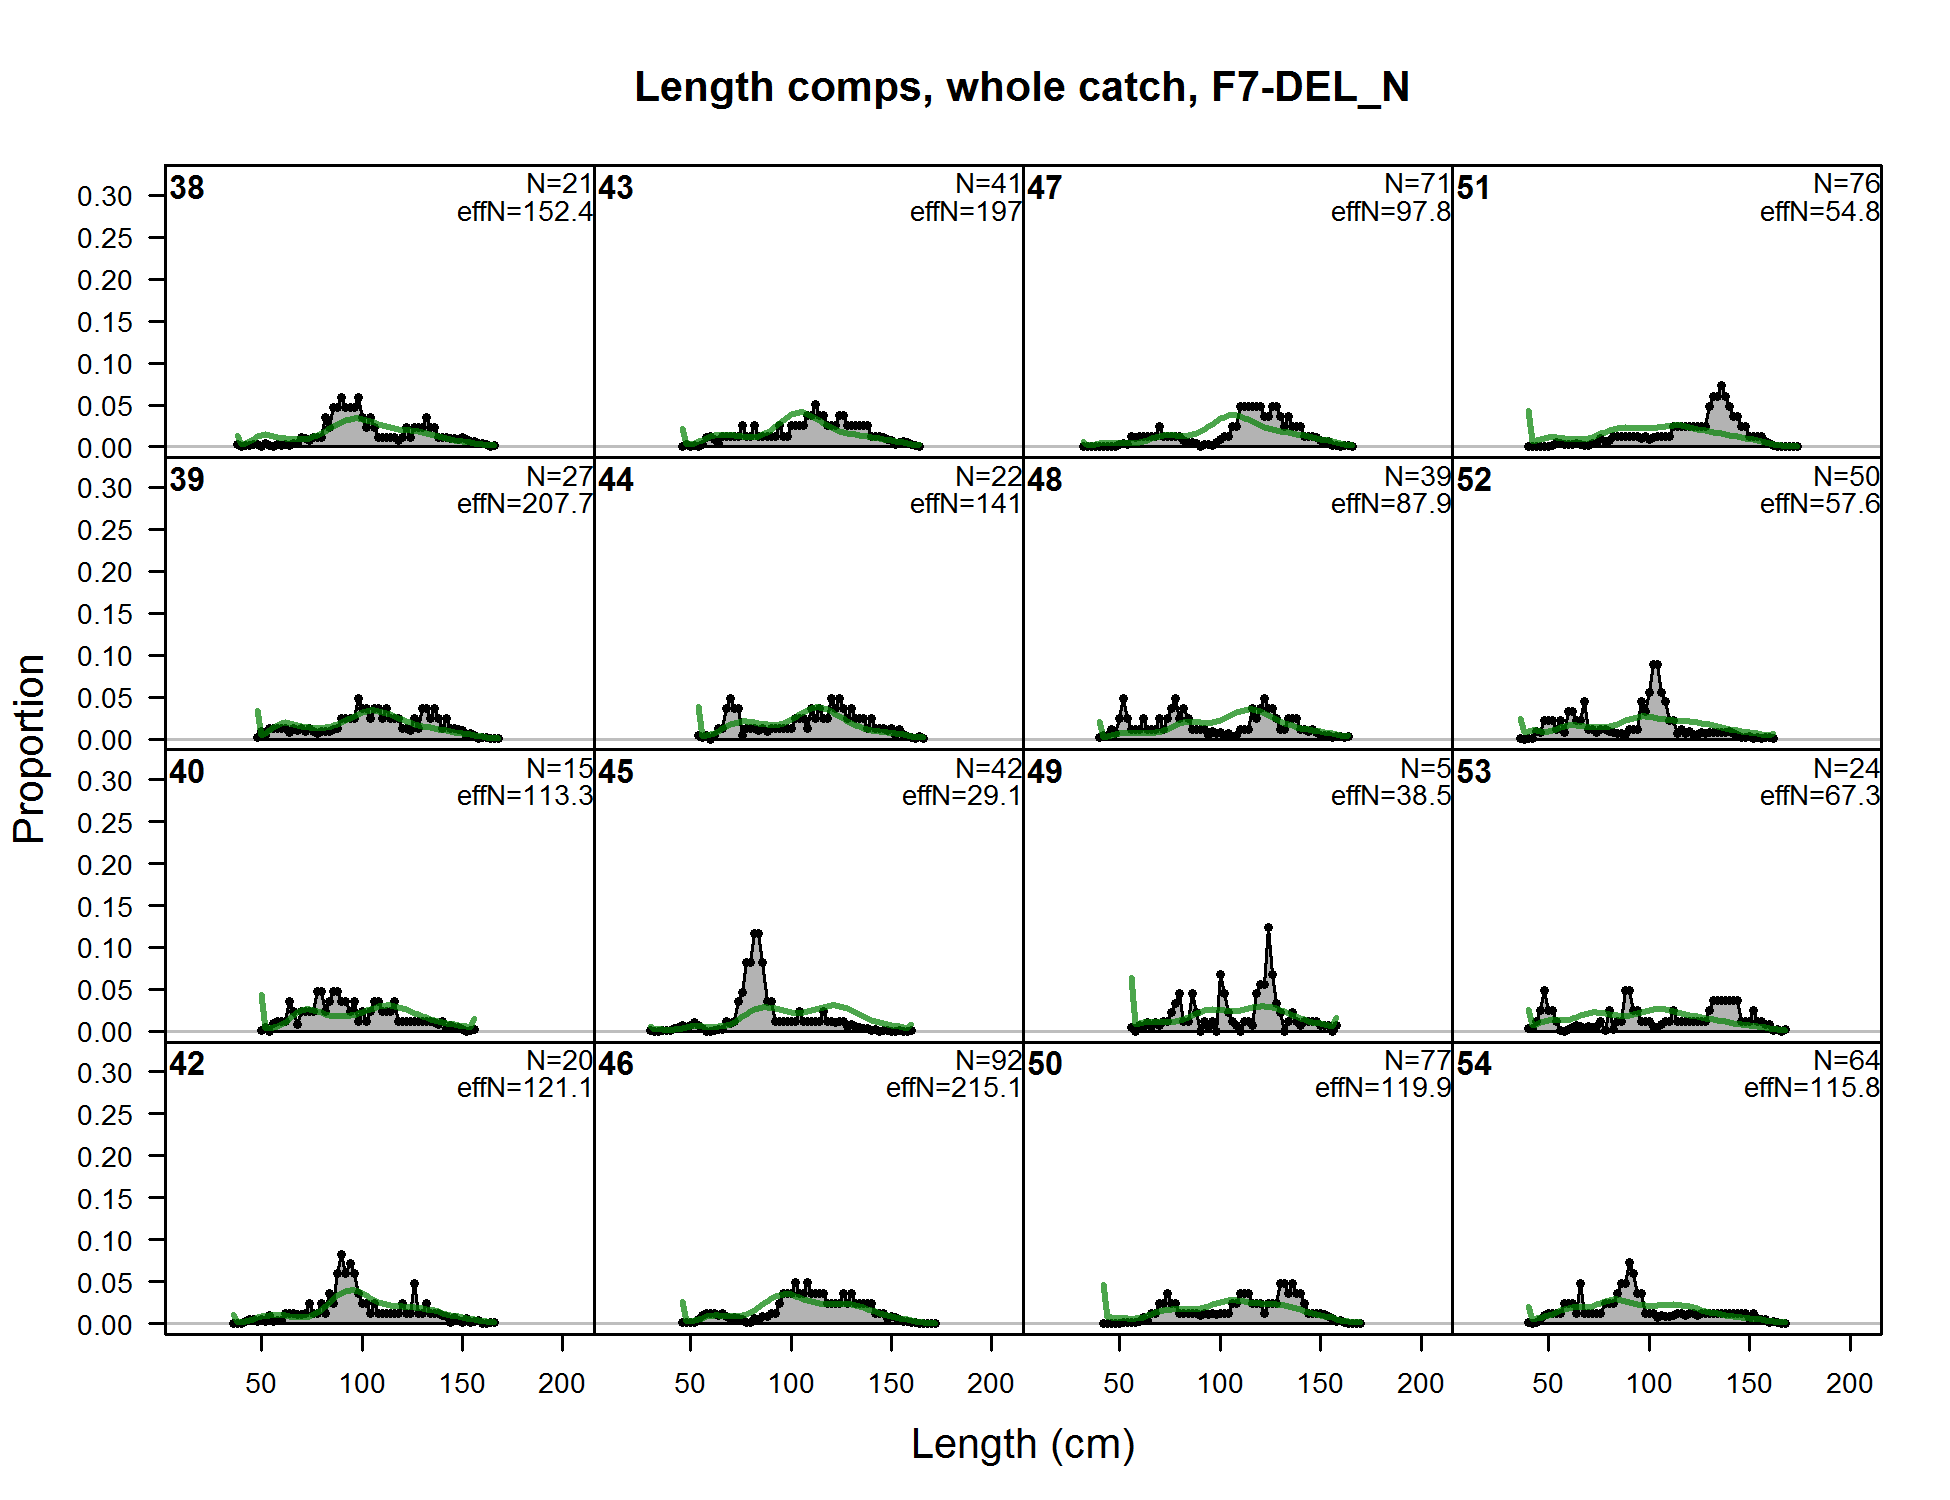
Length comps, whole catch, F7-DEL_N (plot 1 of 11)
file: comp_lenfit_flt7mkt0_page1.png
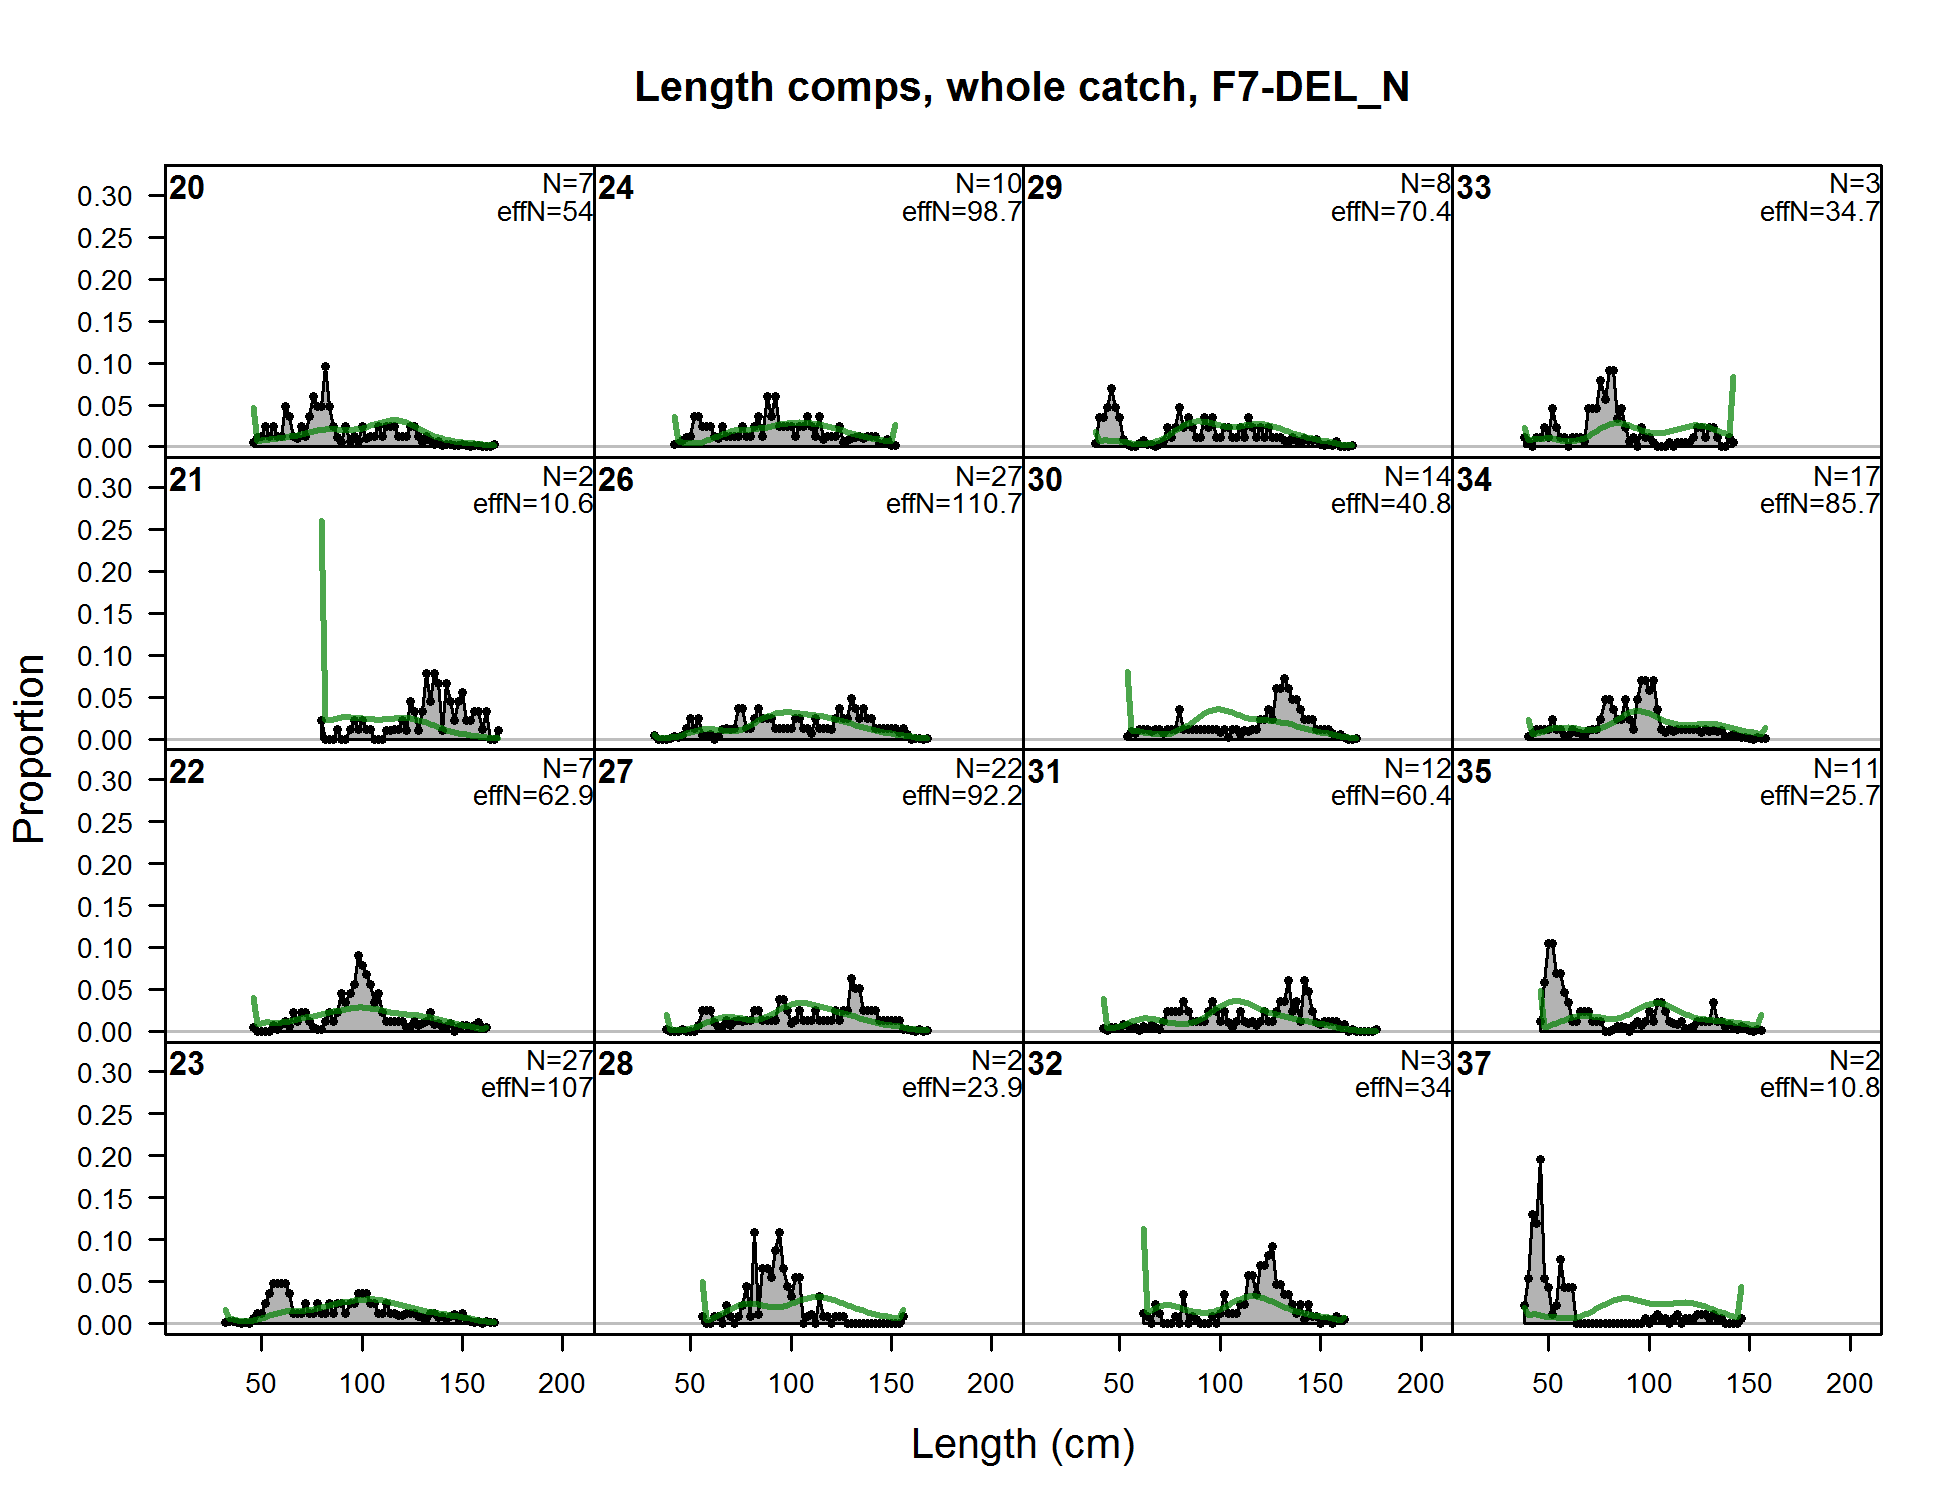
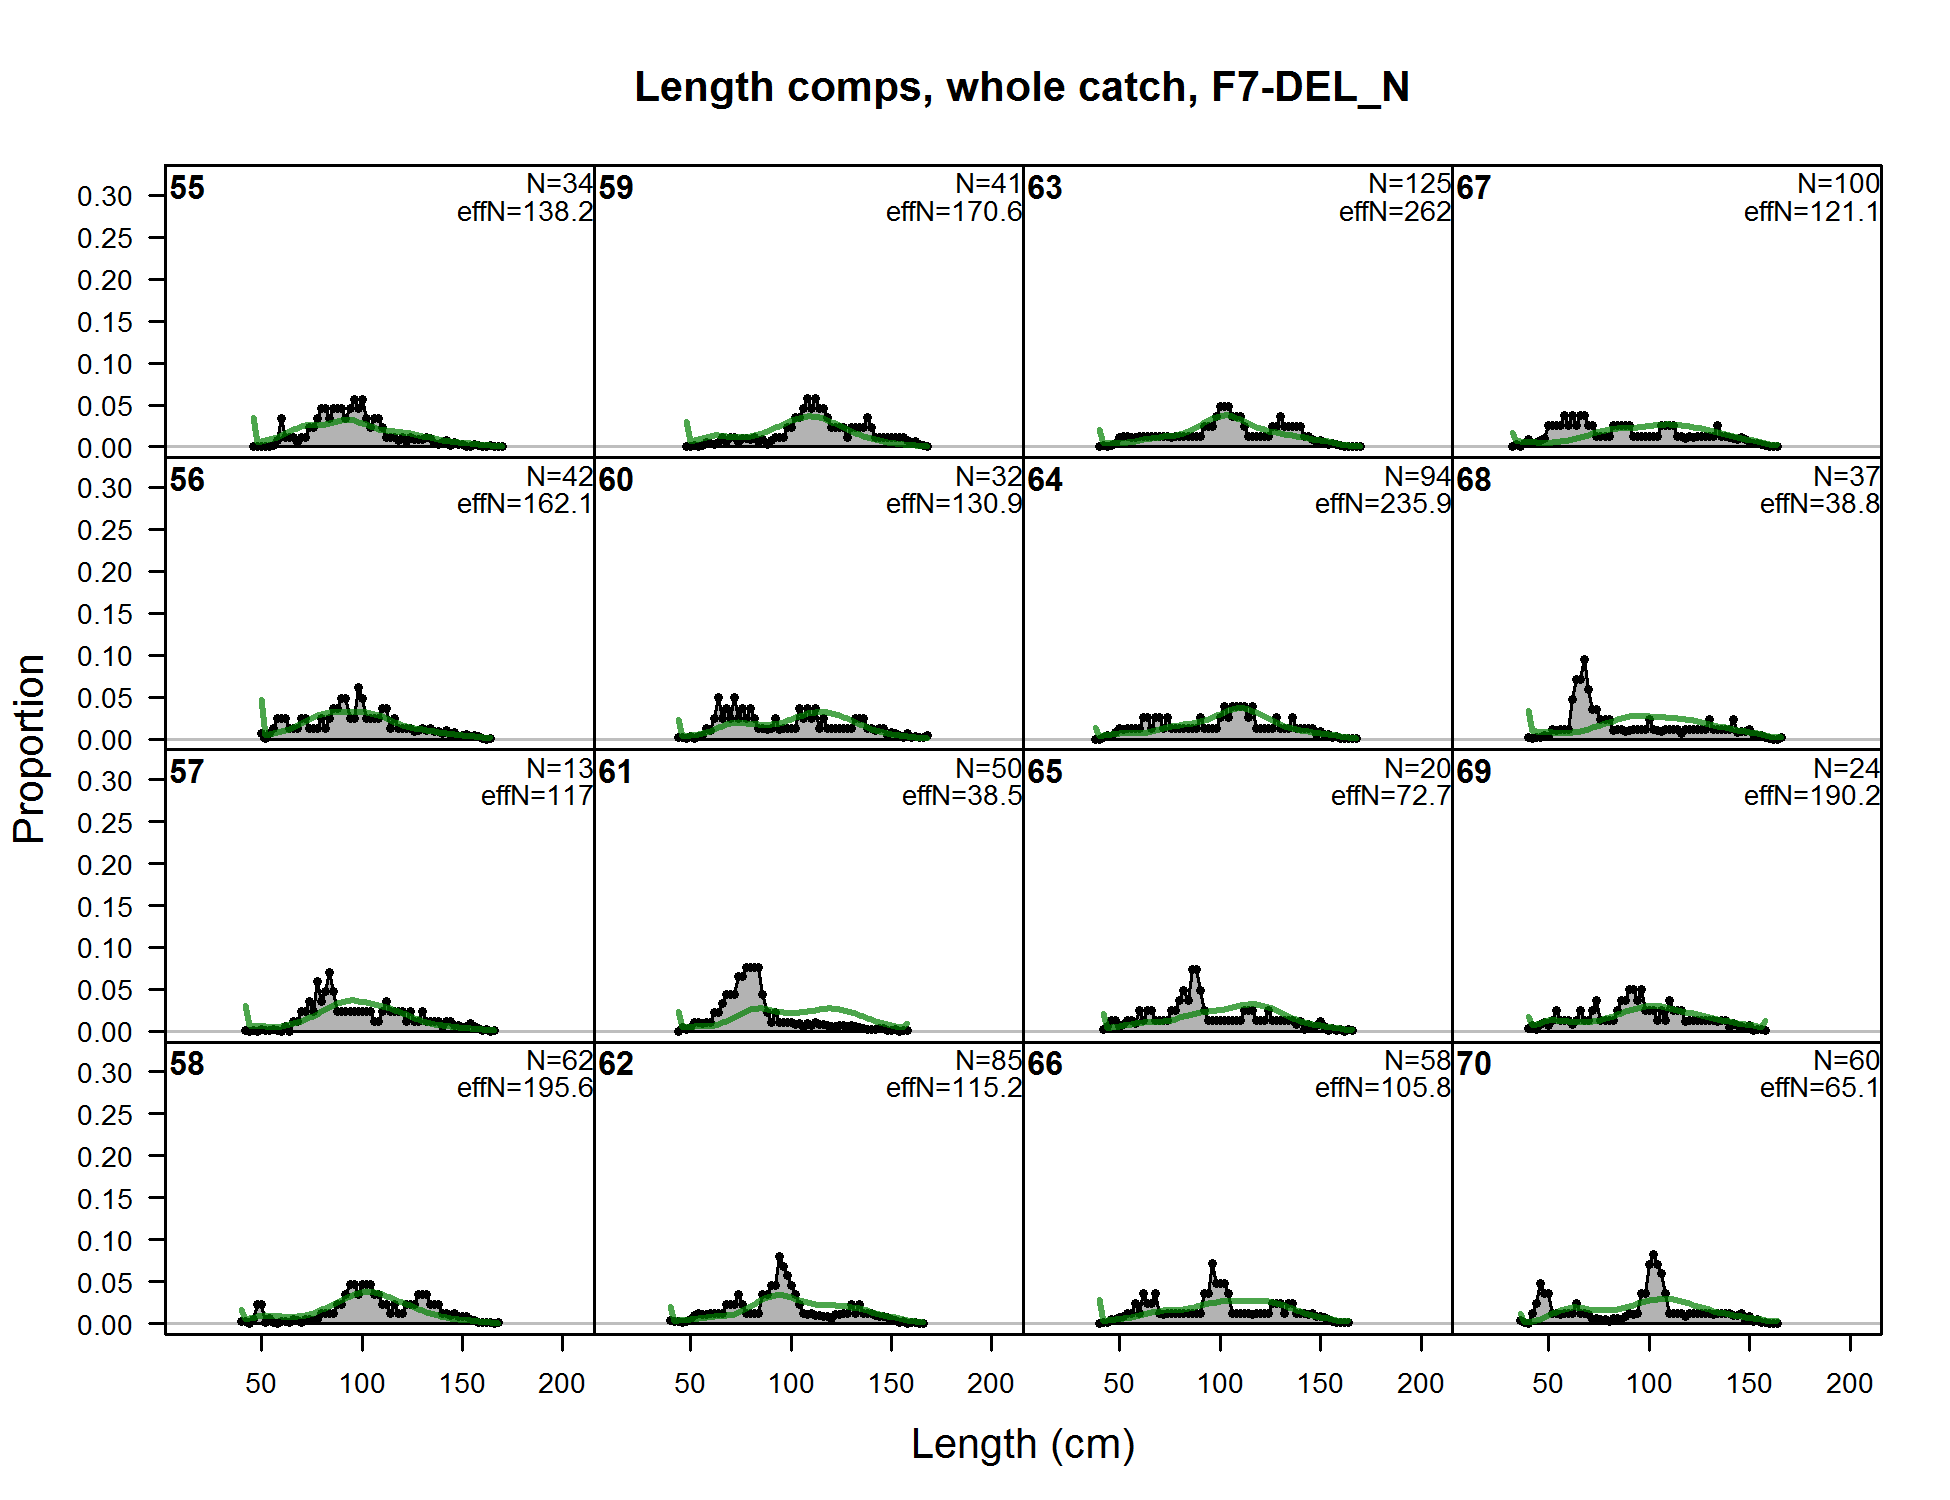
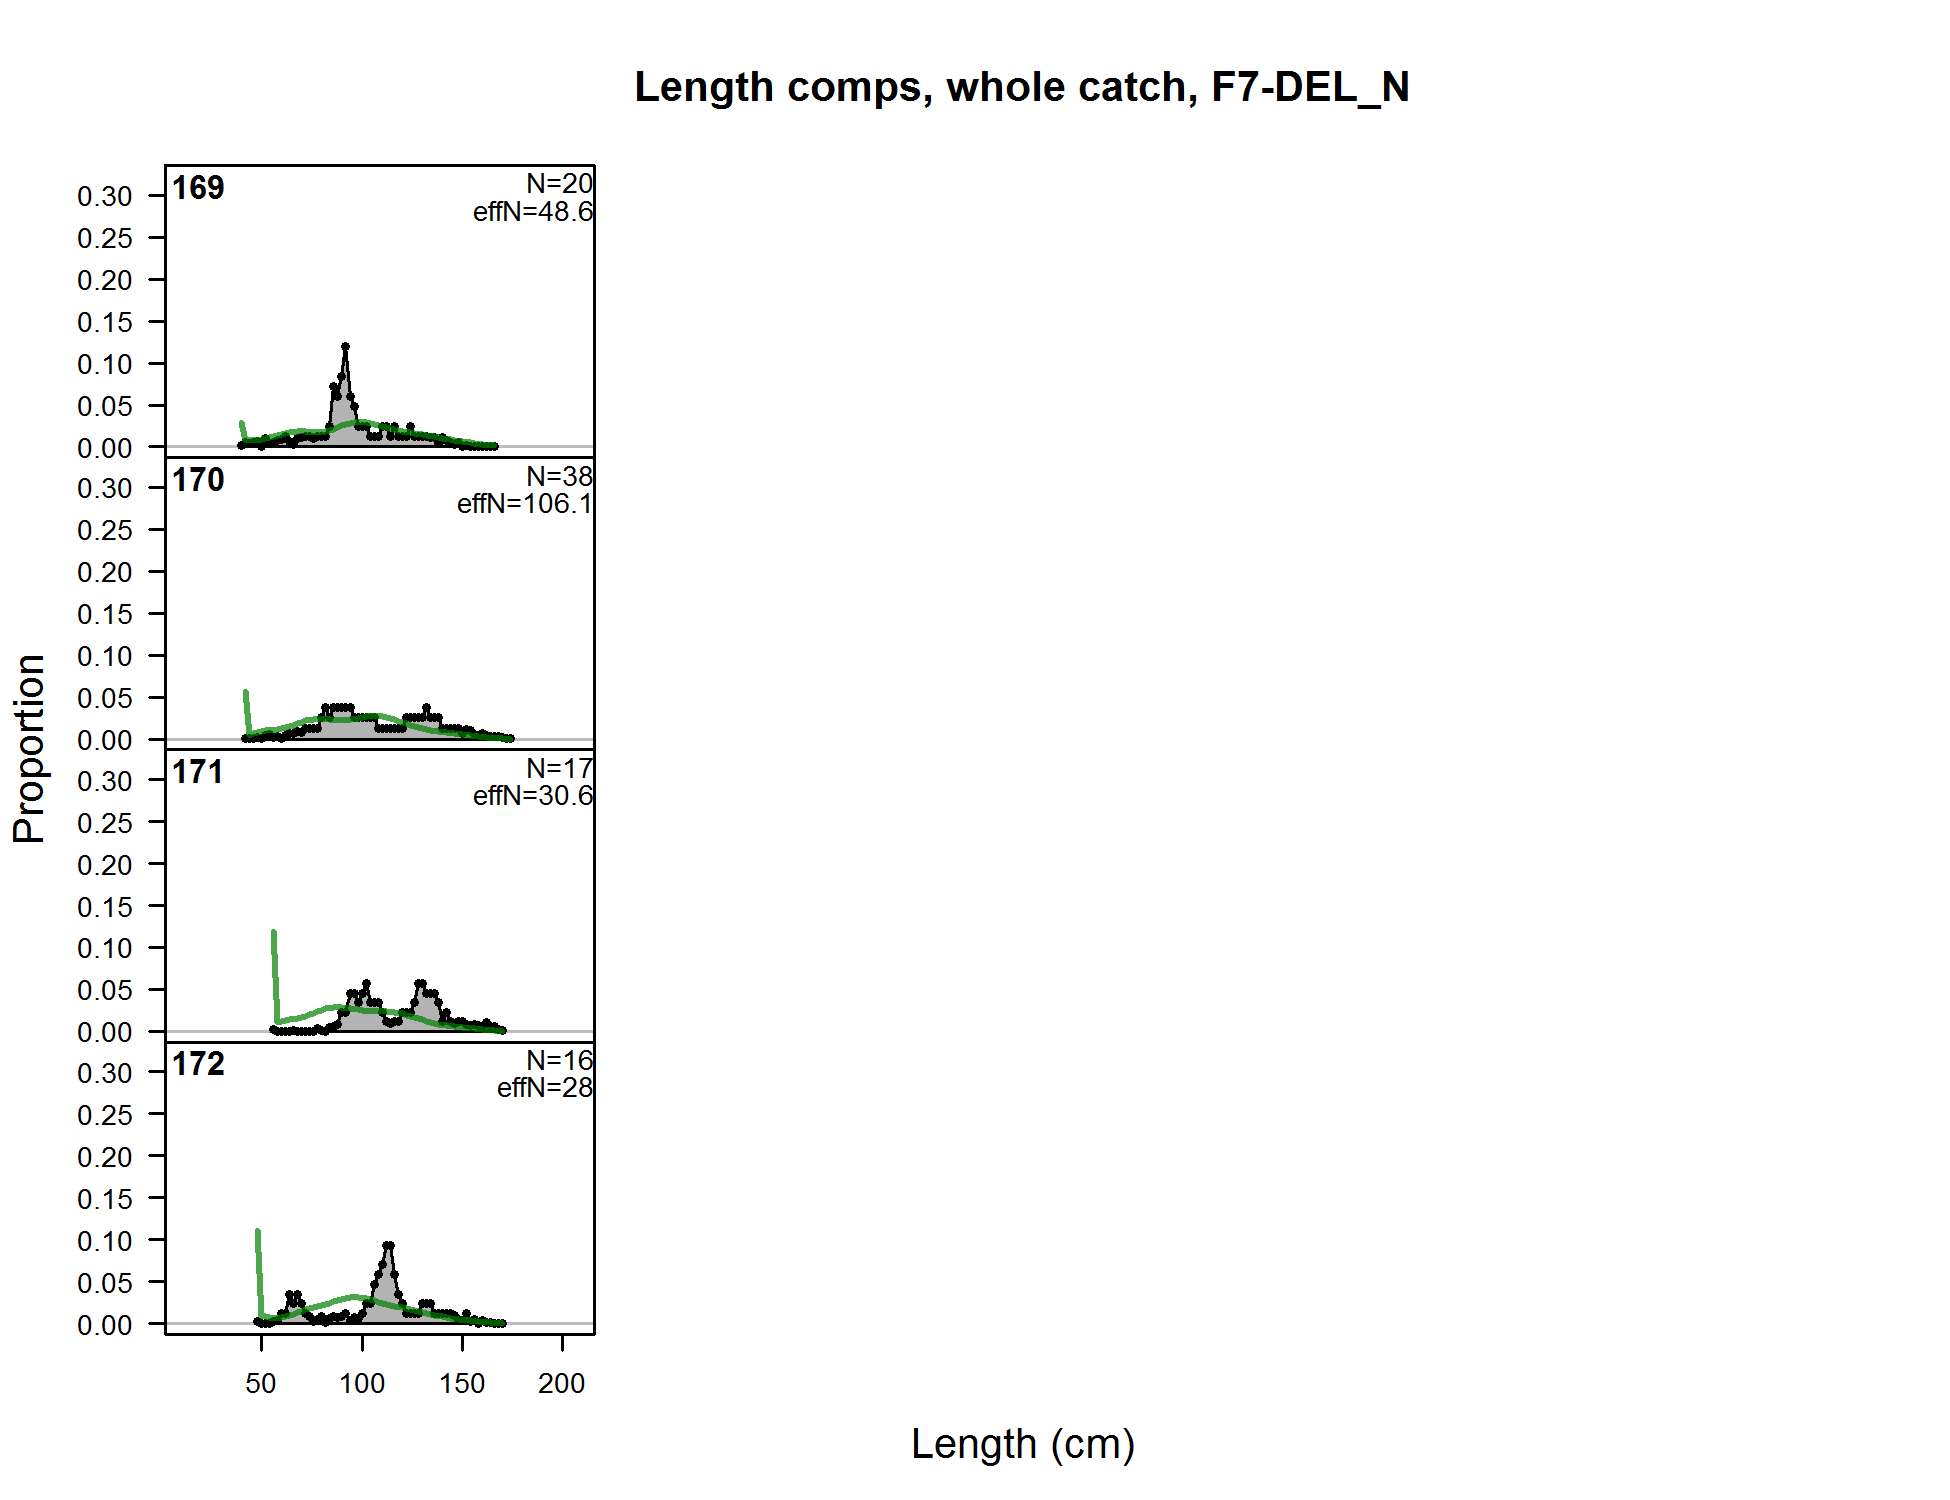
Length comps, whole catch, F7-DEL_N (plot 1 of 11) (plot 2 of 11)
file: comp_lenfit_flt7mkt0_page2.png
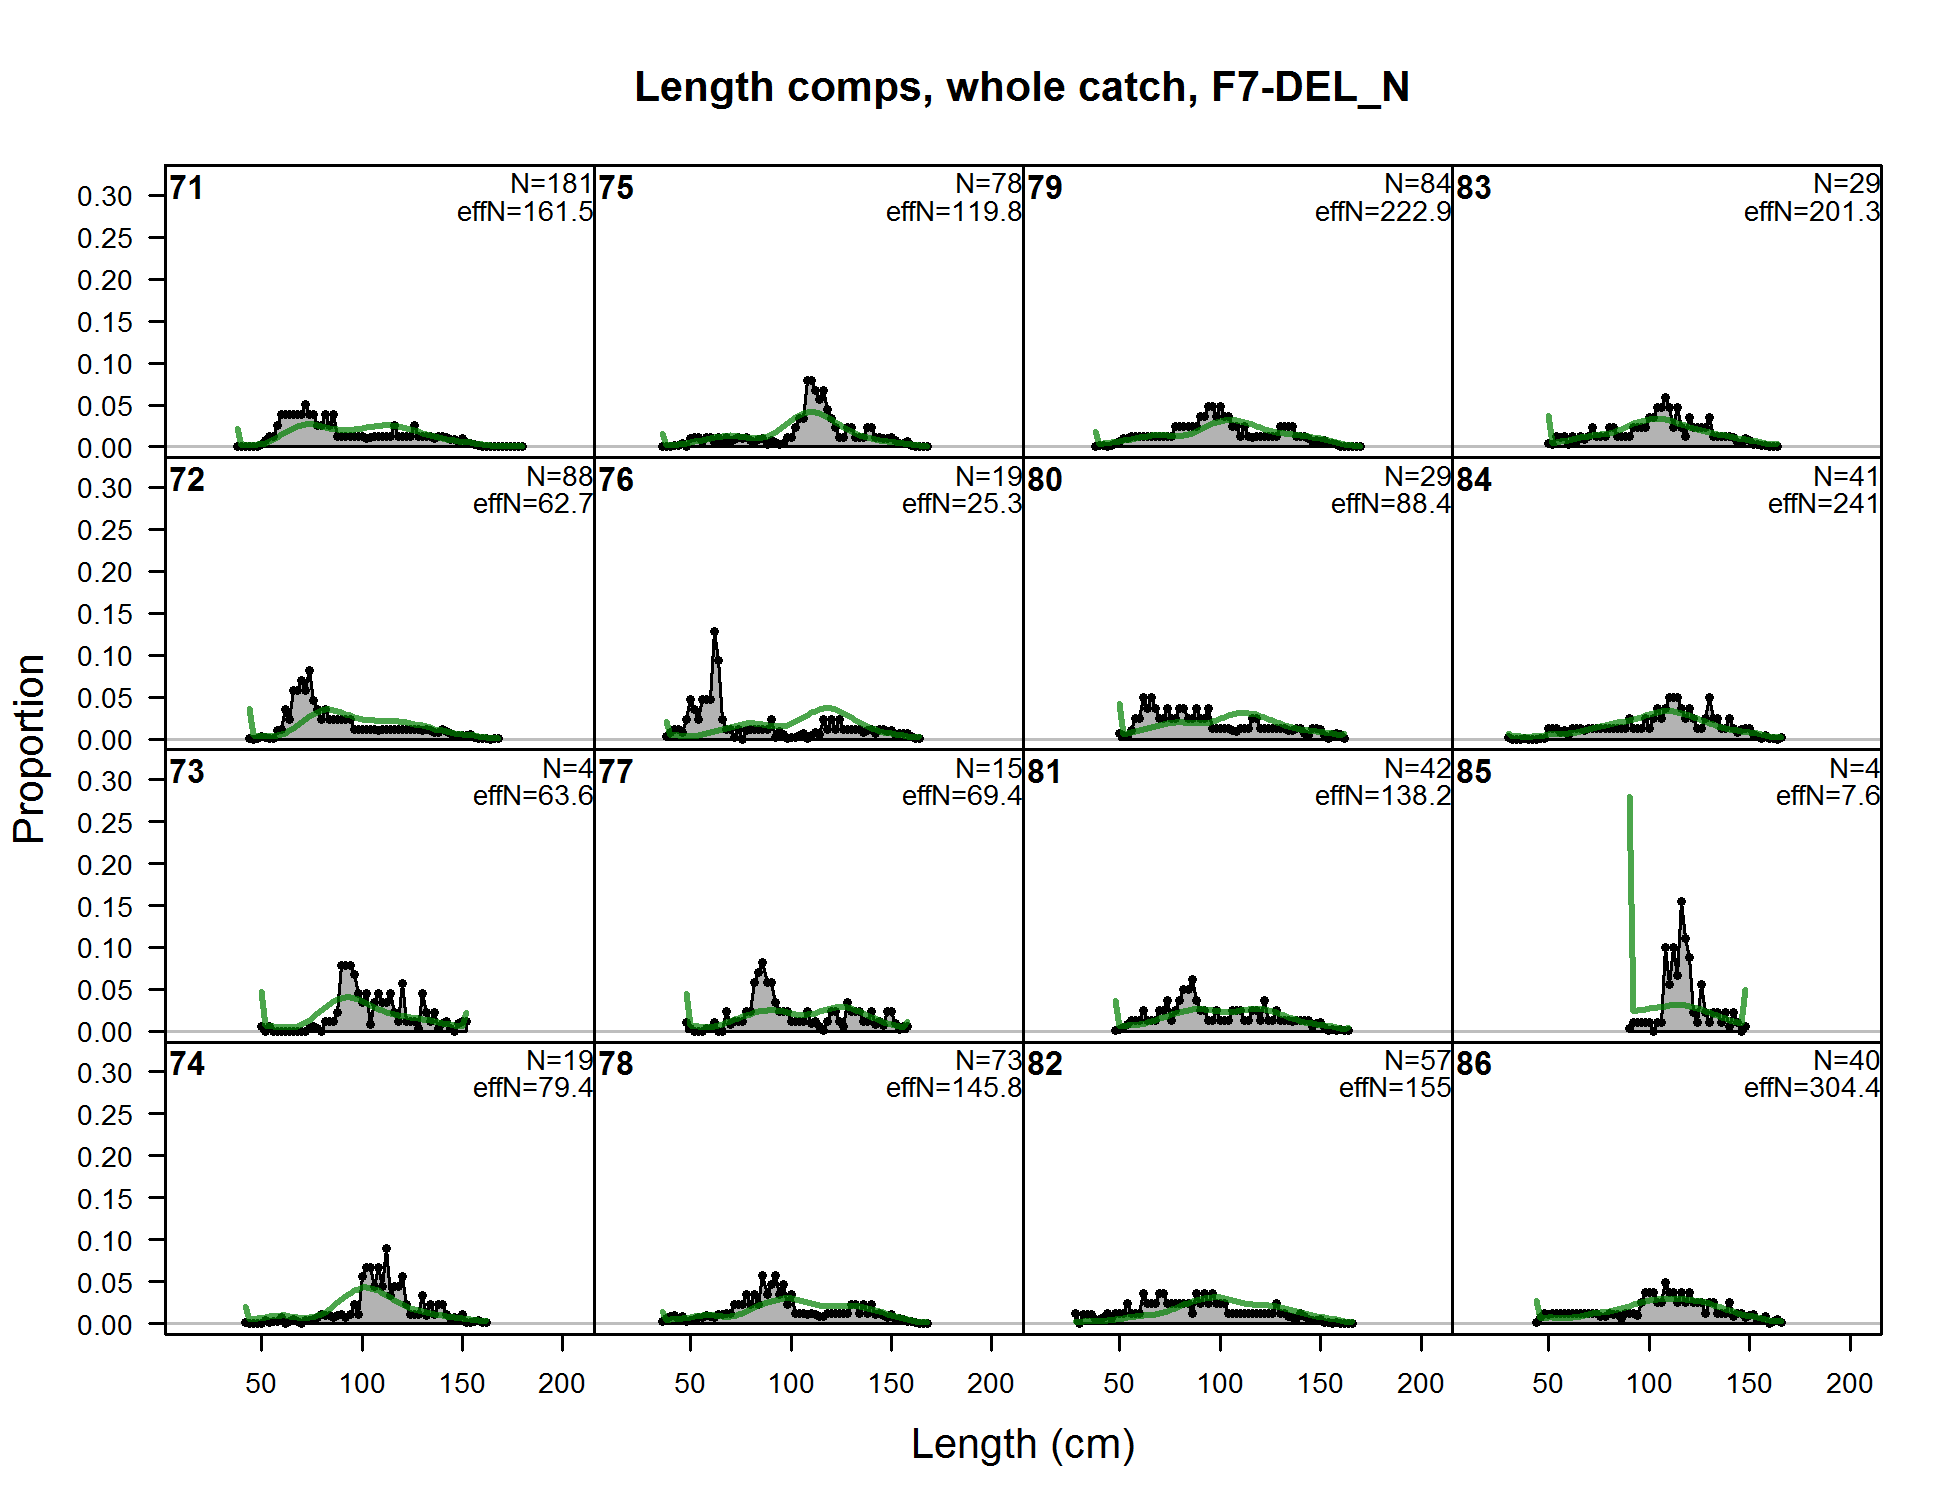
Length comps, whole catch, F7-DEL_N (plot 1 of 11) (plot 2 of 11) (plot 3 of 11)
file: comp_lenfit_flt7mkt0_page3.png
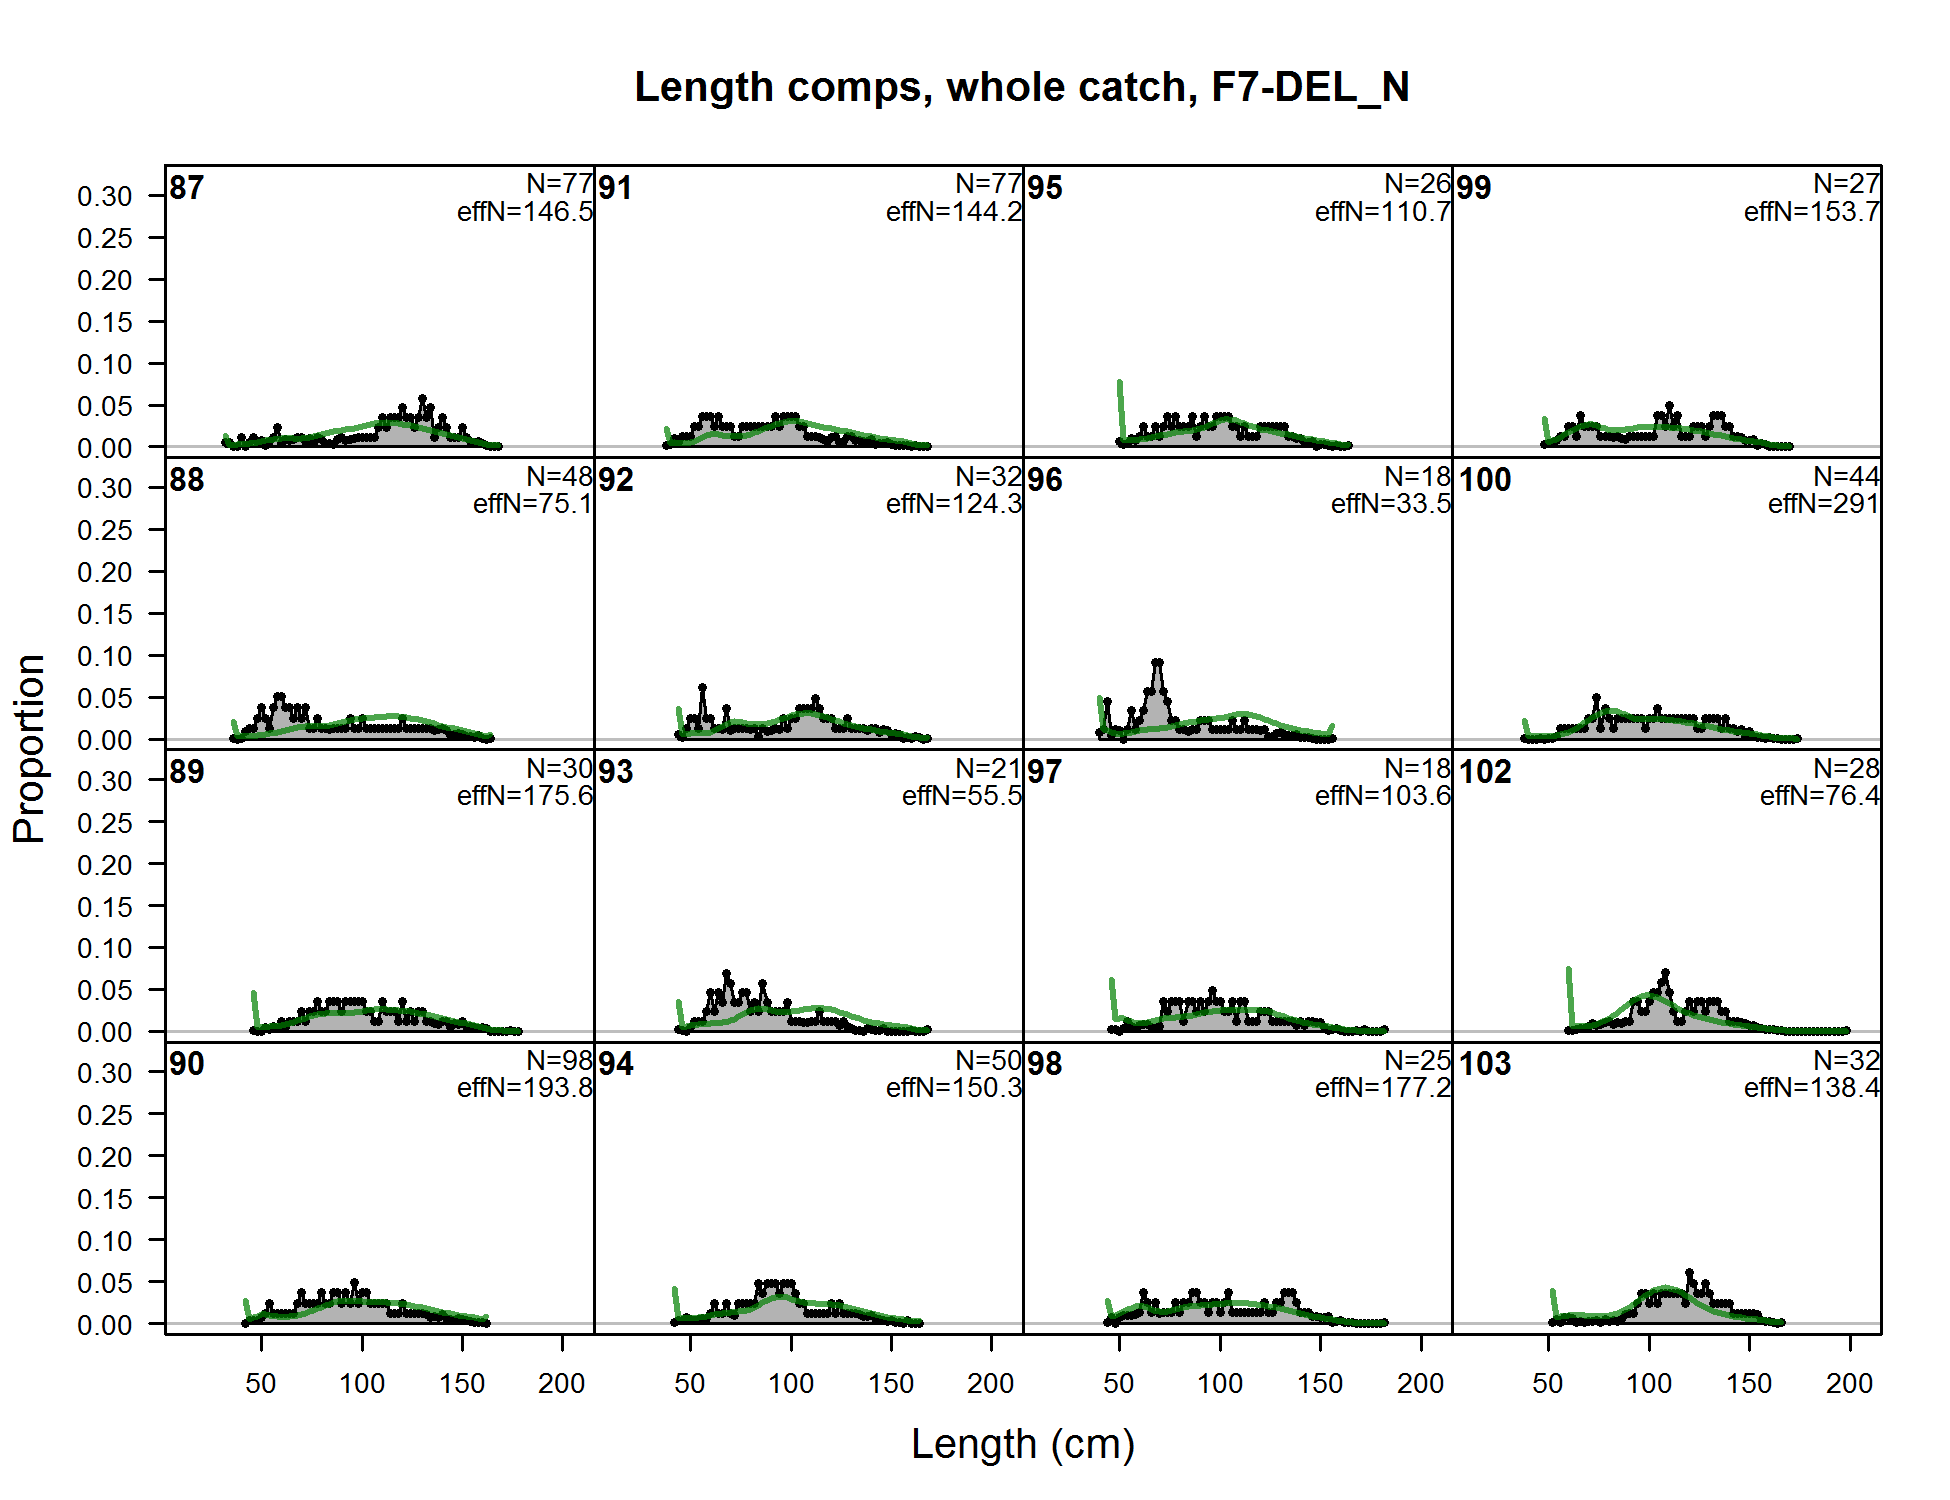
Length comps, whole catch, F7-DEL_N (plot 1 of 11) (plot 2 of 11) (plot 3 of 11) (plot 4 of 11)
file: comp_lenfit_flt7mkt0_page4.png
Length comps, whole catch, F7-DEL_N (plot 1 of 11) (plot 2 of 11) (plot 3 of 11) (plot 4 of 11) (plot 5 of 11)
file: comp_lenfit_flt7mkt0_page5.png
Length comps, whole catch, F7-DEL_N (plot 1 of 11) (plot 2 of 11) (plot 3 of 11) (plot 4 of 11) (plot 5 of 11) (plot 6 of 11)
file: comp_lenfit_flt7mkt0_page6.png
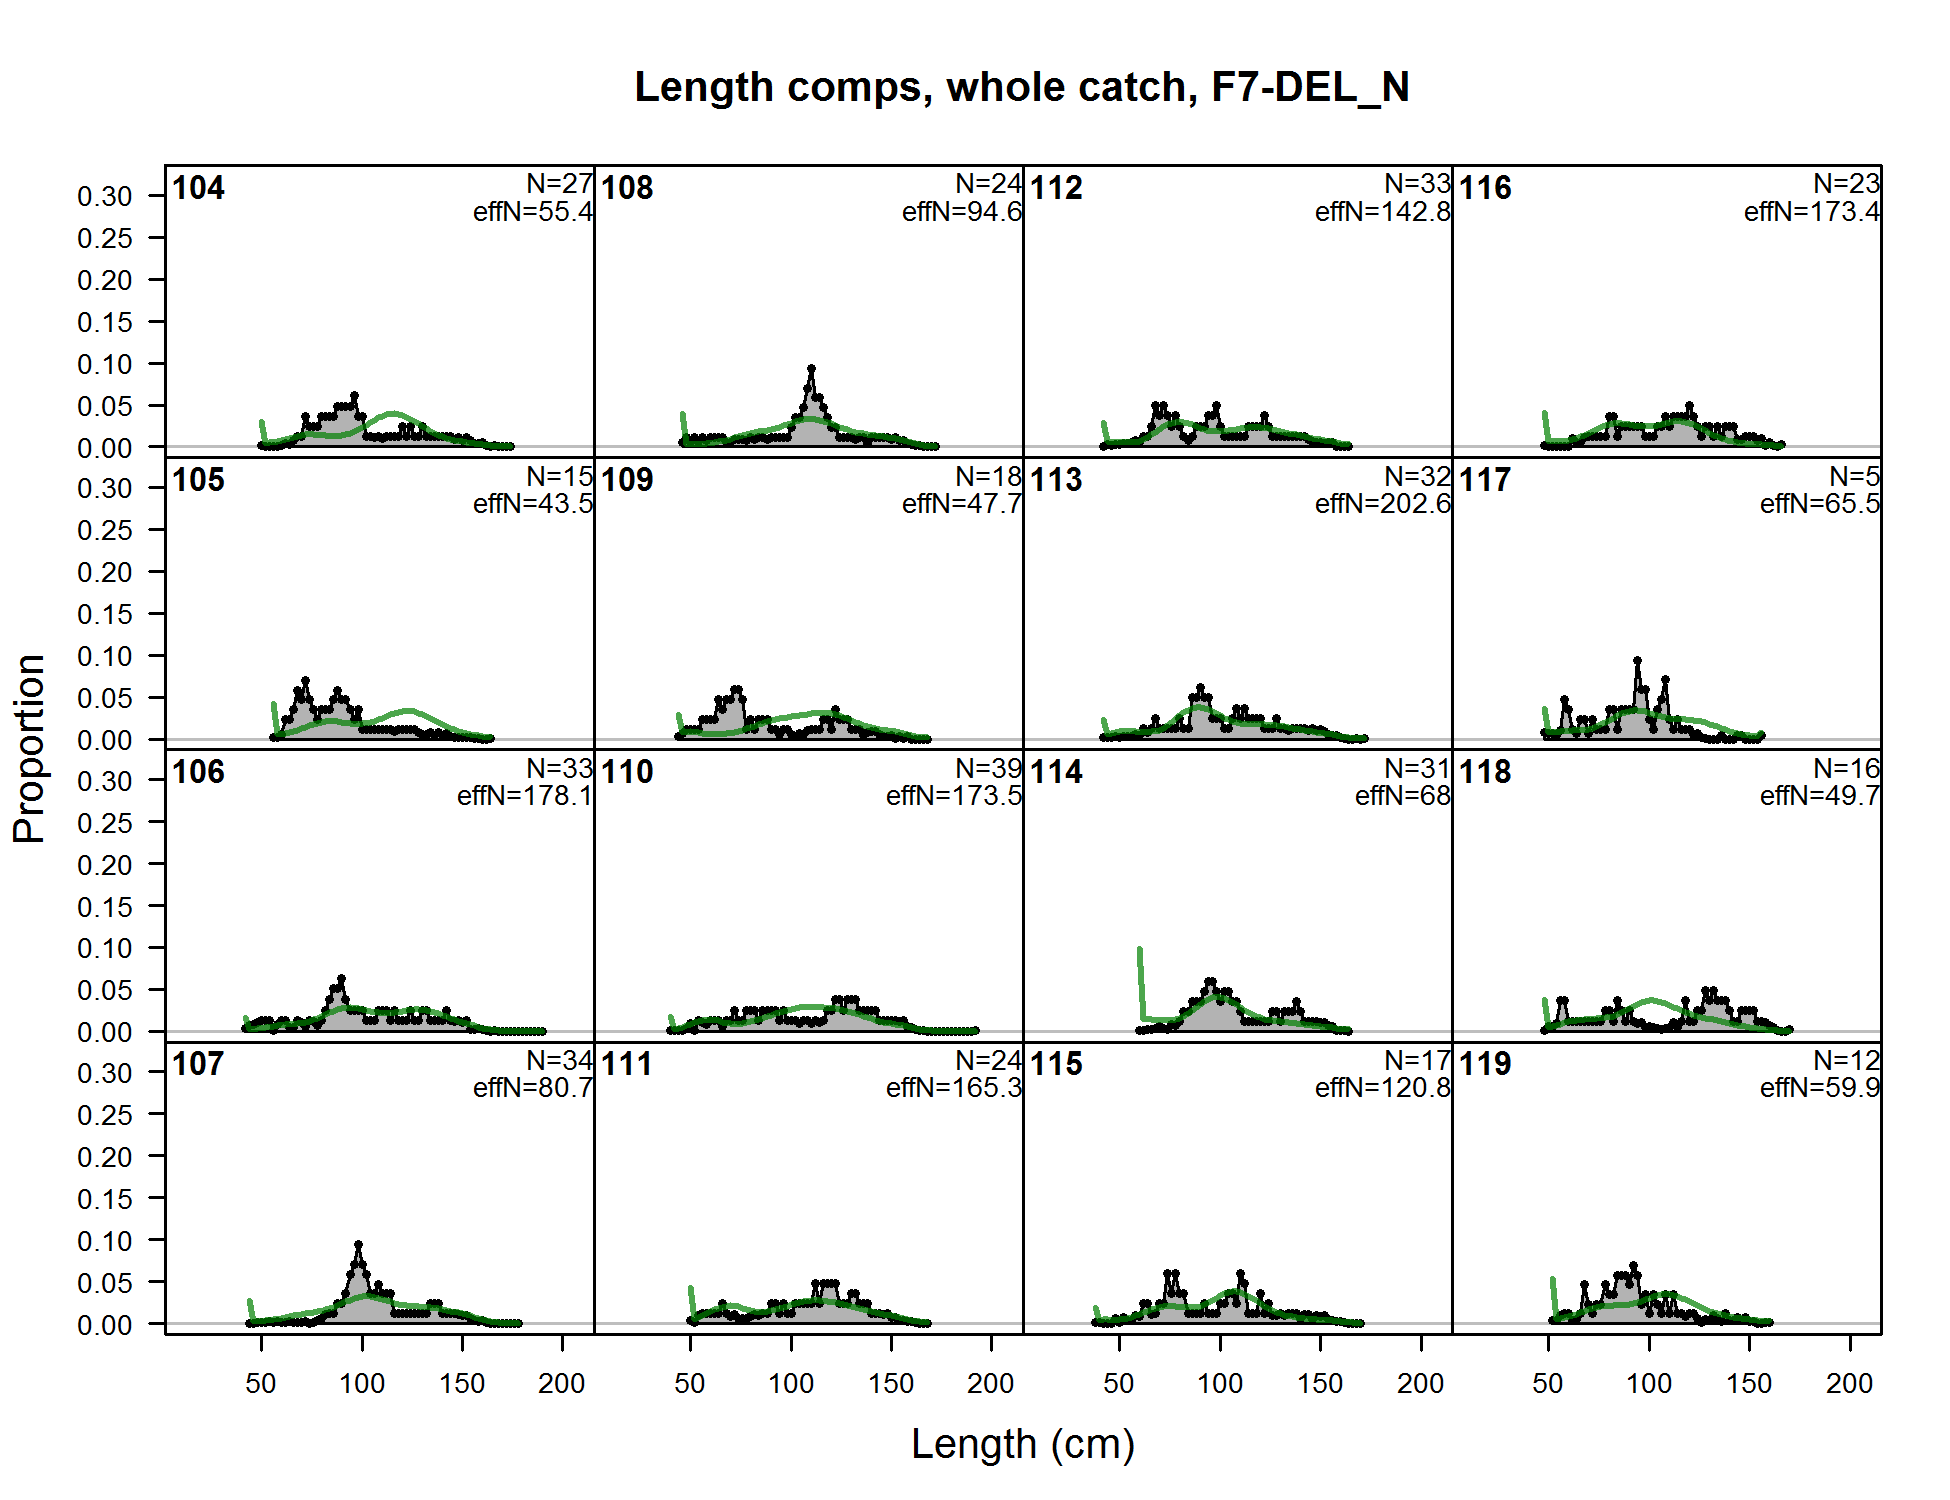
Length comps, whole catch, F7-DEL_N (plot 1 of 11) (plot 2 of 11) (plot 3 of 11) (plot 4 of 11) (plot 5 of 11) (plot 6 of 11) (plot 7 of 11)
file: comp_lenfit_flt7mkt0_page7.png
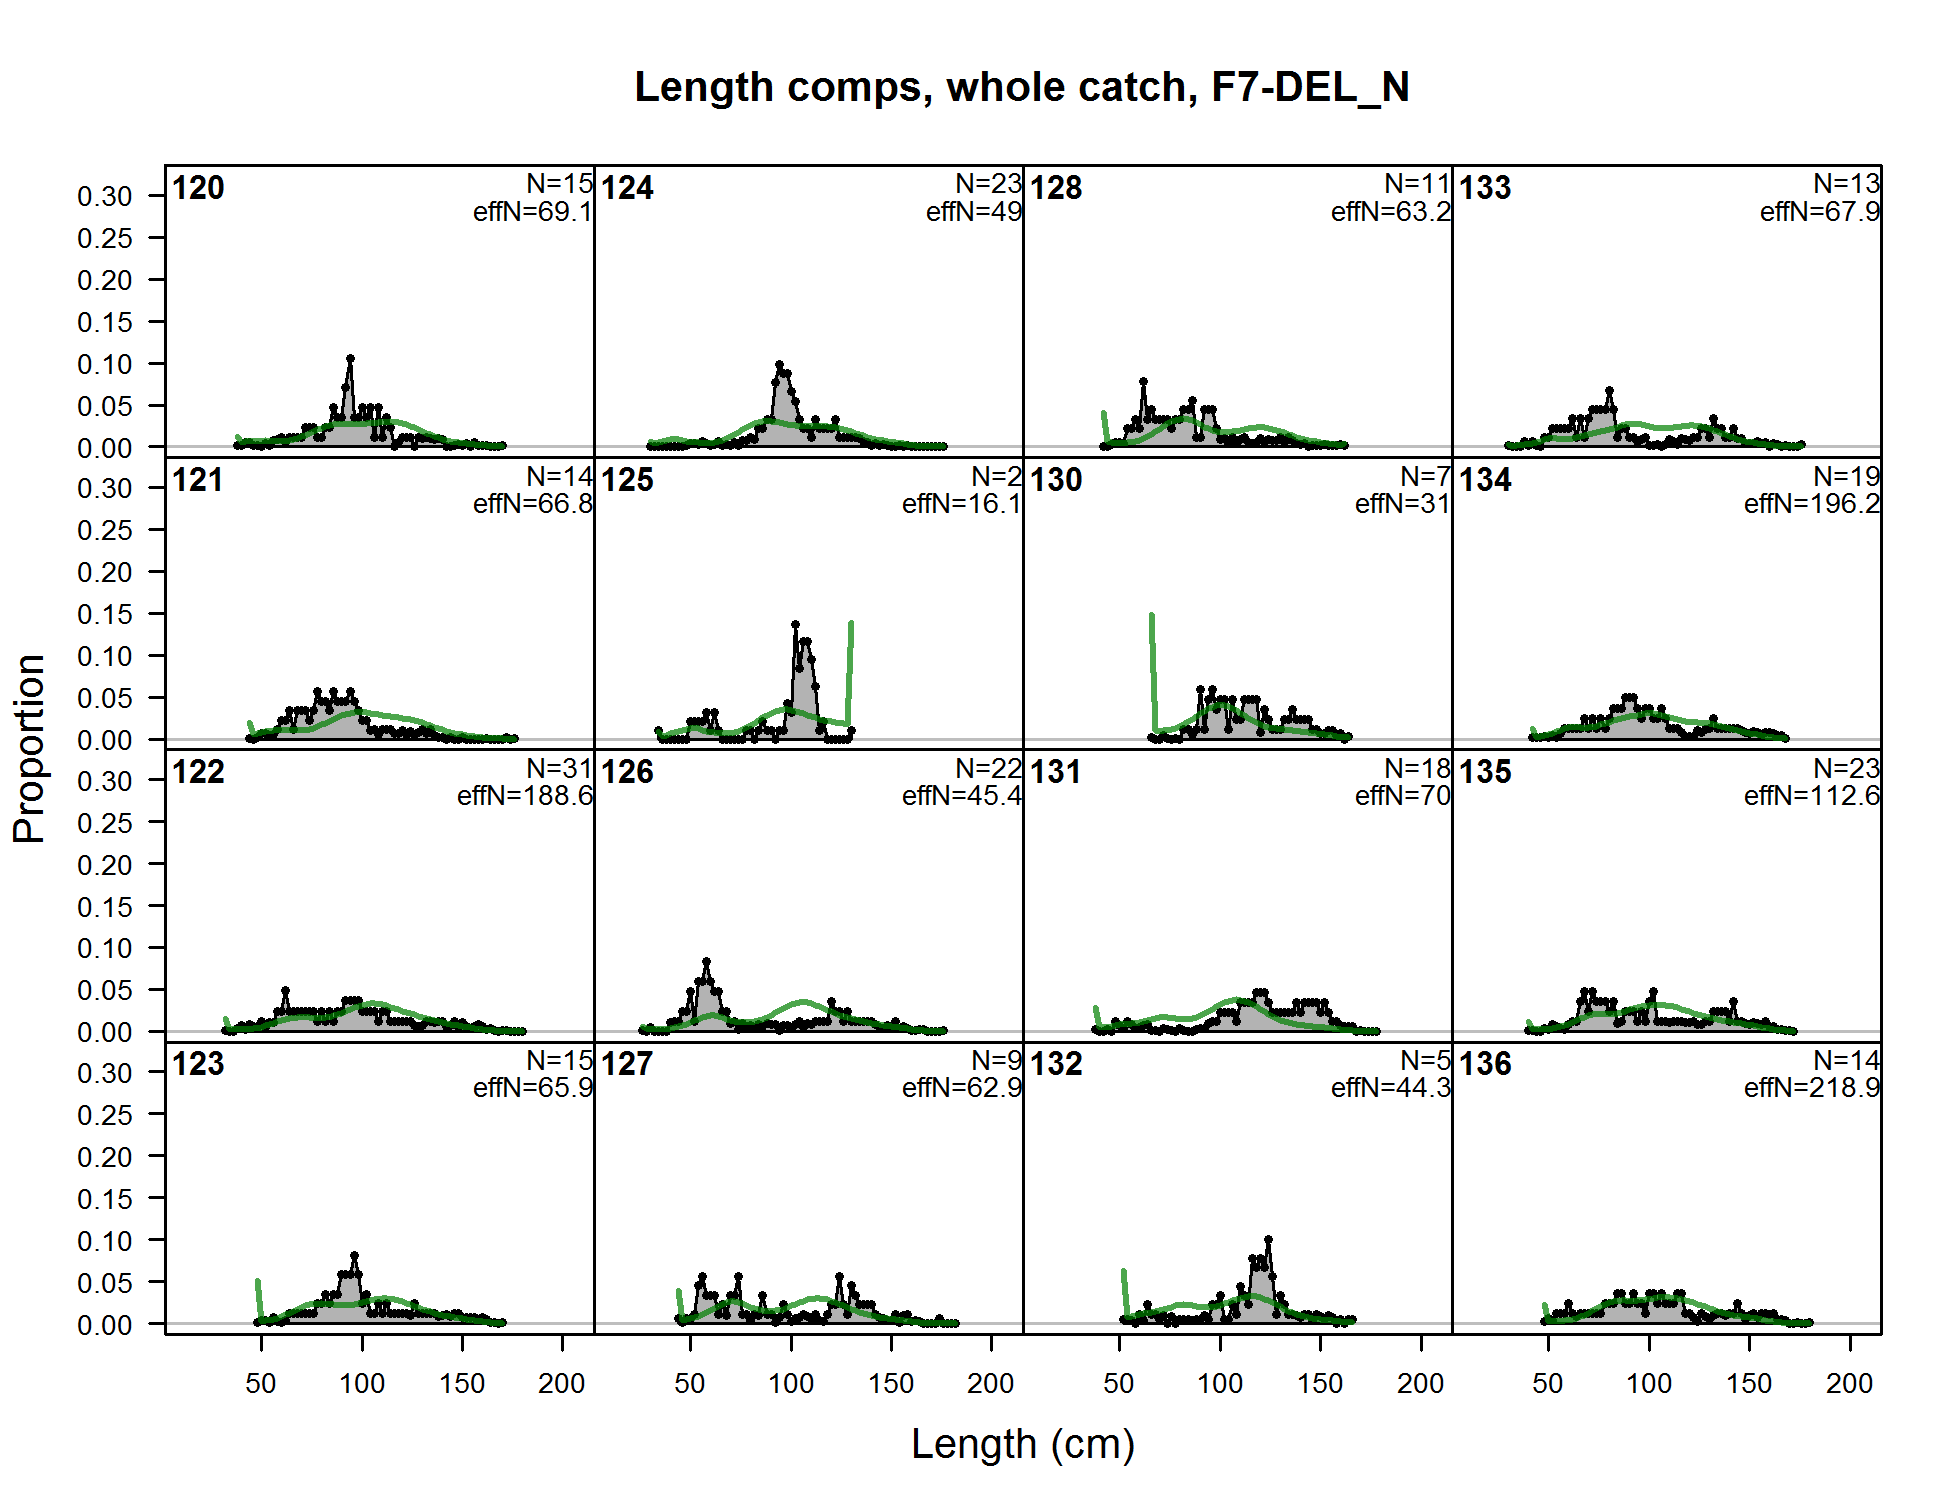
Length comps, whole catch, F7-DEL_N (plot 1 of 11) (plot 2 of 11) (plot 3 of 11) (plot 4 of 11) (plot 5 of 11) (plot 6 of 11) (plot 7 of 11) (plot 8 of 11)
file: comp_lenfit_flt7mkt0_page8.png
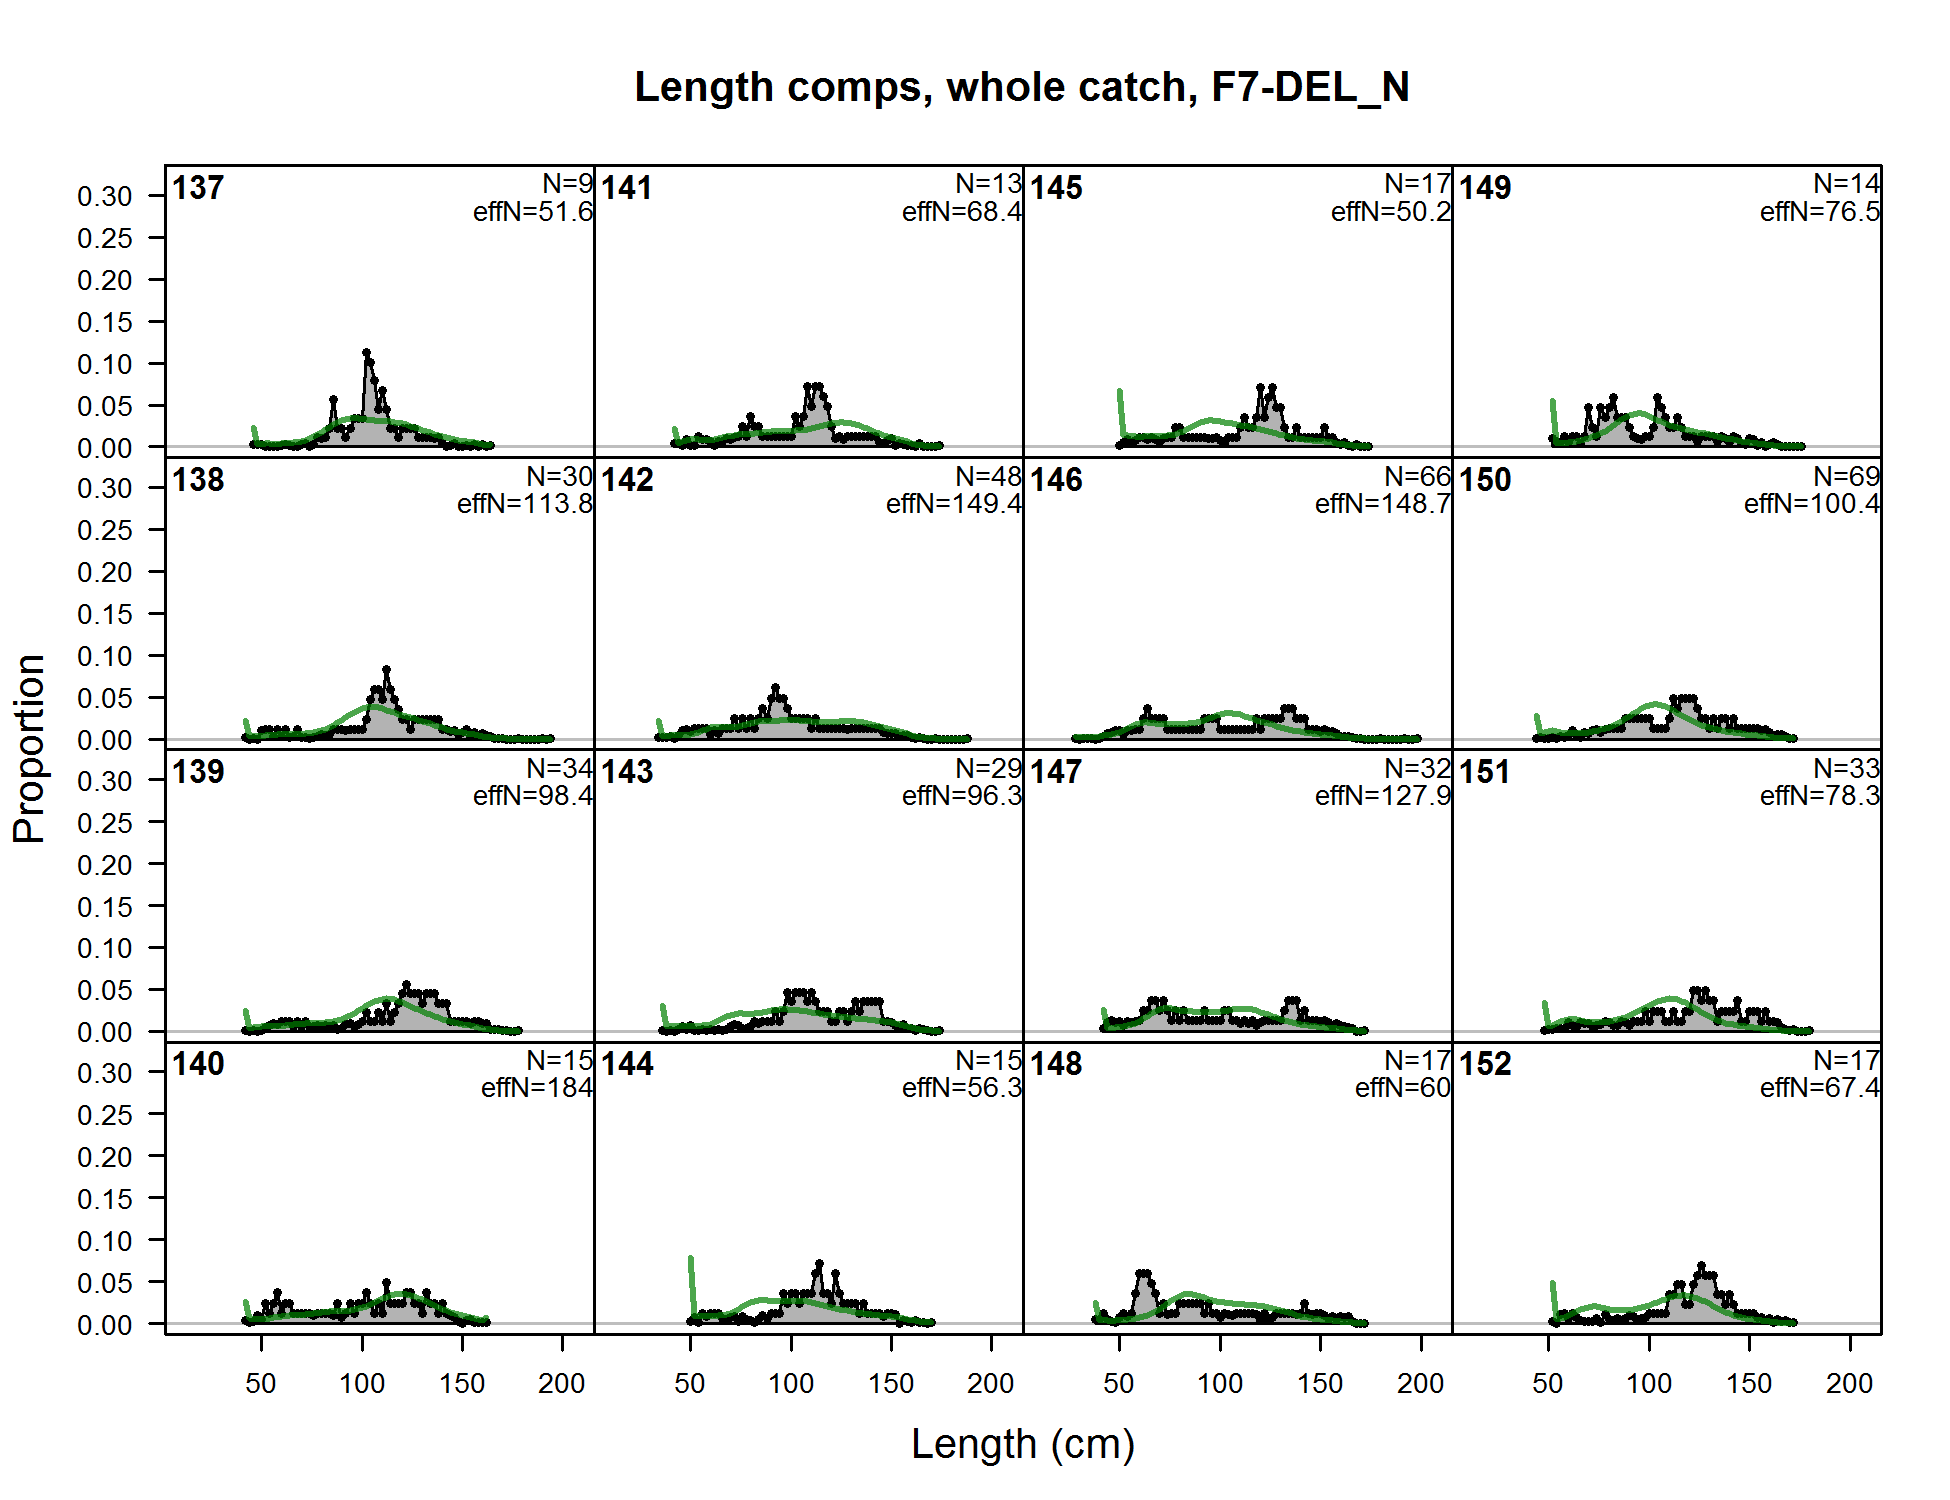
Length comps, whole catch, F7-DEL_N (plot 1 of 11) (plot 2 of 11) (plot 3 of 11) (plot 4 of 11) (plot 5 of 11) (plot 6 of 11) (plot 7 of 11) (plot 8 of 11) (plot 9 of 11)
file: comp_lenfit_flt7mkt0_page9.png
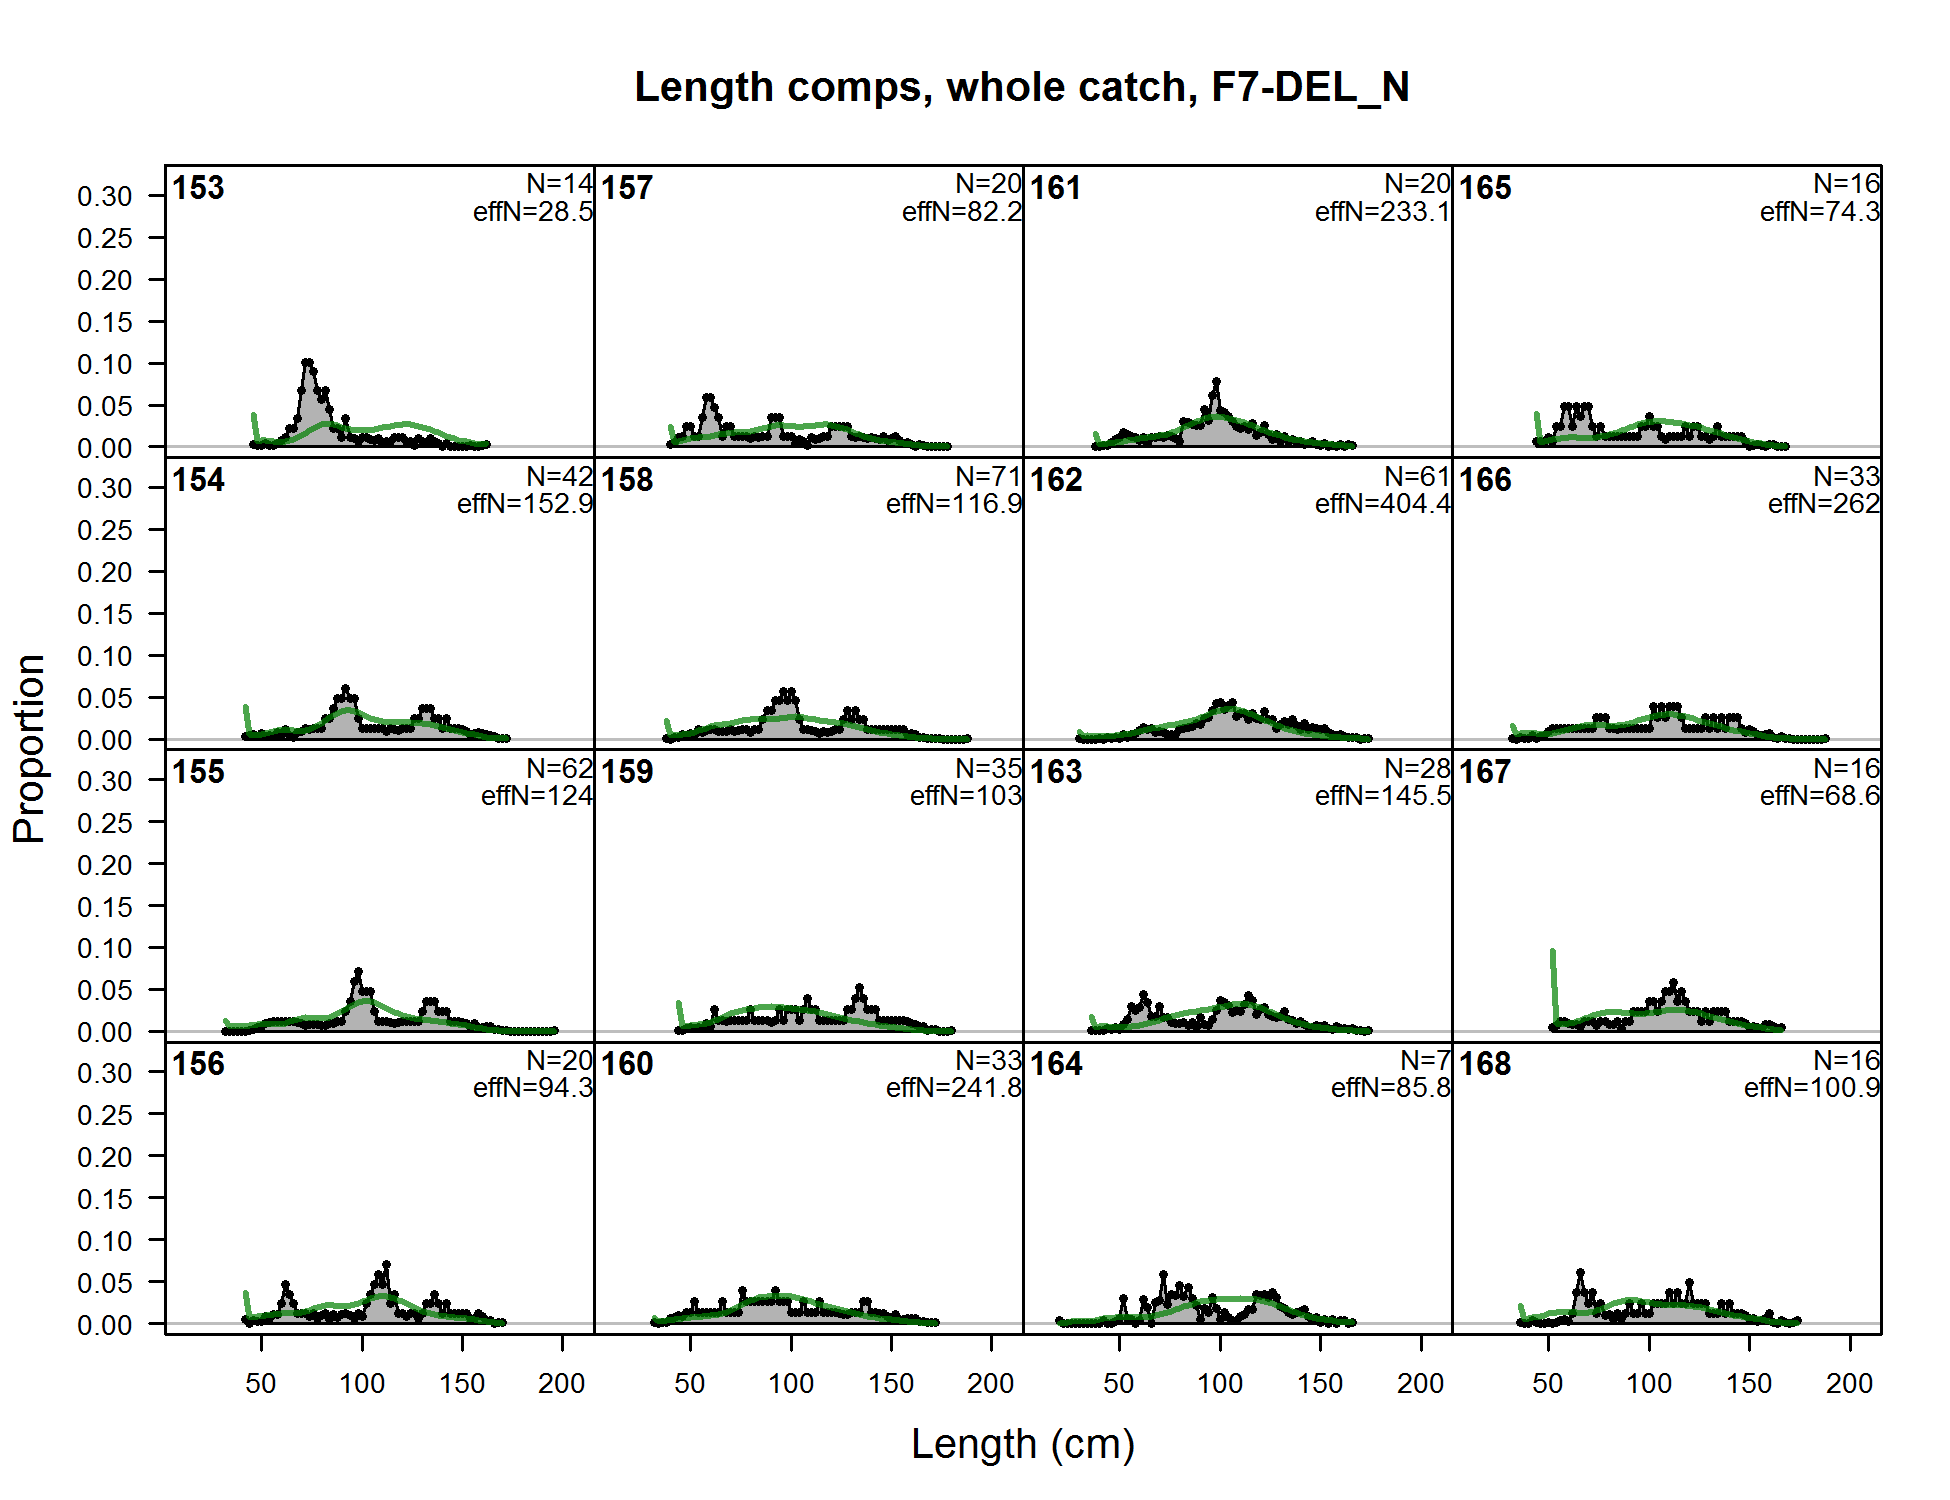
Length comps, whole catch, F7-DEL_N (plot 1 of 11) (plot 2 of 11) (plot 3 of 11) (plot 4 of 11) (plot 5 of 11) (plot 6 of 11) (plot 7 of 11) (plot 8 of 11) (plot 9 of 11) (plot 10 of 11)
file: comp_lenfit_flt7mkt0_page10.png
Length comps, whole catch, F7-DEL_N (plot 1 of 11) (plot 2 of 11) (plot 3 of 11) (plot 4 of 11) (plot 5 of 11) (plot 6 of 11) (plot 7 of 11) (plot 8 of 11) (plot 9 of 11) (plot 10 of 11) (plot 11 of 11)
file: comp_lenfit_flt7mkt0_page11.png
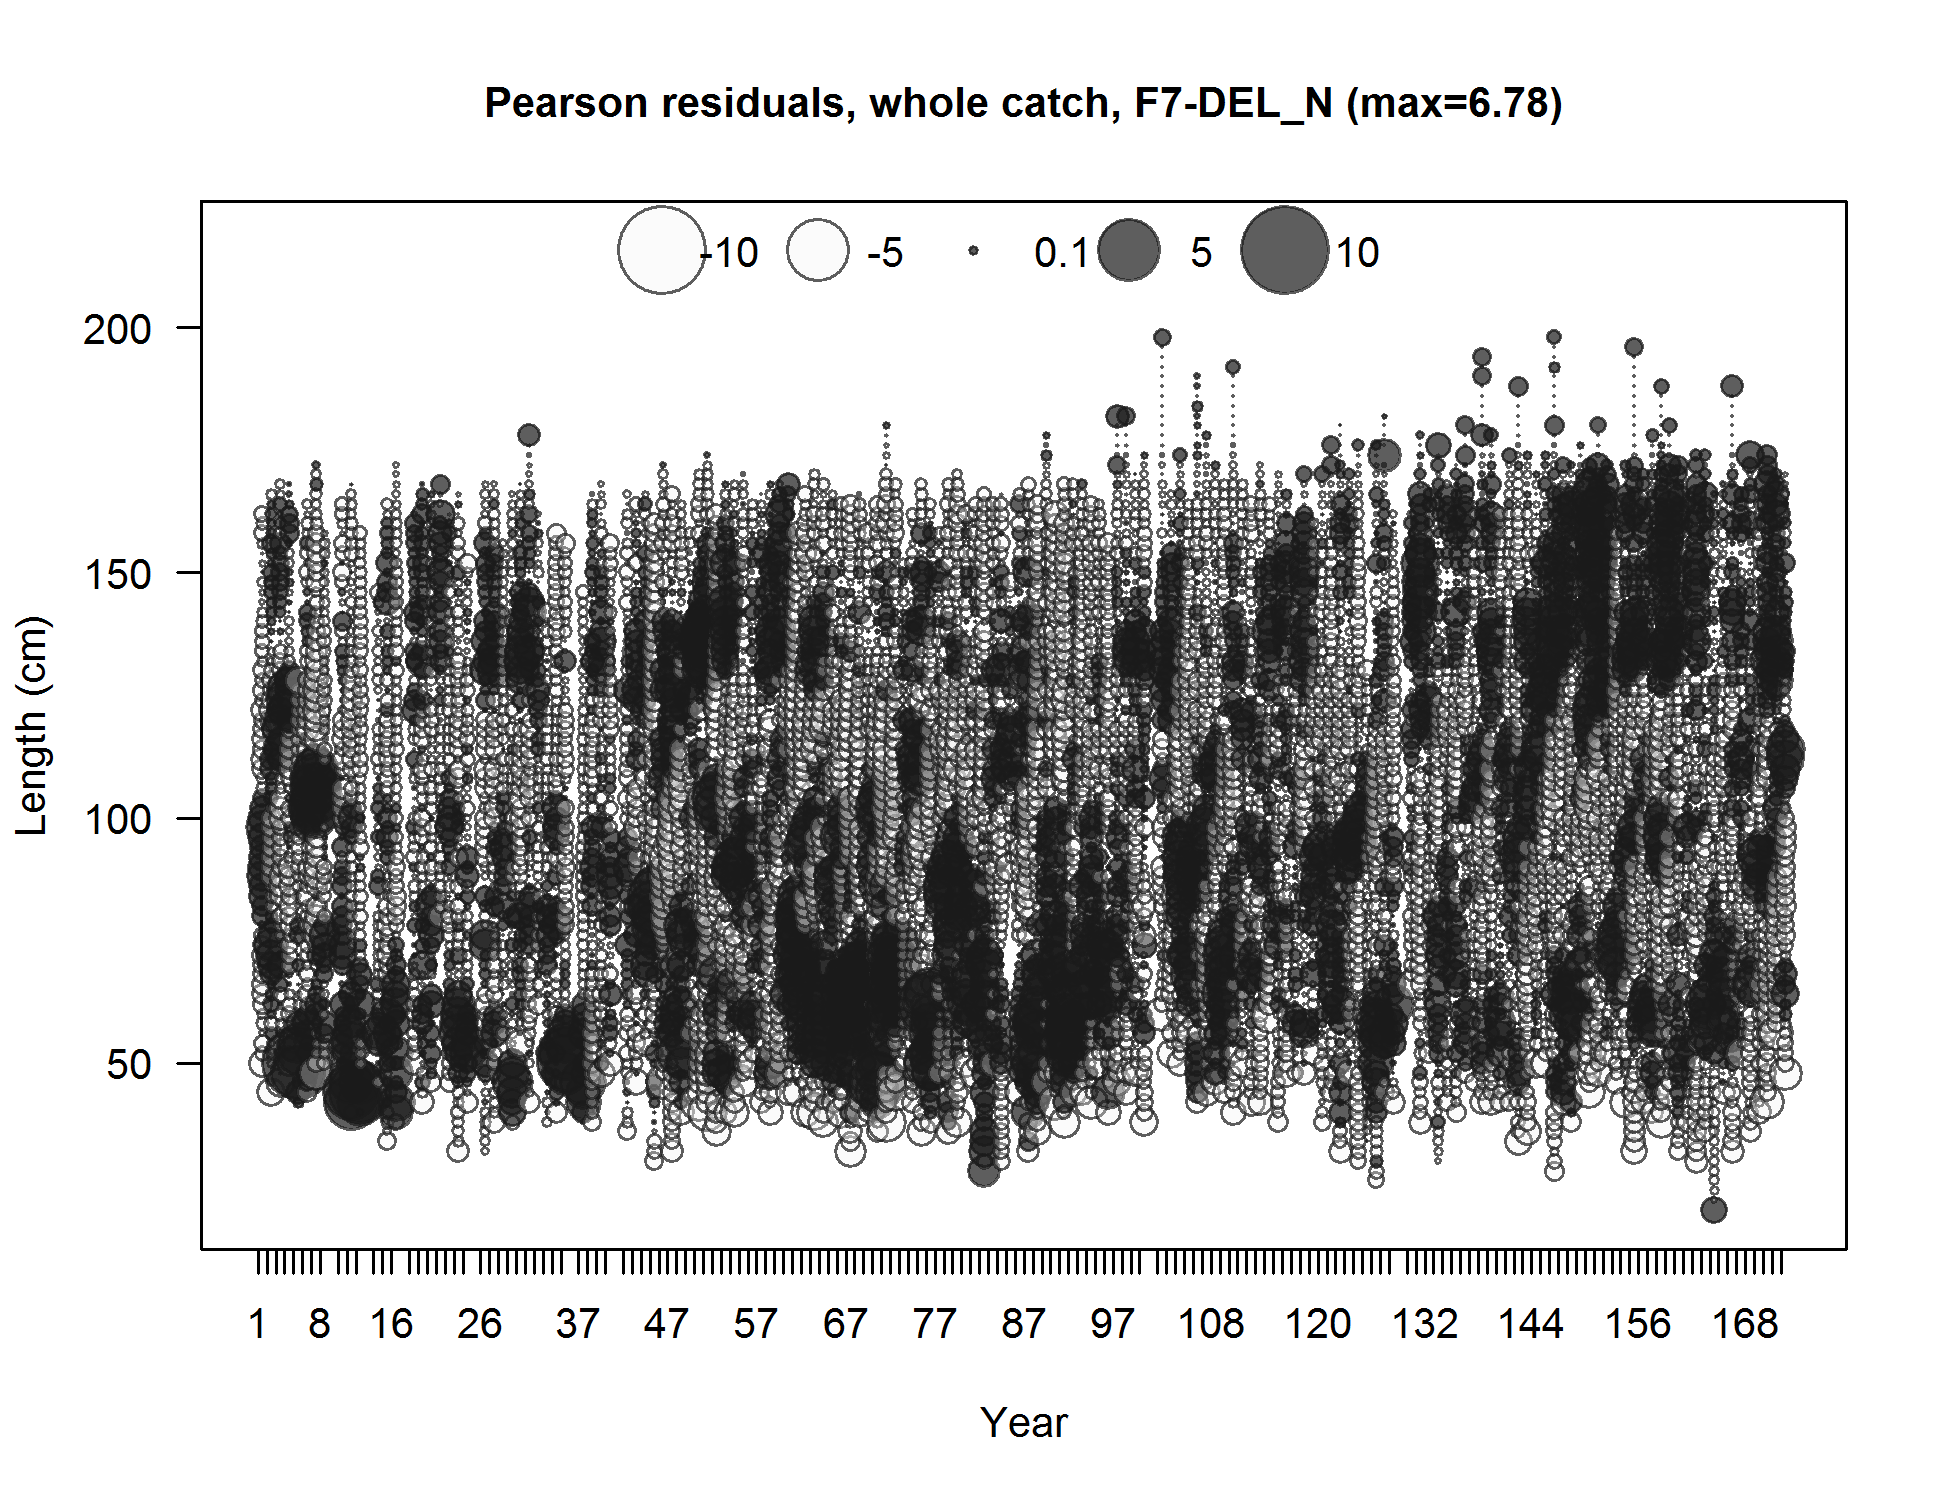
Pearson residuals, whole catch, F7-DEL_N (max=6.78) (plot 11 of 11)
Closed bubbles are positive residuals (observed > expected) and open bubbles are negative residuals (observed < expected).
file: comp_lenfit_residsflt7mkt0_page11.png
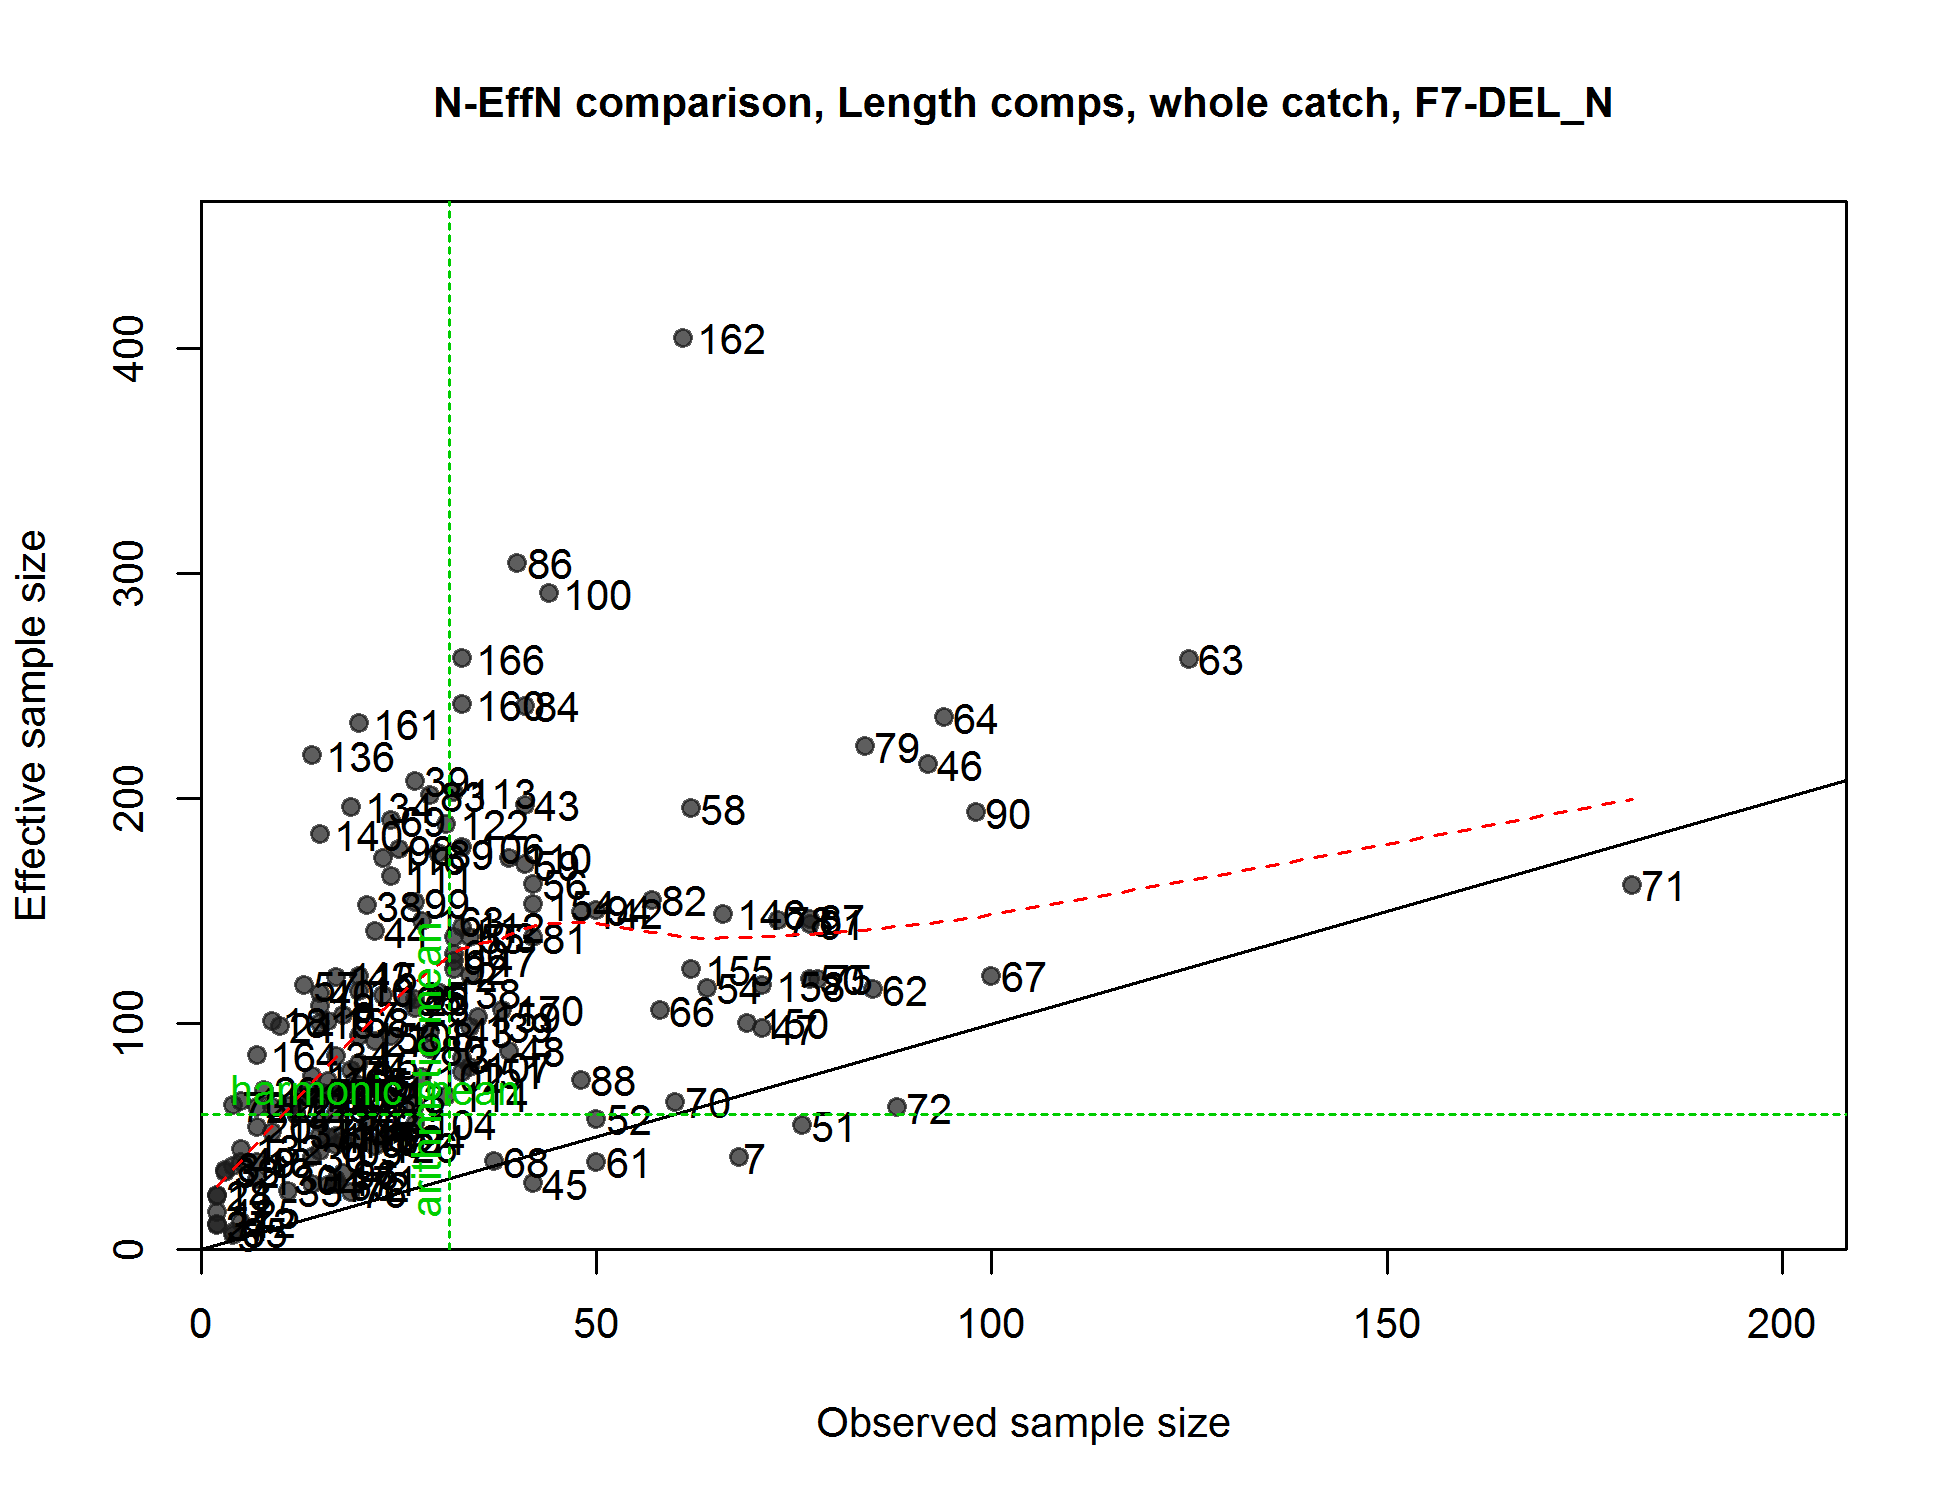
N-EffN comparison, Length comps, whole catch, F7-DEL_N
file: comp_lenfit_sampsize_flt7mkt0.png
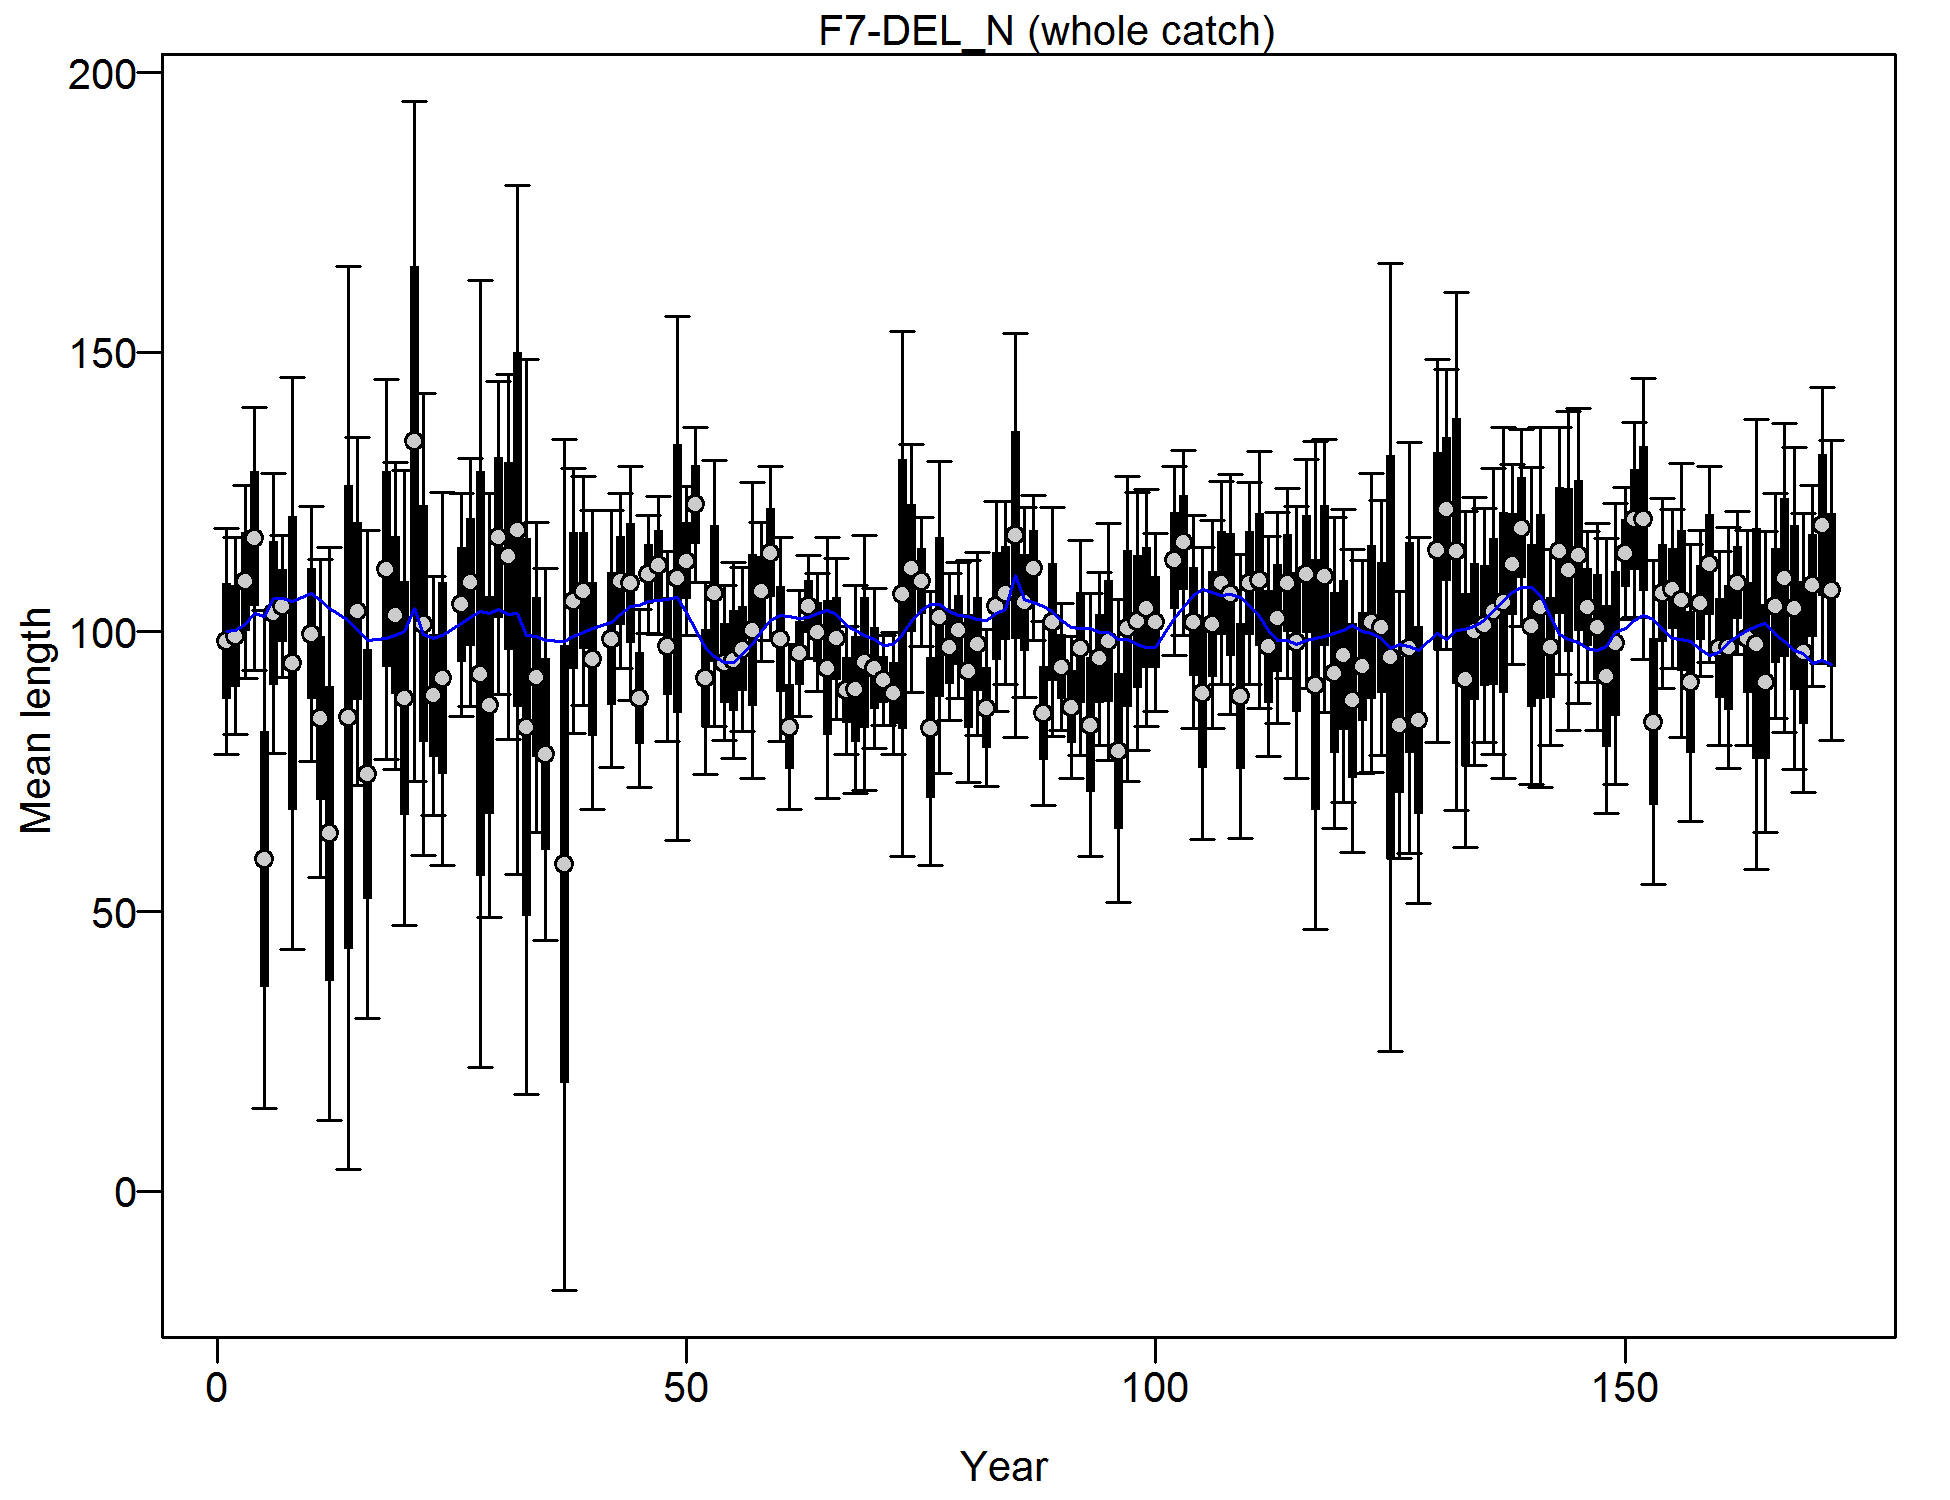
Mean length for F7-DEL_N with 95% confidence intervals based on current samples sizes.
Francis data weighting method TA1.8: thinner intervals (with capped ends) show result of further adjusting sample sizes based on suggested multiplier (with 95% interval) for len data from F7-DEL_N:
0.2644 (0.2146-0.3398)
For more info, see
Francis, R.I.C.C. (2011). Data weighting in statistical fisheries stock assessment models. Can. J. Fish. Aquat. Sci. 68: 1124-1138.
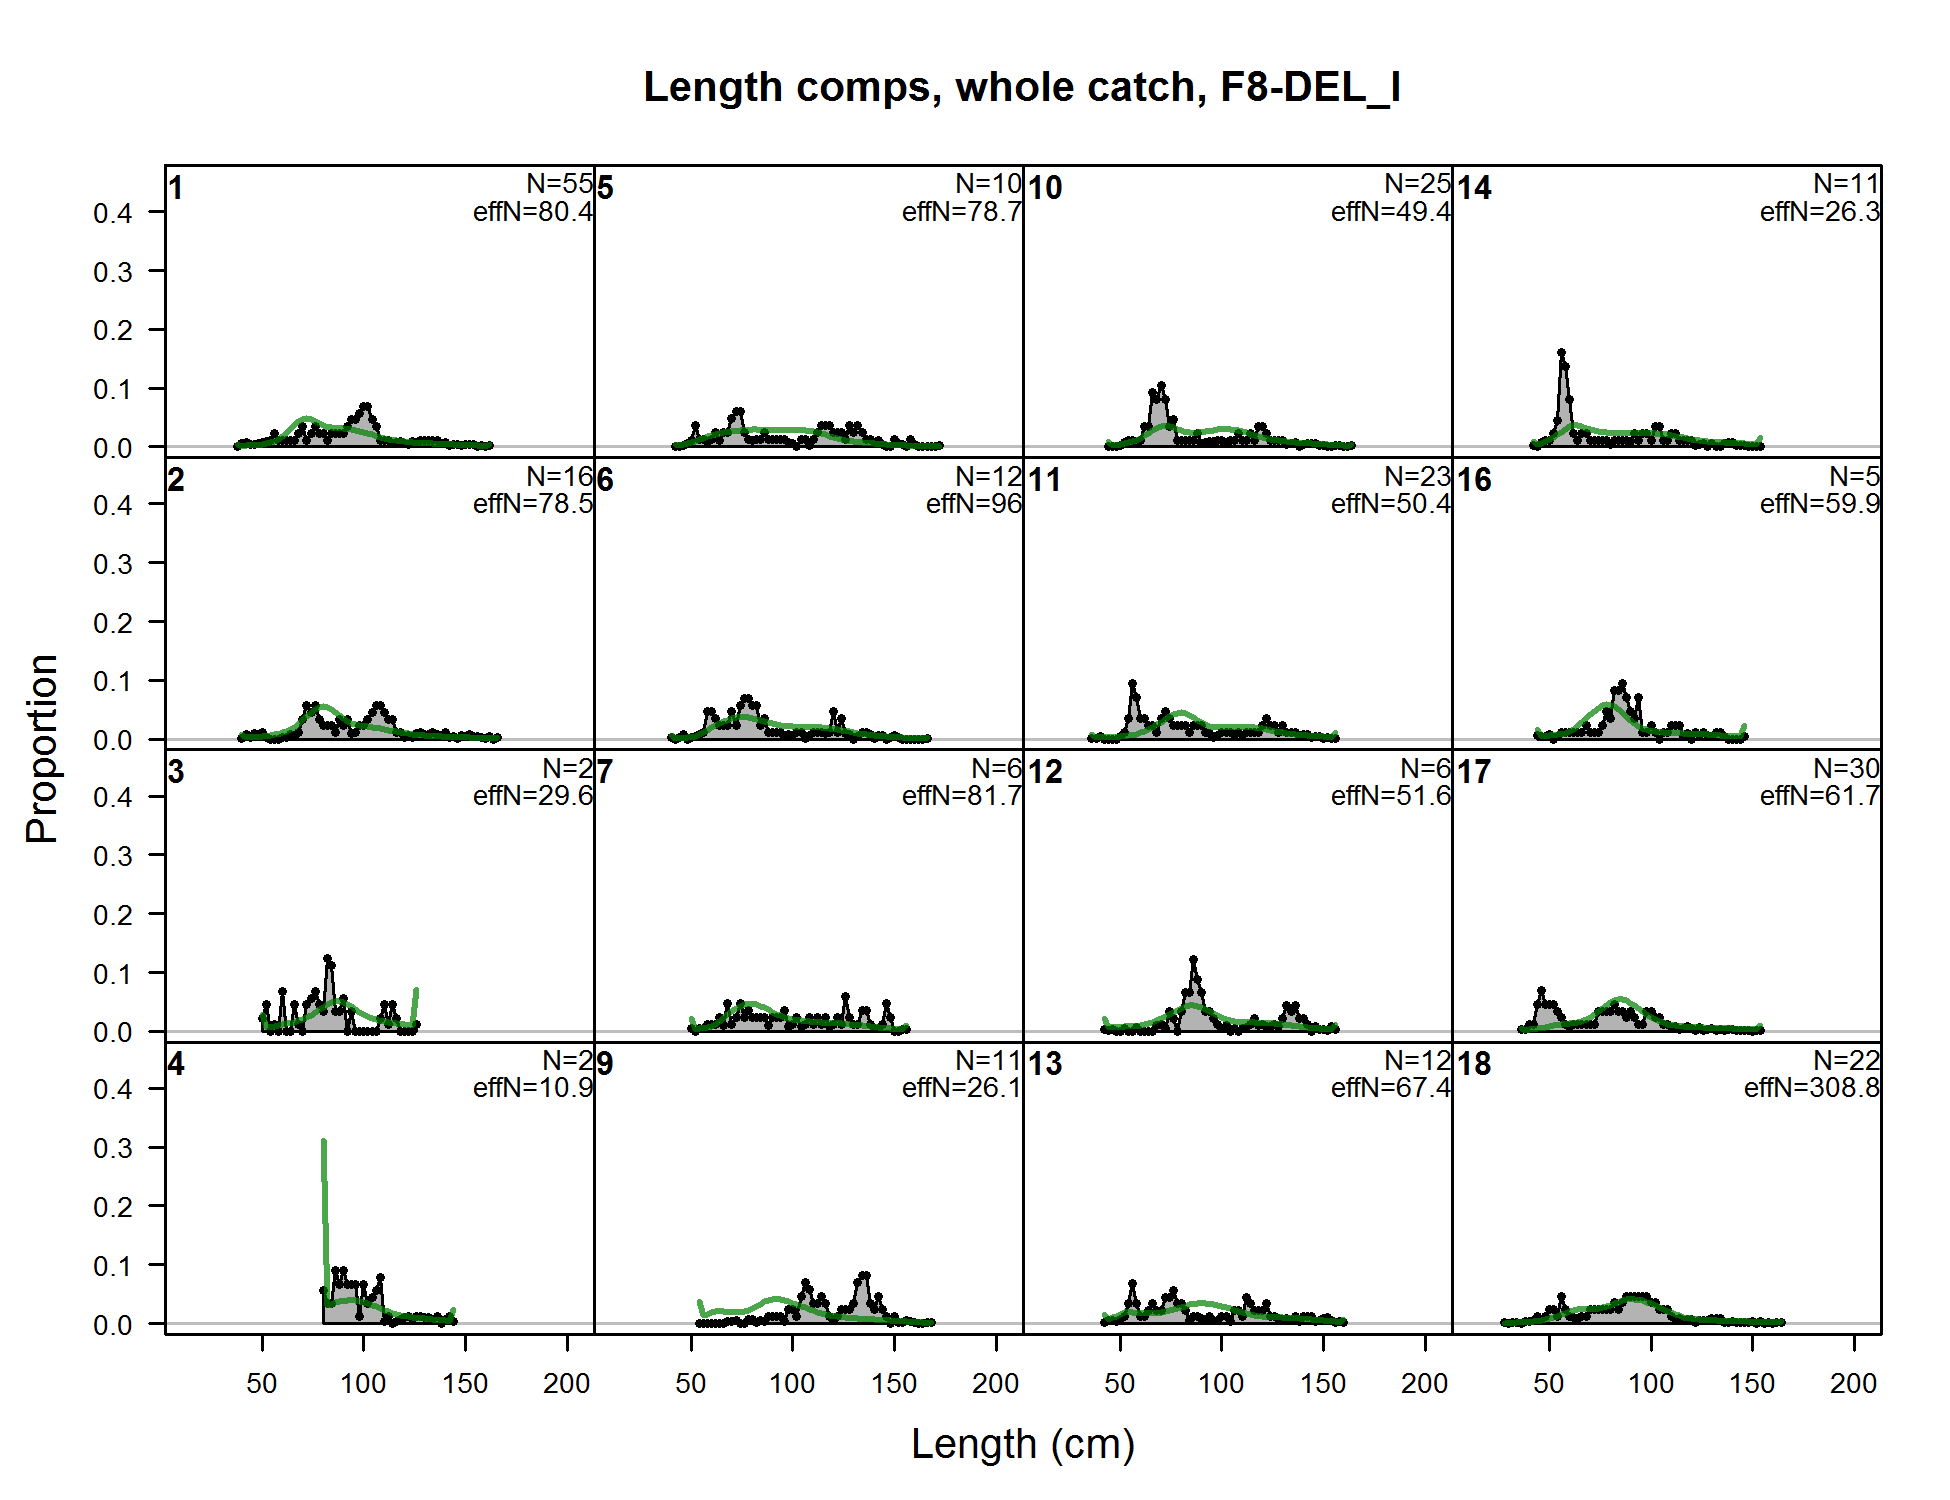
Length comps, whole catch, F8-DEL_I (plot 1 of 11)
file: comp_lenfit_flt8mkt0_page1.png
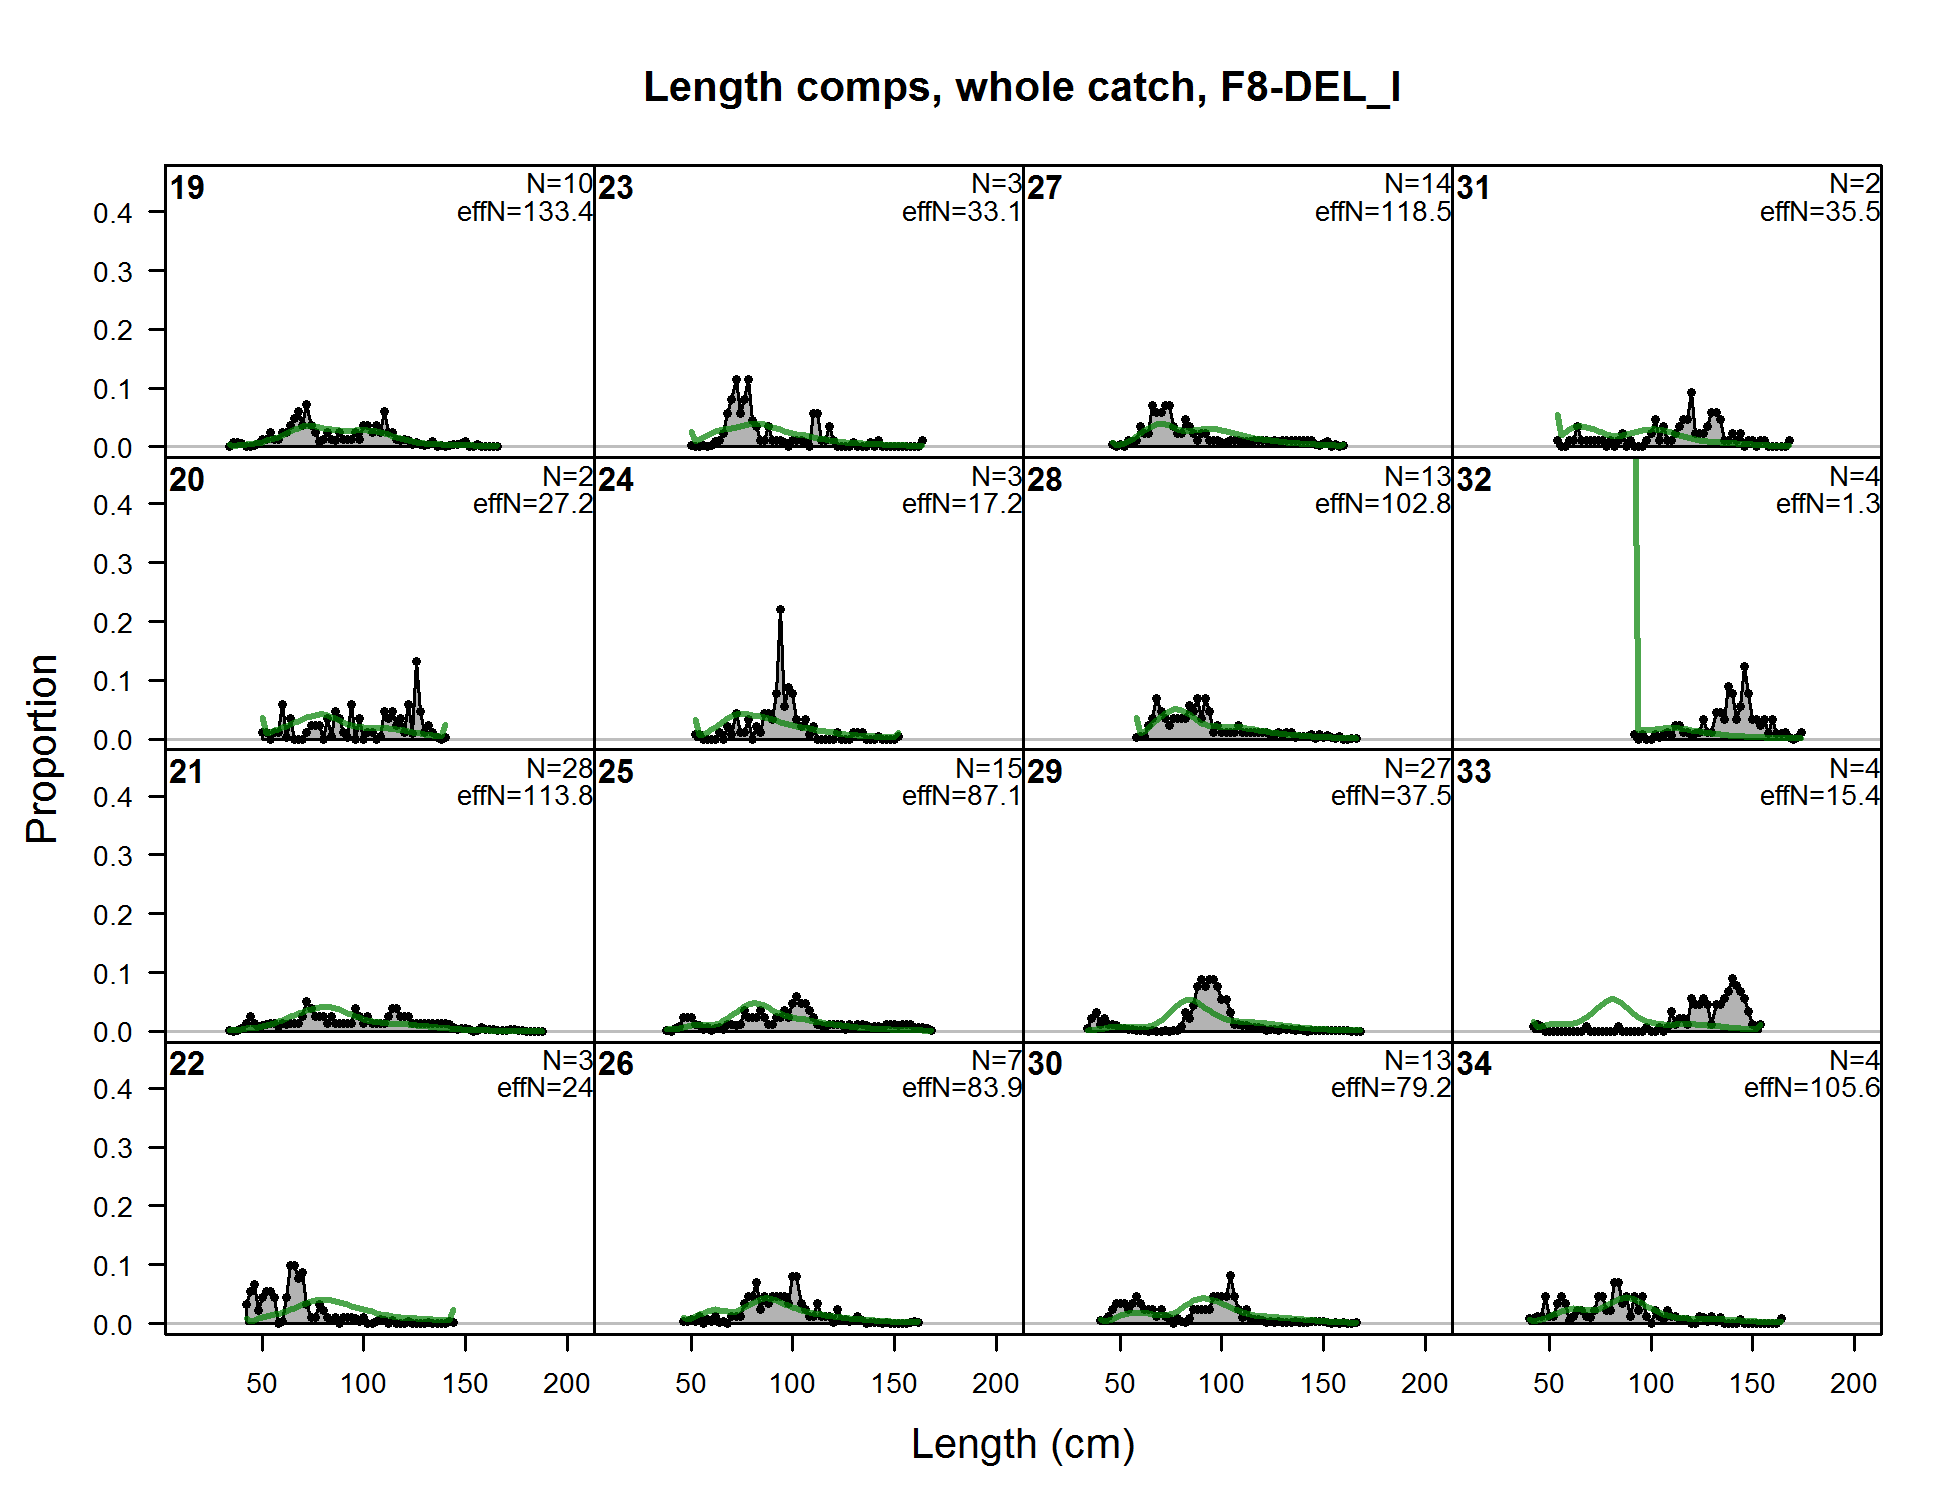
Length comps, whole catch, F8-DEL_I (plot 1 of 11) (plot 2 of 11)
file: comp_lenfit_flt8mkt0_page2.png
Length comps, whole catch, F8-DEL_I (plot 1 of 11) (plot 2 of 11) (plot 3 of 11)
file: comp_lenfit_flt8mkt0_page3.png
Length comps, whole catch, F8-DEL_I (plot 1 of 11) (plot 2 of 11) (plot 3 of 11) (plot 4 of 11)
file: comp_lenfit_flt8mkt0_page4.png
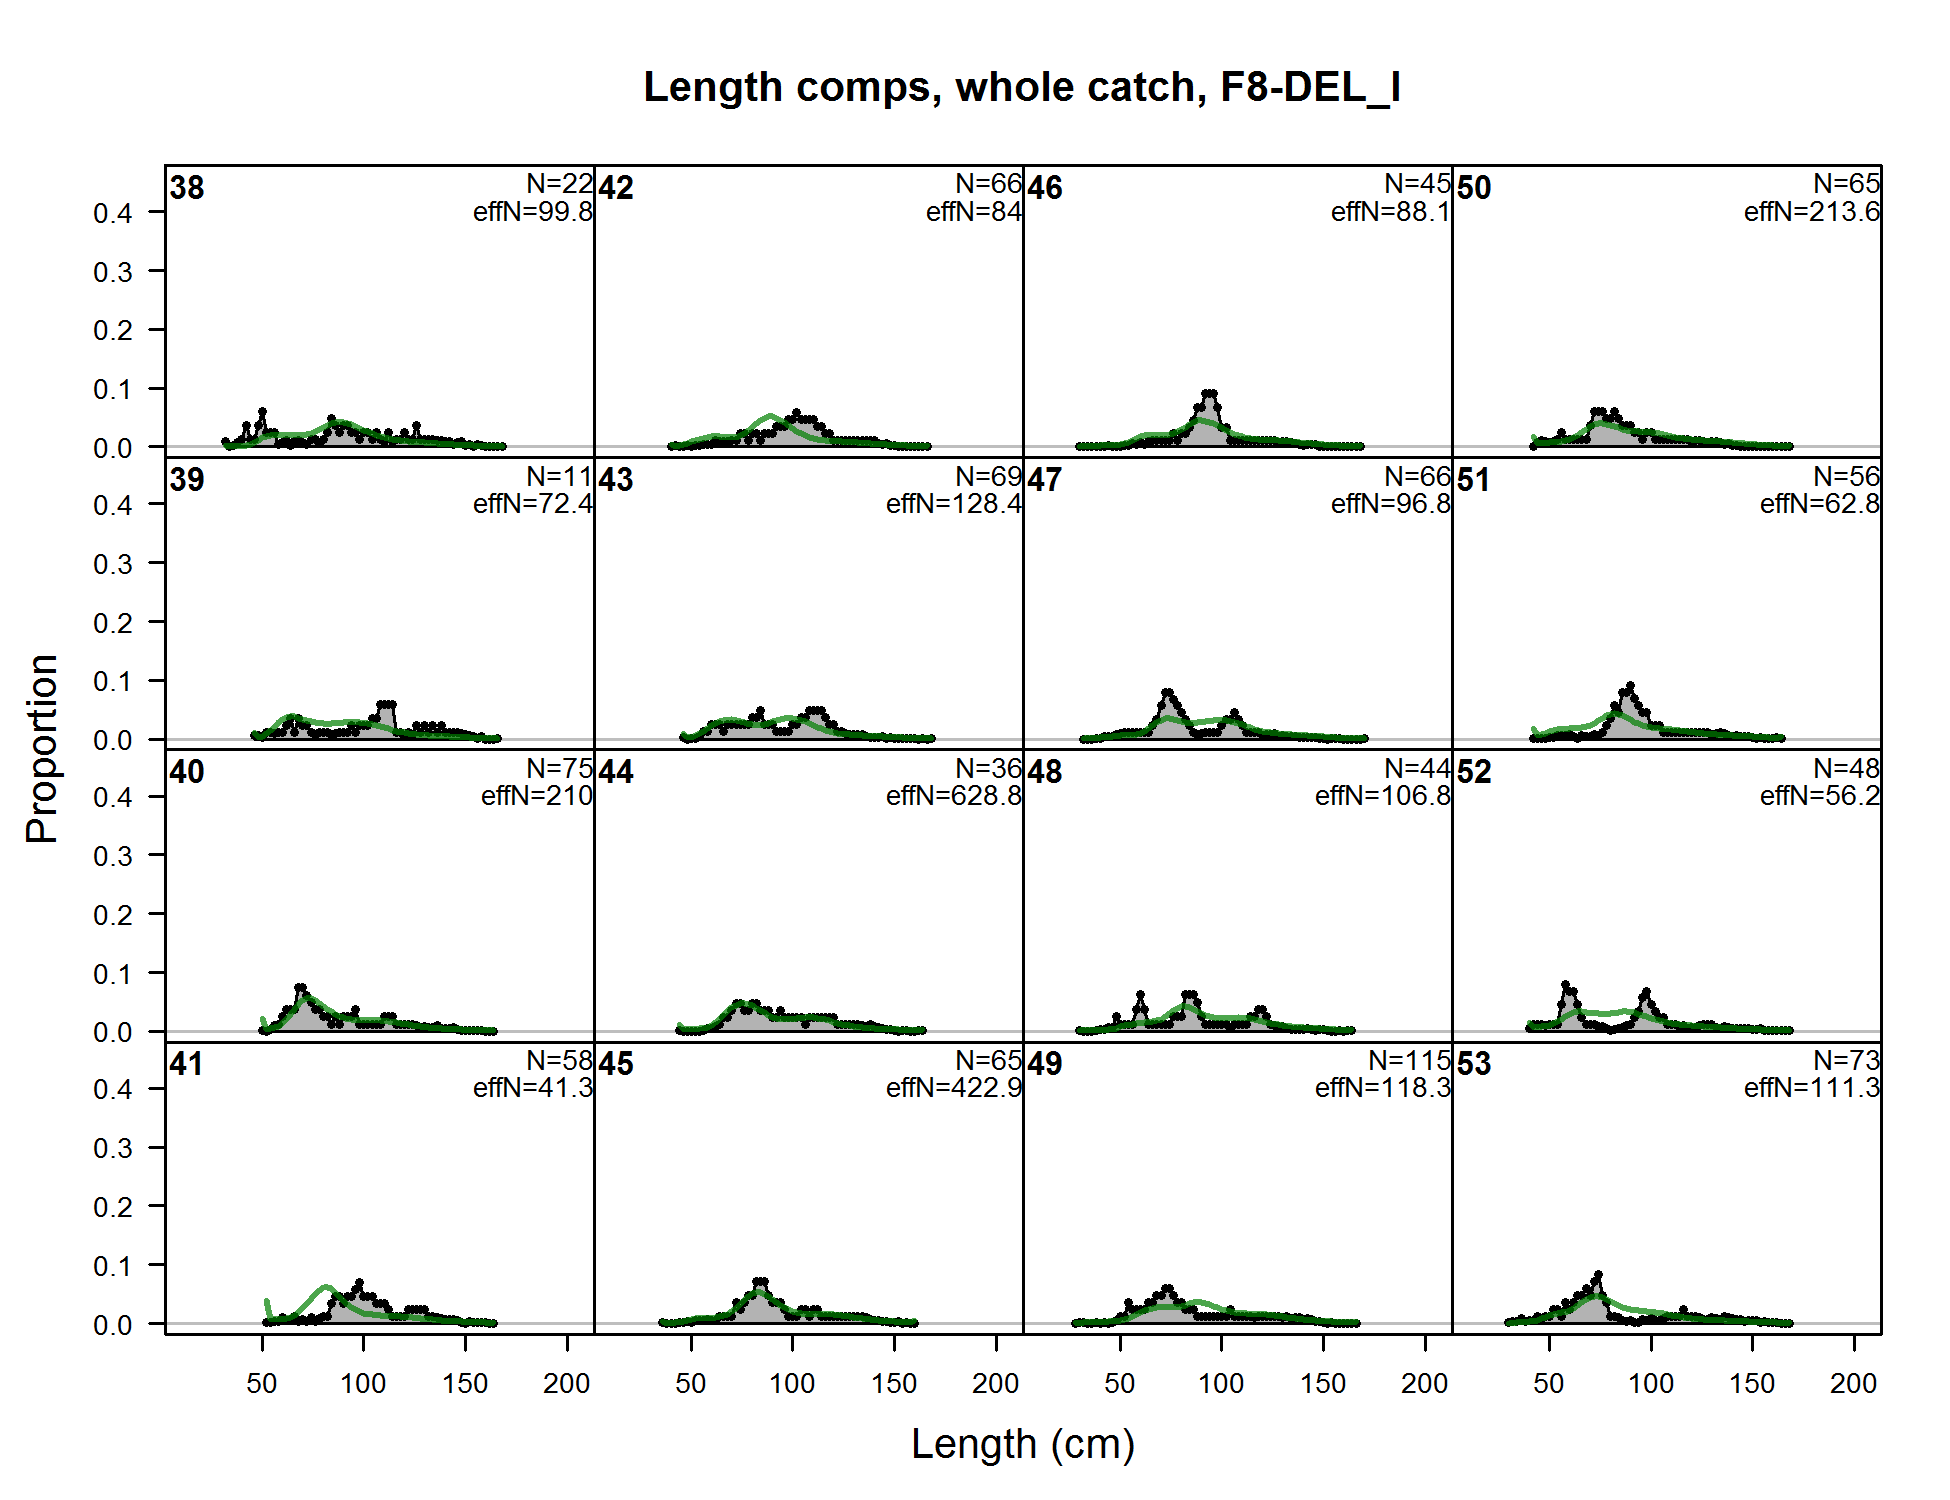
Length comps, whole catch, F8-DEL_I (plot 1 of 11) (plot 2 of 11) (plot 3 of 11) (plot 4 of 11) (plot 5 of 11)
file: comp_lenfit_flt8mkt0_page5.png
Length comps, whole catch, F8-DEL_I (plot 1 of 11) (plot 2 of 11) (plot 3 of 11) (plot 4 of 11) (plot 5 of 11) (plot 6 of 11)
file: comp_lenfit_flt8mkt0_page6.png
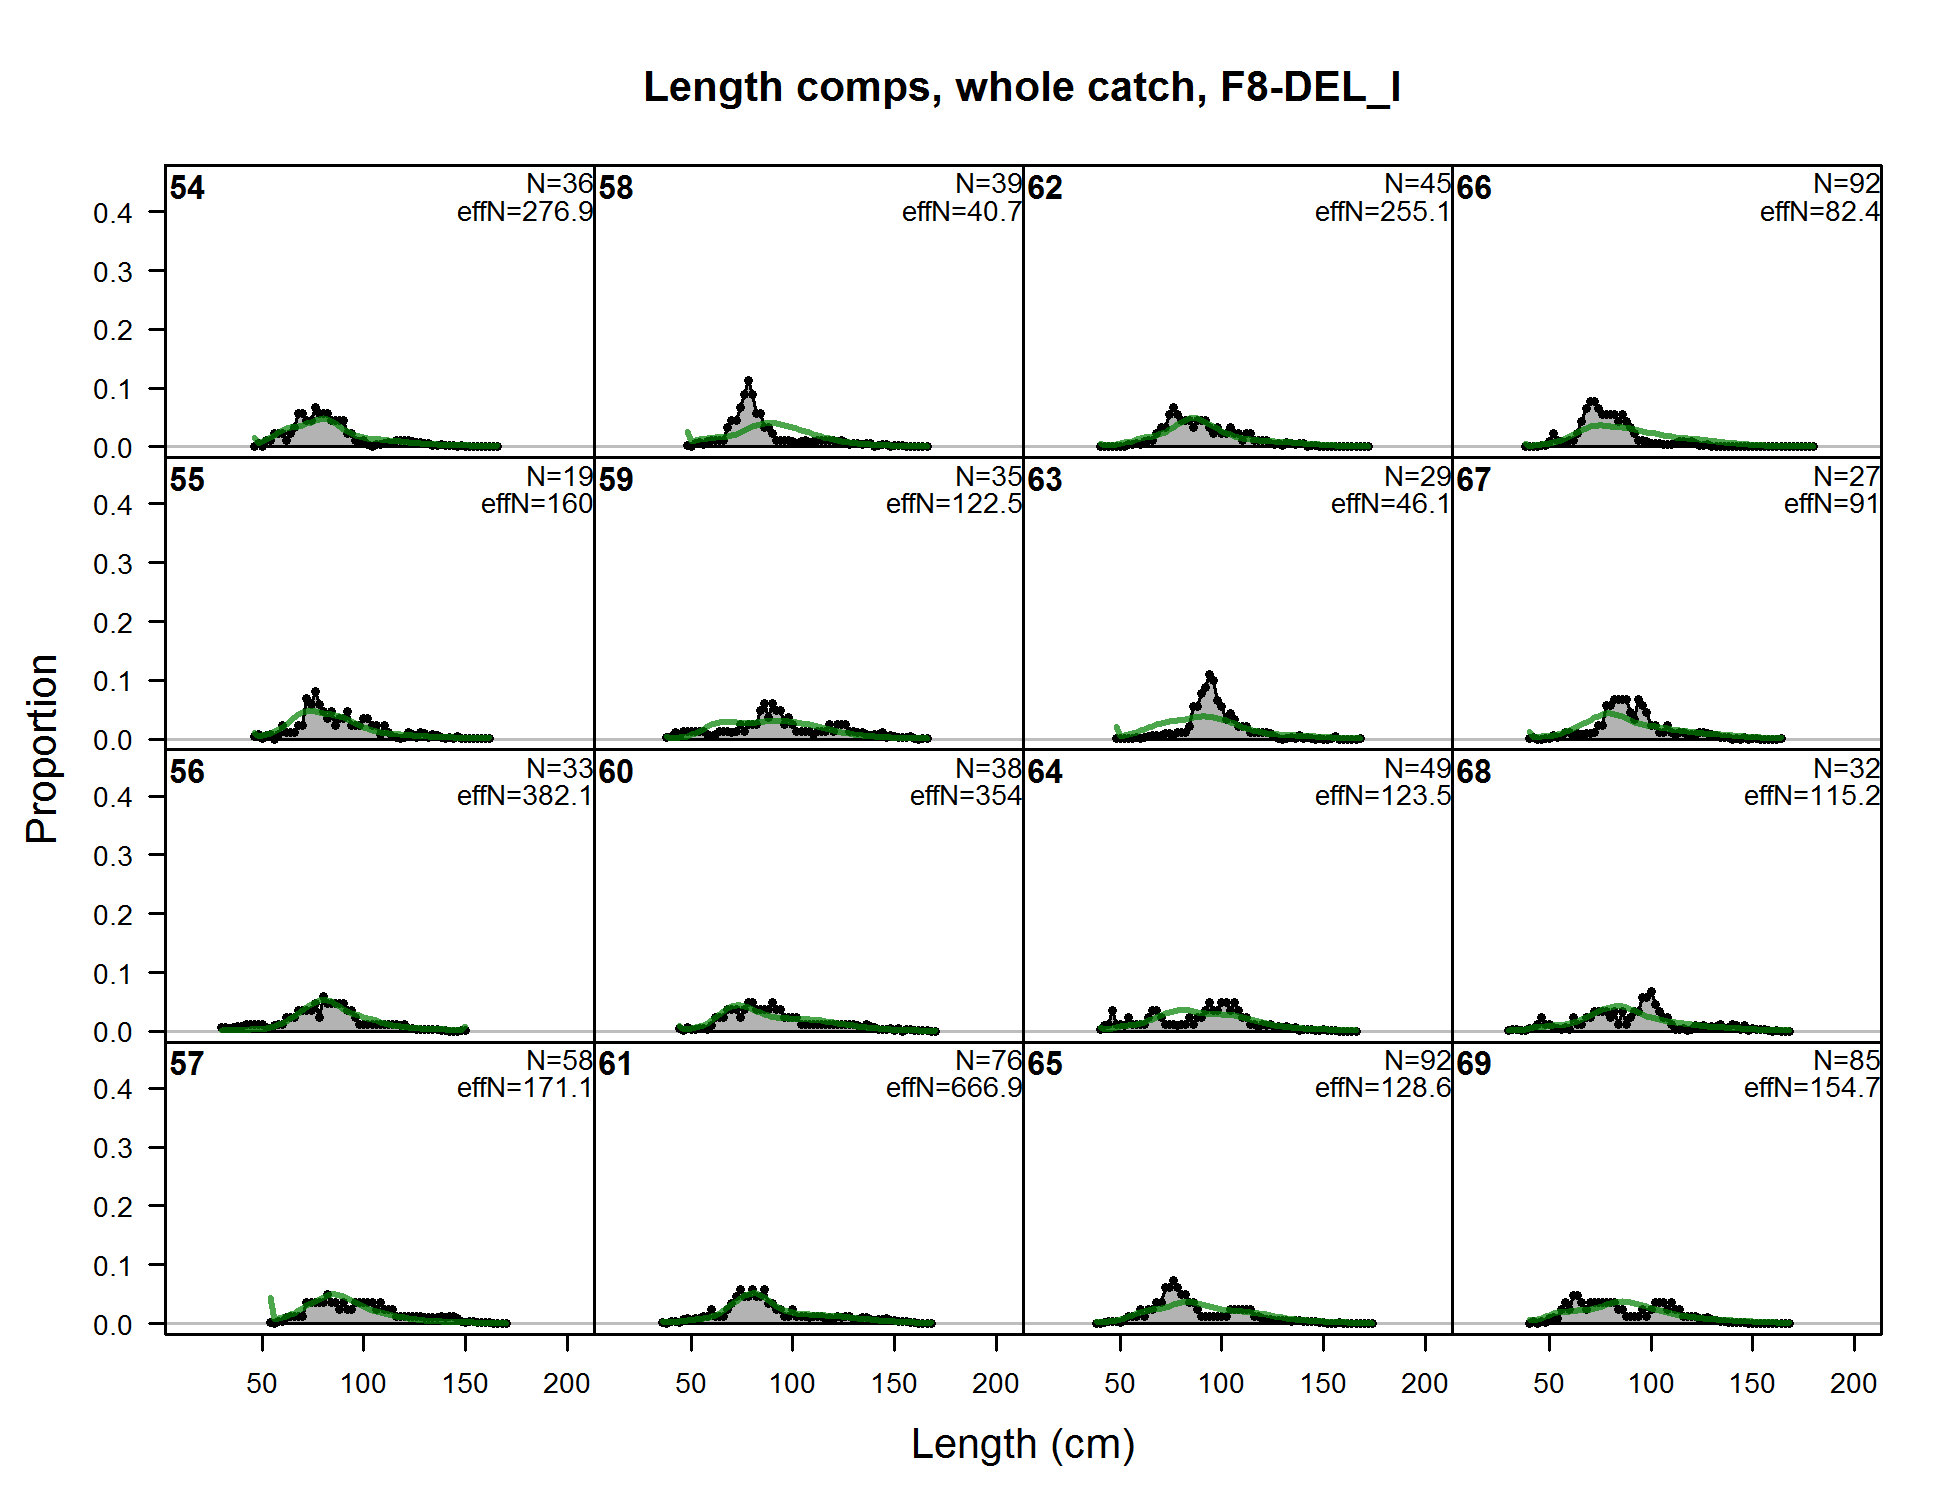
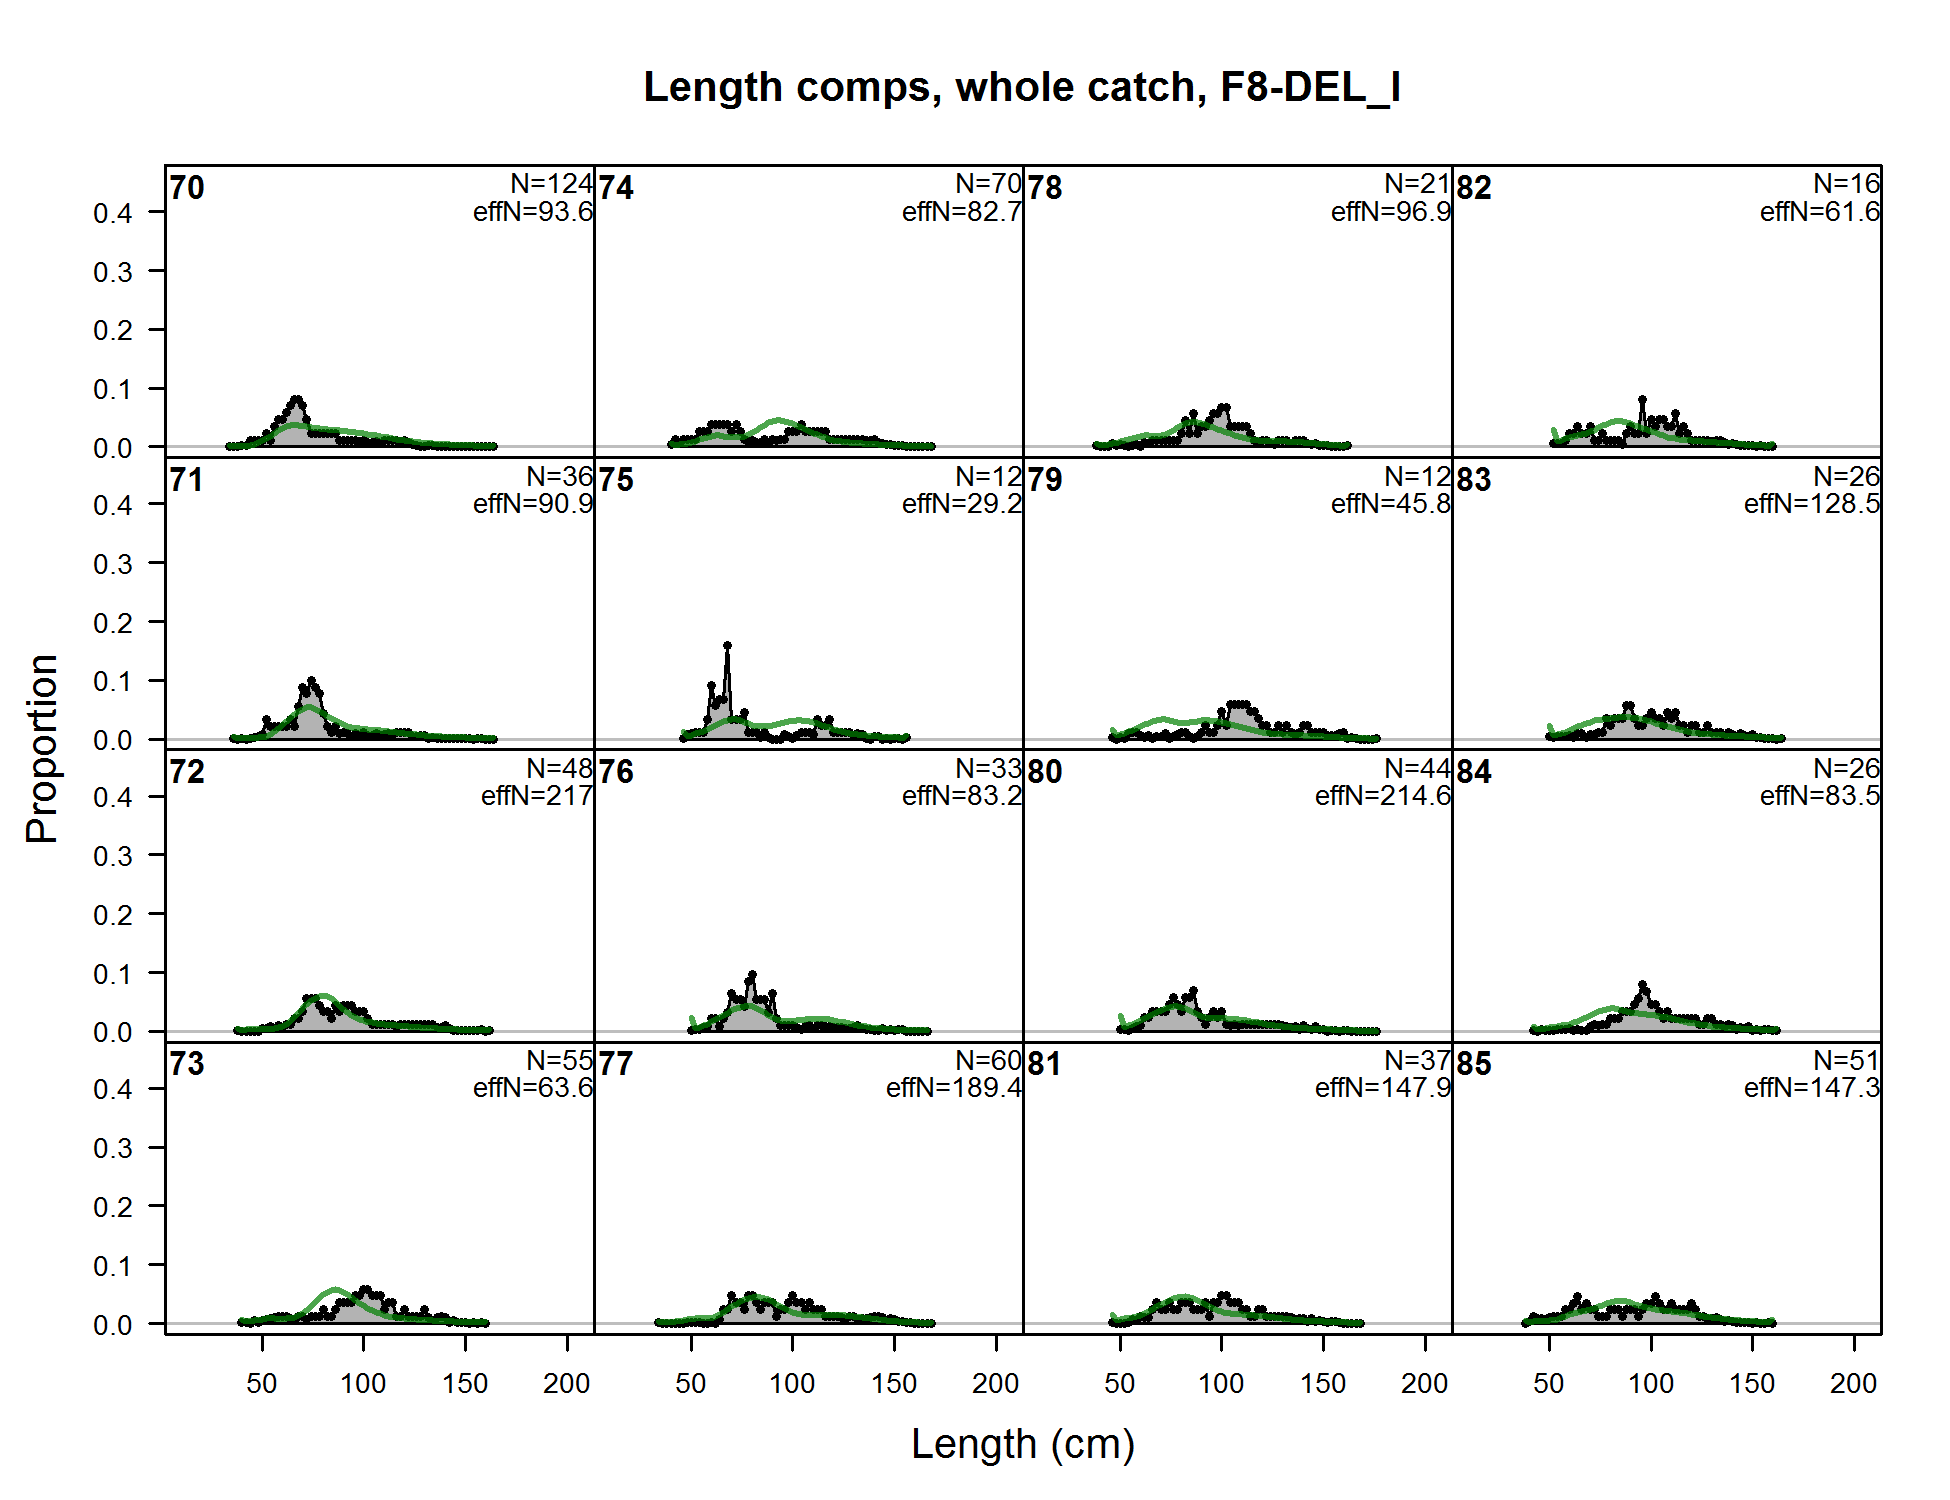
Length comps, whole catch, F8-DEL_I (plot 1 of 11) (plot 2 of 11) (plot 3 of 11) (plot 4 of 11) (plot 5 of 11) (plot 6 of 11) (plot 7 of 11)
file: comp_lenfit_flt8mkt0_page7.png
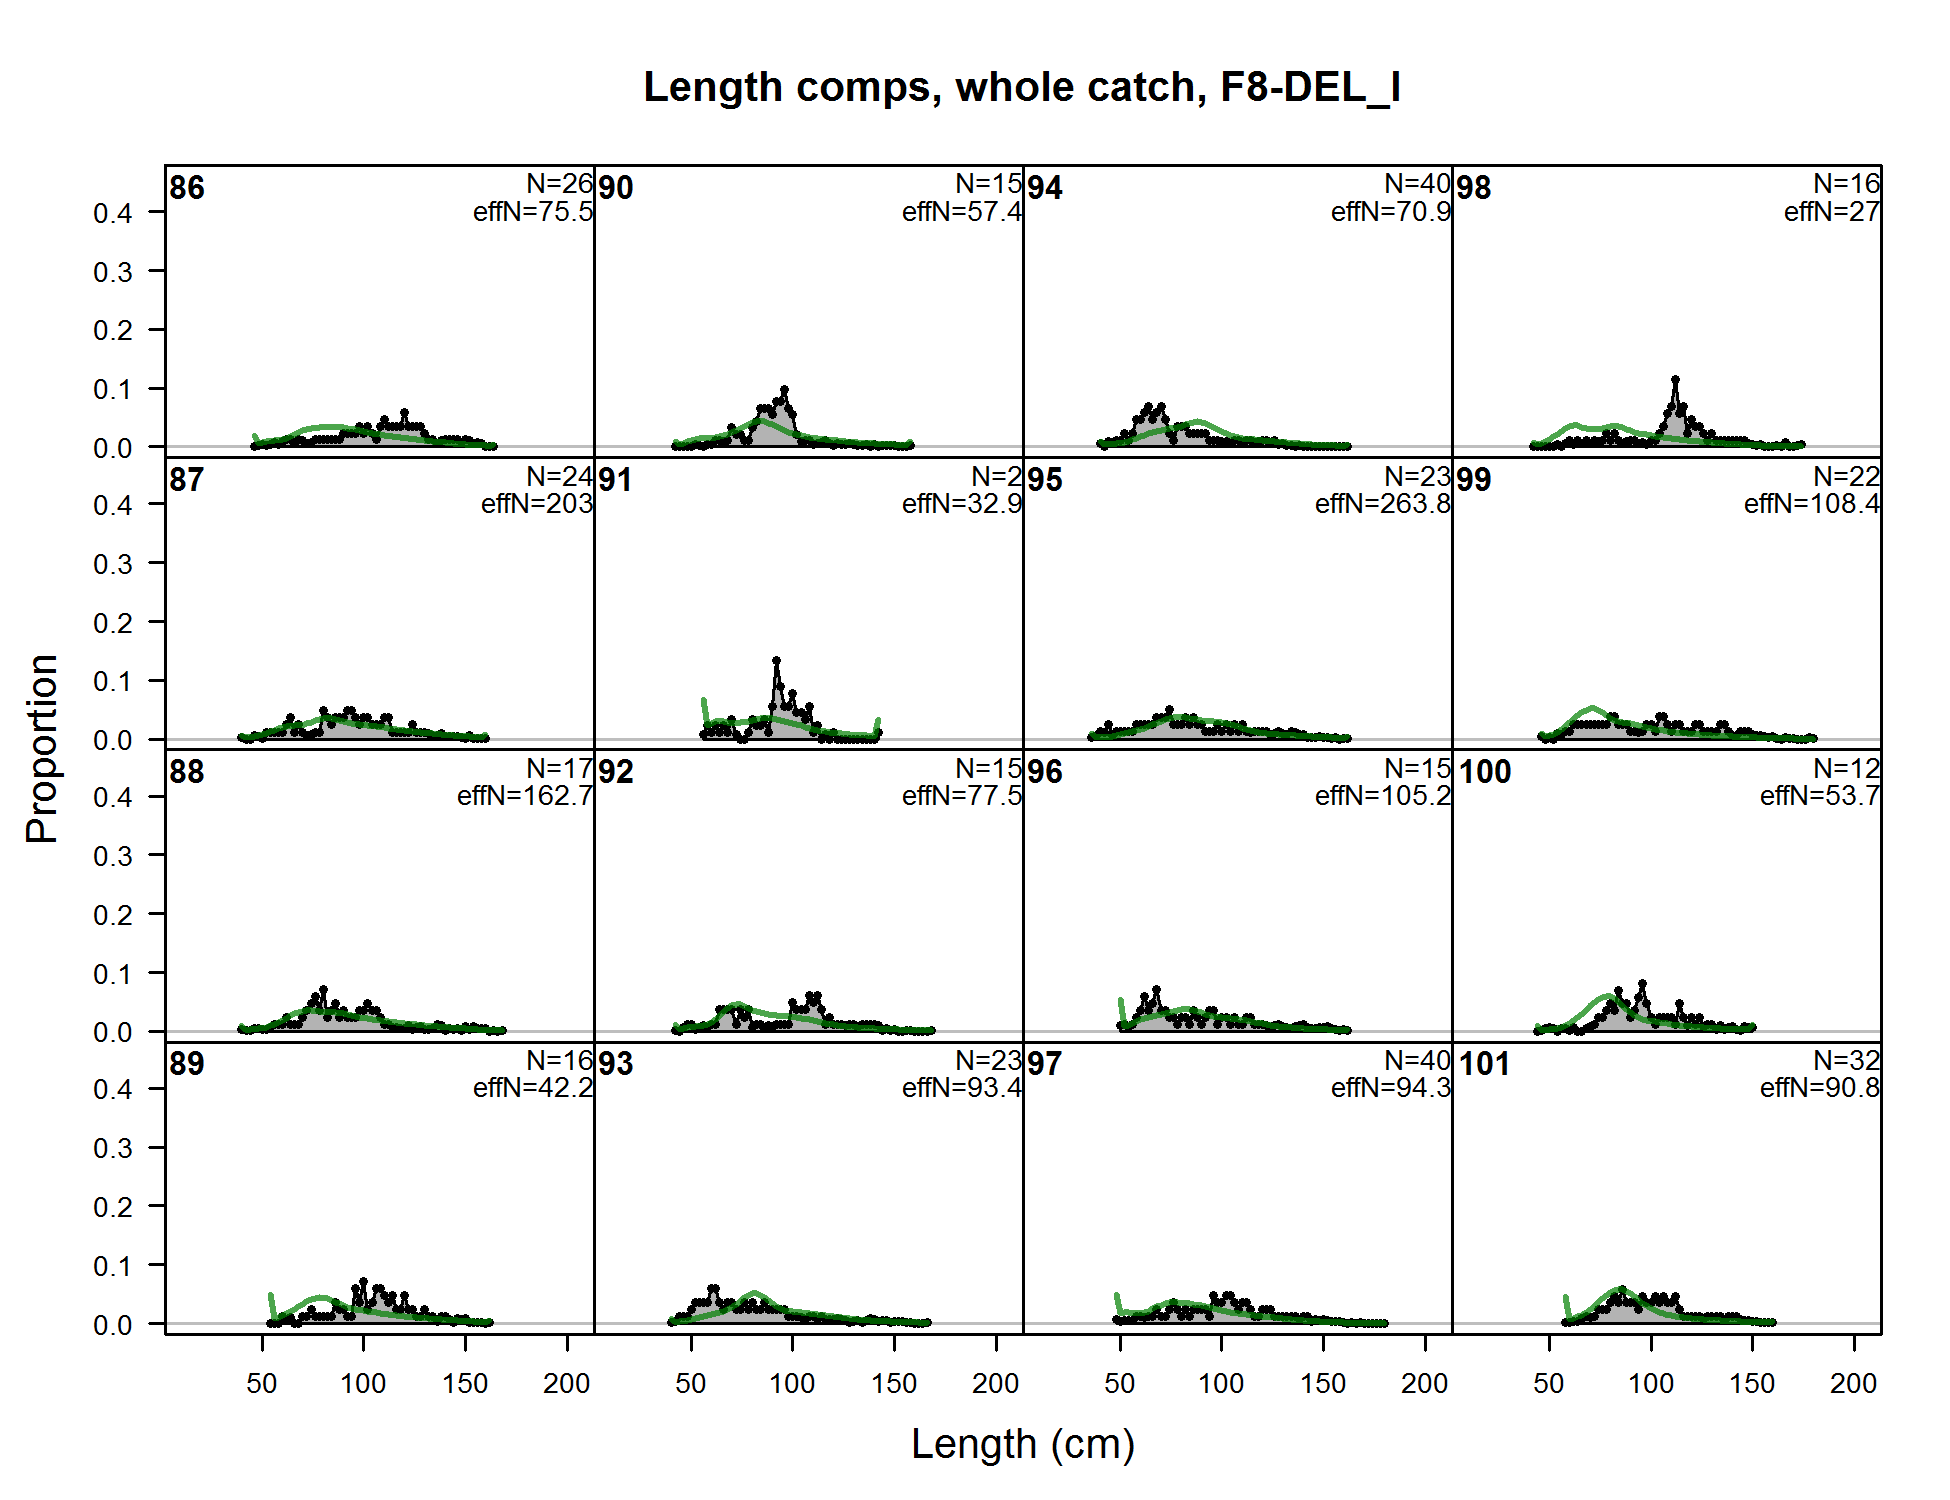
Length comps, whole catch, F8-DEL_I (plot 1 of 11) (plot 2 of 11) (plot 3 of 11) (plot 4 of 11) (plot 5 of 11) (plot 6 of 11) (plot 7 of 11) (plot 8 of 11)
file: comp_lenfit_flt8mkt0_page8.png
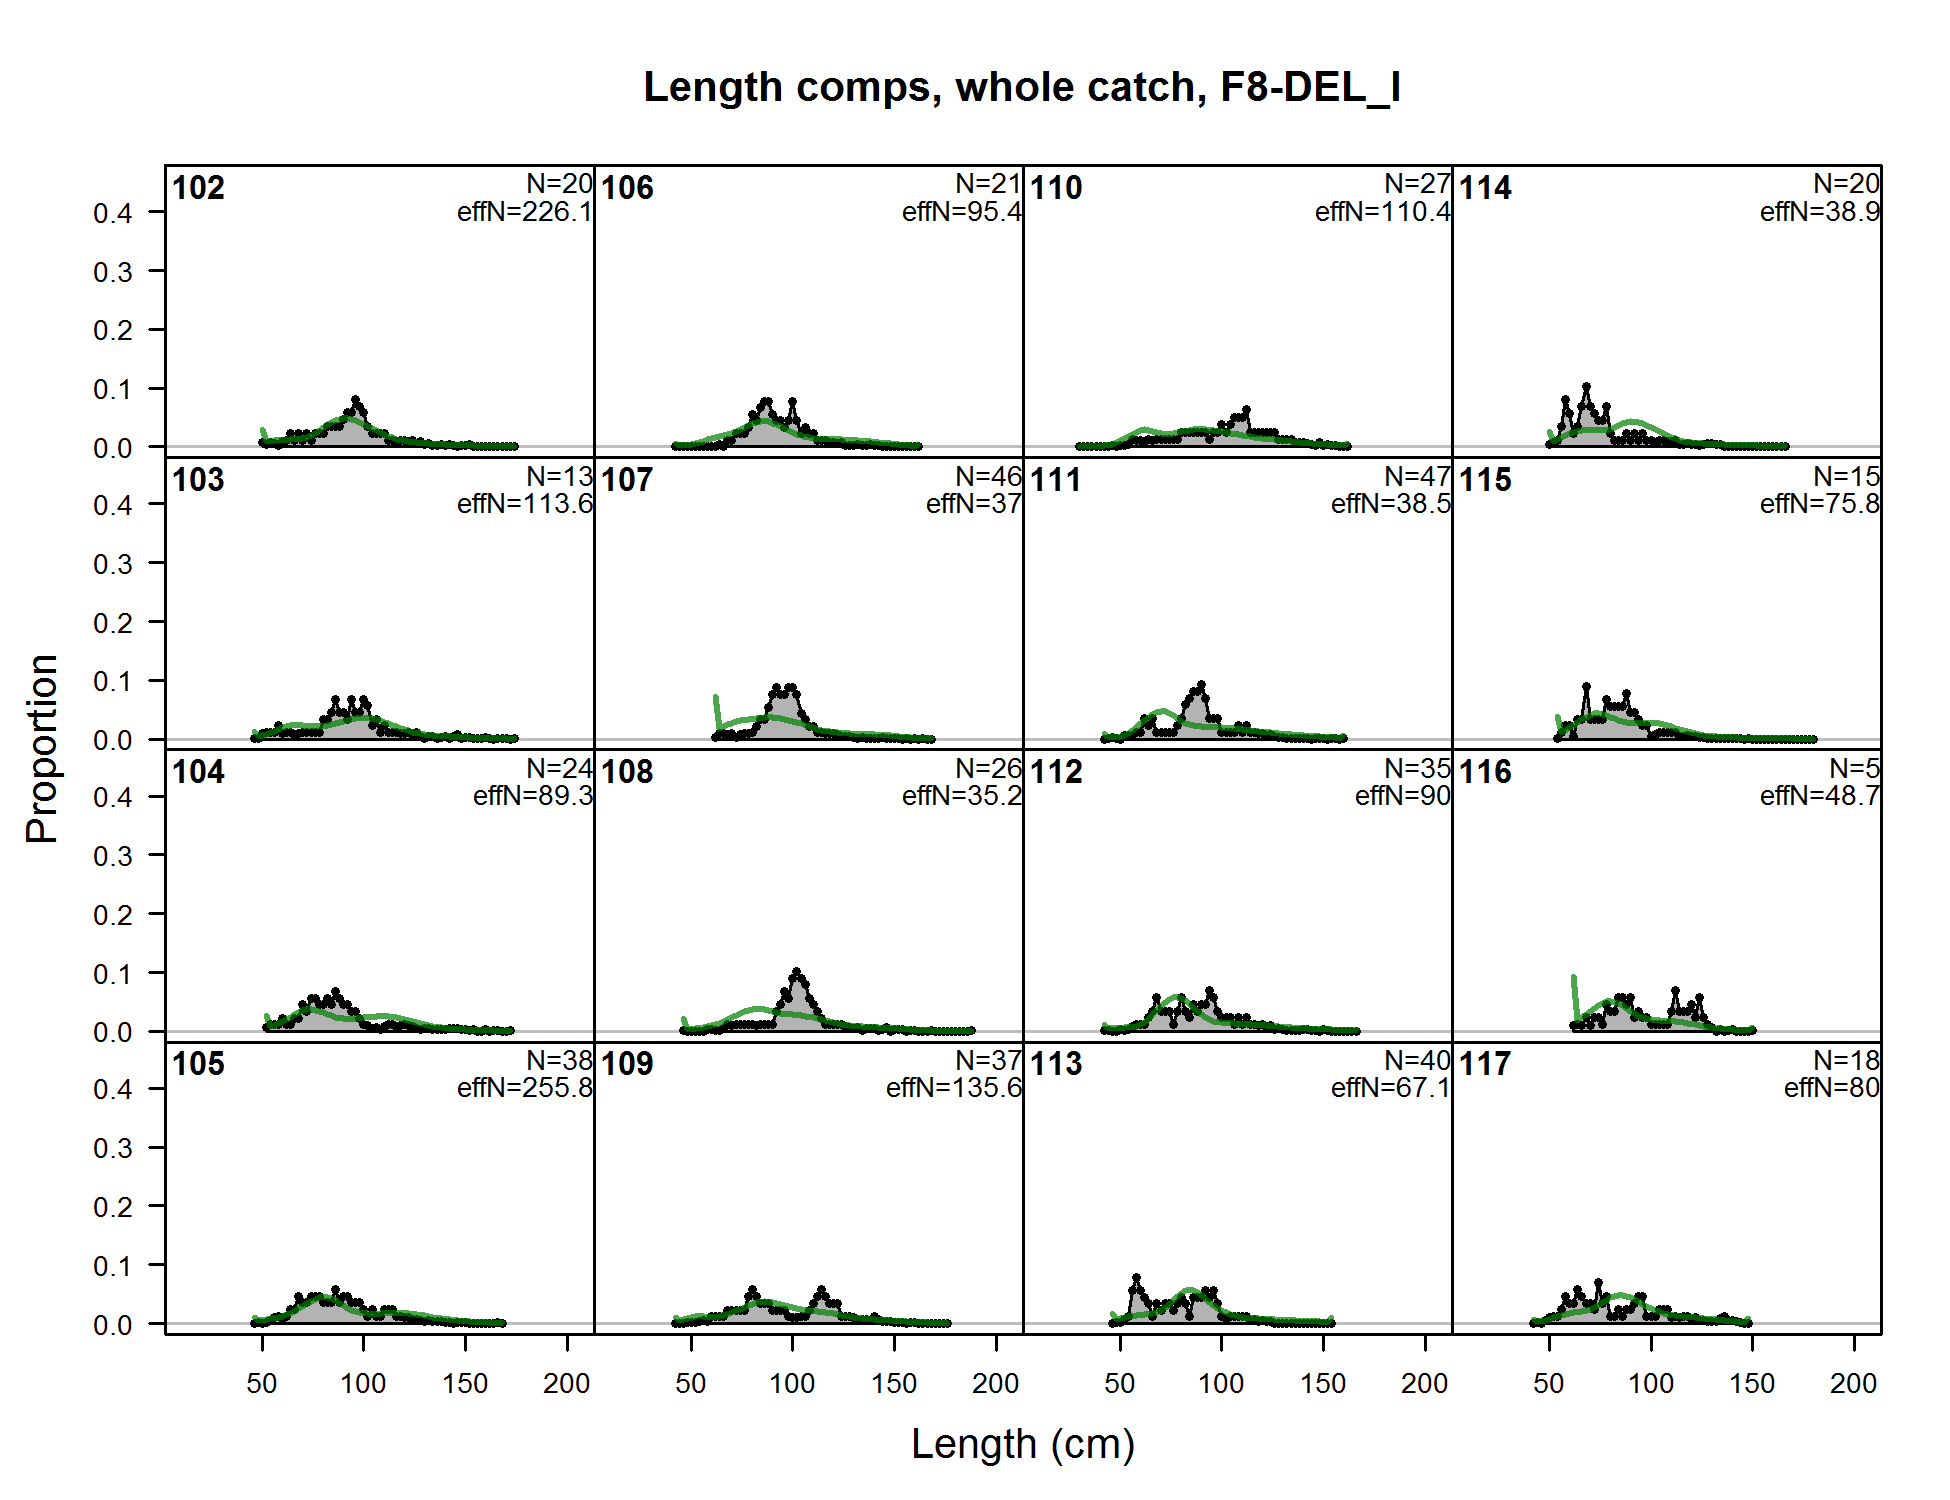
Length comps, whole catch, F8-DEL_I (plot 1 of 11) (plot 2 of 11) (plot 3 of 11) (plot 4 of 11) (plot 5 of 11) (plot 6 of 11) (plot 7 of 11) (plot 8 of 11) (plot 9 of 11)
file: comp_lenfit_flt8mkt0_page9.png
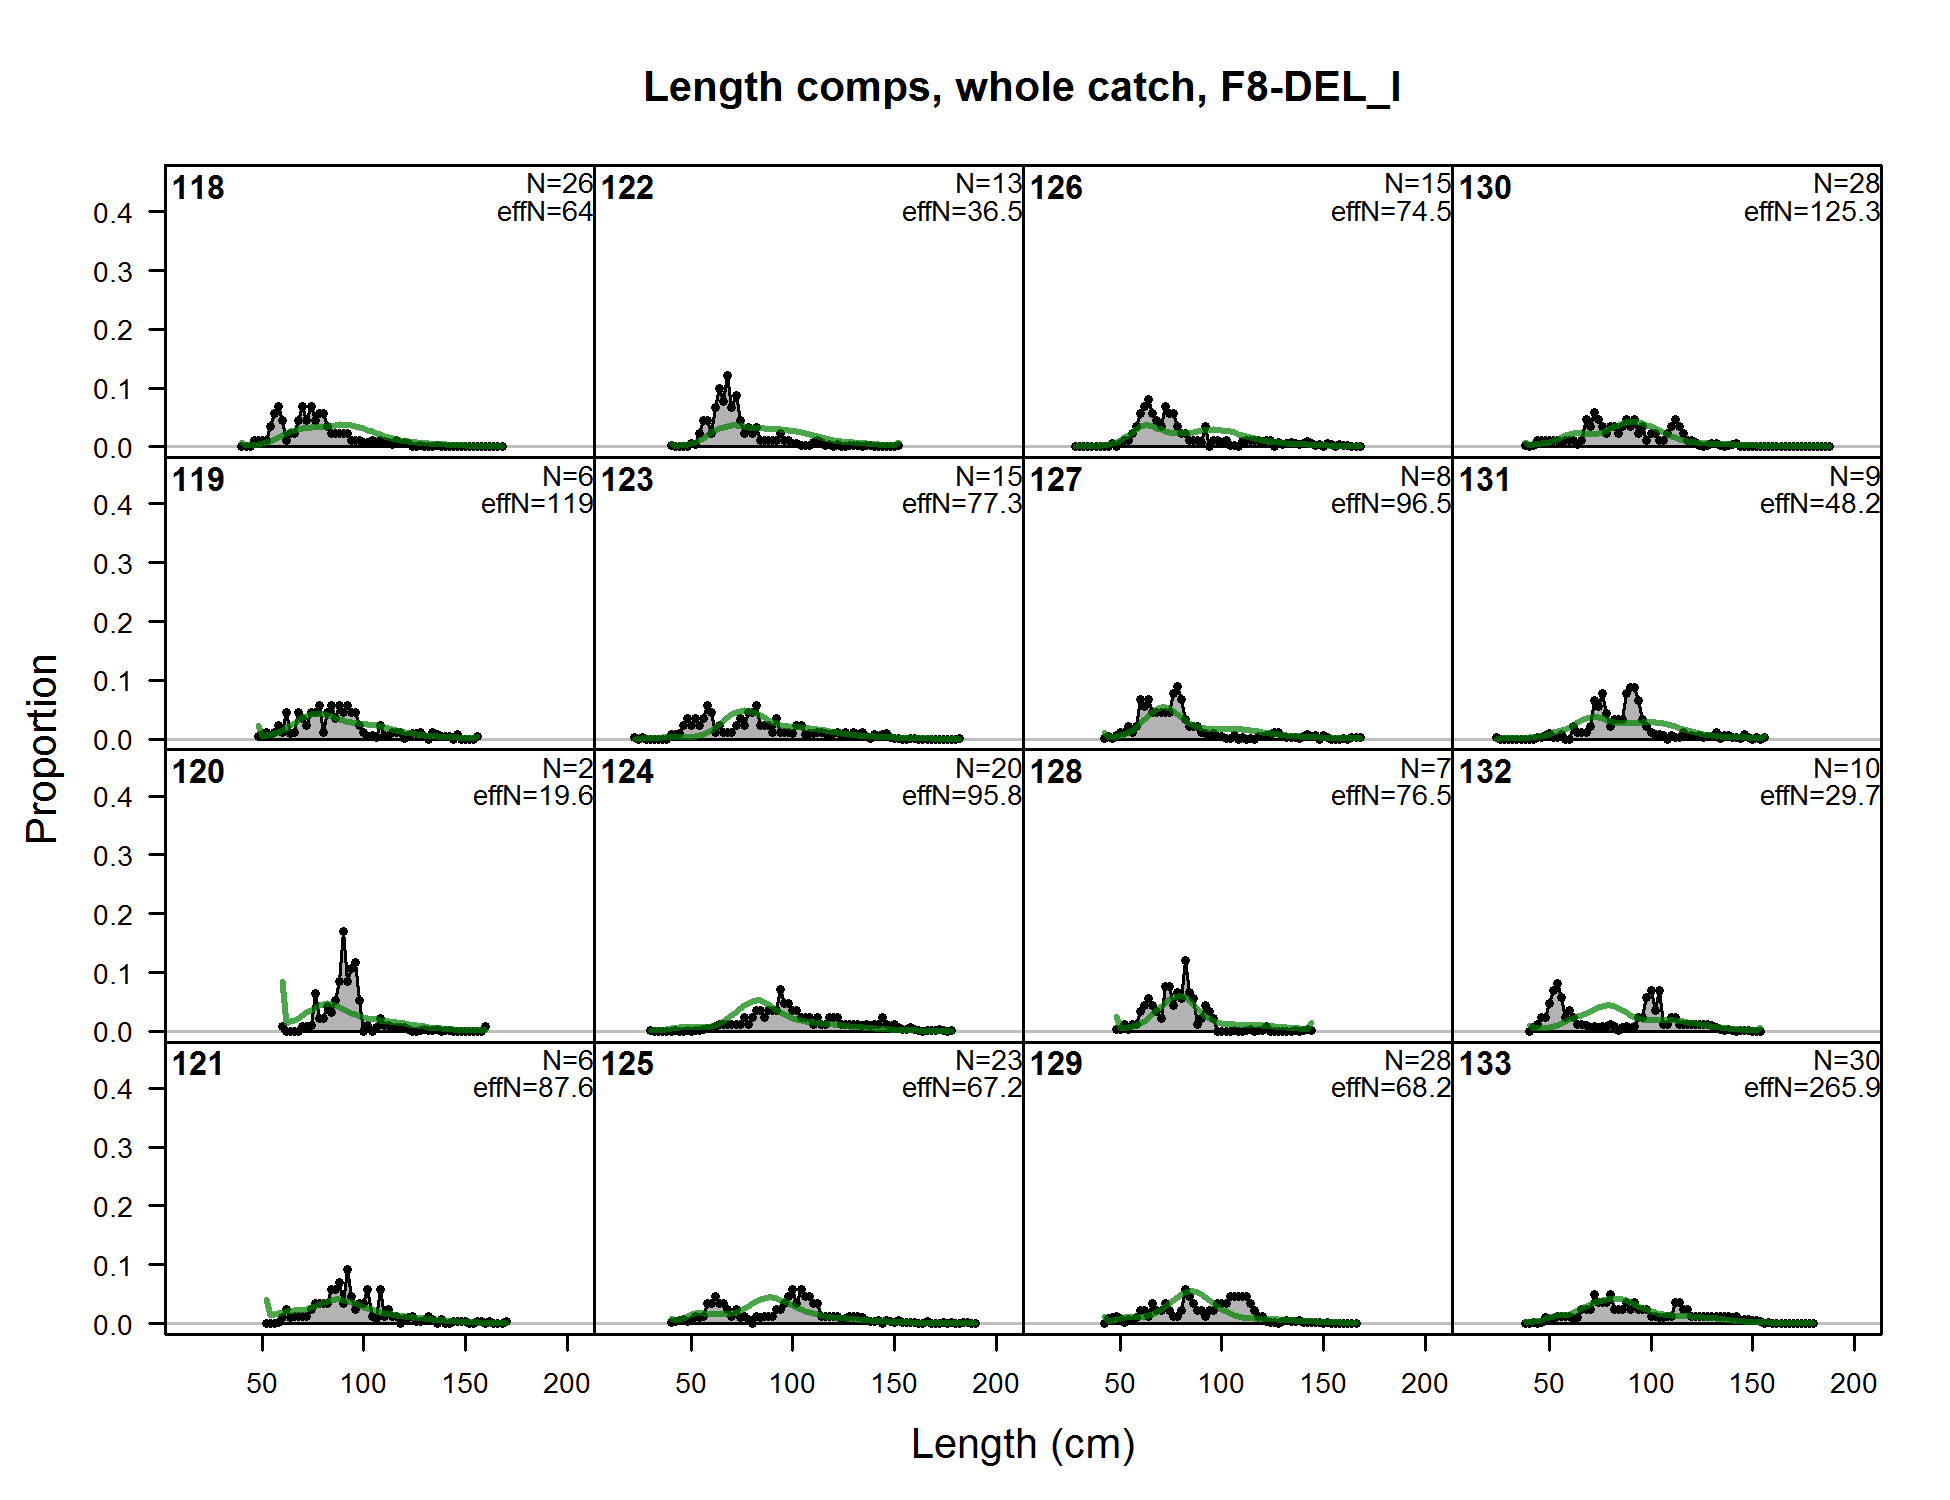
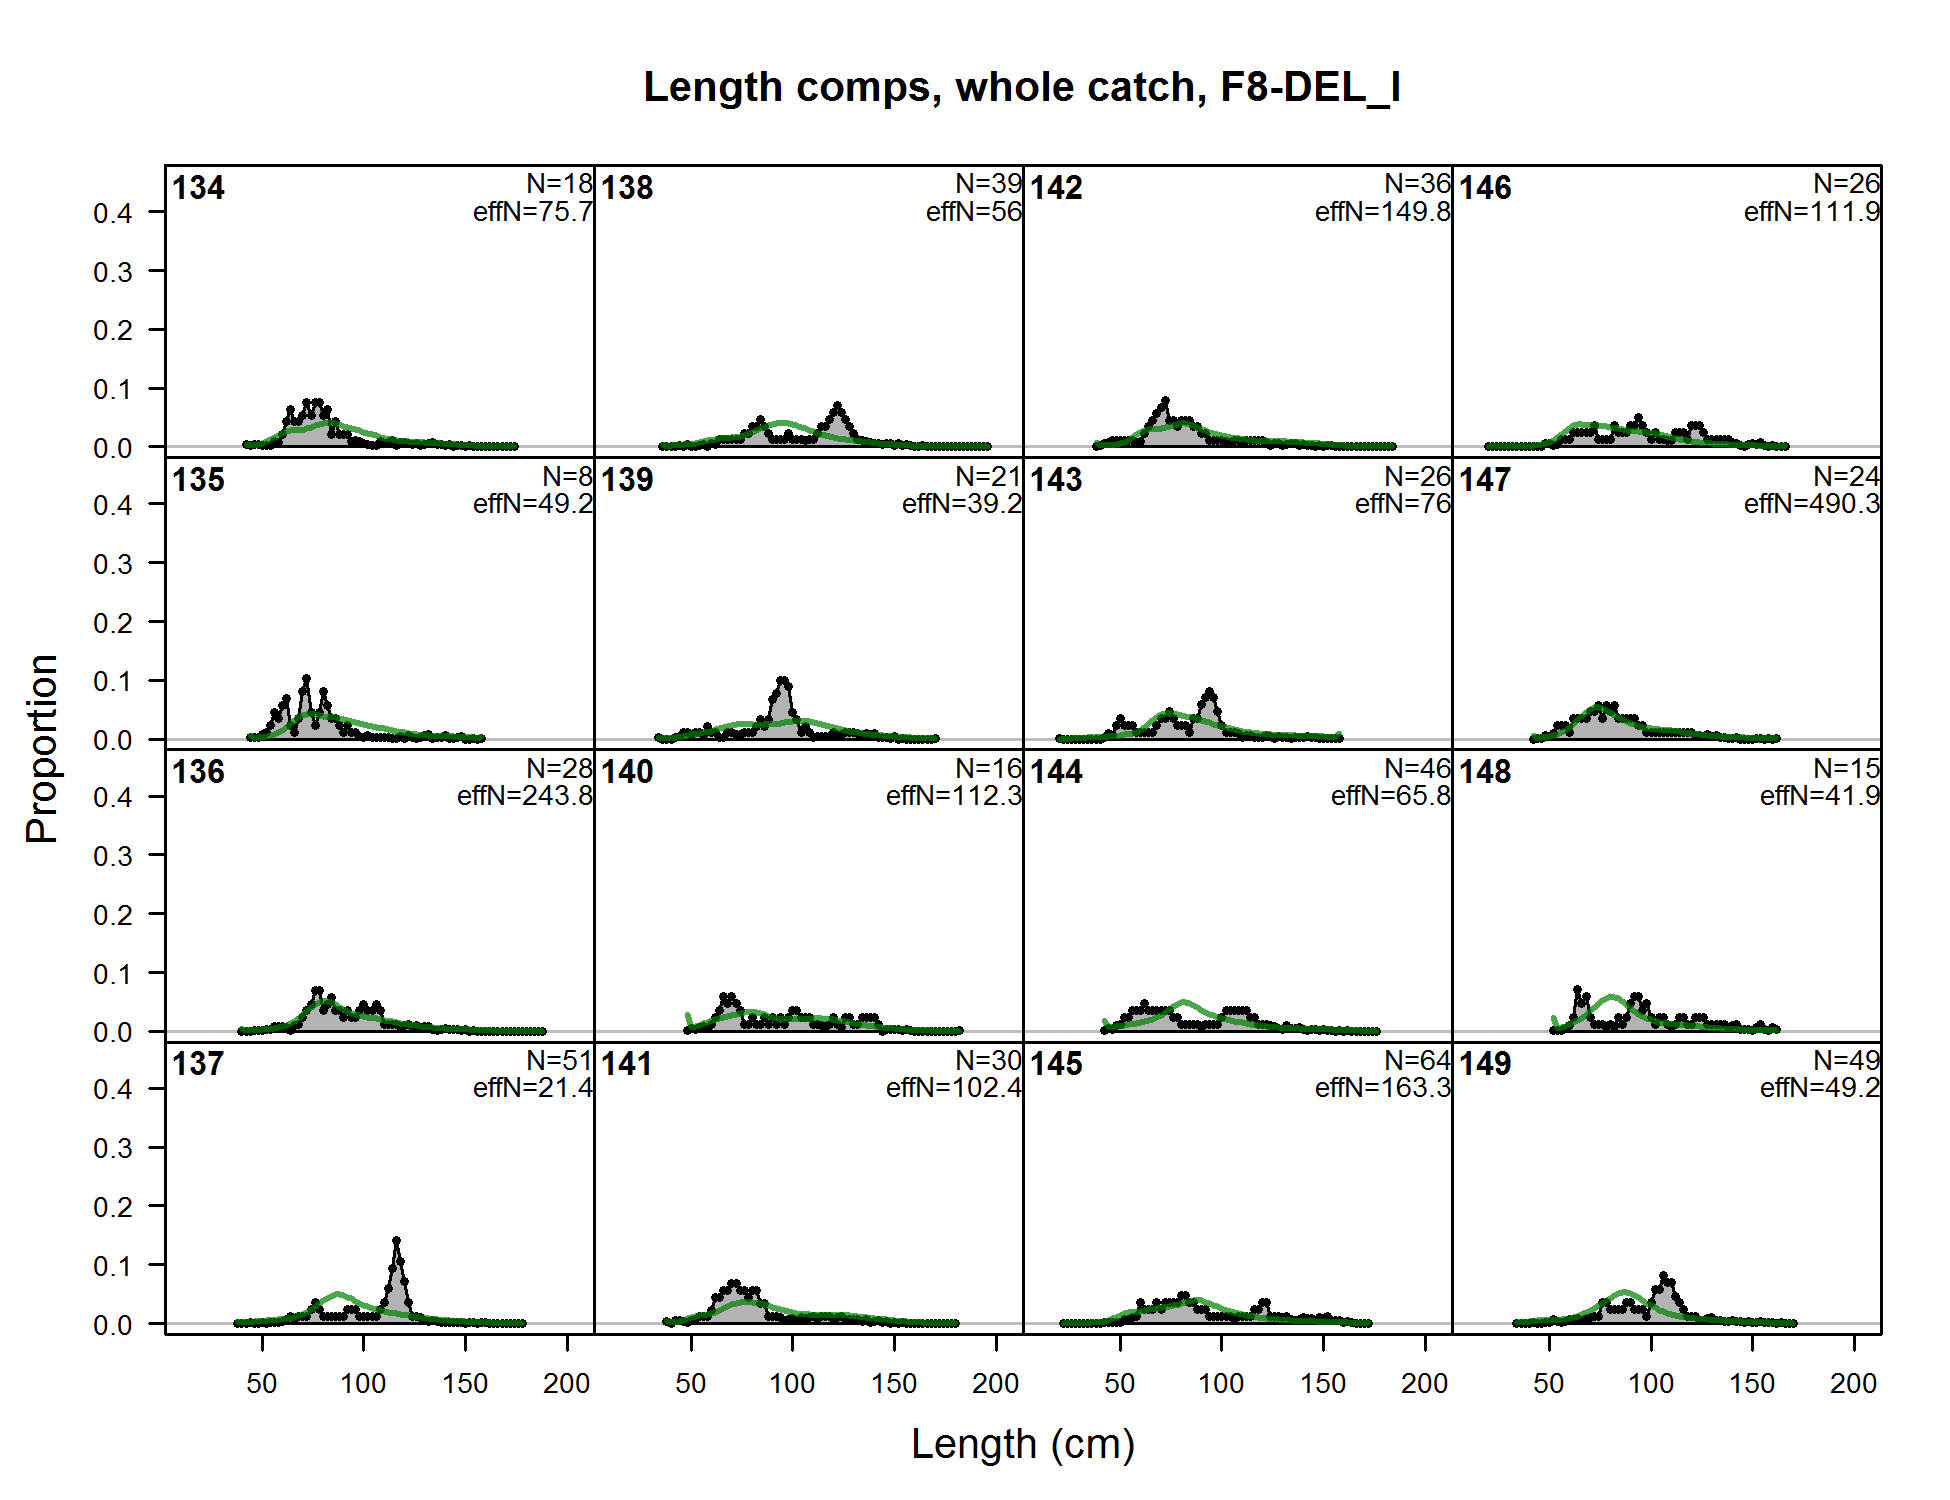
Length comps, whole catch, F8-DEL_I (plot 1 of 11) (plot 2 of 11) (plot 3 of 11) (plot 4 of 11) (plot 5 of 11) (plot 6 of 11) (plot 7 of 11) (plot 8 of 11) (plot 9 of 11) (plot 10 of 11)
file: comp_lenfit_flt8mkt0_page10.png
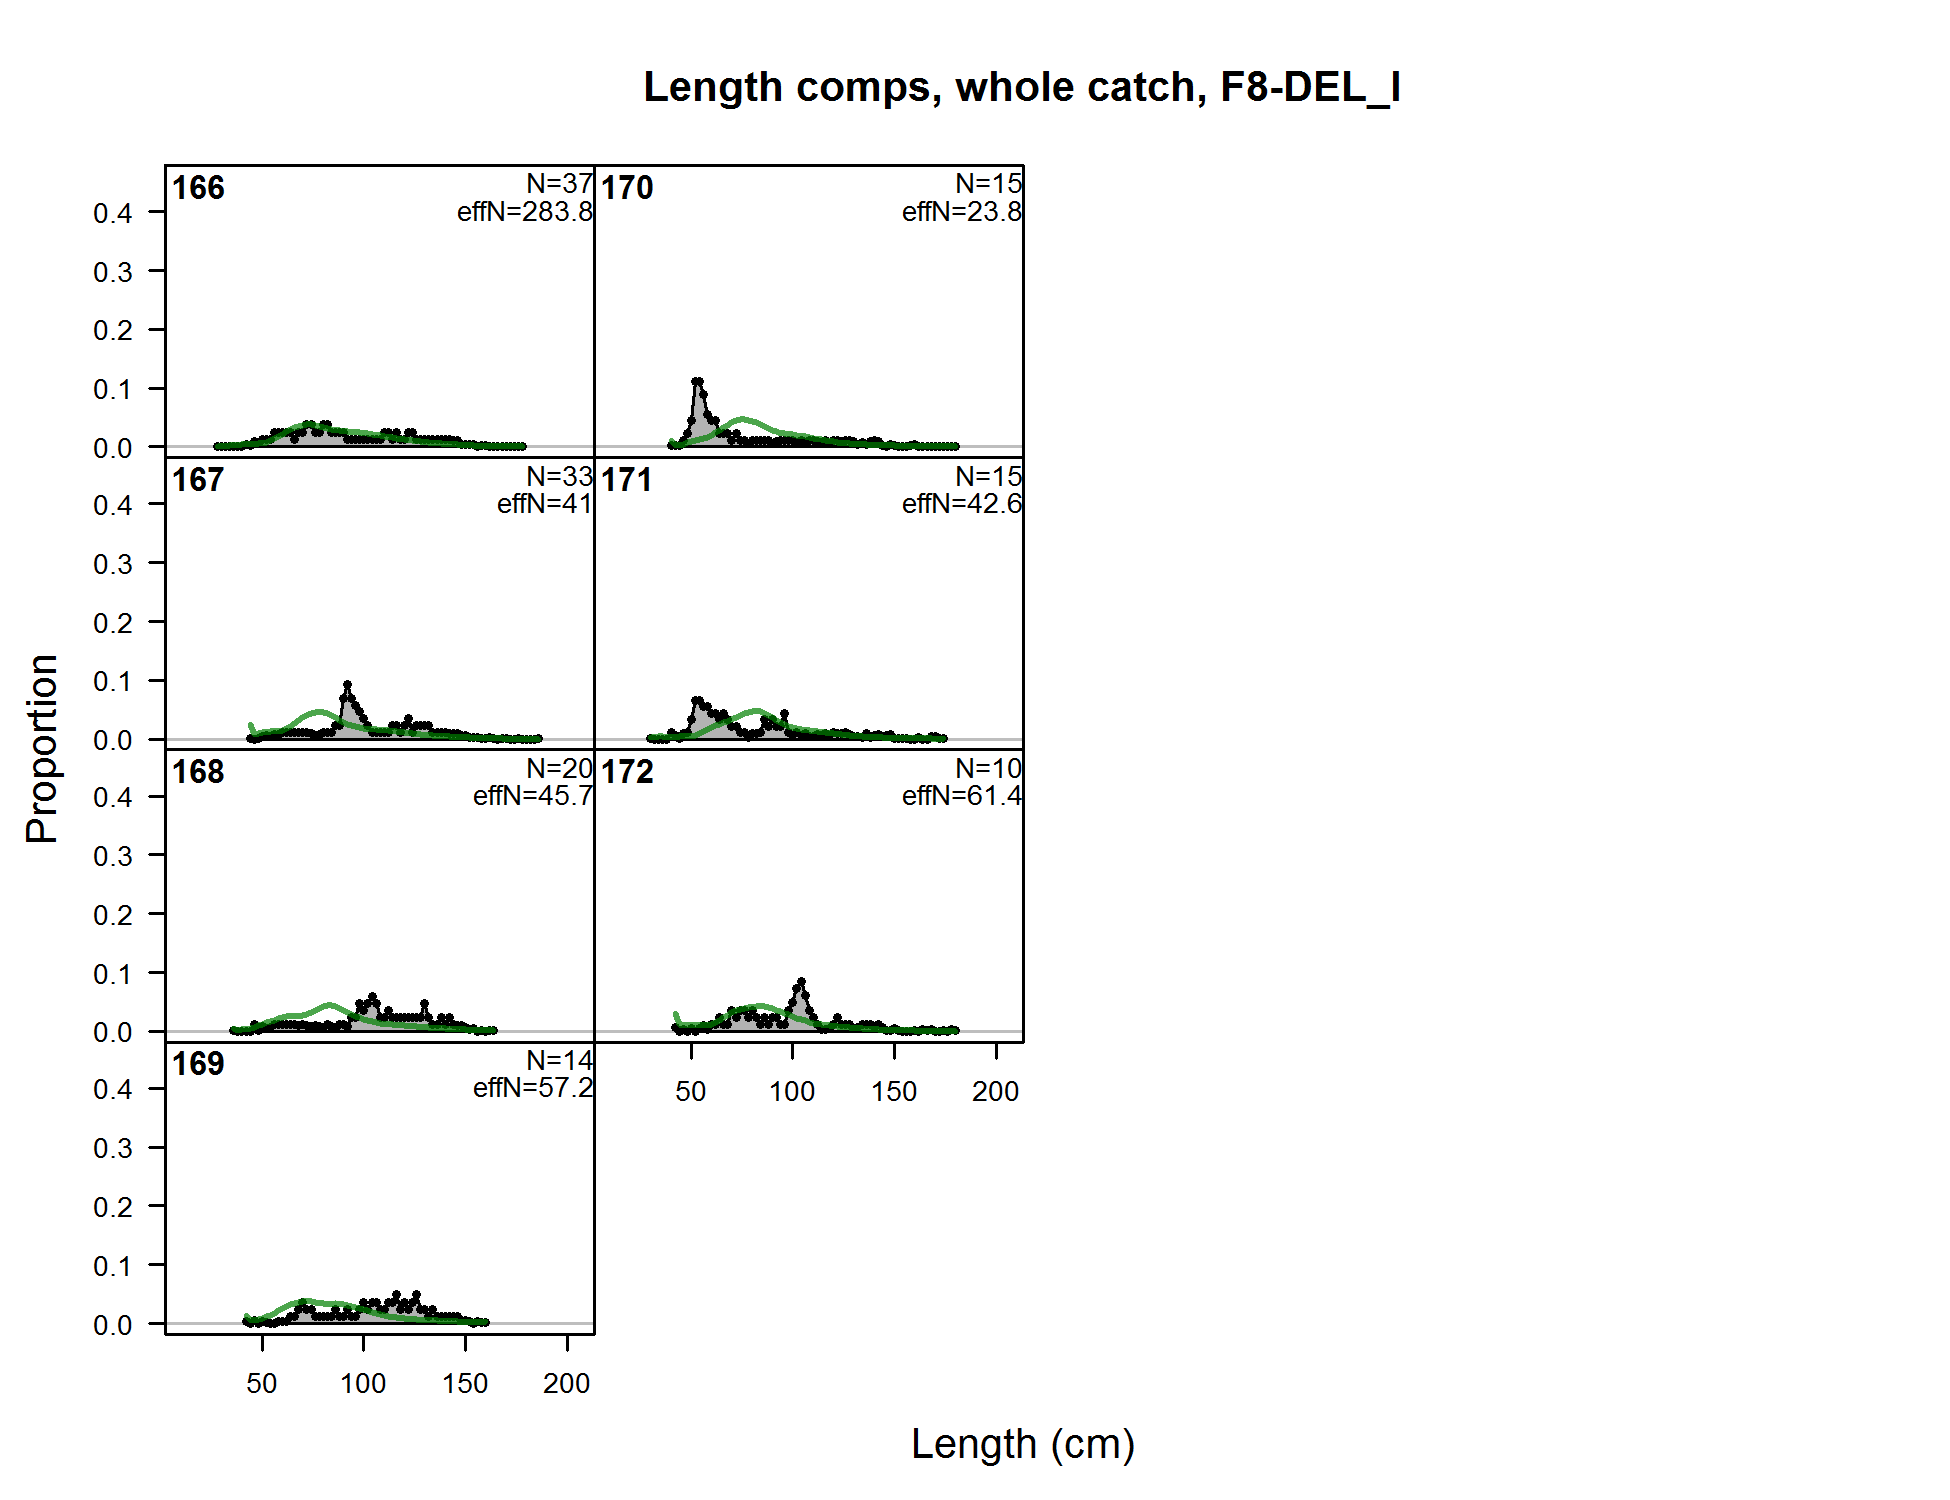
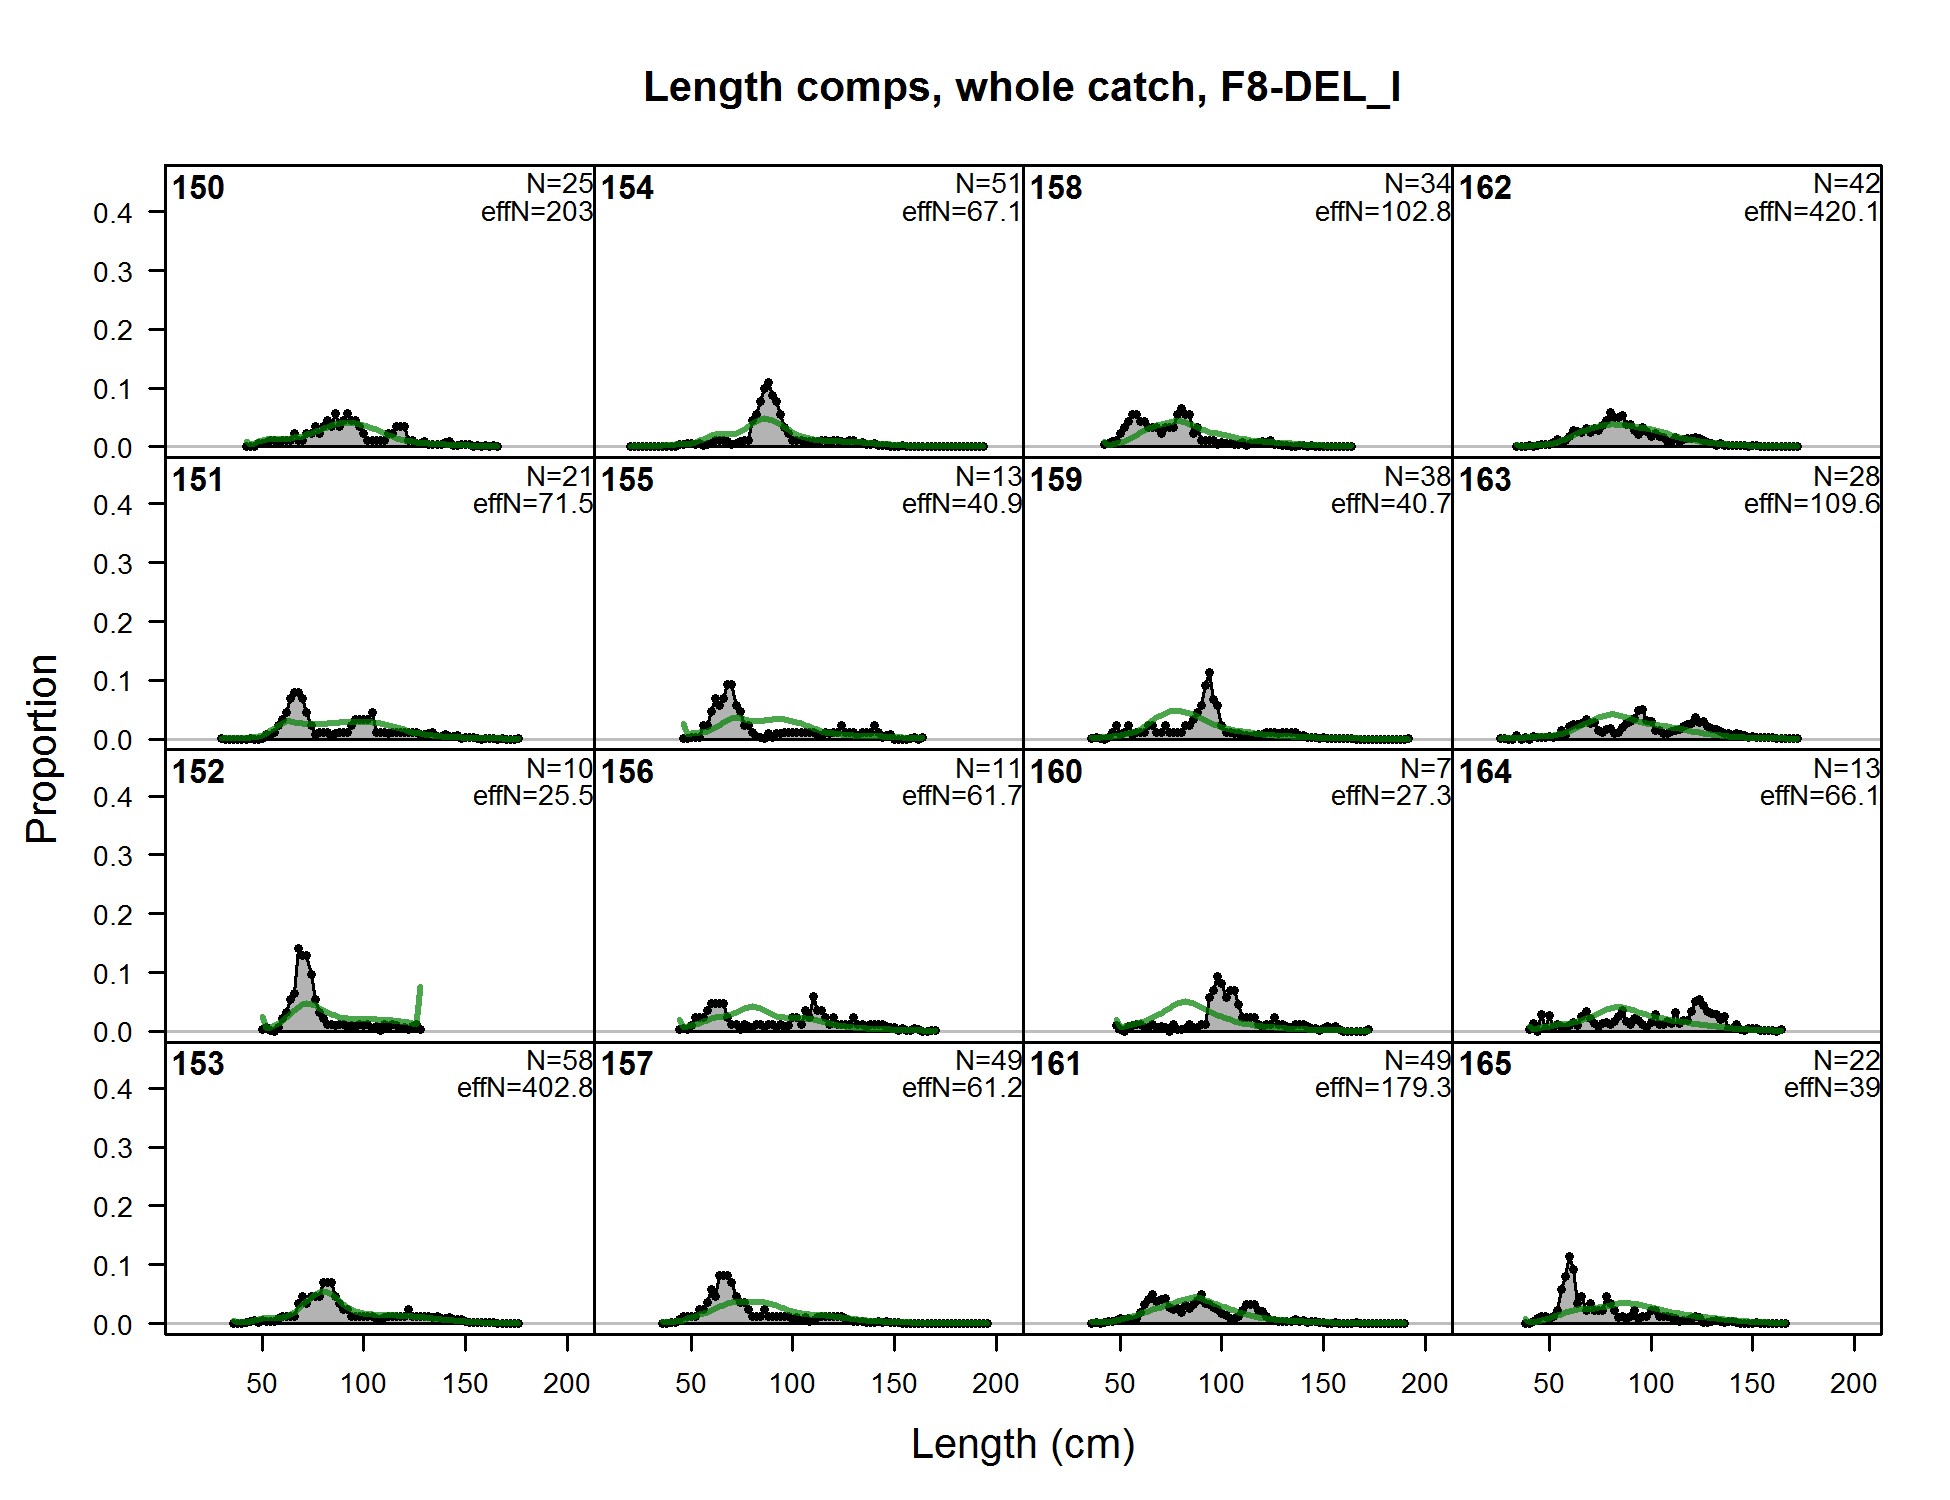
Length comps, whole catch, F8-DEL_I (plot 1 of 11) (plot 2 of 11) (plot 3 of 11) (plot 4 of 11) (plot 5 of 11) (plot 6 of 11) (plot 7 of 11) (plot 8 of 11) (plot 9 of 11) (plot 10 of 11) (plot 11 of 11)
file: comp_lenfit_flt8mkt0_page11.png
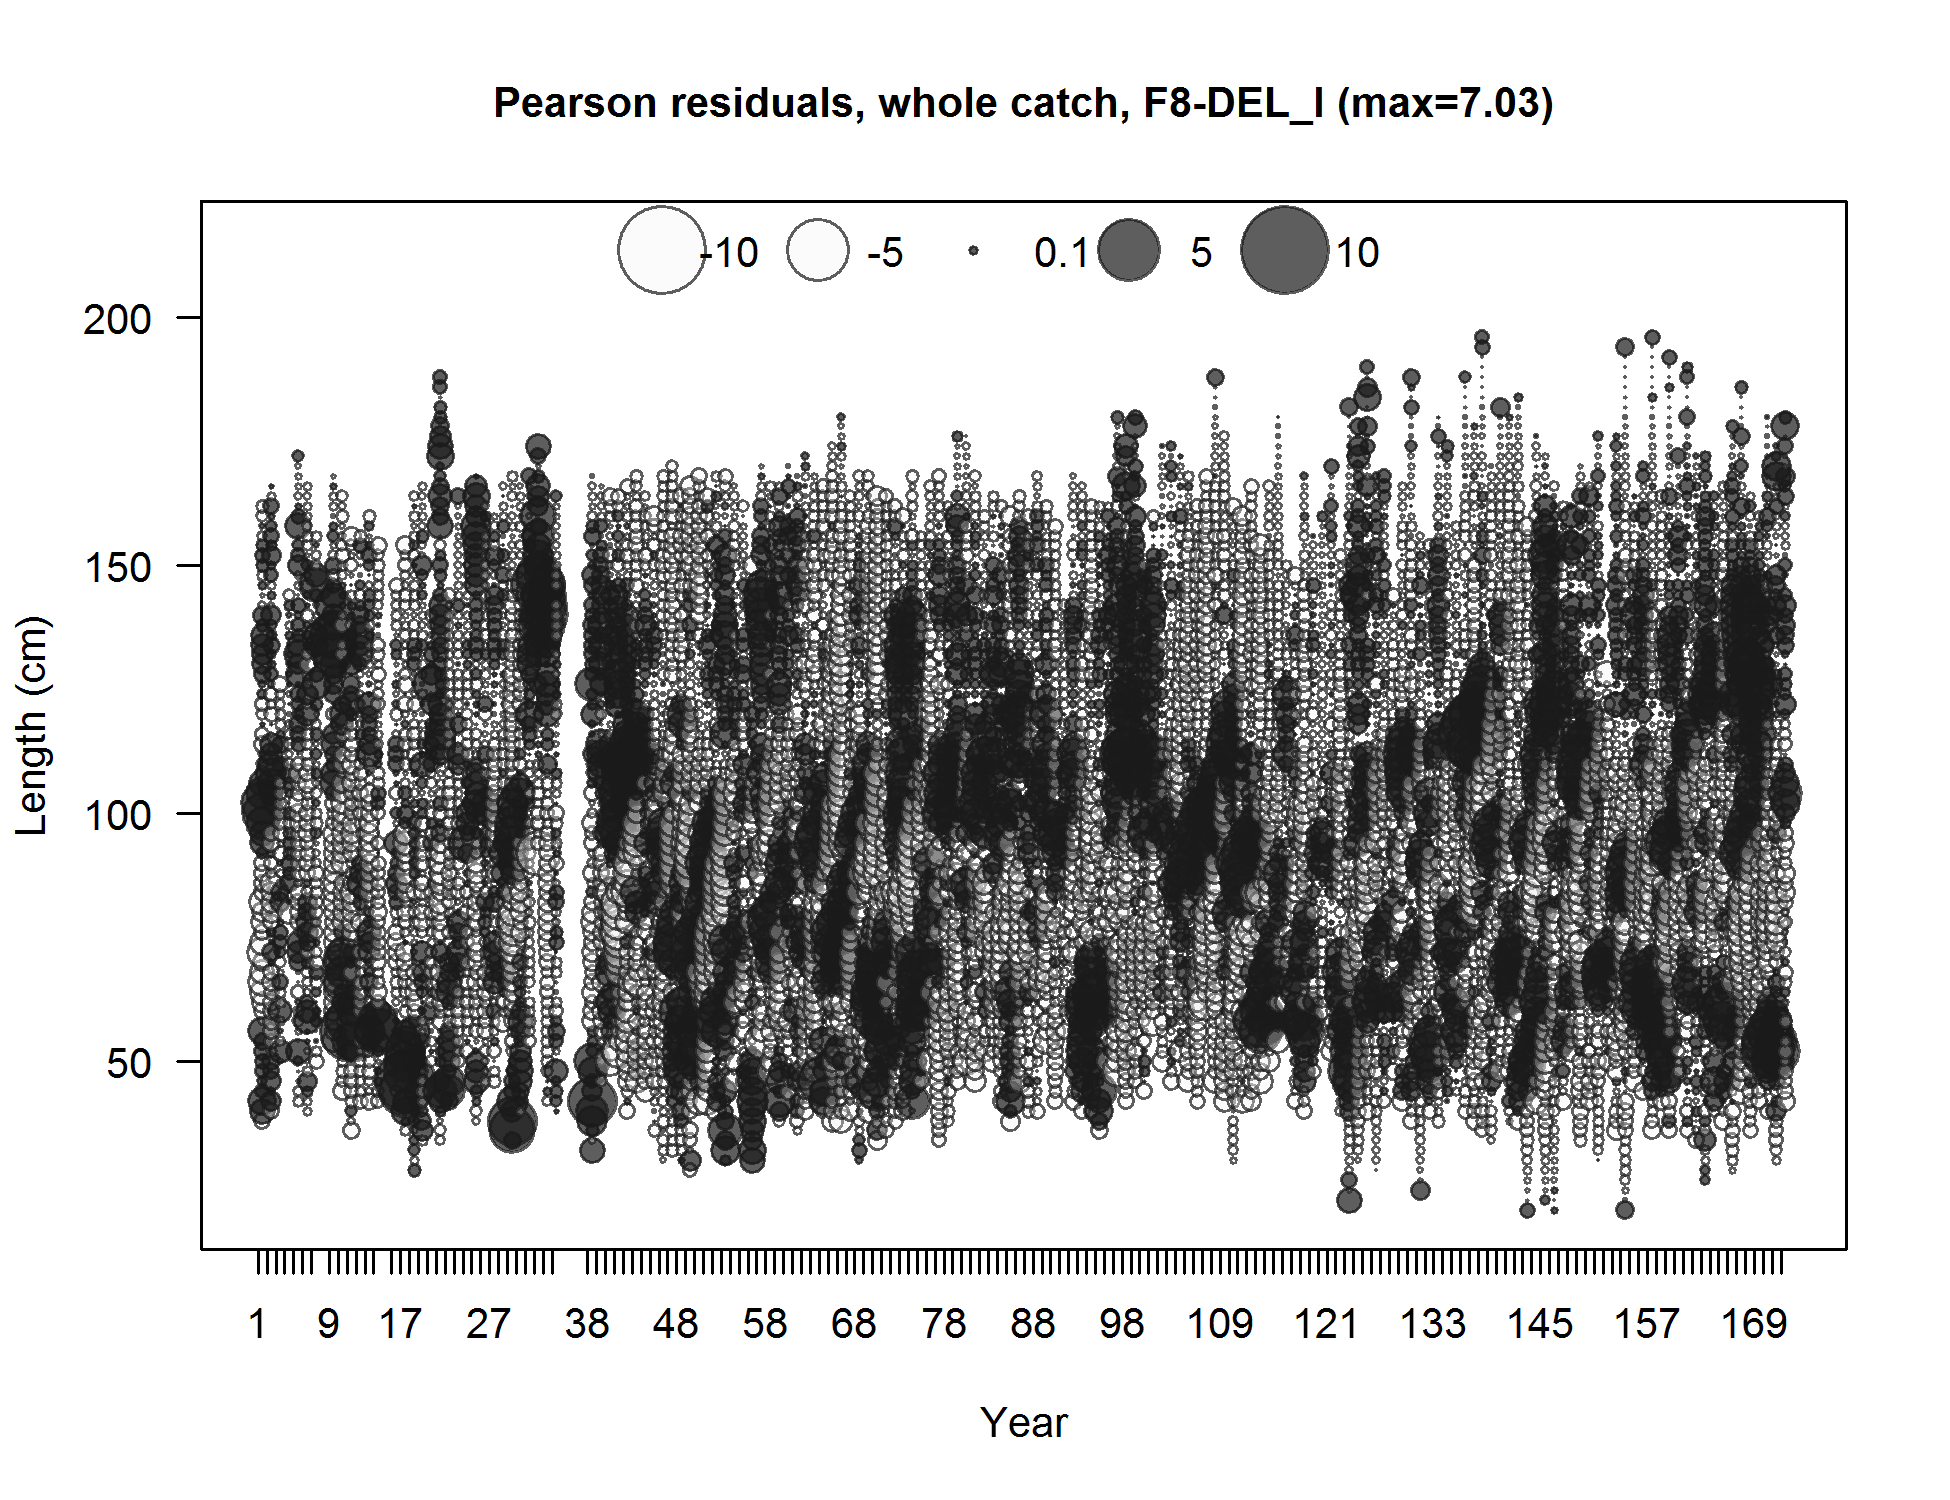
Pearson residuals, whole catch, F8-DEL_I (max=7.03) (plot 11 of 11)
Closed bubbles are positive residuals (observed > expected) and open bubbles are negative residuals (observed < expected).
file: comp_lenfit_residsflt8mkt0_page11.png
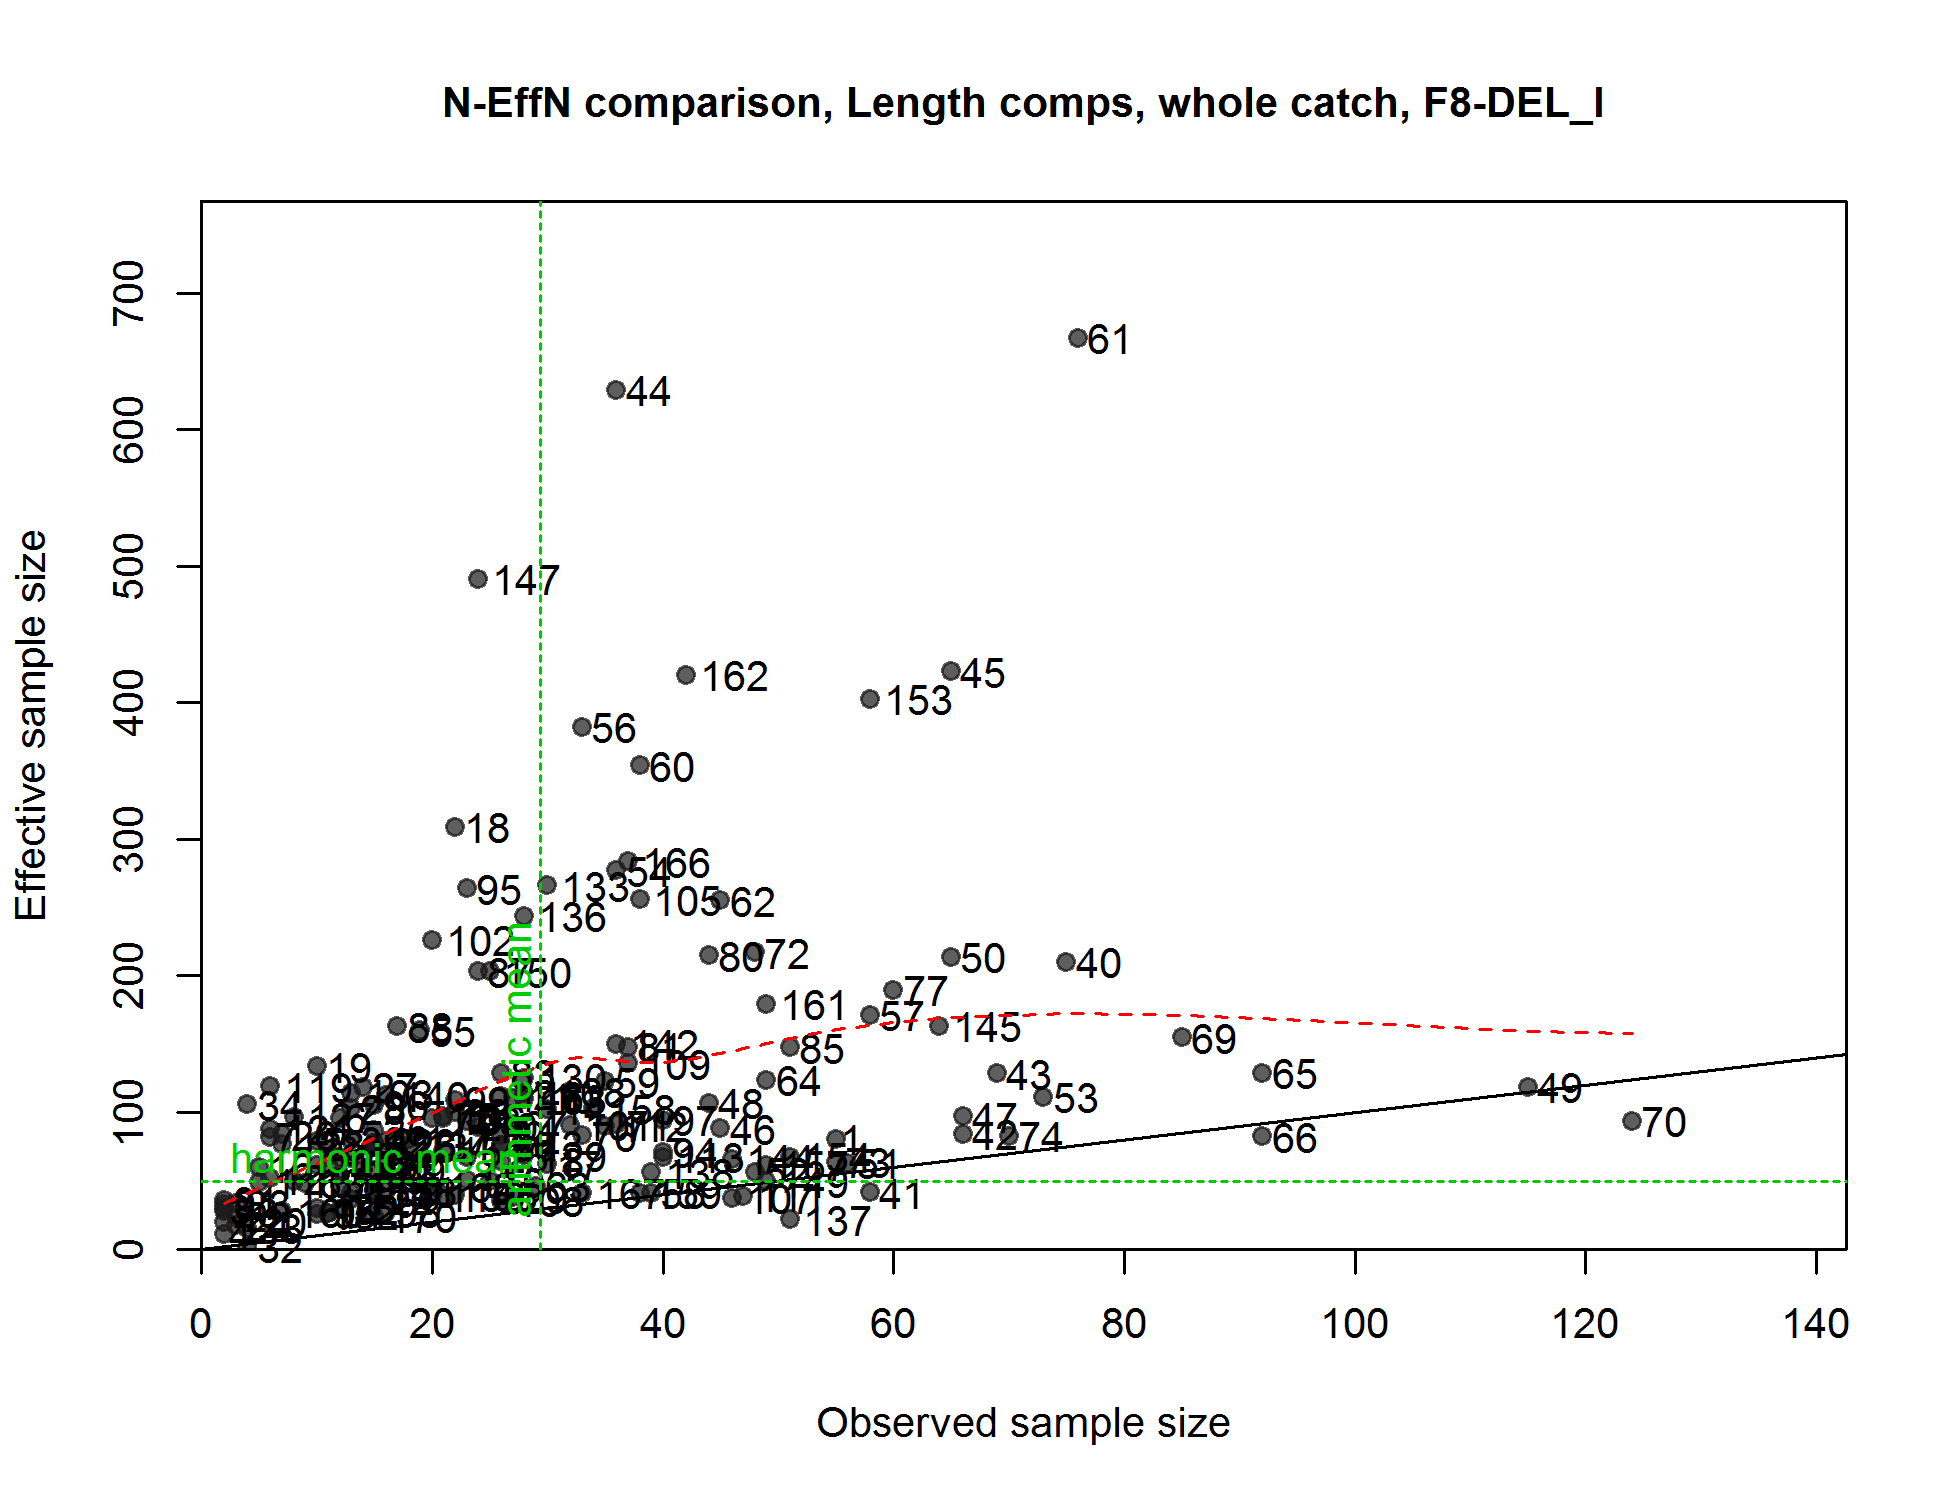
N-EffN comparison, Length comps, whole catch, F8-DEL_I
file: comp_lenfit_sampsize_flt8mkt0.png
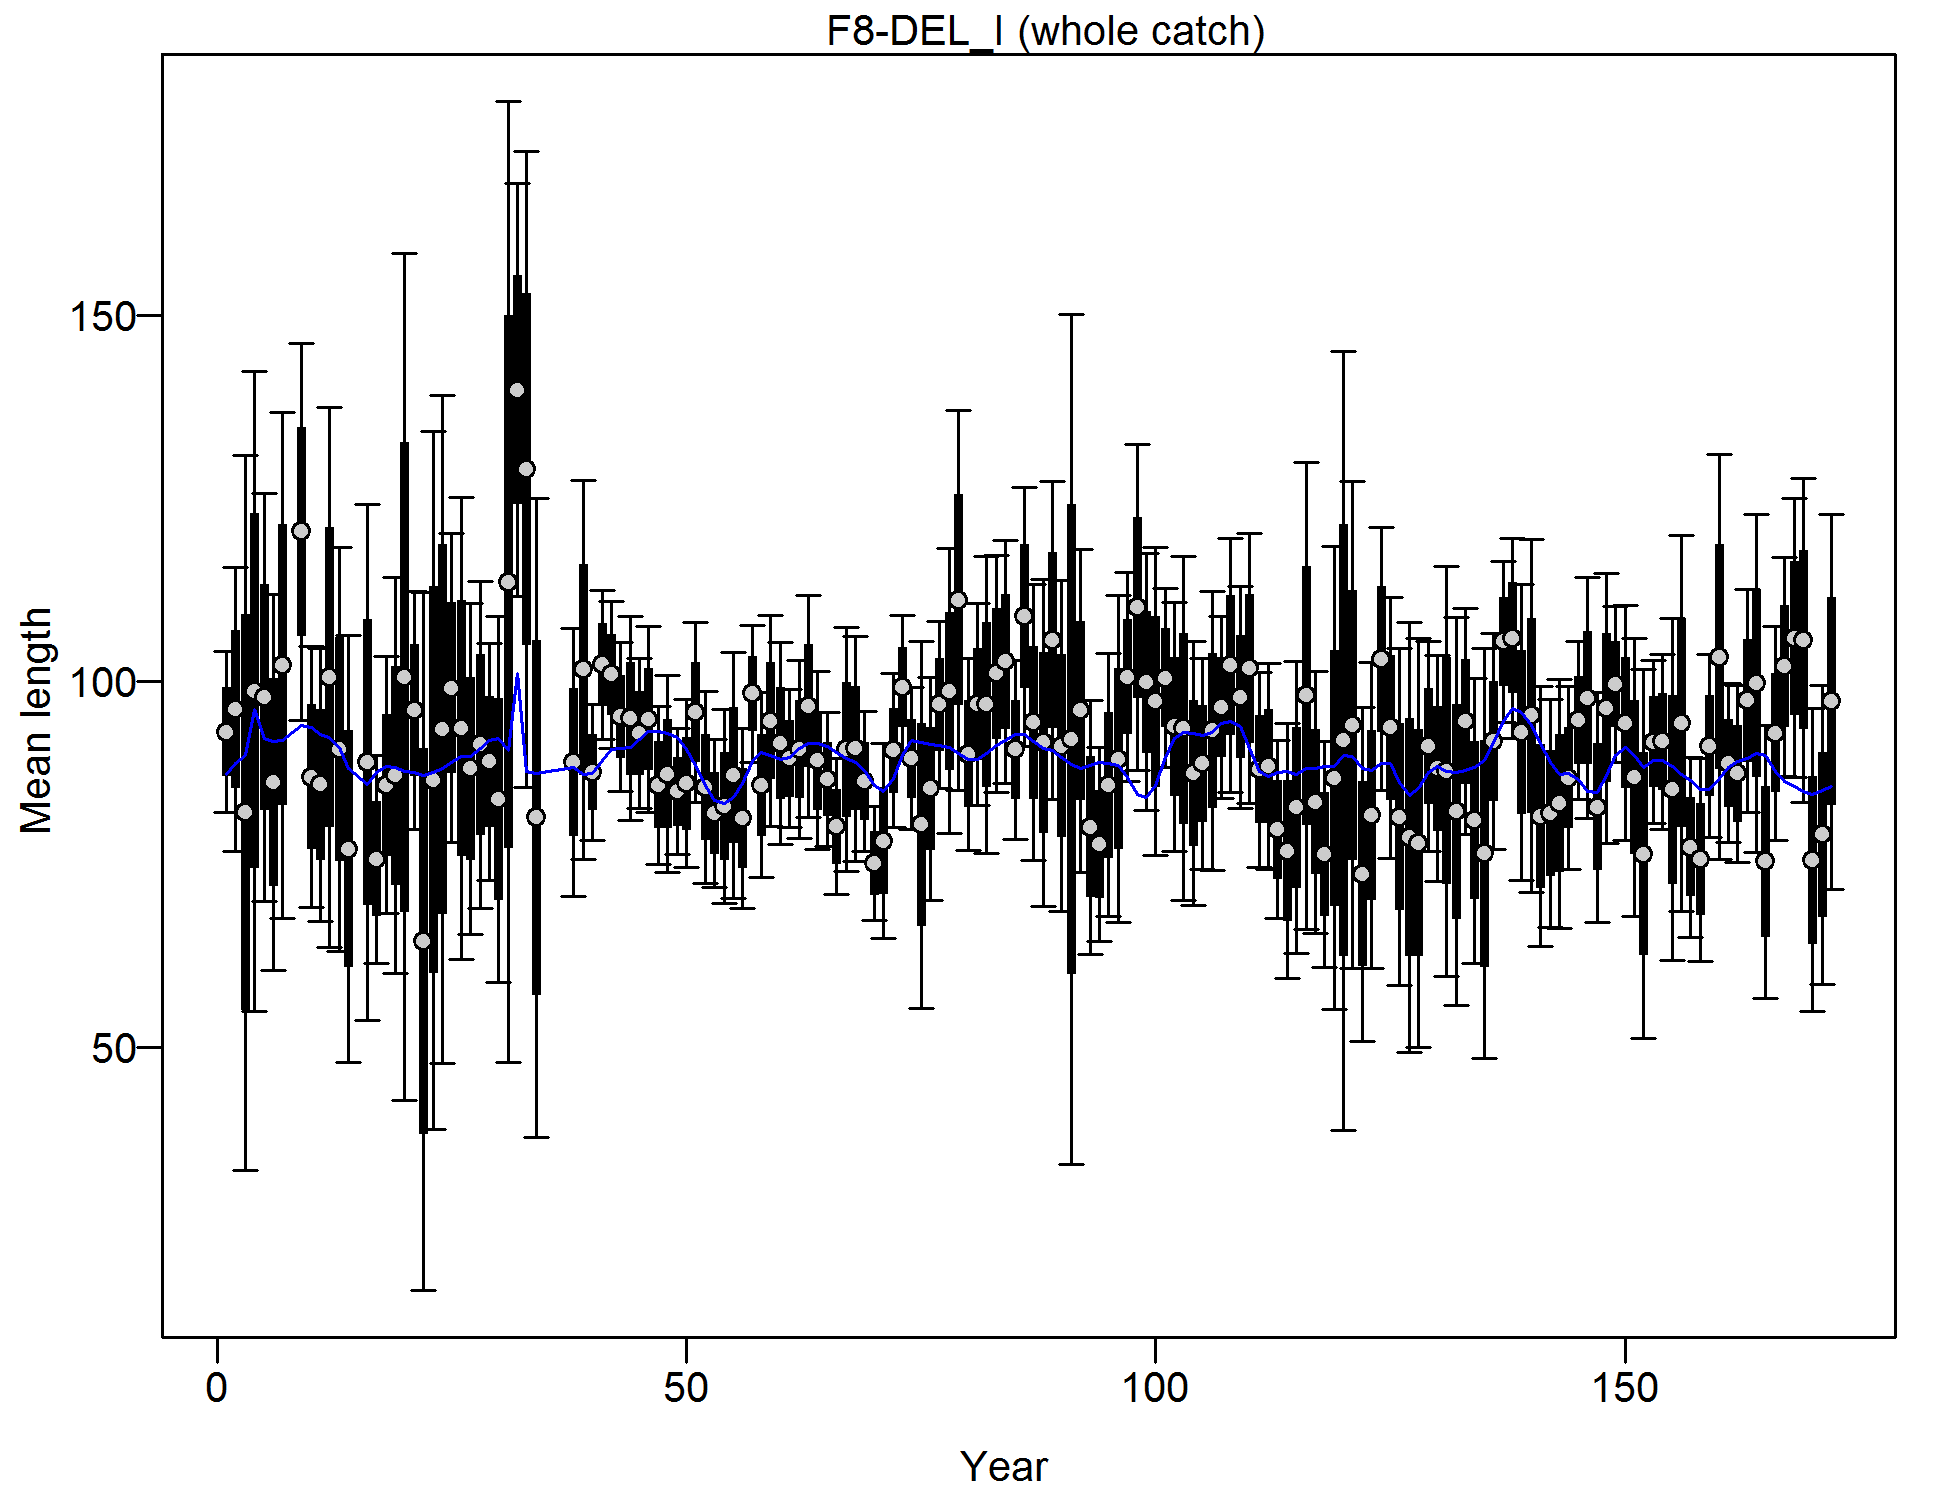
Mean length for F8-DEL_I with 95% confidence intervals based on current samples sizes.
Francis data weighting method TA1.8: thinner intervals (with capped ends) show result of further adjusting sample sizes based on suggested multiplier (with 95% interval) for len data from F8-DEL_I:
0.3069 (0.2553-0.3855)
For more info, see
Francis, R.I.C.C. (2011). Data weighting in statistical fisheries stock assessment models. Can. J. Fish. Aquat. Sci. 68: 1124-1138.
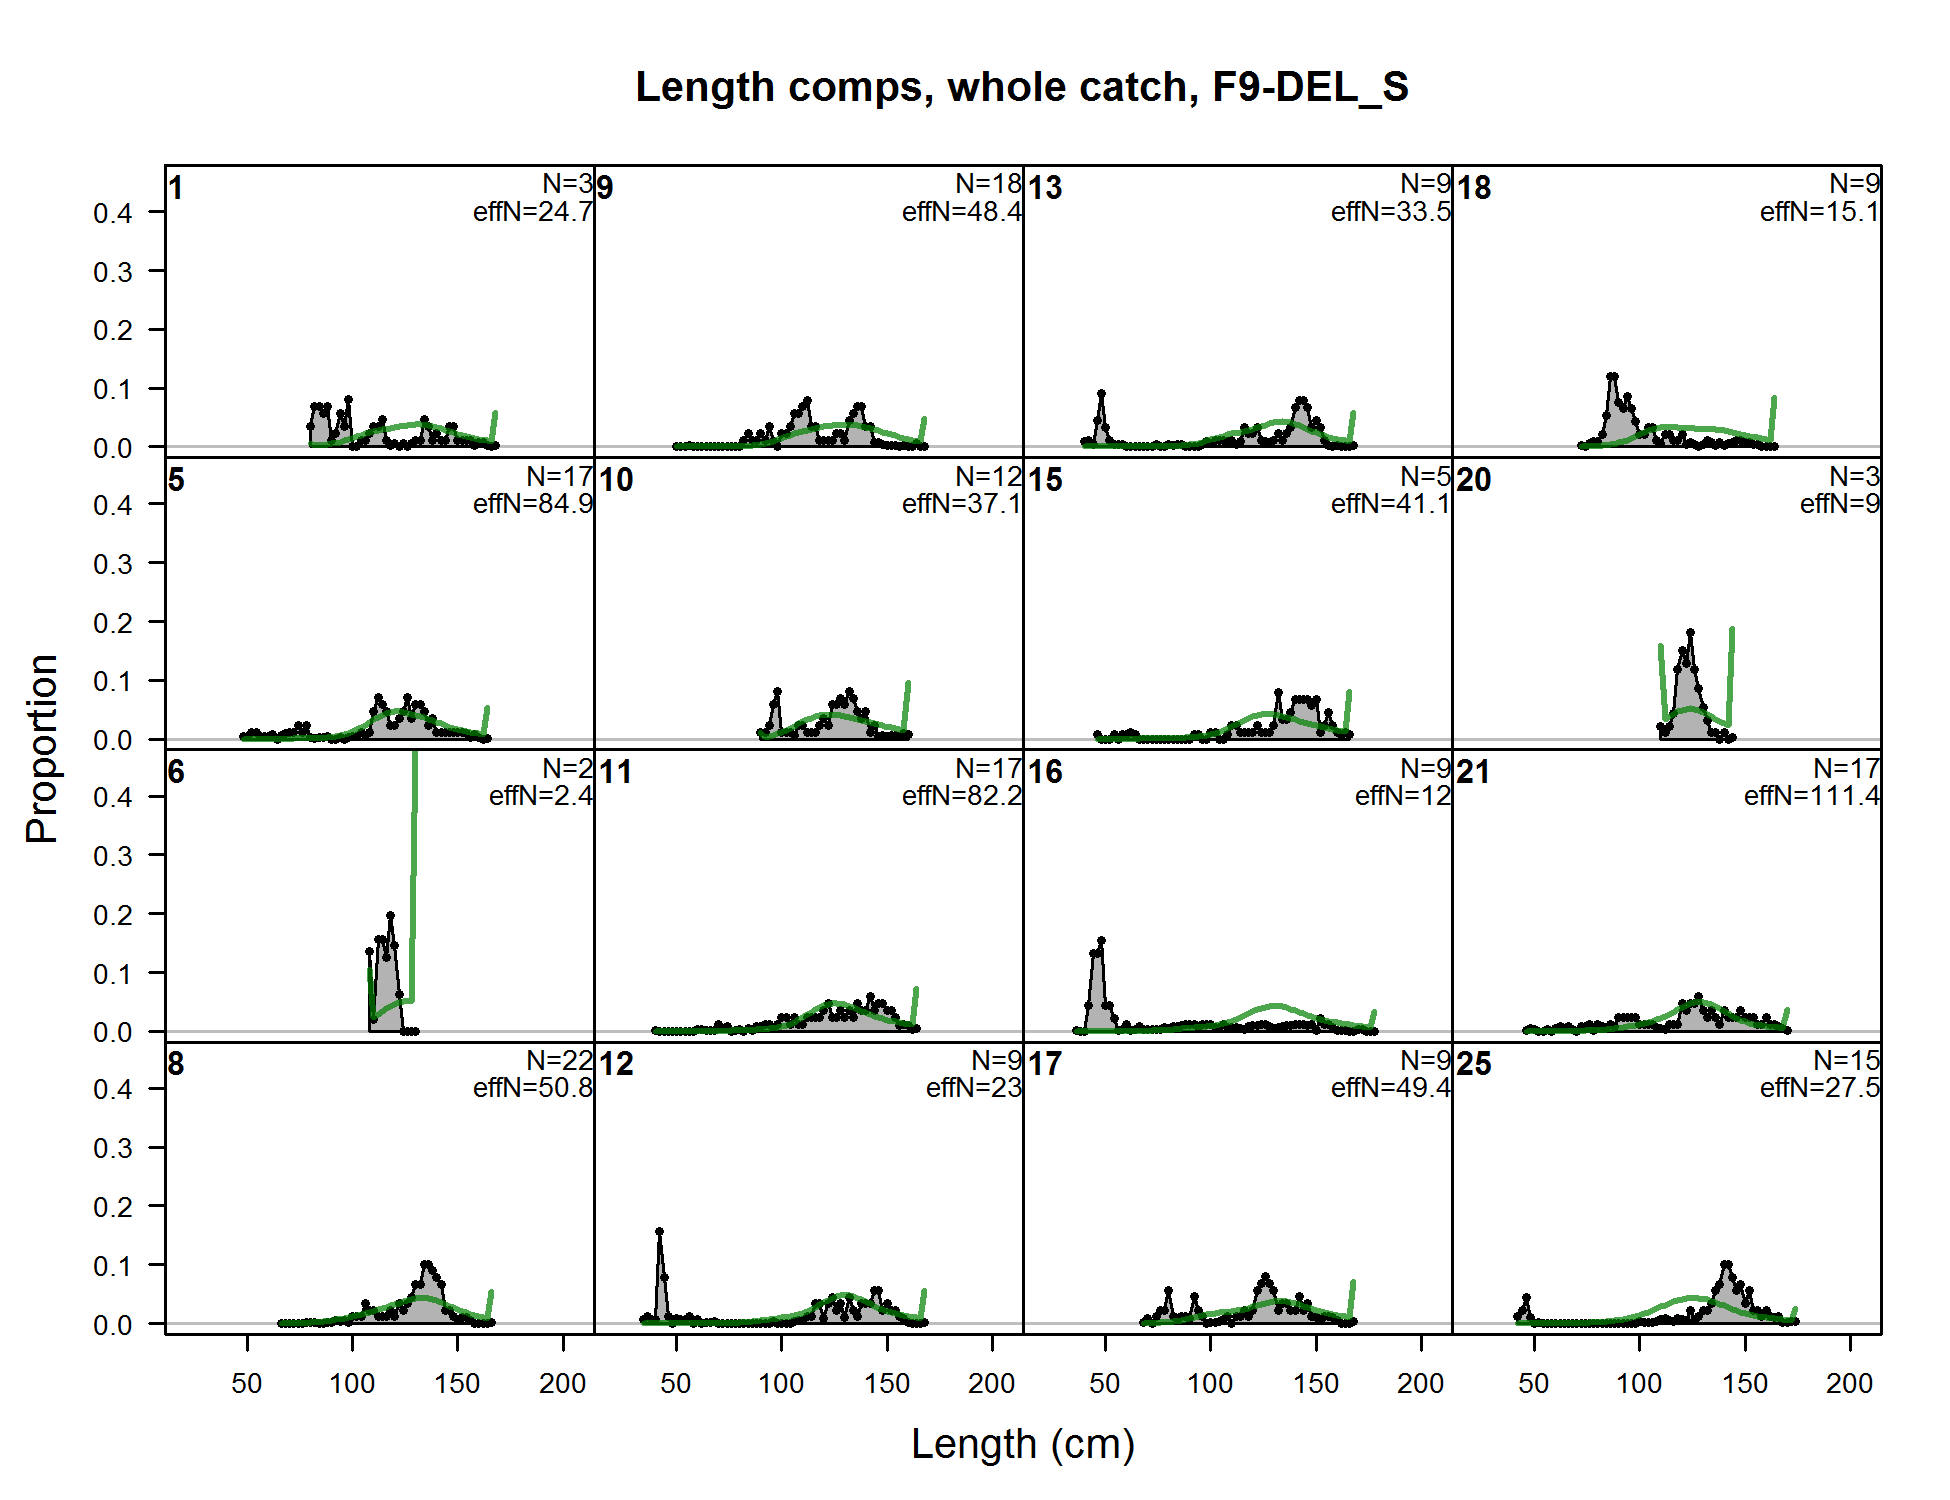
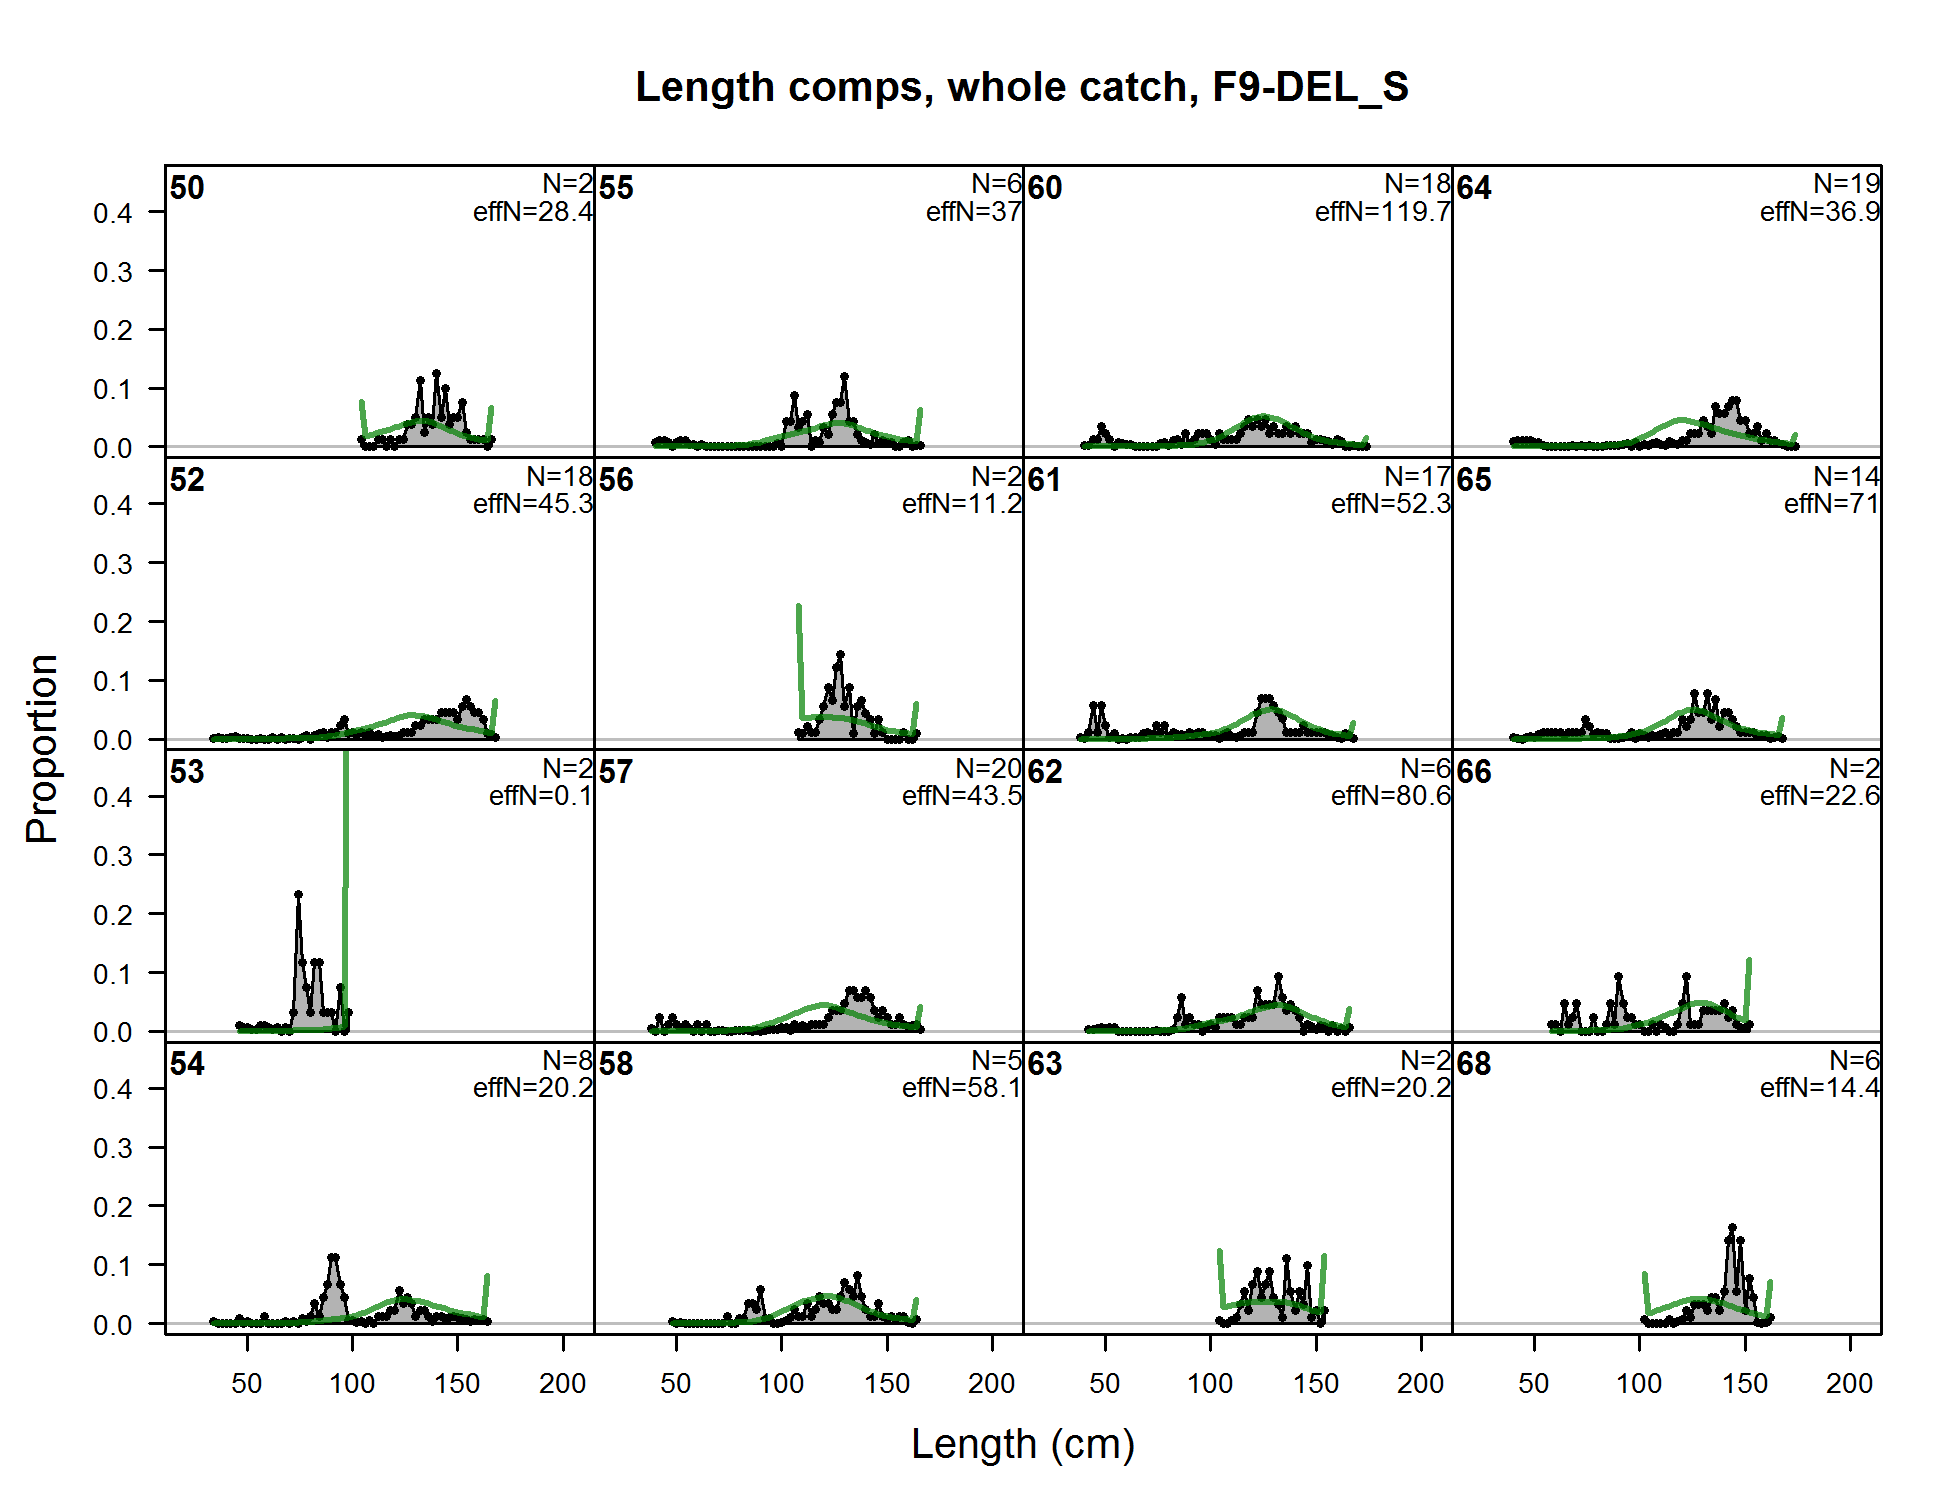
Length comps, whole catch, F9-DEL_S (plot 1 of 7)
file: comp_lenfit_flt9mkt0_page1.png
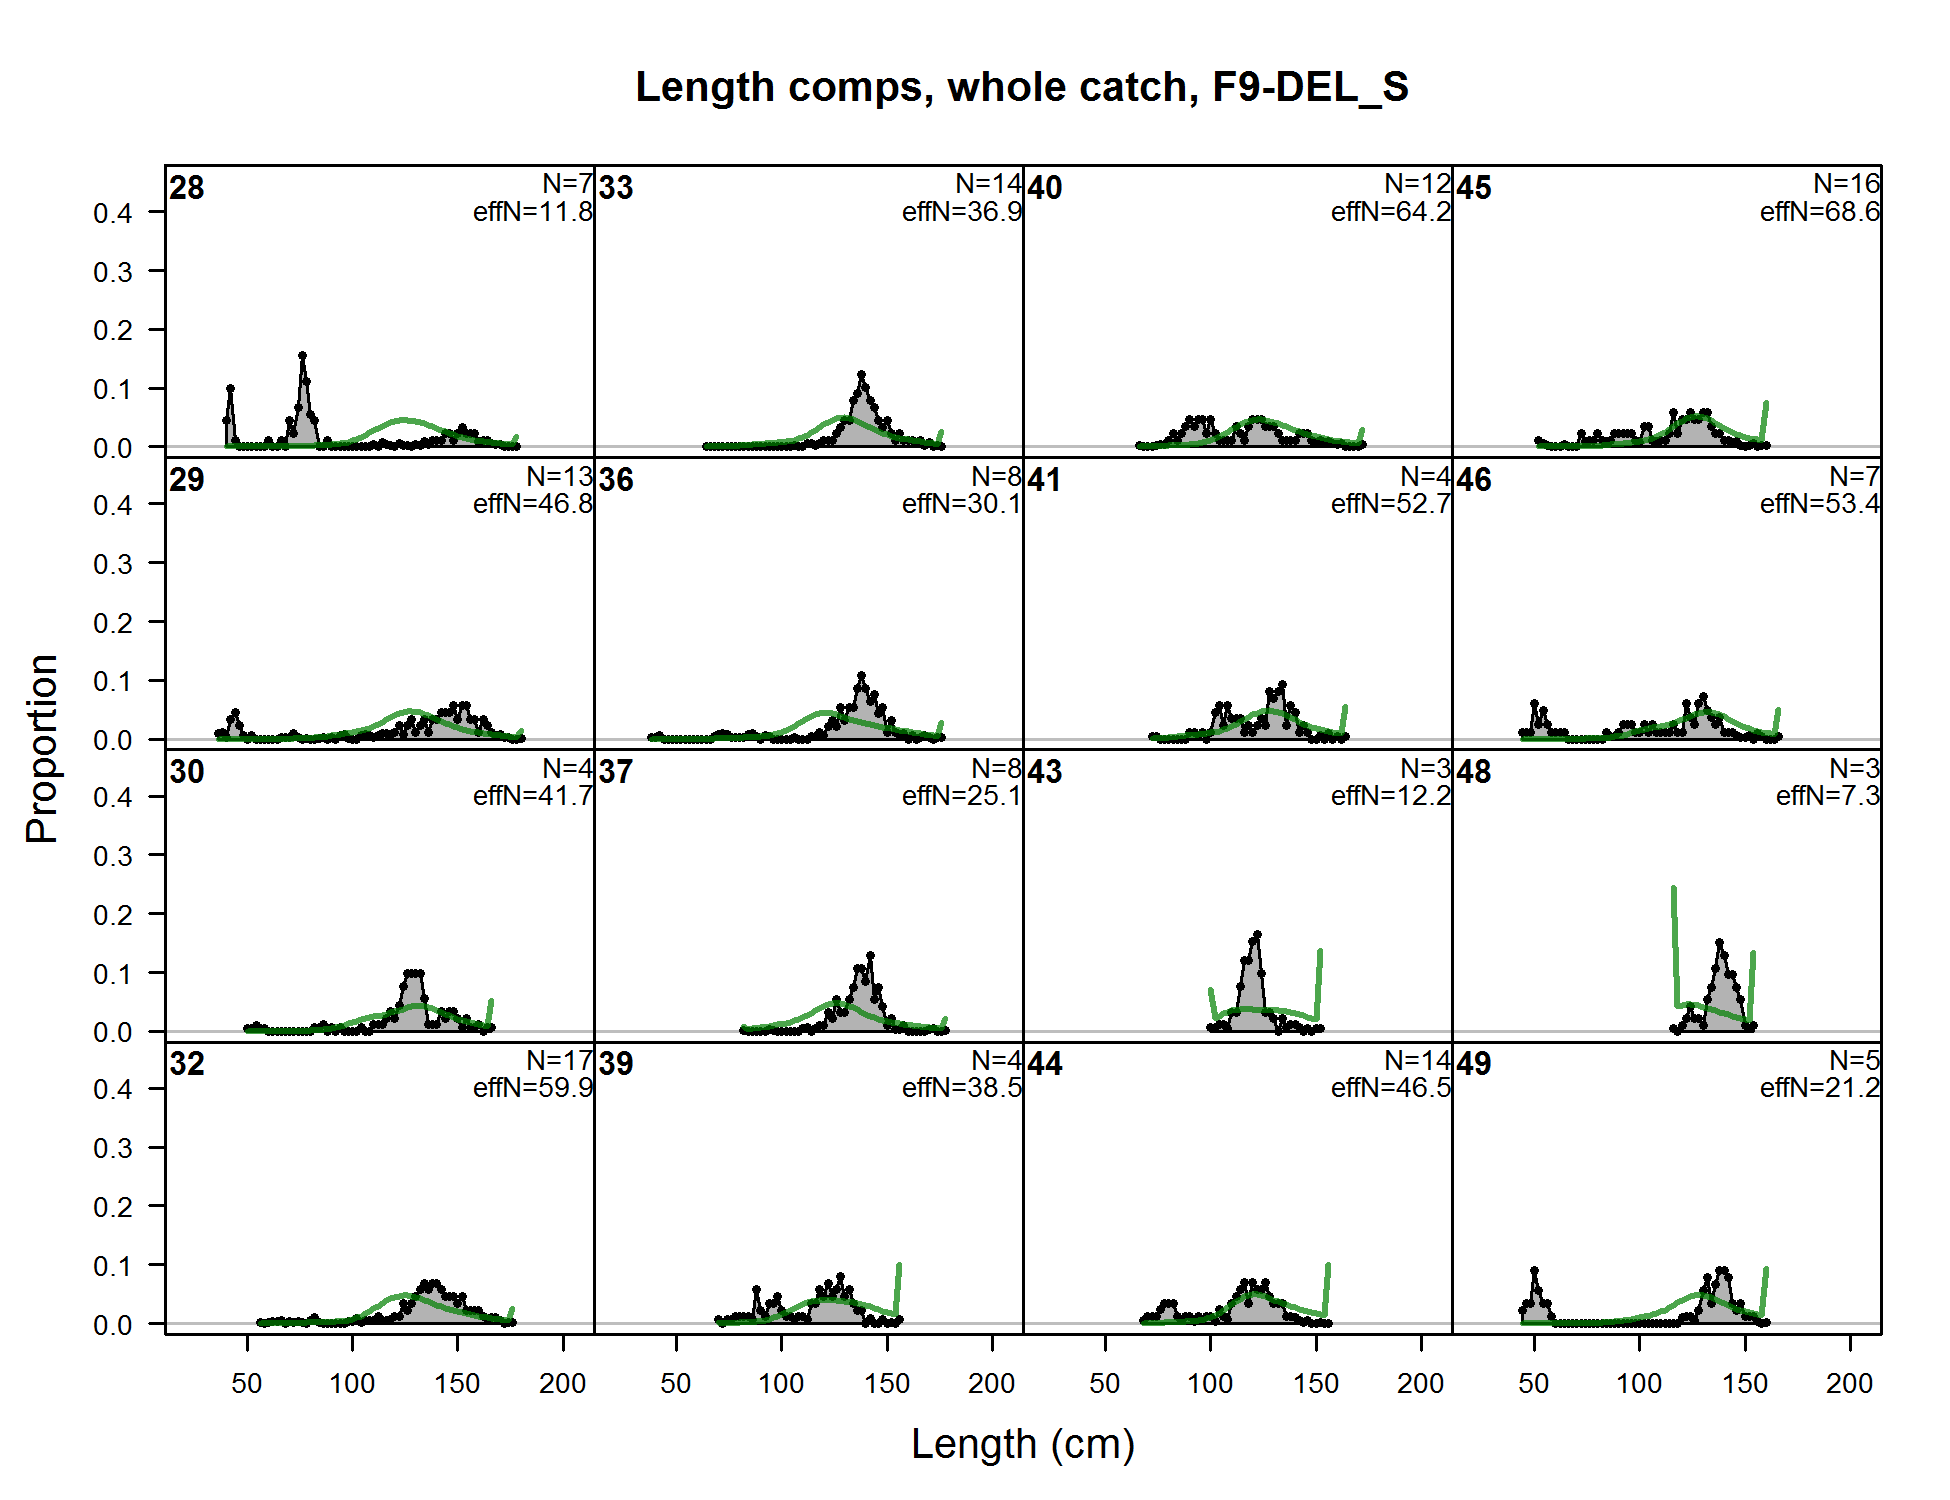
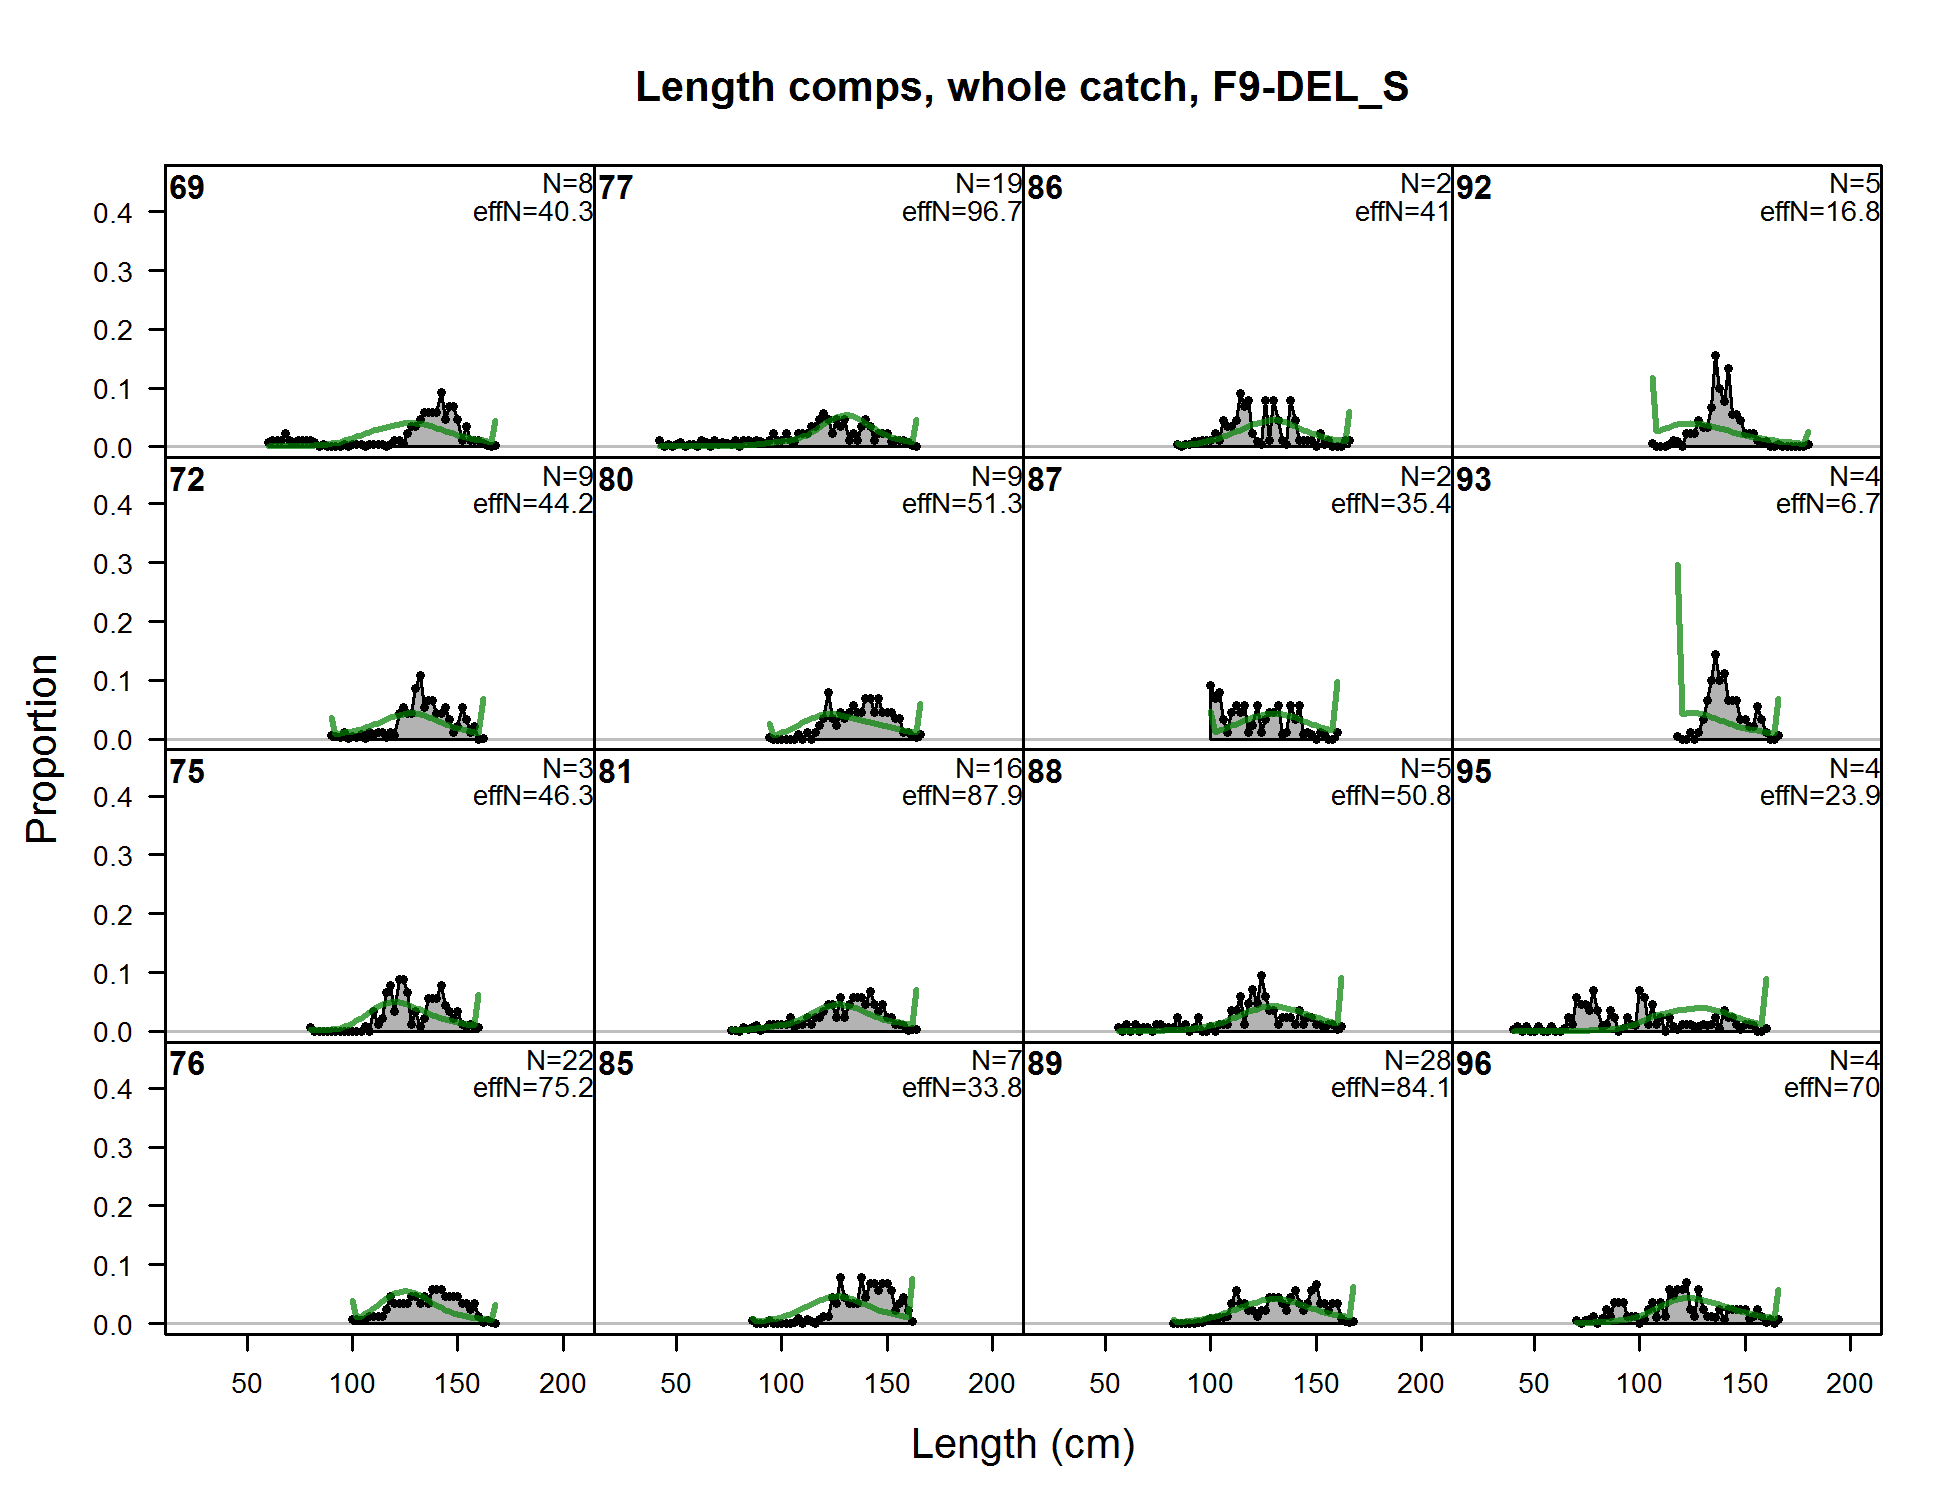
Length comps, whole catch, F9-DEL_S (plot 1 of 7) (plot 2 of 7)
file: comp_lenfit_flt9mkt0_page2.png
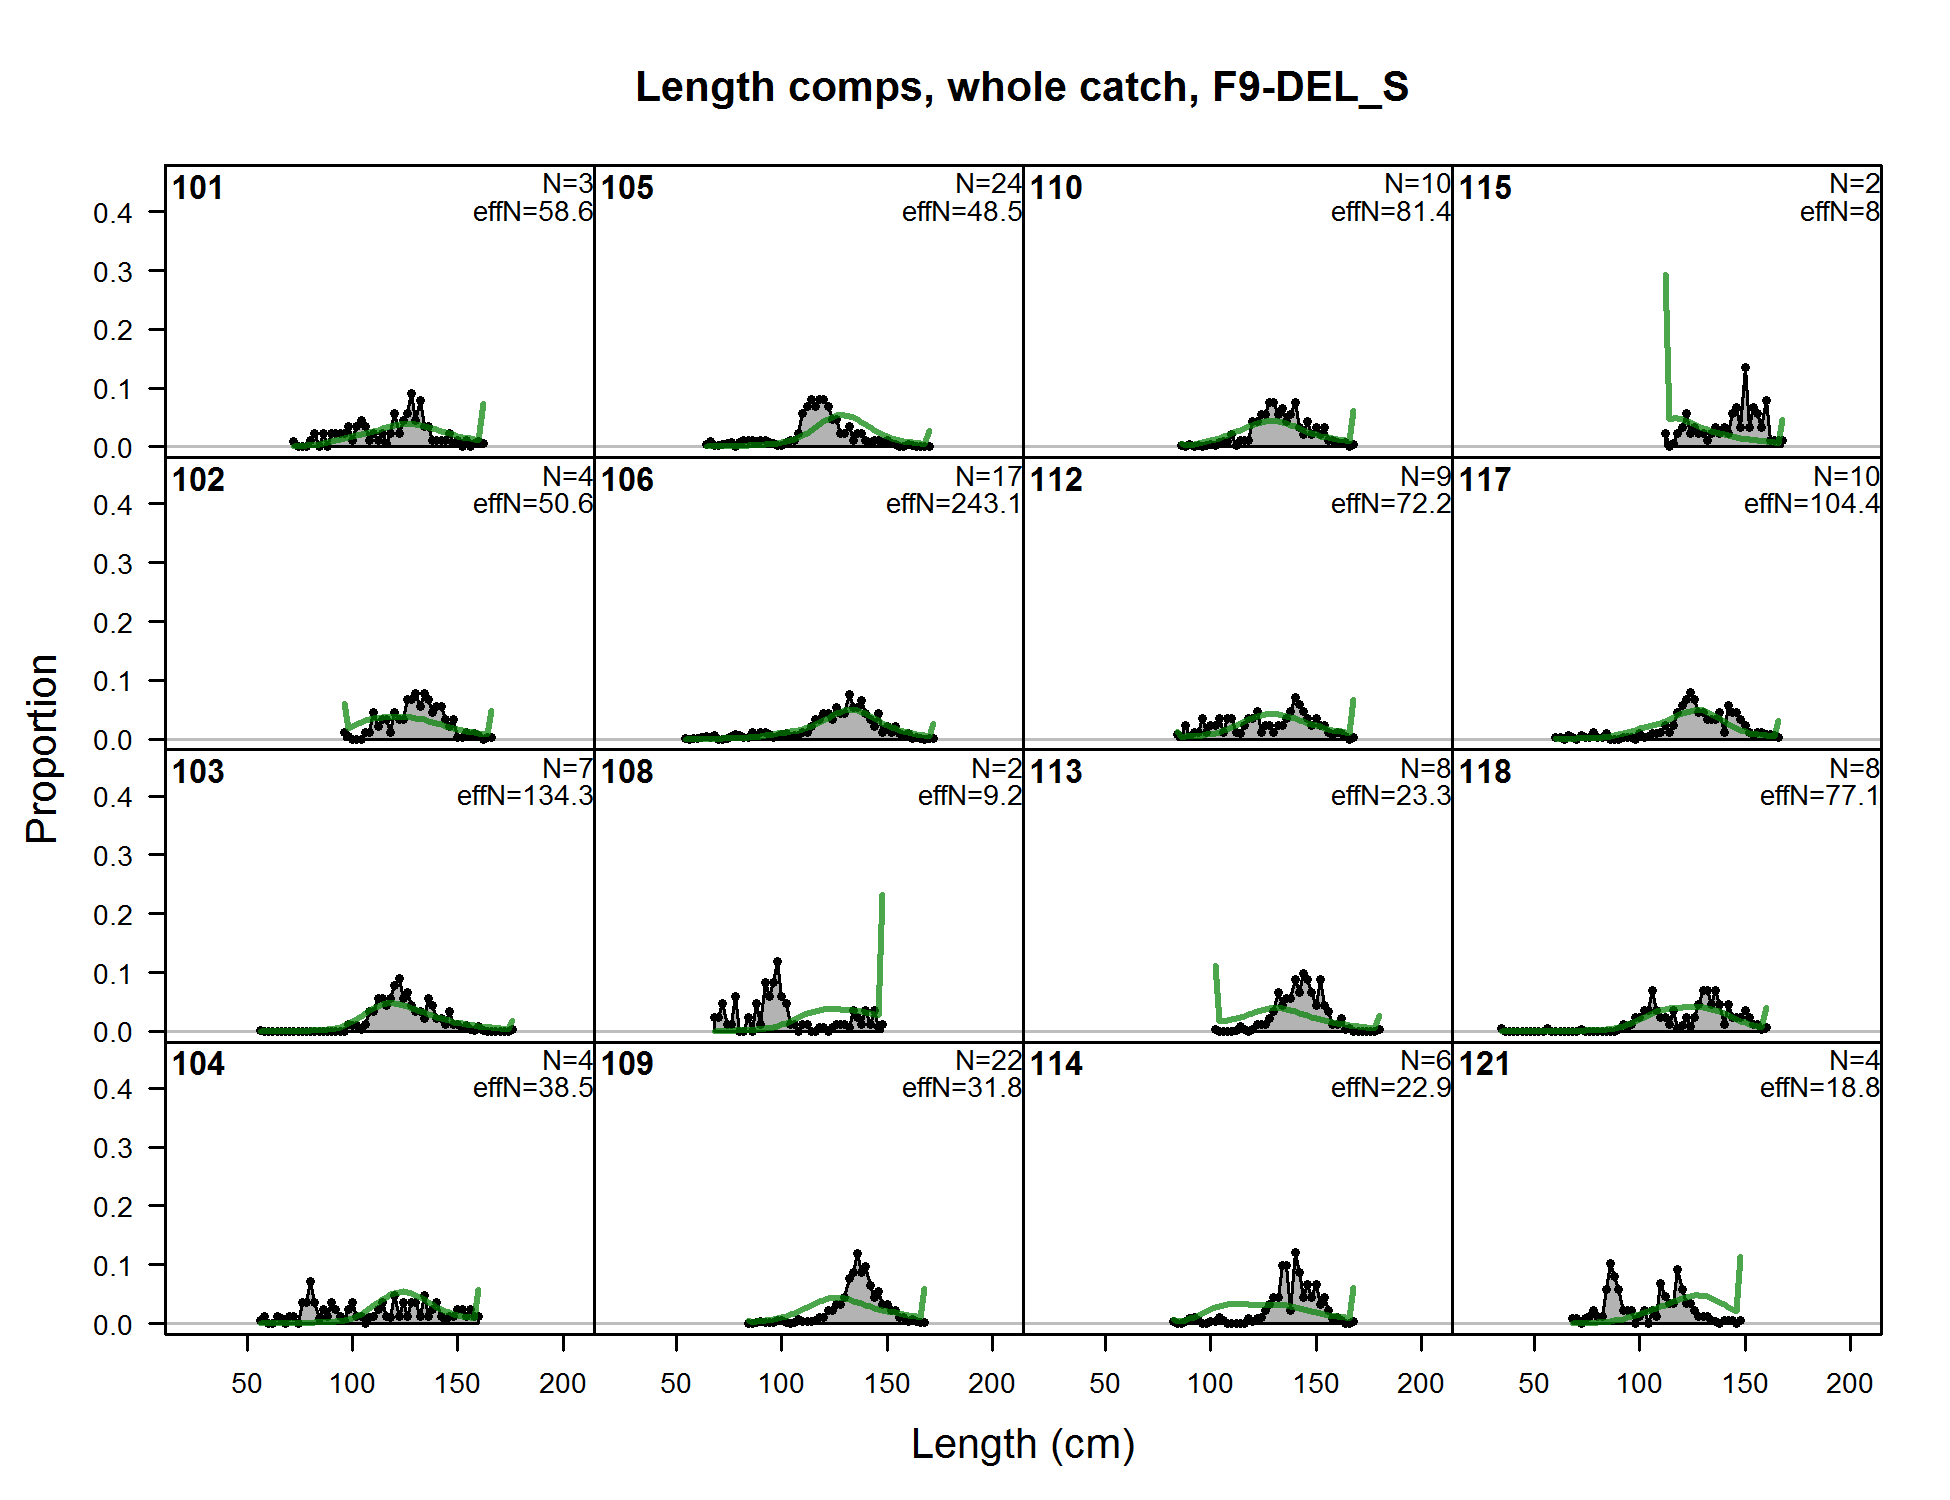
Length comps, whole catch, F9-DEL_S (plot 1 of 7) (plot 2 of 7) (plot 3 of 7)
file: comp_lenfit_flt9mkt0_page3.png
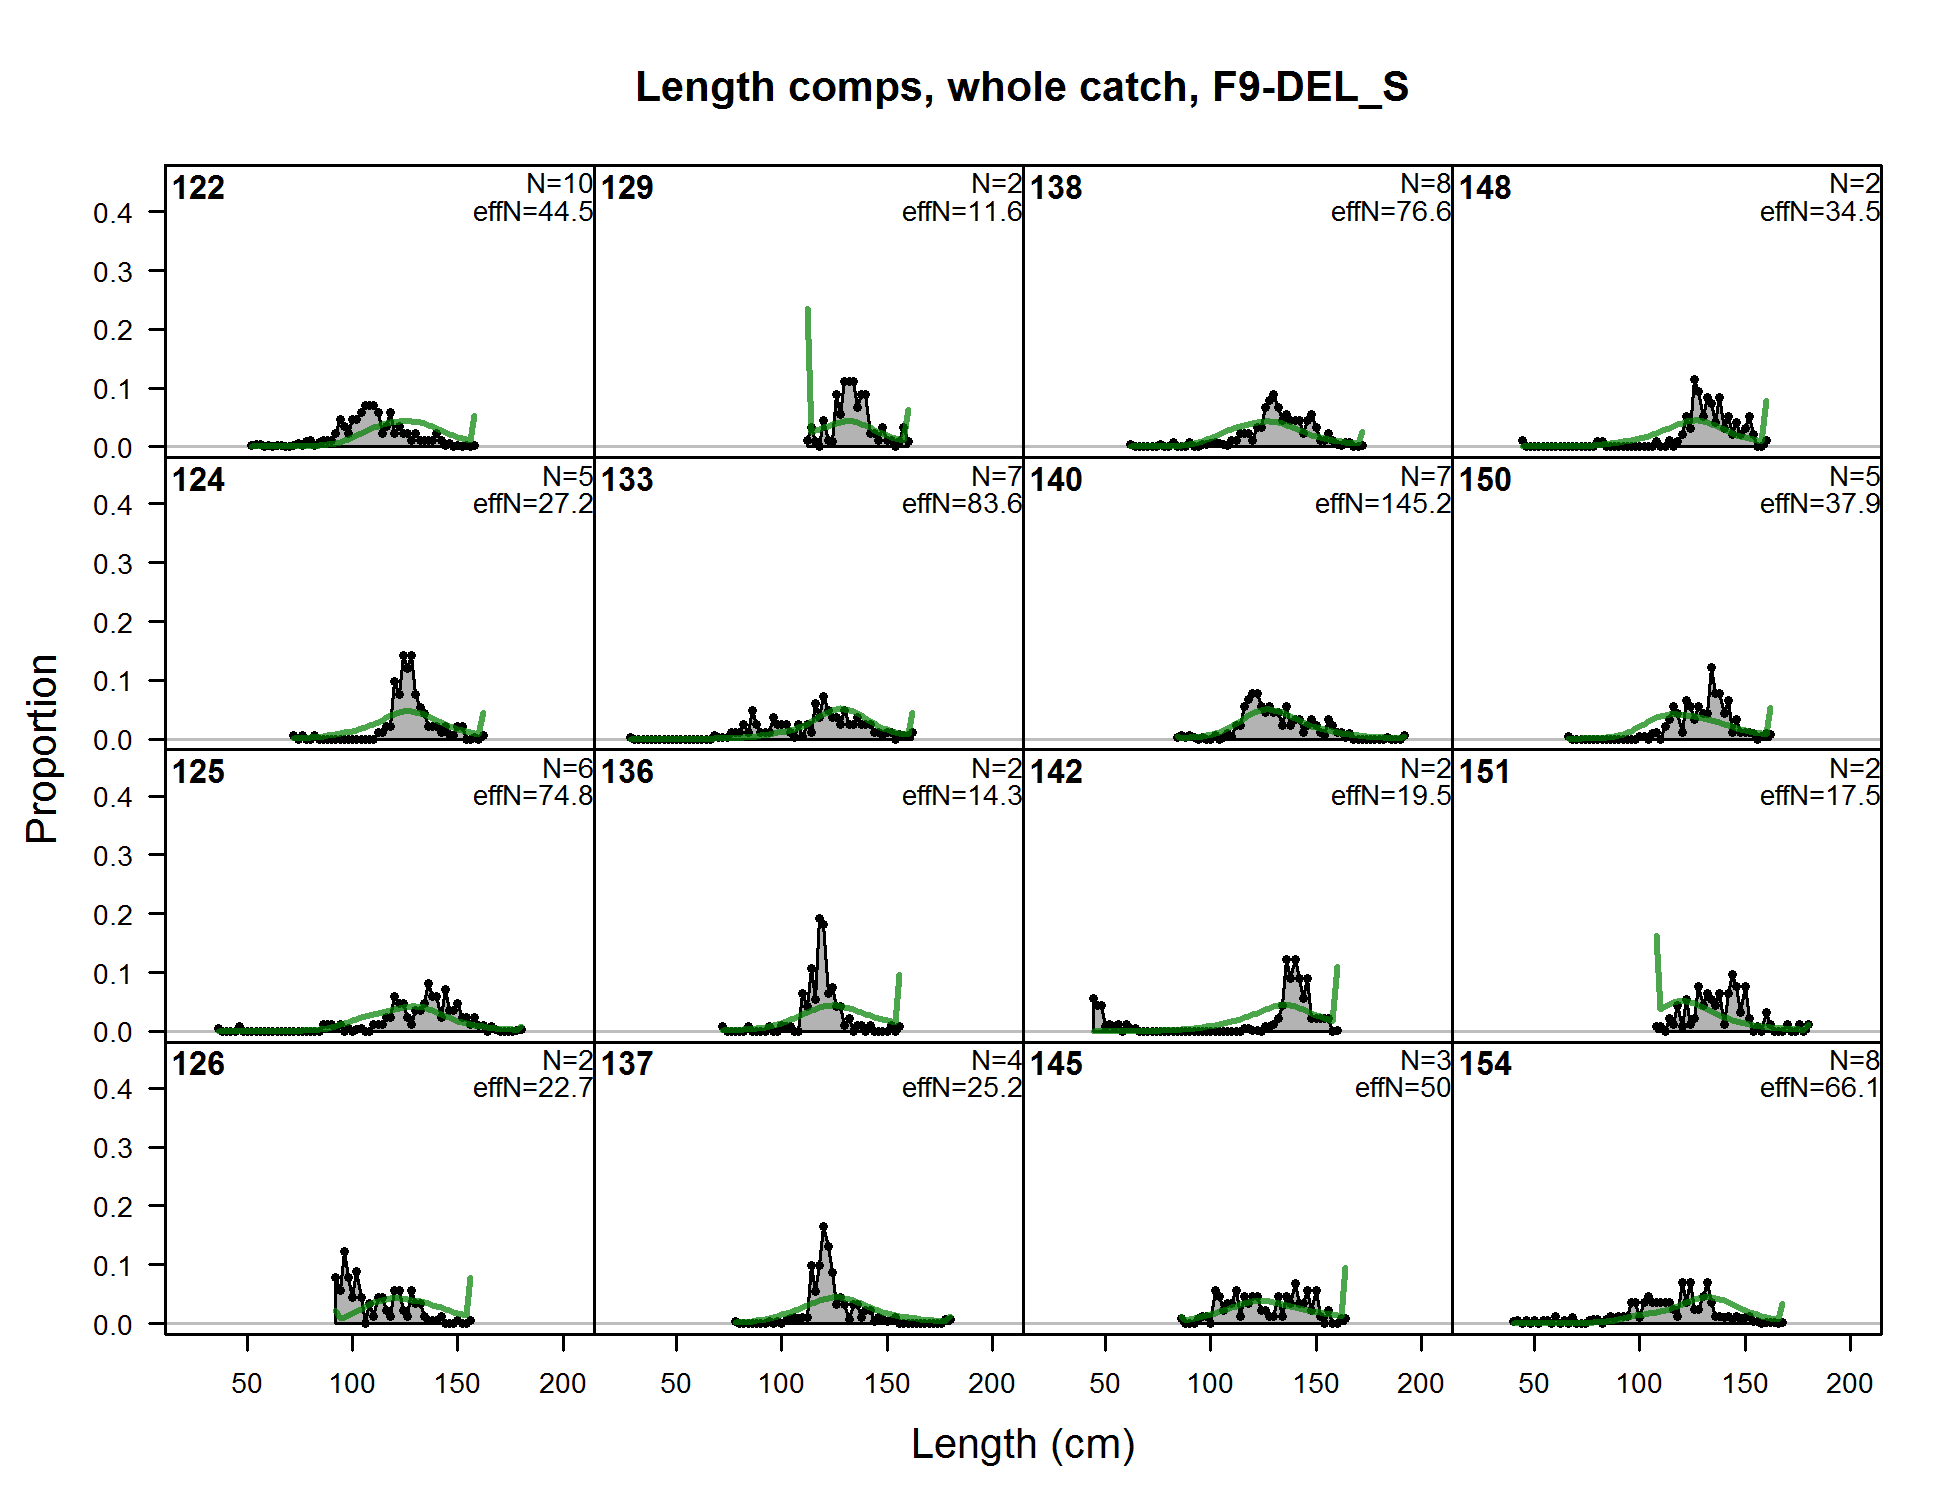
Length comps, whole catch, F9-DEL_S (plot 1 of 7) (plot 2 of 7) (plot 3 of 7) (plot 4 of 7)
file: comp_lenfit_flt9mkt0_page4.png
Length comps, whole catch, F9-DEL_S (plot 1 of 7) (plot 2 of 7) (plot 3 of 7) (plot 4 of 7) (plot 5 of 7)
file: comp_lenfit_flt9mkt0_page5.png
Length comps, whole catch, F9-DEL_S (plot 1 of 7) (plot 2 of 7) (plot 3 of 7) (plot 4 of 7) (plot 5 of 7) (plot 6 of 7)
file: comp_lenfit_flt9mkt0_page6.png
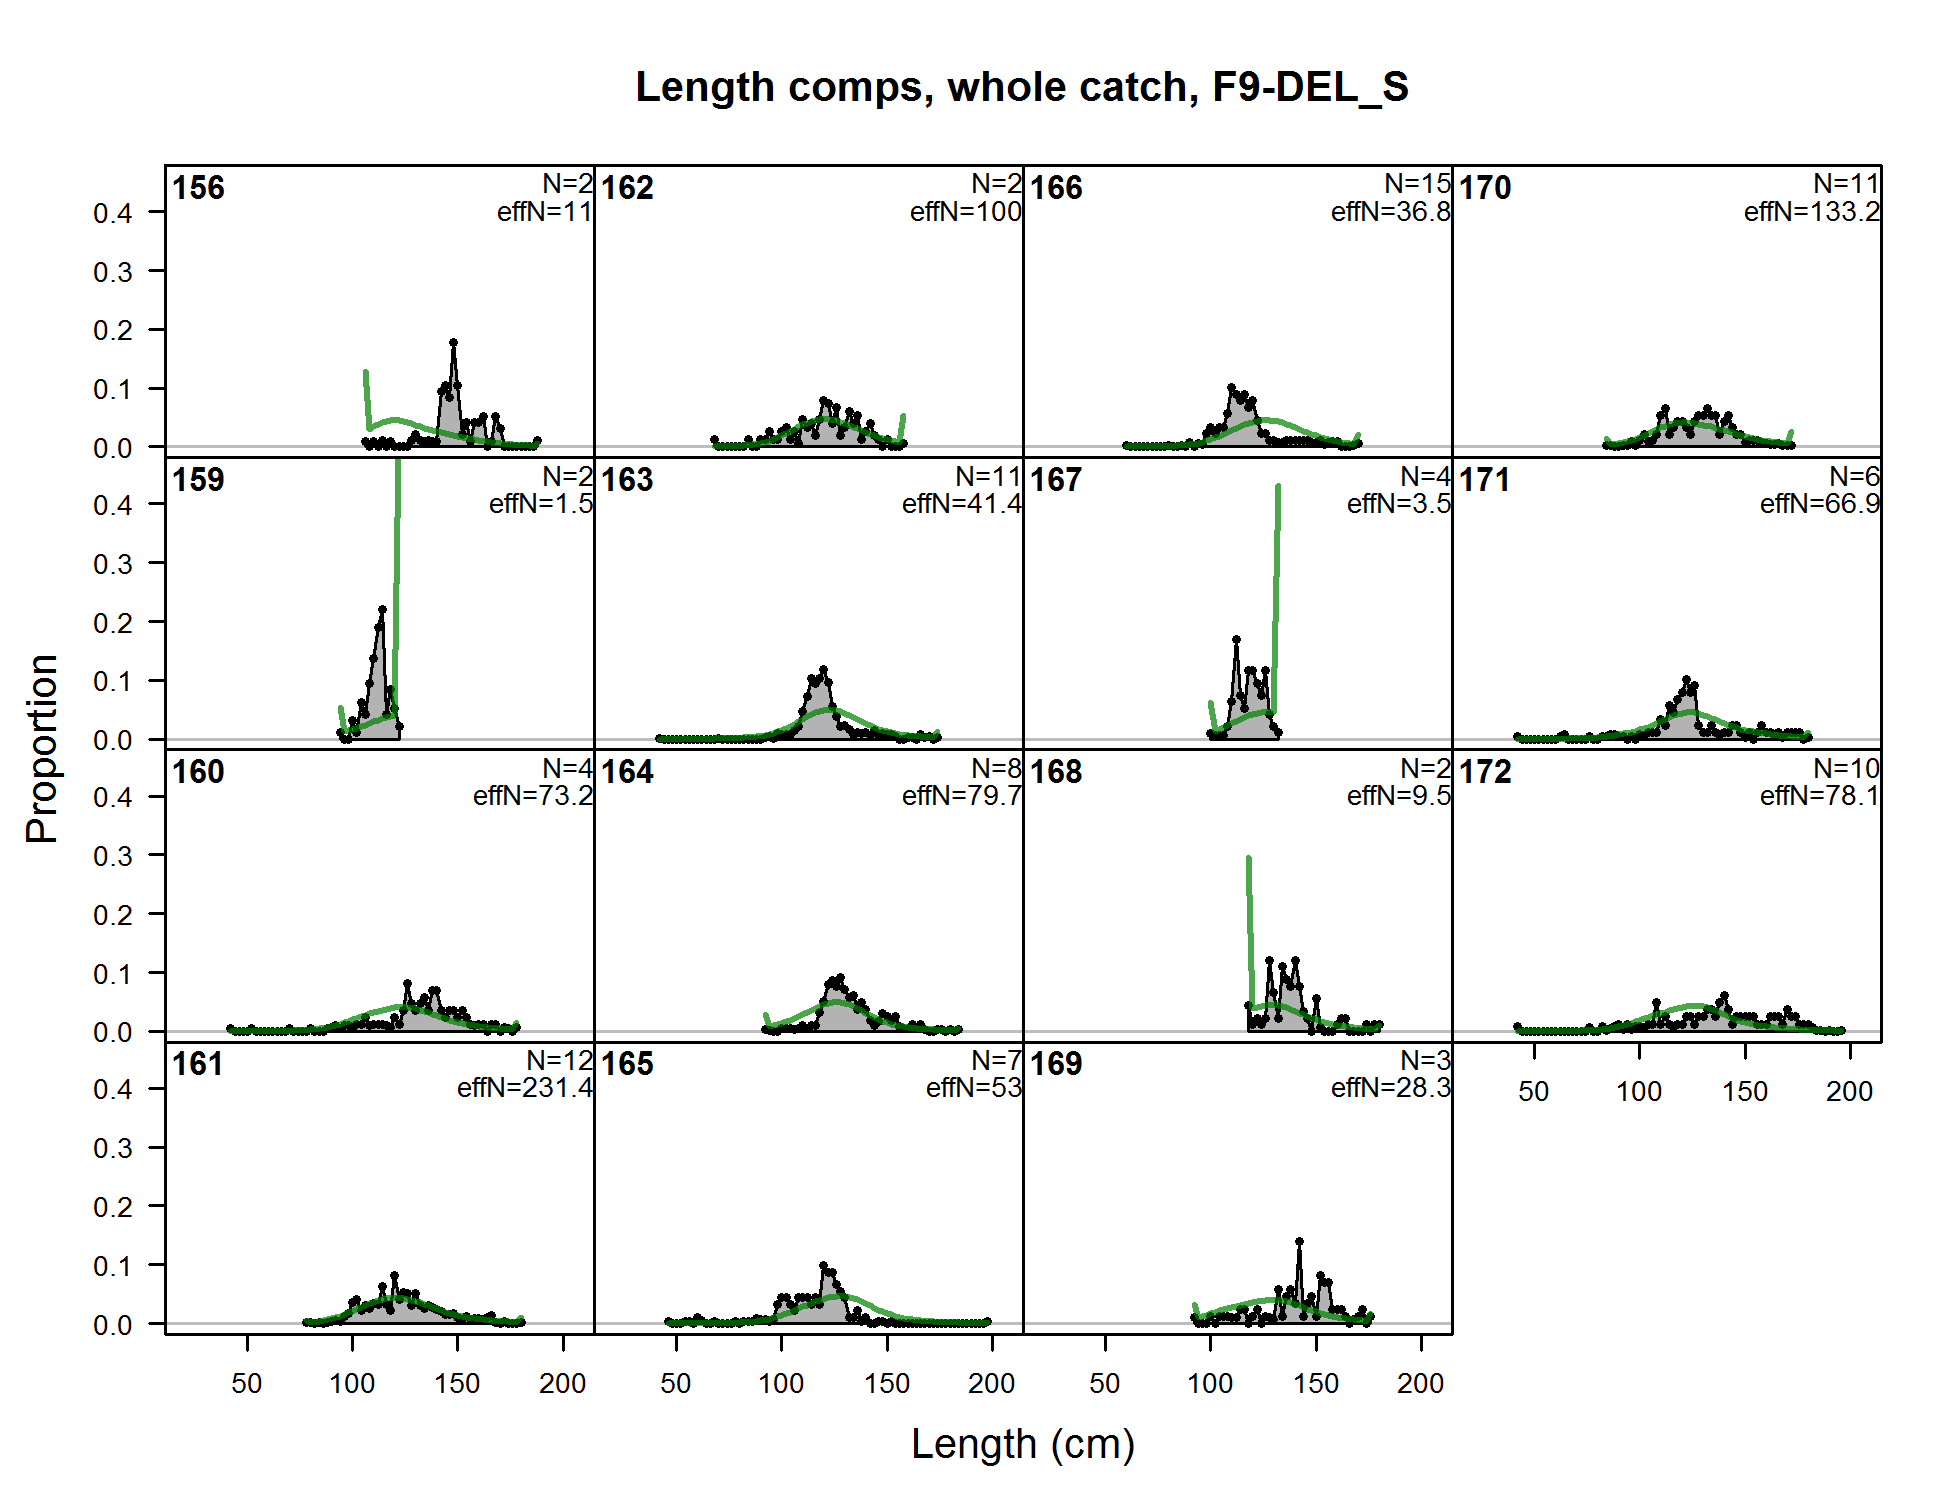
Length comps, whole catch, F9-DEL_S (plot 1 of 7) (plot 2 of 7) (plot 3 of 7) (plot 4 of 7) (plot 5 of 7) (plot 6 of 7) (plot 7 of 7)
file: comp_lenfit_flt9mkt0_page7.png
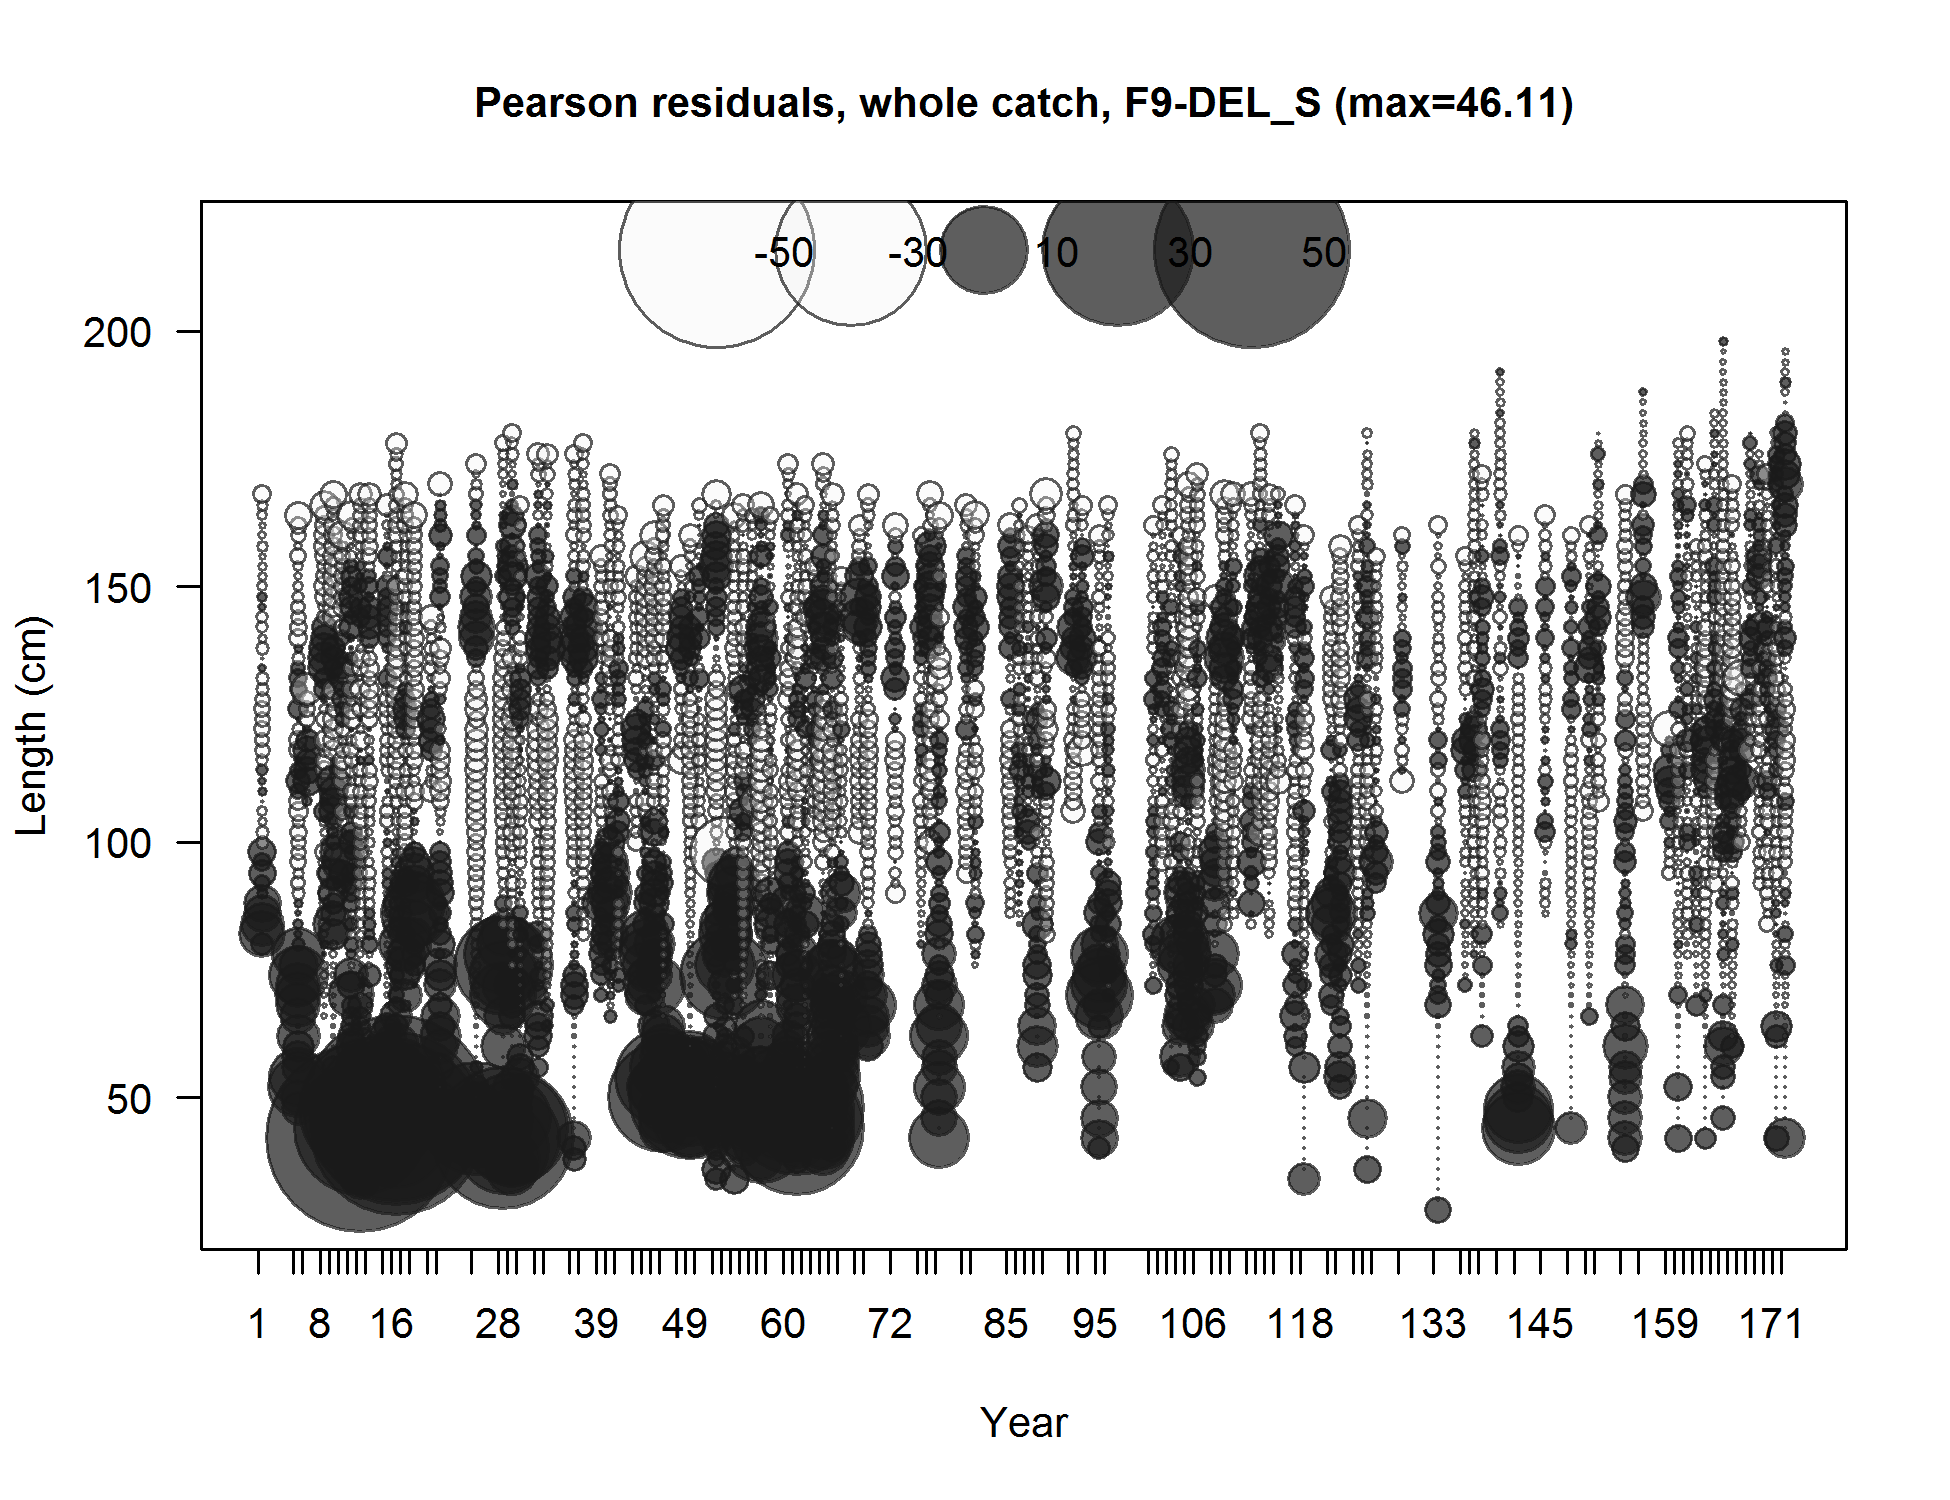
Pearson residuals, whole catch, F9-DEL_S (max=46.11) (plot 7 of 7)
Closed bubbles are positive residuals (observed > expected) and open bubbles are negative residuals (observed < expected).
file: comp_lenfit_residsflt9mkt0_page7.png
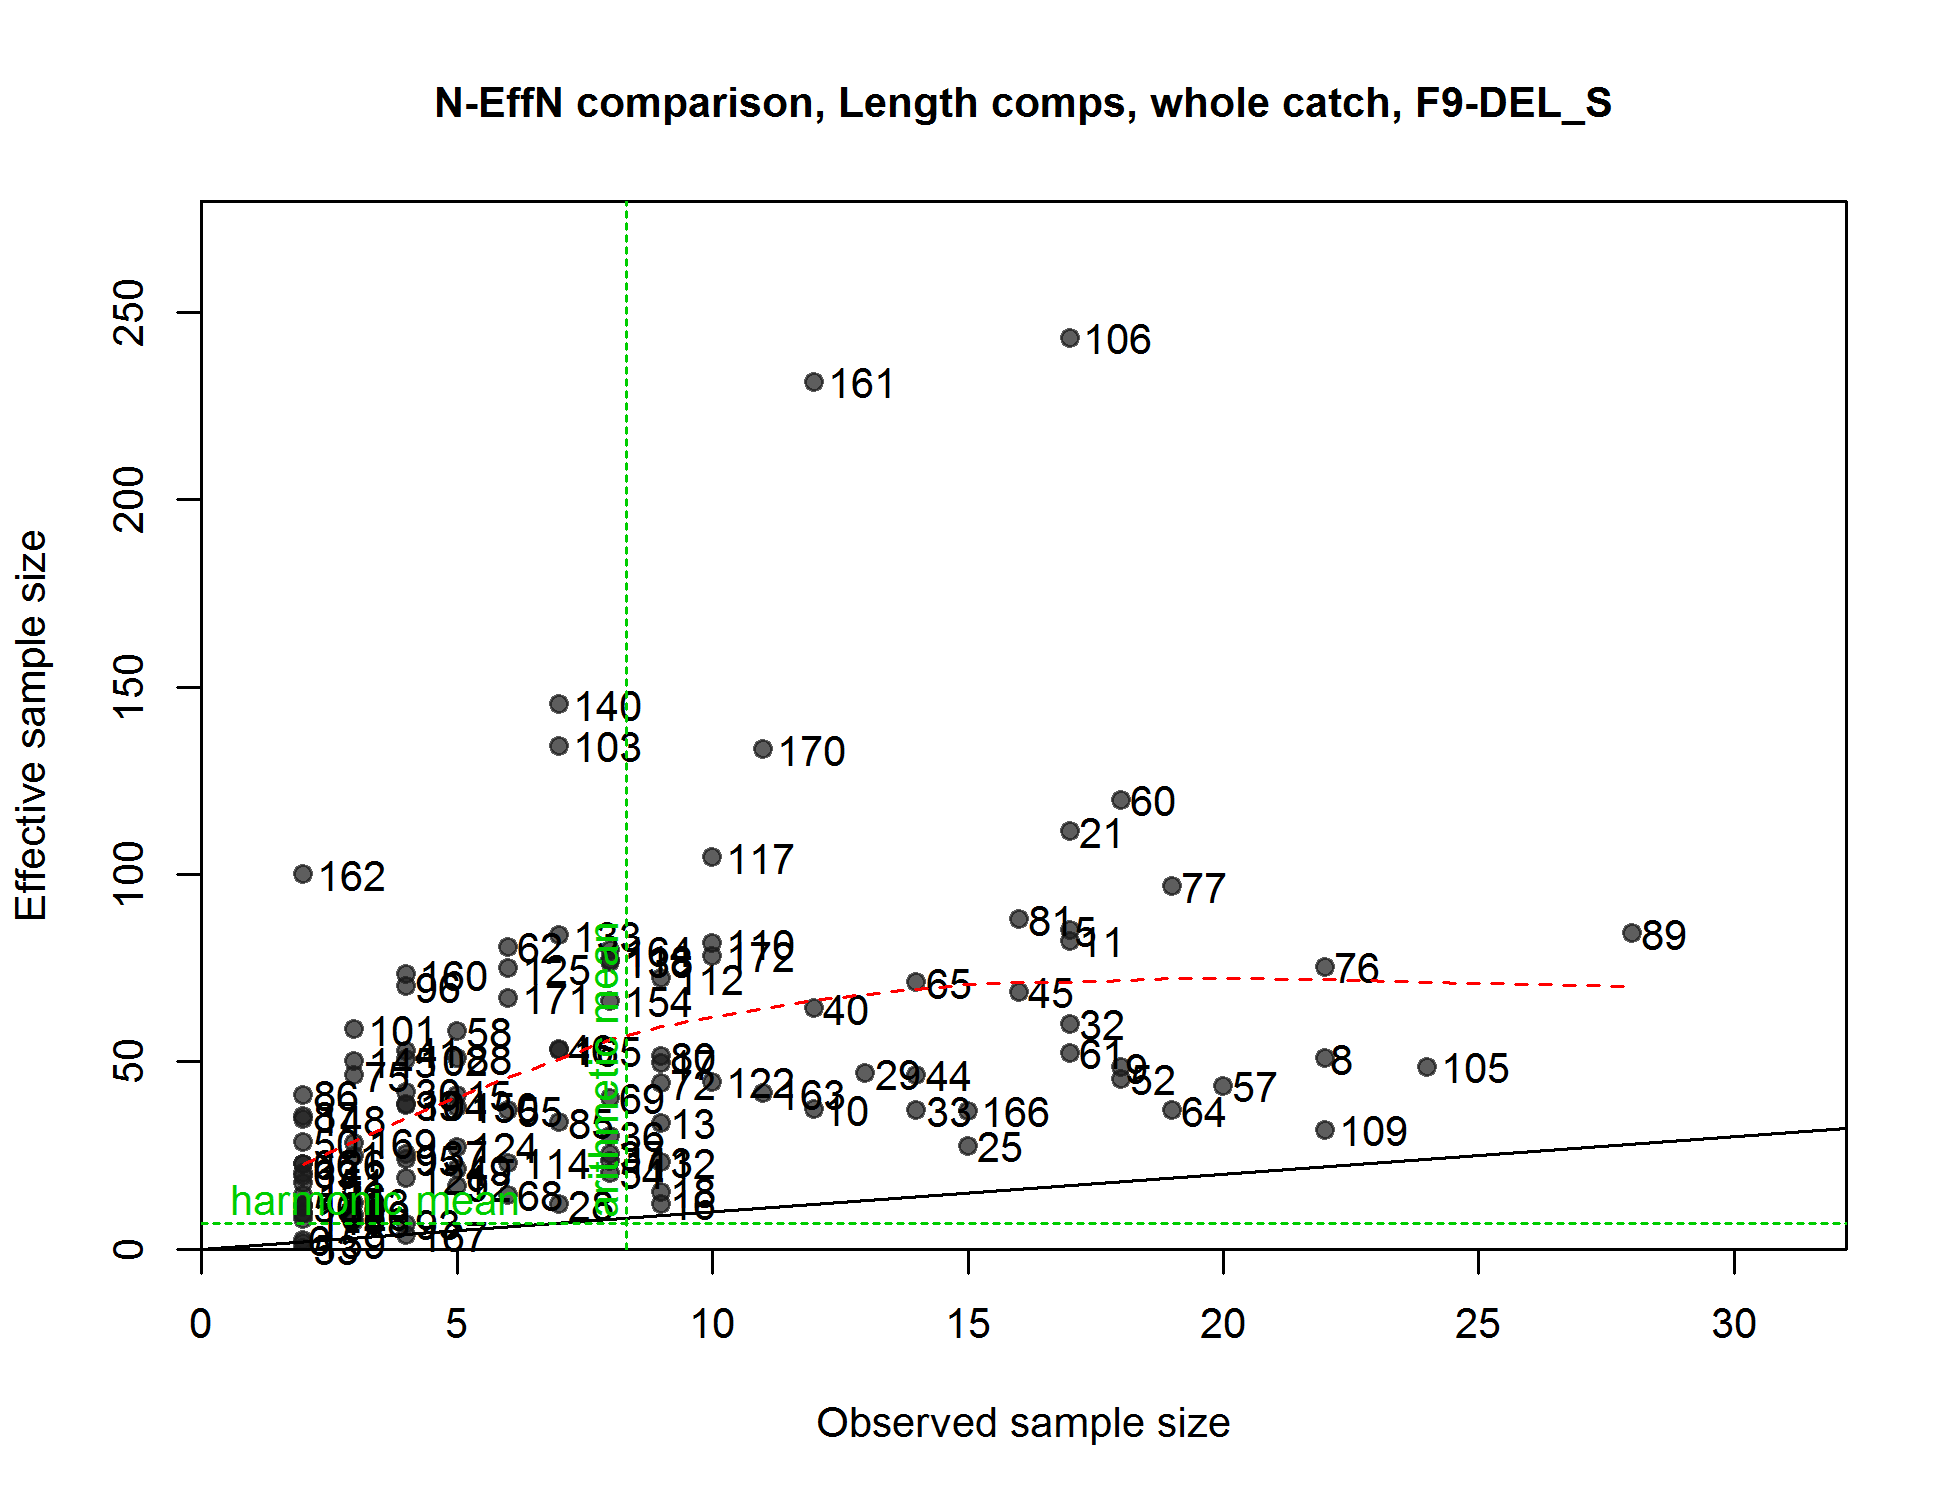
N-EffN comparison, Length comps, whole catch, F9-DEL_S
file: comp_lenfit_sampsize_flt9mkt0.png
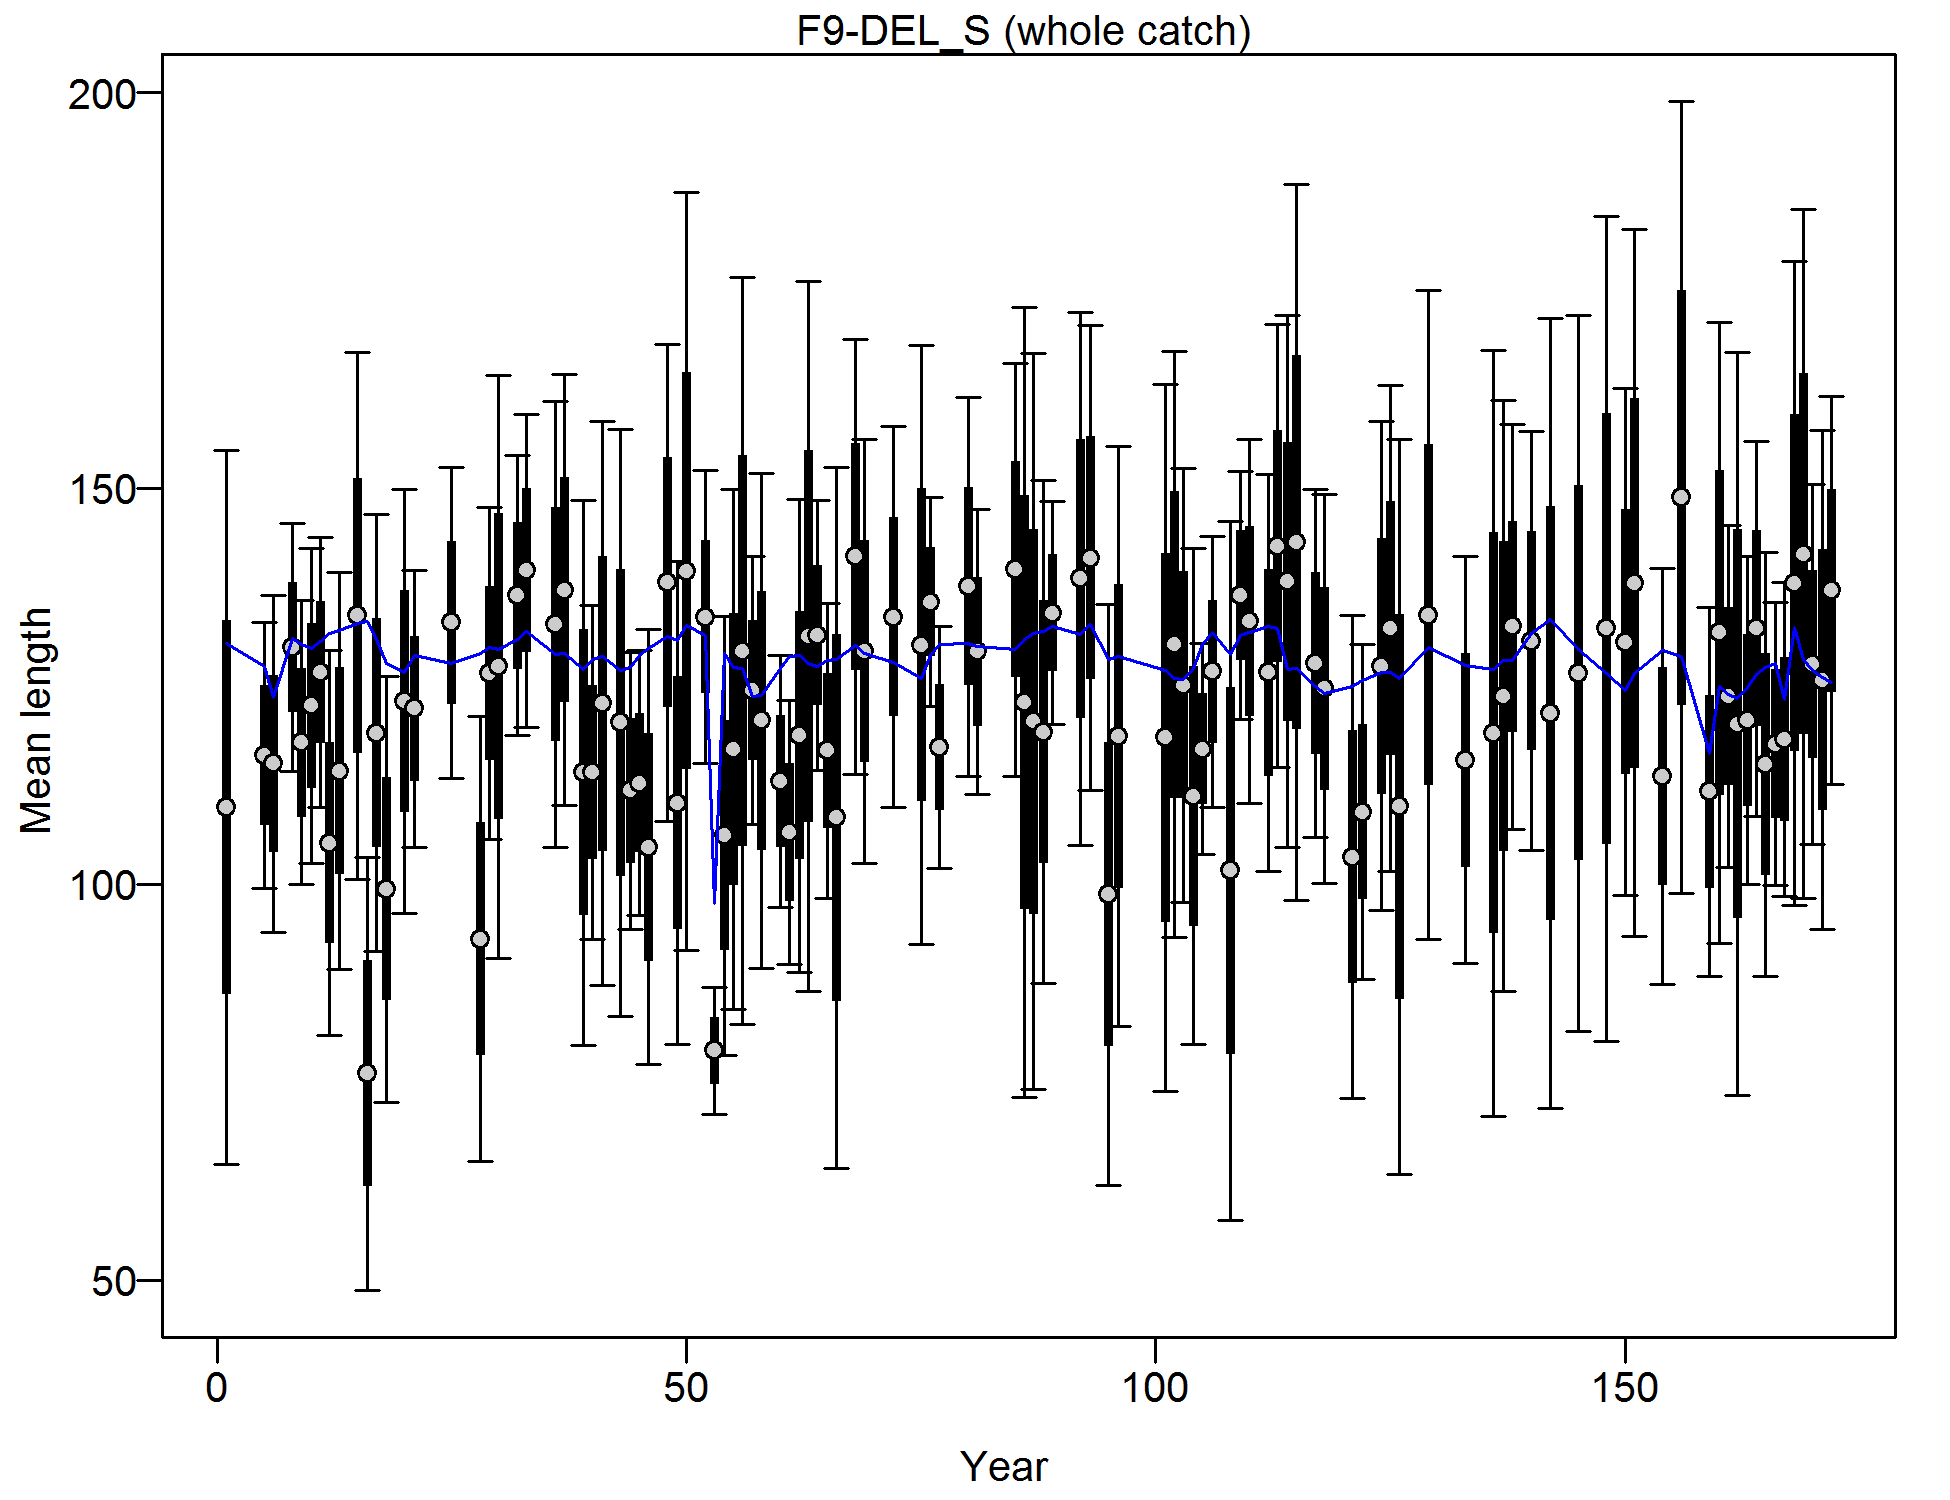
Mean length for F9-DEL_S with 95% confidence intervals based on current samples sizes.
Francis data weighting method TA1.8: thinner intervals (with capped ends) show result of further adjusting sample sizes based on suggested multiplier (with 95% interval) for len data from F9-DEL_S:
0.2741 (0.1909-0.439)
For more info, see
Francis, R.I.C.C. (2011). Data weighting in statistical fisheries stock assessment models. Can. J. Fish. Aquat. Sci. 68: 1124-1138.
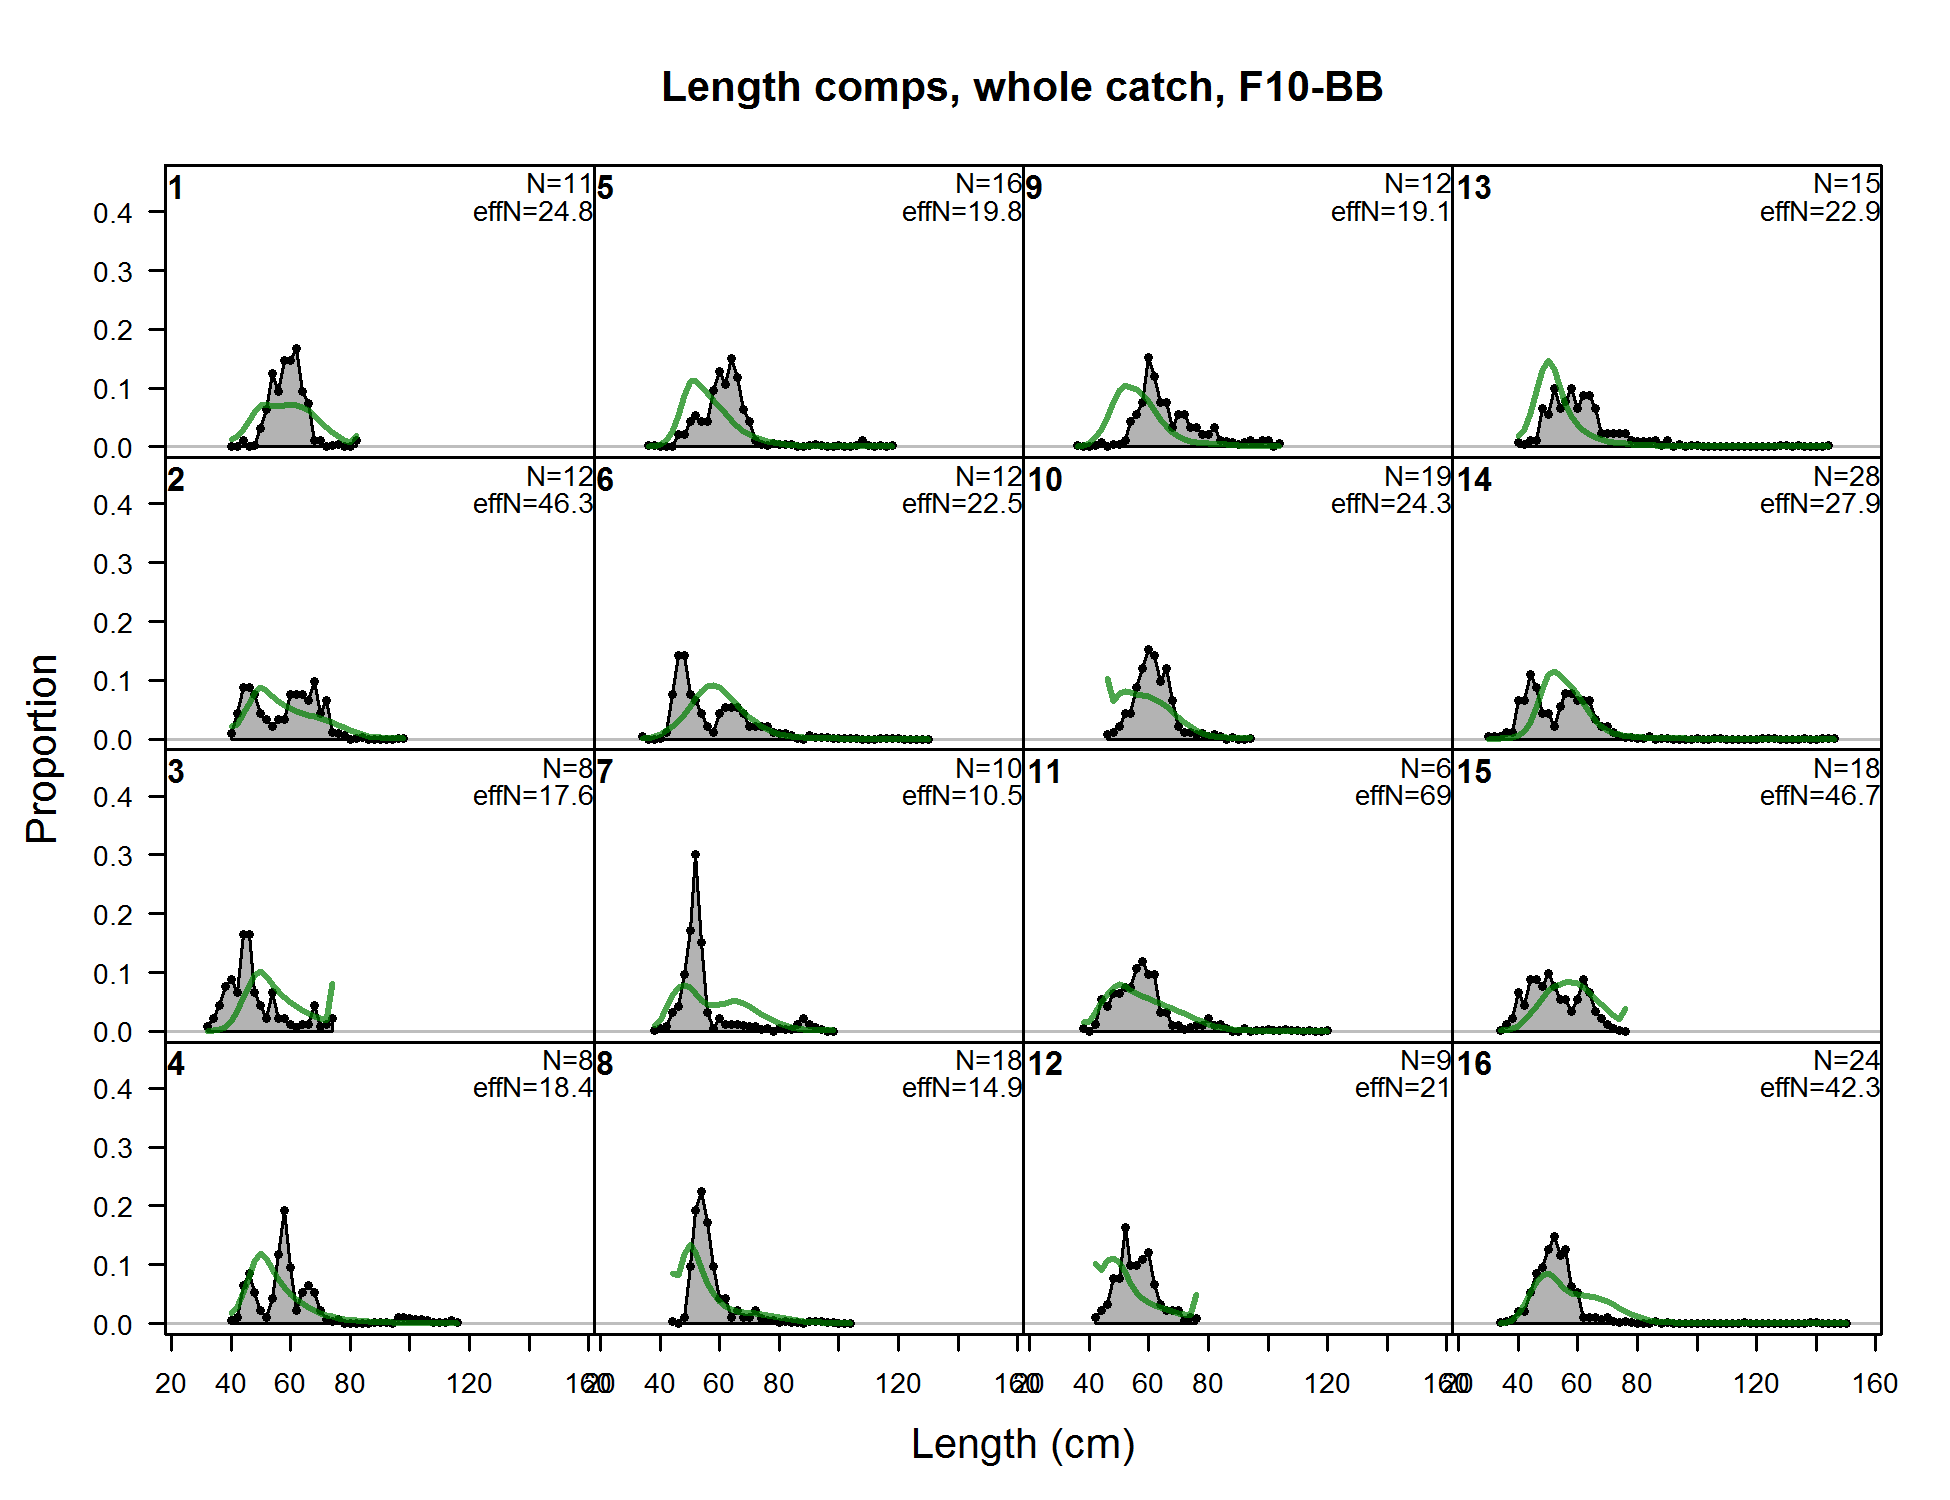
Length comps, whole catch, F10-BB (plot 1 of 6)
file: comp_lenfit_flt10mkt0_page1.png
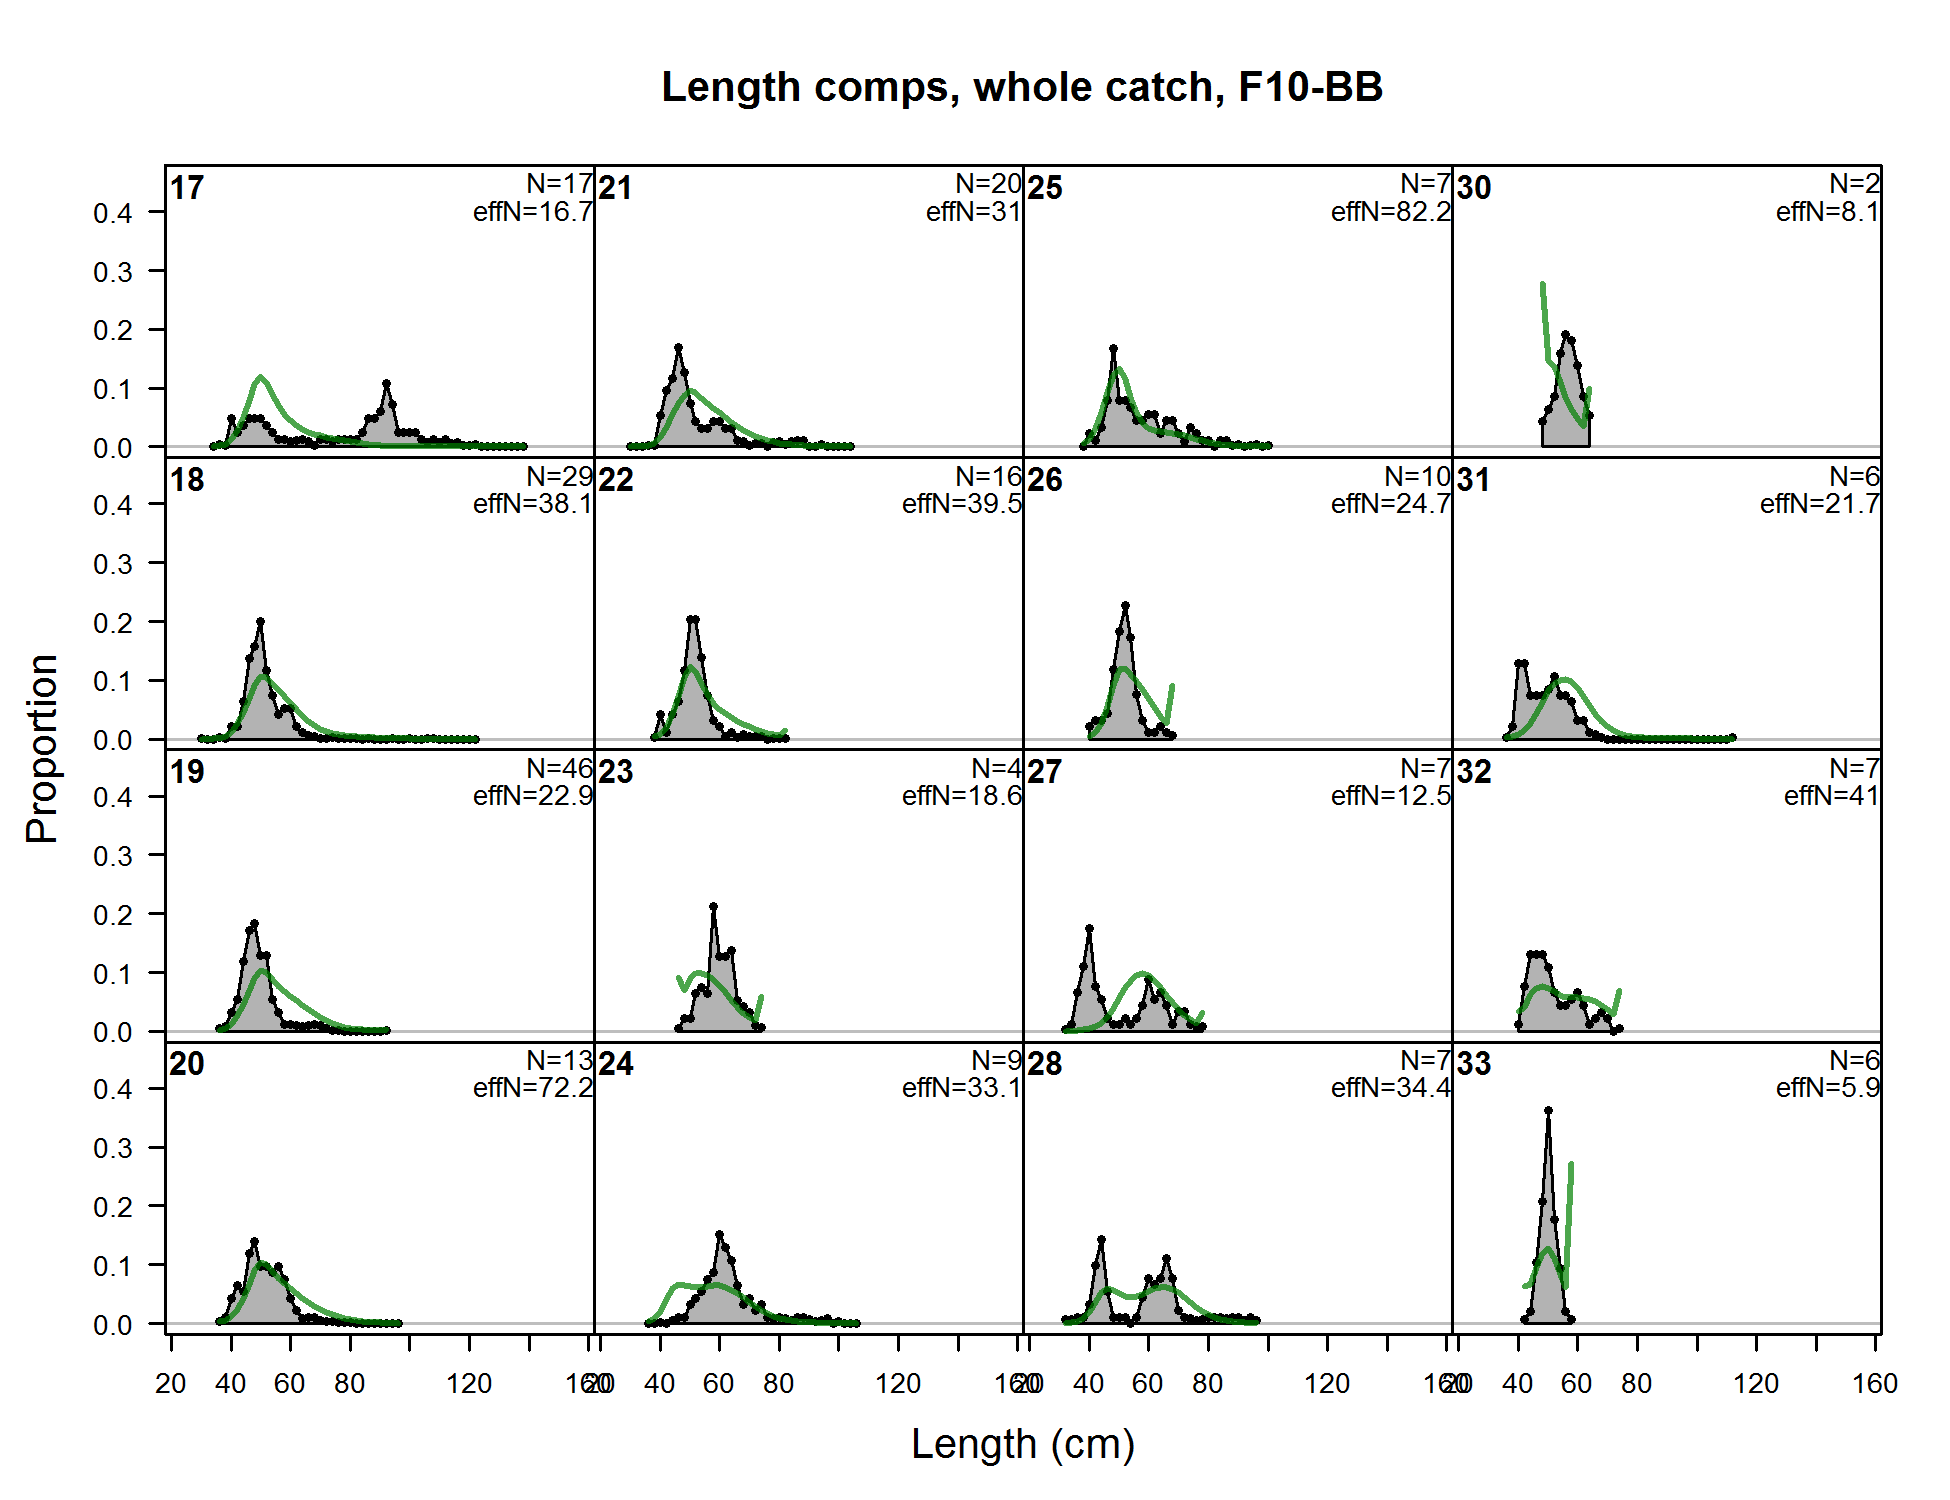
Length comps, whole catch, F10-BB (plot 1 of 6) (plot 2 of 6)
file: comp_lenfit_flt10mkt0_page2.png
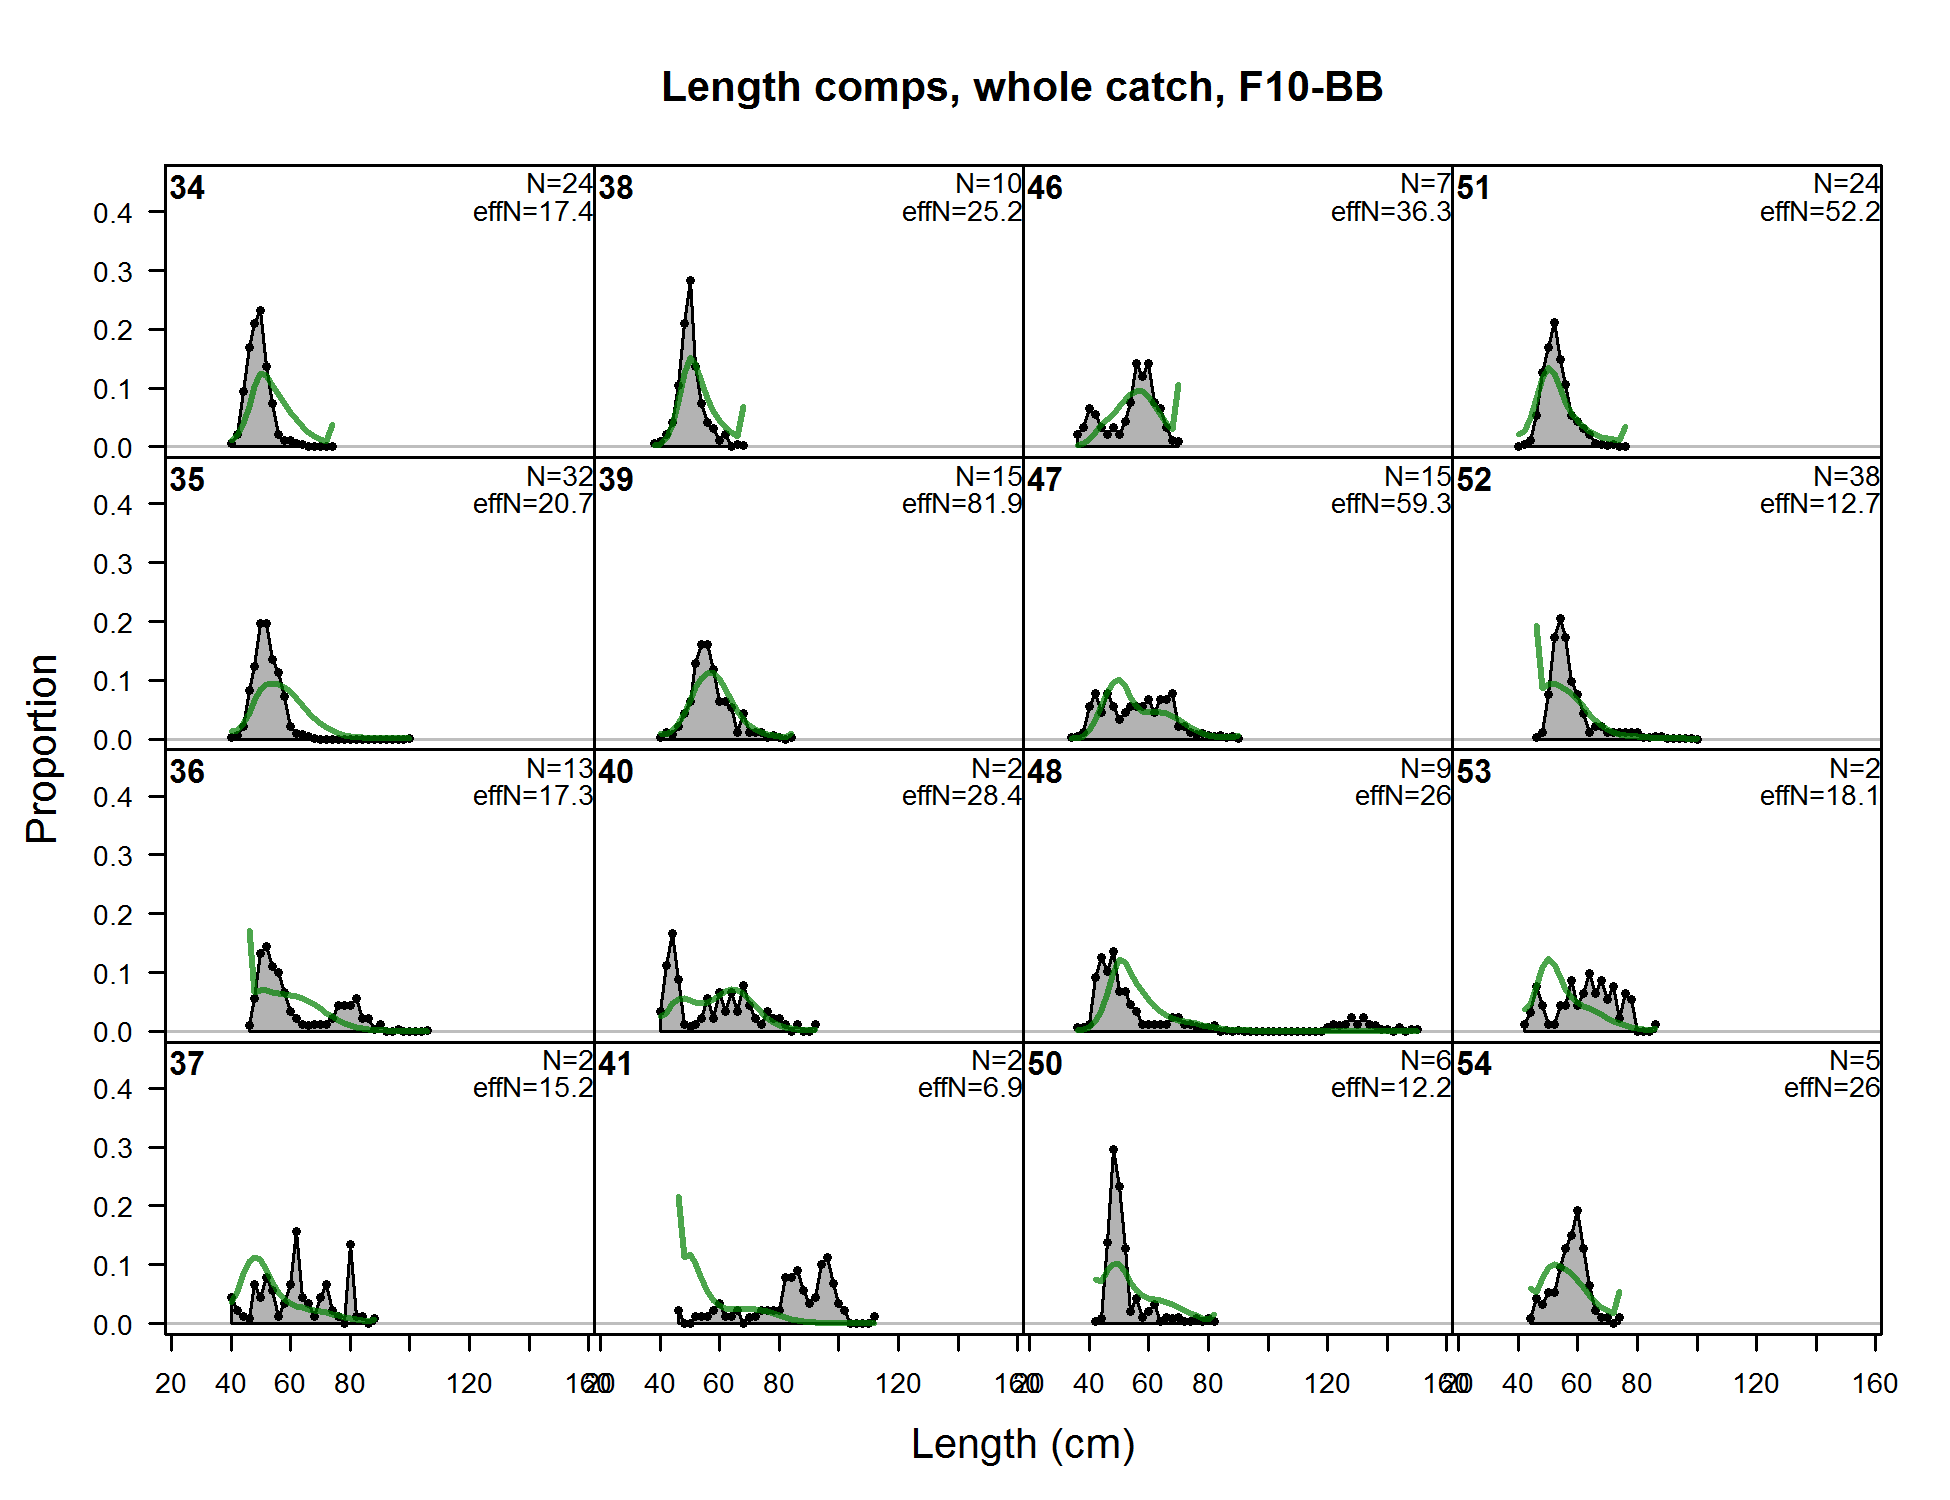
Length comps, whole catch, F10-BB (plot 1 of 6) (plot 2 of 6) (plot 3 of 6)
file: comp_lenfit_flt10mkt0_page3.png
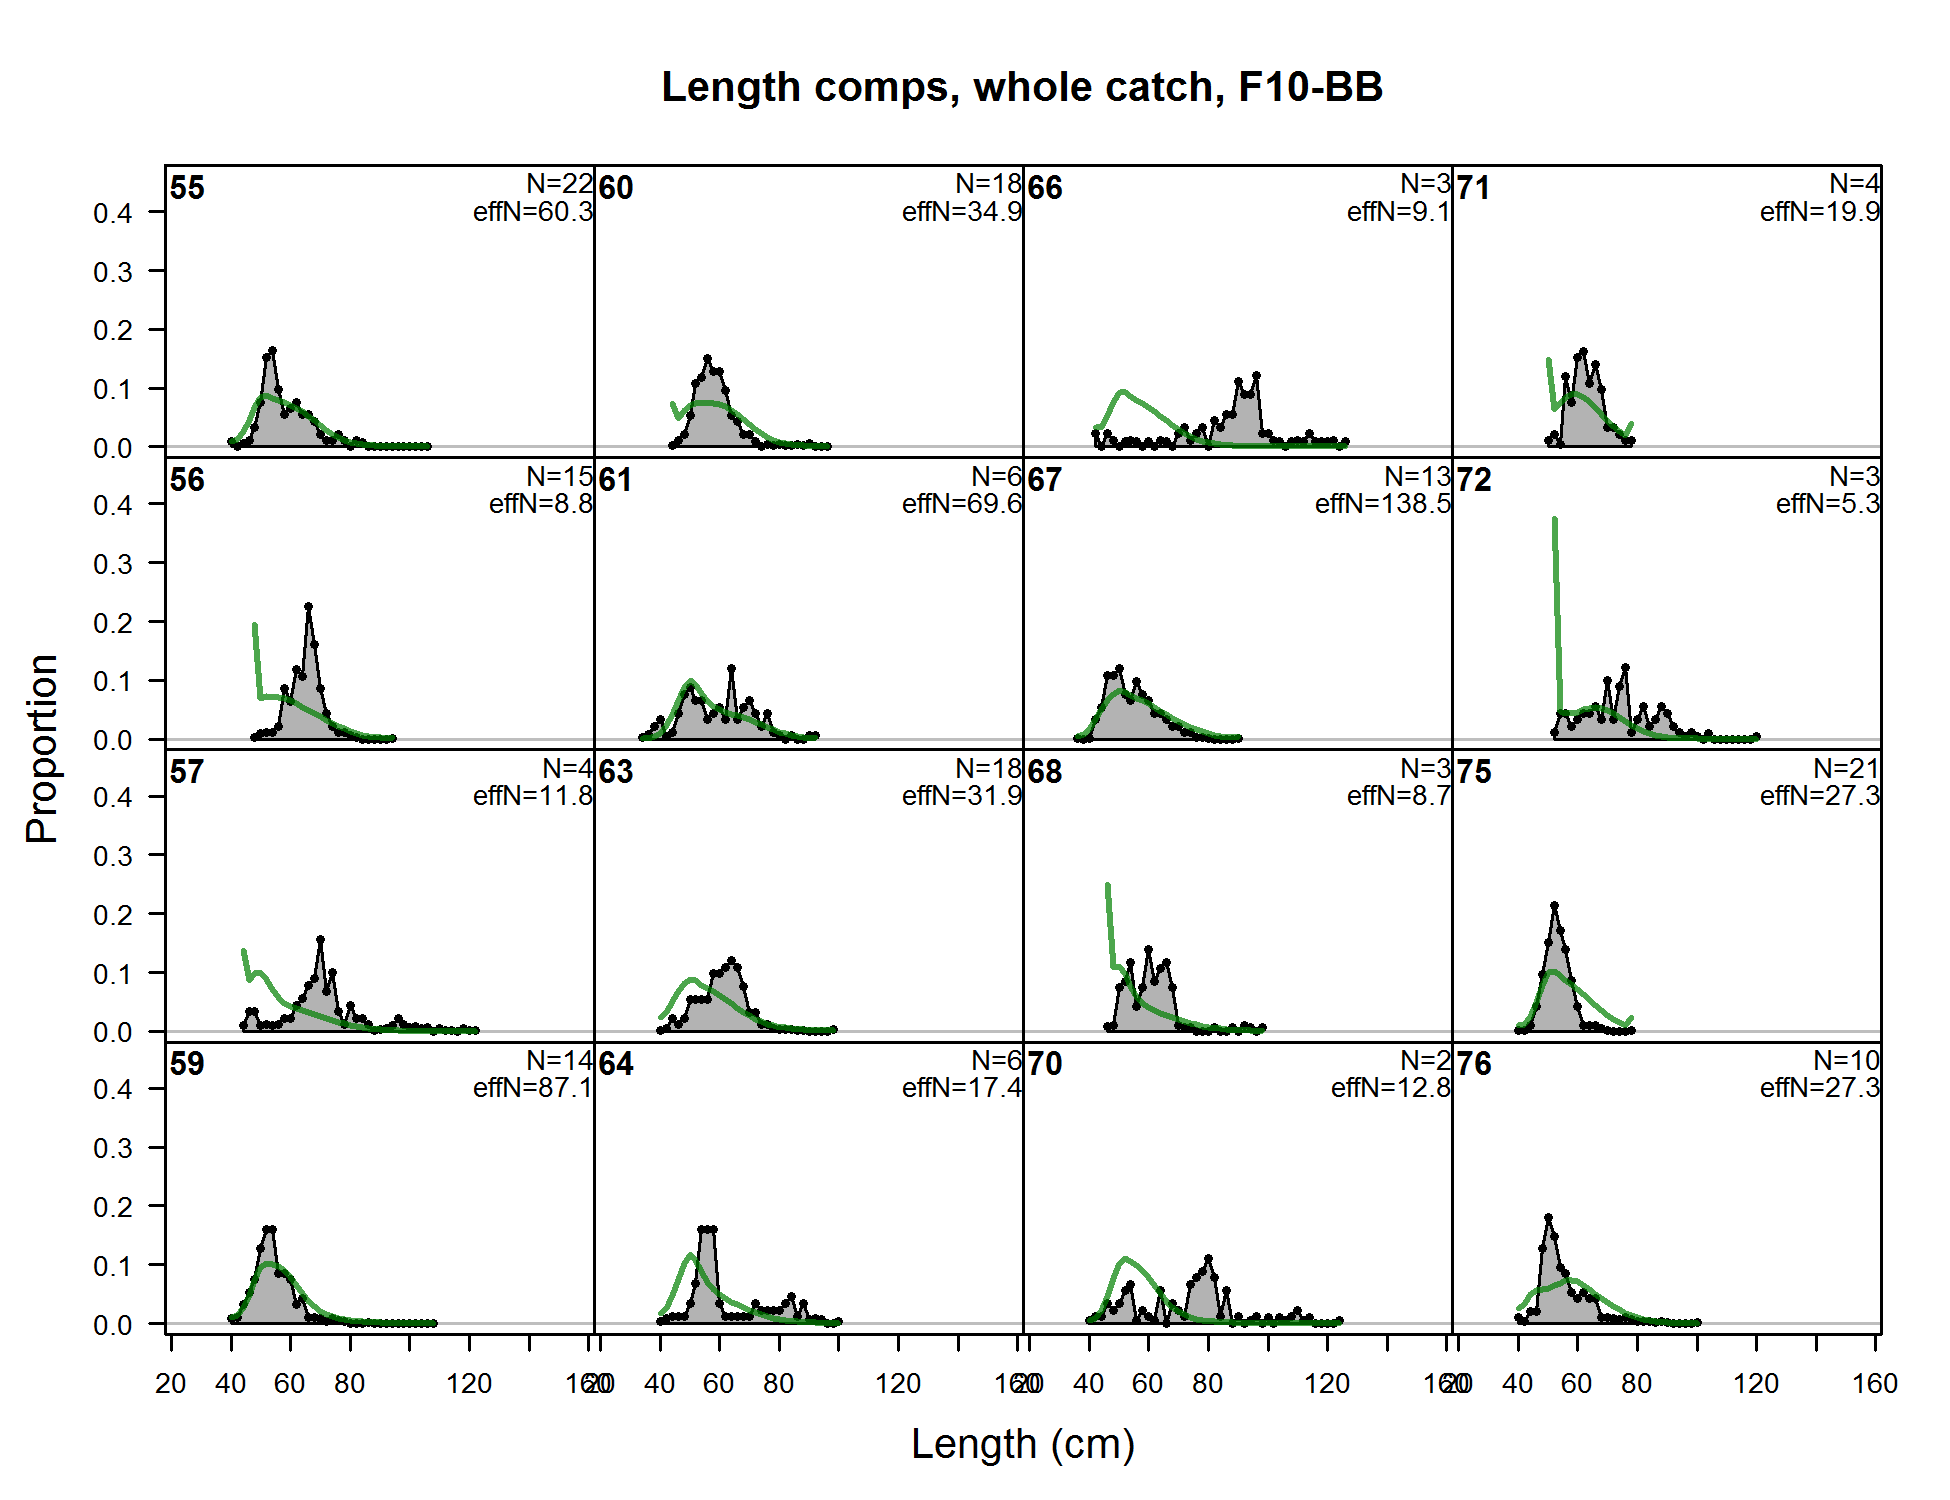
Length comps, whole catch, F10-BB (plot 1 of 6) (plot 2 of 6) (plot 3 of 6) (plot 4 of 6)
file: comp_lenfit_flt10mkt0_page4.png
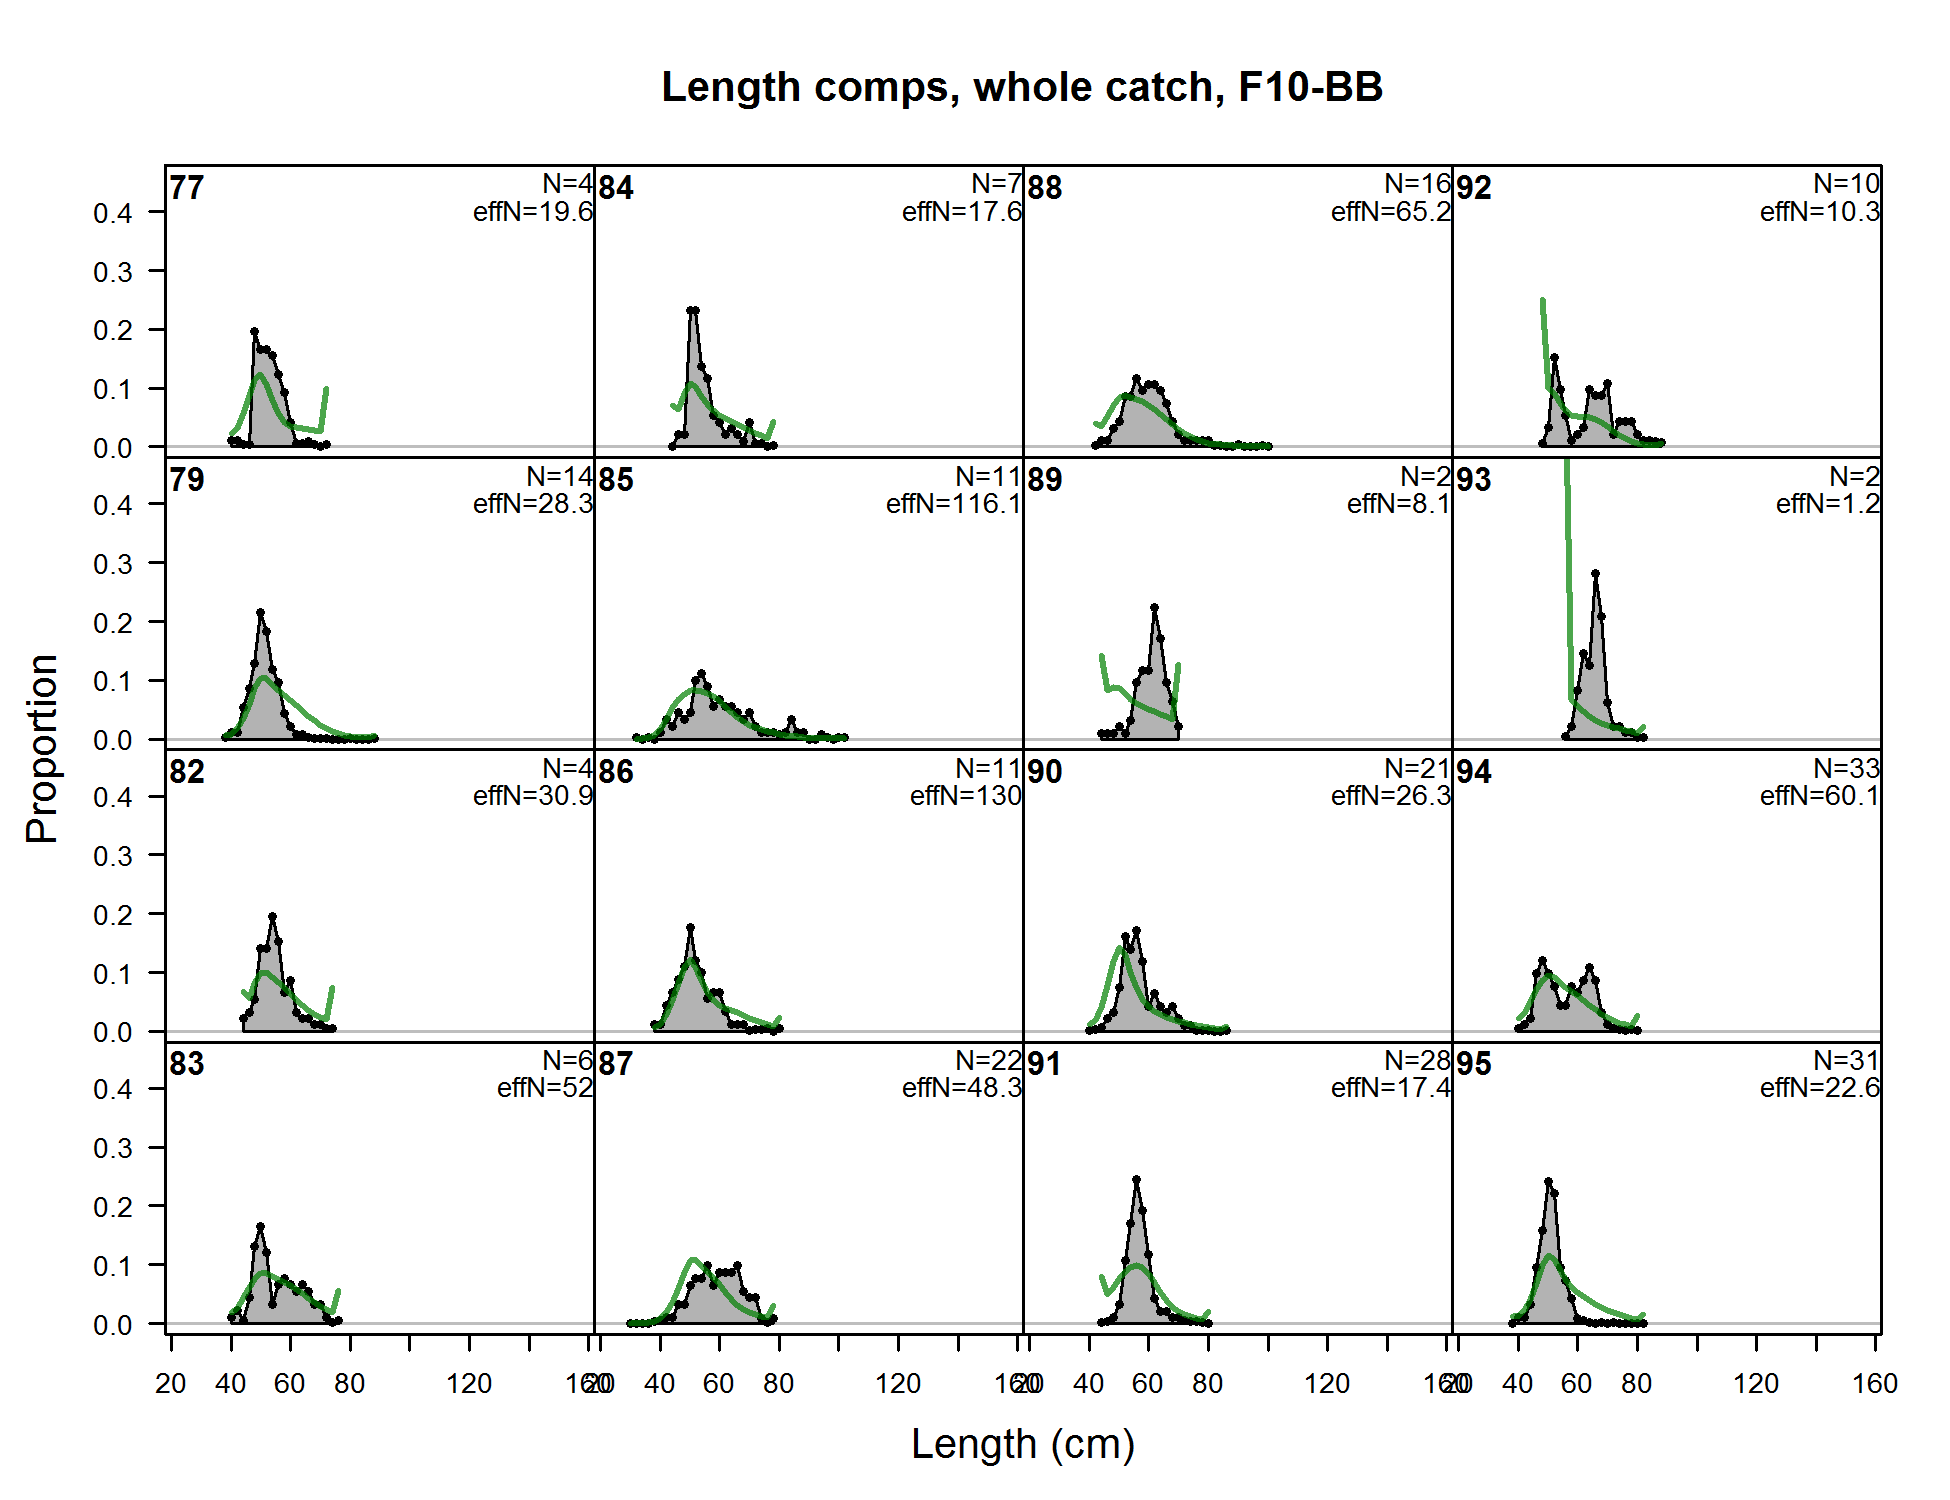
Length comps, whole catch, F10-BB (plot 1 of 6) (plot 2 of 6) (plot 3 of 6) (plot 4 of 6) (plot 5 of 6)
file: comp_lenfit_flt10mkt0_page5.png
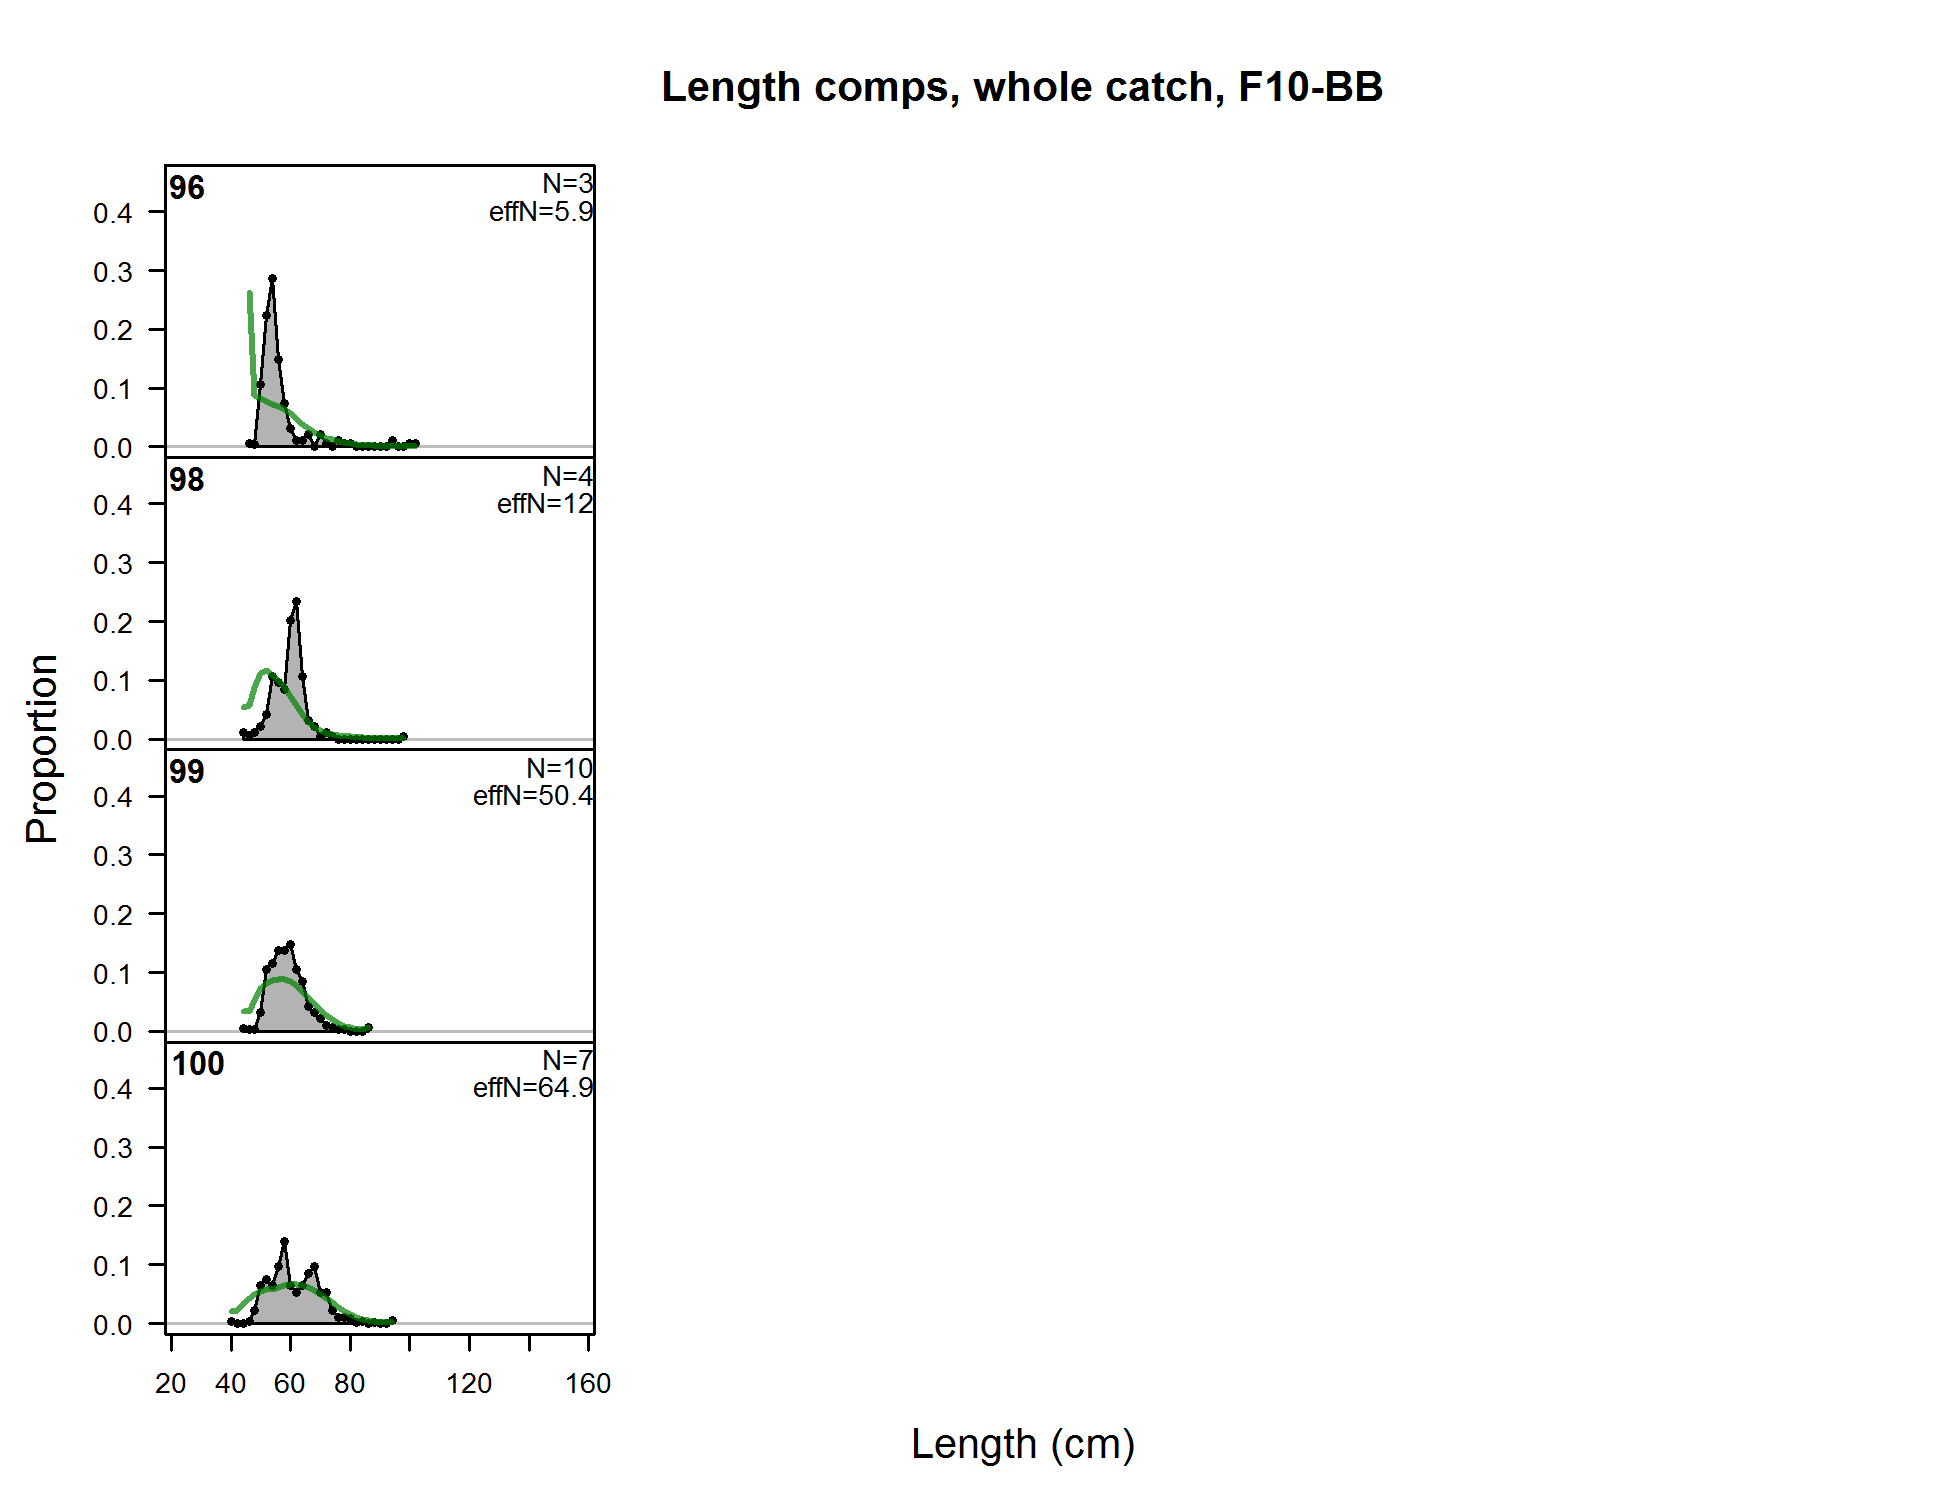
Length comps, whole catch, F10-BB (plot 1 of 6) (plot 2 of 6) (plot 3 of 6) (plot 4 of 6) (plot 5 of 6) (plot 6 of 6)
file: comp_lenfit_flt10mkt0_page6.png
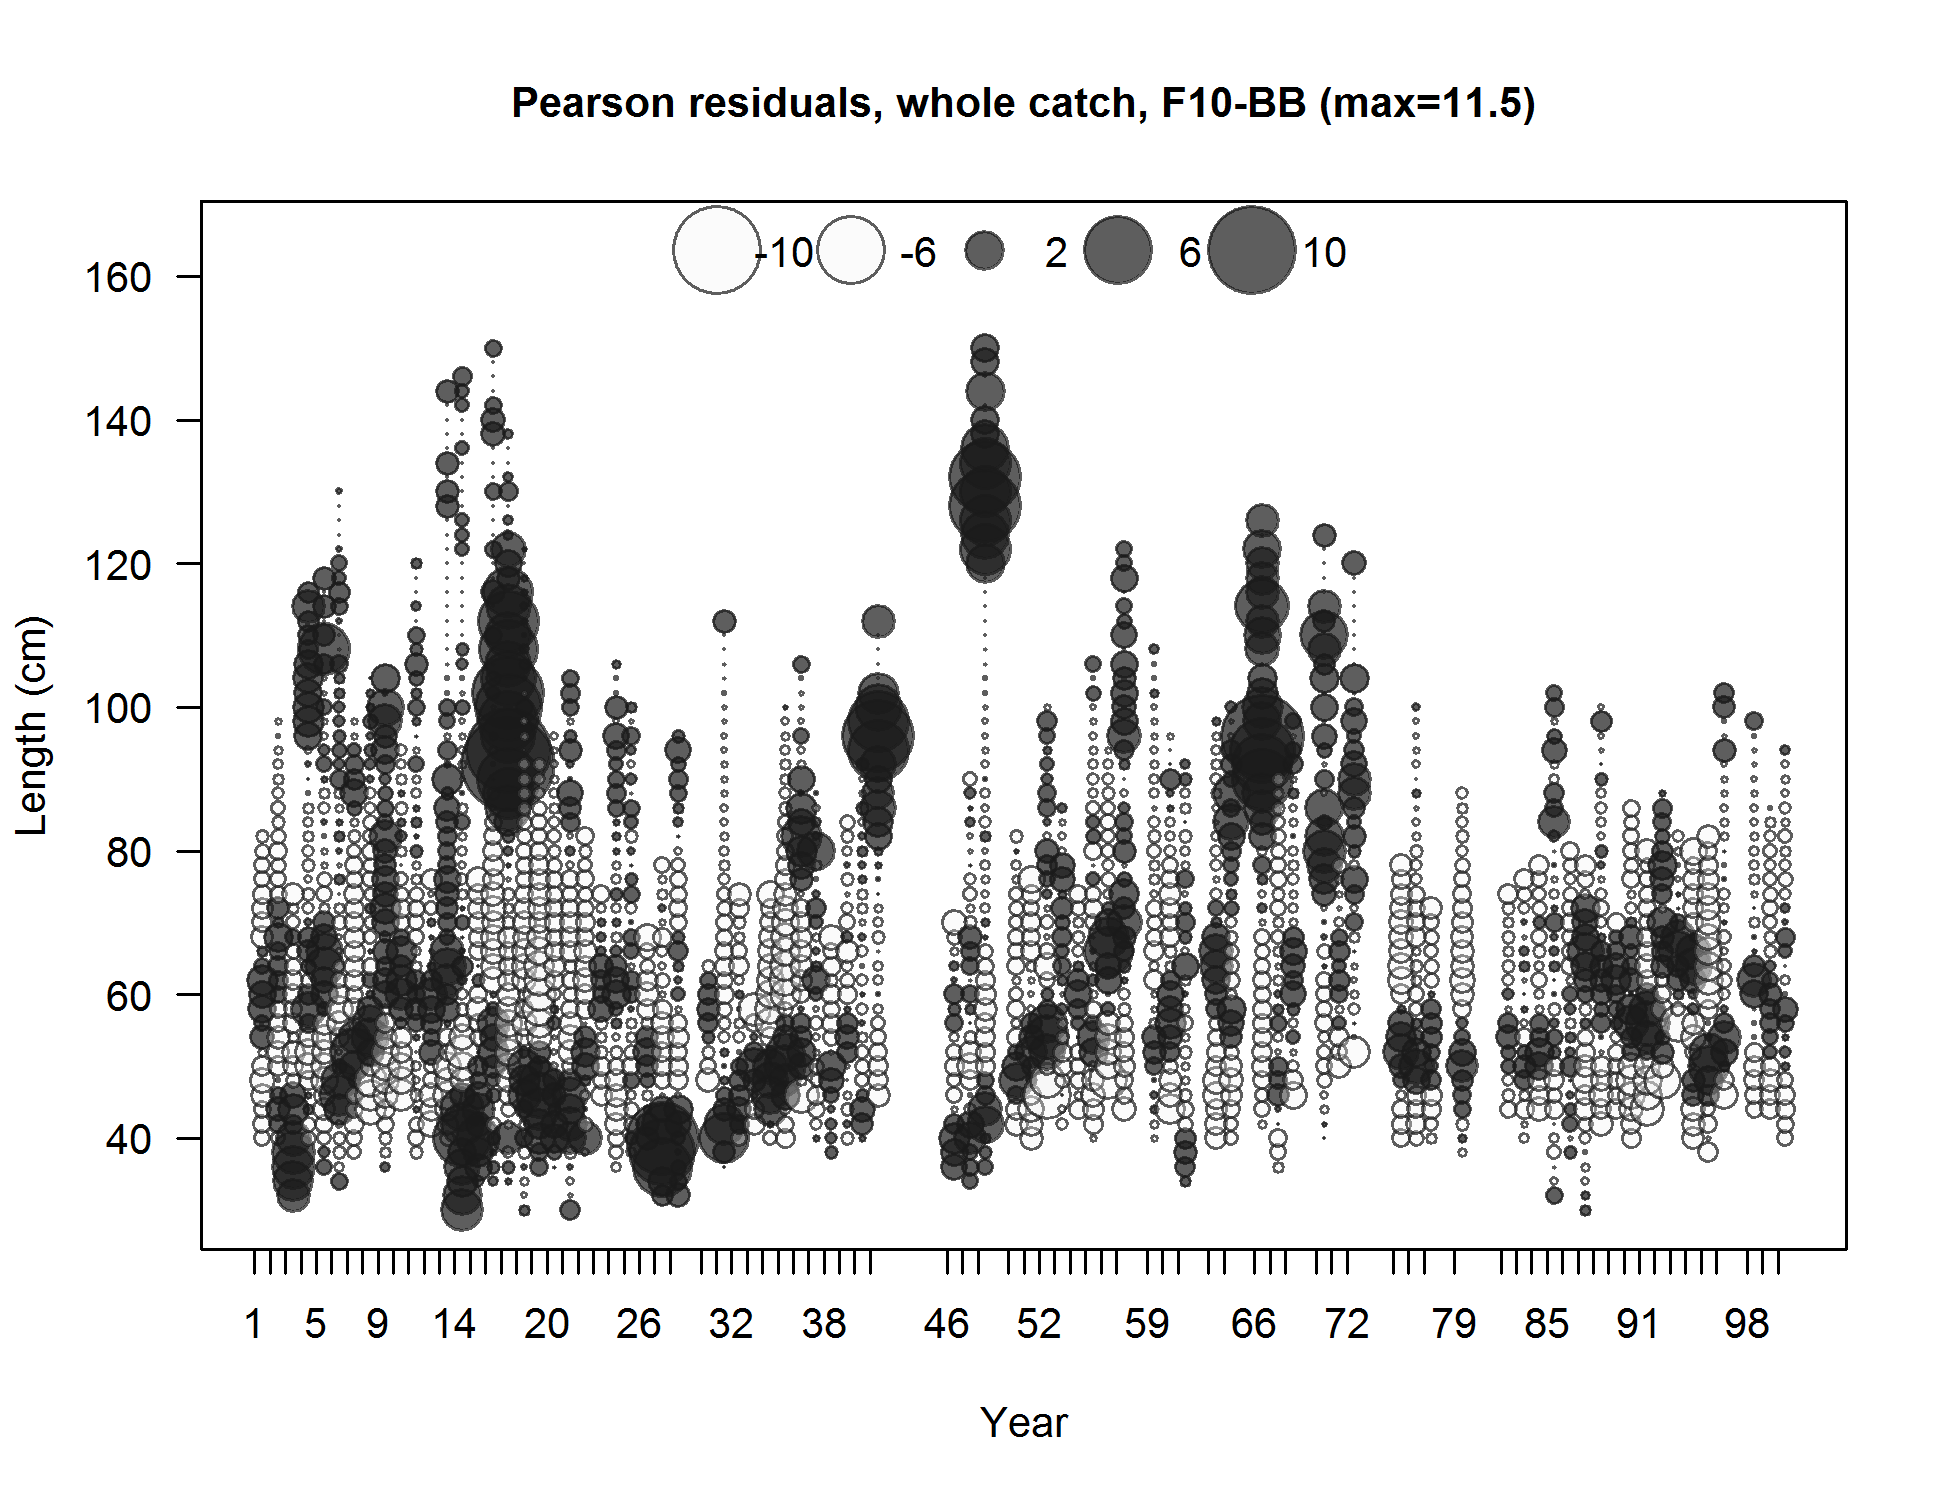
Pearson residuals, whole catch, F10-BB (max=11.5) (plot 6 of 6)
Closed bubbles are positive residuals (observed > expected) and open bubbles are negative residuals (observed < expected).
file: comp_lenfit_residsflt10mkt0_page6.png
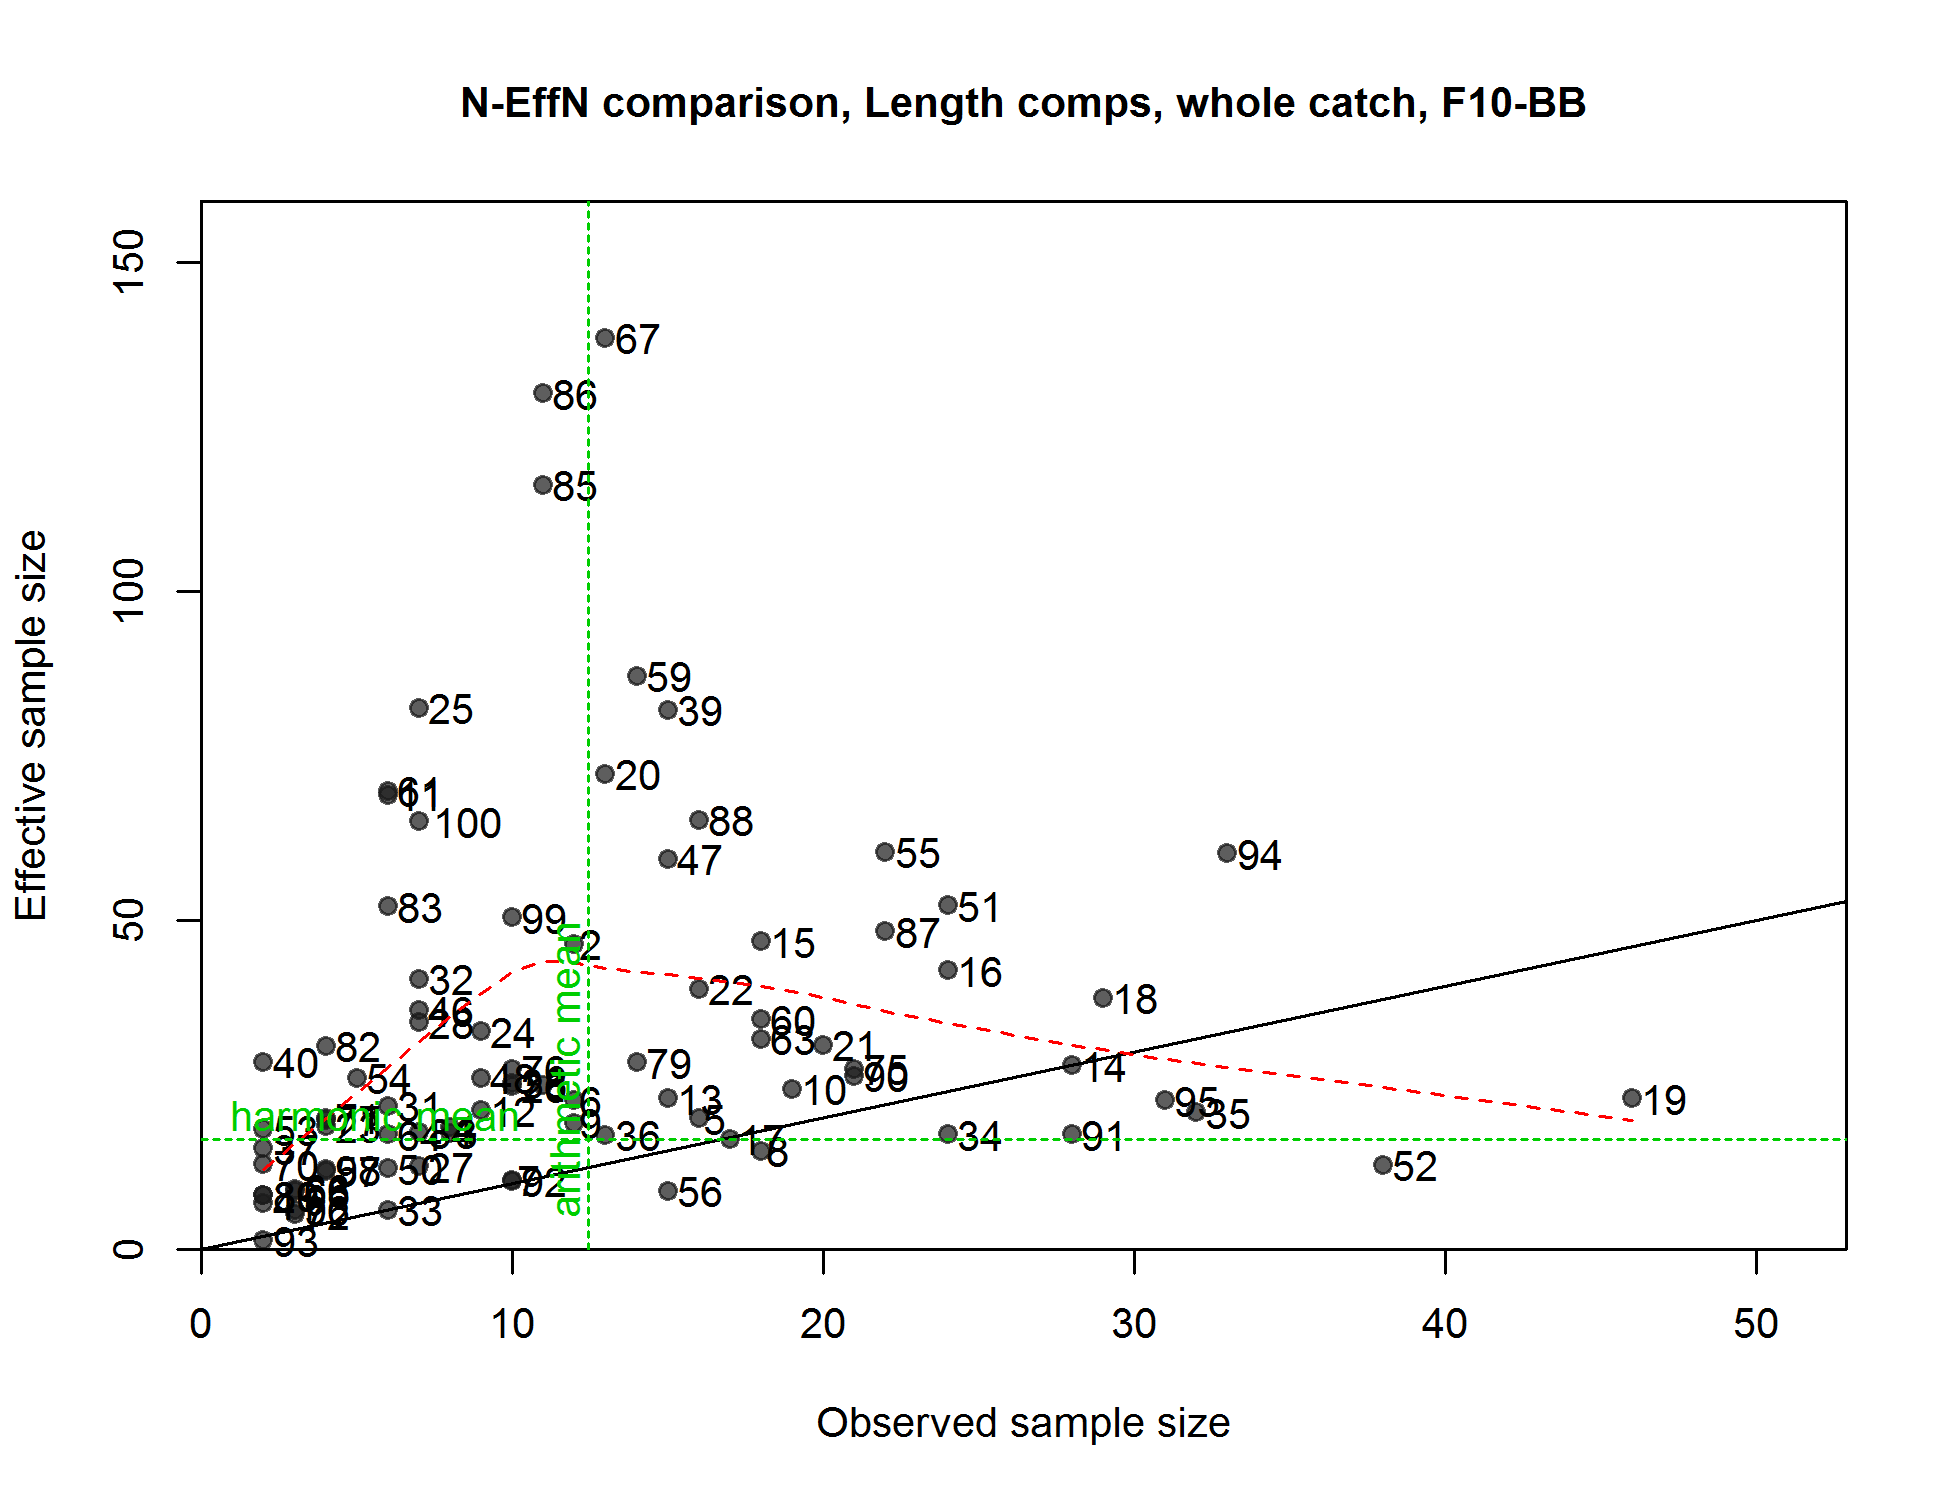
N-EffN comparison, Length comps, whole catch, F10-BB
file: comp_lenfit_sampsize_flt10mkt0.png
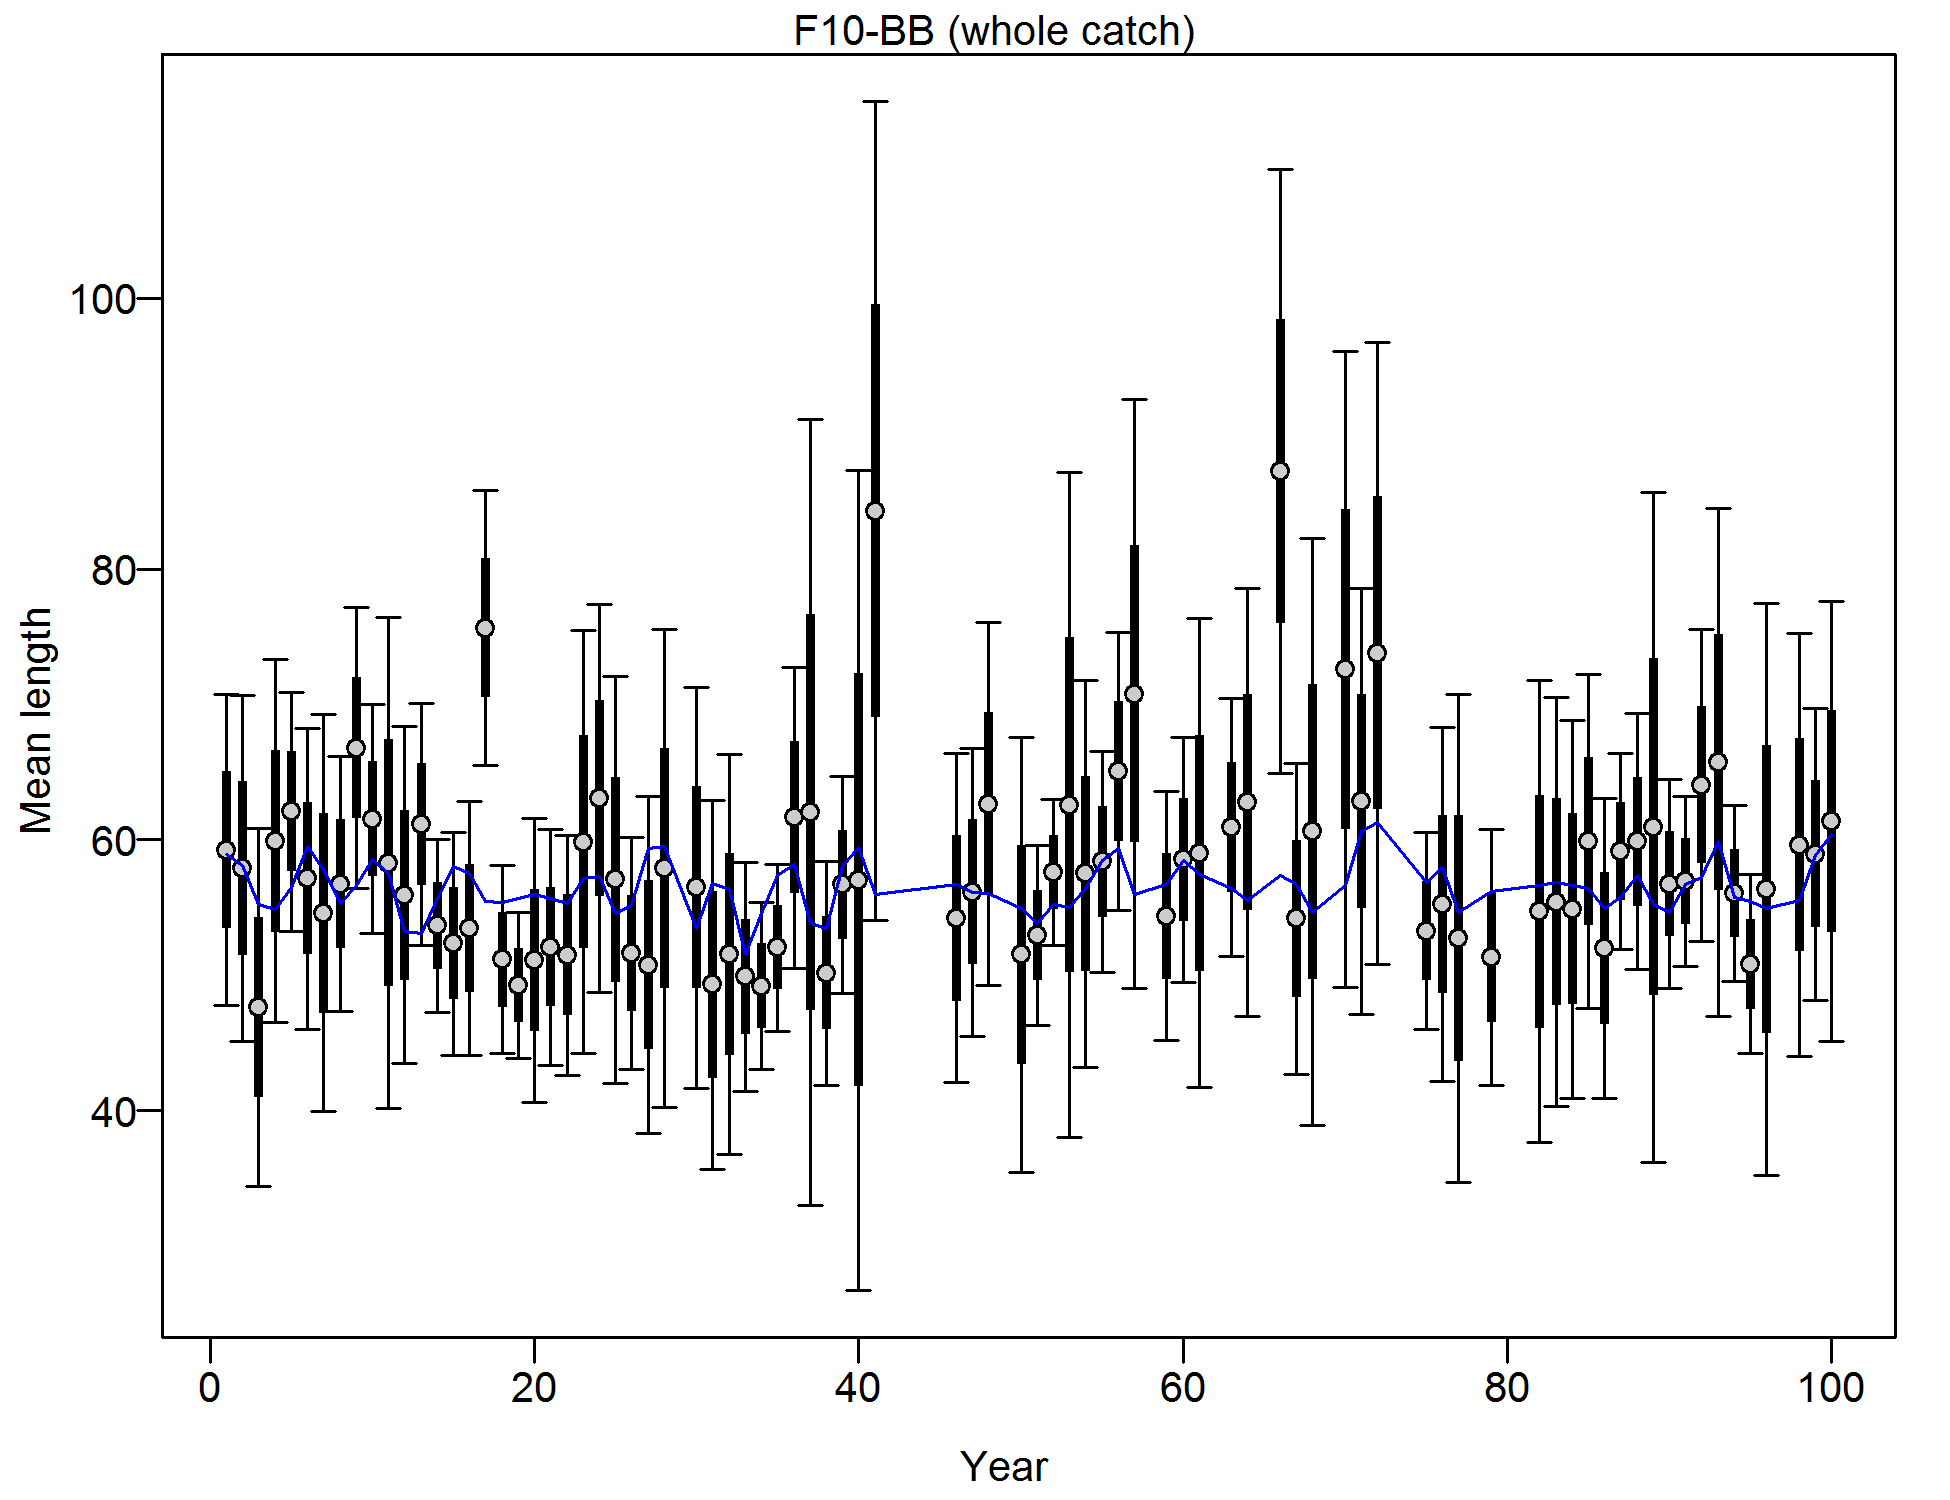
Mean length for F10-BB with 95% confidence intervals based on current samples sizes.
Francis data weighting method TA1.8: thinner intervals (with capped ends) show result of further adjusting sample sizes based on suggested multiplier (with 95% interval) for len data from F10-BB:
0.2536 (0.171-0.4001)
For more info, see
Francis, R.I.C.C. (2011). Data weighting in statistical fisheries stock assessment models. Can. J. Fish. Aquat. Sci. 68: 1124-1138.
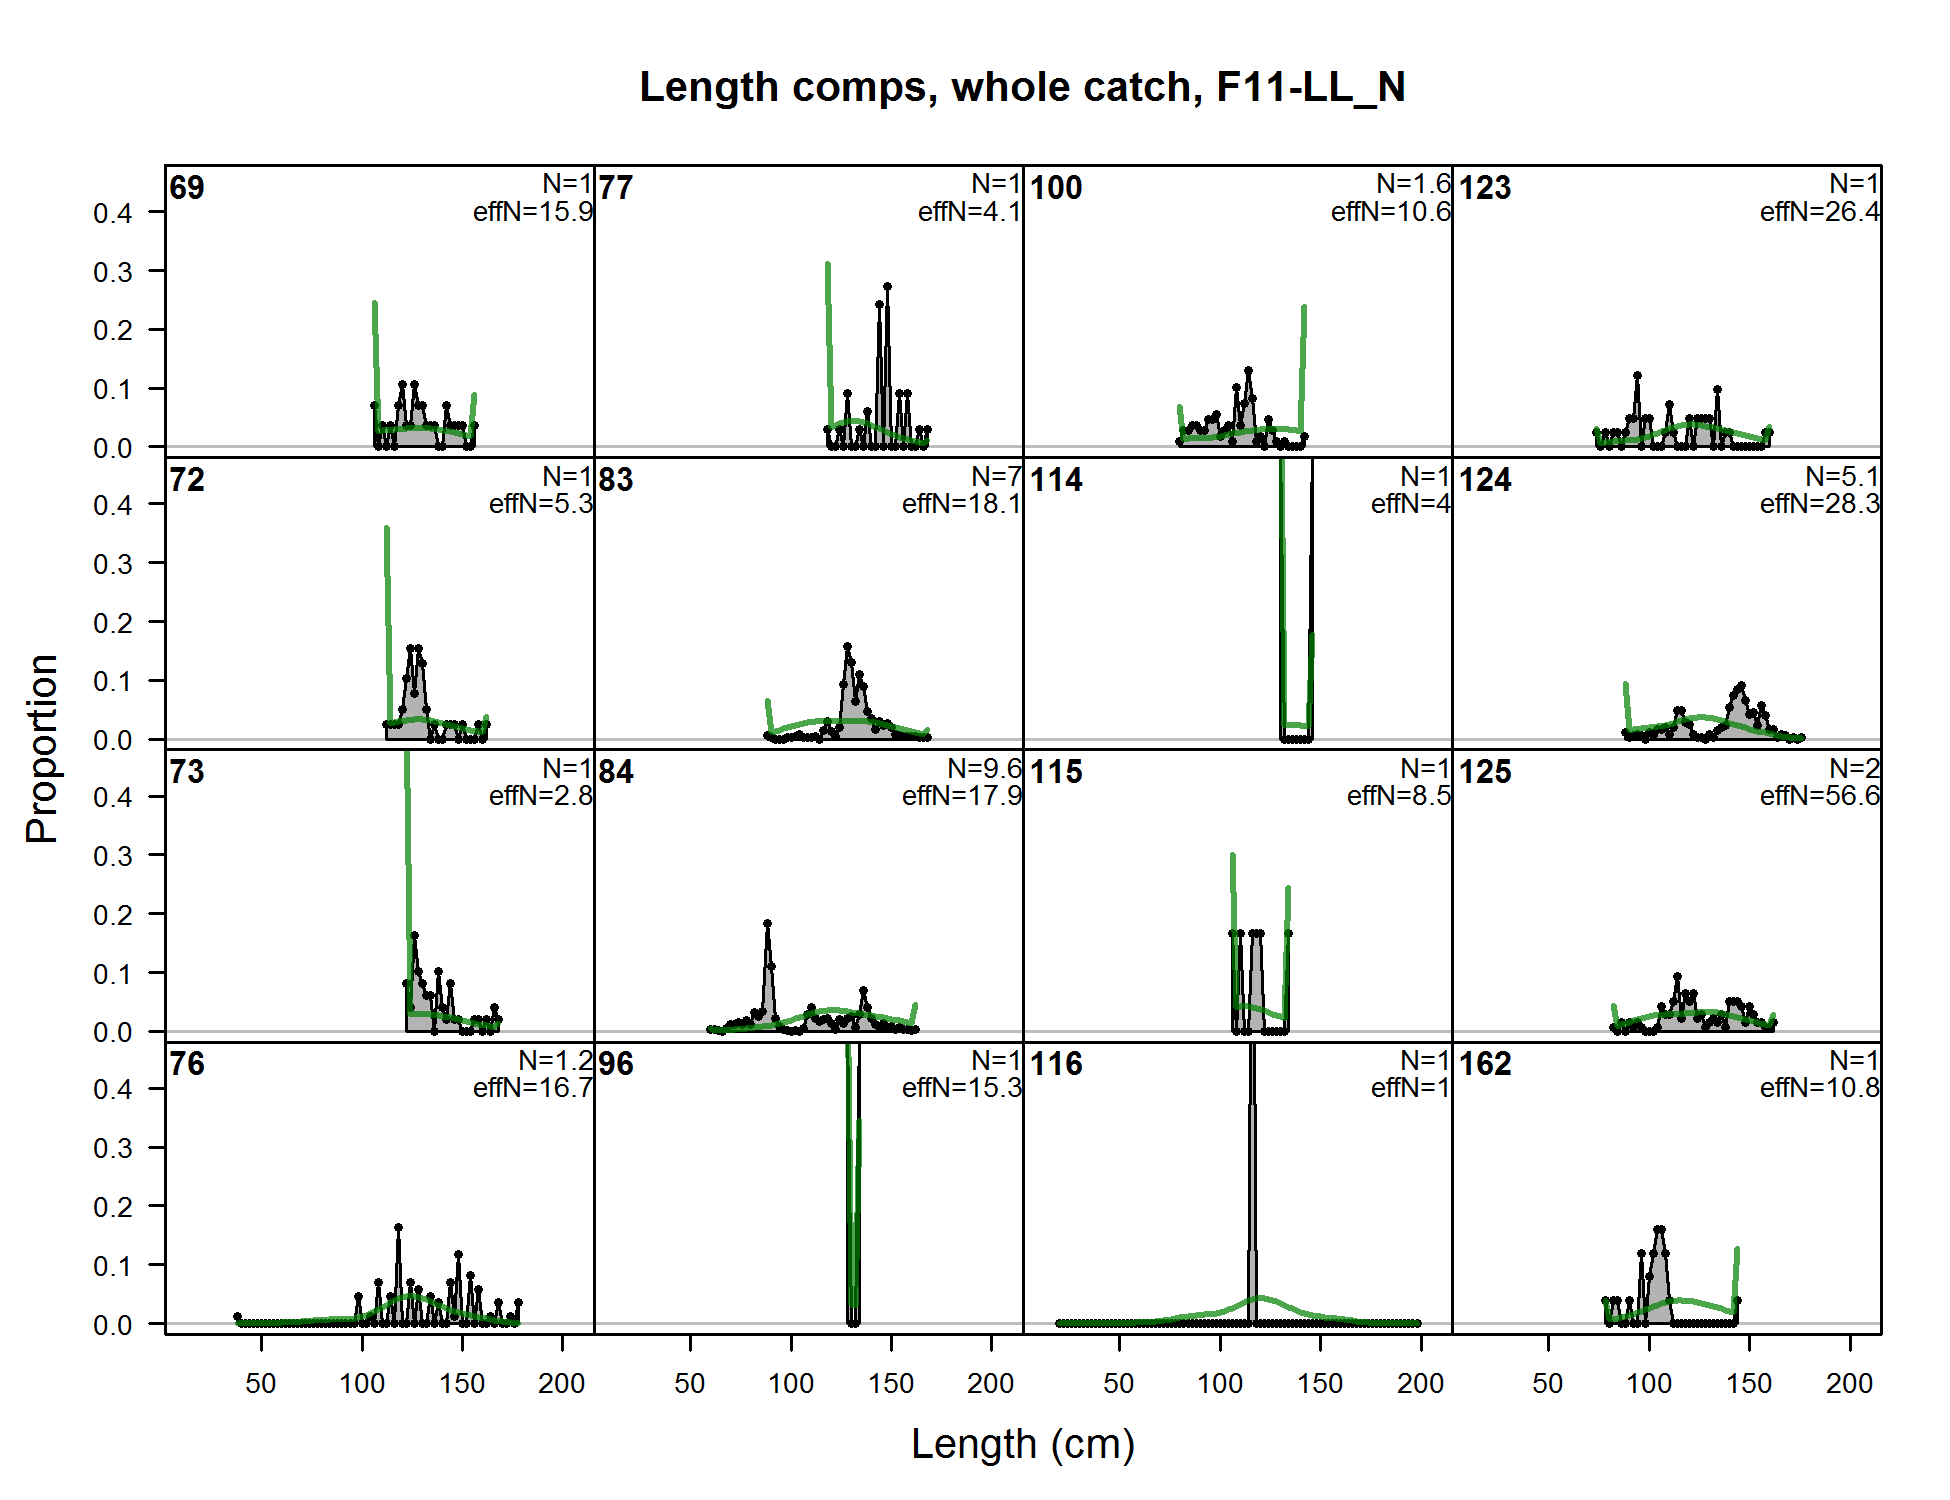
Length comps, whole catch, F11-LL_N (plot 1 of 2)
file: comp_lenfit_flt11mkt0_page1.png
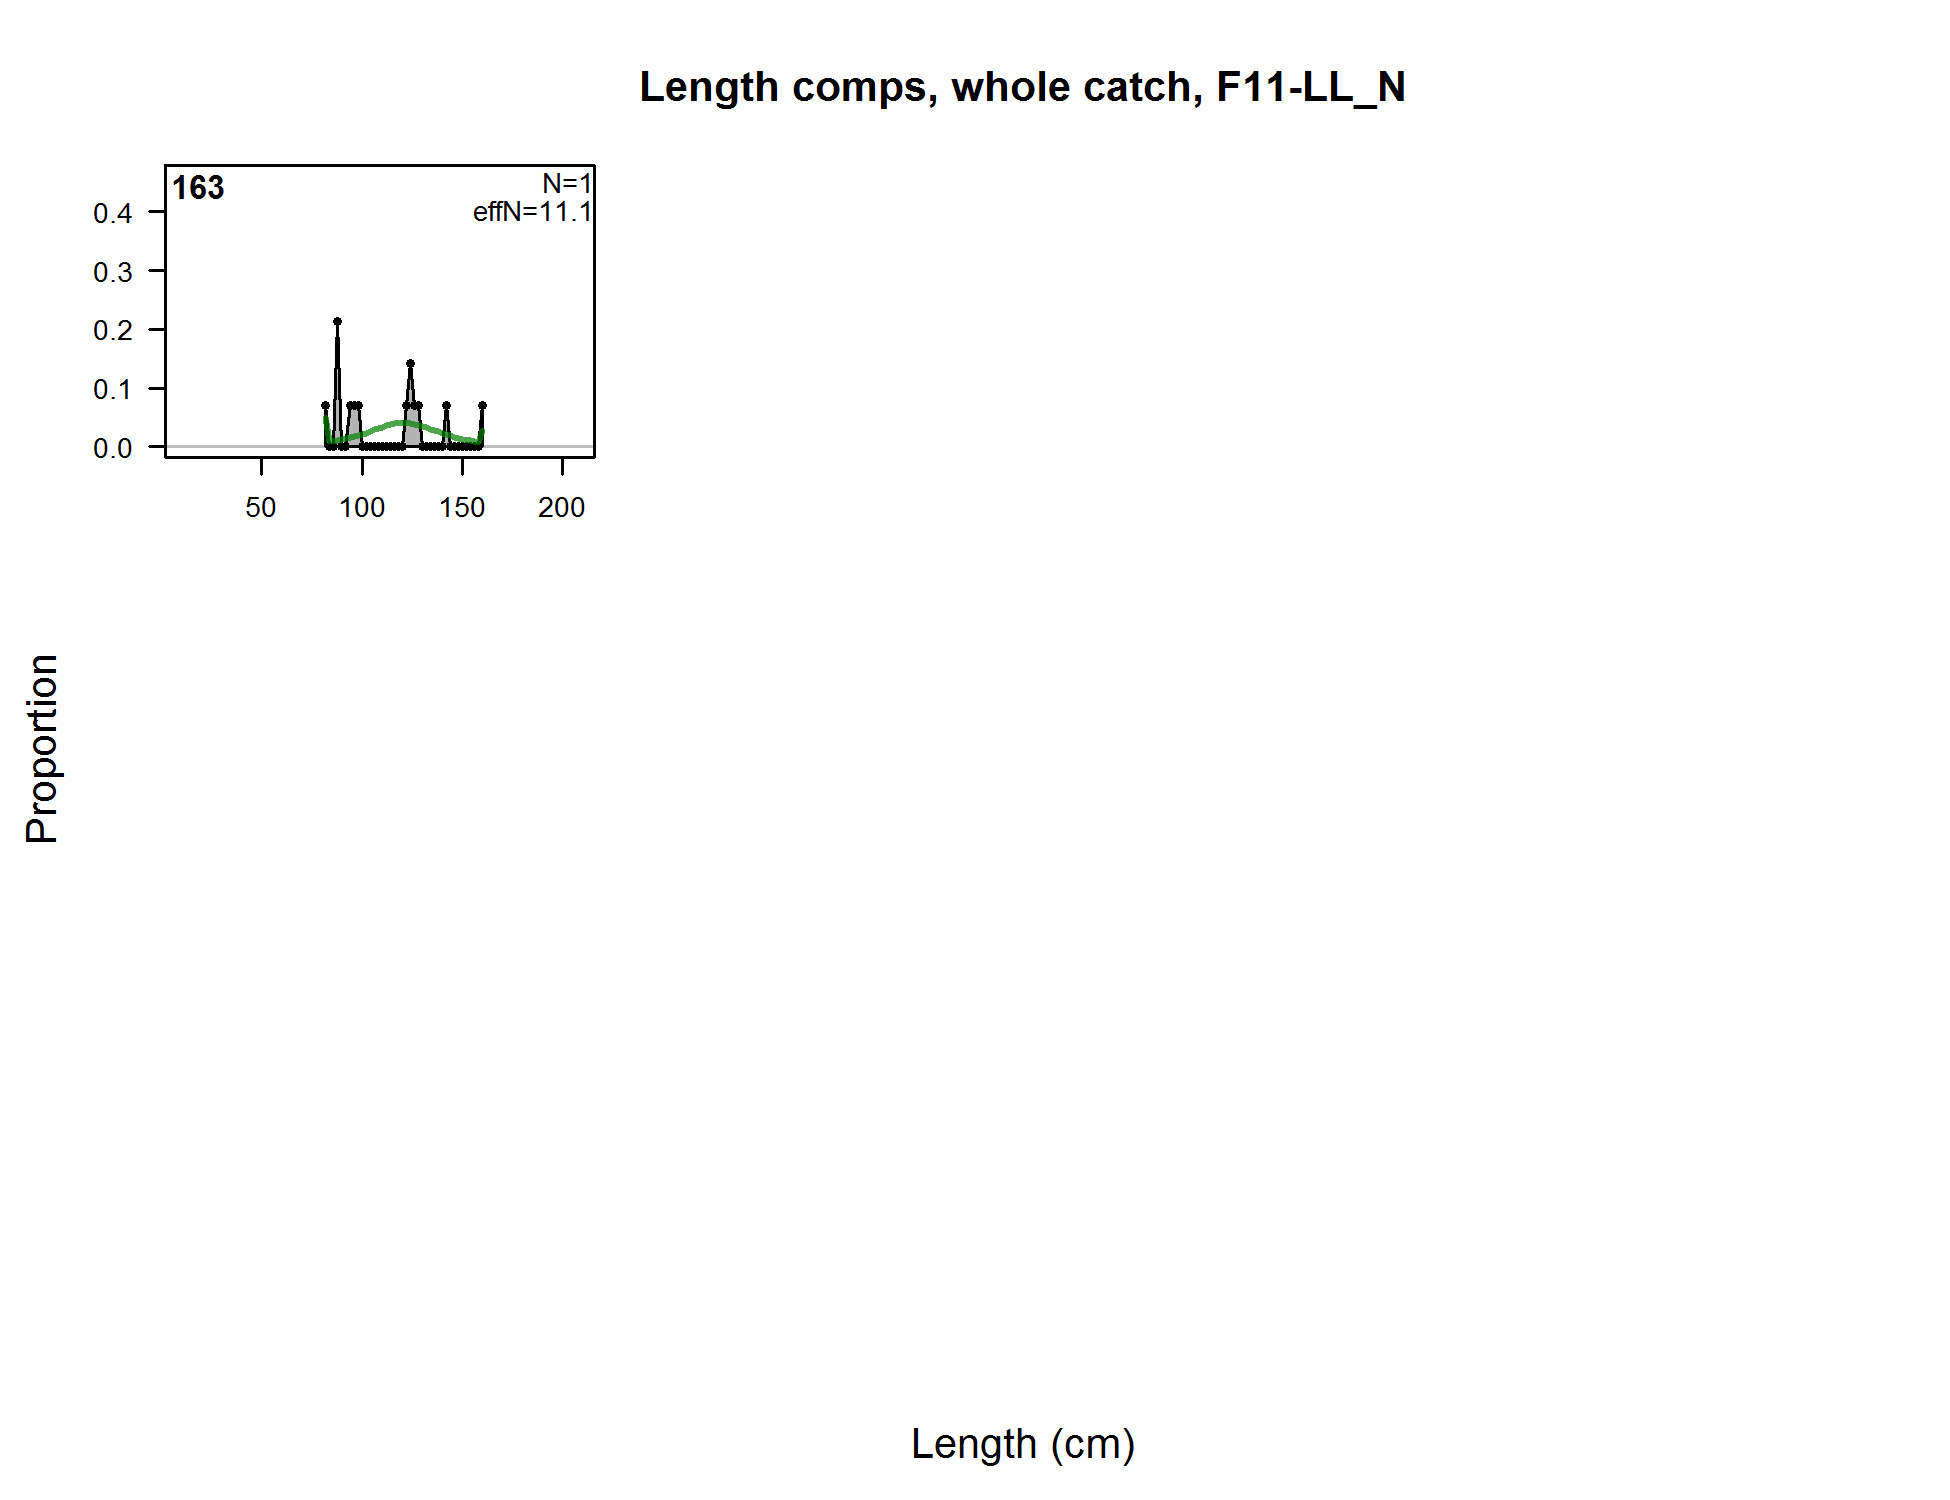
Length comps, whole catch, F11-LL_N (plot 1 of 2) (plot 2 of 2)
file: comp_lenfit_flt11mkt0_page2.png
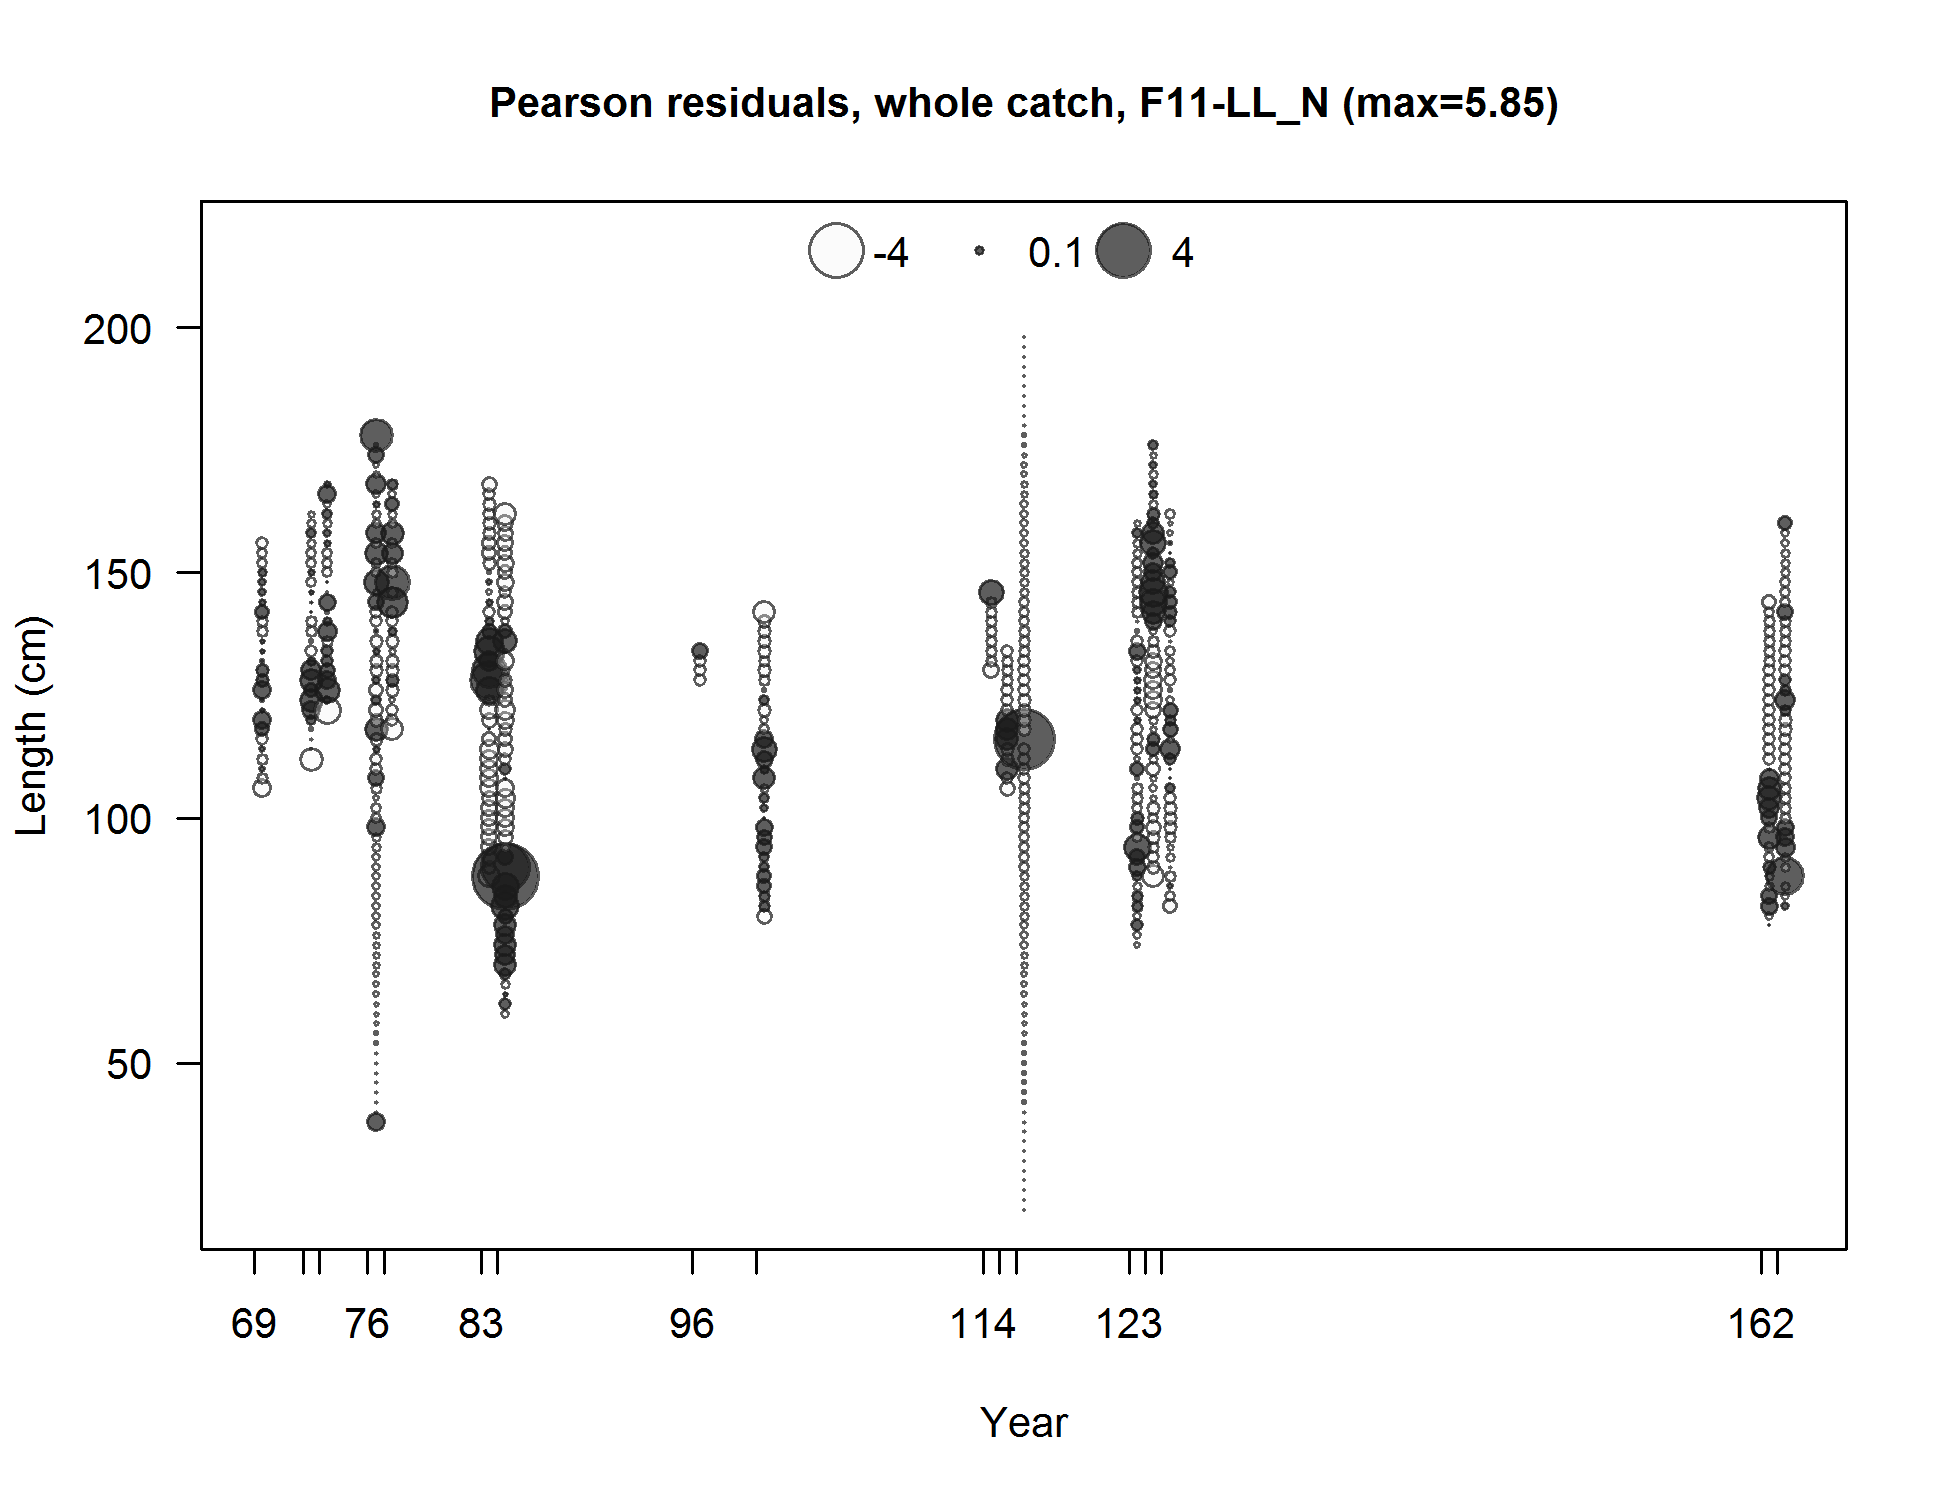
Pearson residuals, whole catch, F11-LL_N (max=5.85) (plot 2 of 2)
Closed bubbles are positive residuals (observed > expected) and open bubbles are negative residuals (observed < expected).
file: comp_lenfit_residsflt11mkt0_page2.png
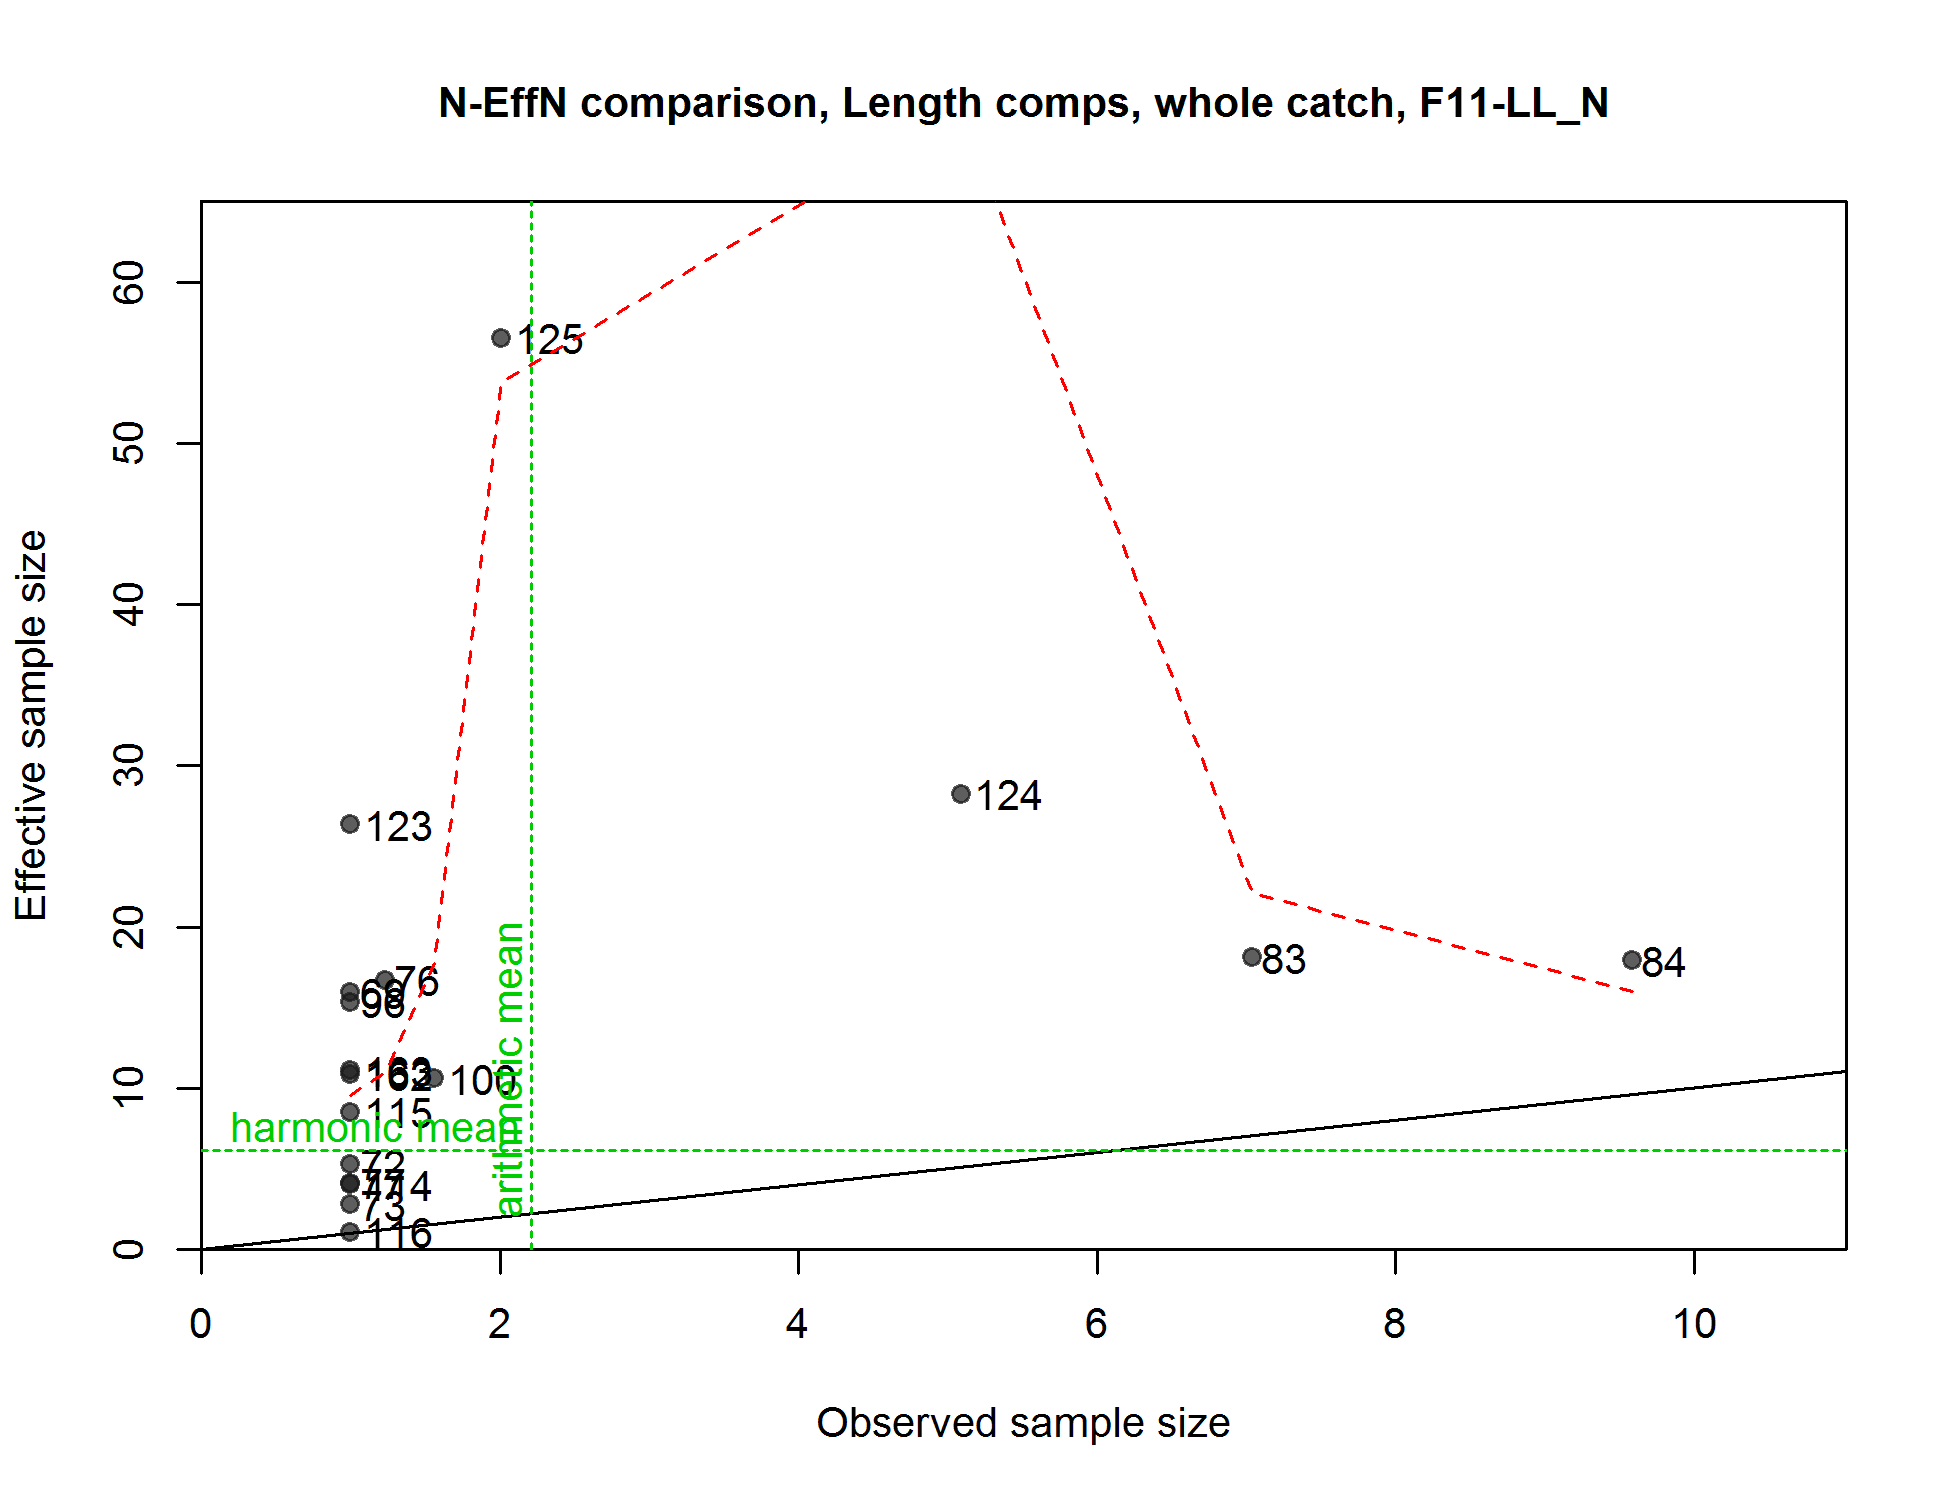
N-EffN comparison, Length comps, whole catch, F11-LL_N
file: comp_lenfit_sampsize_flt11mkt0.png
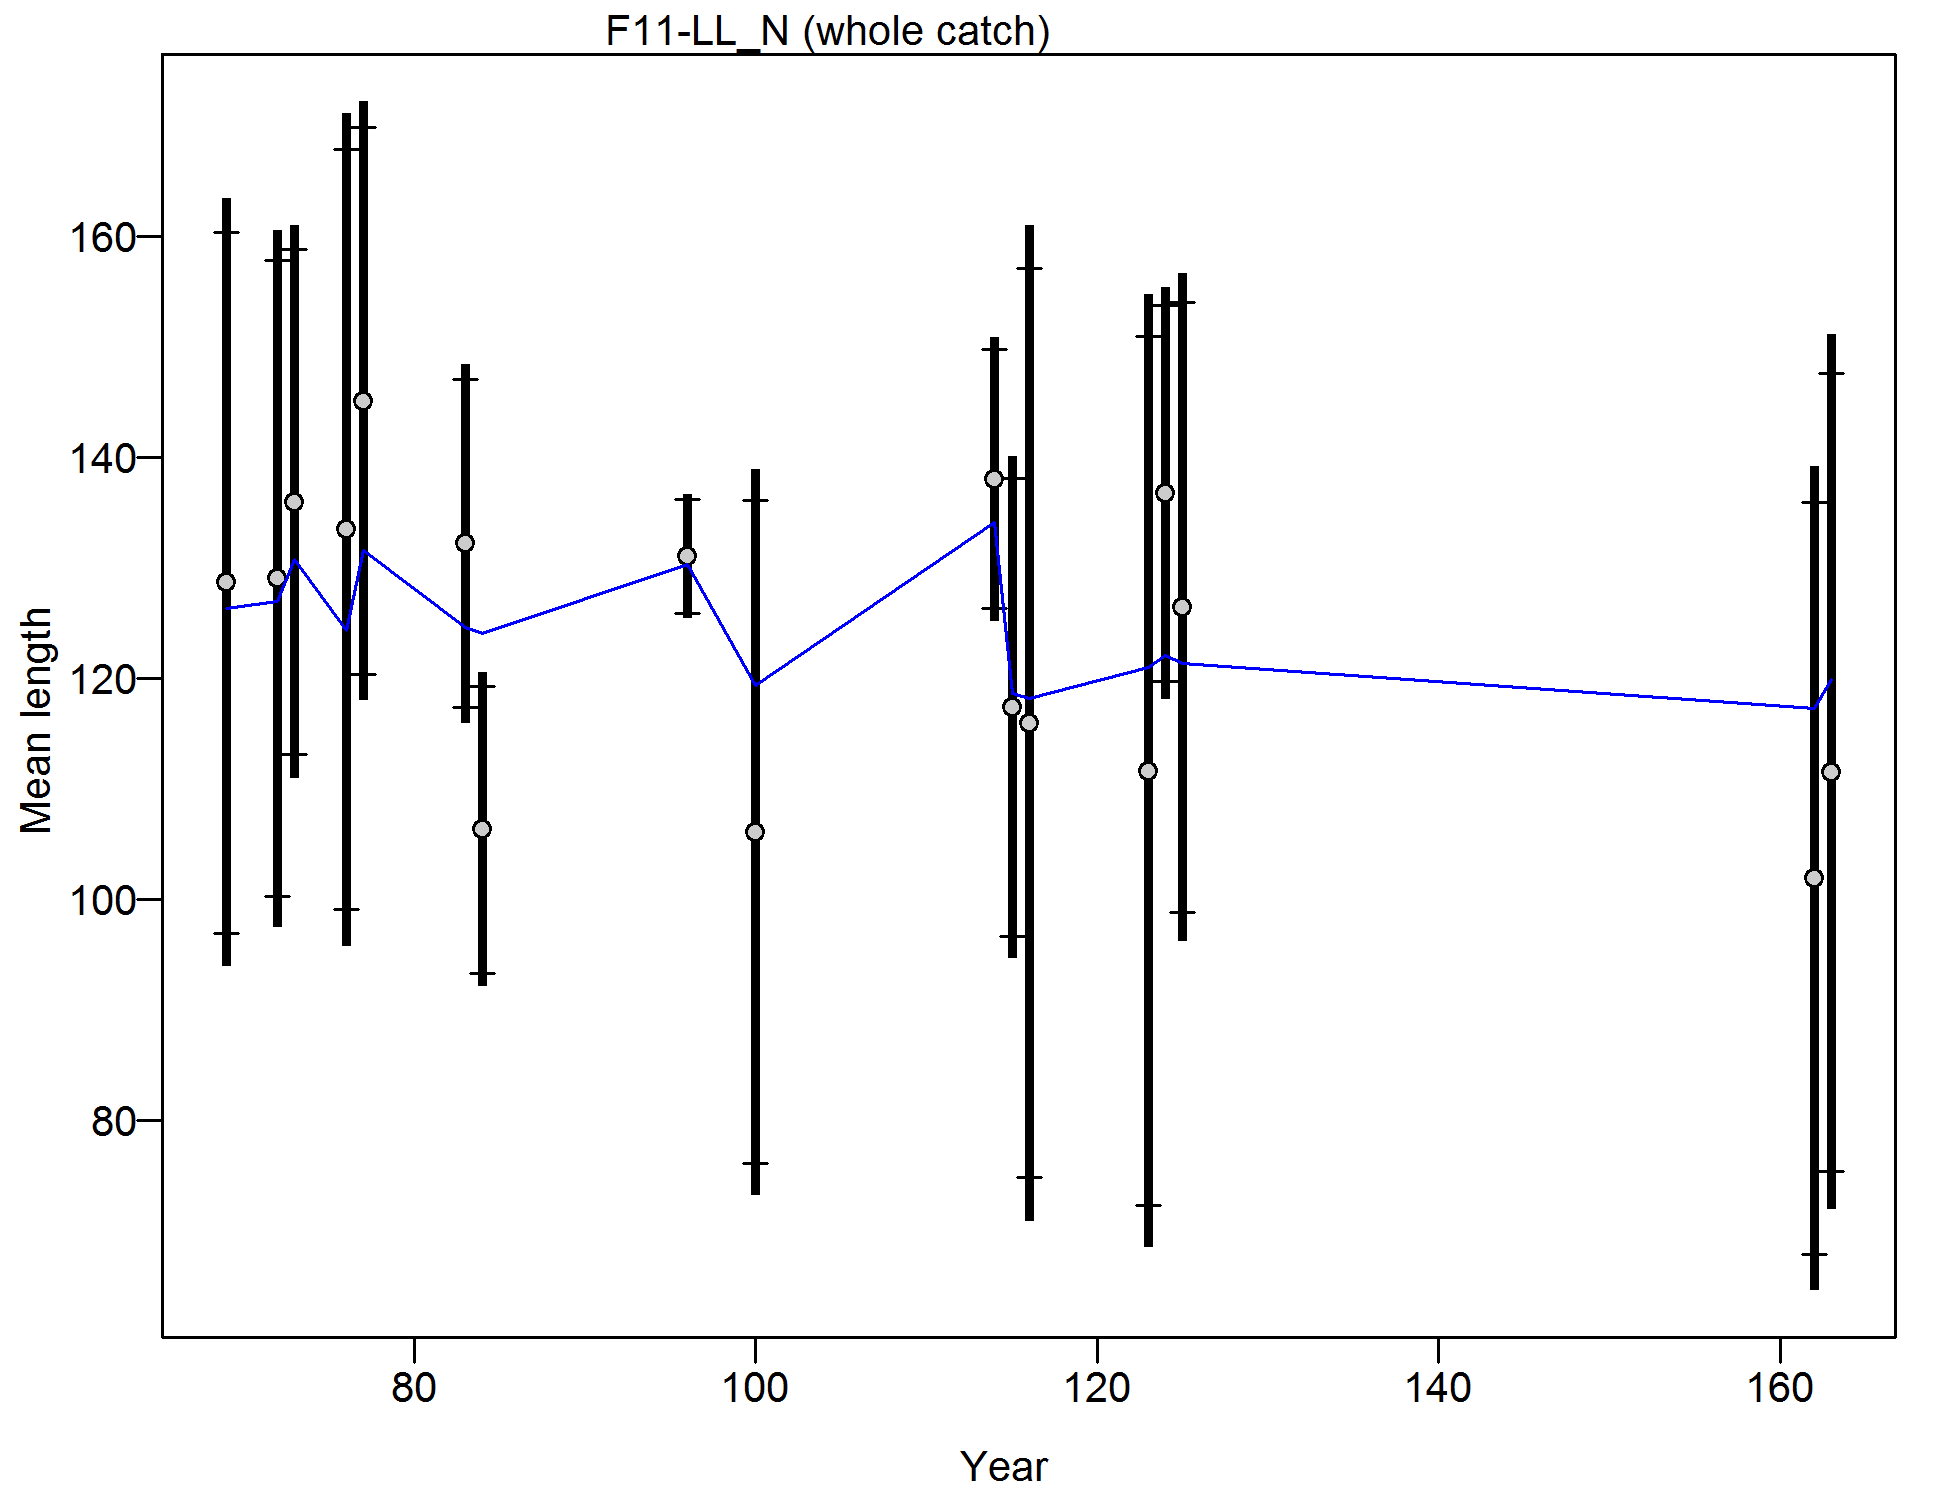
Mean length for F11-LL_N with 95% confidence intervals based on current samples sizes.
Francis data weighting method TA1.8: thinner intervals (with capped ends) show result of further adjusting sample sizes based on suggested multiplier (with 95% interval) for len data from F11-LL_N:
1.201 (0.6155-4.2041)
For more info, see
Francis, R.I.C.C. (2011). Data weighting in statistical fisheries stock assessment models. Can. J. Fish. Aquat. Sci. 68: 1124-1138.
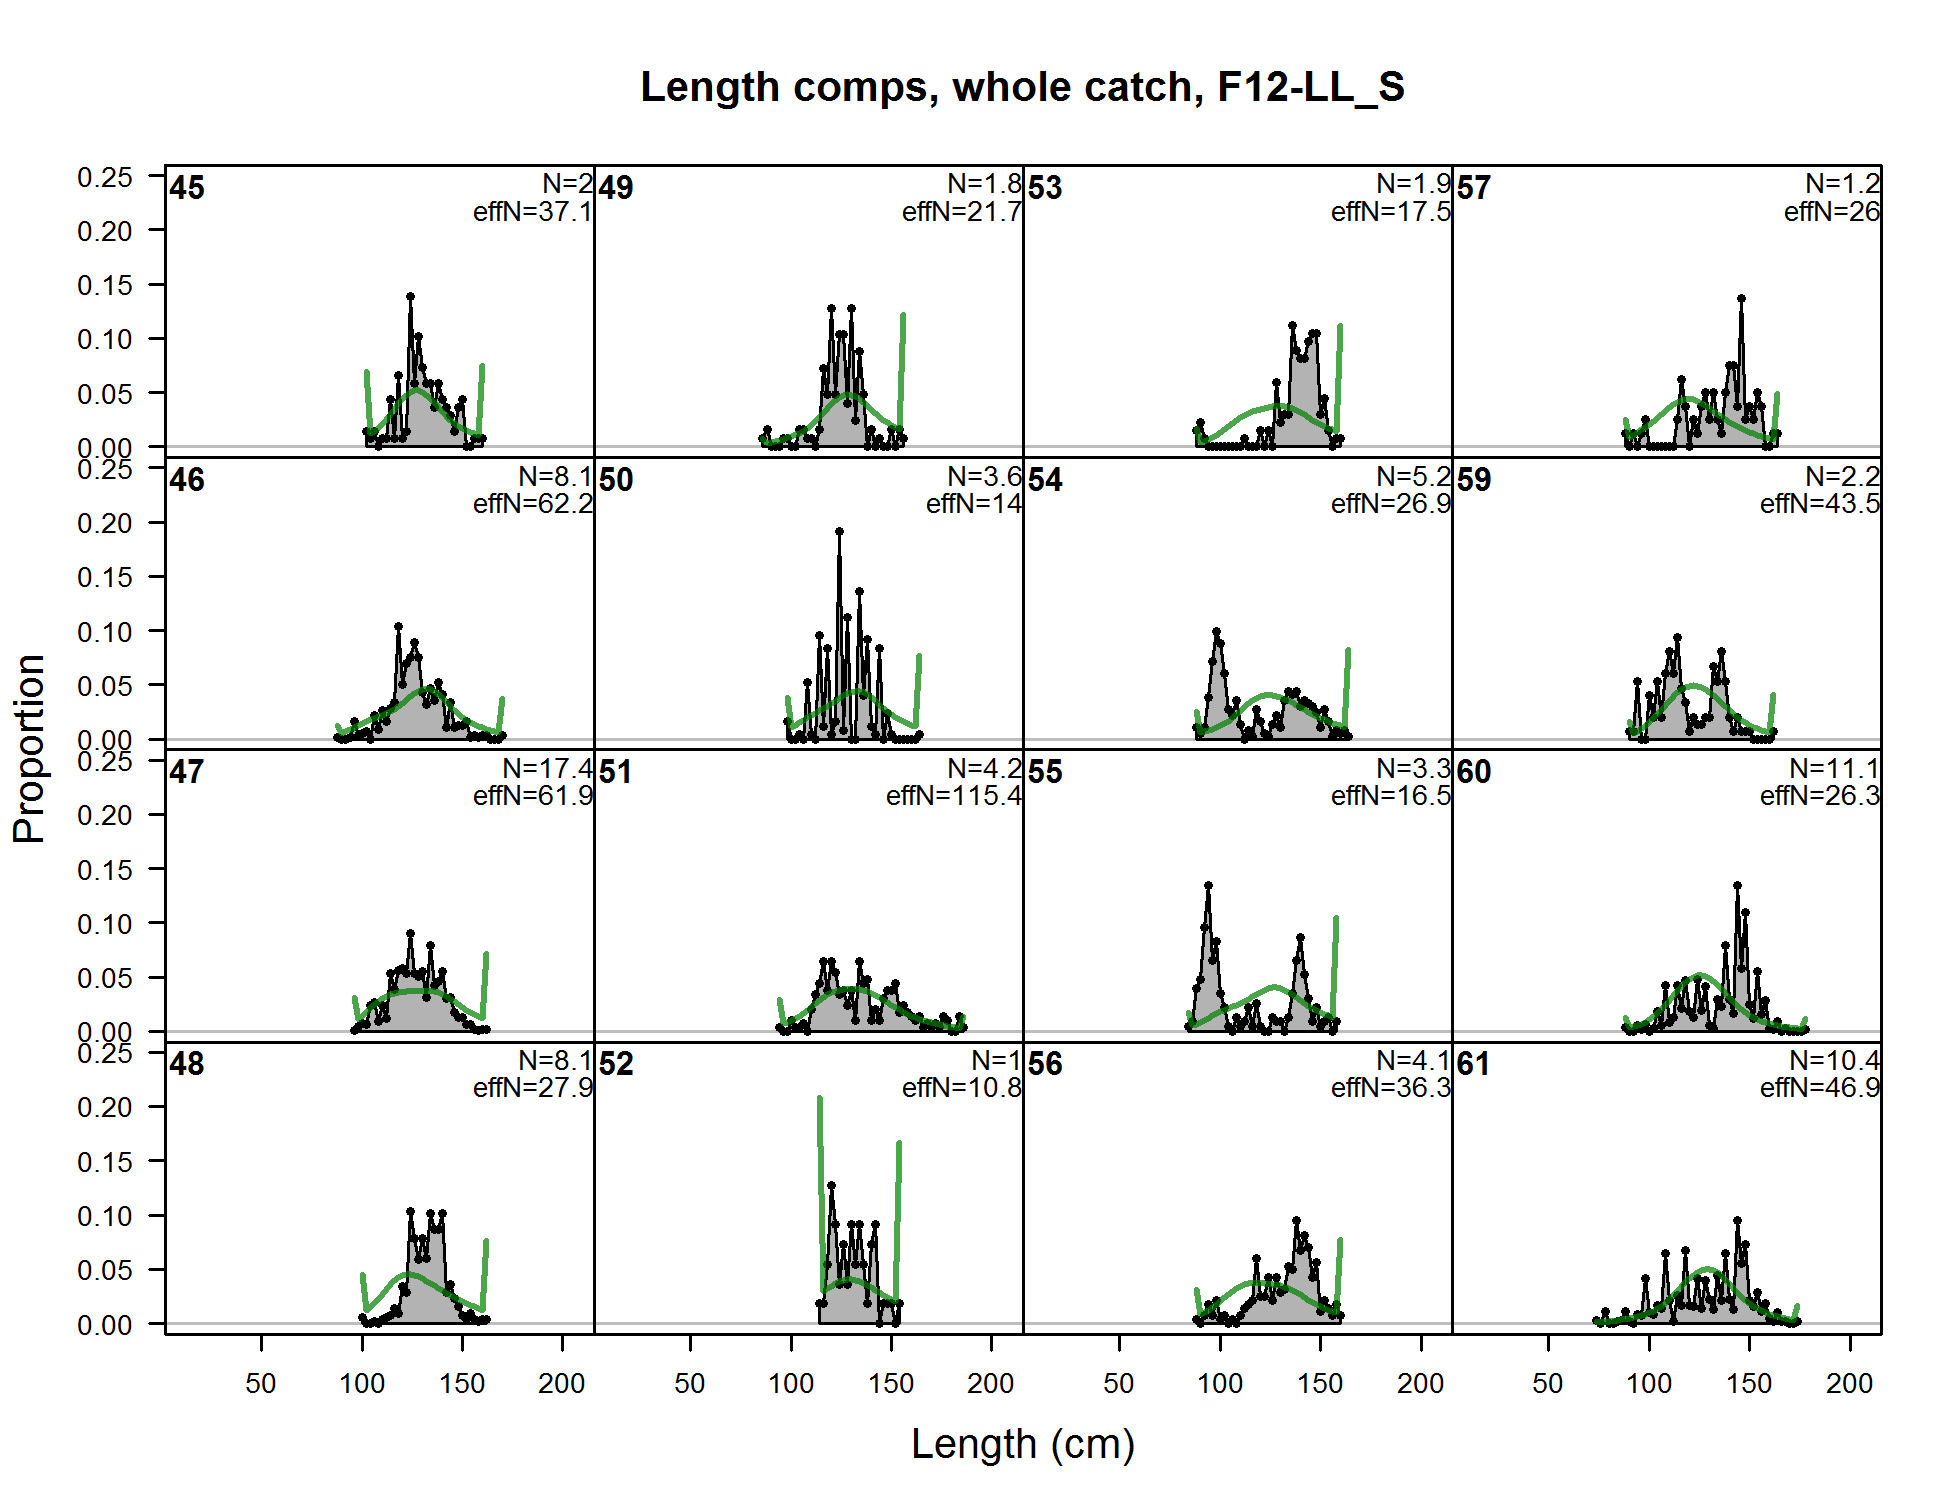
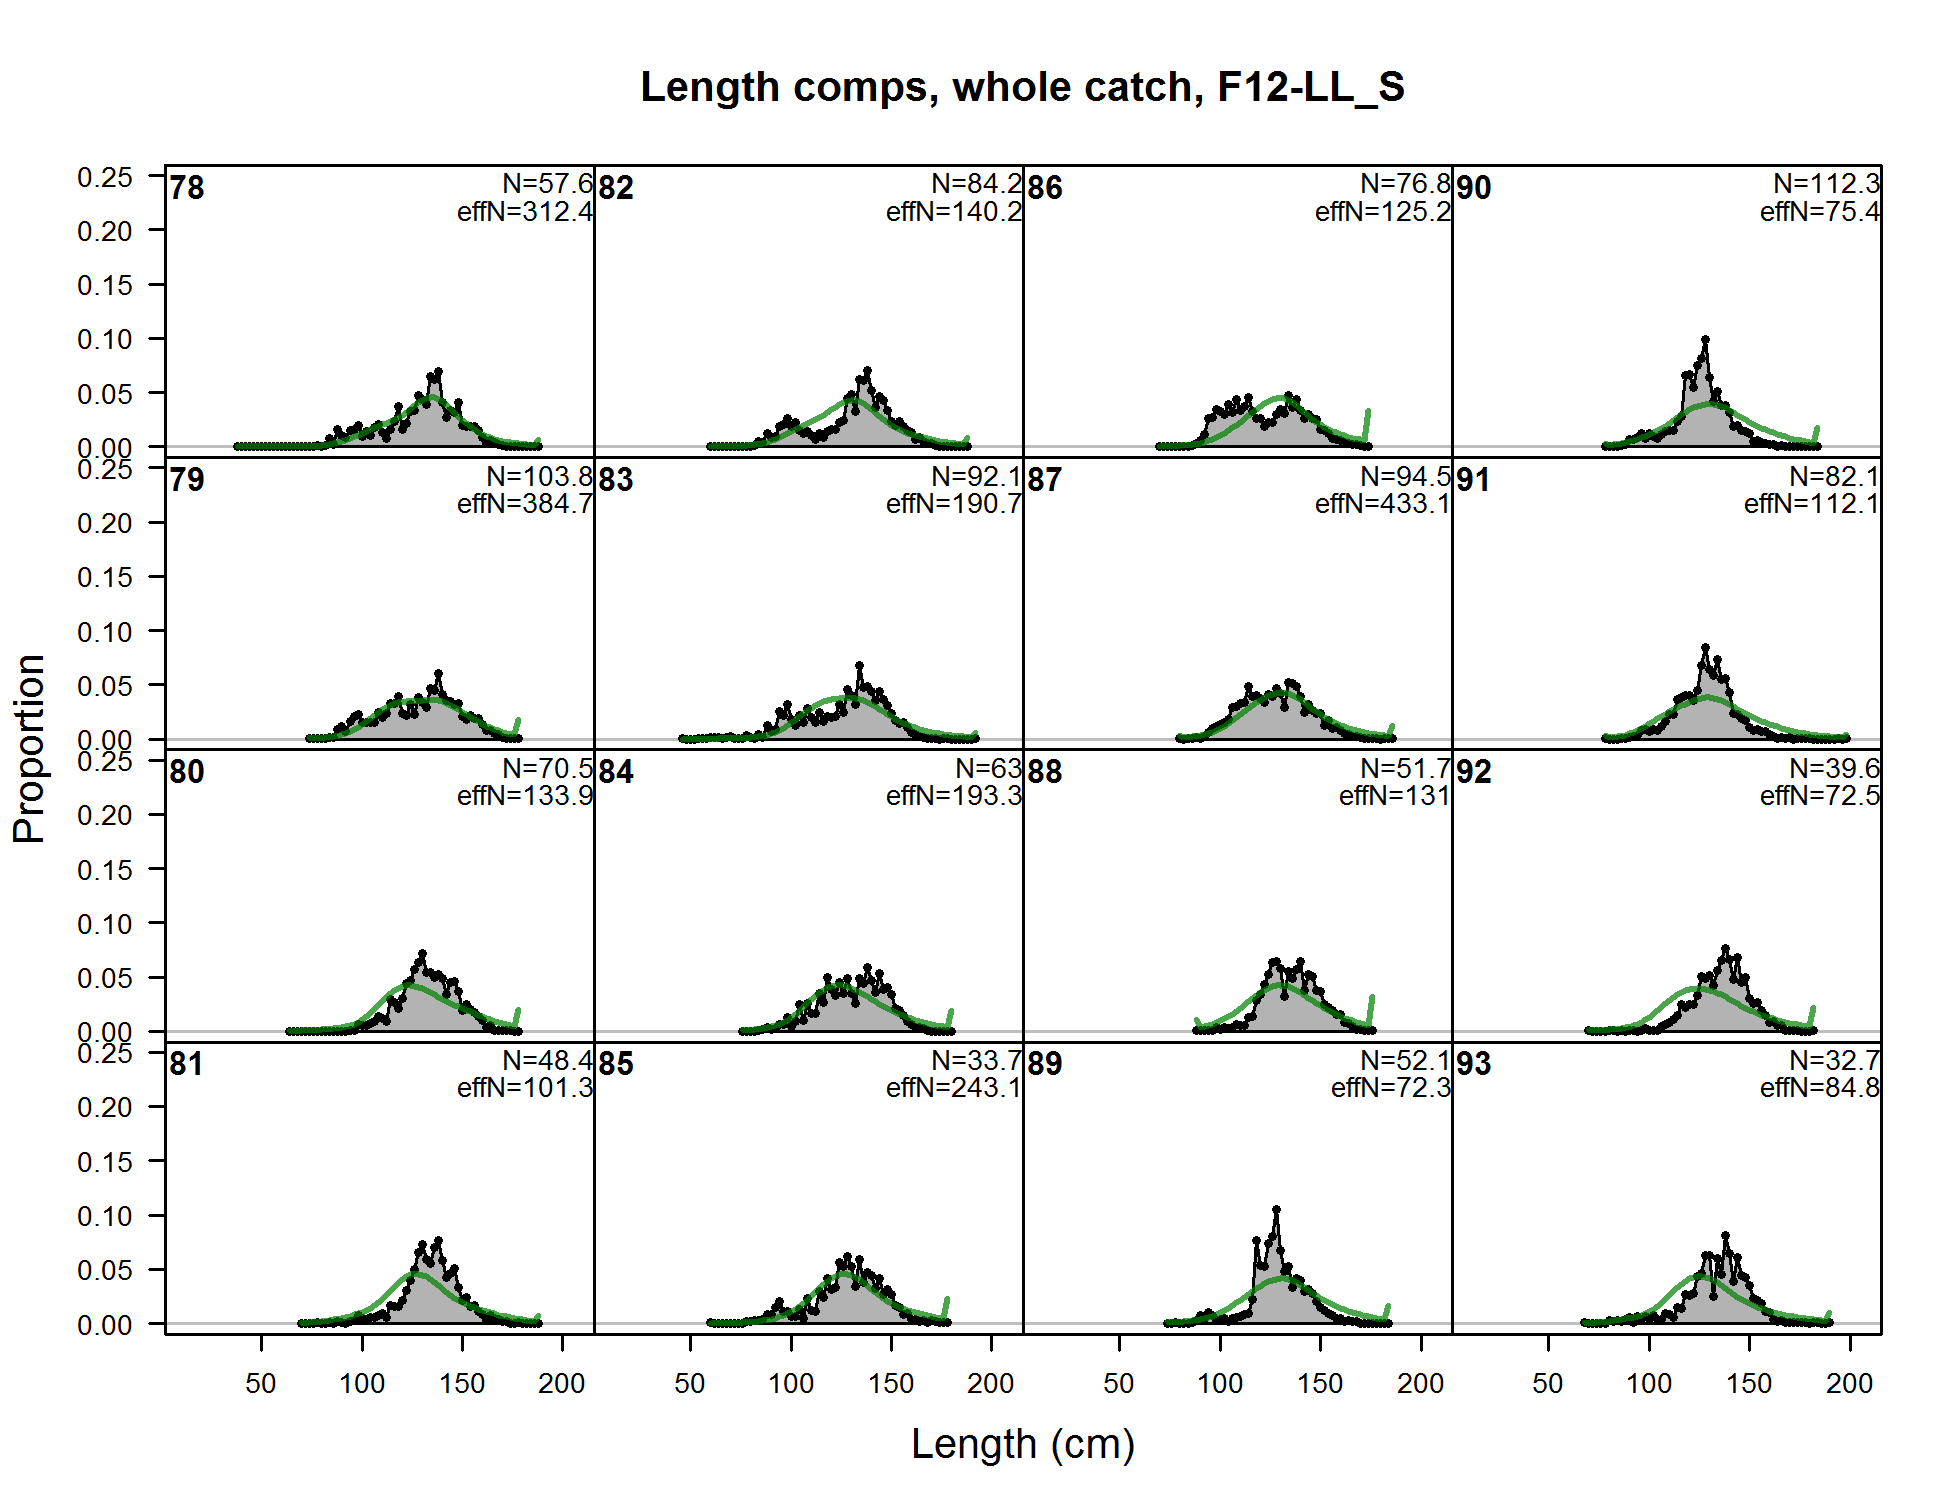
Length comps, whole catch, F12-LL_S (plot 1 of 8)
file: comp_lenfit_flt12mkt0_page1.png
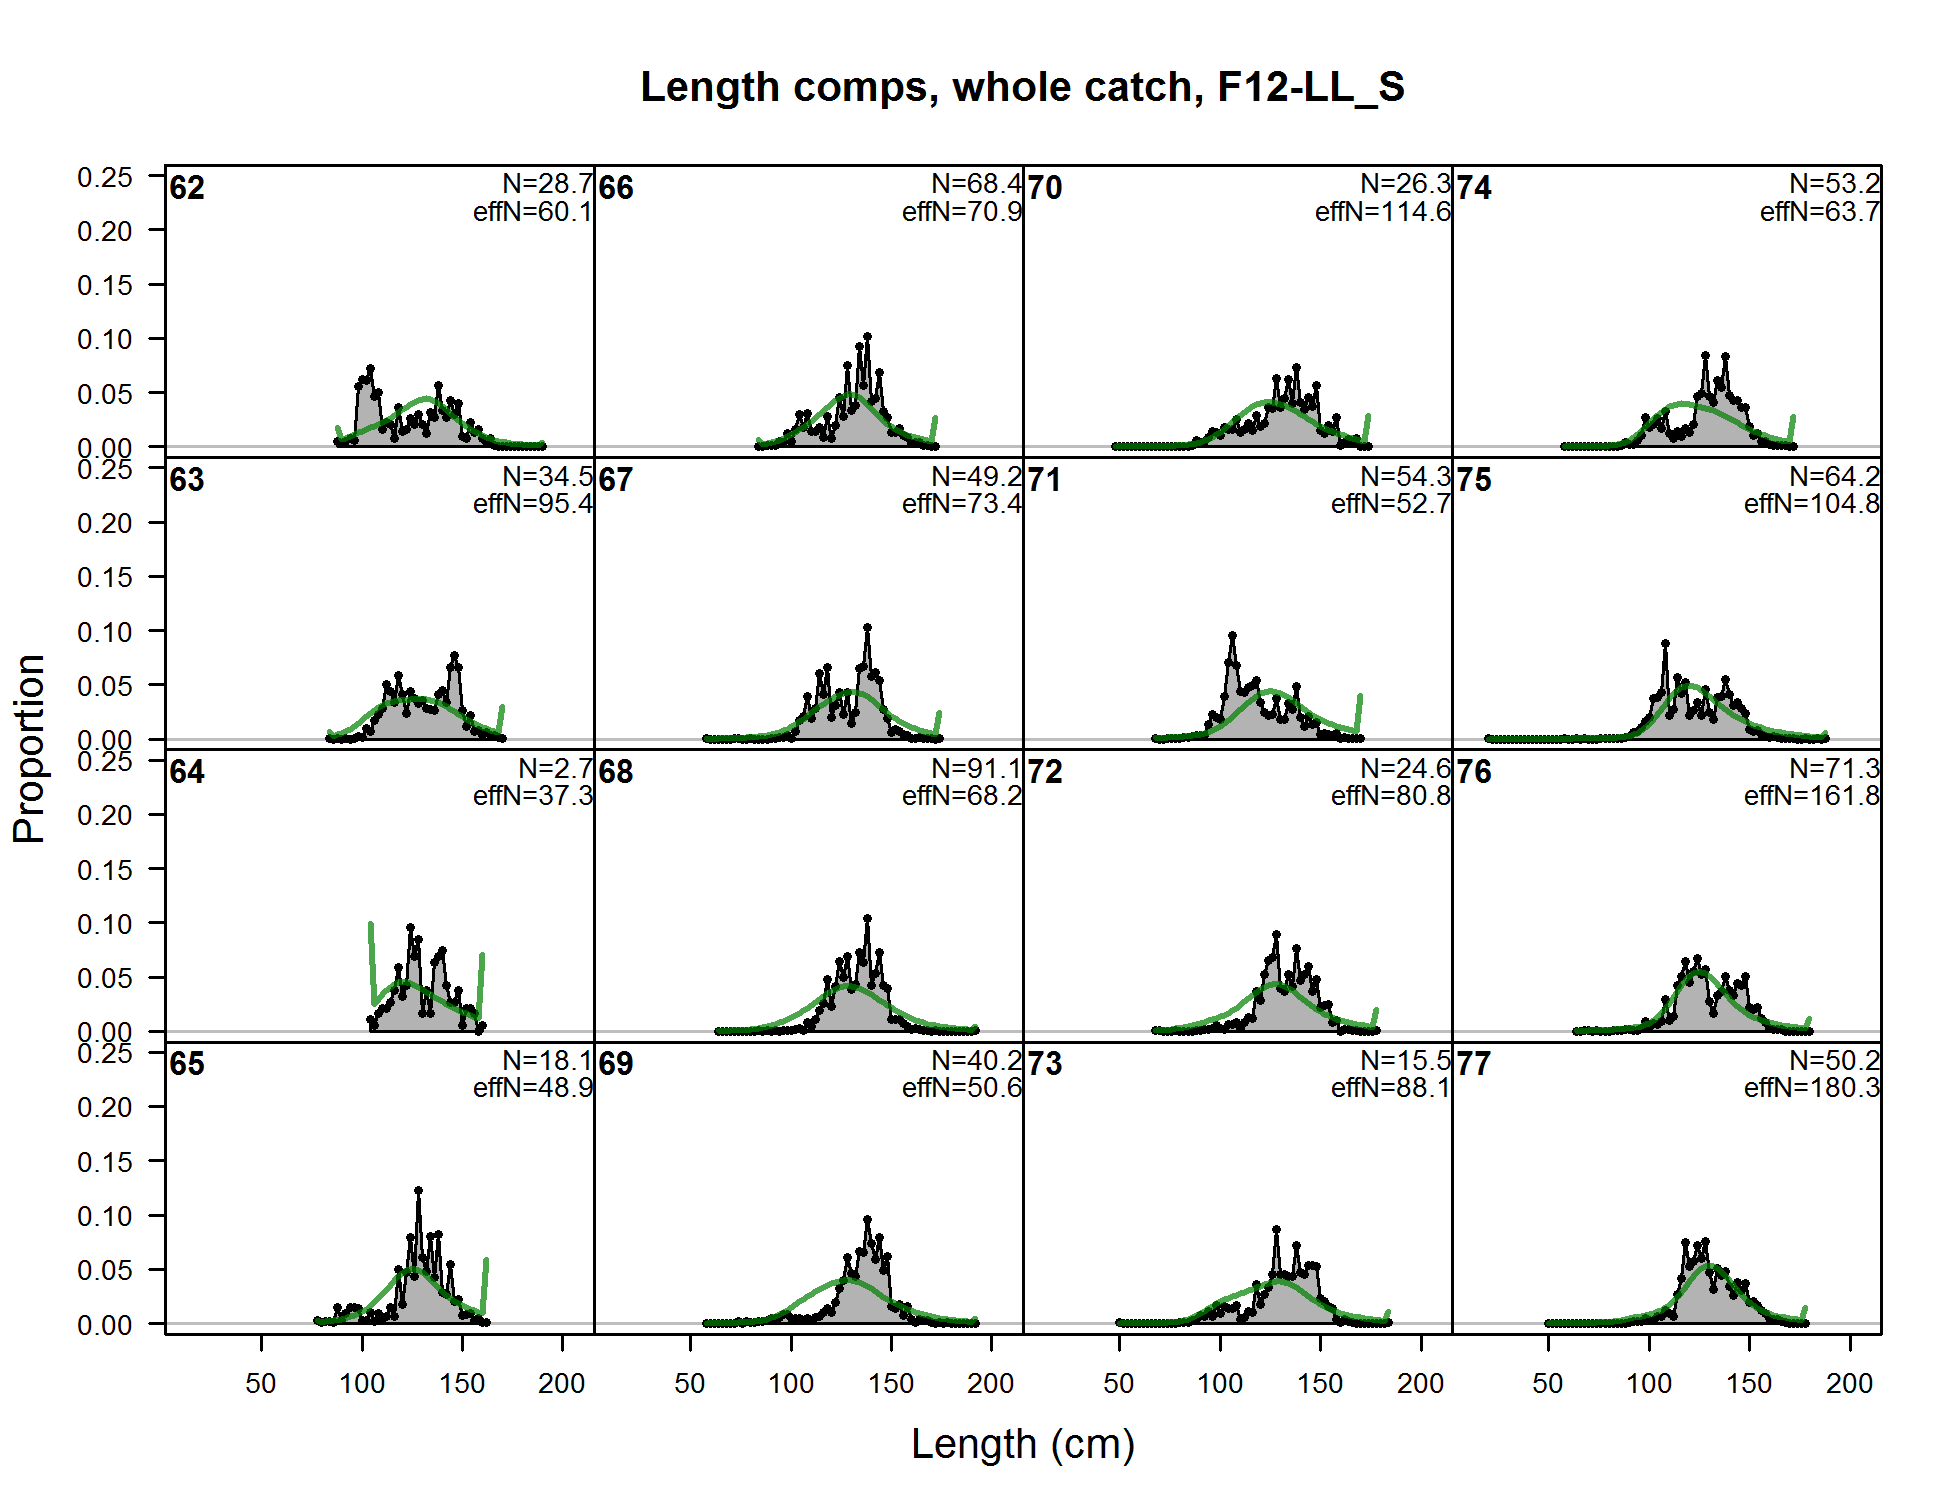
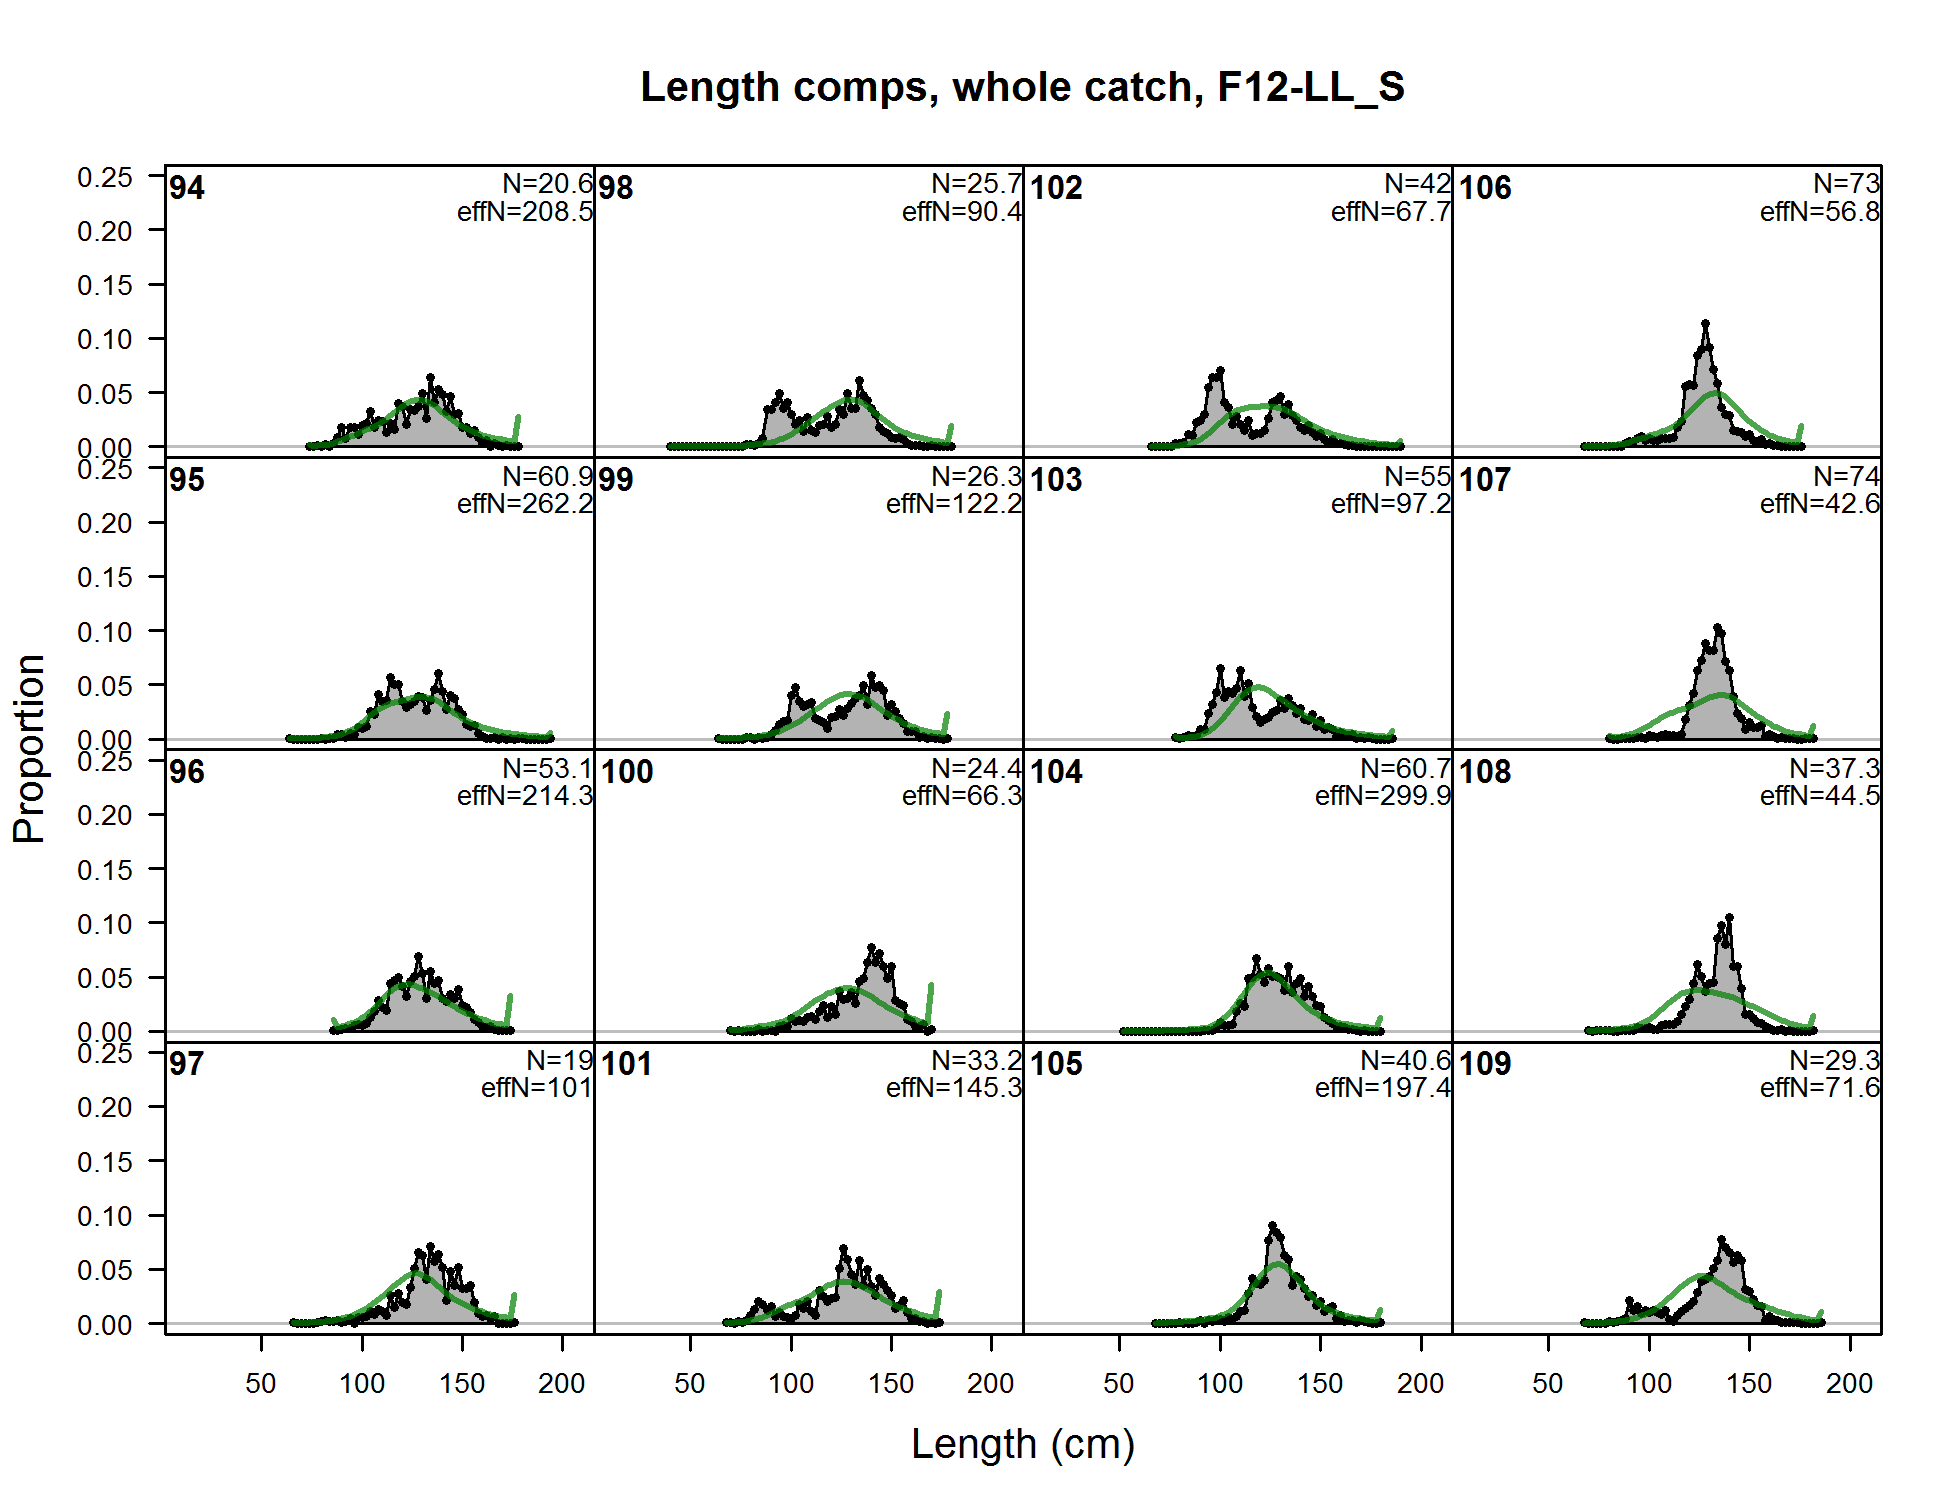
Length comps, whole catch, F12-LL_S (plot 1 of 8) (plot 2 of 8)
file: comp_lenfit_flt12mkt0_page2.png
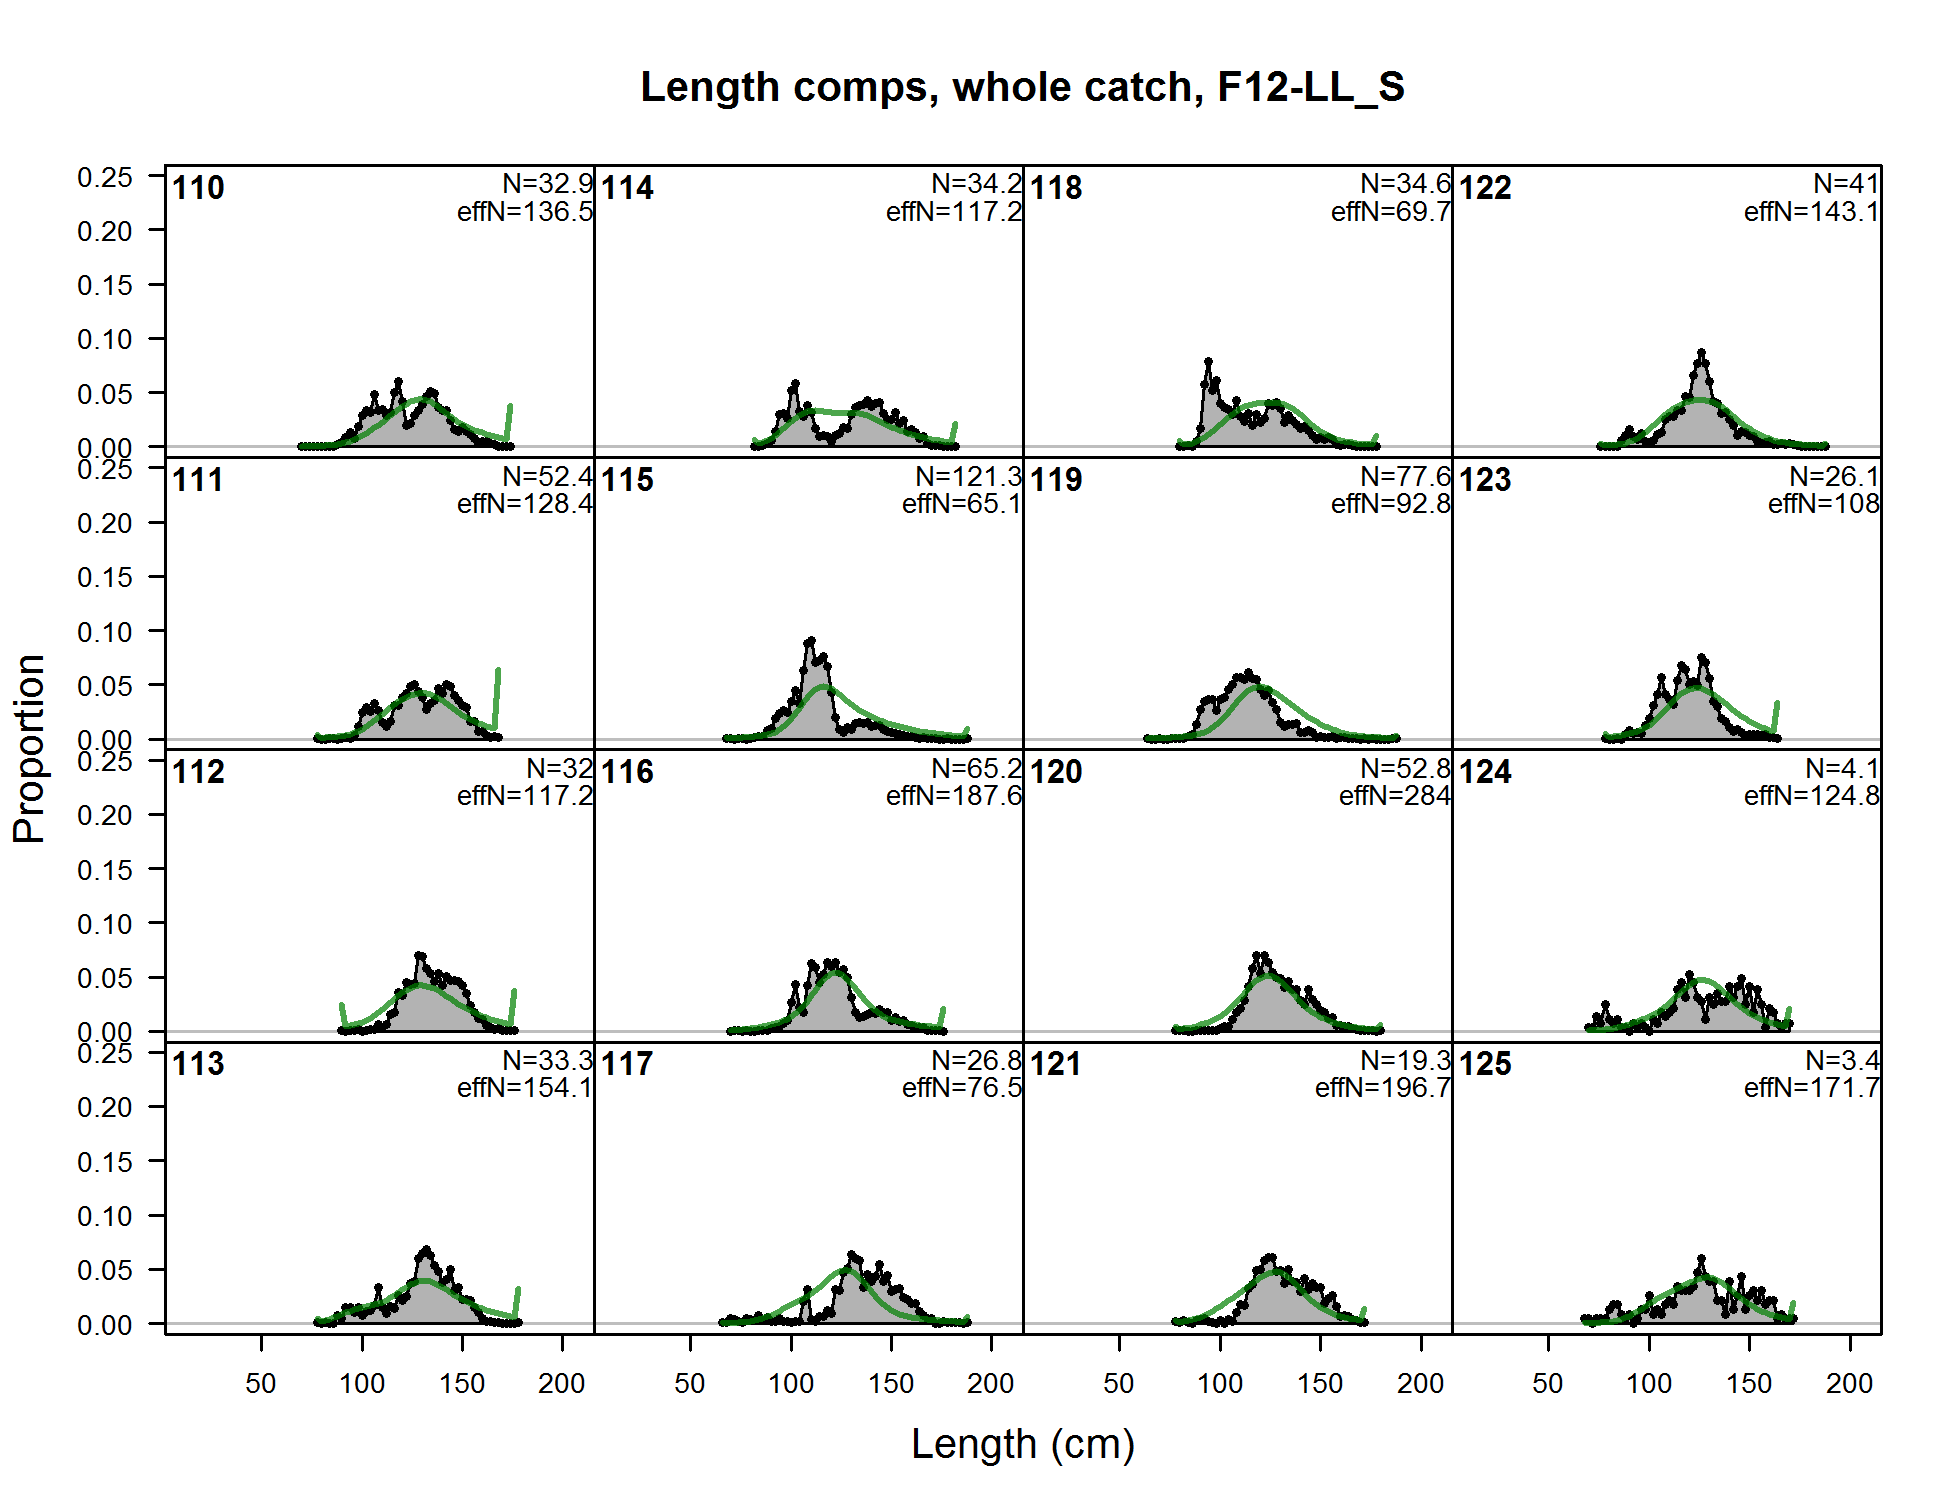
Length comps, whole catch, F12-LL_S (plot 1 of 8) (plot 2 of 8) (plot 3 of 8)
file: comp_lenfit_flt12mkt0_page3.png
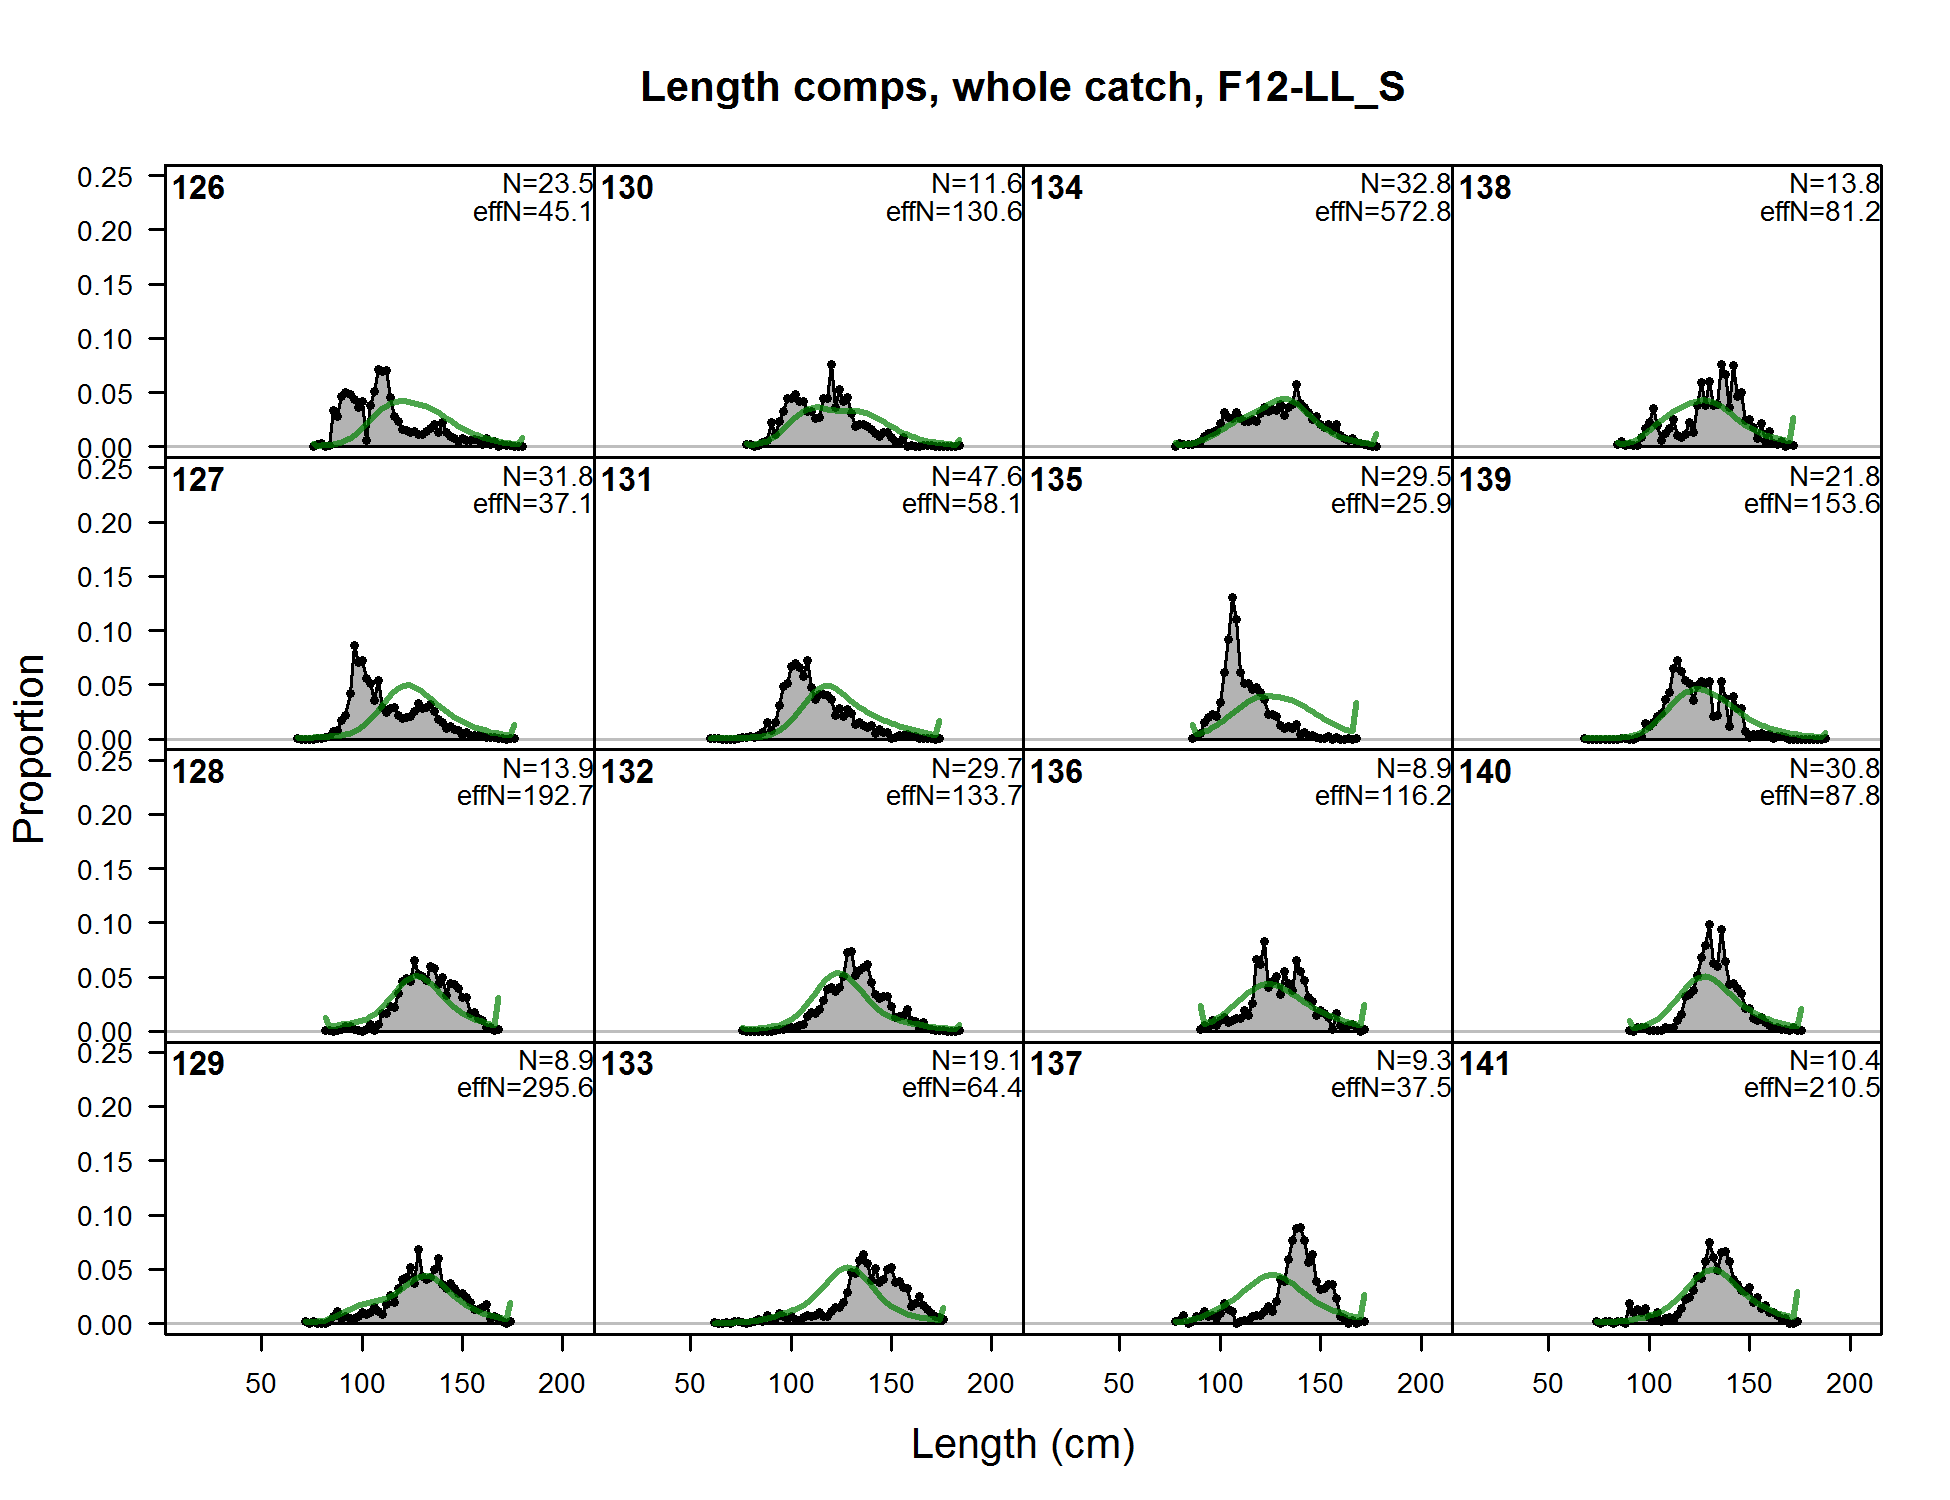
Length comps, whole catch, F12-LL_S (plot 1 of 8) (plot 2 of 8) (plot 3 of 8) (plot 4 of 8)
file: comp_lenfit_flt12mkt0_page4.png
Length comps, whole catch, F12-LL_S (plot 1 of 8) (plot 2 of 8) (plot 3 of 8) (plot 4 of 8) (plot 5 of 8)
file: comp_lenfit_flt12mkt0_page5.png
Length comps, whole catch, F12-LL_S (plot 1 of 8) (plot 2 of 8) (plot 3 of 8) (plot 4 of 8) (plot 5 of 8) (plot 6 of 8)
file: comp_lenfit_flt12mkt0_page6.png
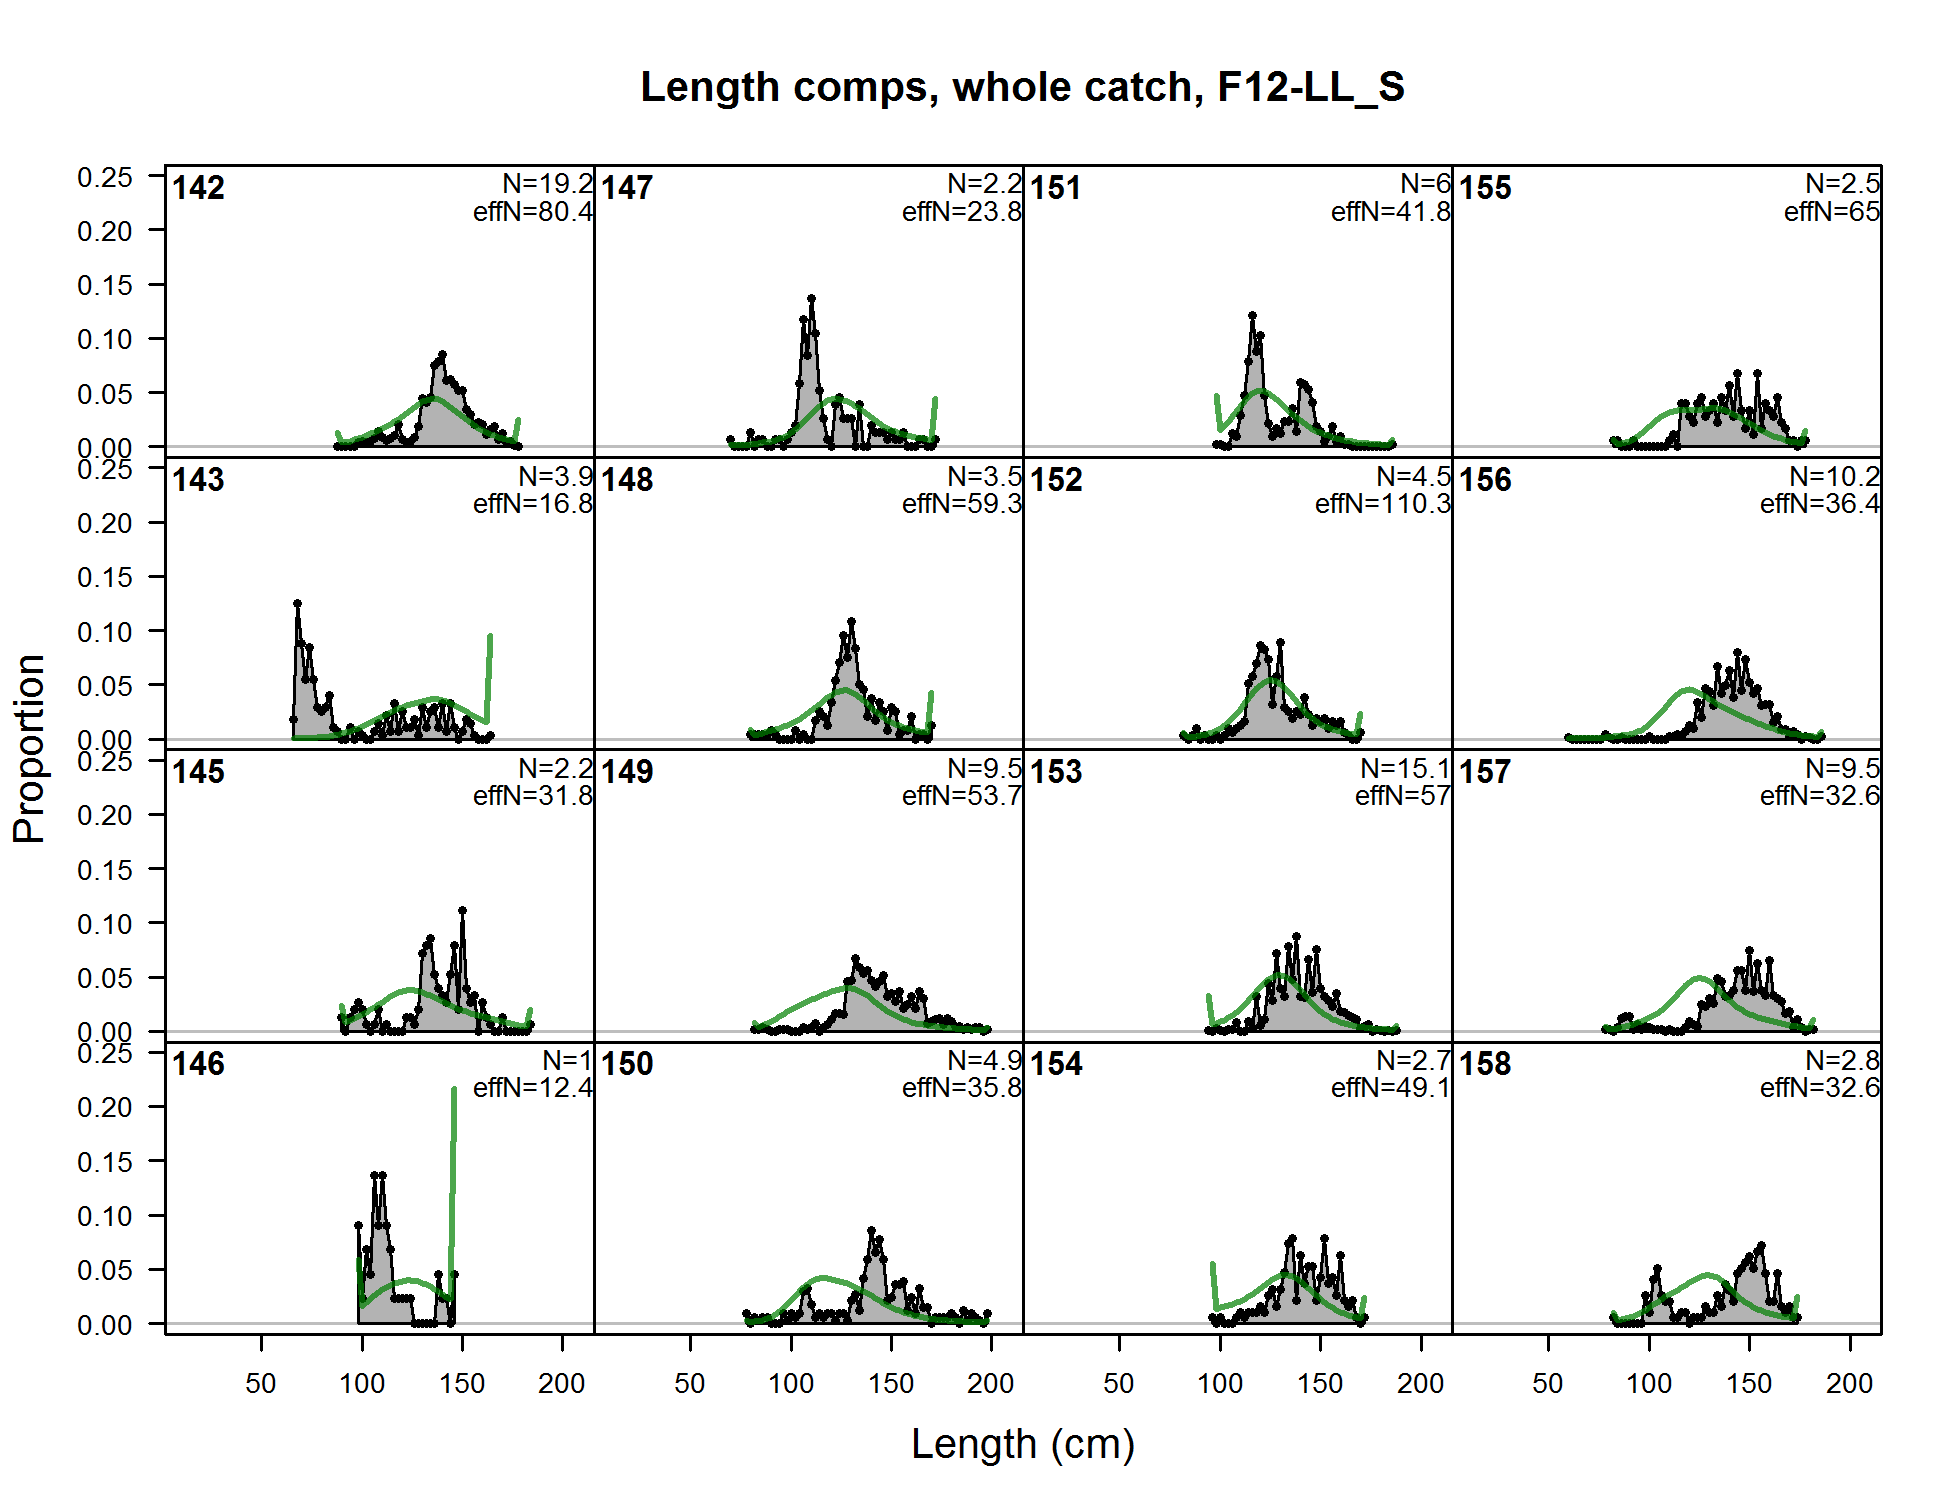
Length comps, whole catch, F12-LL_S (plot 1 of 8) (plot 2 of 8) (plot 3 of 8) (plot 4 of 8) (plot 5 of 8) (plot 6 of 8) (plot 7 of 8)
file: comp_lenfit_flt12mkt0_page7.png
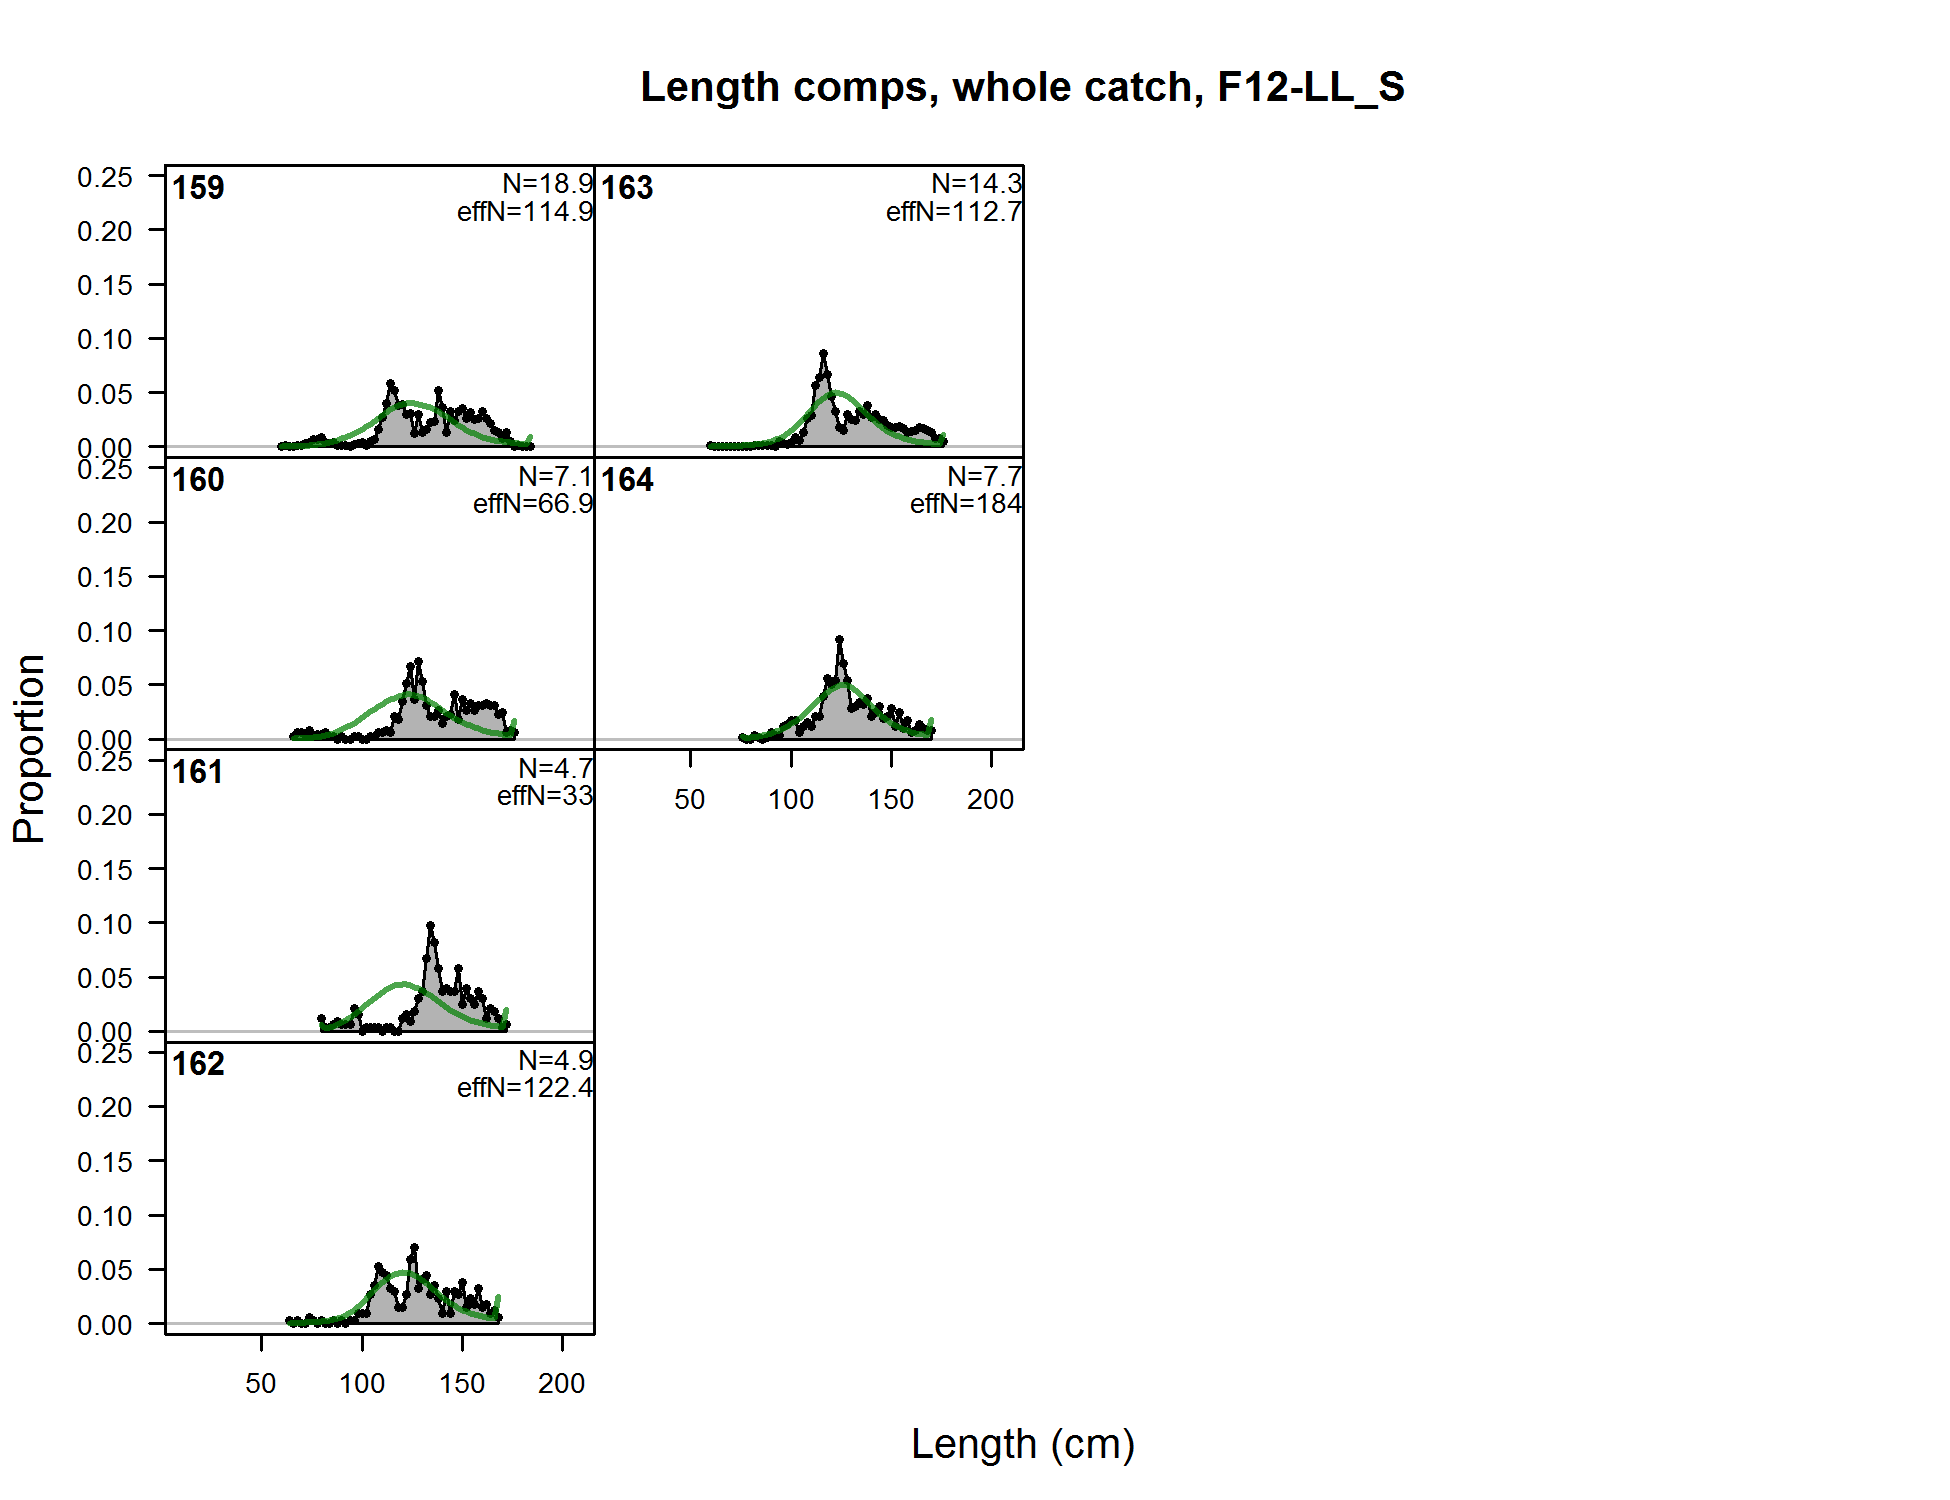
Length comps, whole catch, F12-LL_S (plot 1 of 8) (plot 2 of 8) (plot 3 of 8) (plot 4 of 8) (plot 5 of 8) (plot 6 of 8) (plot 7 of 8) (plot 8 of 8)
file: comp_lenfit_flt12mkt0_page8.png
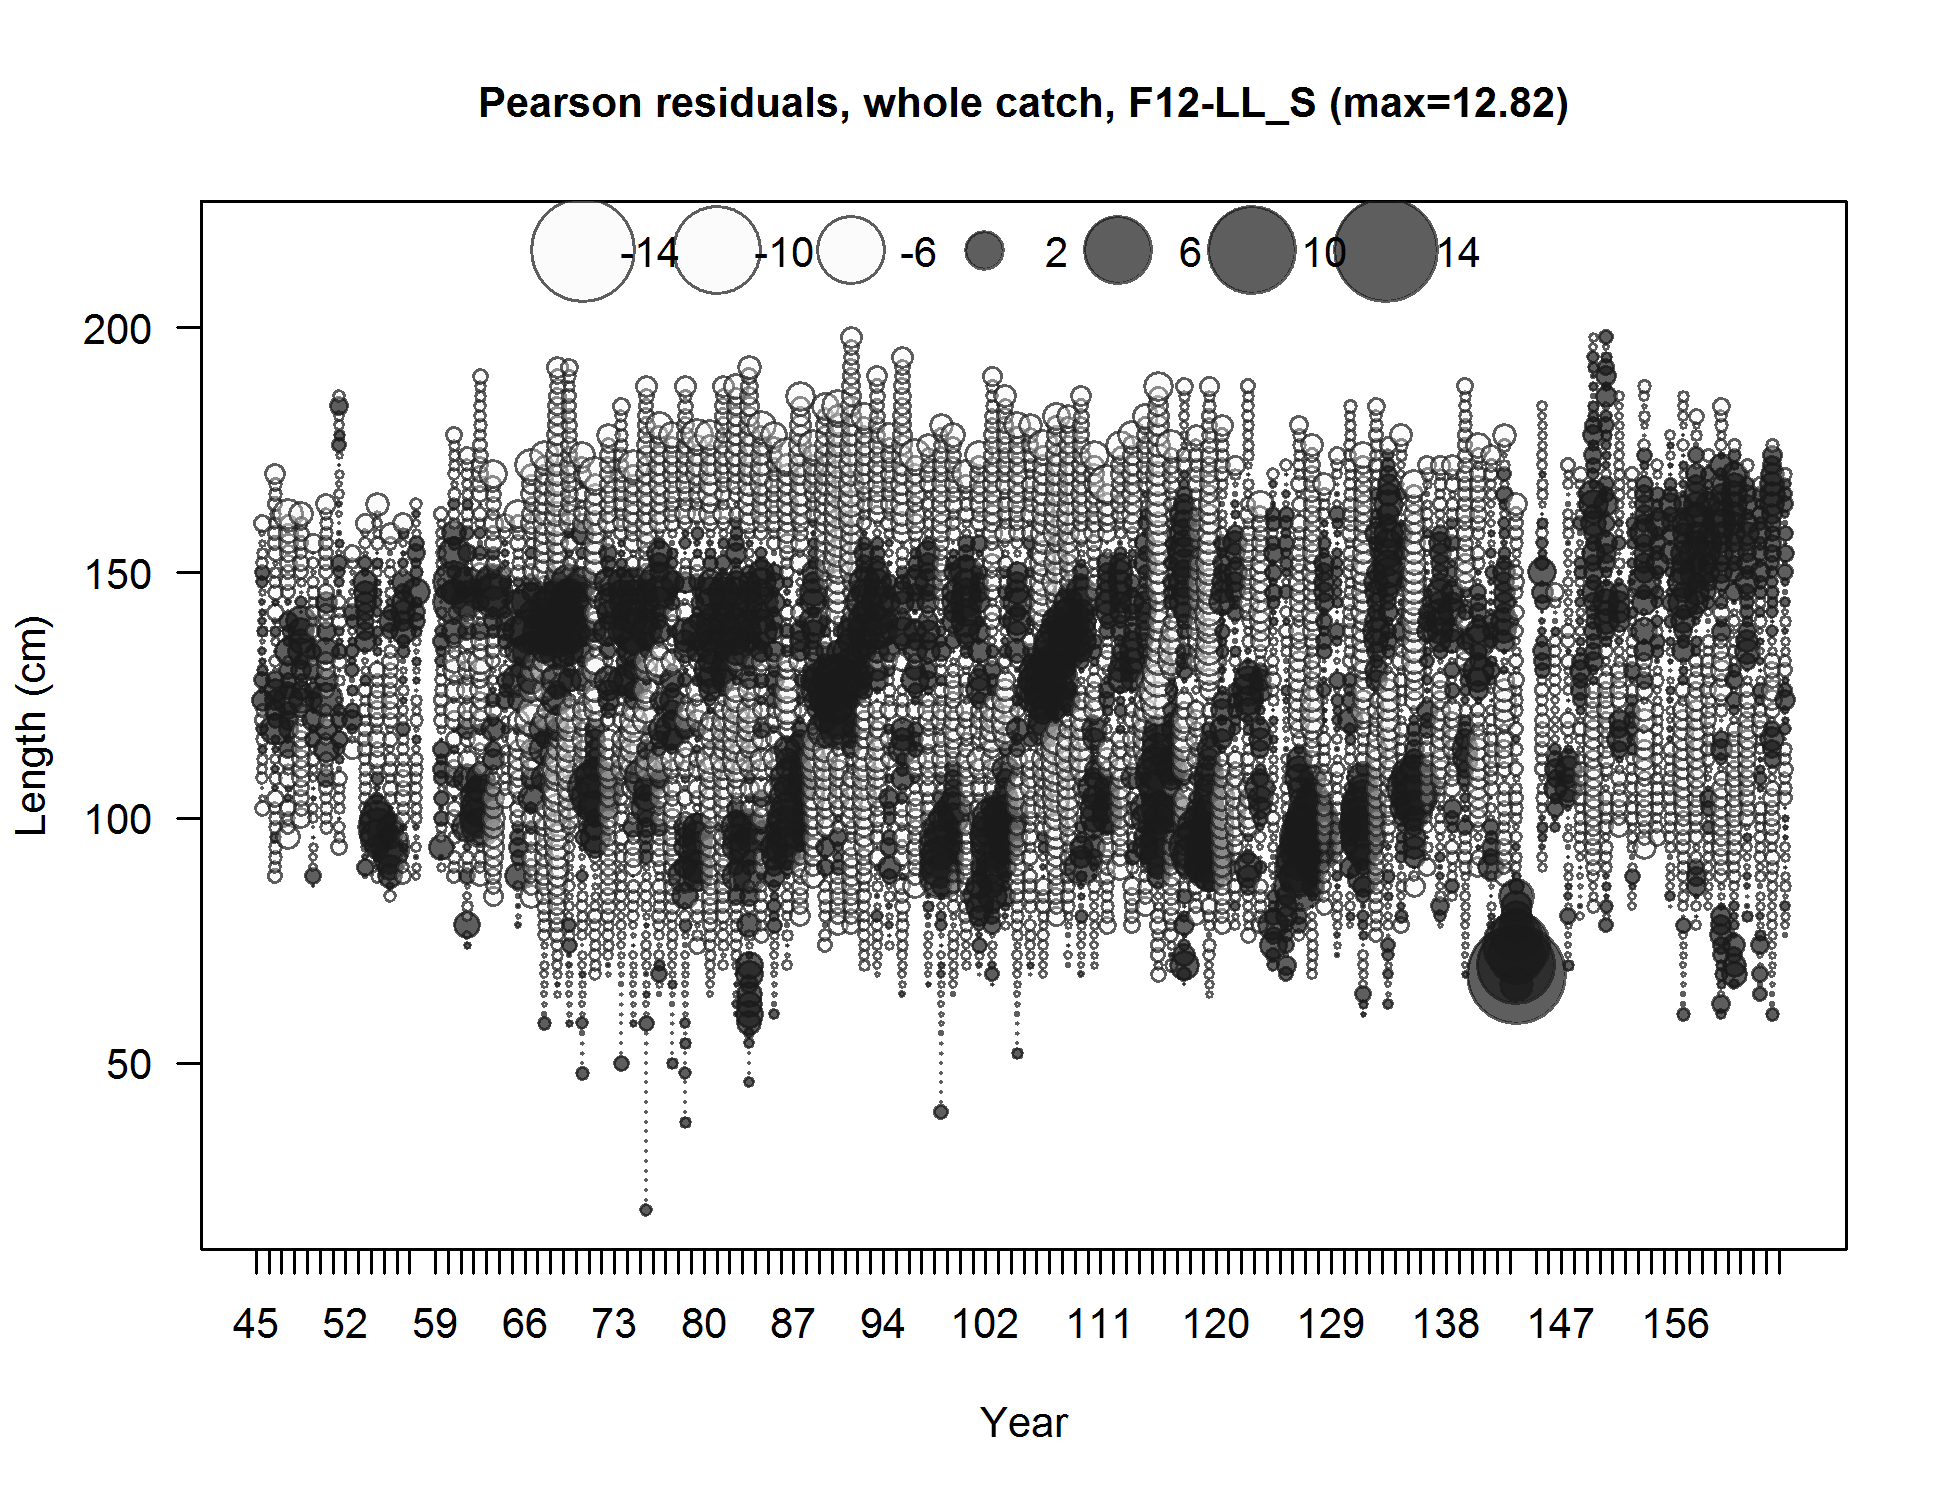
Pearson residuals, whole catch, F12-LL_S (max=12.82) (plot 8 of 8)
Closed bubbles are positive residuals (observed > expected) and open bubbles are negative residuals (observed < expected).
file: comp_lenfit_residsflt12mkt0_page8.png
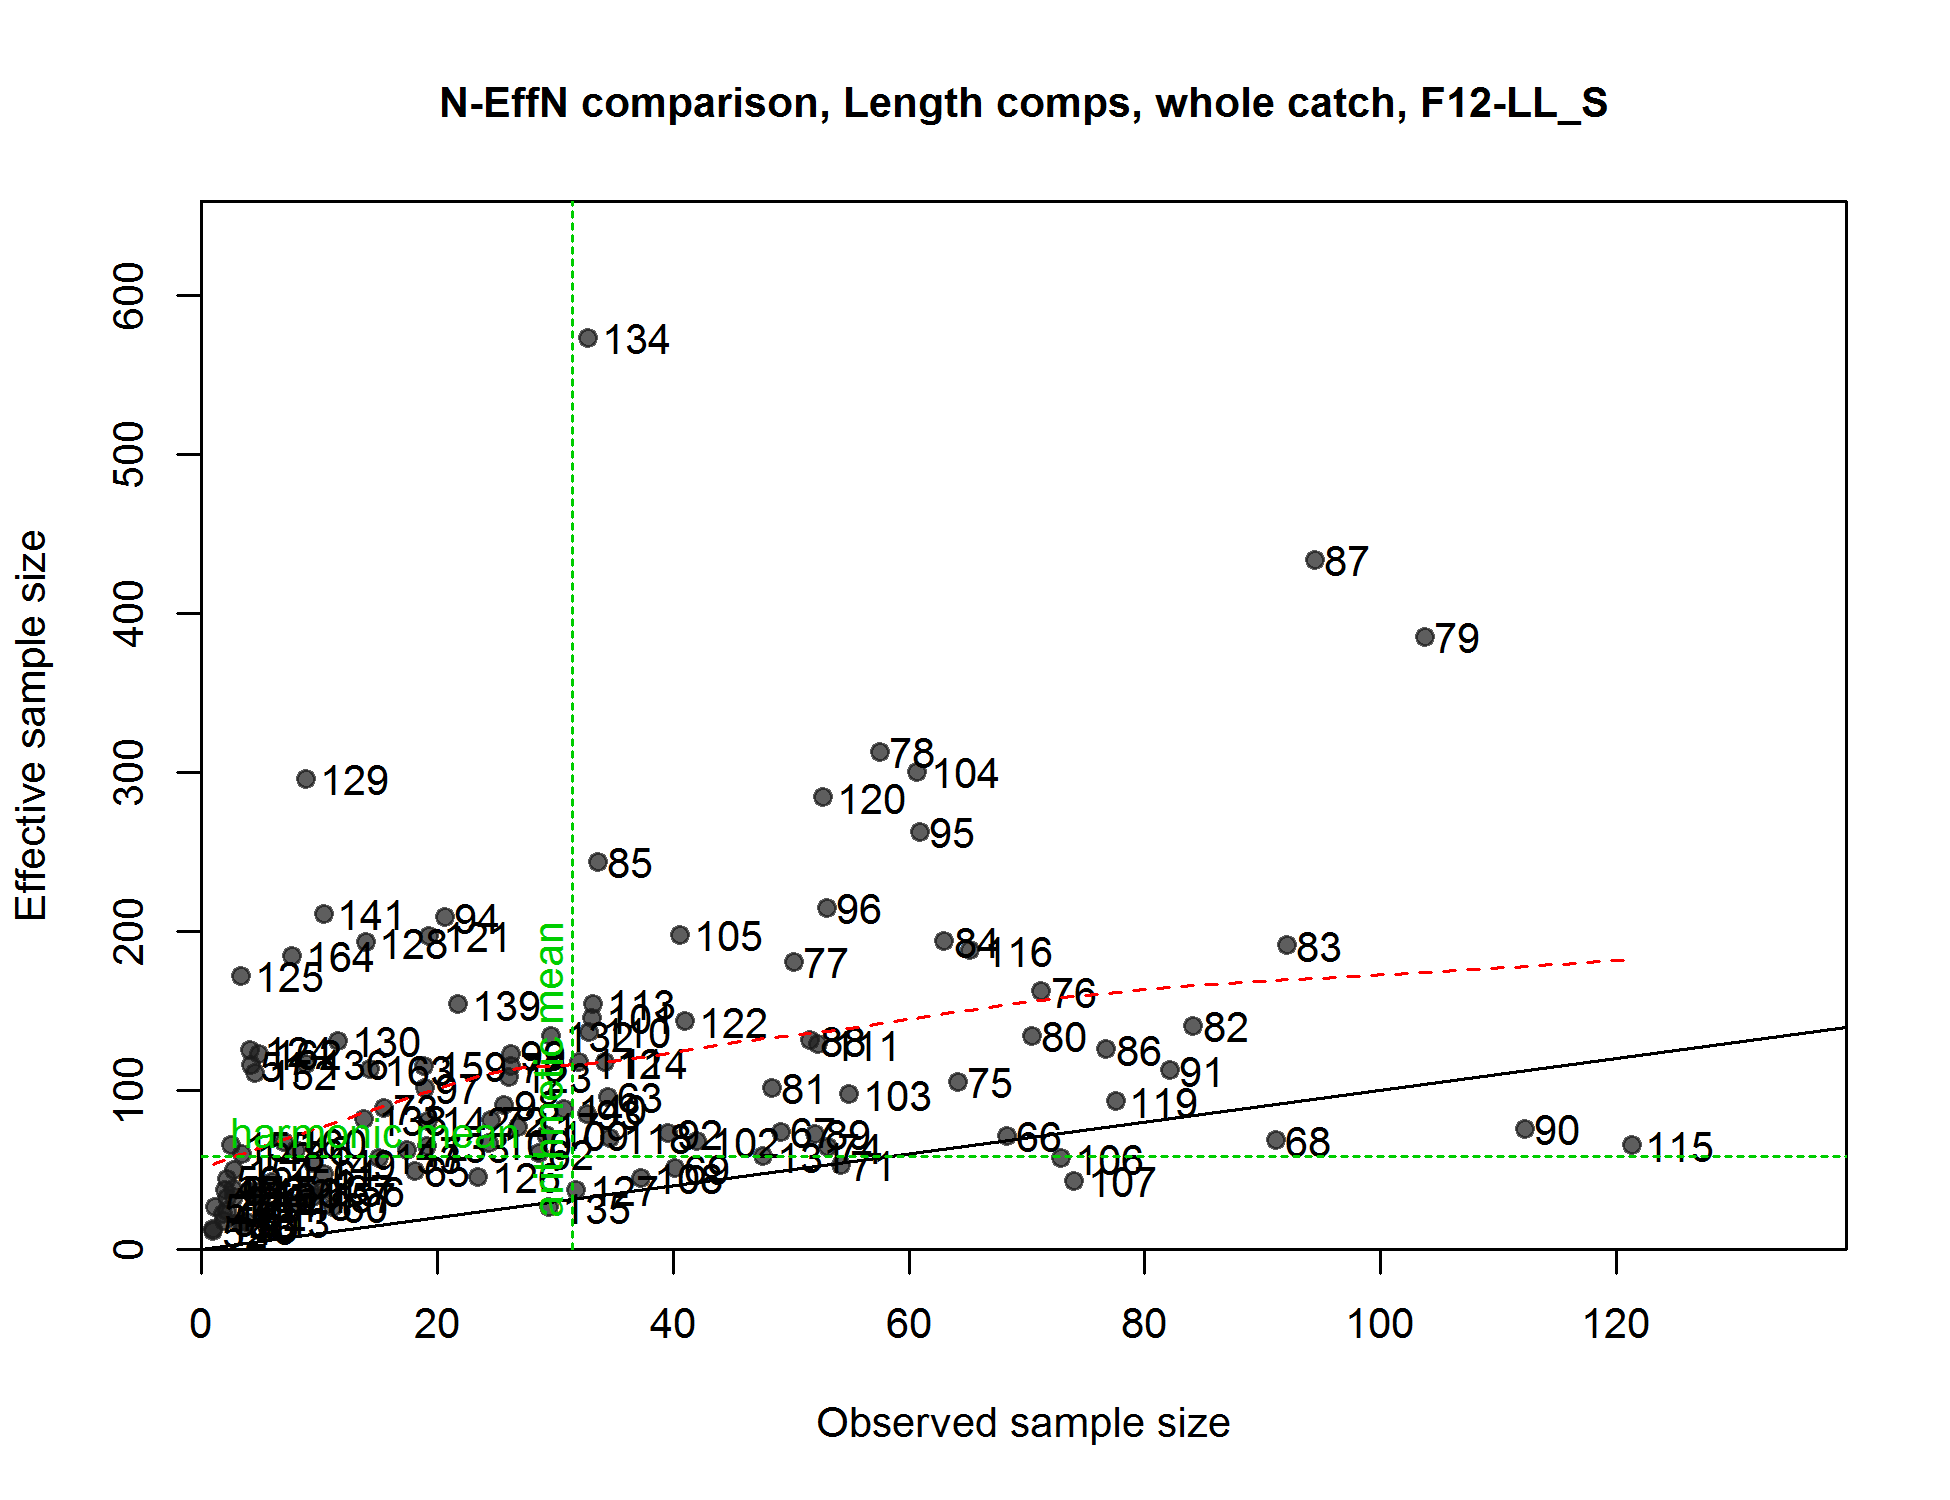
N-EffN comparison, Length comps, whole catch, F12-LL_S
file: comp_lenfit_sampsize_flt12mkt0.png
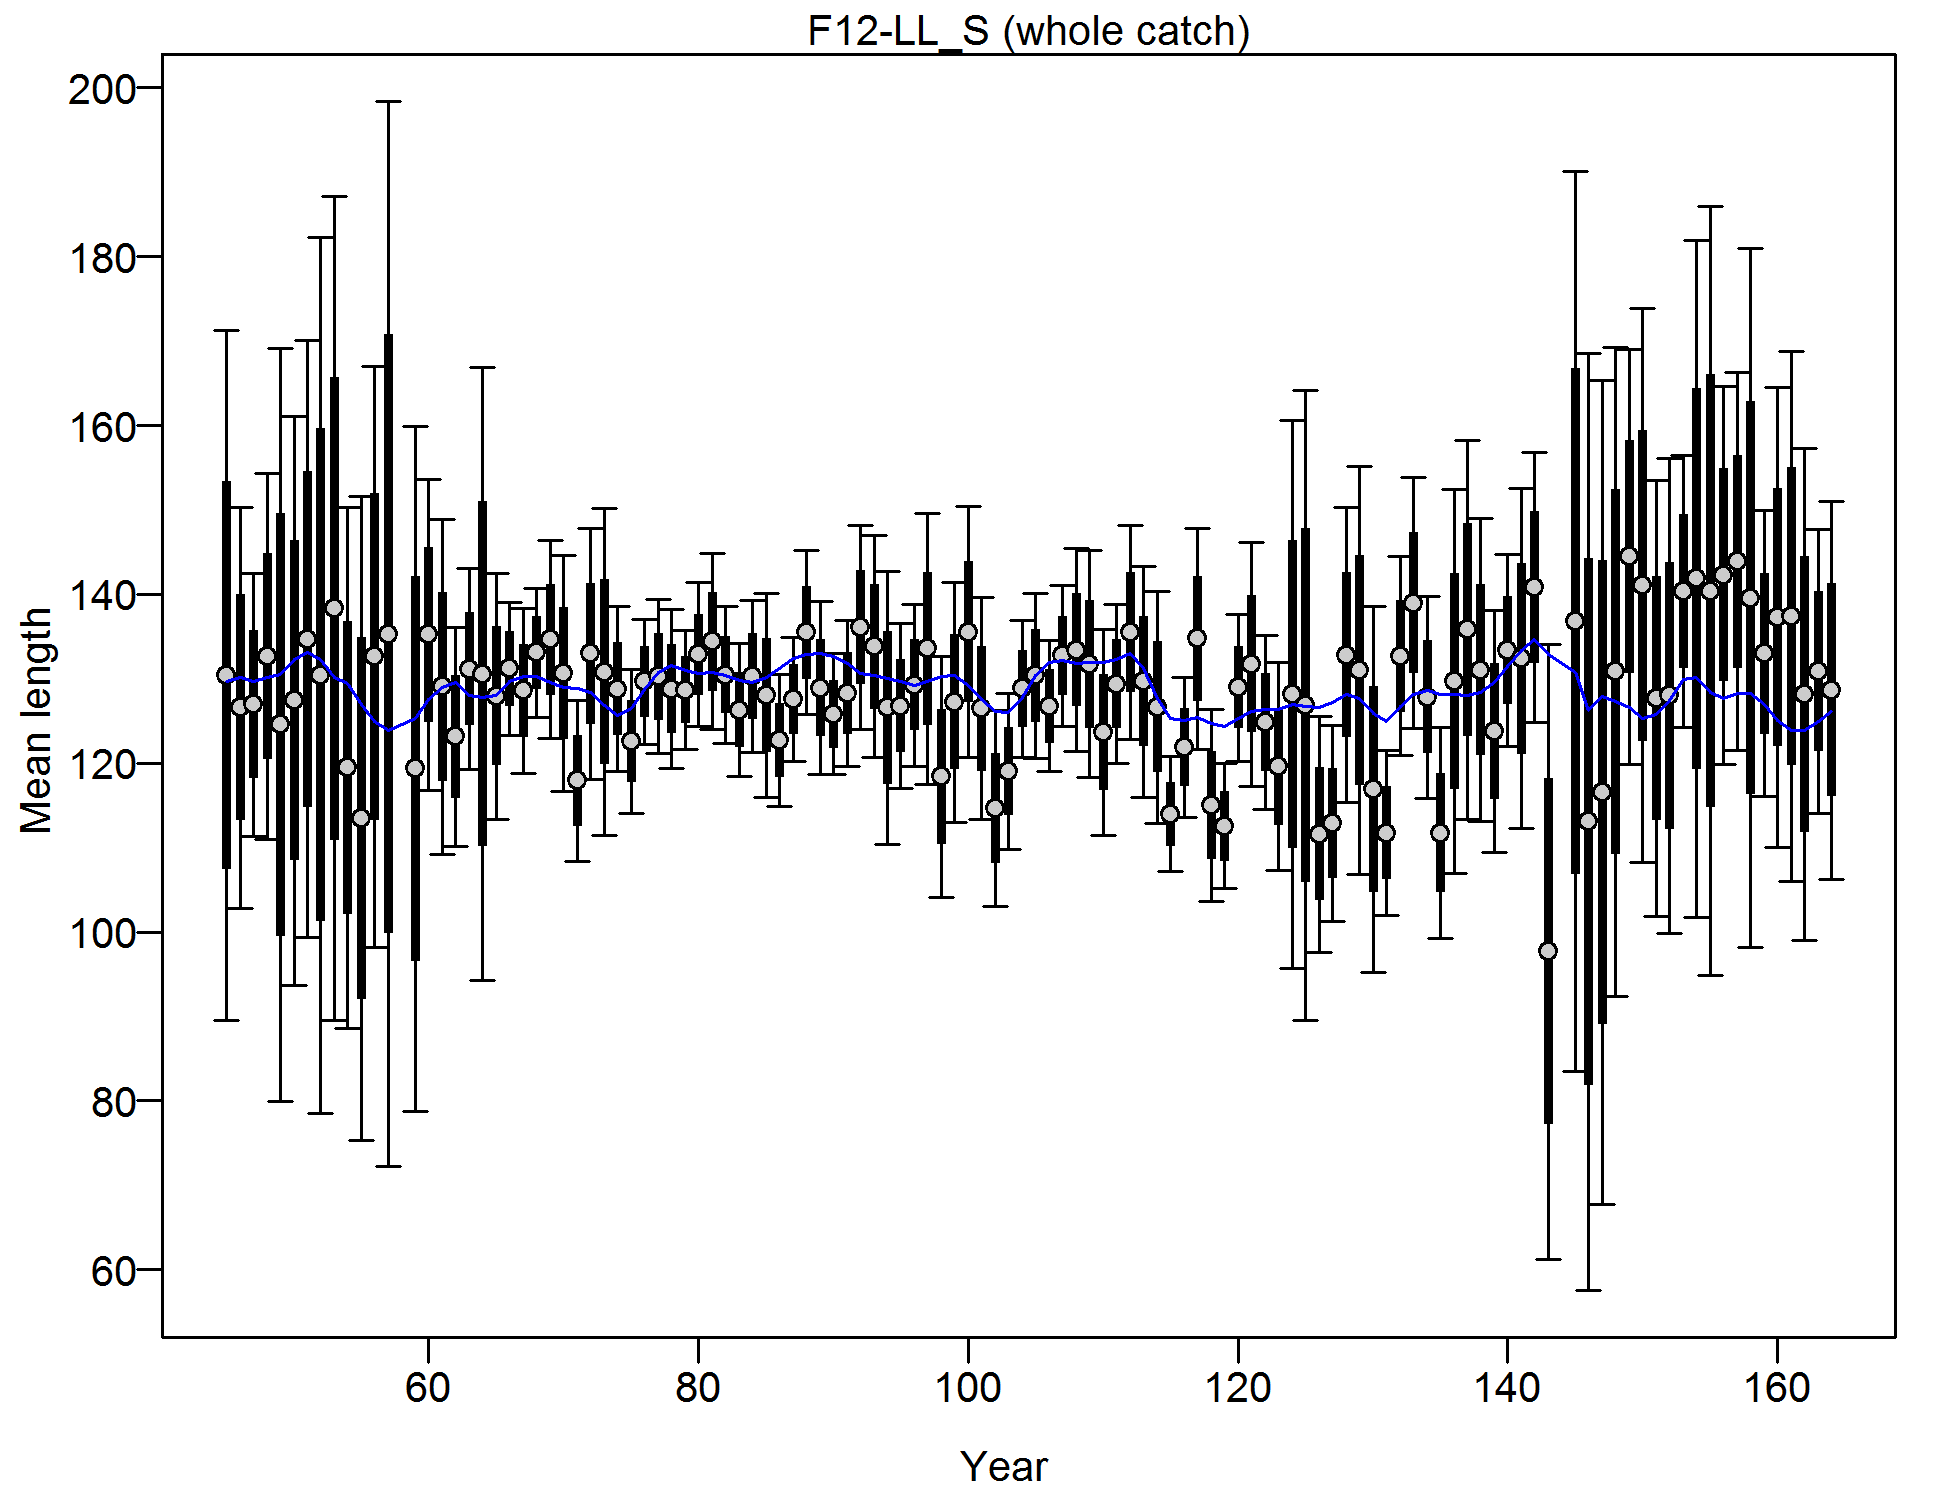
Mean length for F12-LL_S with 95% confidence intervals based on current samples sizes.
Francis data weighting method TA1.8: thinner intervals (with capped ends) show result of further adjusting sample sizes based on suggested multiplier (with 95% interval) for len data from F12-LL_S:
0.3163 (0.2432-0.4462)
For more info, see
Francis, R.I.C.C. (2011). Data weighting in statistical fisheries stock assessment models. Can. J. Fish. Aquat. Sci. 68: 1124-1138.
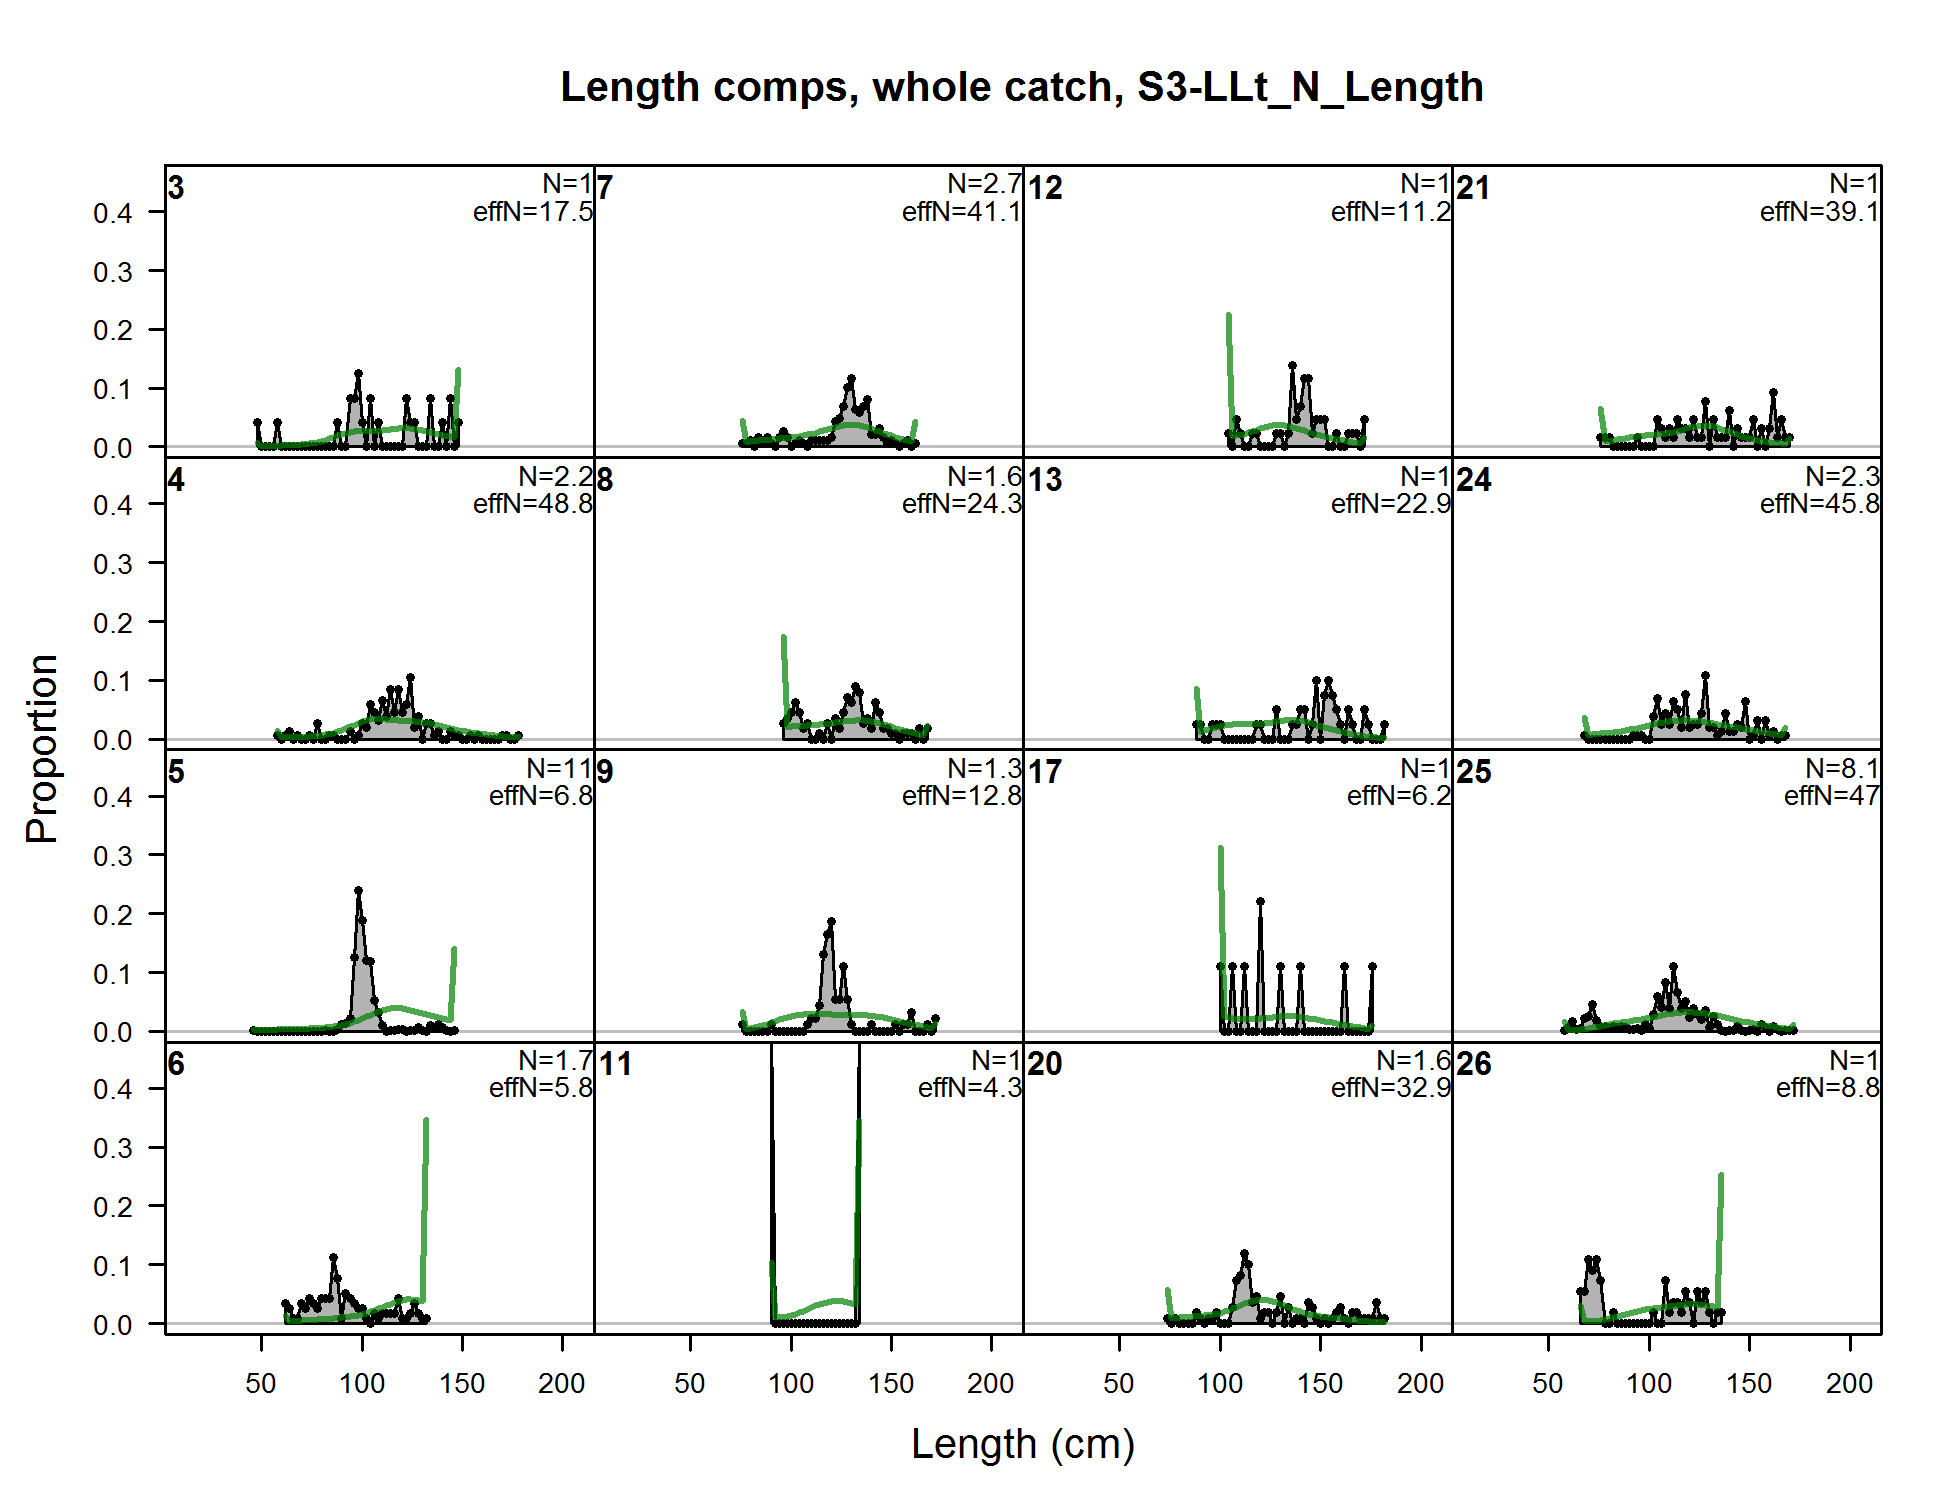
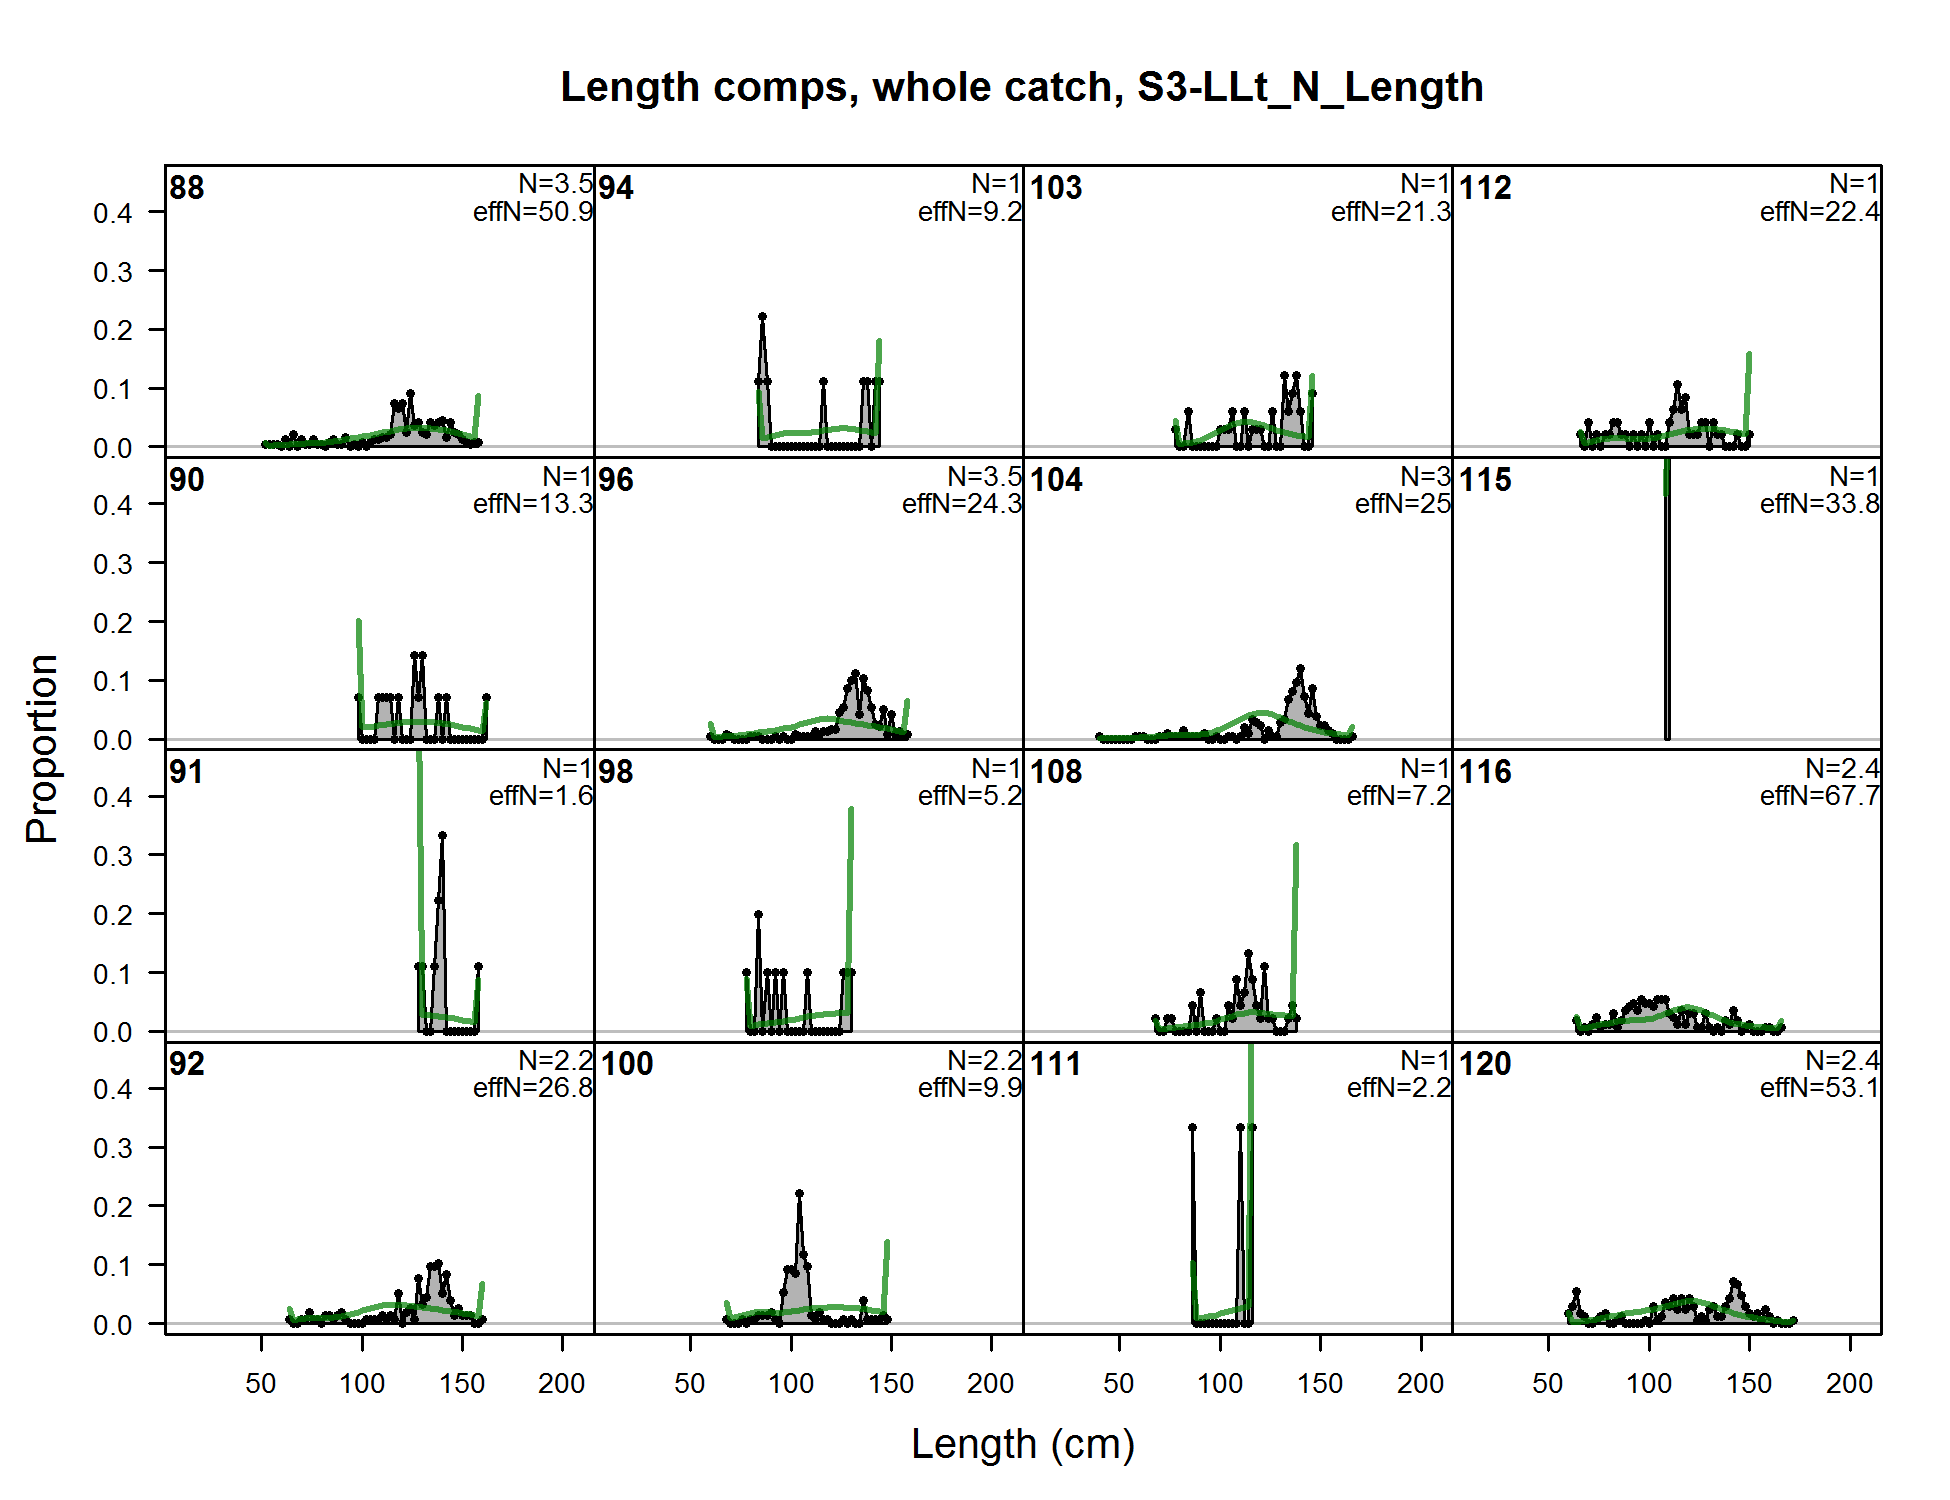
Length comps, whole catch, S3-LLt_N_Length (plot 1 of 5)
file: comp_lenfit_flt19mkt0_page1.png
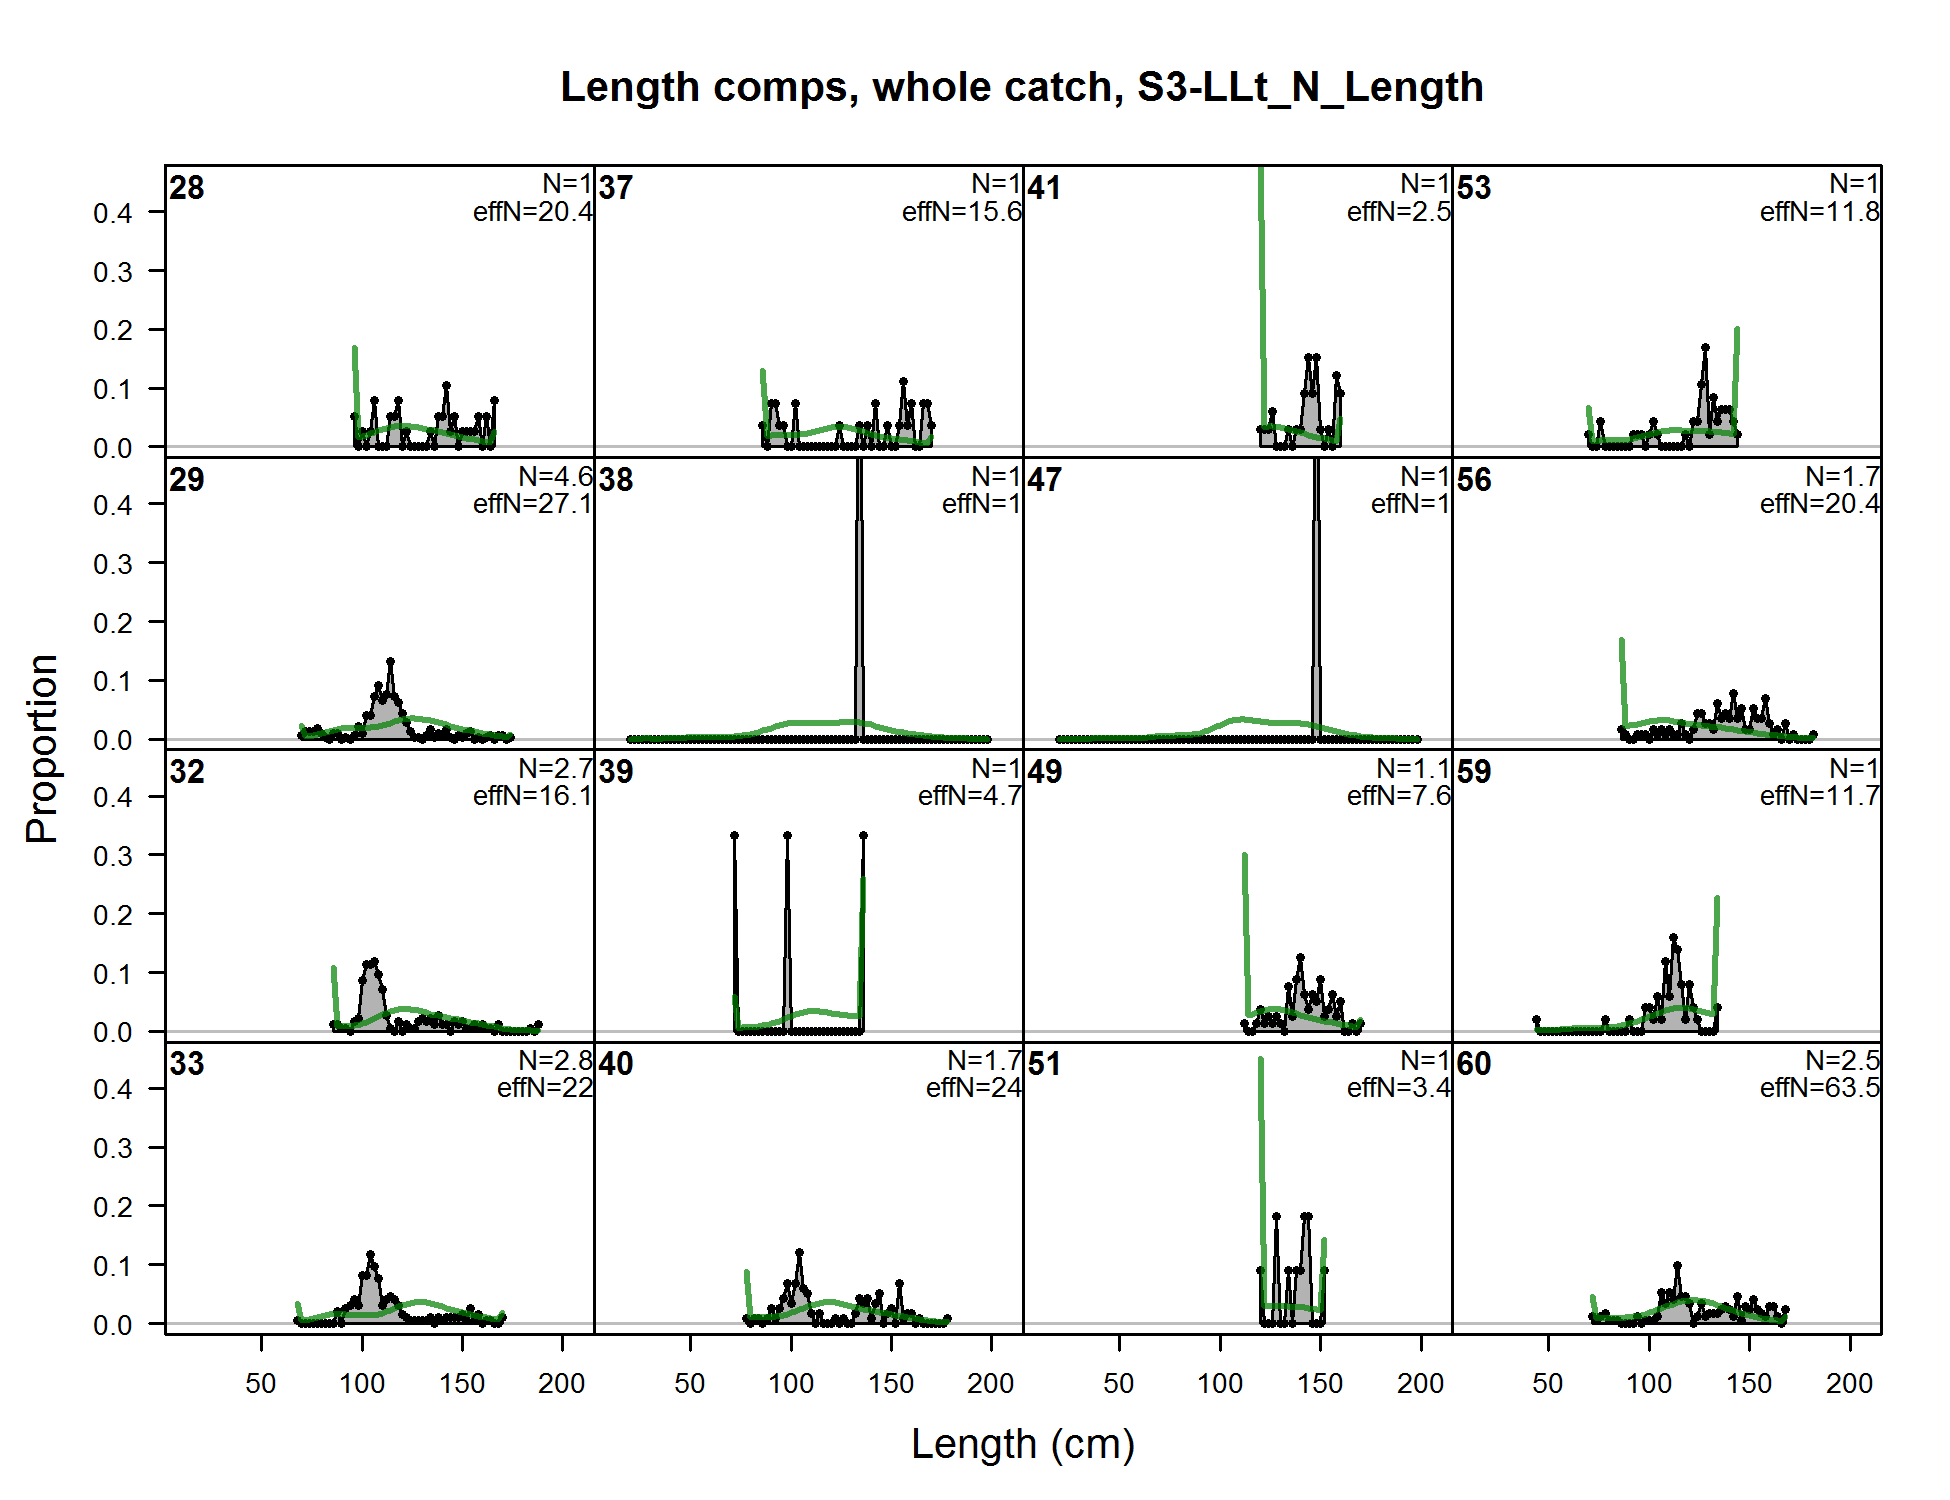
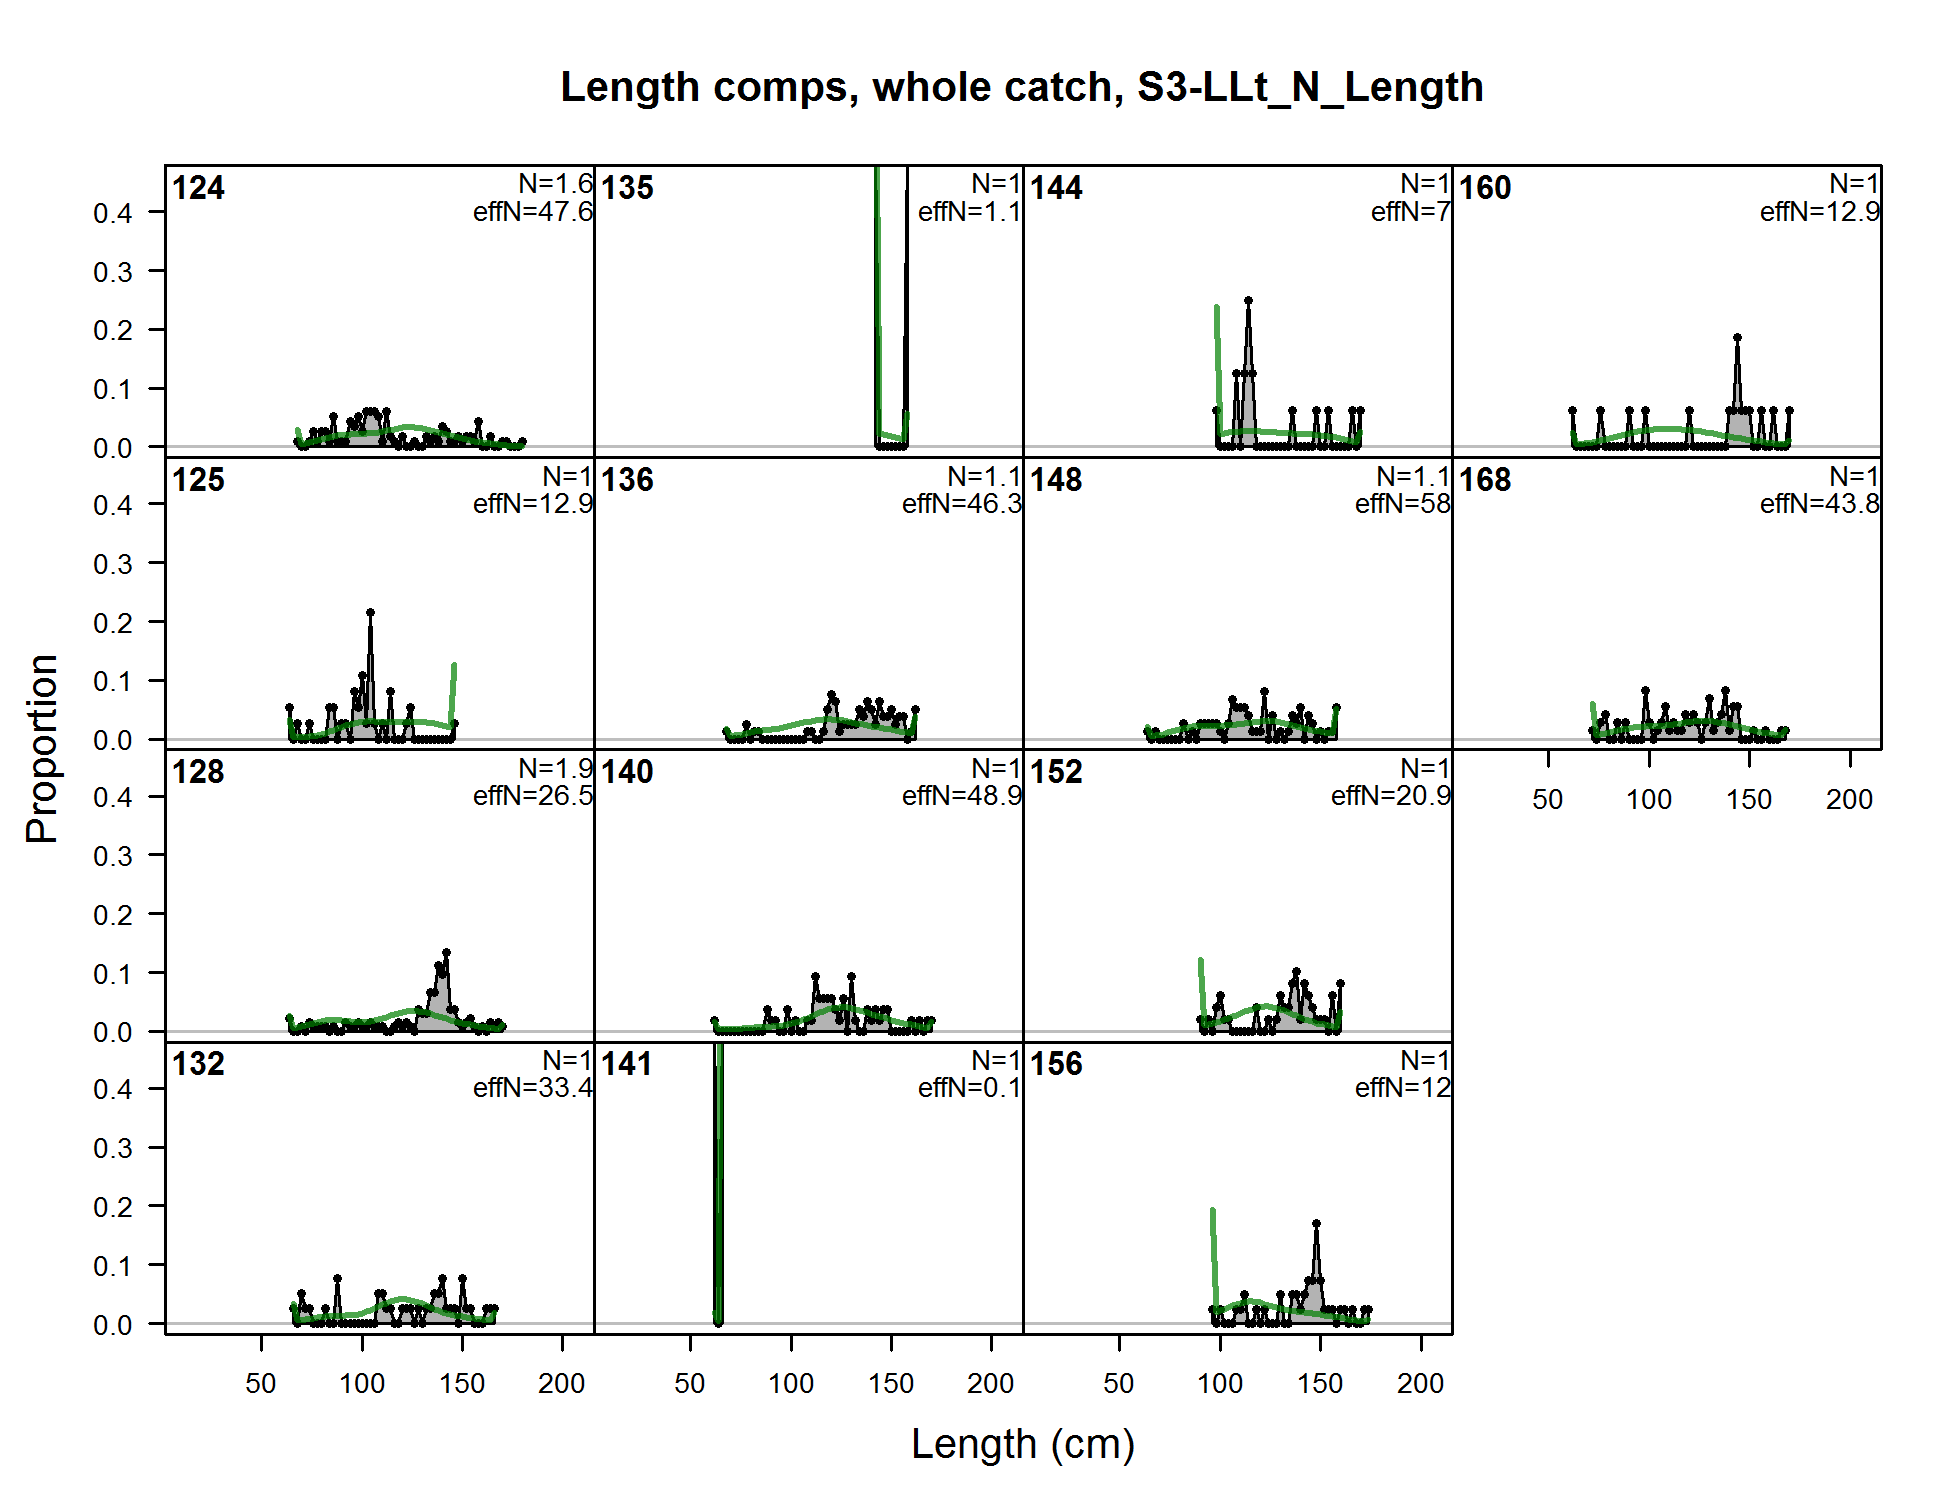
Length comps, whole catch, S3-LLt_N_Length (plot 1 of 5) (plot 2 of 5)
file: comp_lenfit_flt19mkt0_page2.png
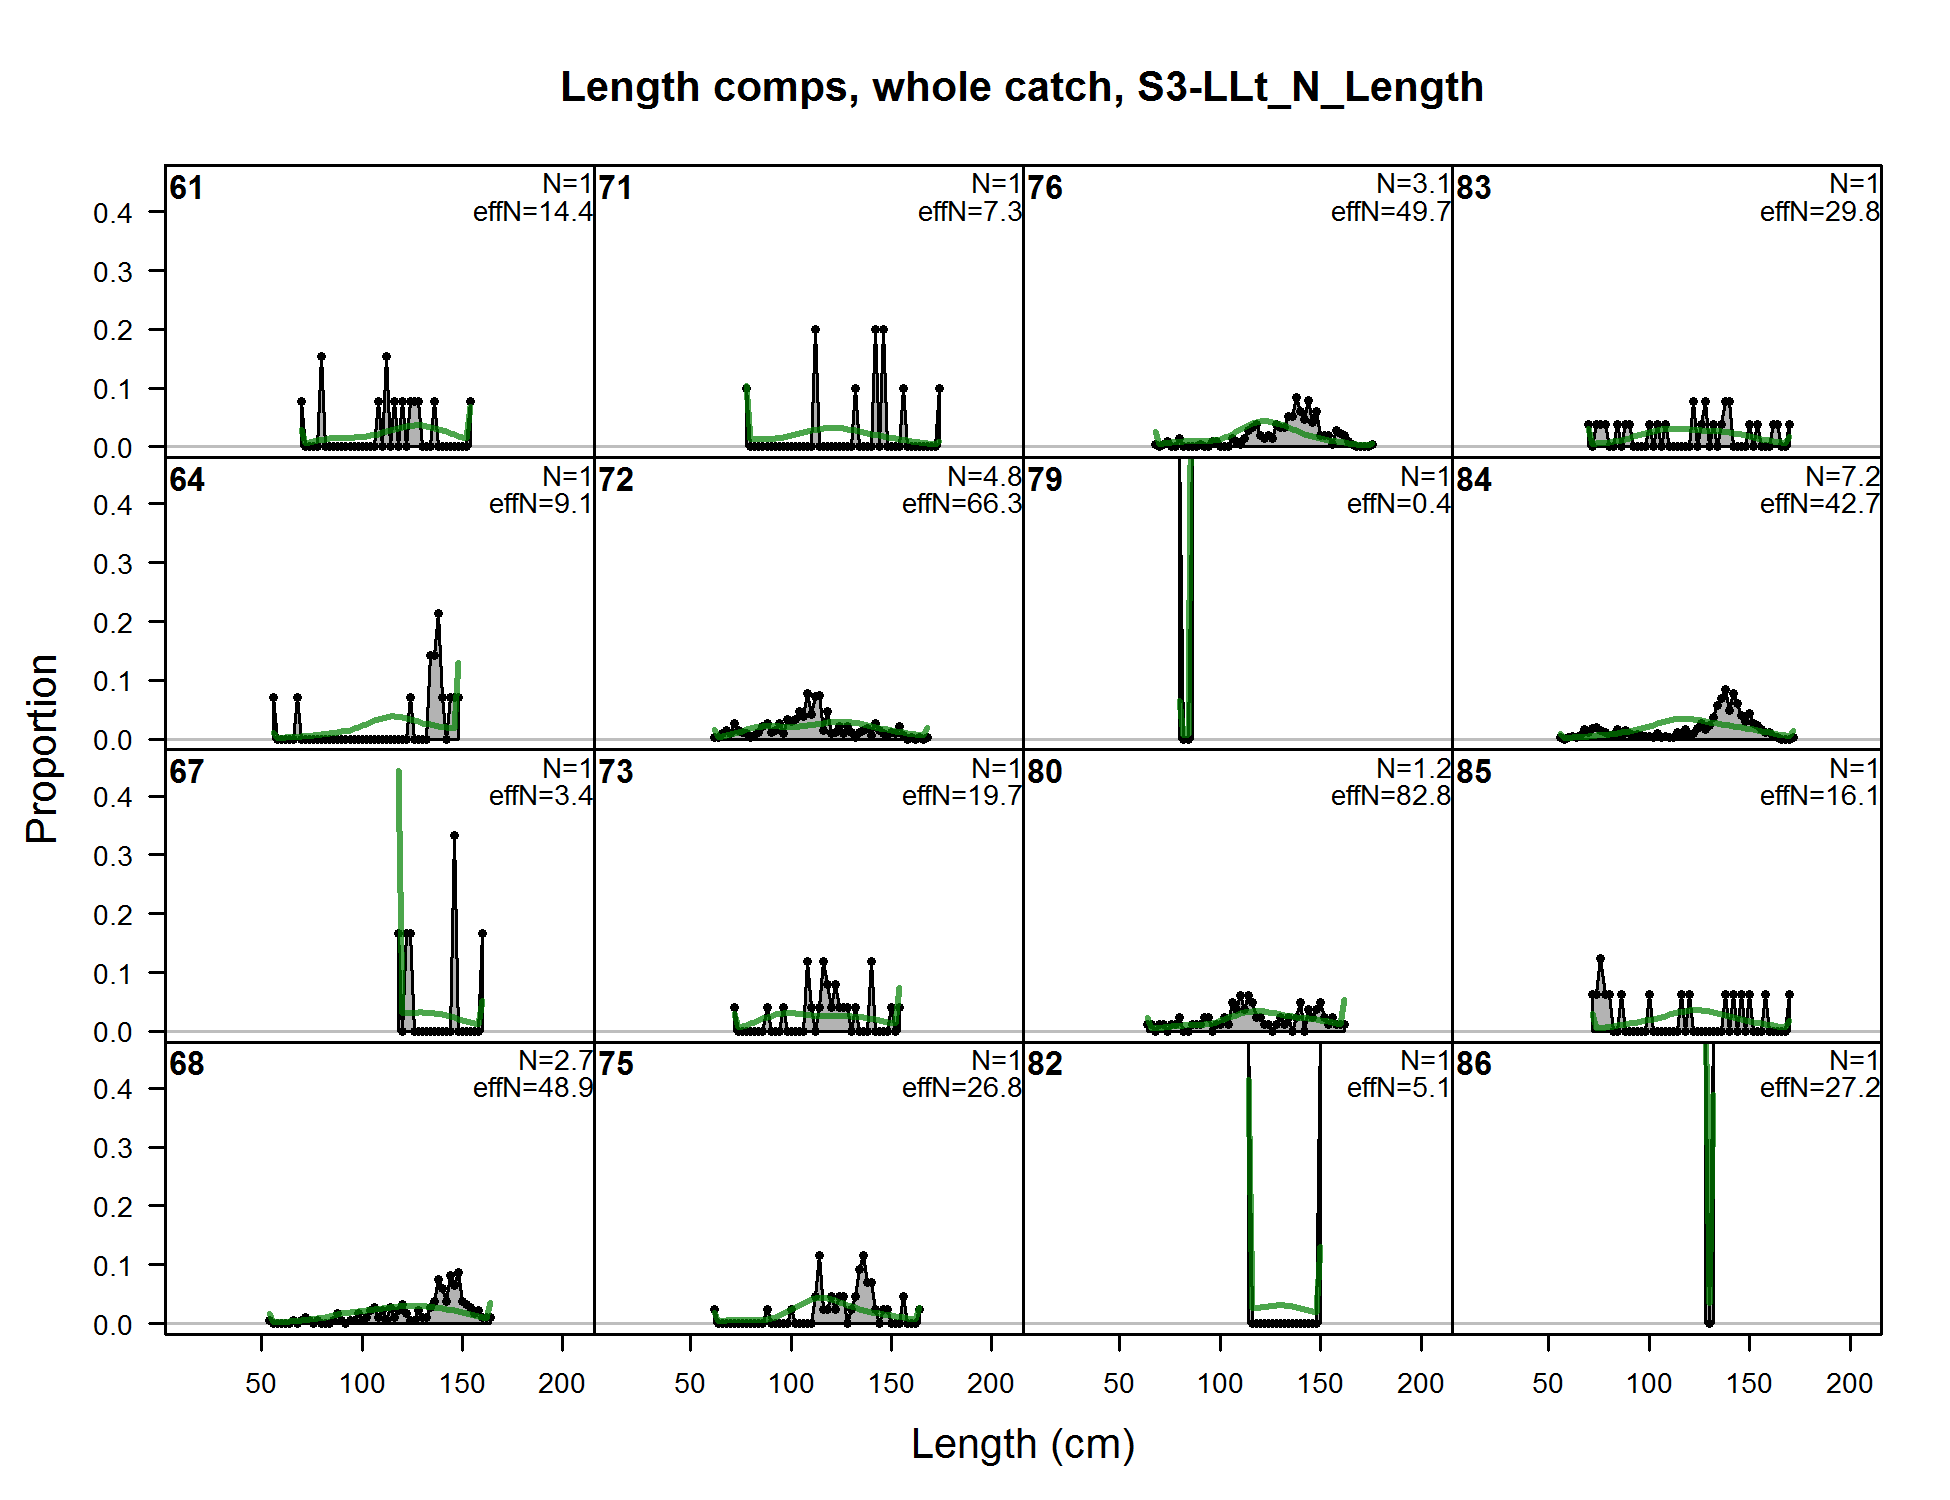
Length comps, whole catch, S3-LLt_N_Length (plot 1 of 5) (plot 2 of 5) (plot 3 of 5)
file: comp_lenfit_flt19mkt0_page3.png
Length comps, whole catch, S3-LLt_N_Length (plot 1 of 5) (plot 2 of 5) (plot 3 of 5) (plot 4 of 5)
file: comp_lenfit_flt19mkt0_page4.png
Length comps, whole catch, S3-LLt_N_Length (plot 1 of 5) (plot 2 of 5) (plot 3 of 5) (plot 4 of 5) (plot 5 of 5)
file: comp_lenfit_flt19mkt0_page5.png
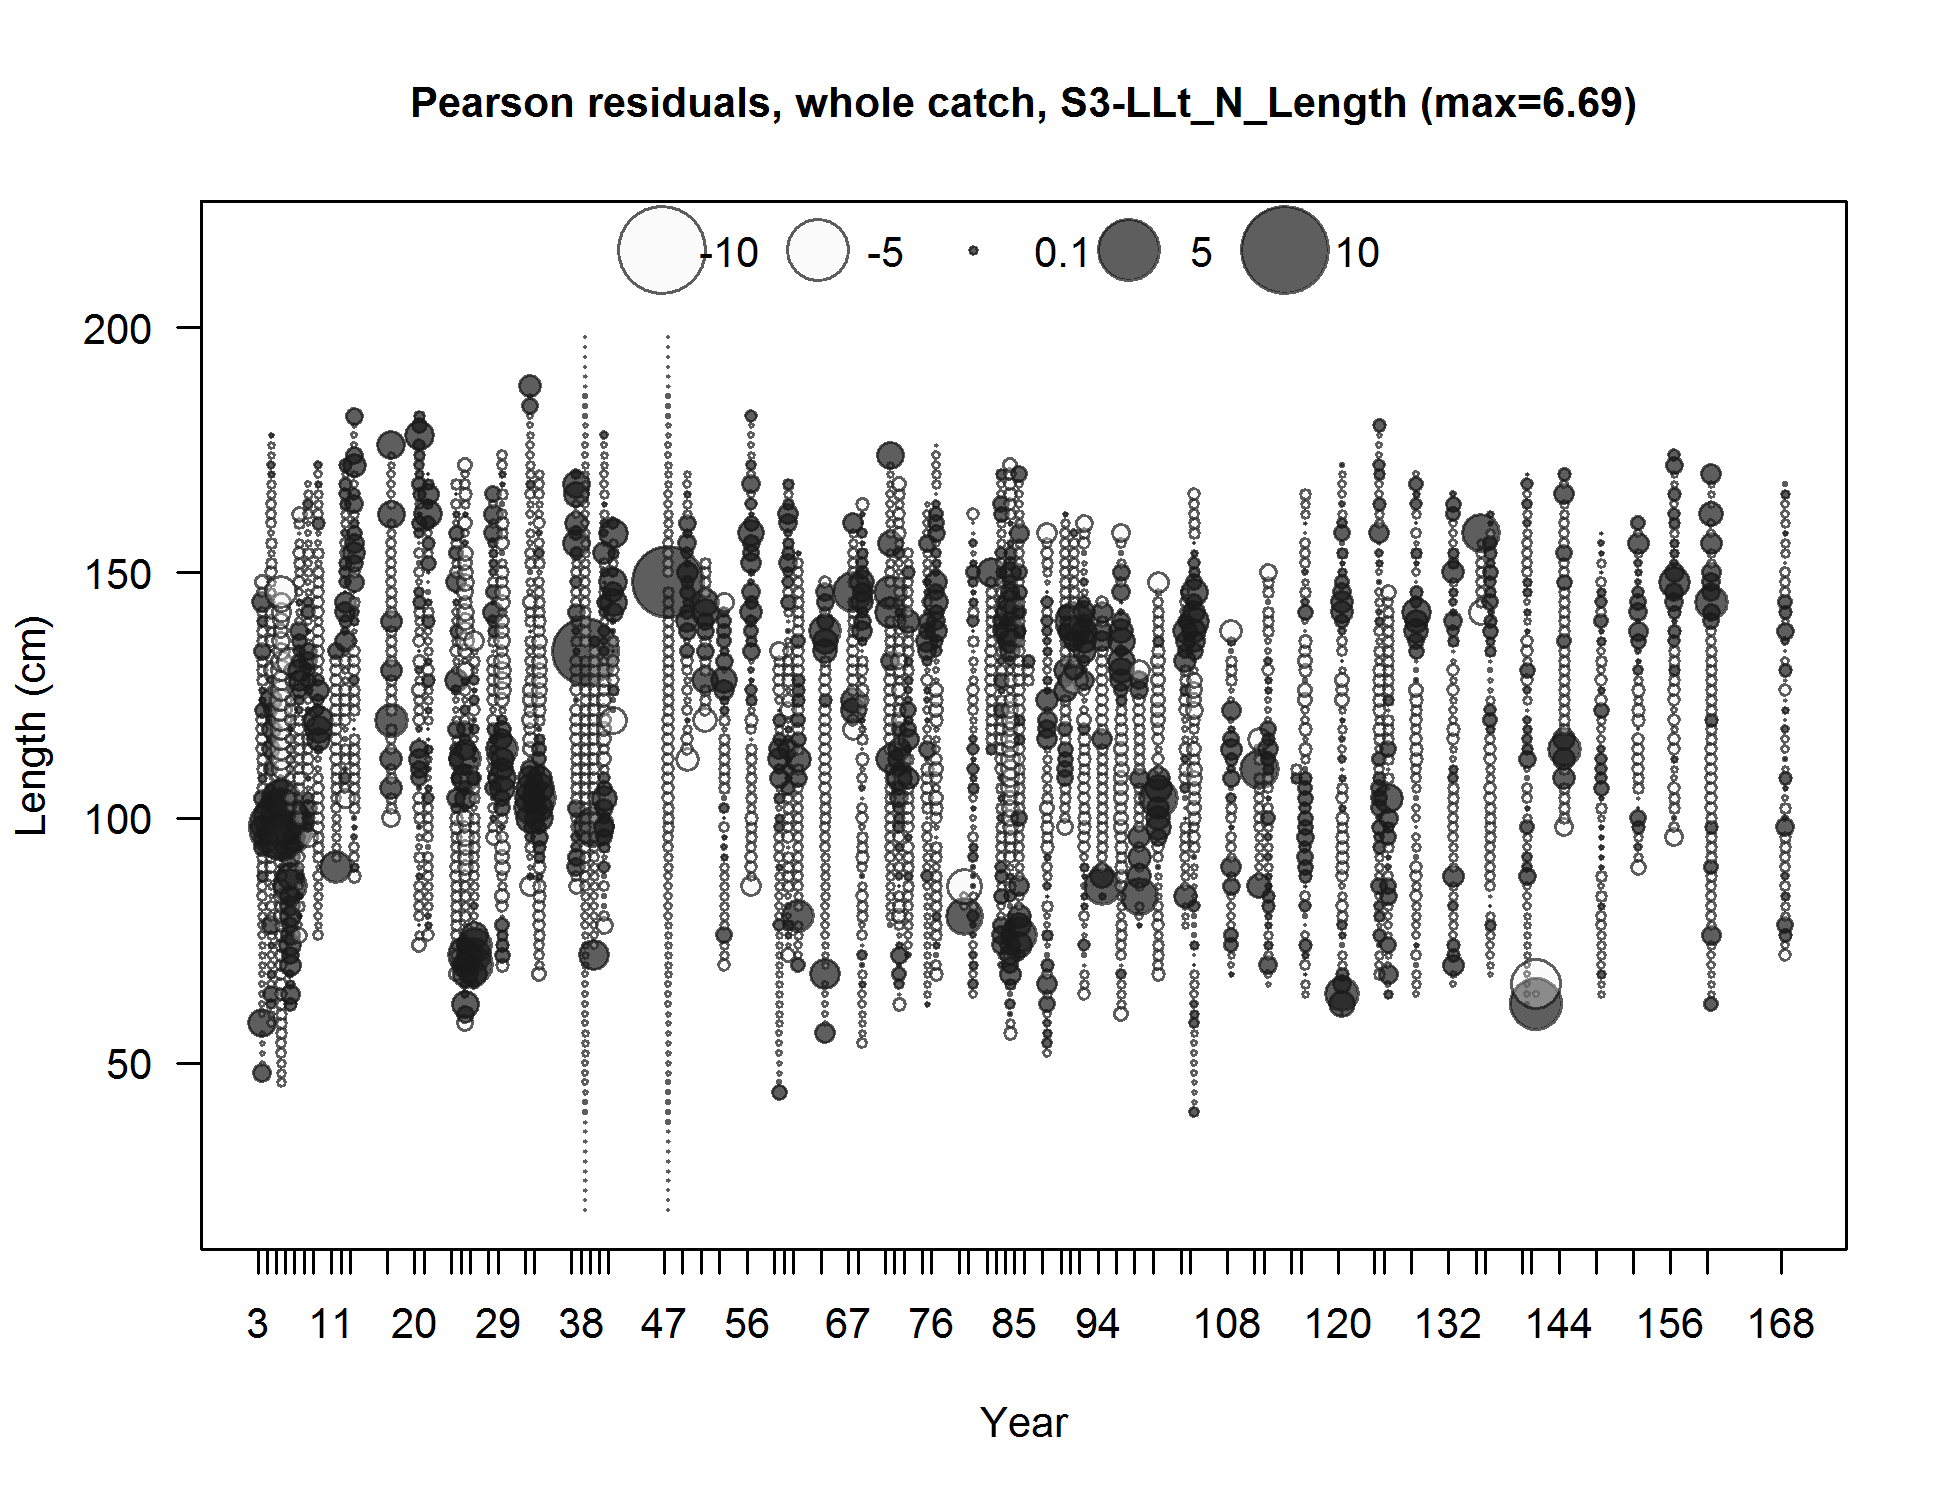
Pearson residuals, whole catch, S3-LLt_N_Length (max=6.69) (plot 5 of 5)
Closed bubbles are positive residuals (observed > expected) and open bubbles are negative residuals (observed < expected).
file: comp_lenfit_residsflt19mkt0_page5.png
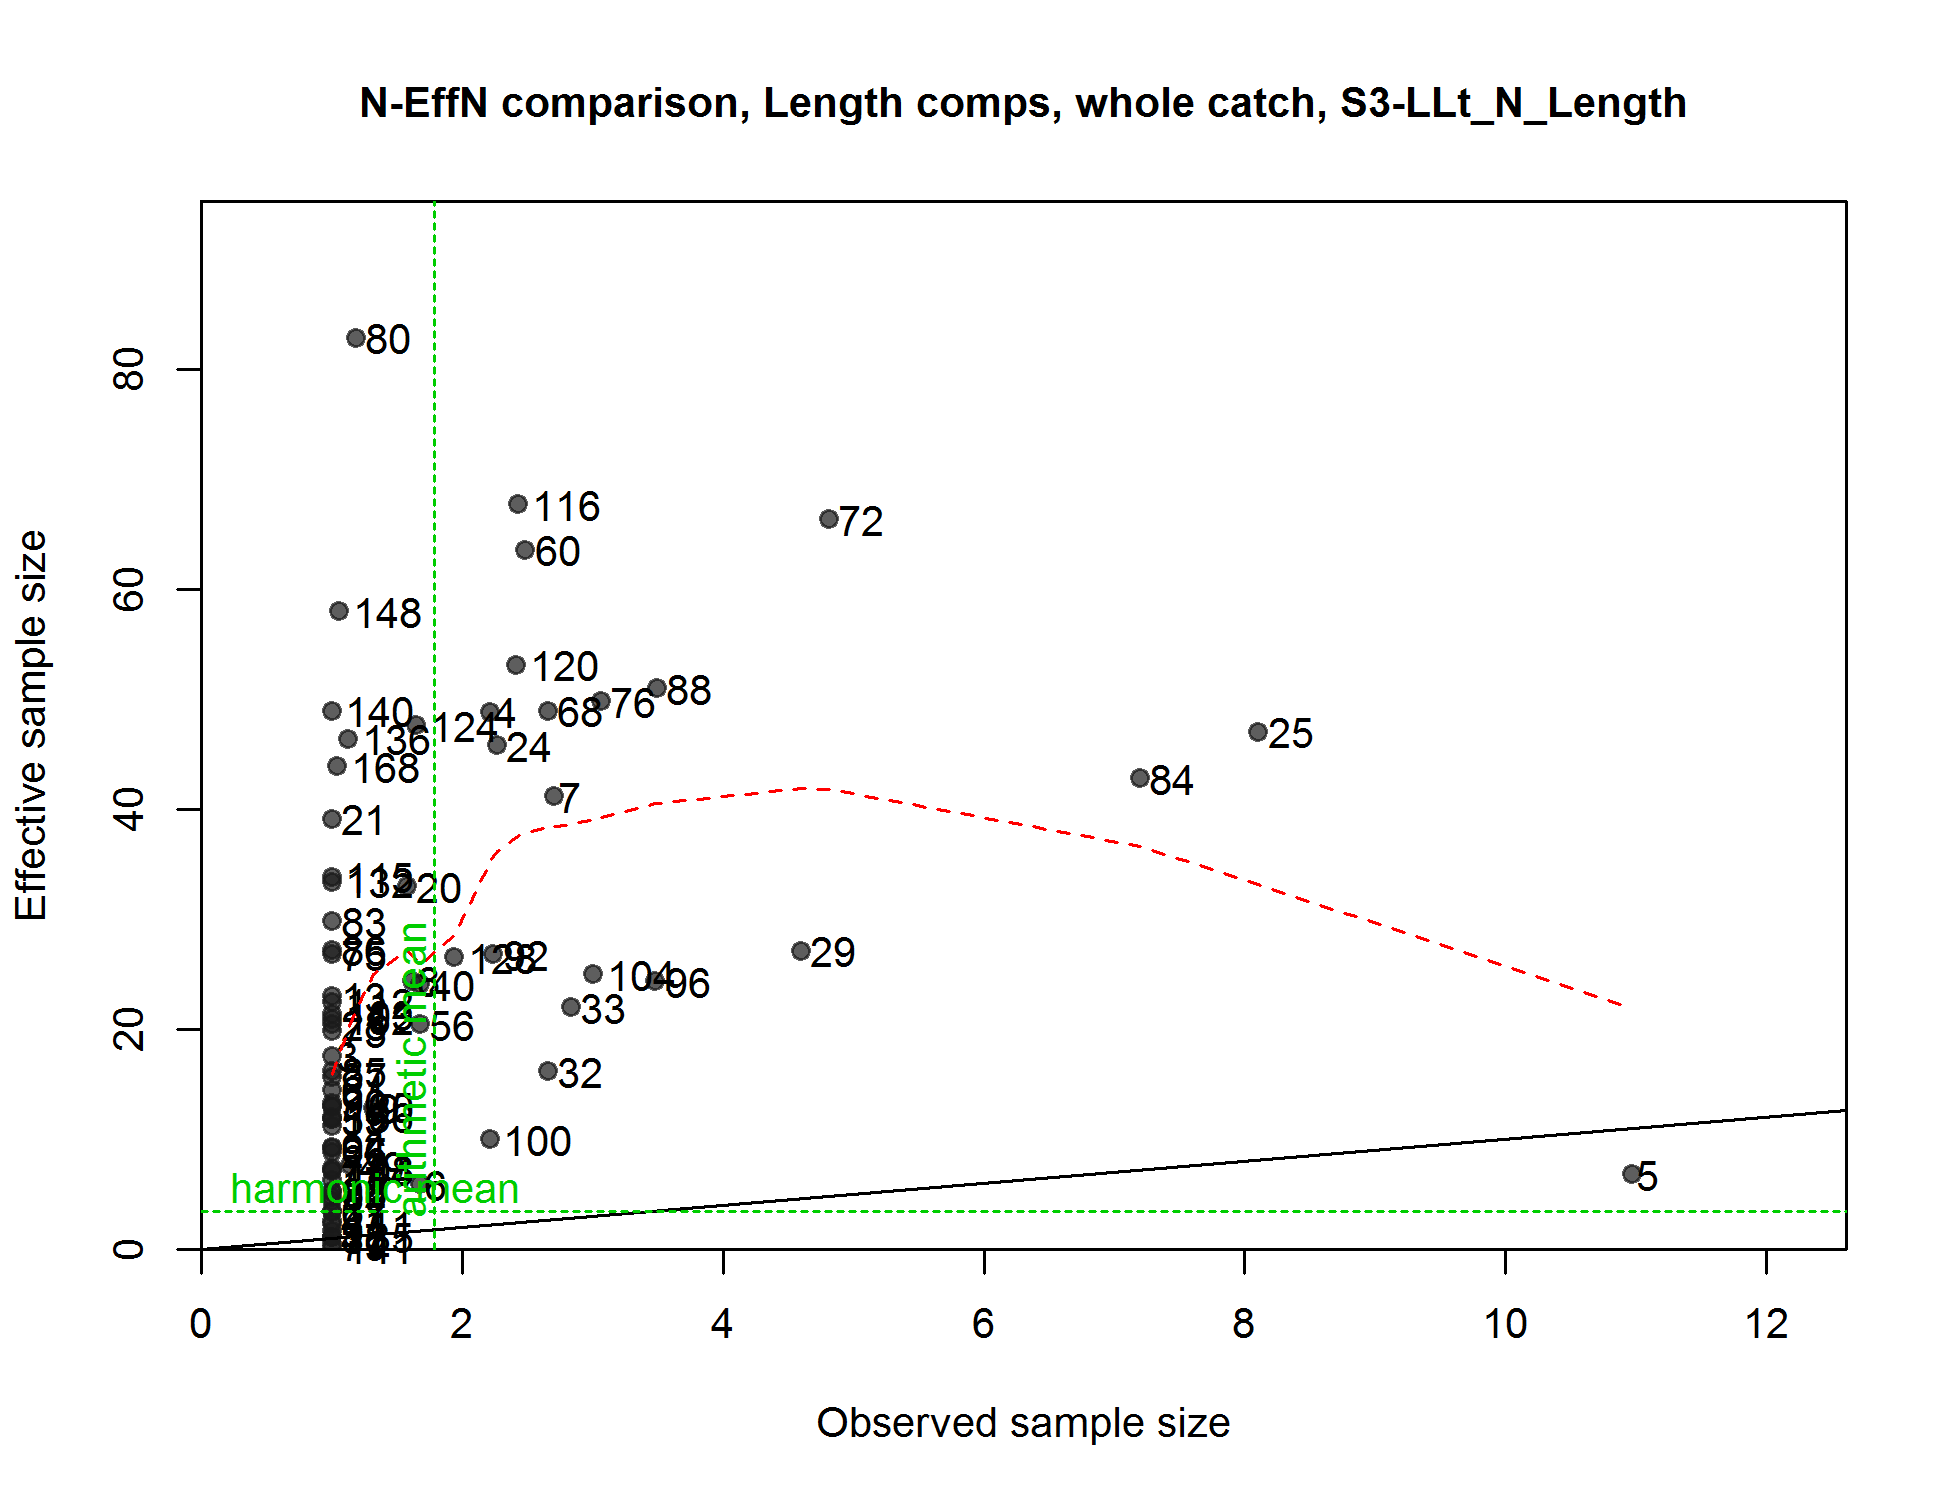
N-EffN comparison, Length comps, whole catch, S3-LLt_N_Length
file: comp_lenfit_sampsize_flt19mkt0.png
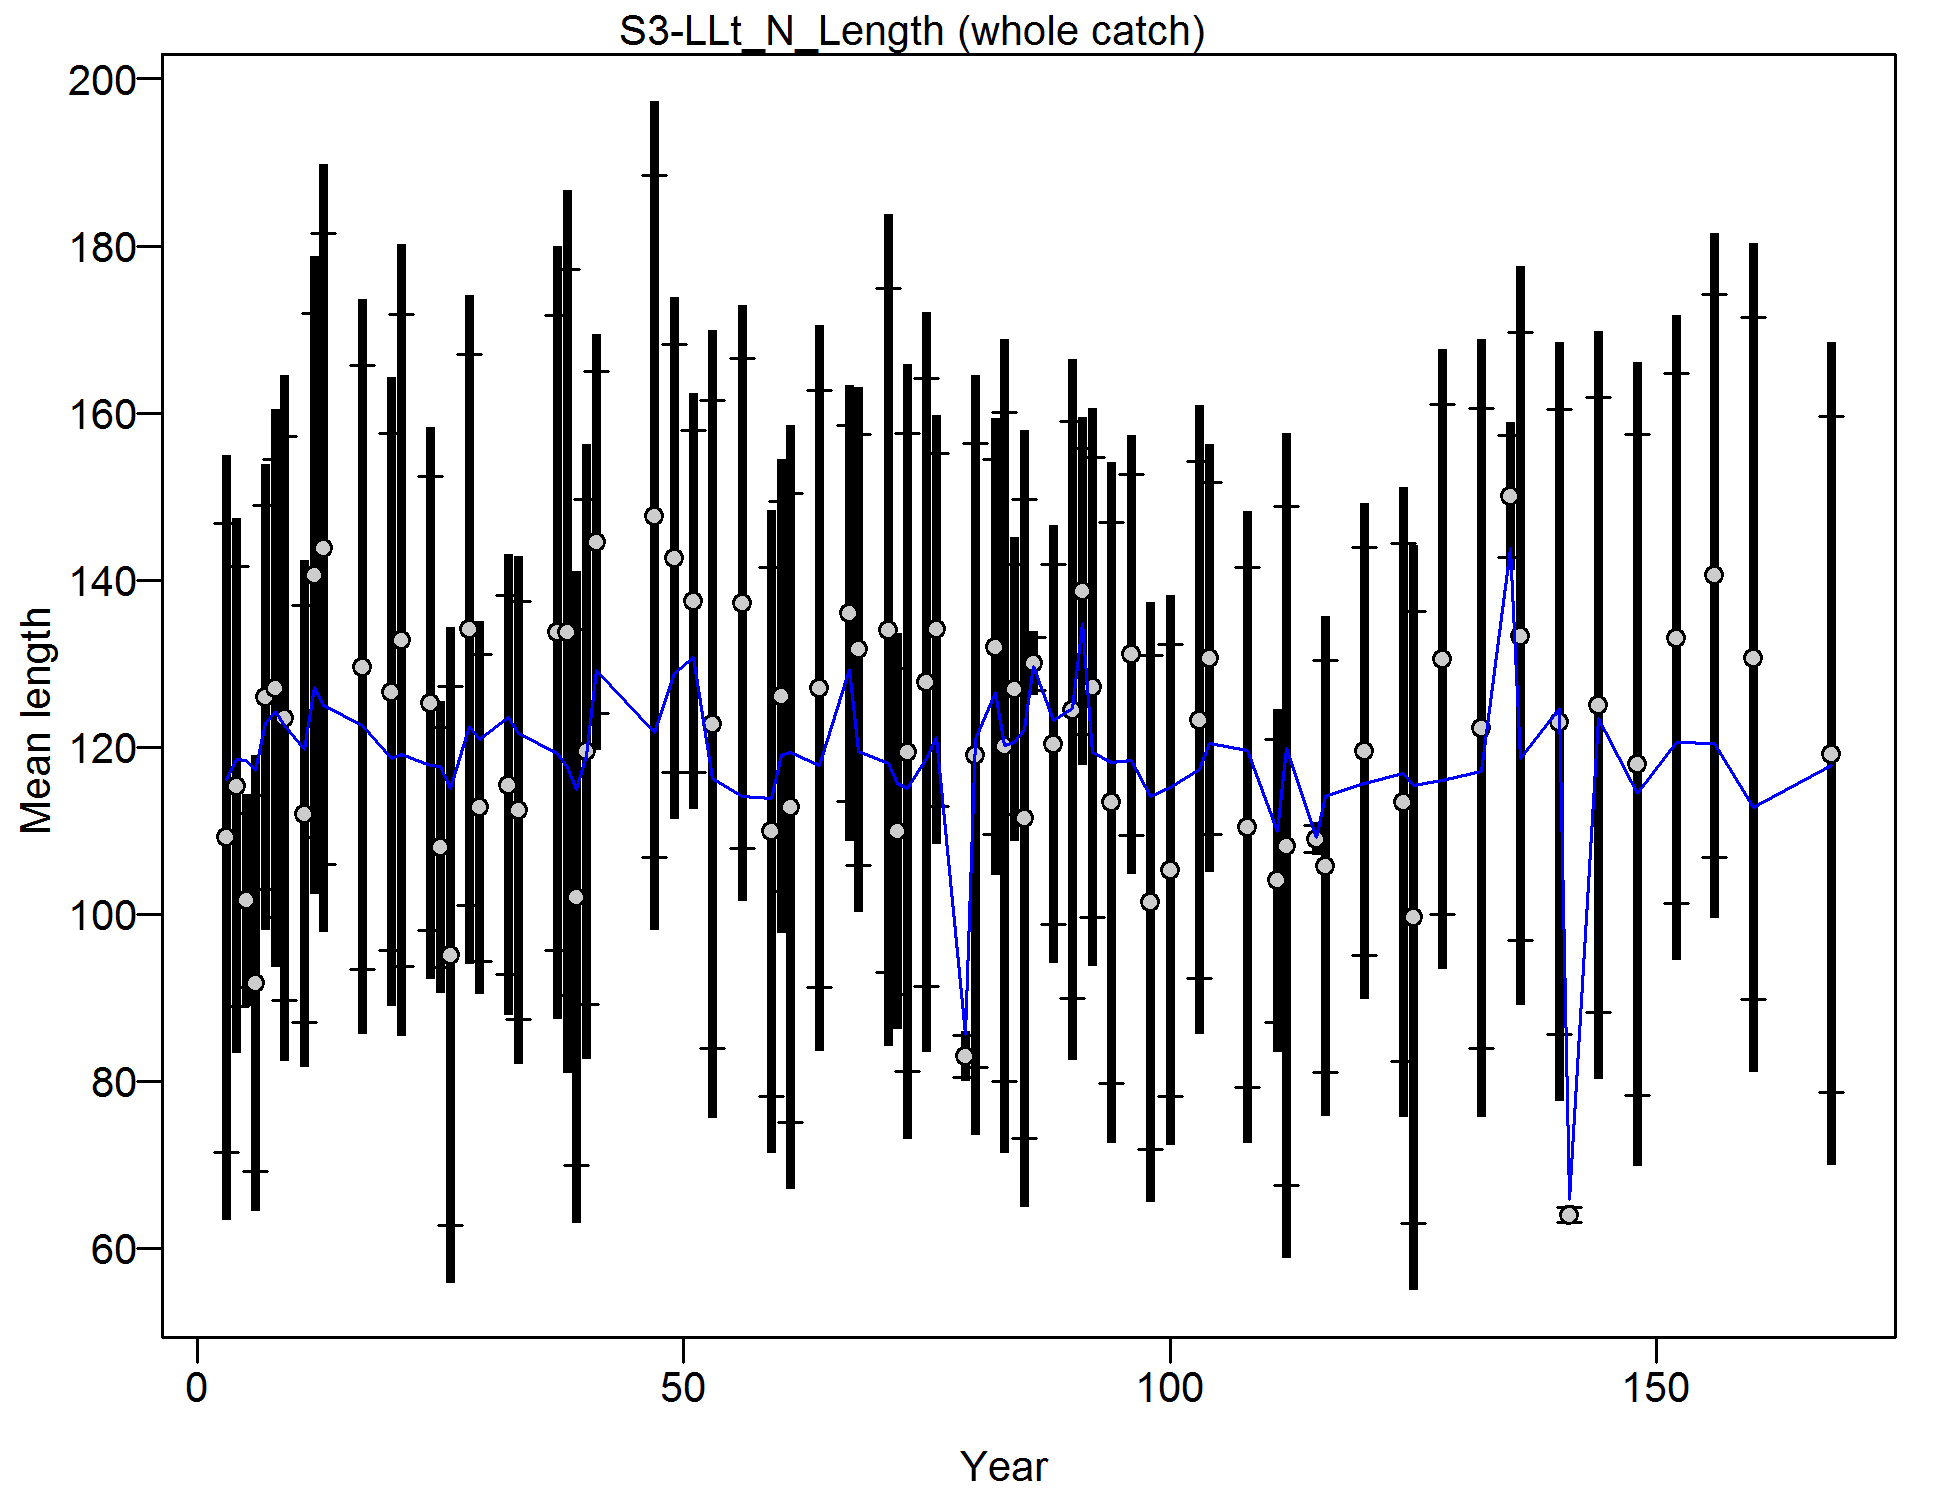
Mean length for S3-LLt_N_Length with 95% confidence intervals based on current samples sizes.
Francis data weighting method TA1.8: thinner intervals (with capped ends) show result of further adjusting sample sizes based on suggested multiplier (with 95% interval) for len data from S3-LLt_N_Length:
1.4791 (0.9208-2.8391)
For more info, see
Francis, R.I.C.C. (2011). Data weighting in statistical fisheries stock assessment models. Can. J. Fish. Aquat. Sci. 68: 1124-1138.
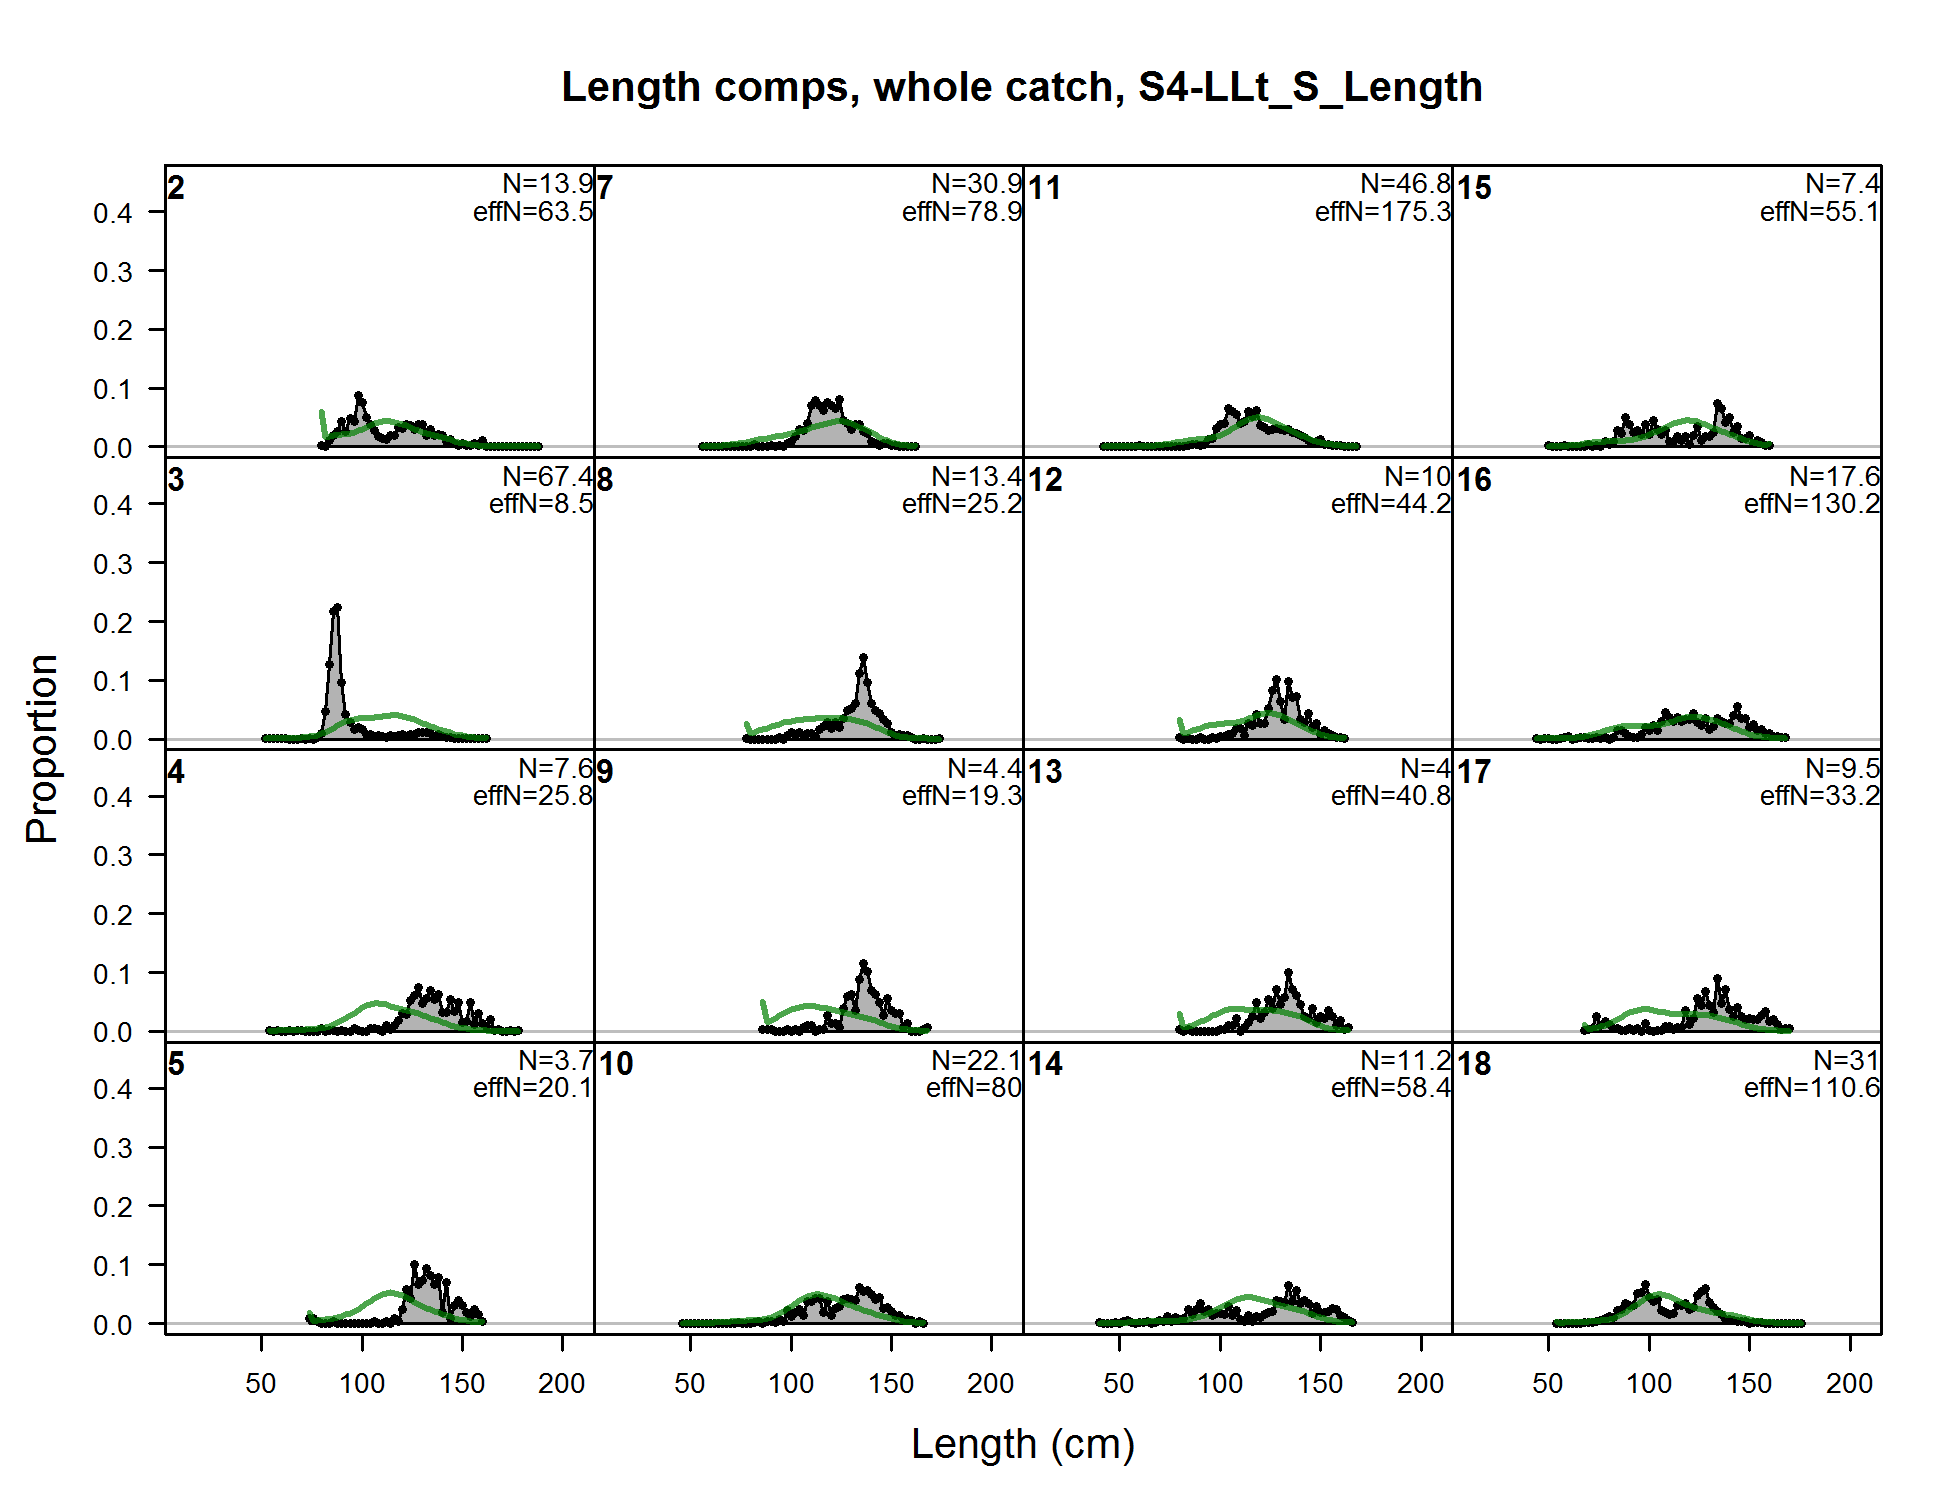
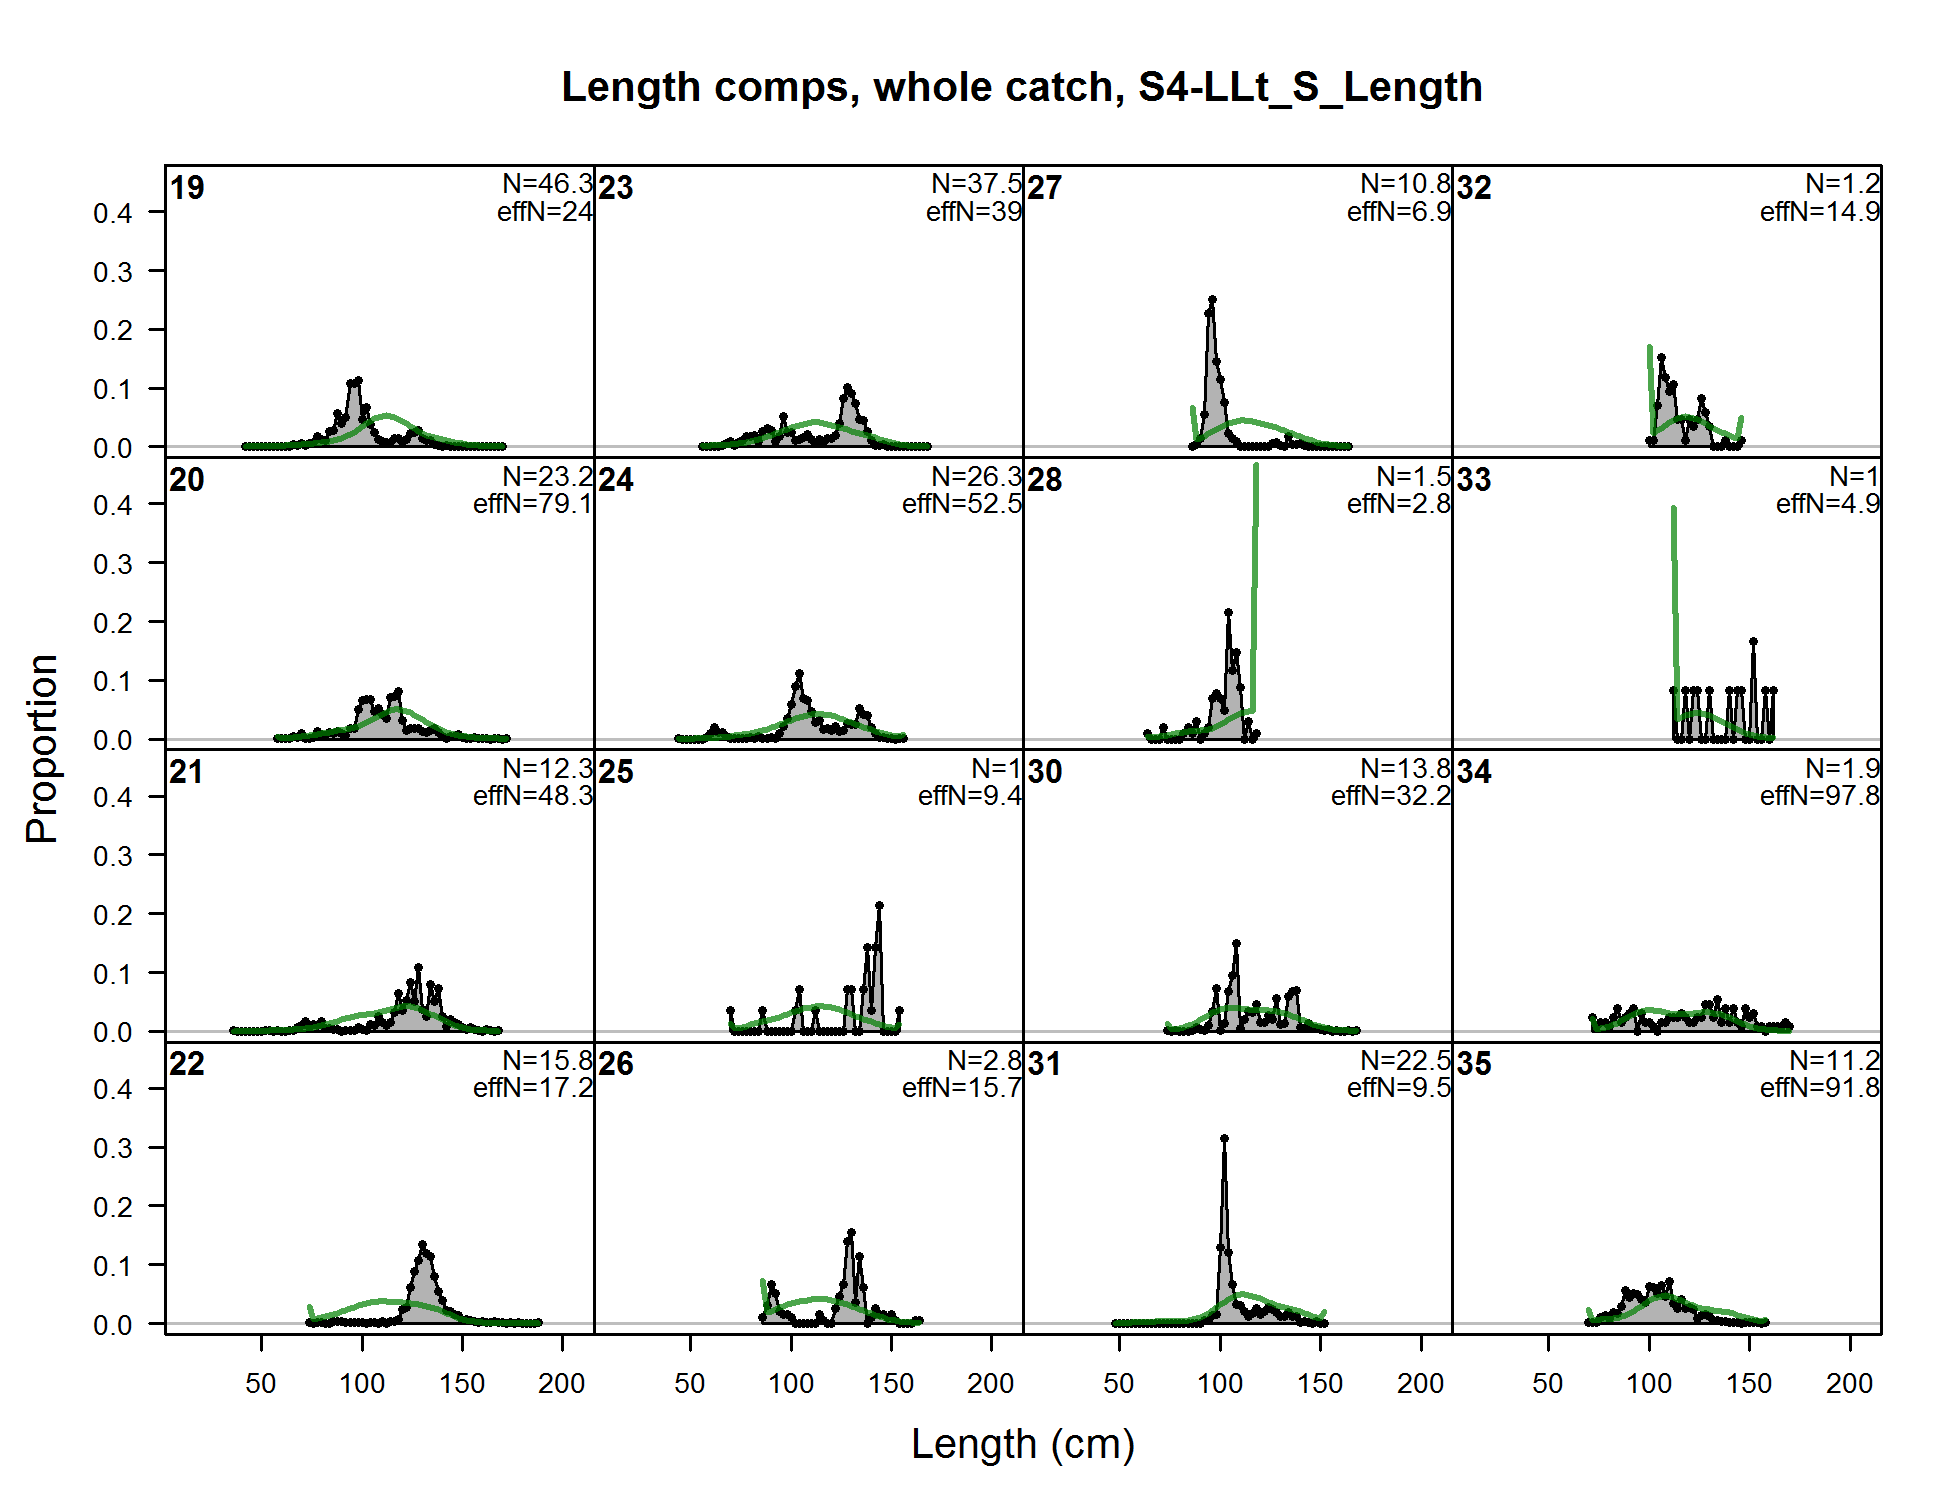
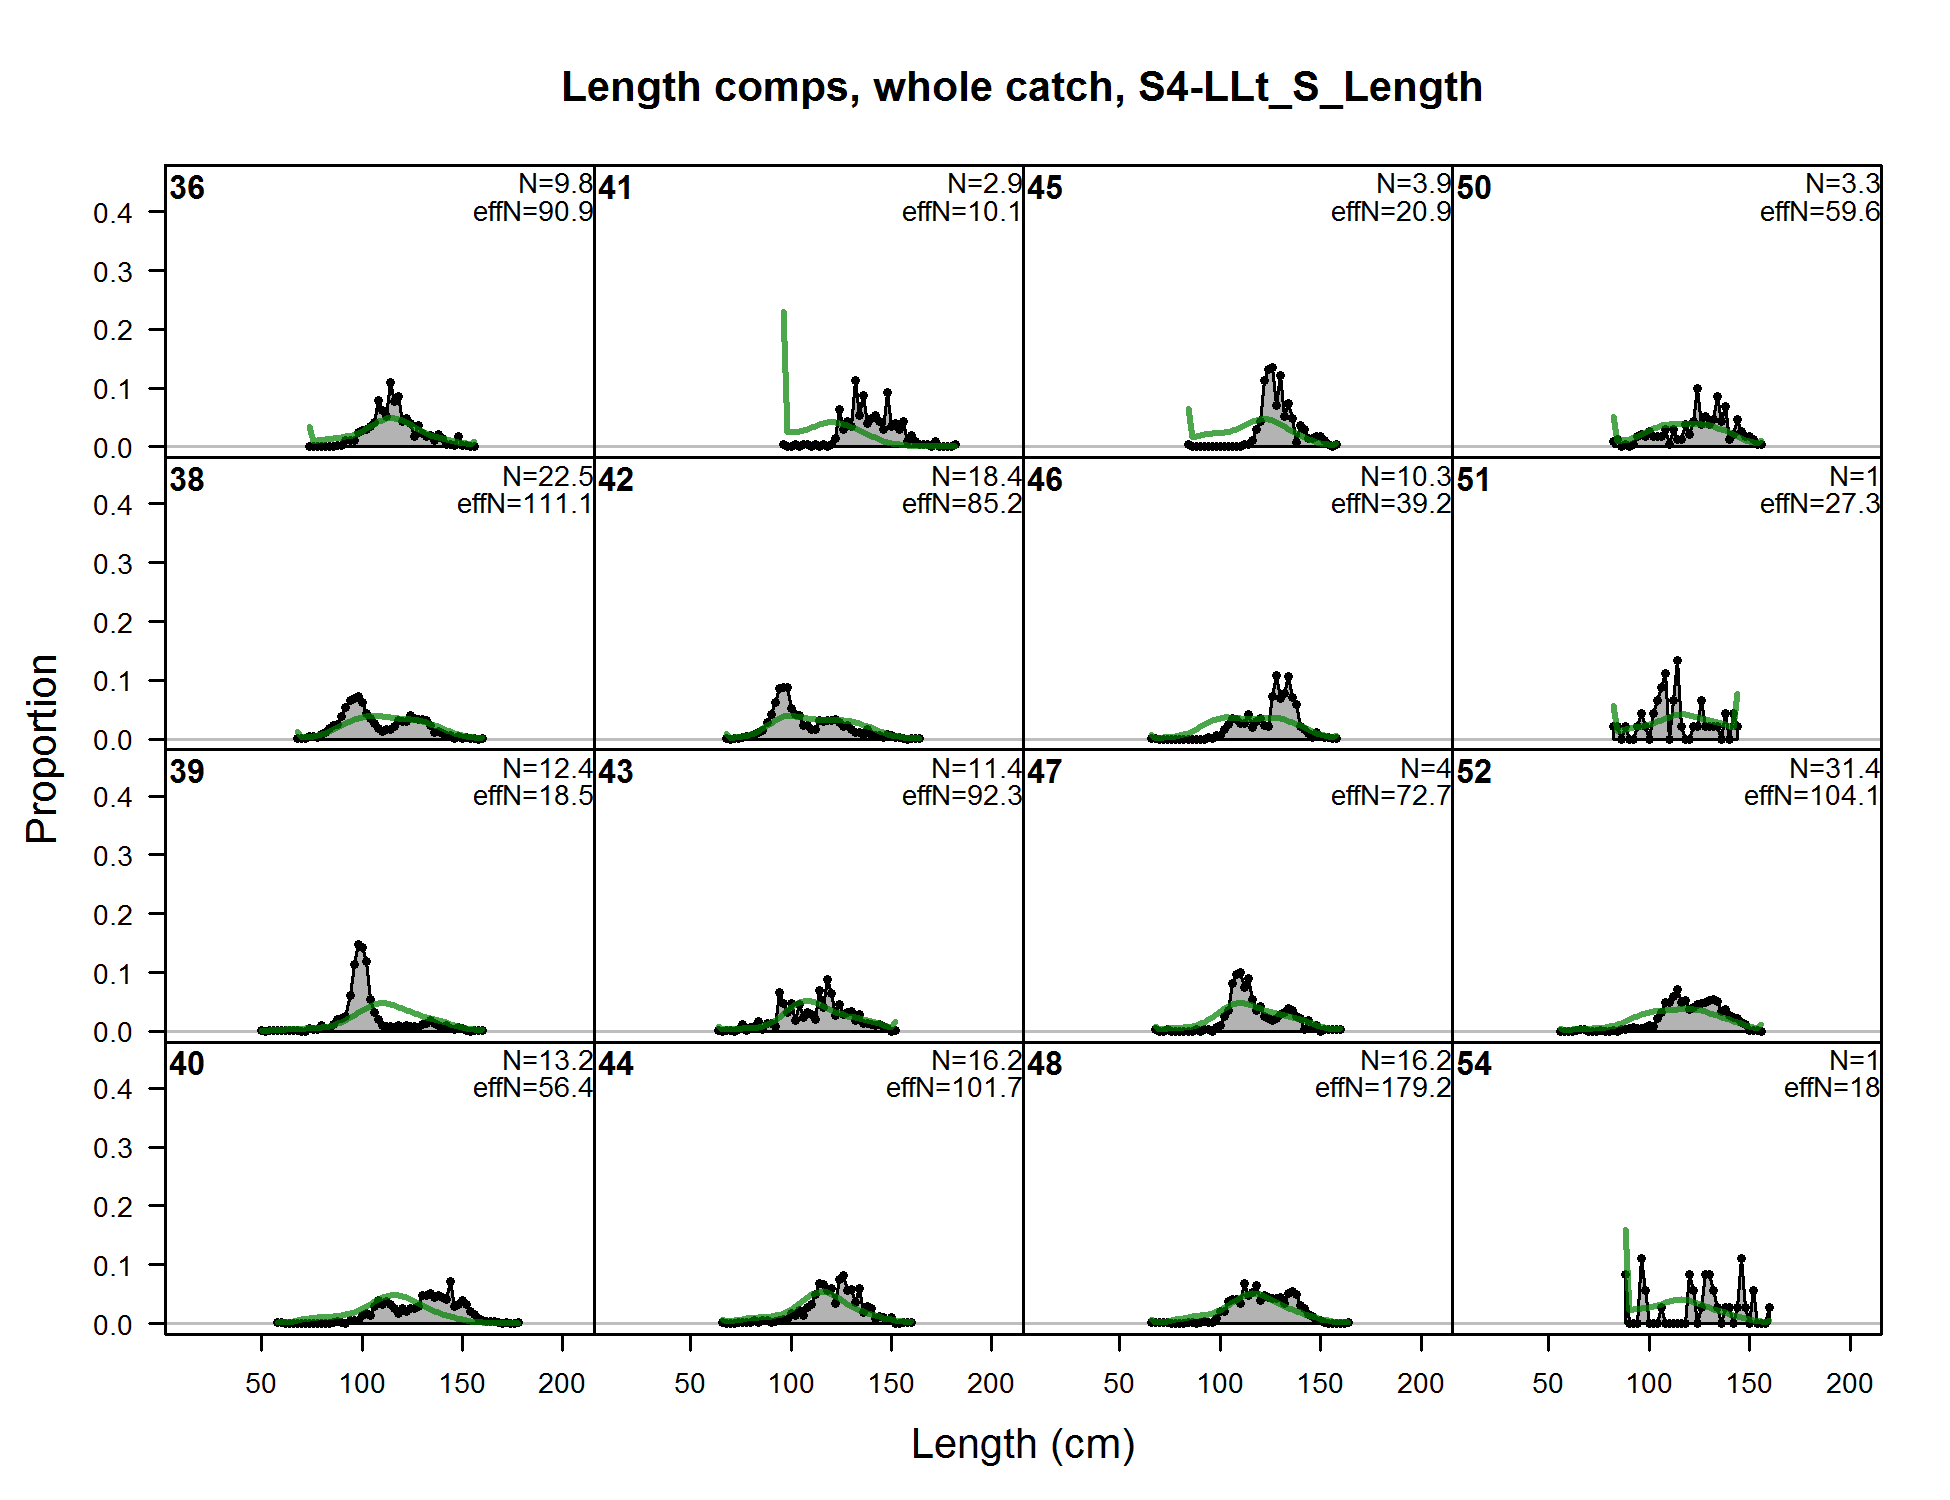
Length comps, whole catch, S4-LLt_S_Length (plot 1 of 6)
file: comp_lenfit_flt20mkt0_page1.png
Length comps, whole catch, S4-LLt_S_Length (plot 1 of 6) (plot 2 of 6)
file: comp_lenfit_flt20mkt0_page2.png
Length comps, whole catch, S4-LLt_S_Length (plot 1 of 6) (plot 2 of 6) (plot 3 of 6)
file: comp_lenfit_flt20mkt0_page3.png
Length comps, whole catch, S4-LLt_S_Length (plot 1 of 6) (plot 2 of 6) (plot 3 of 6) (plot 4 of 6)
file: comp_lenfit_flt20mkt0_page4.png
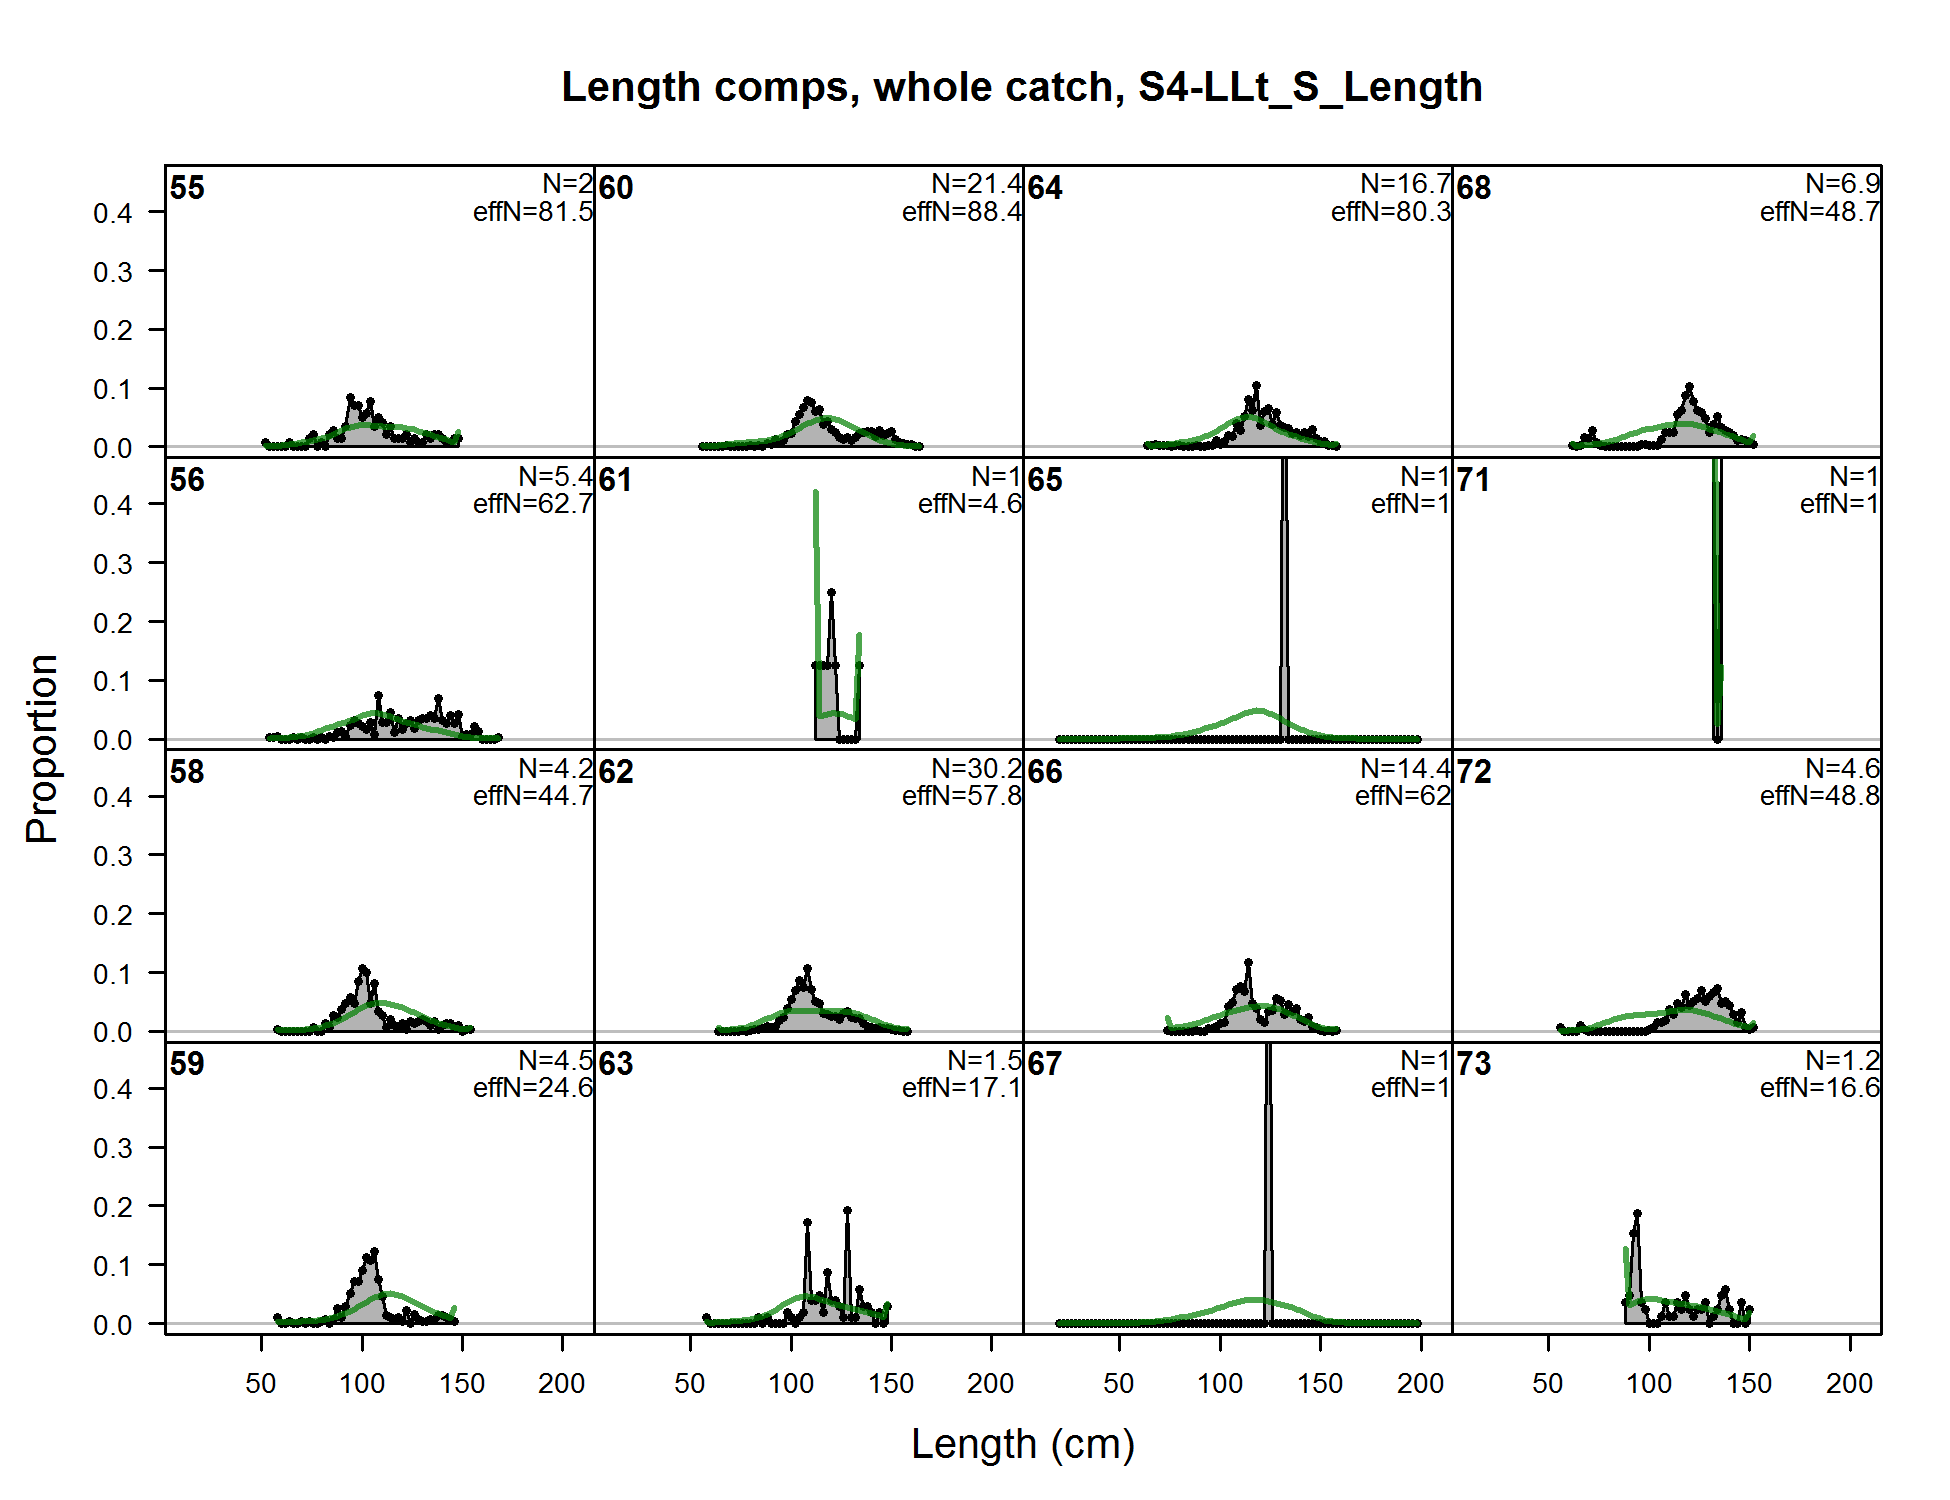
Length comps, whole catch, S4-LLt_S_Length (plot 1 of 6) (plot 2 of 6) (plot 3 of 6) (plot 4 of 6) (plot 5 of 6)
file: comp_lenfit_flt20mkt0_page5.png
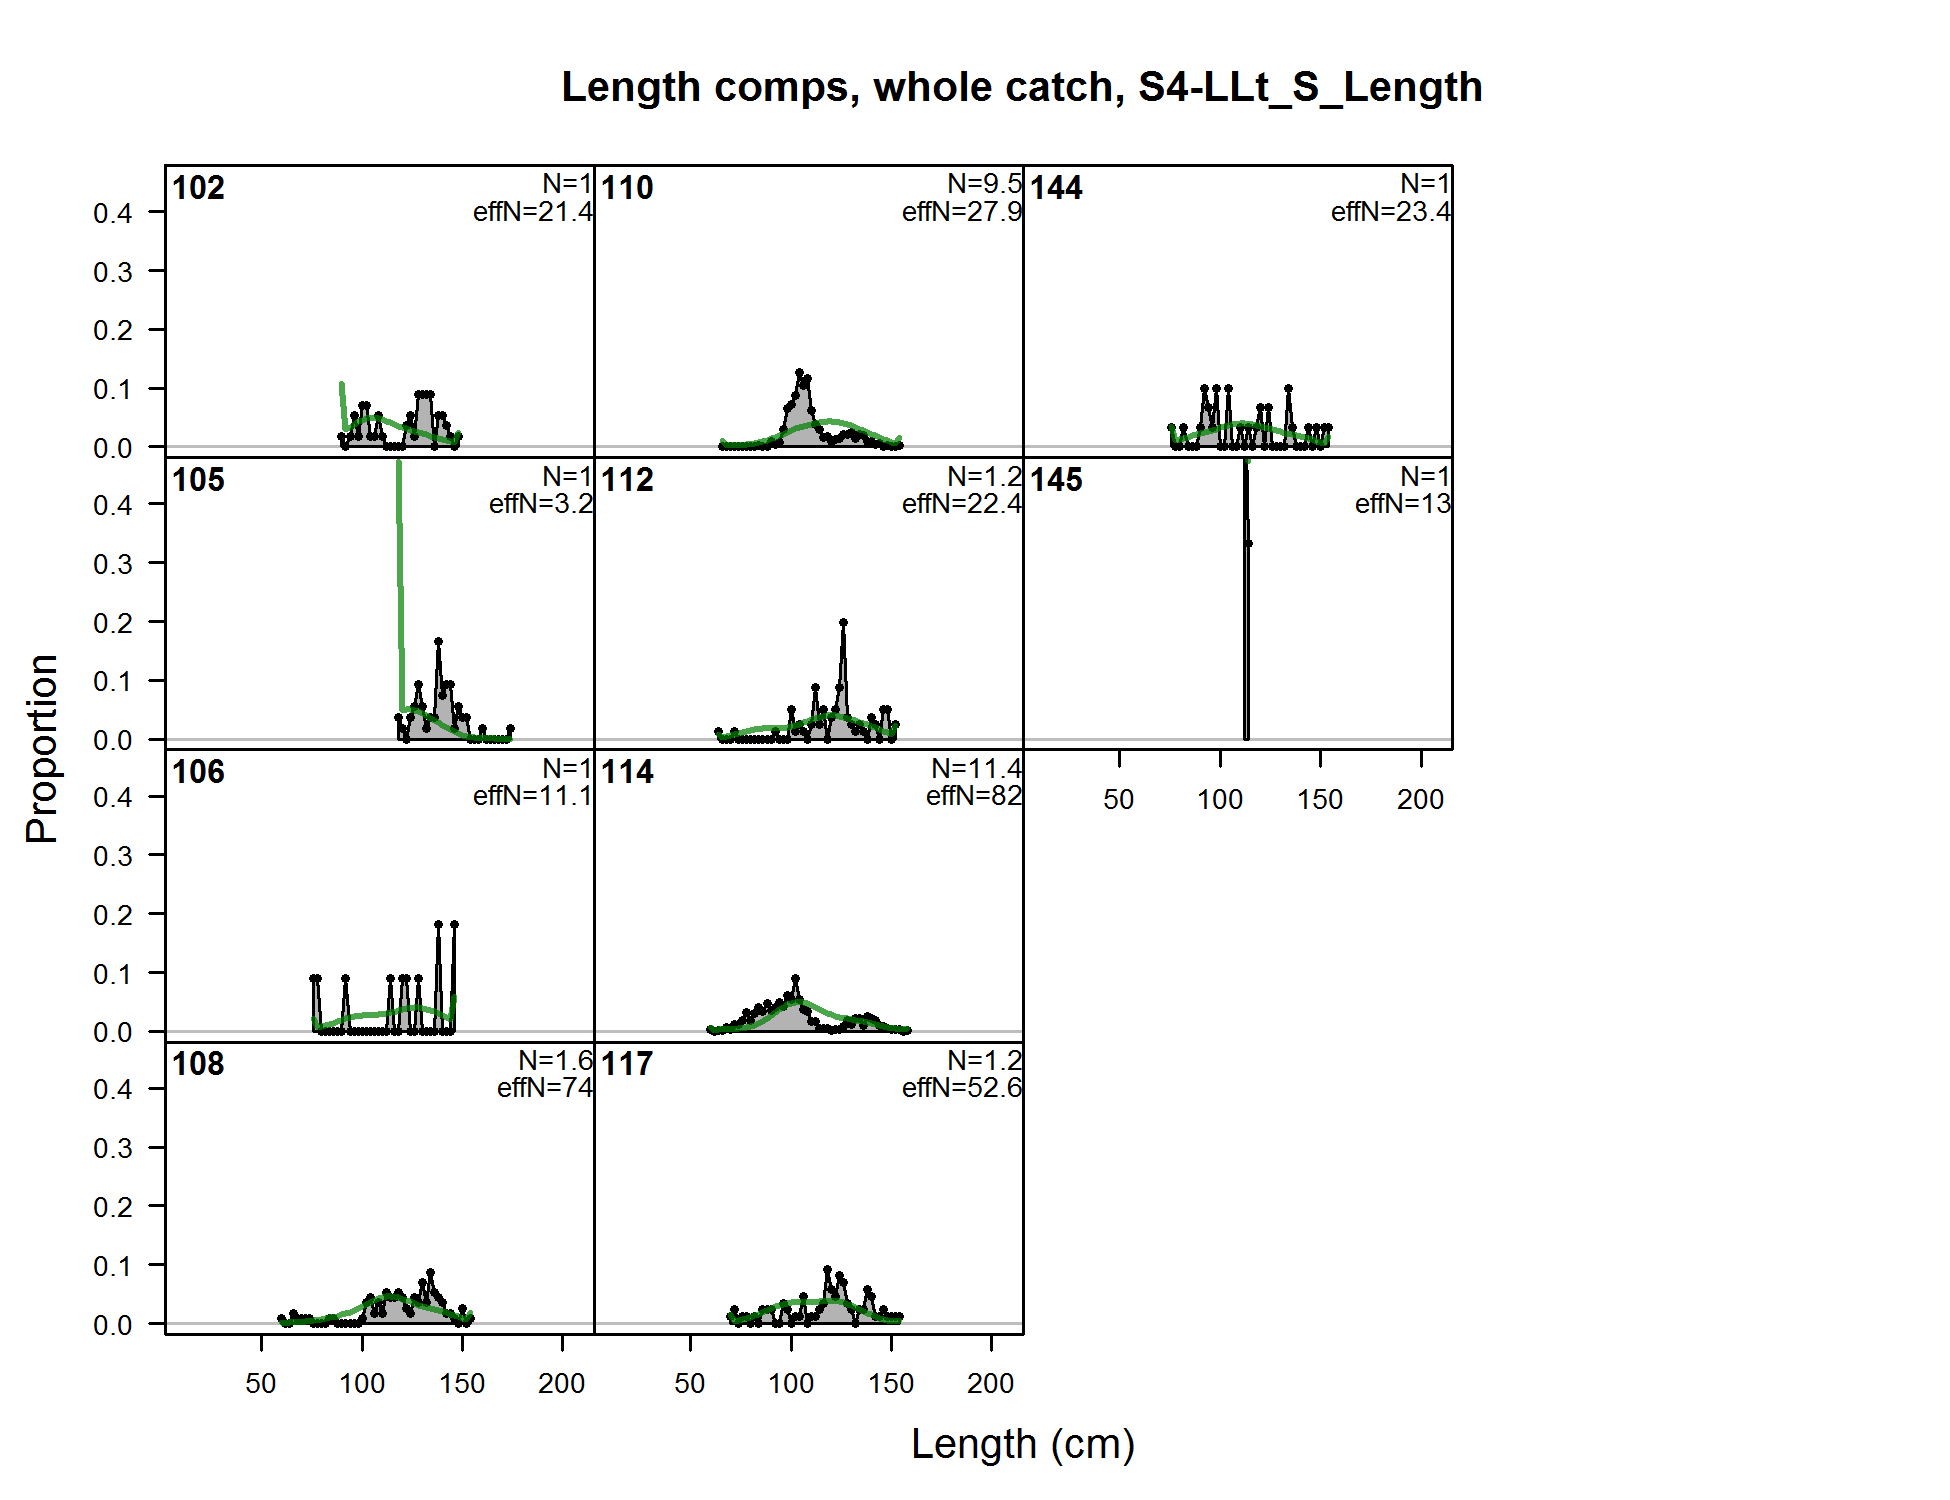
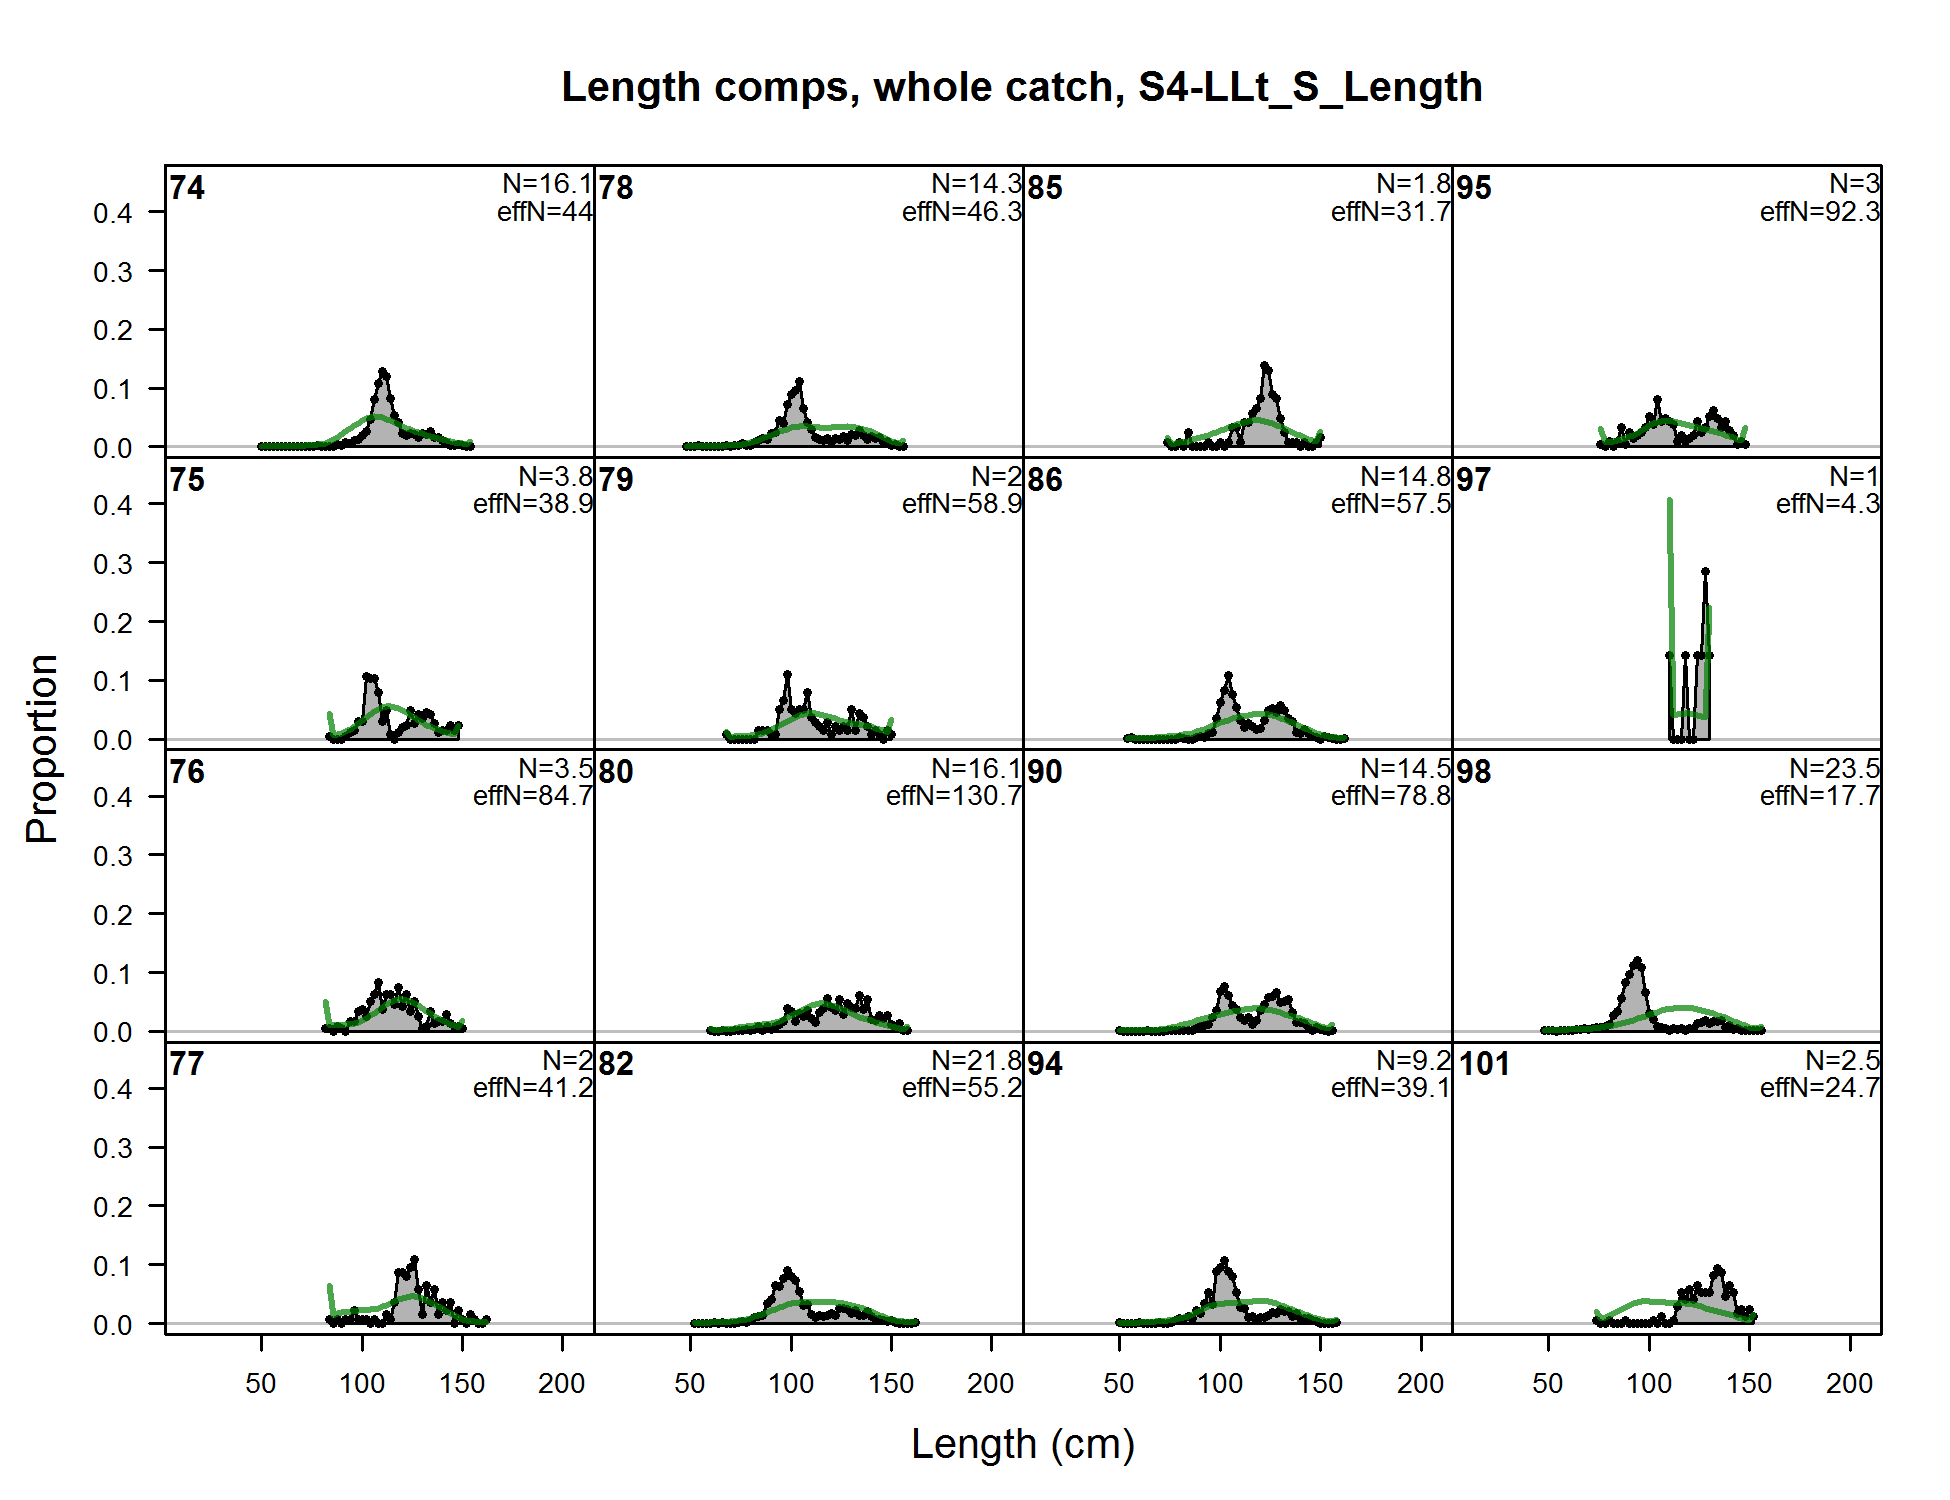
Length comps, whole catch, S4-LLt_S_Length (plot 1 of 6) (plot 2 of 6) (plot 3 of 6) (plot 4 of 6) (plot 5 of 6) (plot 6 of 6)
file: comp_lenfit_flt20mkt0_page6.png
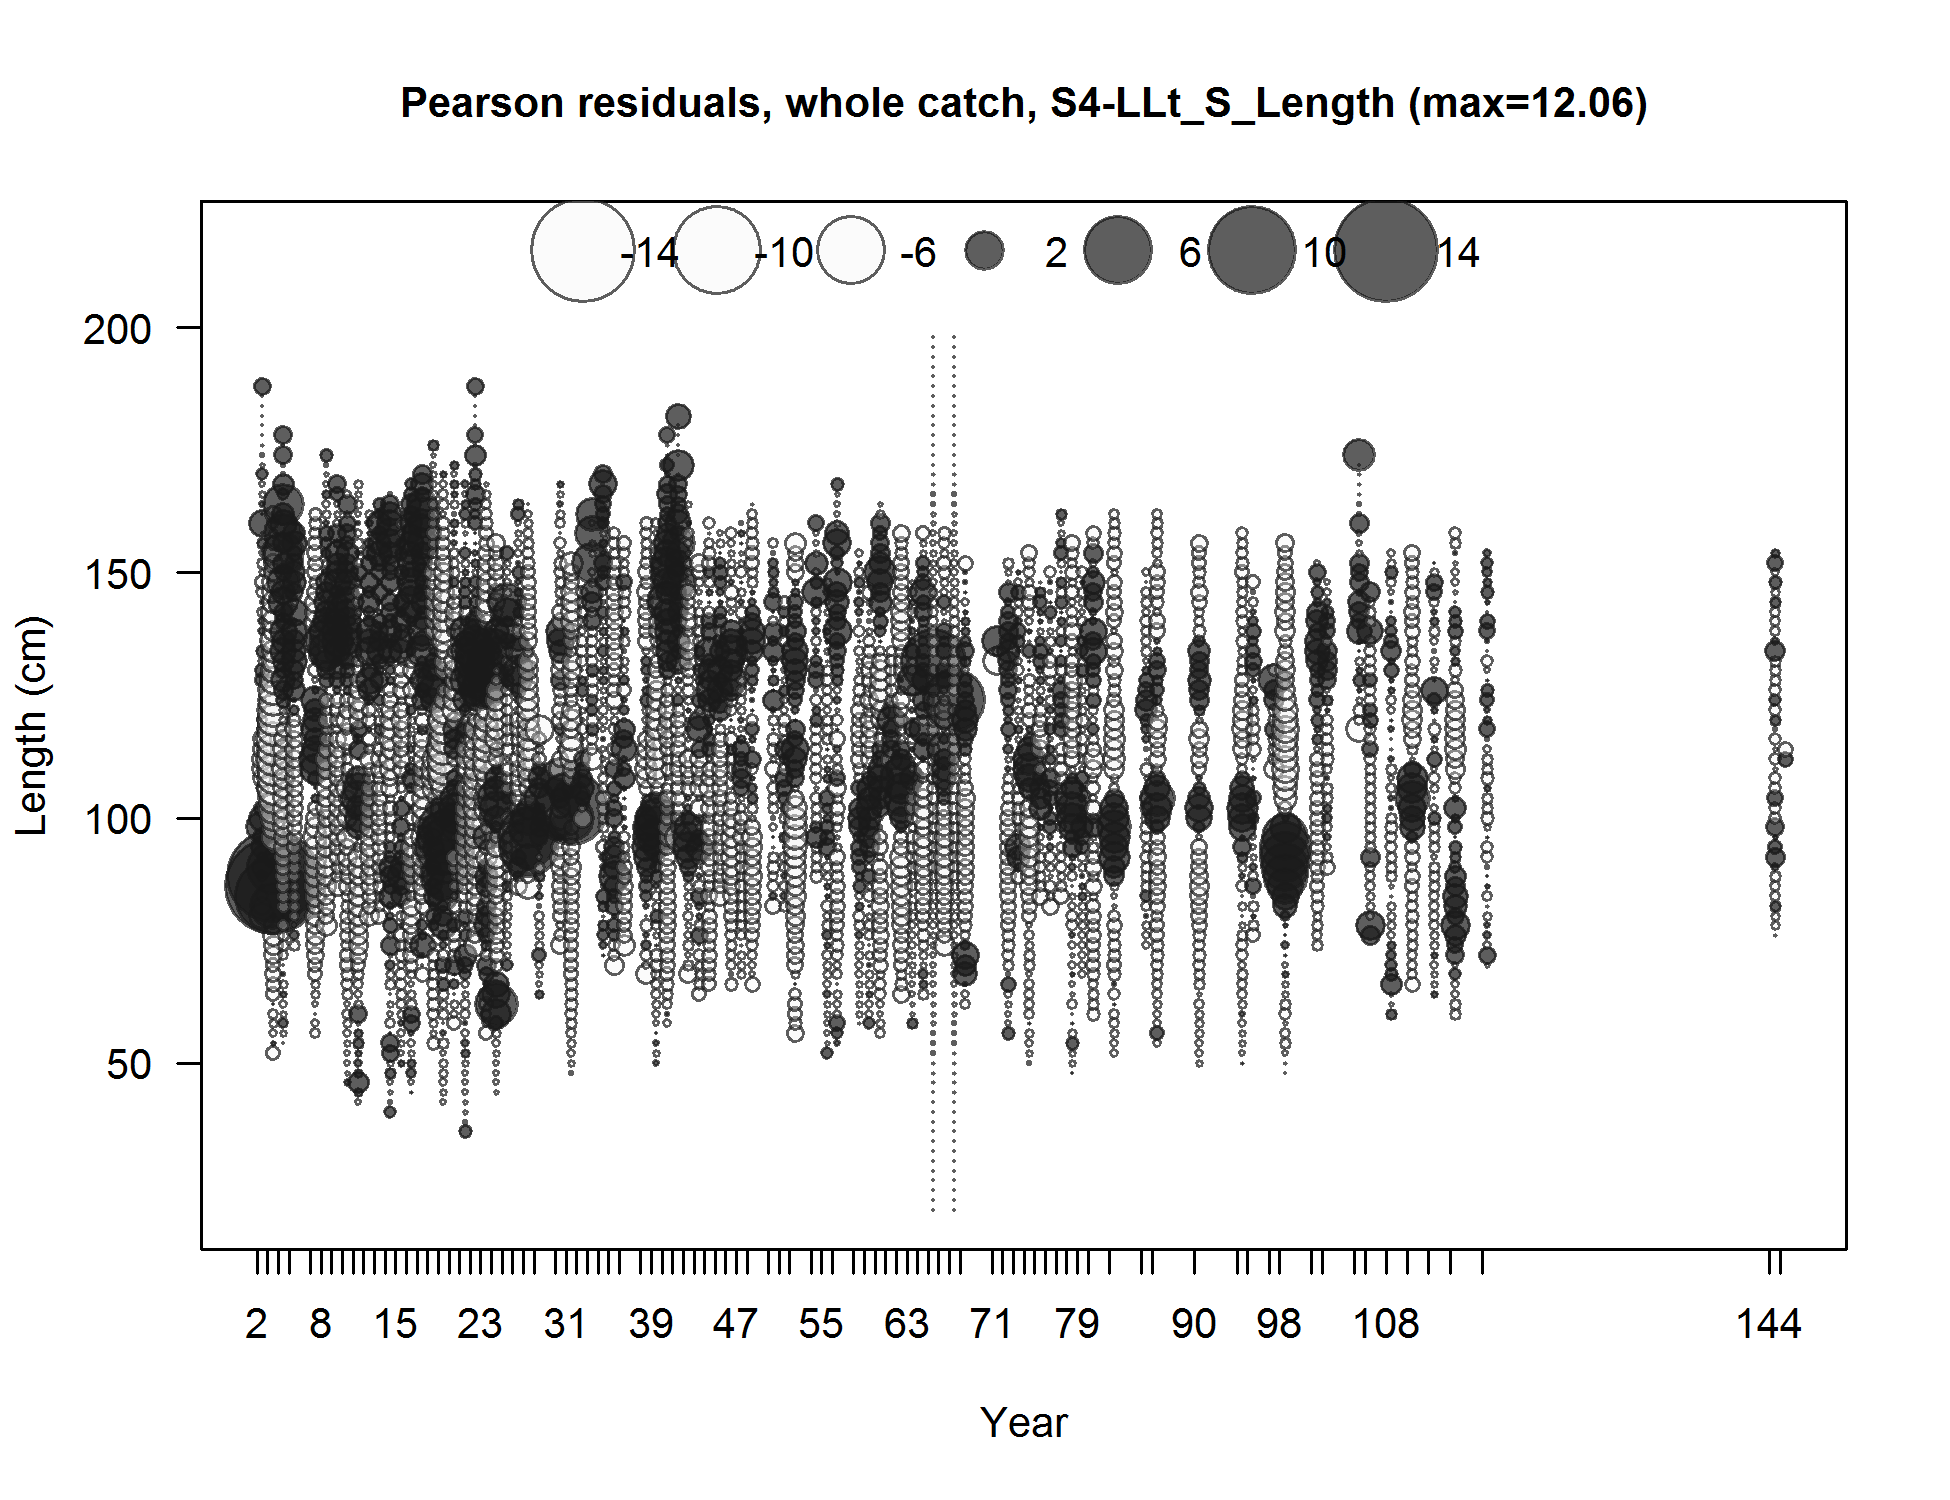
Pearson residuals, whole catch, S4-LLt_S_Length (max=12.06) (plot 6 of 6)
Closed bubbles are positive residuals (observed > expected) and open bubbles are negative residuals (observed < expected).
file: comp_lenfit_residsflt20mkt0_page6.png
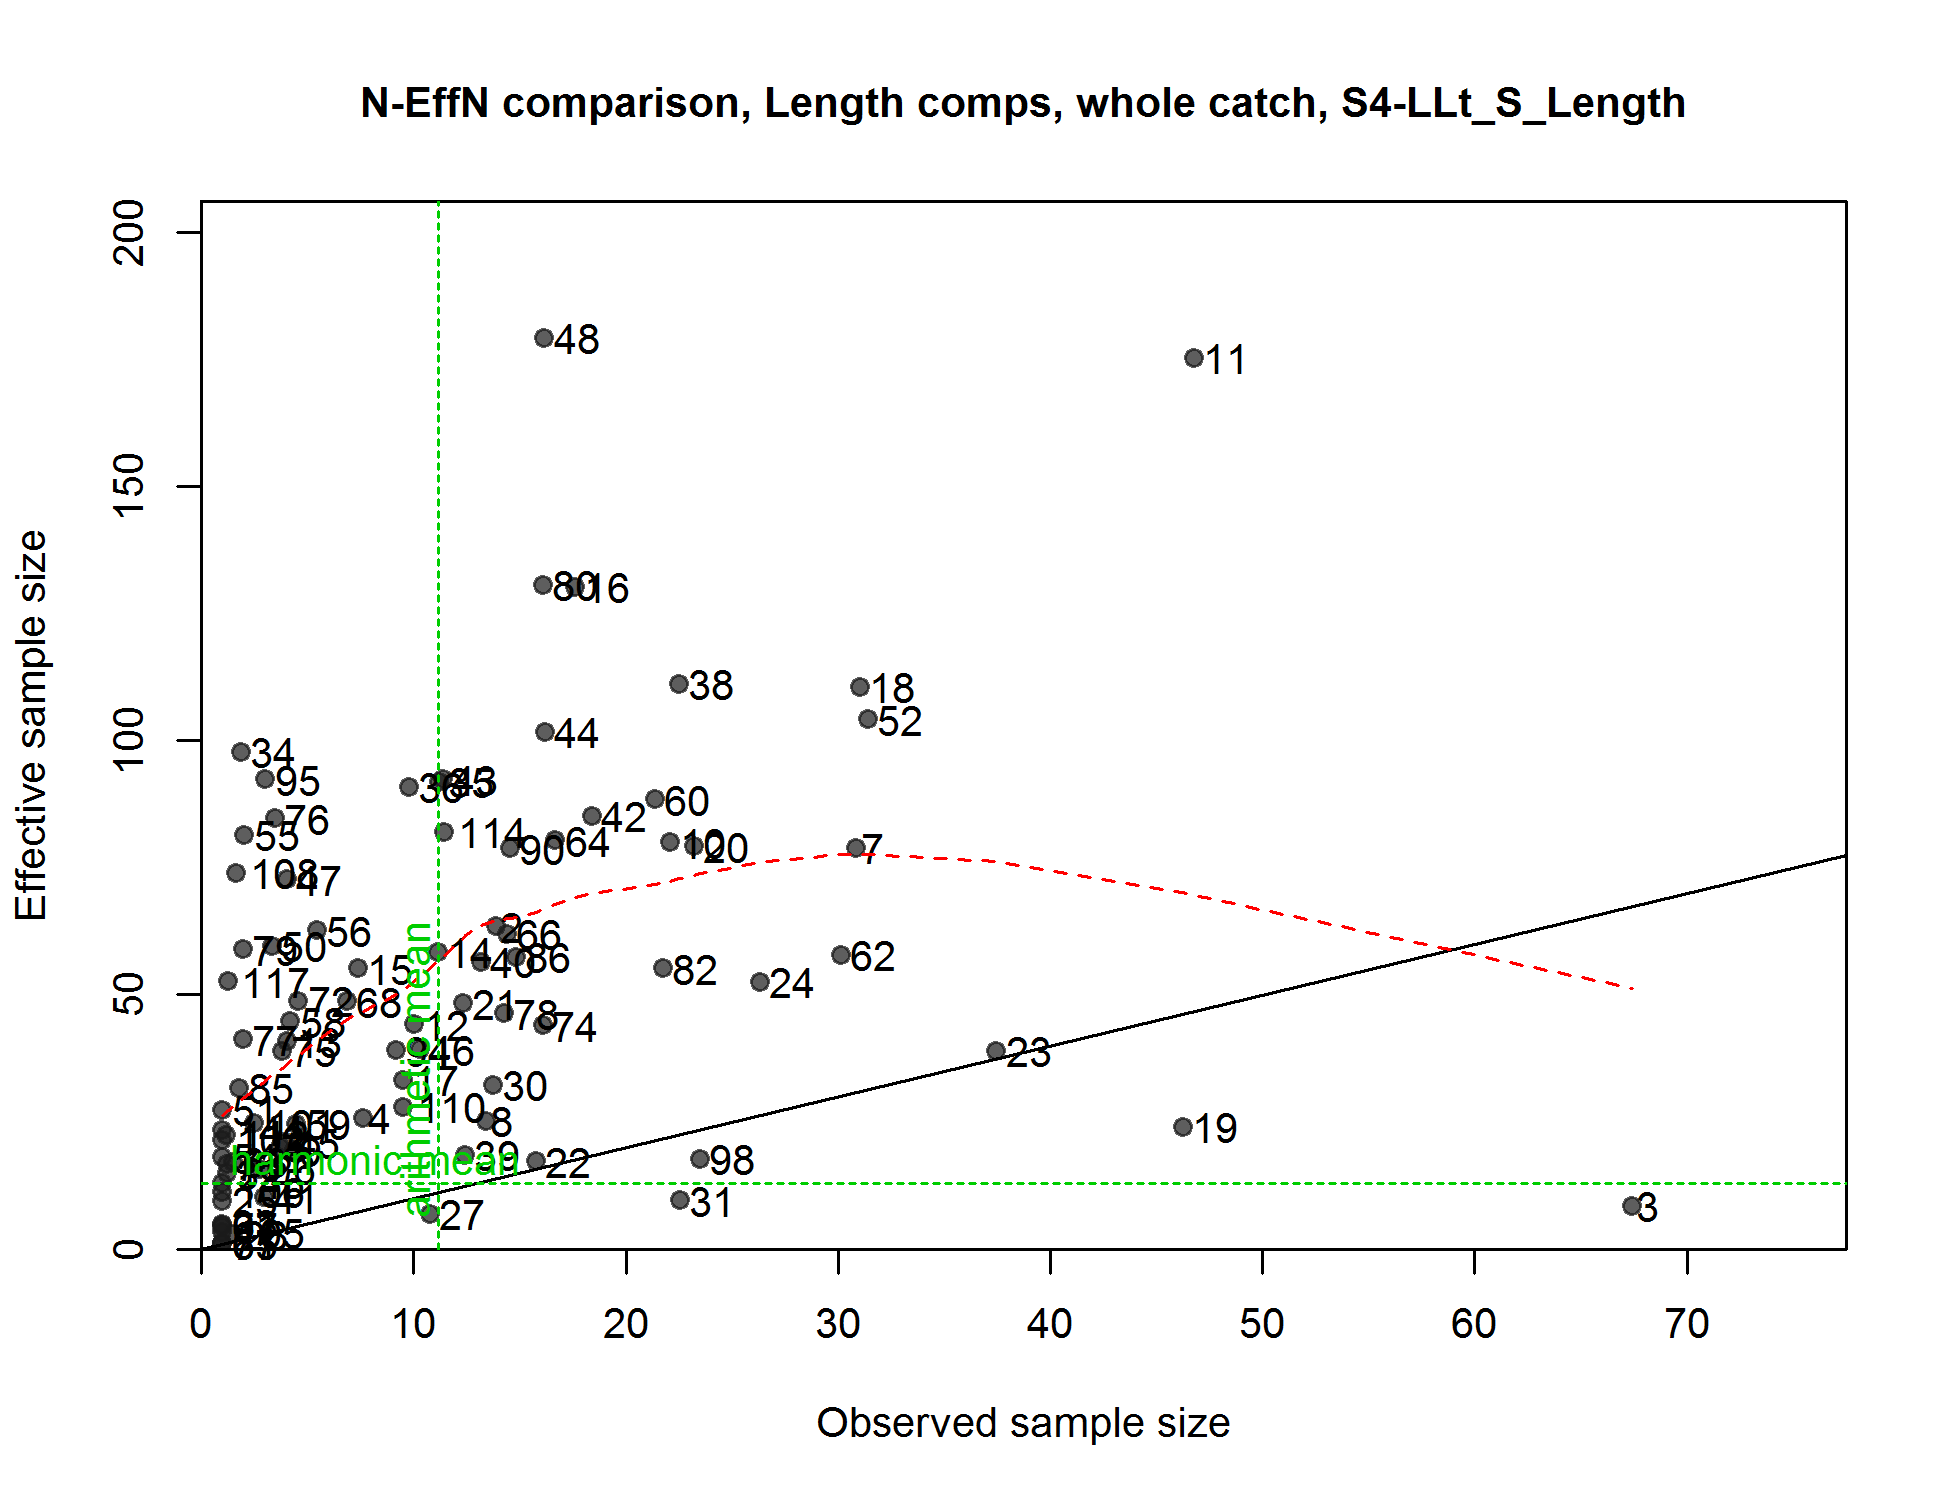
N-EffN comparison, Length comps, whole catch, S4-LLt_S_Length
file: comp_lenfit_sampsize_flt20mkt0.png
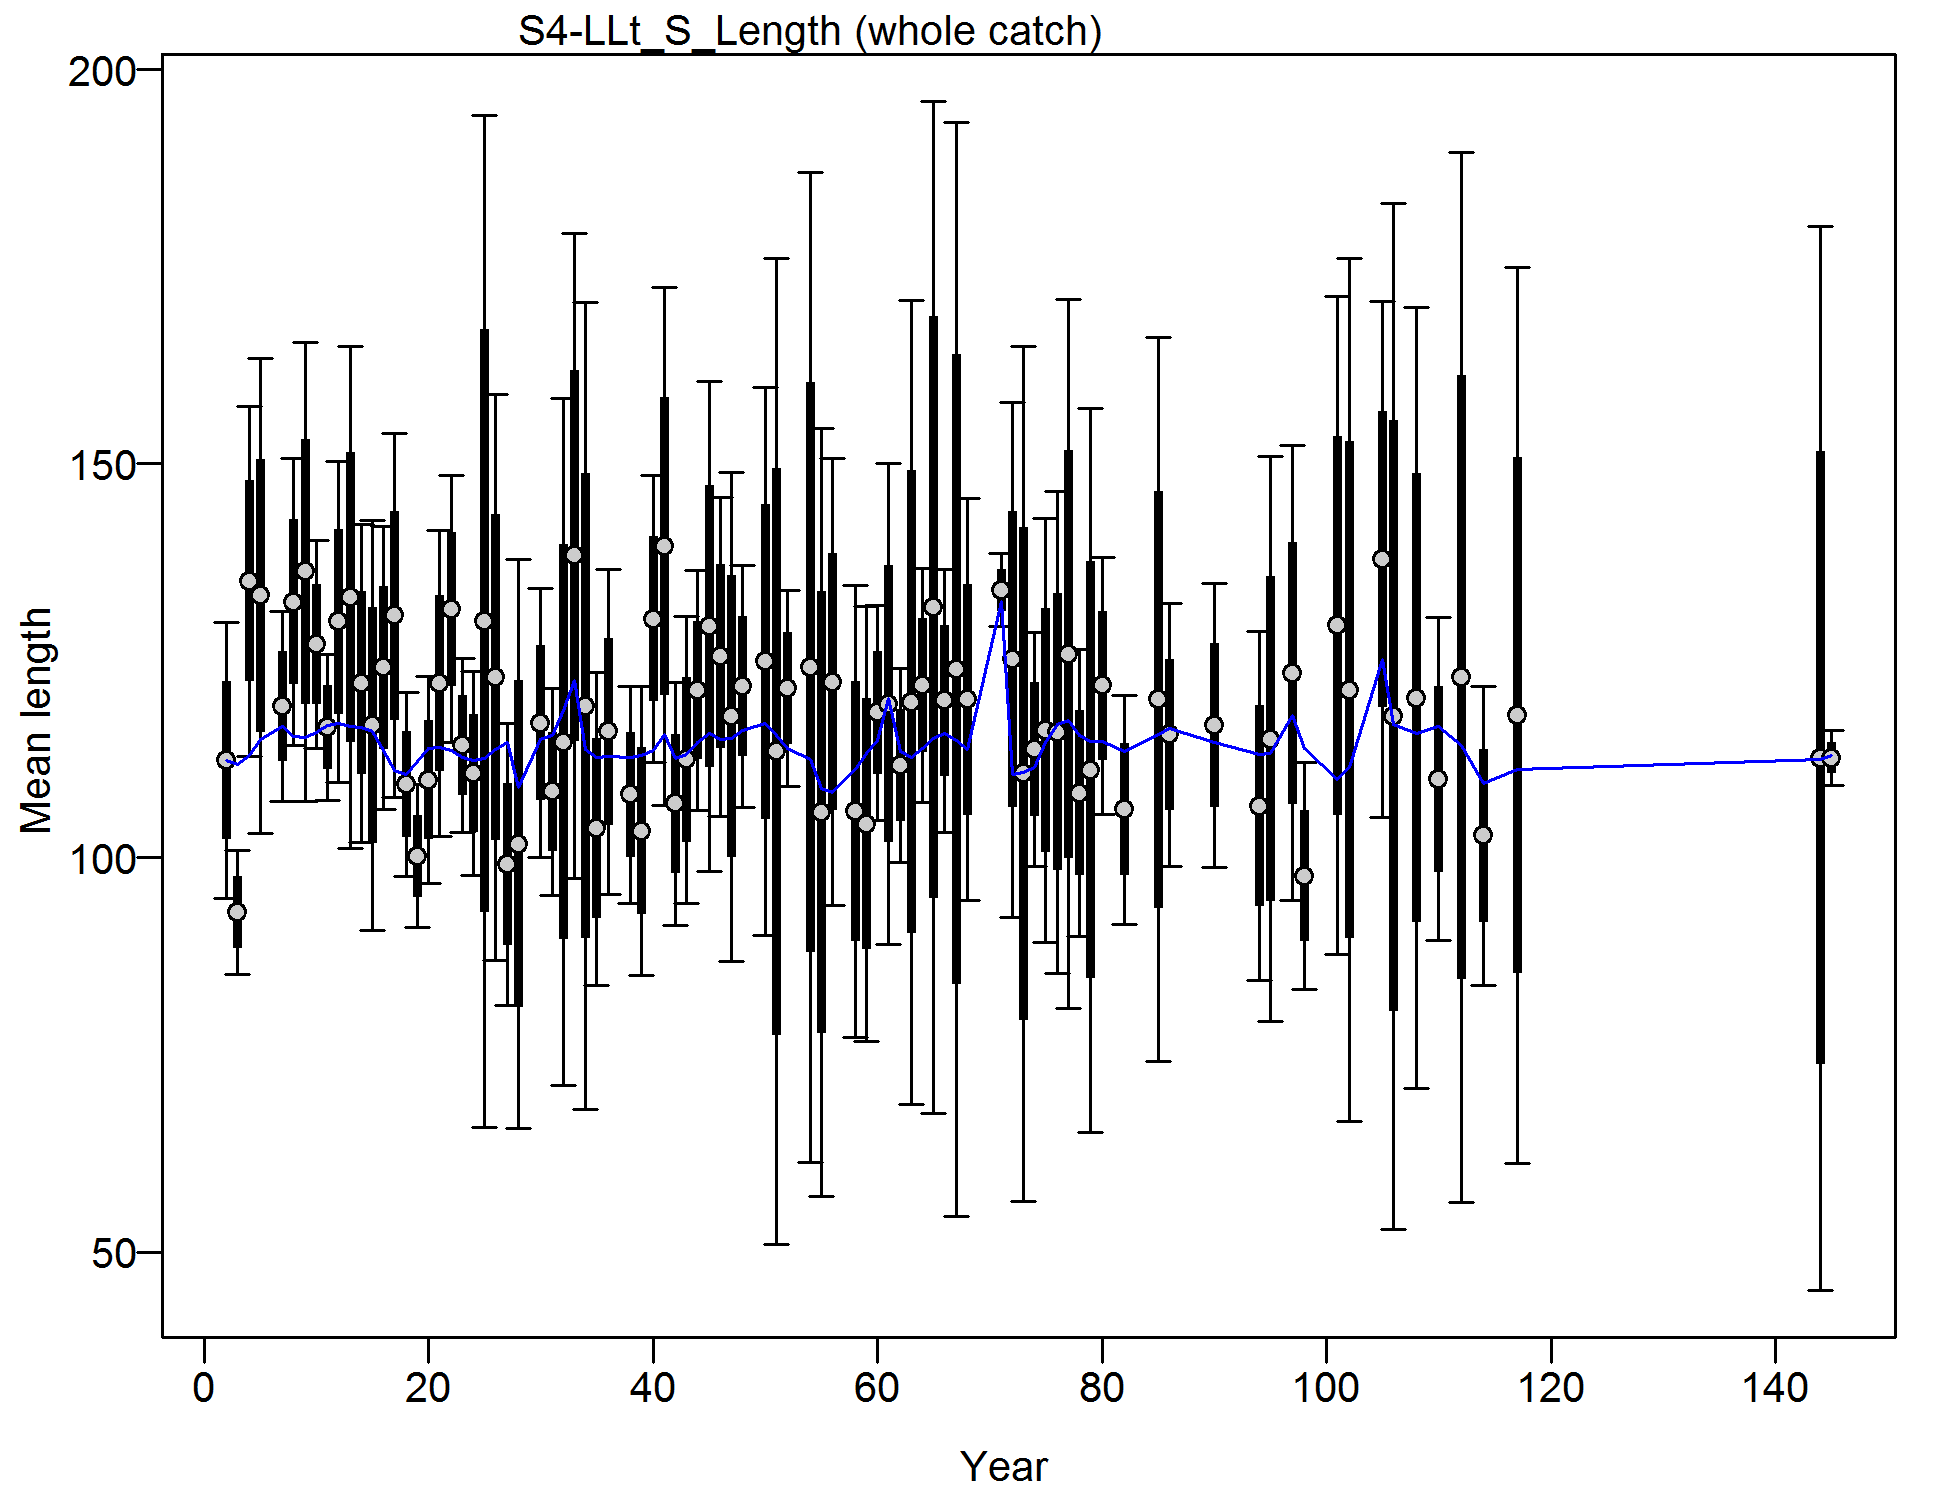
Mean length for S4-LLt_S_Length with 95% confidence intervals based on current samples sizes.
Francis data weighting method TA1.8: thinner intervals (with capped ends) show result of further adjusting sample sizes based on suggested multiplier (with 95% interval) for len data from S4-LLt_S_Length:
0.3315 (0.1997-0.6165)
For more info, see
Francis, R.I.C.C. (2011). Data weighting in statistical fisheries stock assessment models. Can. J. Fish. Aquat. Sci. 68: 1124-1138.
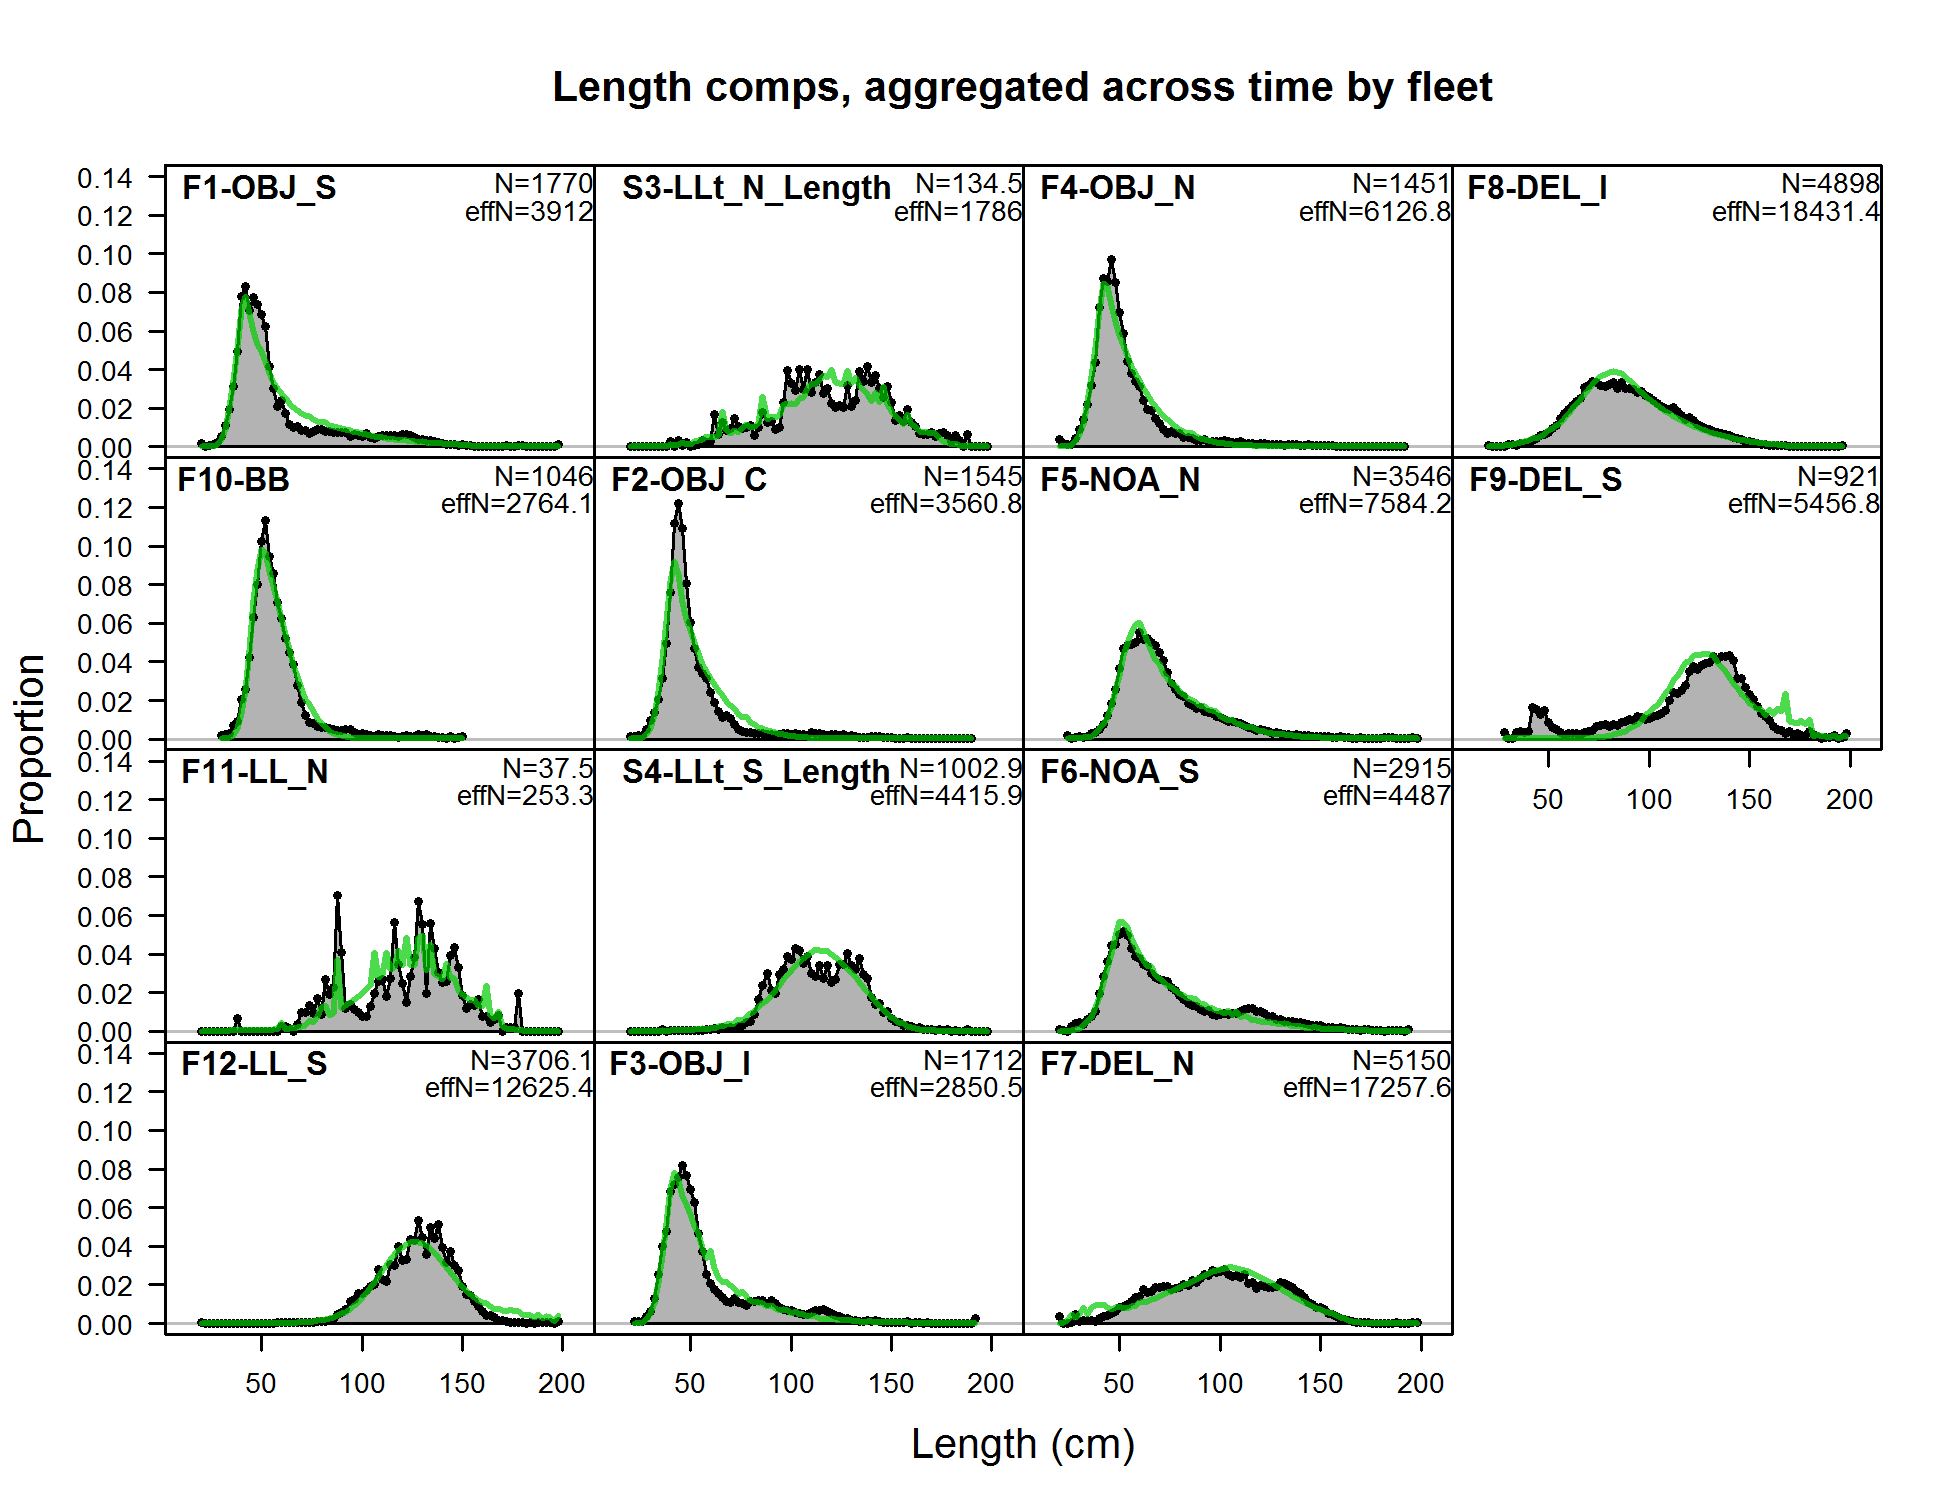
Length comps, aggregated across time by fleet.
Labels 'retained' and 'discard' indicate discarded or retained sampled for each fleet. Panels without this designation represent the whole catch.
file: comp_lenfit__aggregated_across_time.png
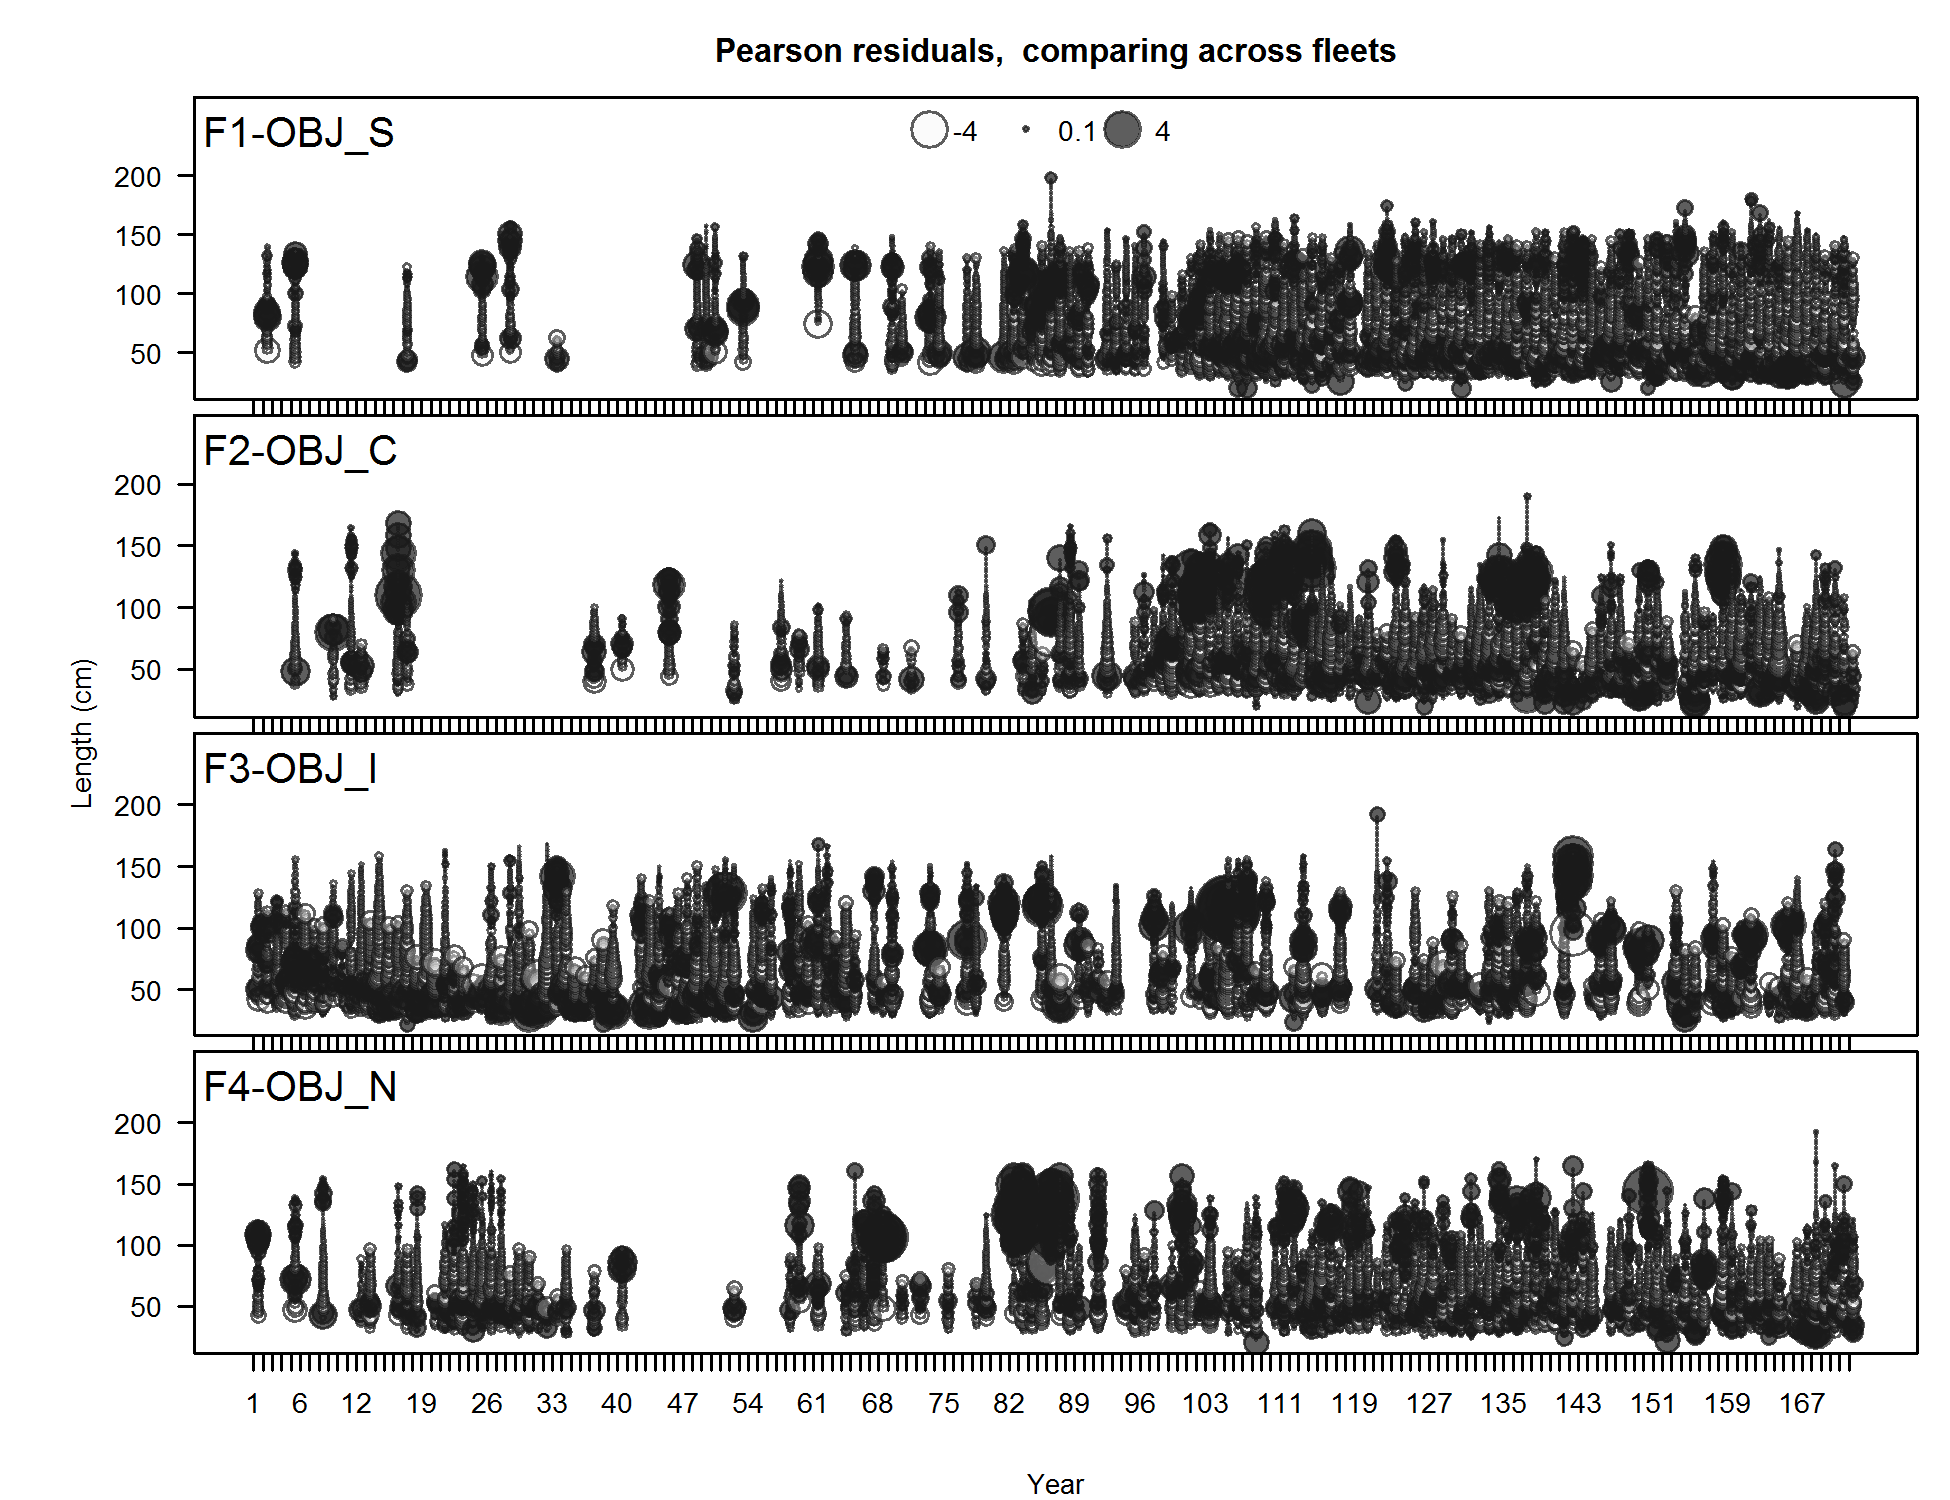
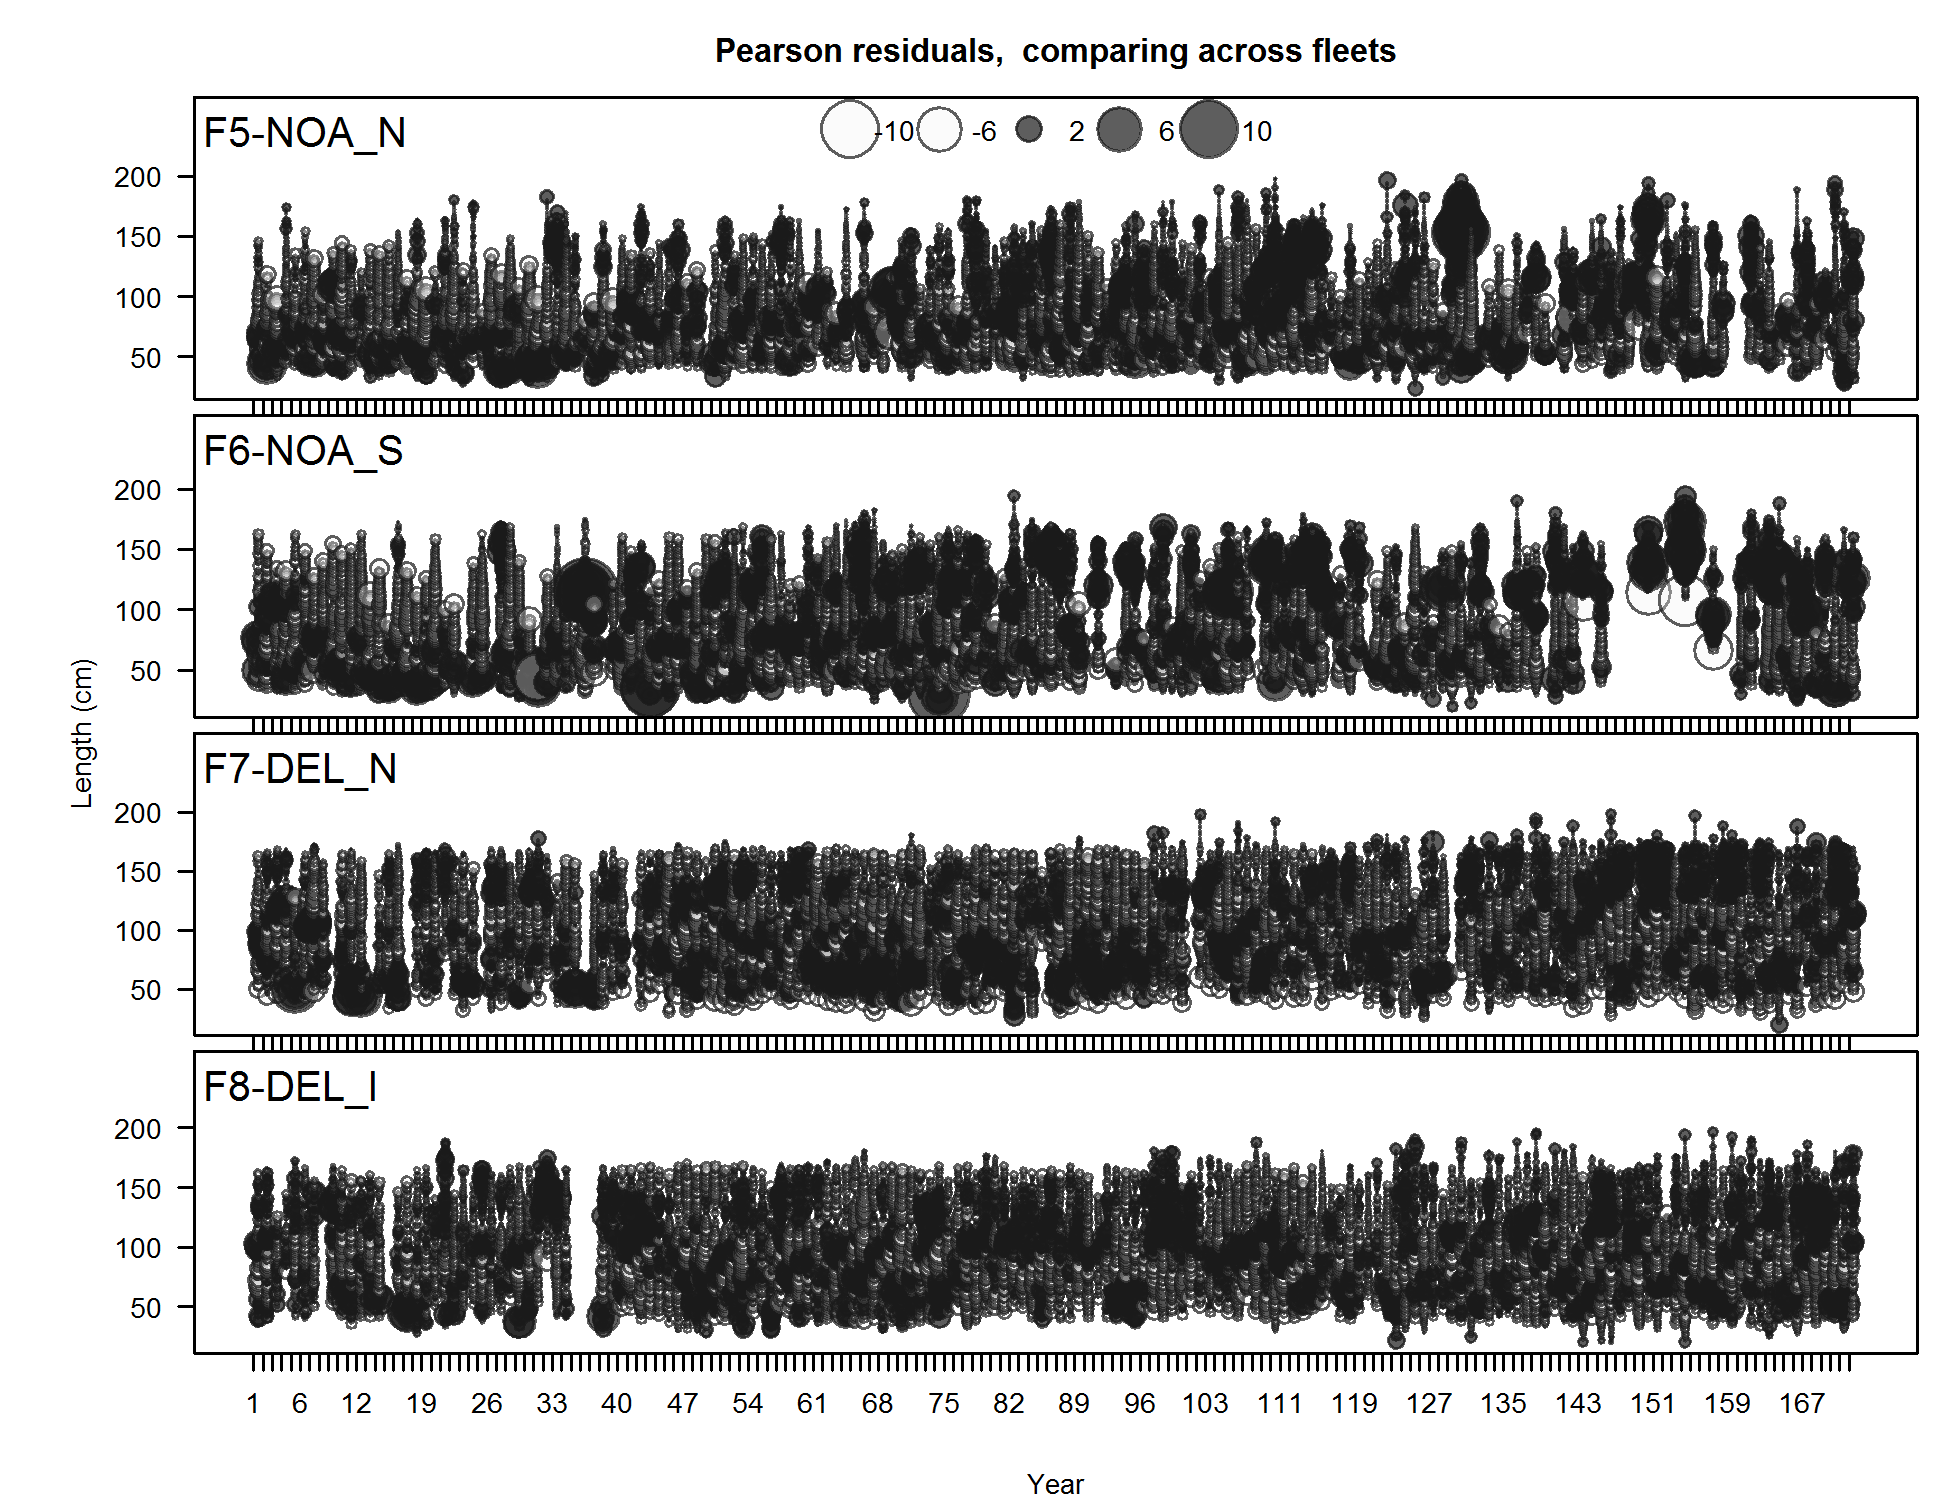
Pearson residuals, comparing across fleets (plot 1 of 4)
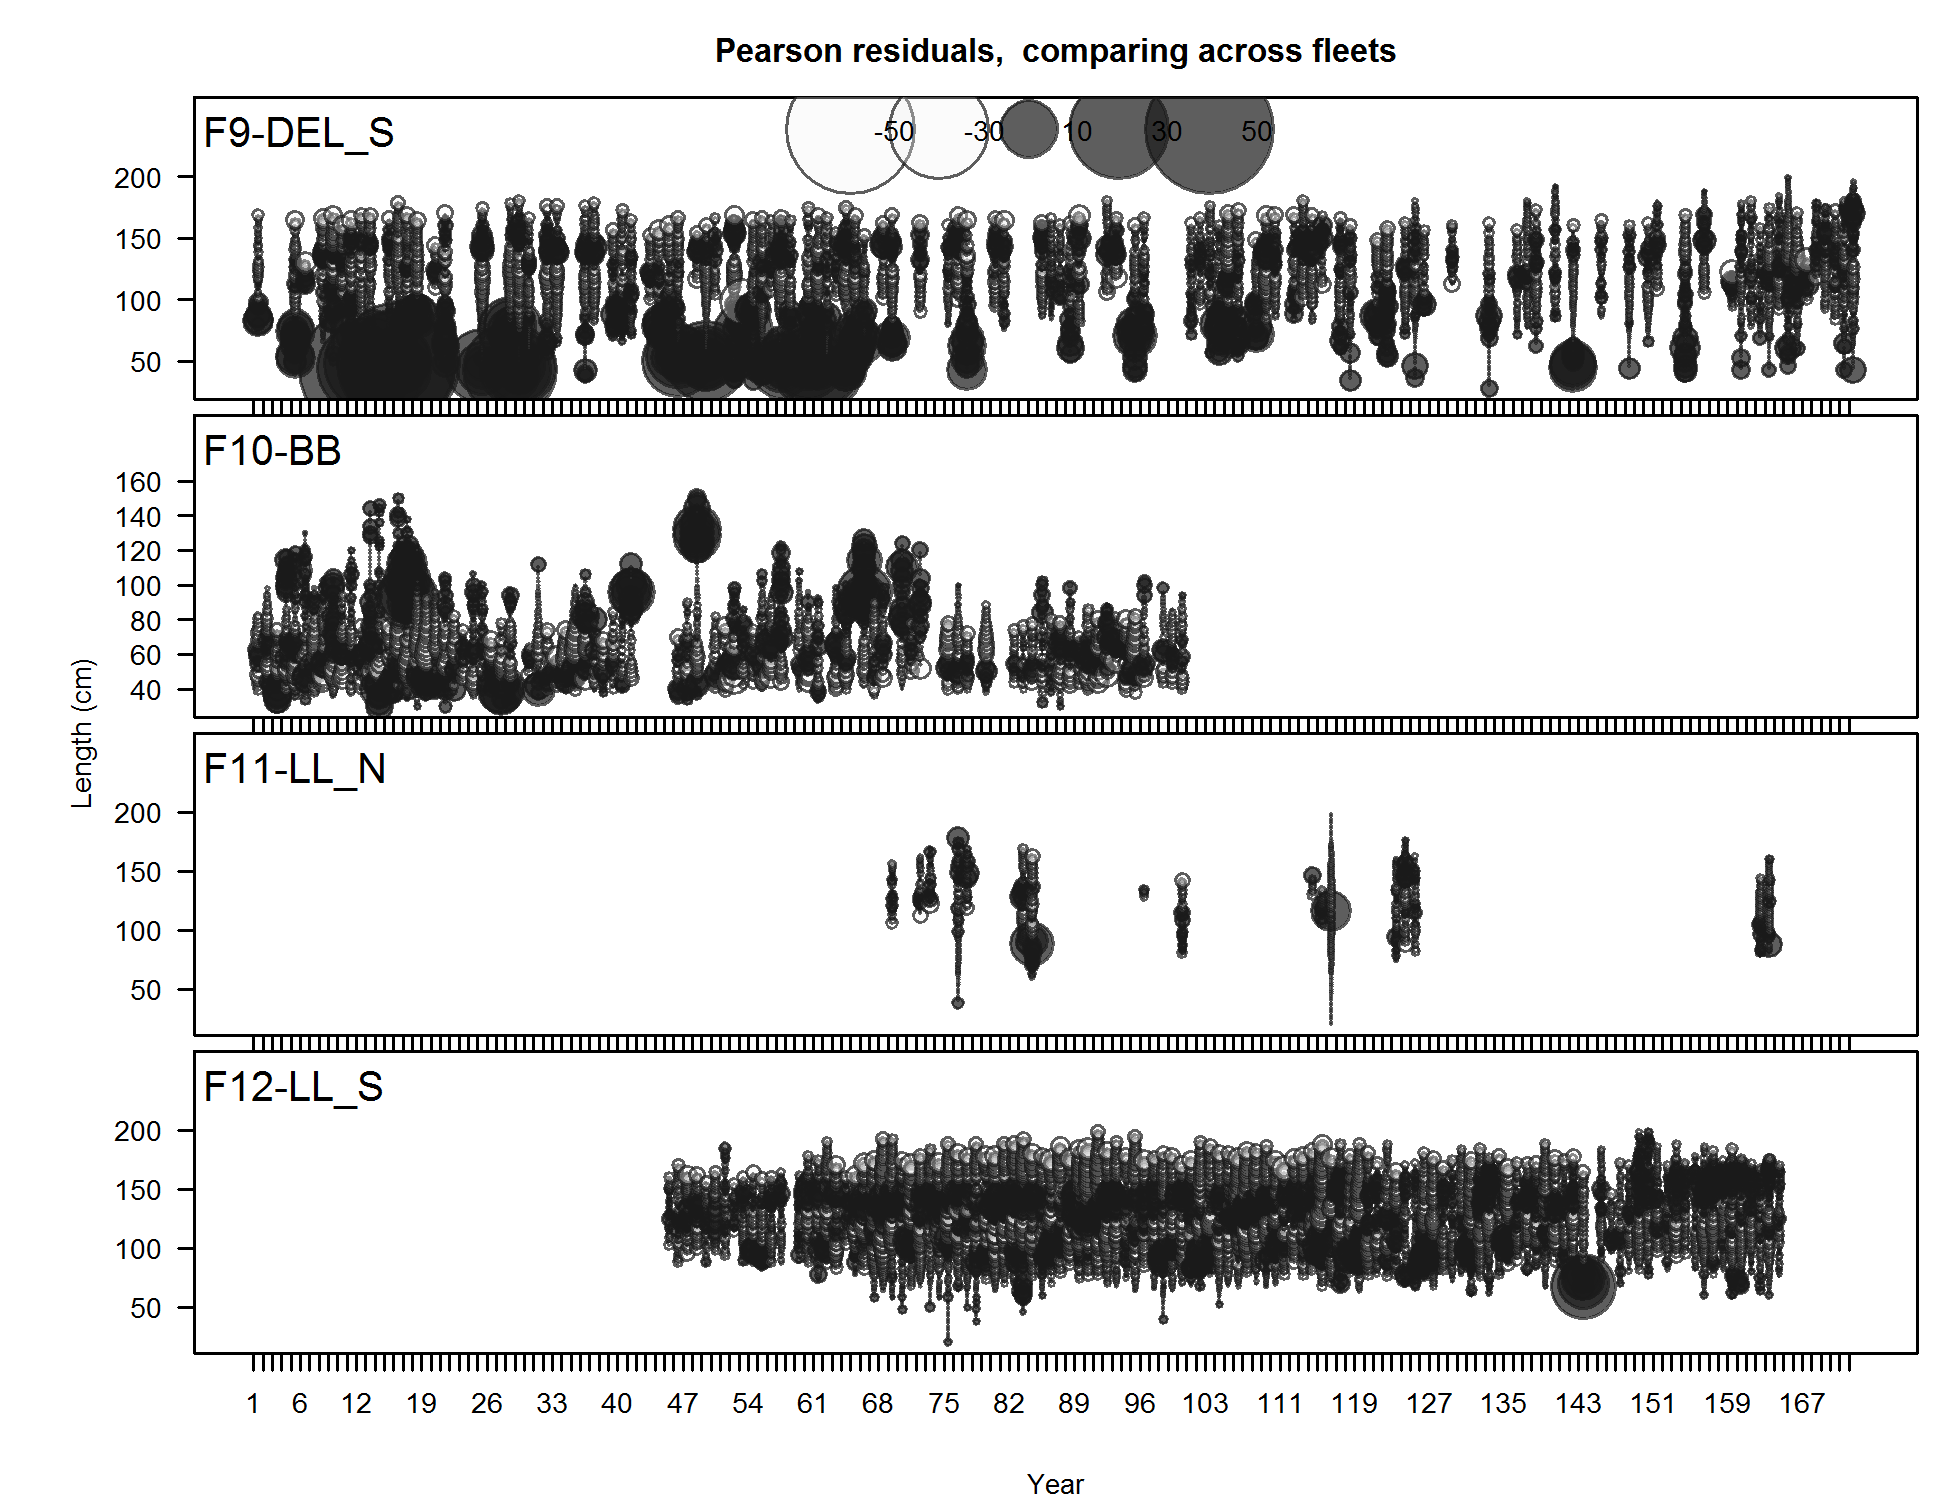
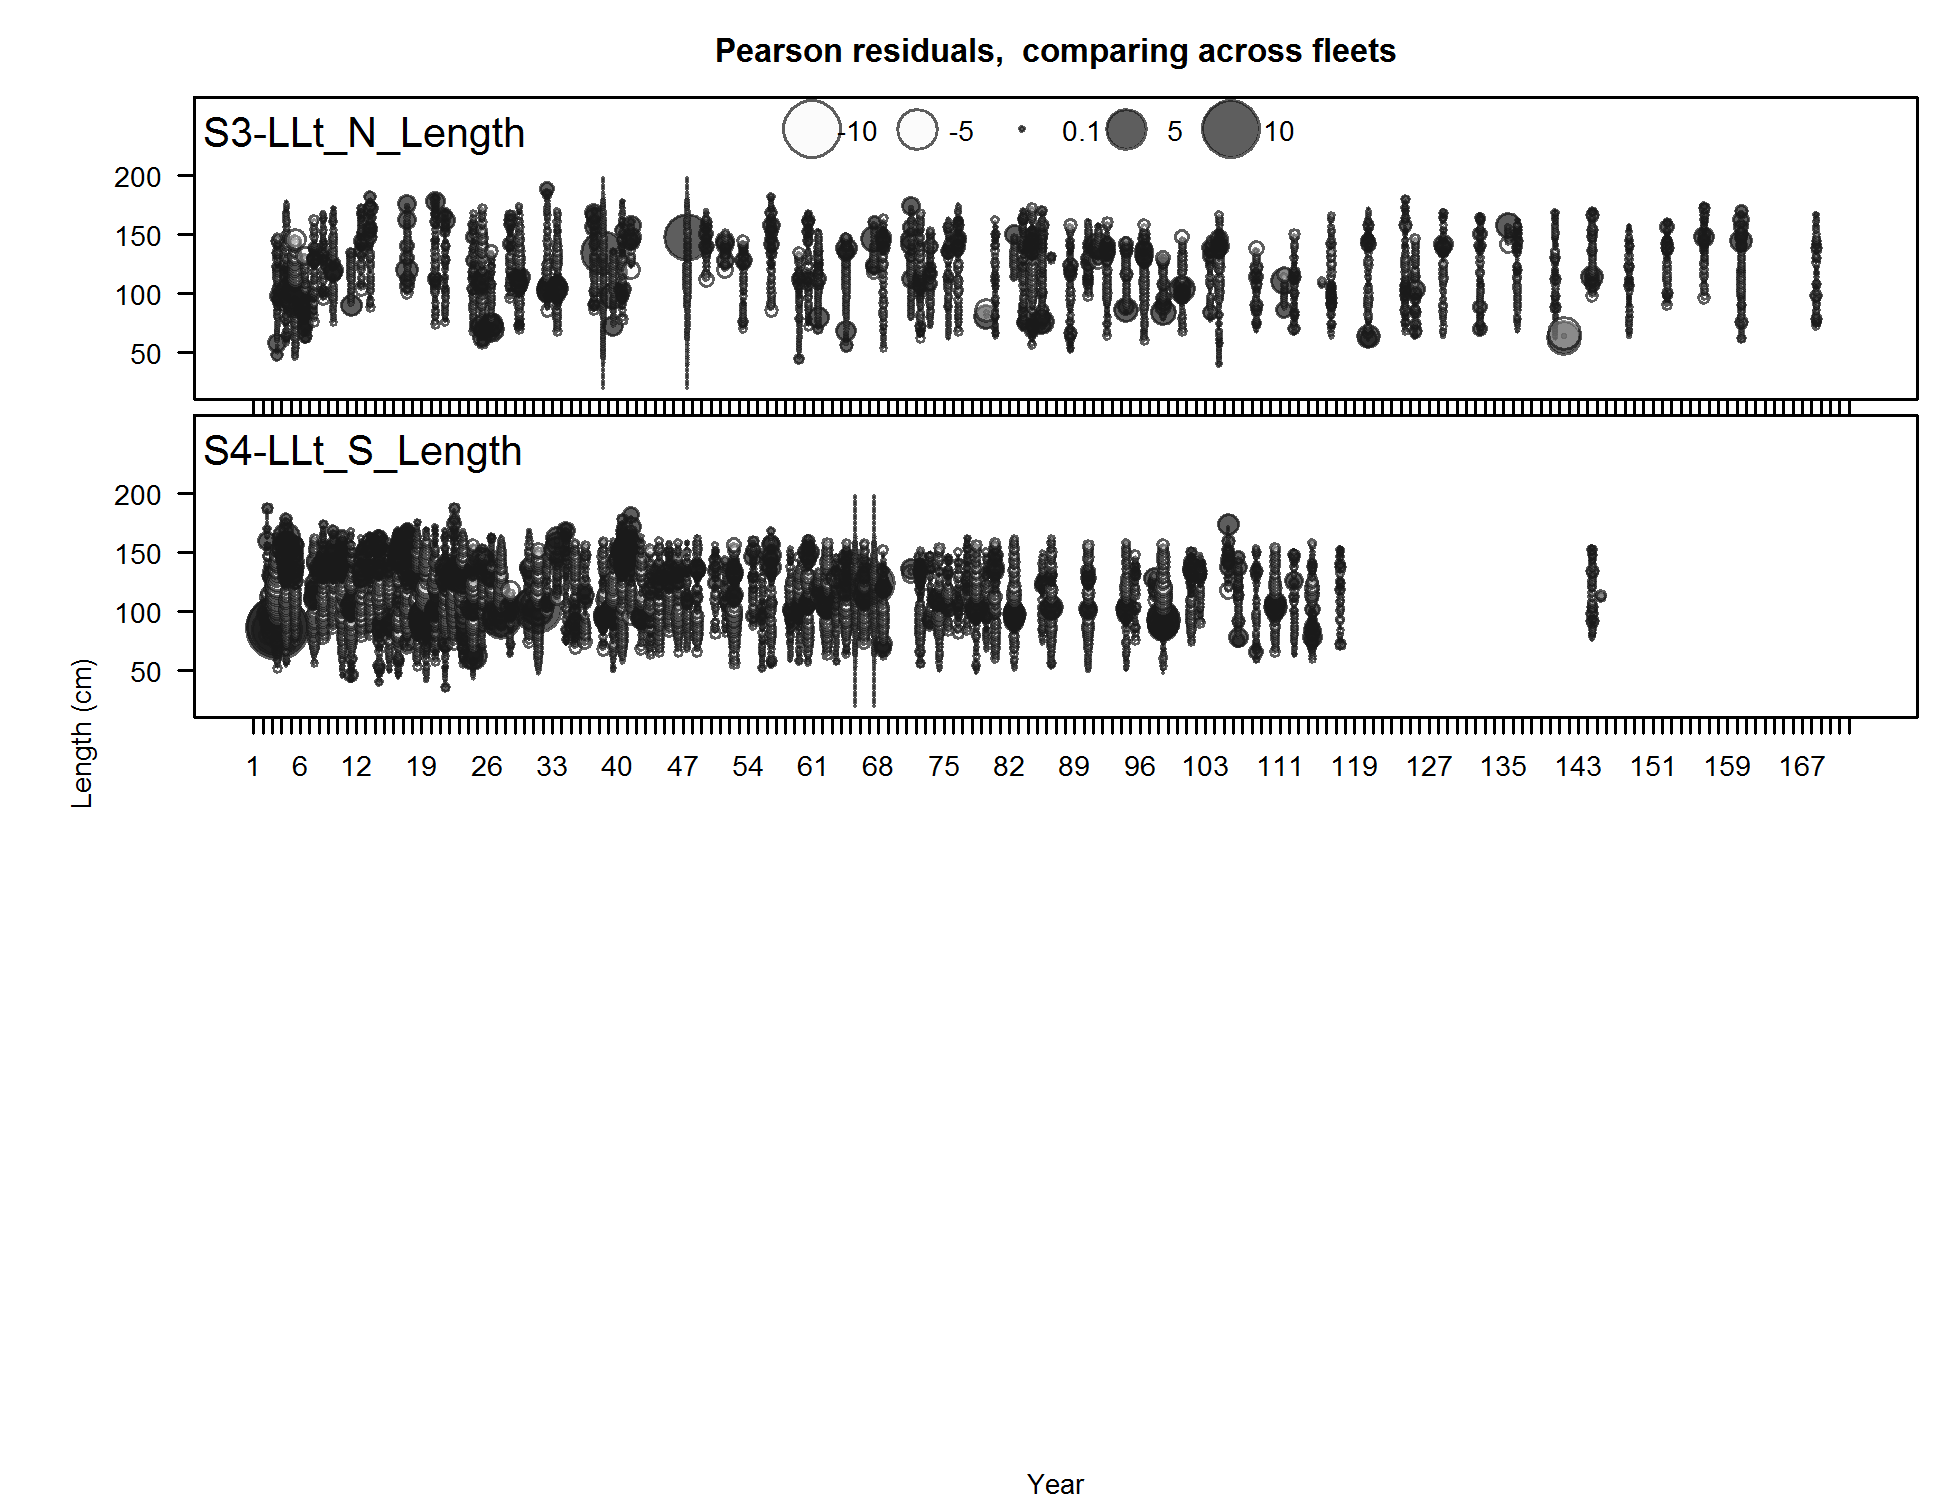
Closed bubbles are positive residuals (observed > expected) and open bubbles are negative residuals (observed < expected).
file: comp_lenfit__page1_multi-fleet_comparison.png
Pearson residuals, comparing across fleets (plot 2 of 4)
file: comp_lenfit__page2_multi-fleet_comparison.png
Pearson residuals, comparing across fleets (plot 3 of 4)
file: comp_lenfit__page3_multi-fleet_comparison.png
Pearson residuals, comparing across fleets (plot 4 of 4)
file: comp_lenfit__page4_multi-fleet_comparison.png
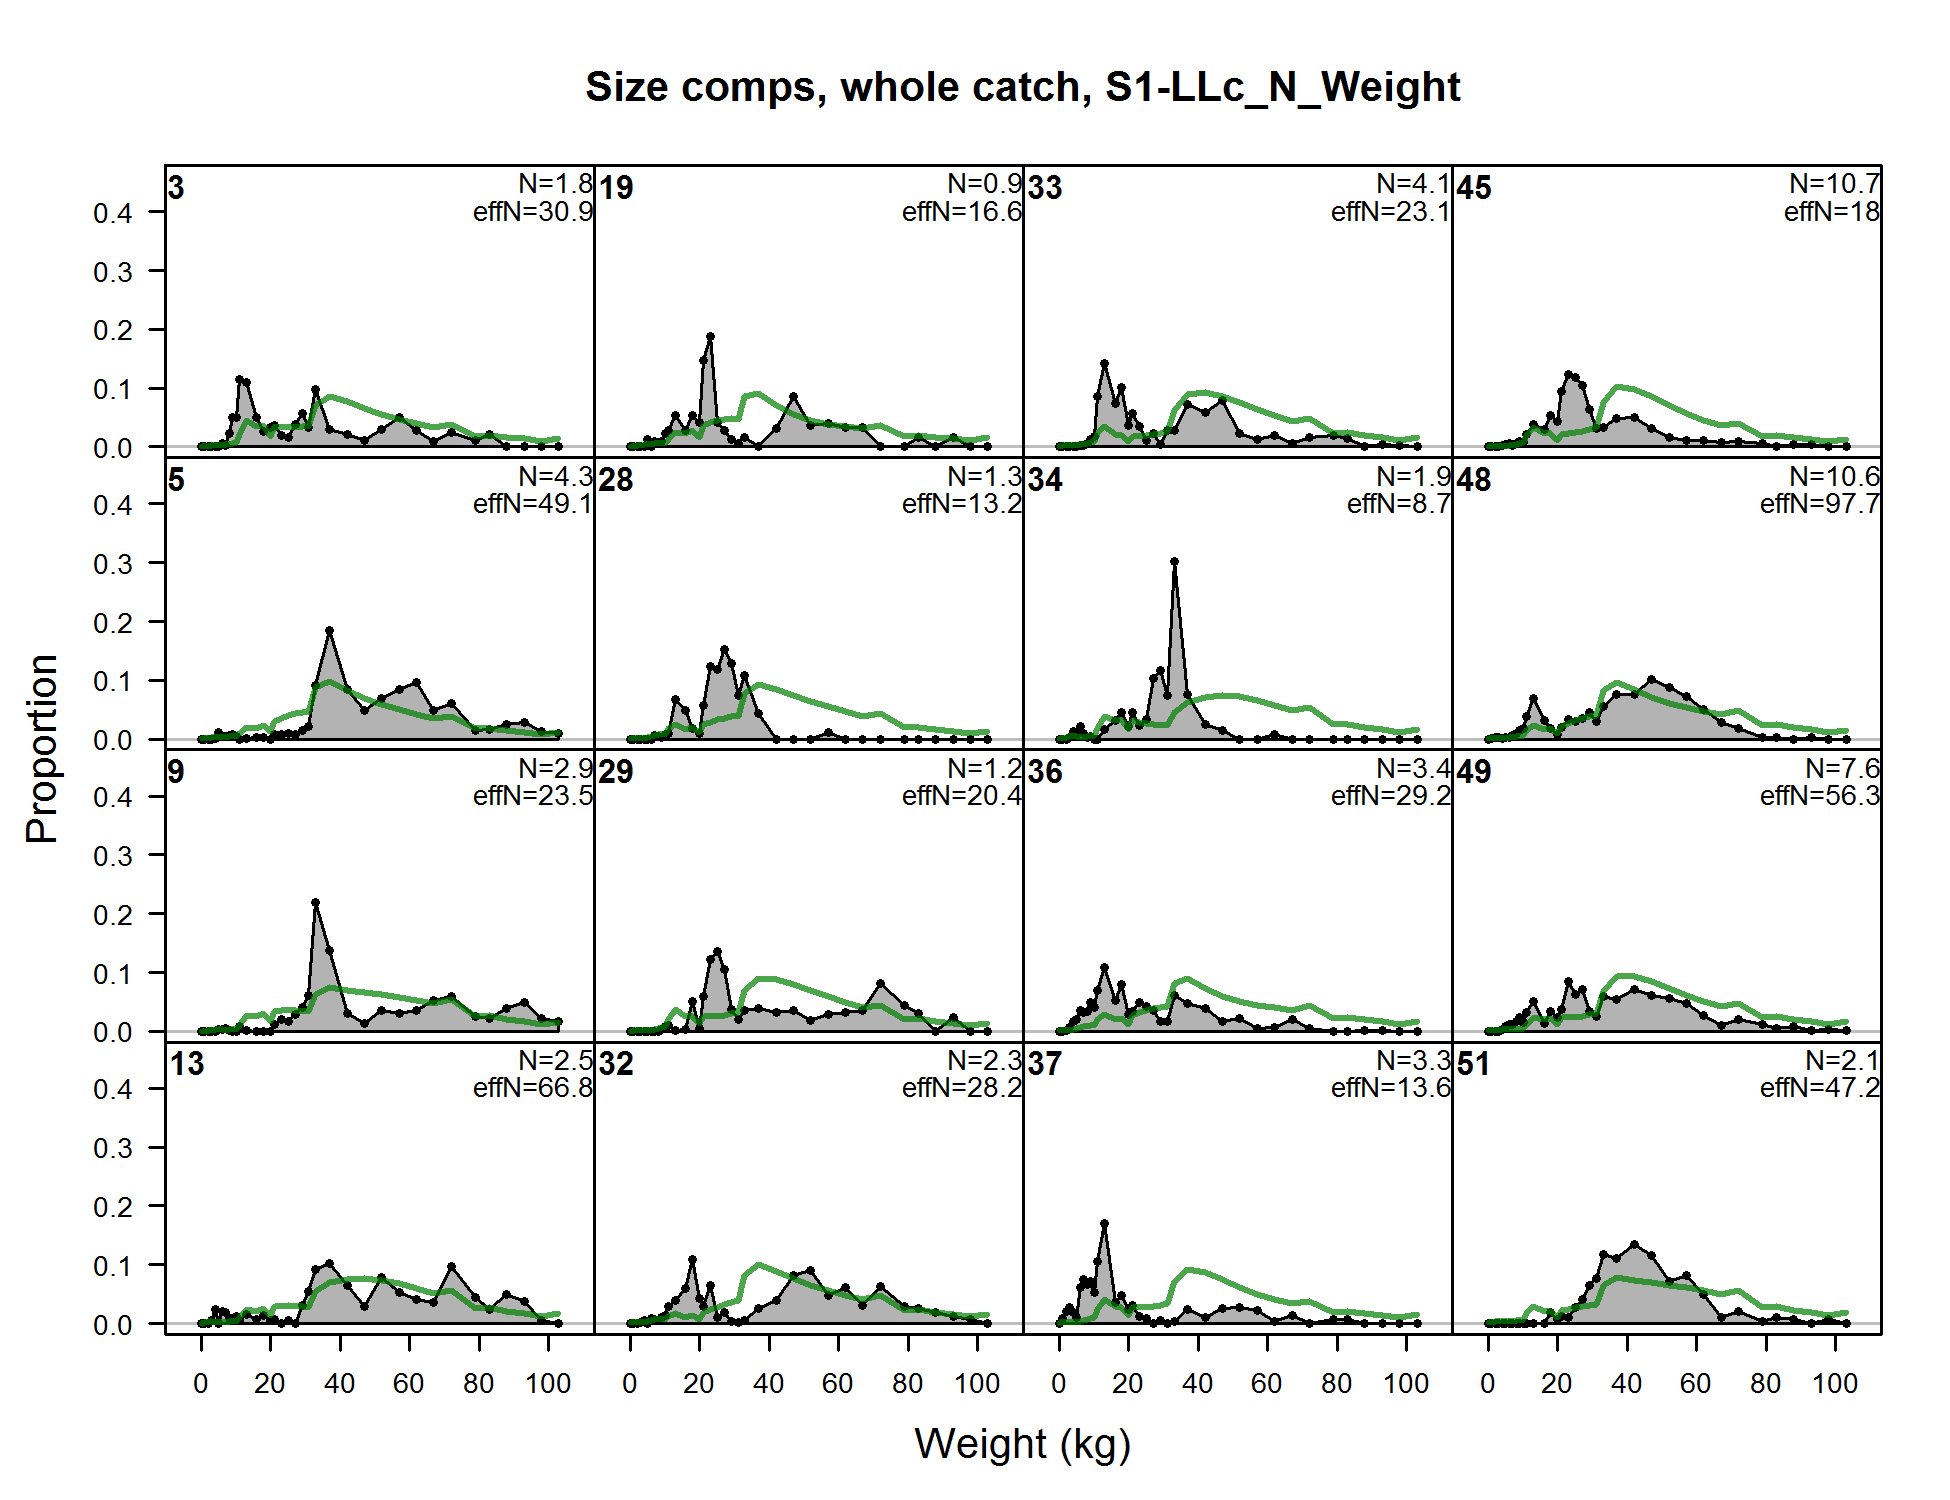
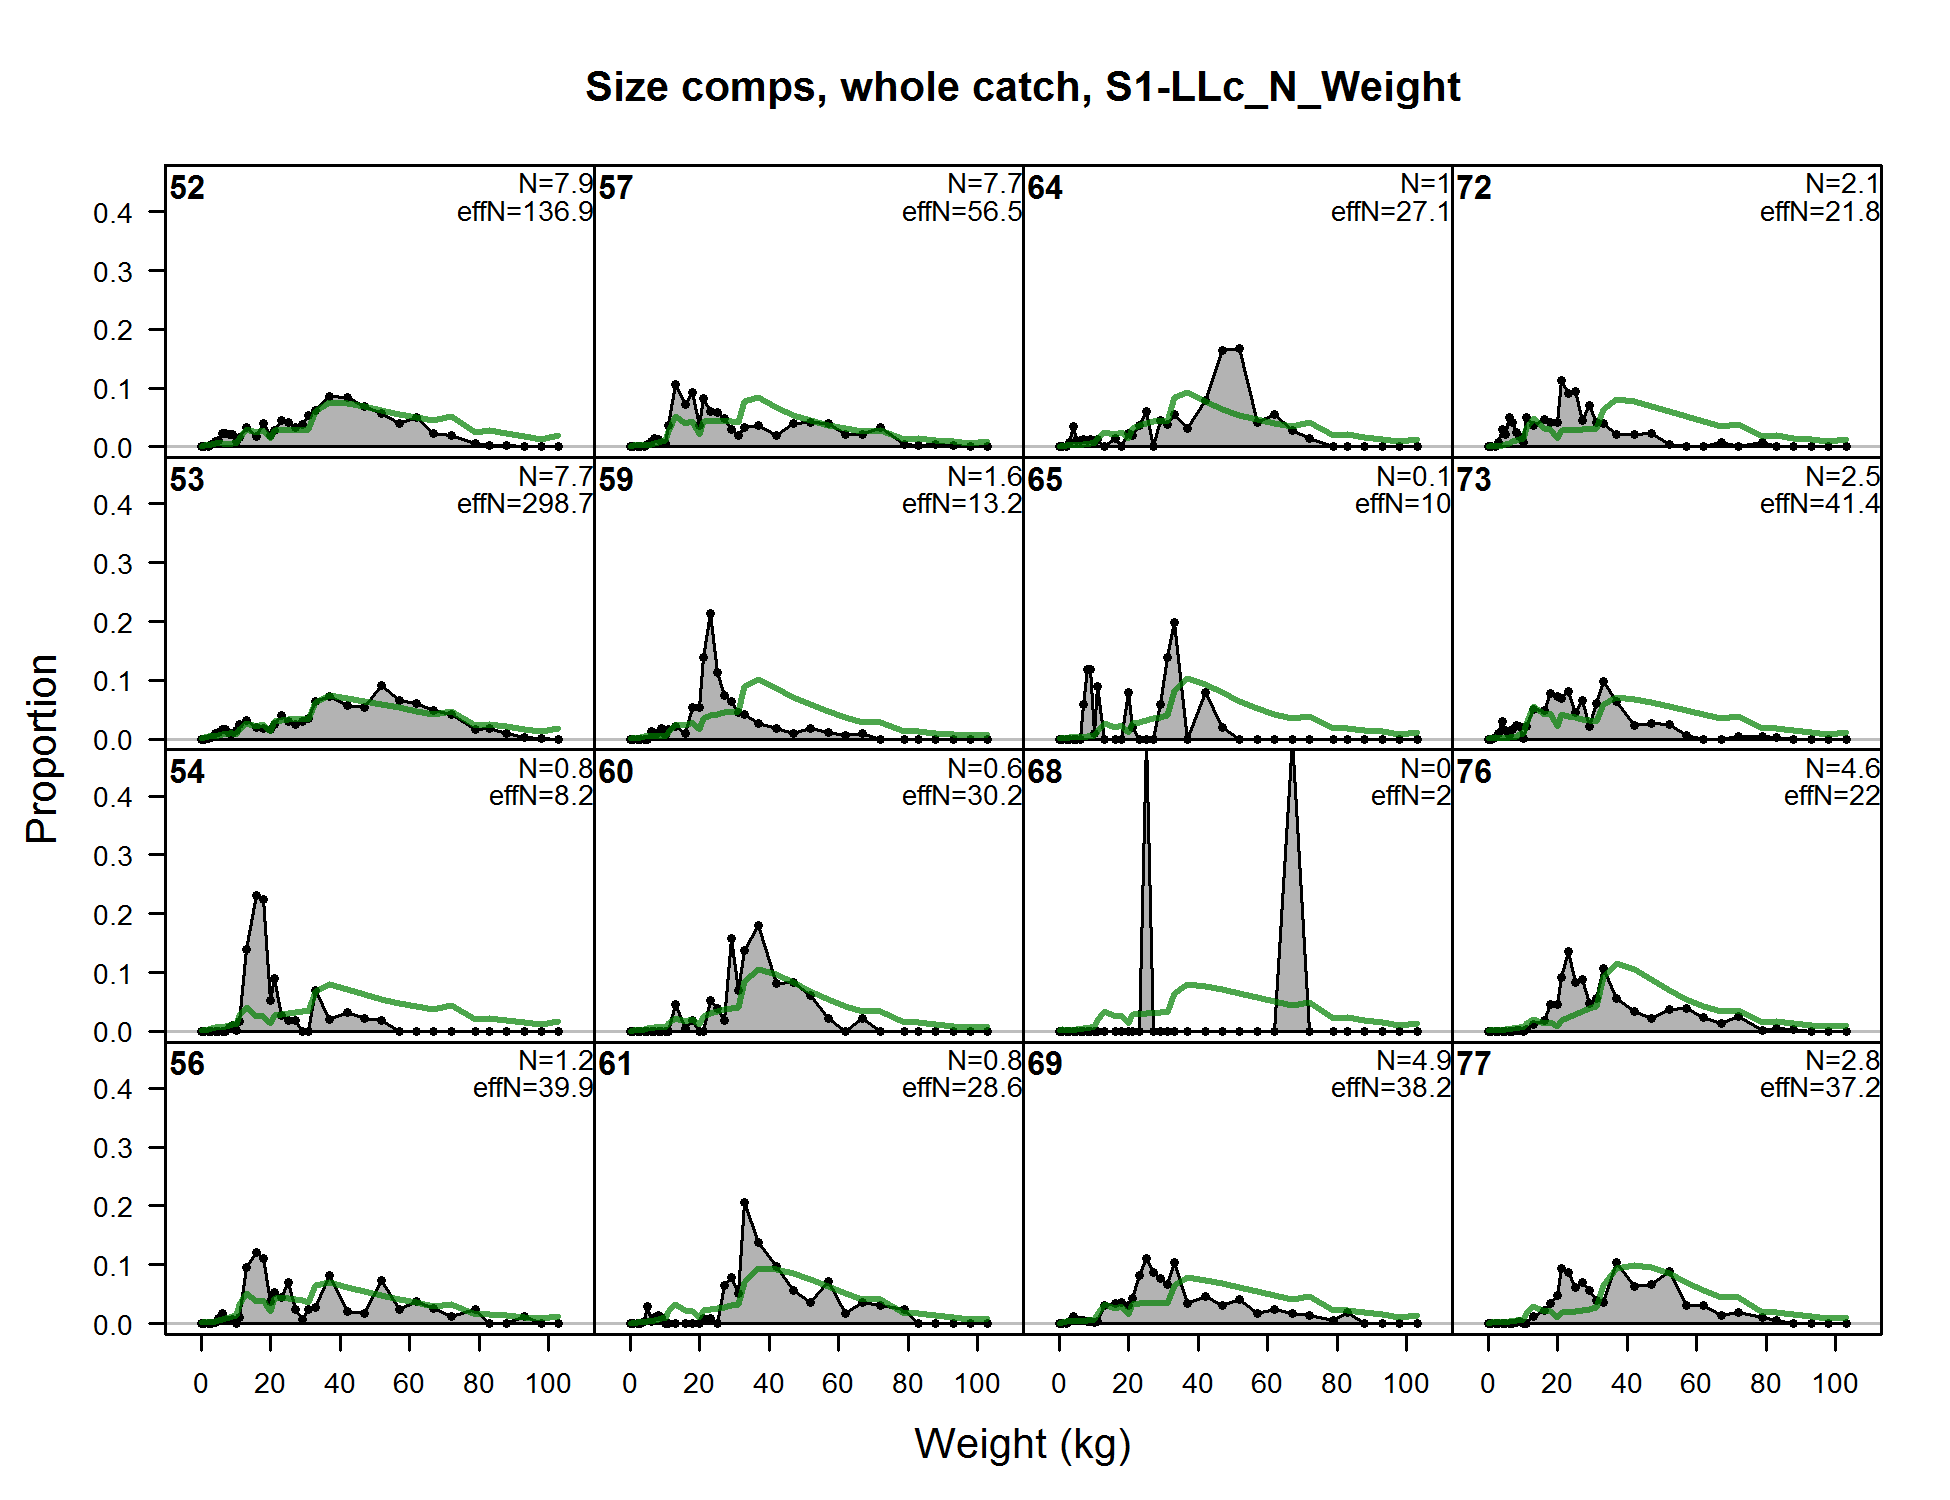
Size comps, whole catch, S1-LLc_N_Weight (plot 1 of 3)
file: comp_sizefit_flt17mkt0_page1.png
Size comps, whole catch, S1-LLc_N_Weight (plot 1 of 3) (plot 2 of 3)
file: comp_sizefit_flt17mkt0_page2.png
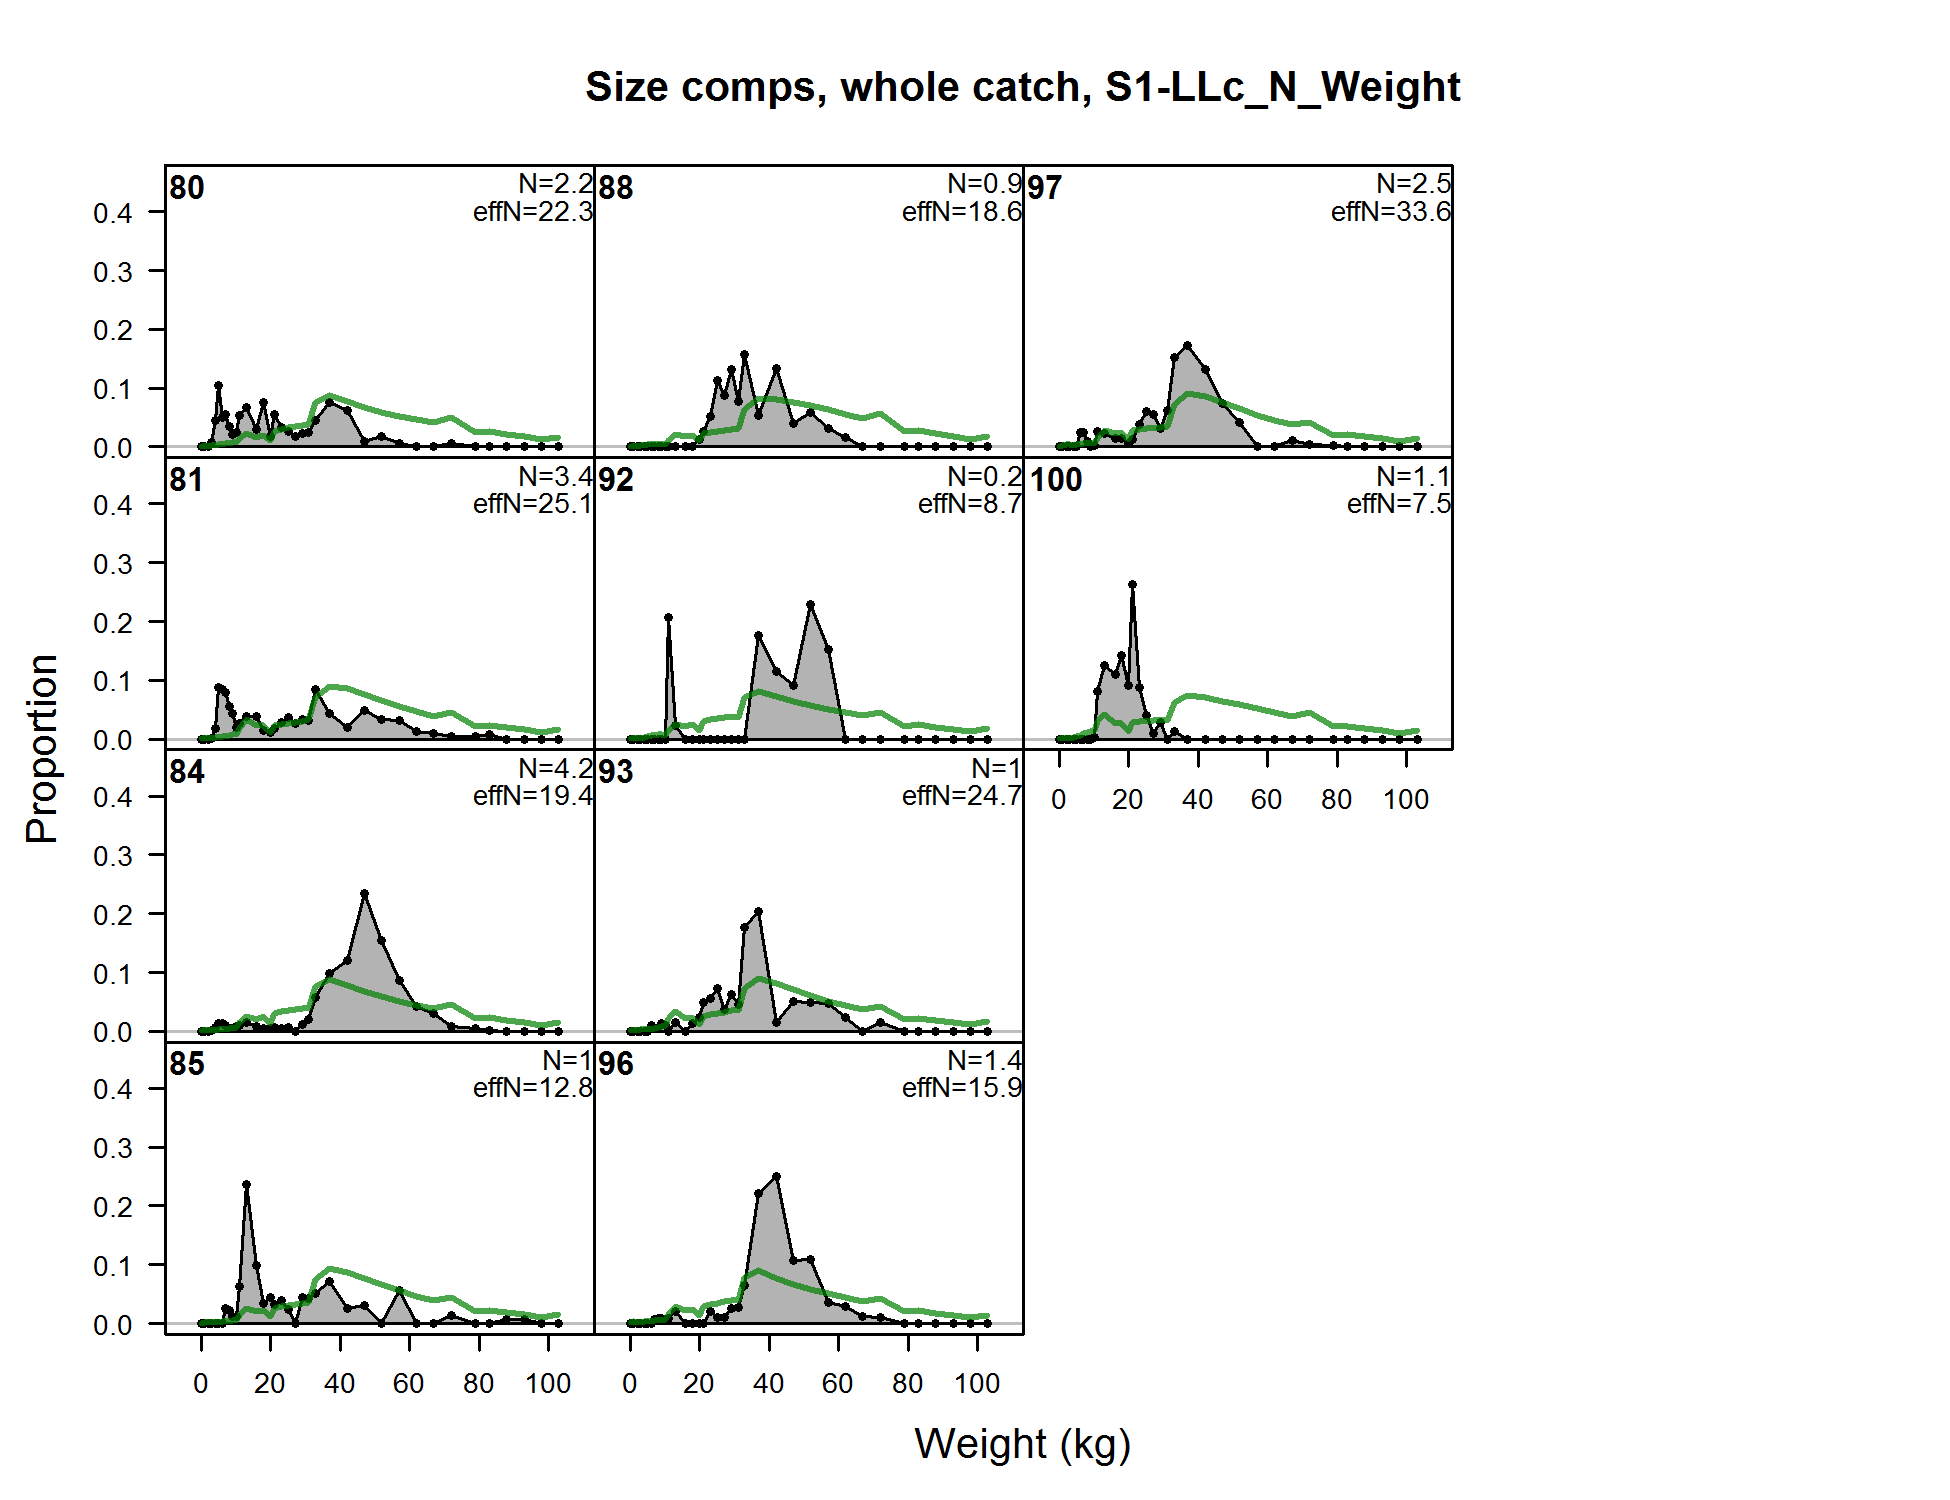
Size comps, whole catch, S1-LLc_N_Weight (plot 1 of 3) (plot 2 of 3) (plot 3 of 3)
file: comp_sizefit_flt17mkt0_page3.png
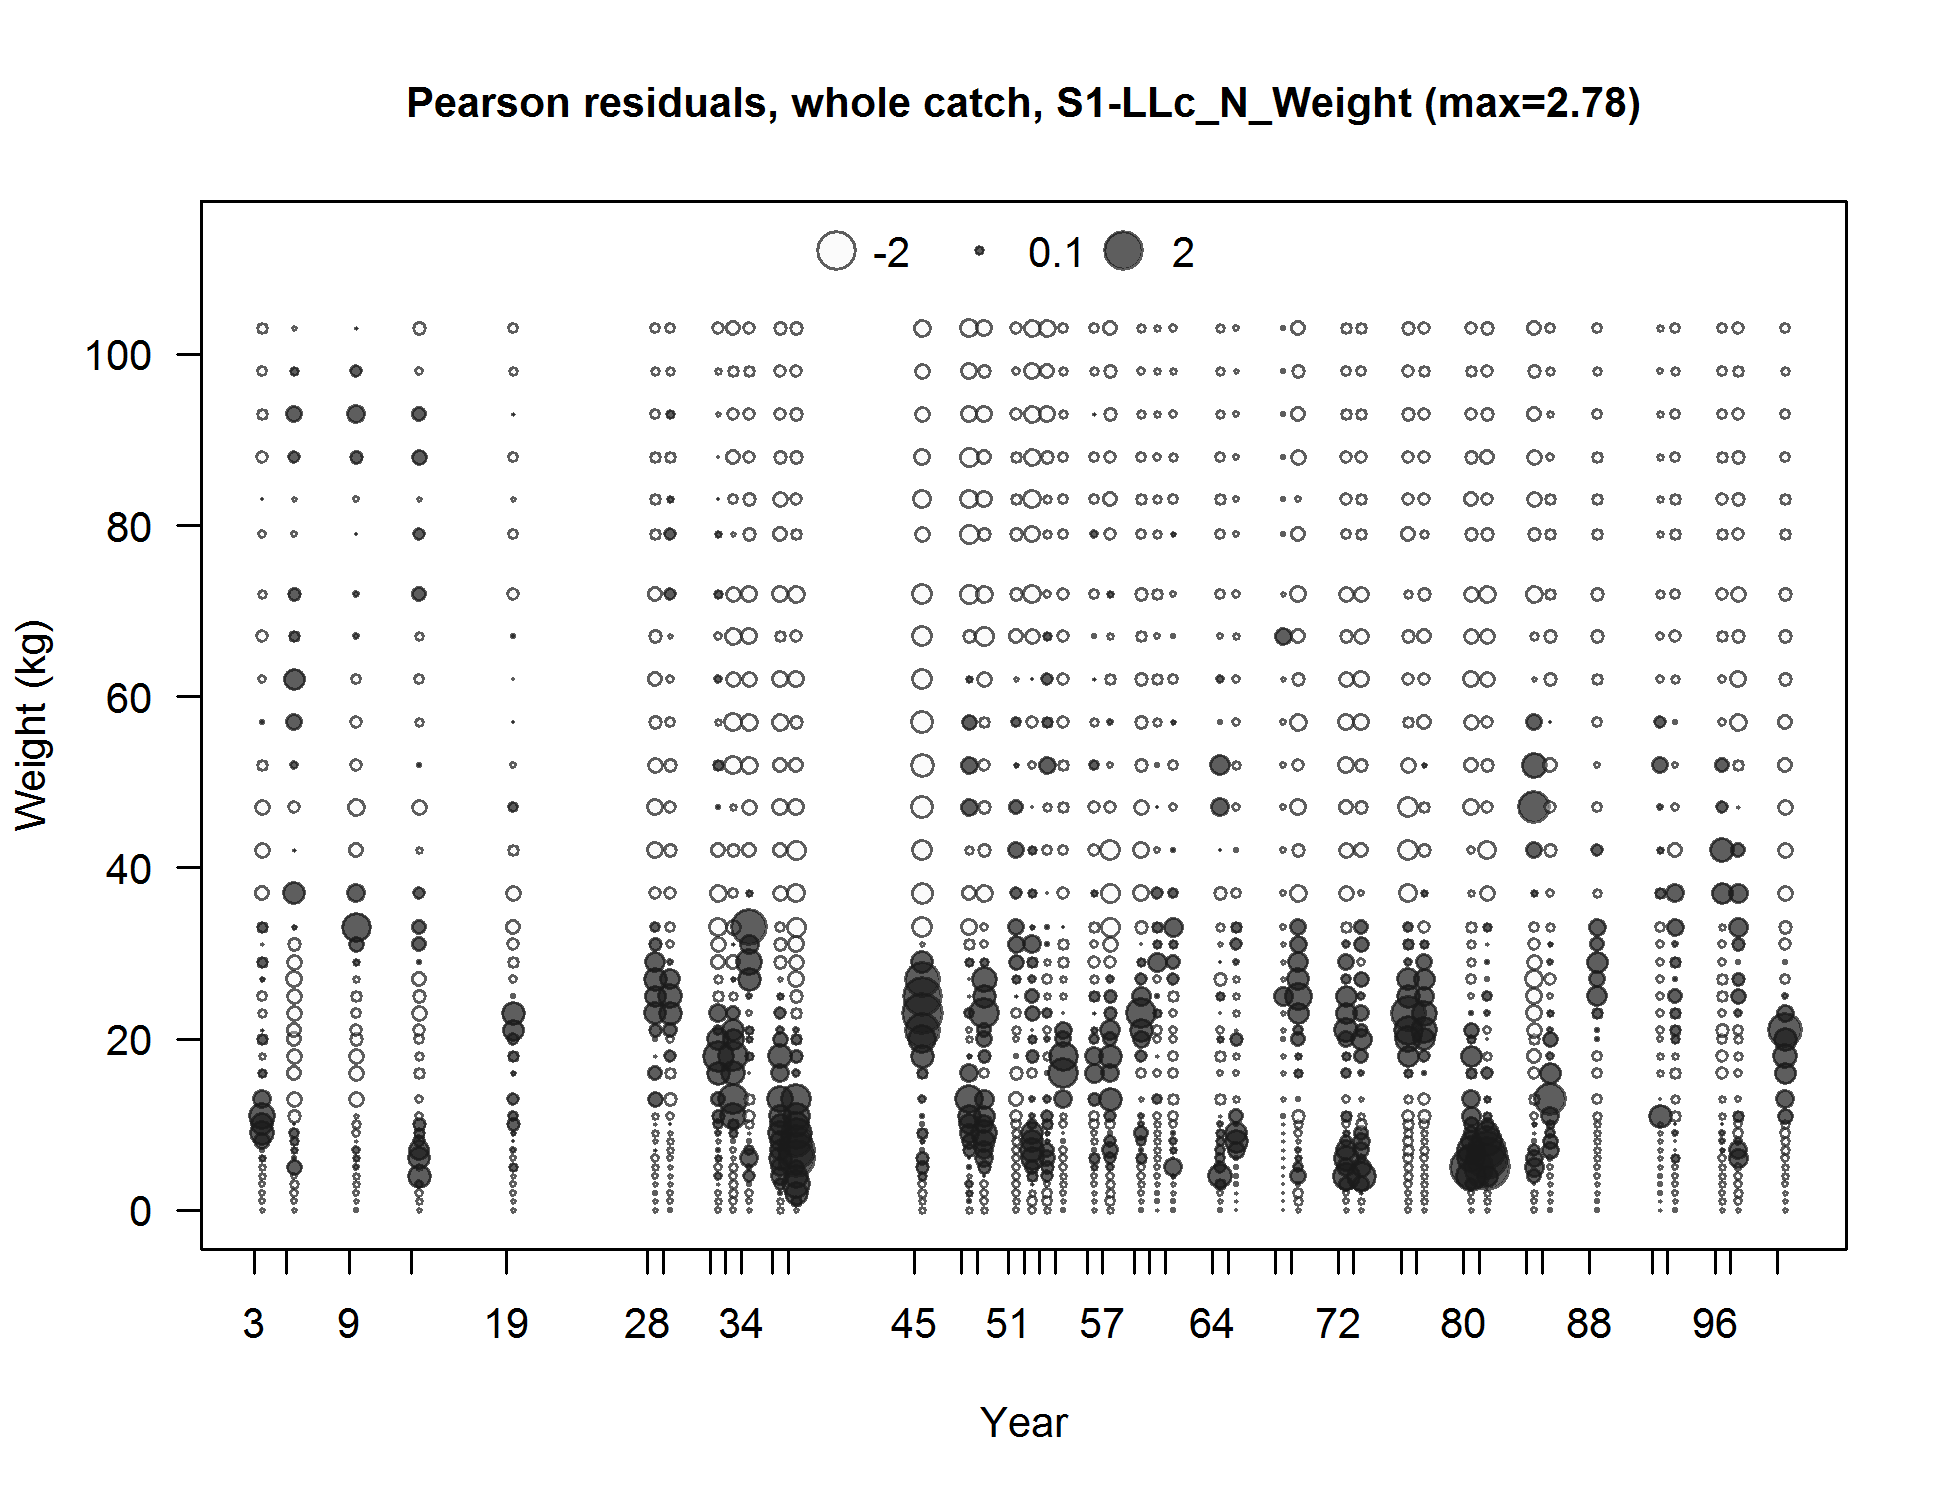
Pearson residuals, whole catch, S1-LLc_N_Weight (max=2.78) (plot 3 of 3)
Closed bubbles are positive residuals (observed > expected) and open bubbles are negative residuals (observed < expected).
file: comp_sizefit_residsflt17mkt0_page3.png
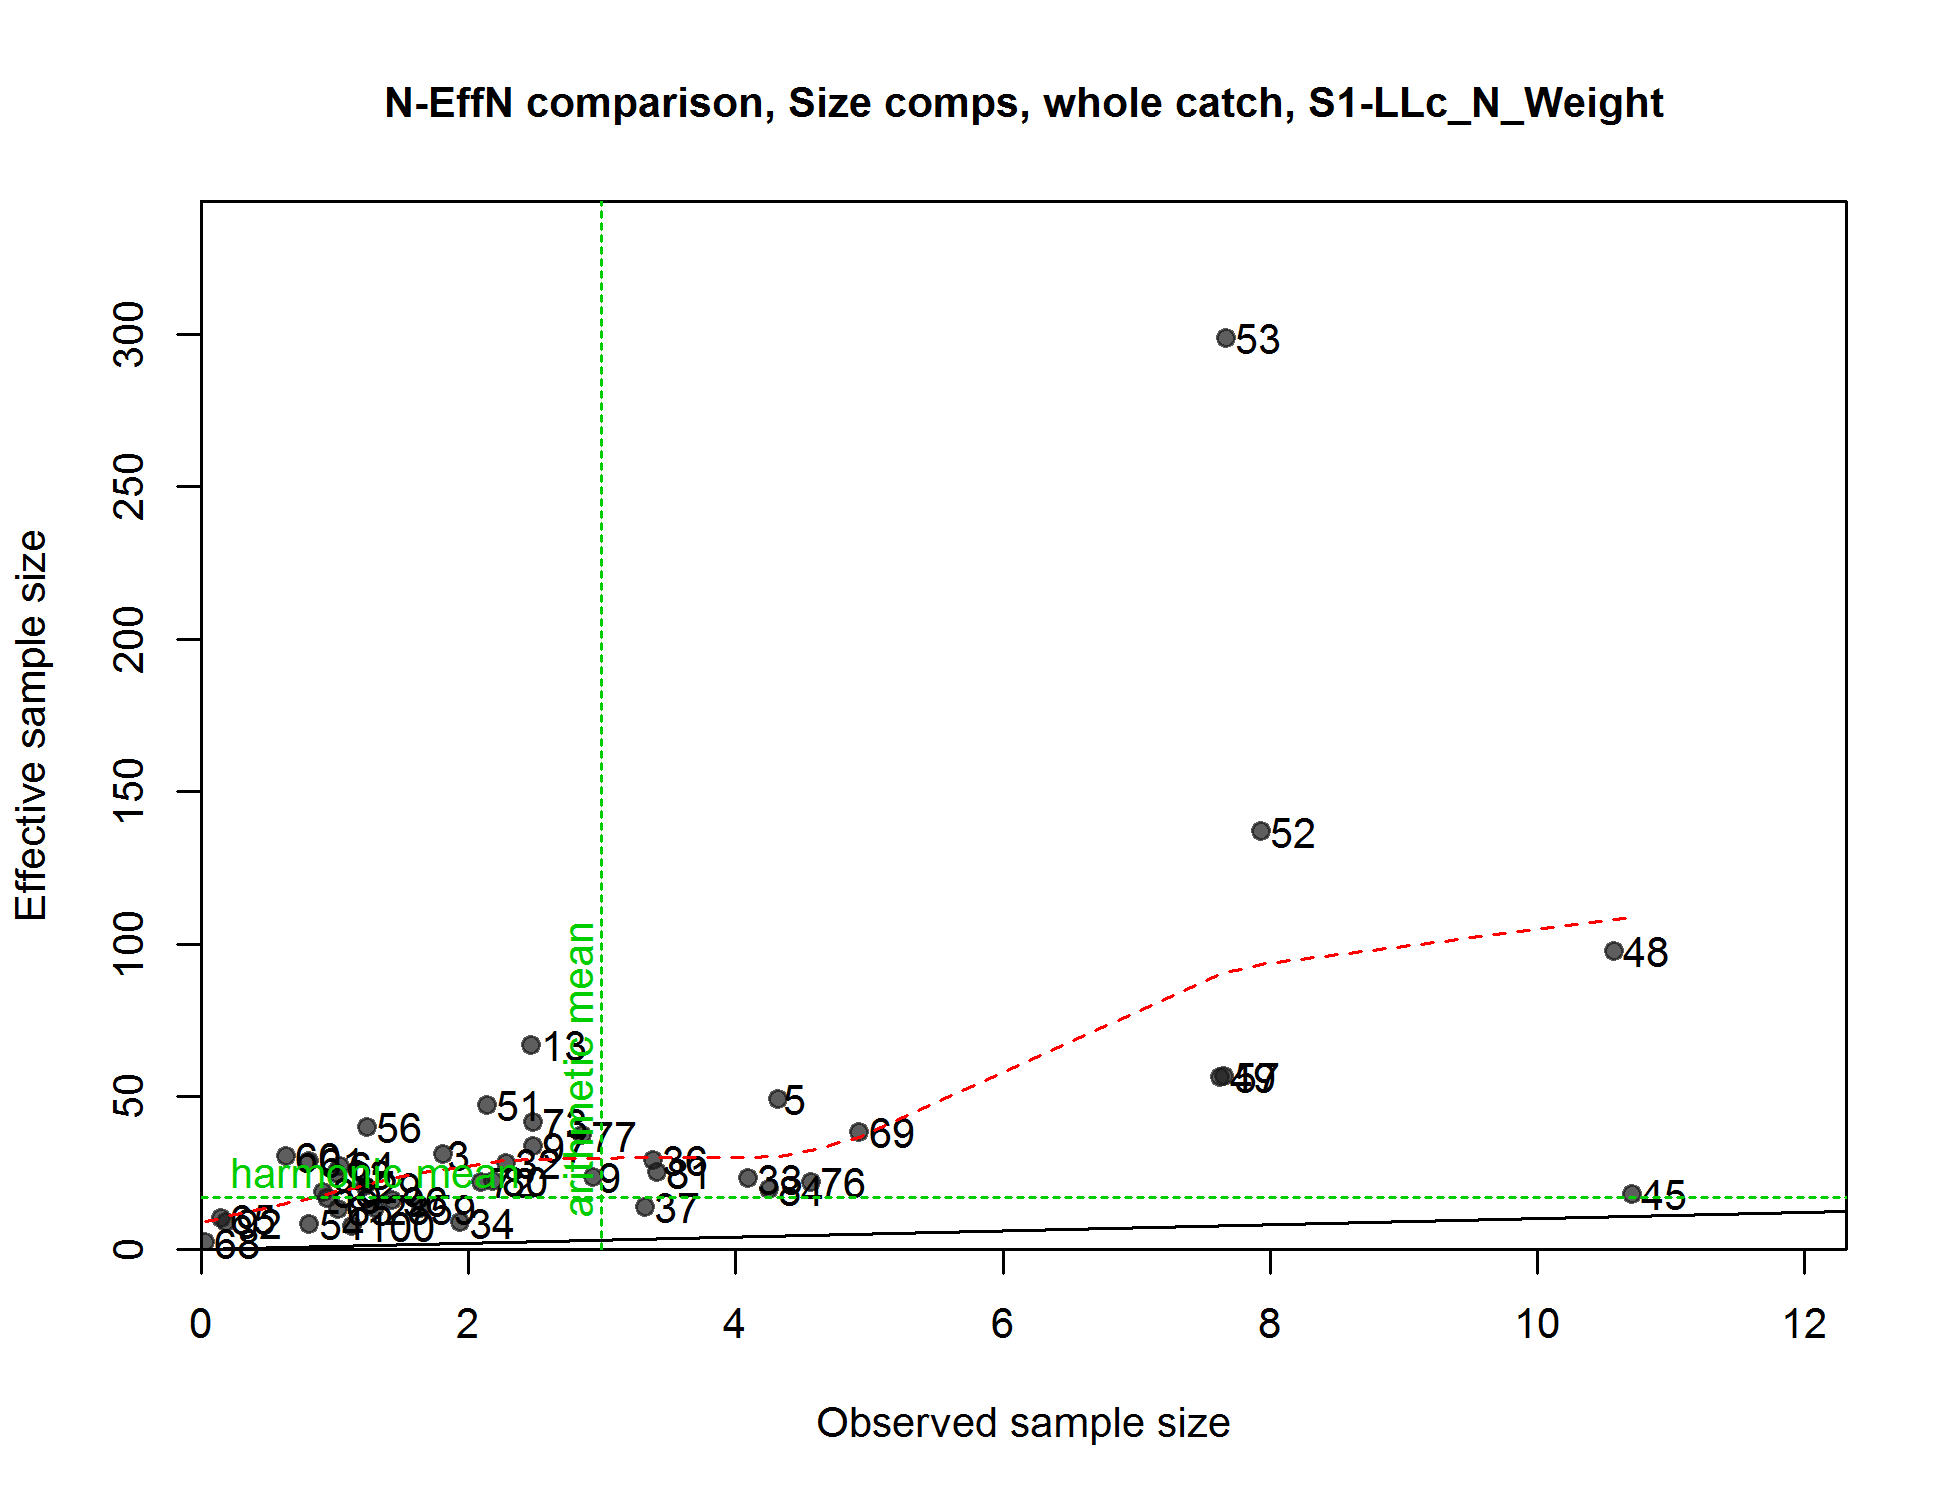
N-EffN comparison, Size comps, whole catch, S1-LLc_N_Weight
file: comp_sizefit_sampsize_flt17mkt0.png
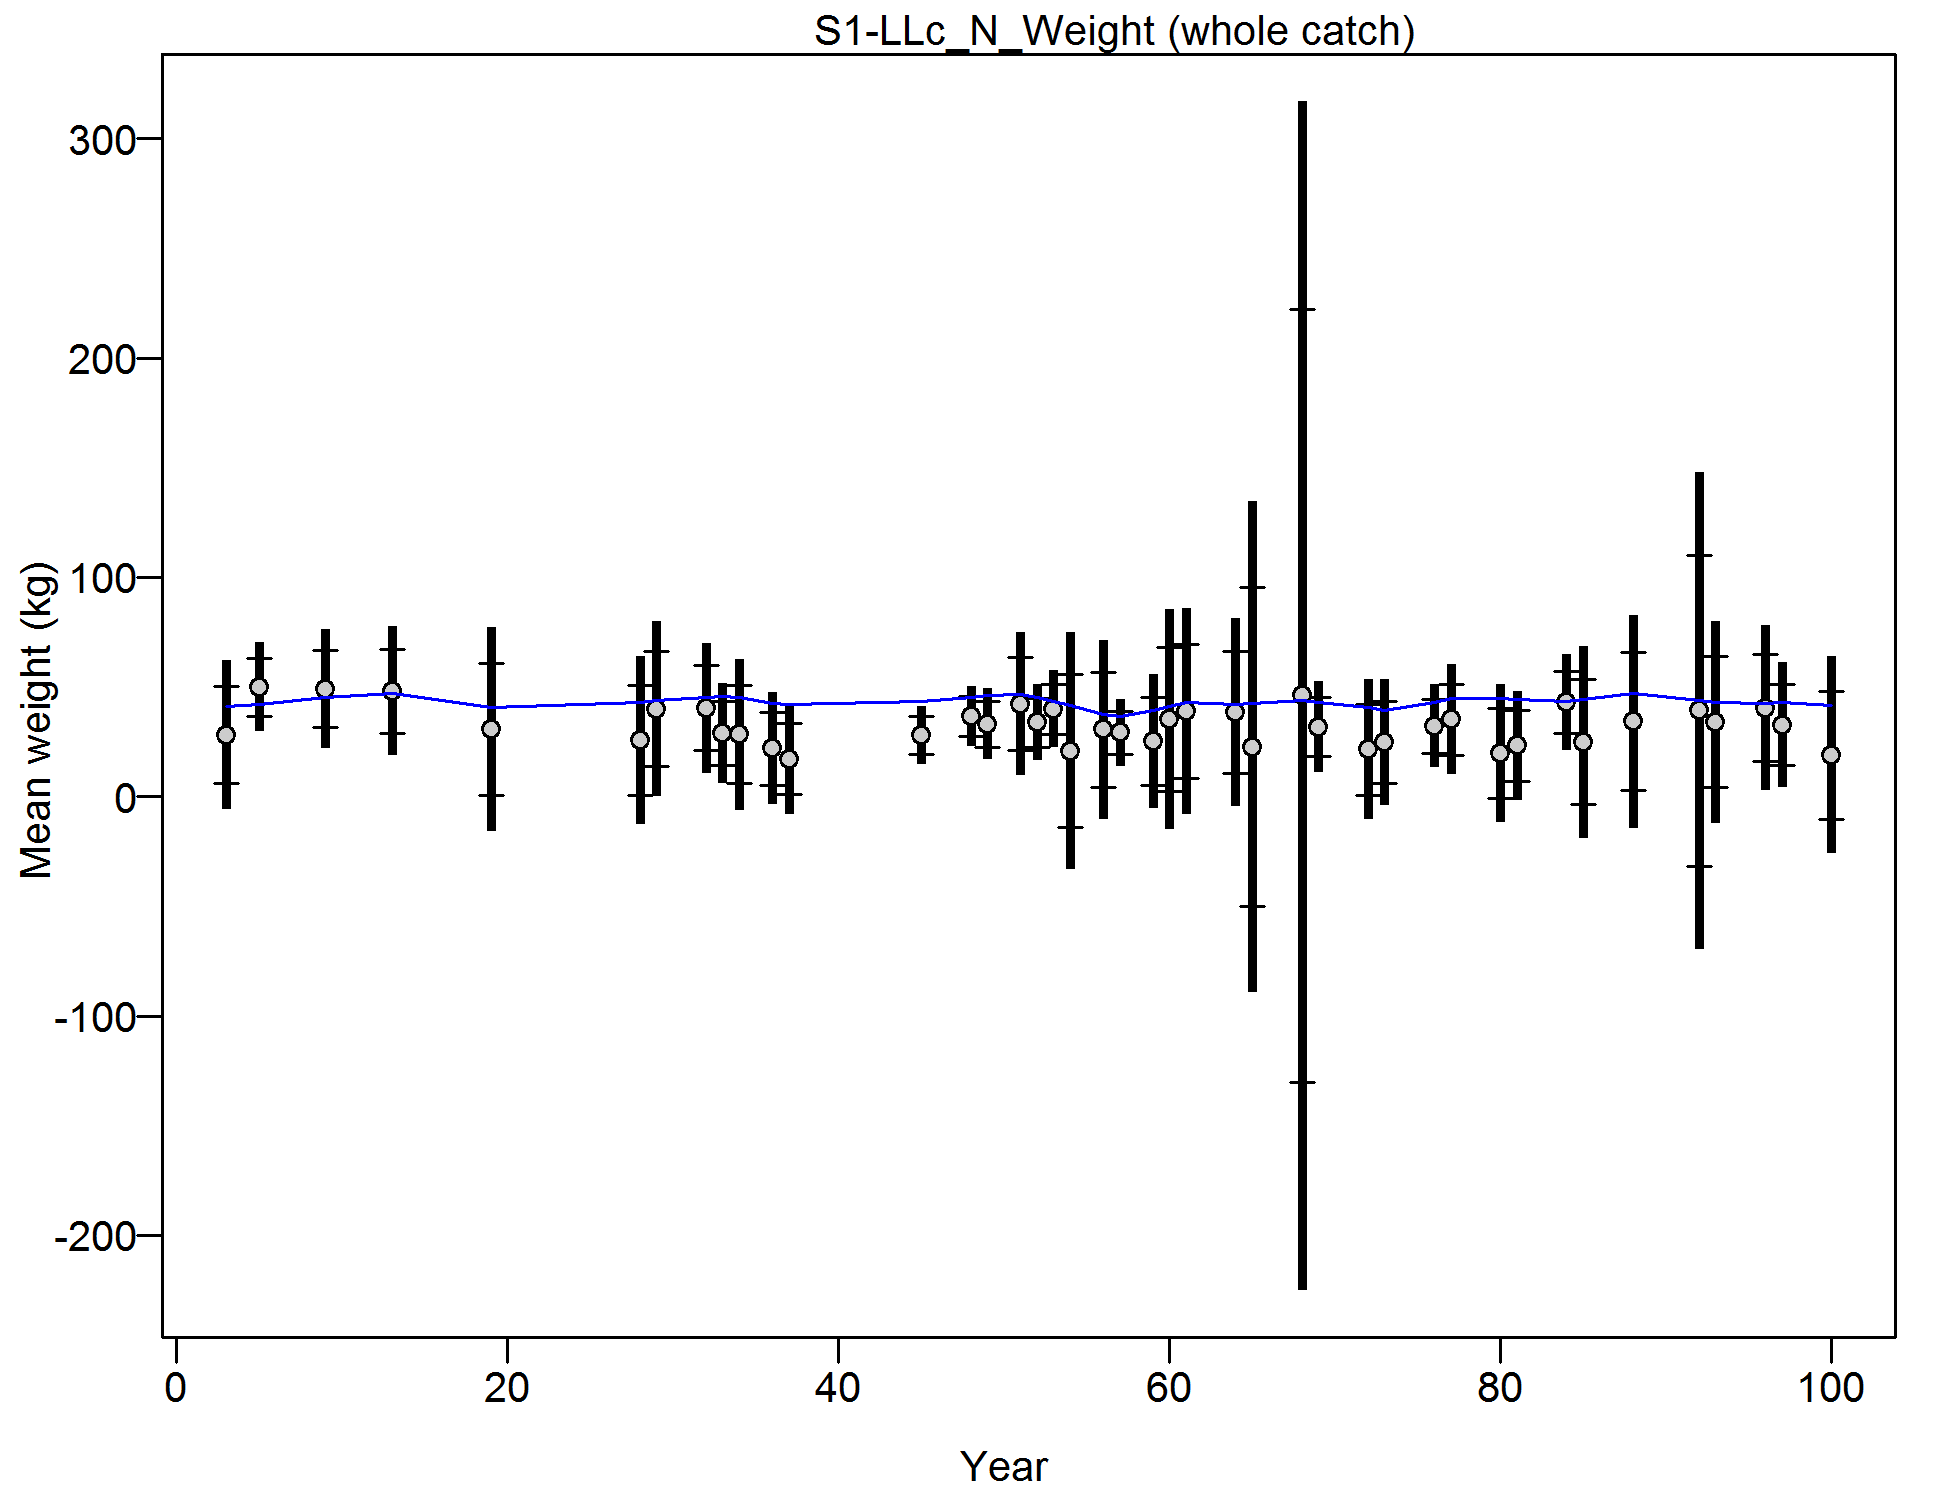
Mean size for S1-LLc_N_Weight with 95% confidence intervals based on current samples sizes.
Francis data weighting method TA1.8: thinner intervals (with capped ends) show result of further adjusting sample sizes based on suggested multiplier (with 95% interval) for size data from S1-LLc_N_Weight:
2.3626 (1.6741-3.9713)
For more info, see
Francis, R.I.C.C. (2011). Data weighting in statistical fisheries stock assessment models. Can. J. Fish. Aquat. Sci. 68: 1124-1138.
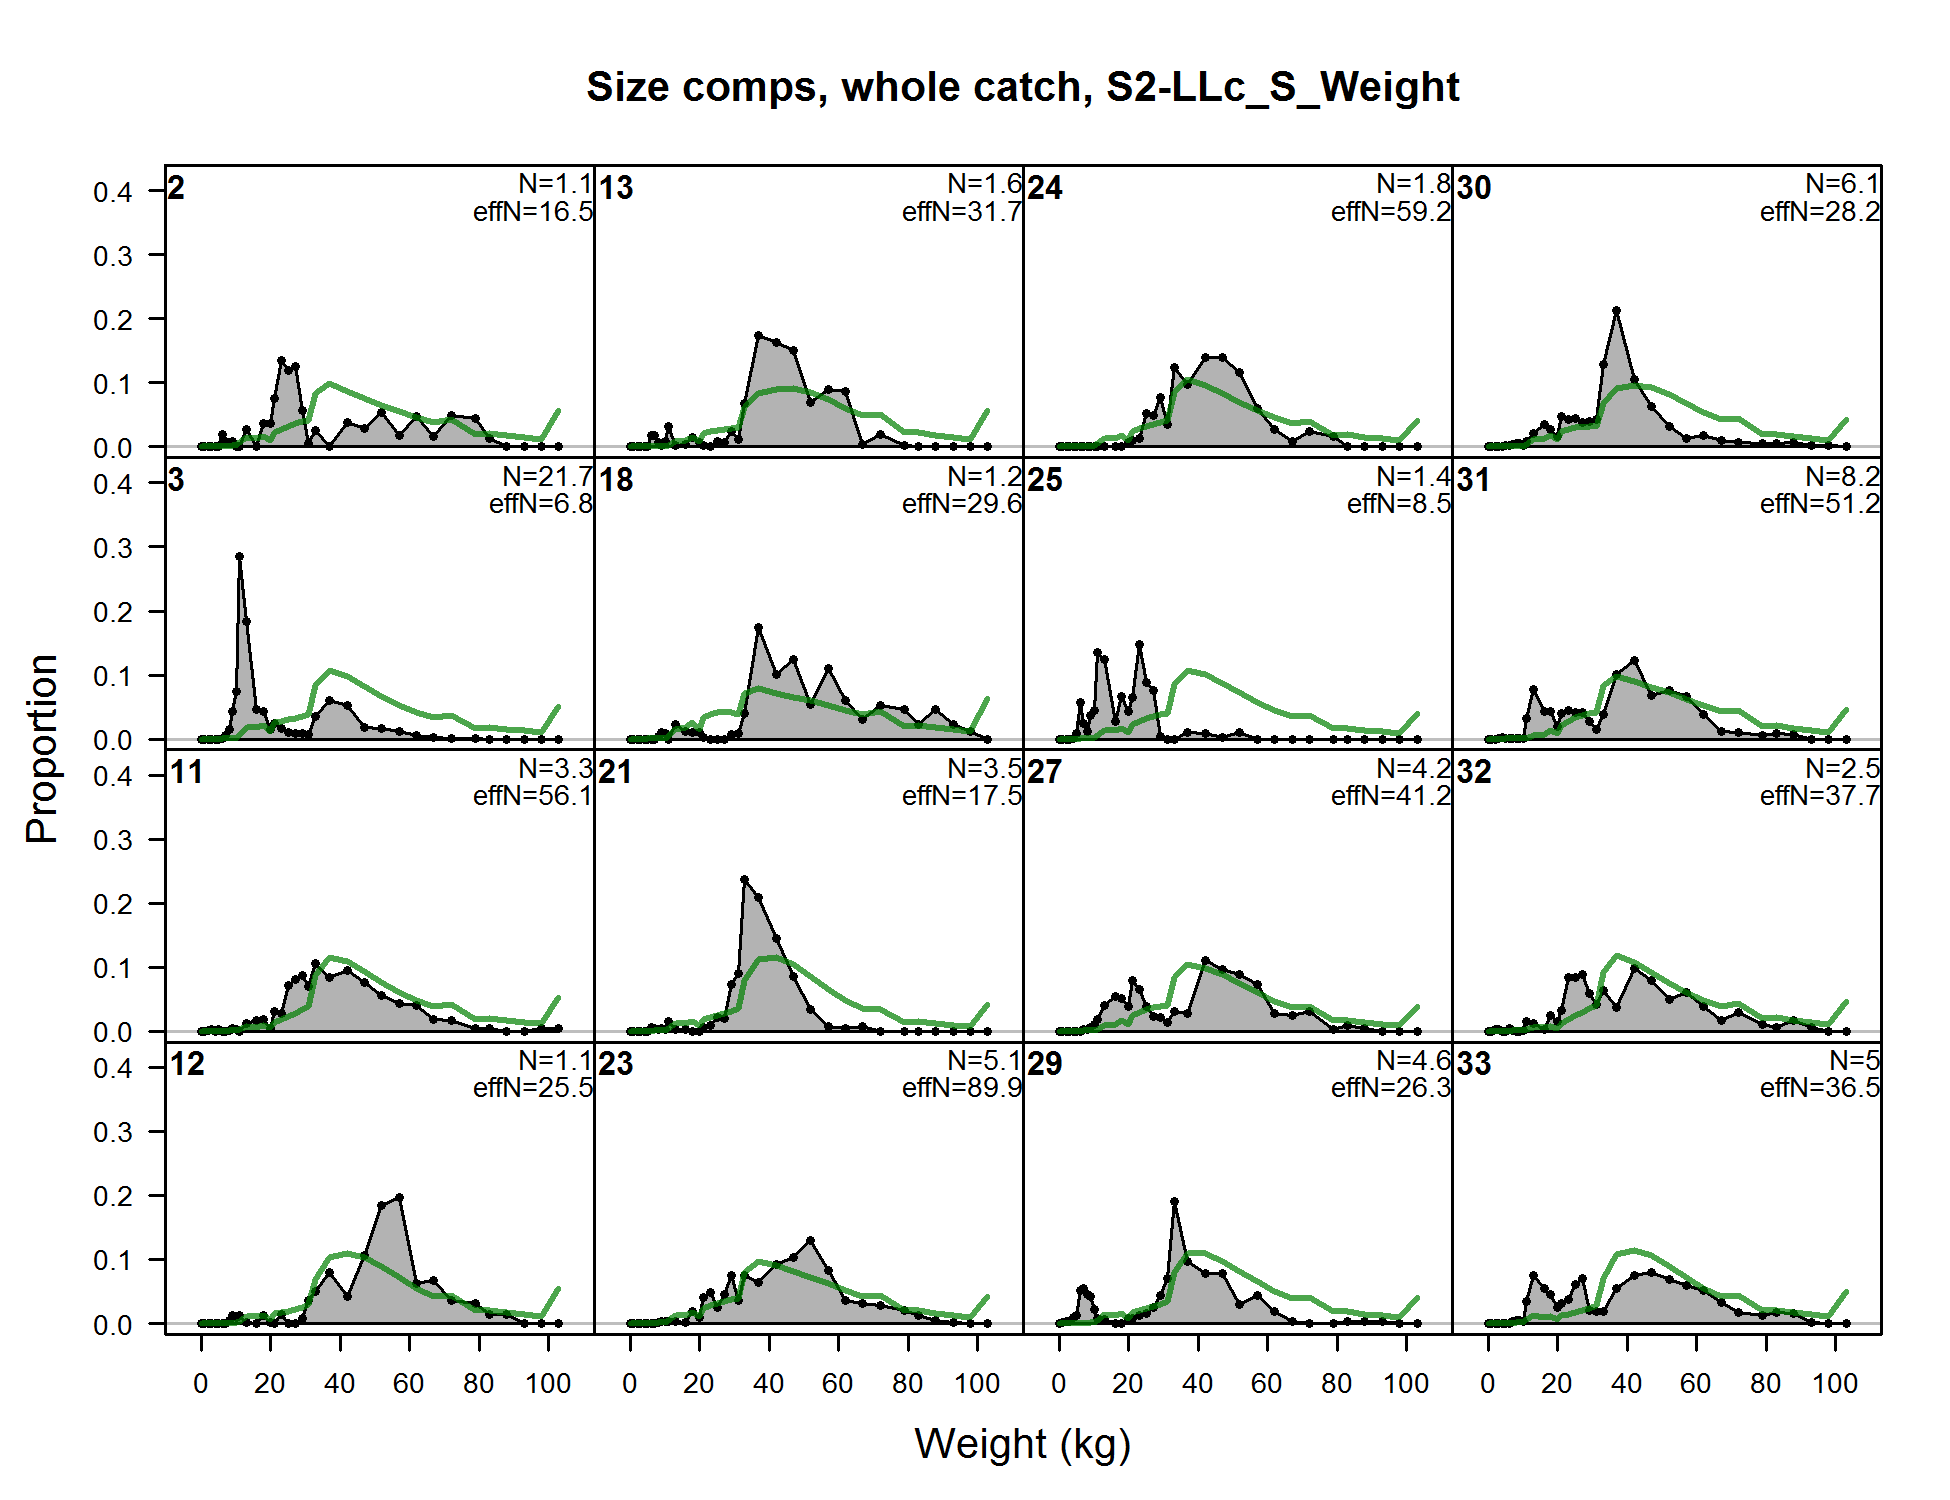
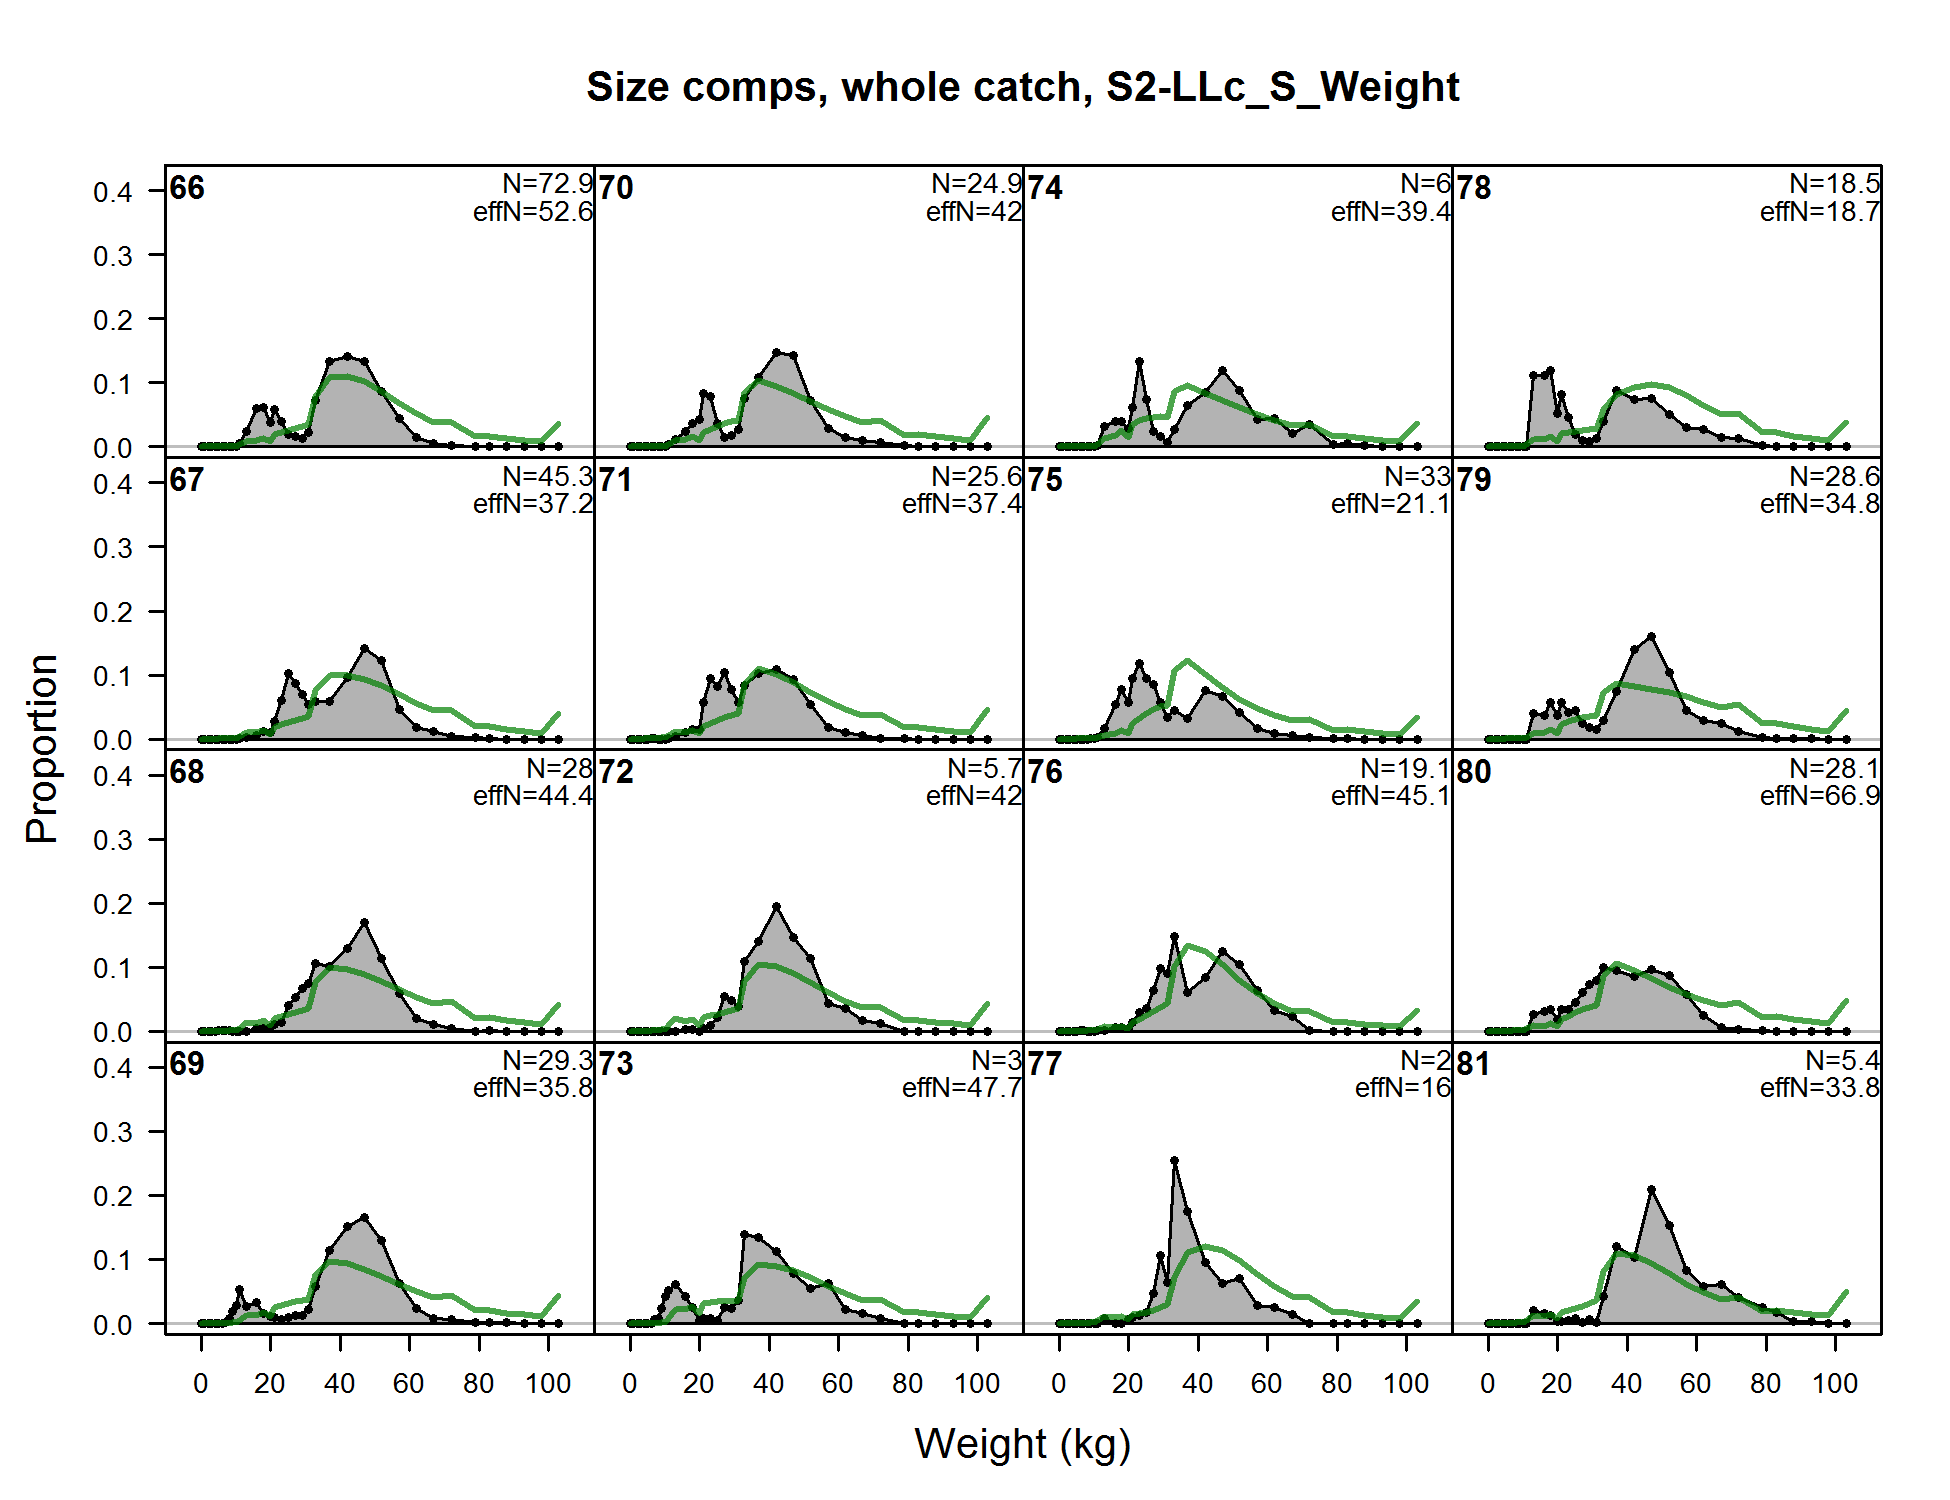
Size comps, whole catch, S2-LLc_S_Weight (plot 1 of 6)
file: comp_sizefit_flt18mkt0_page1.png
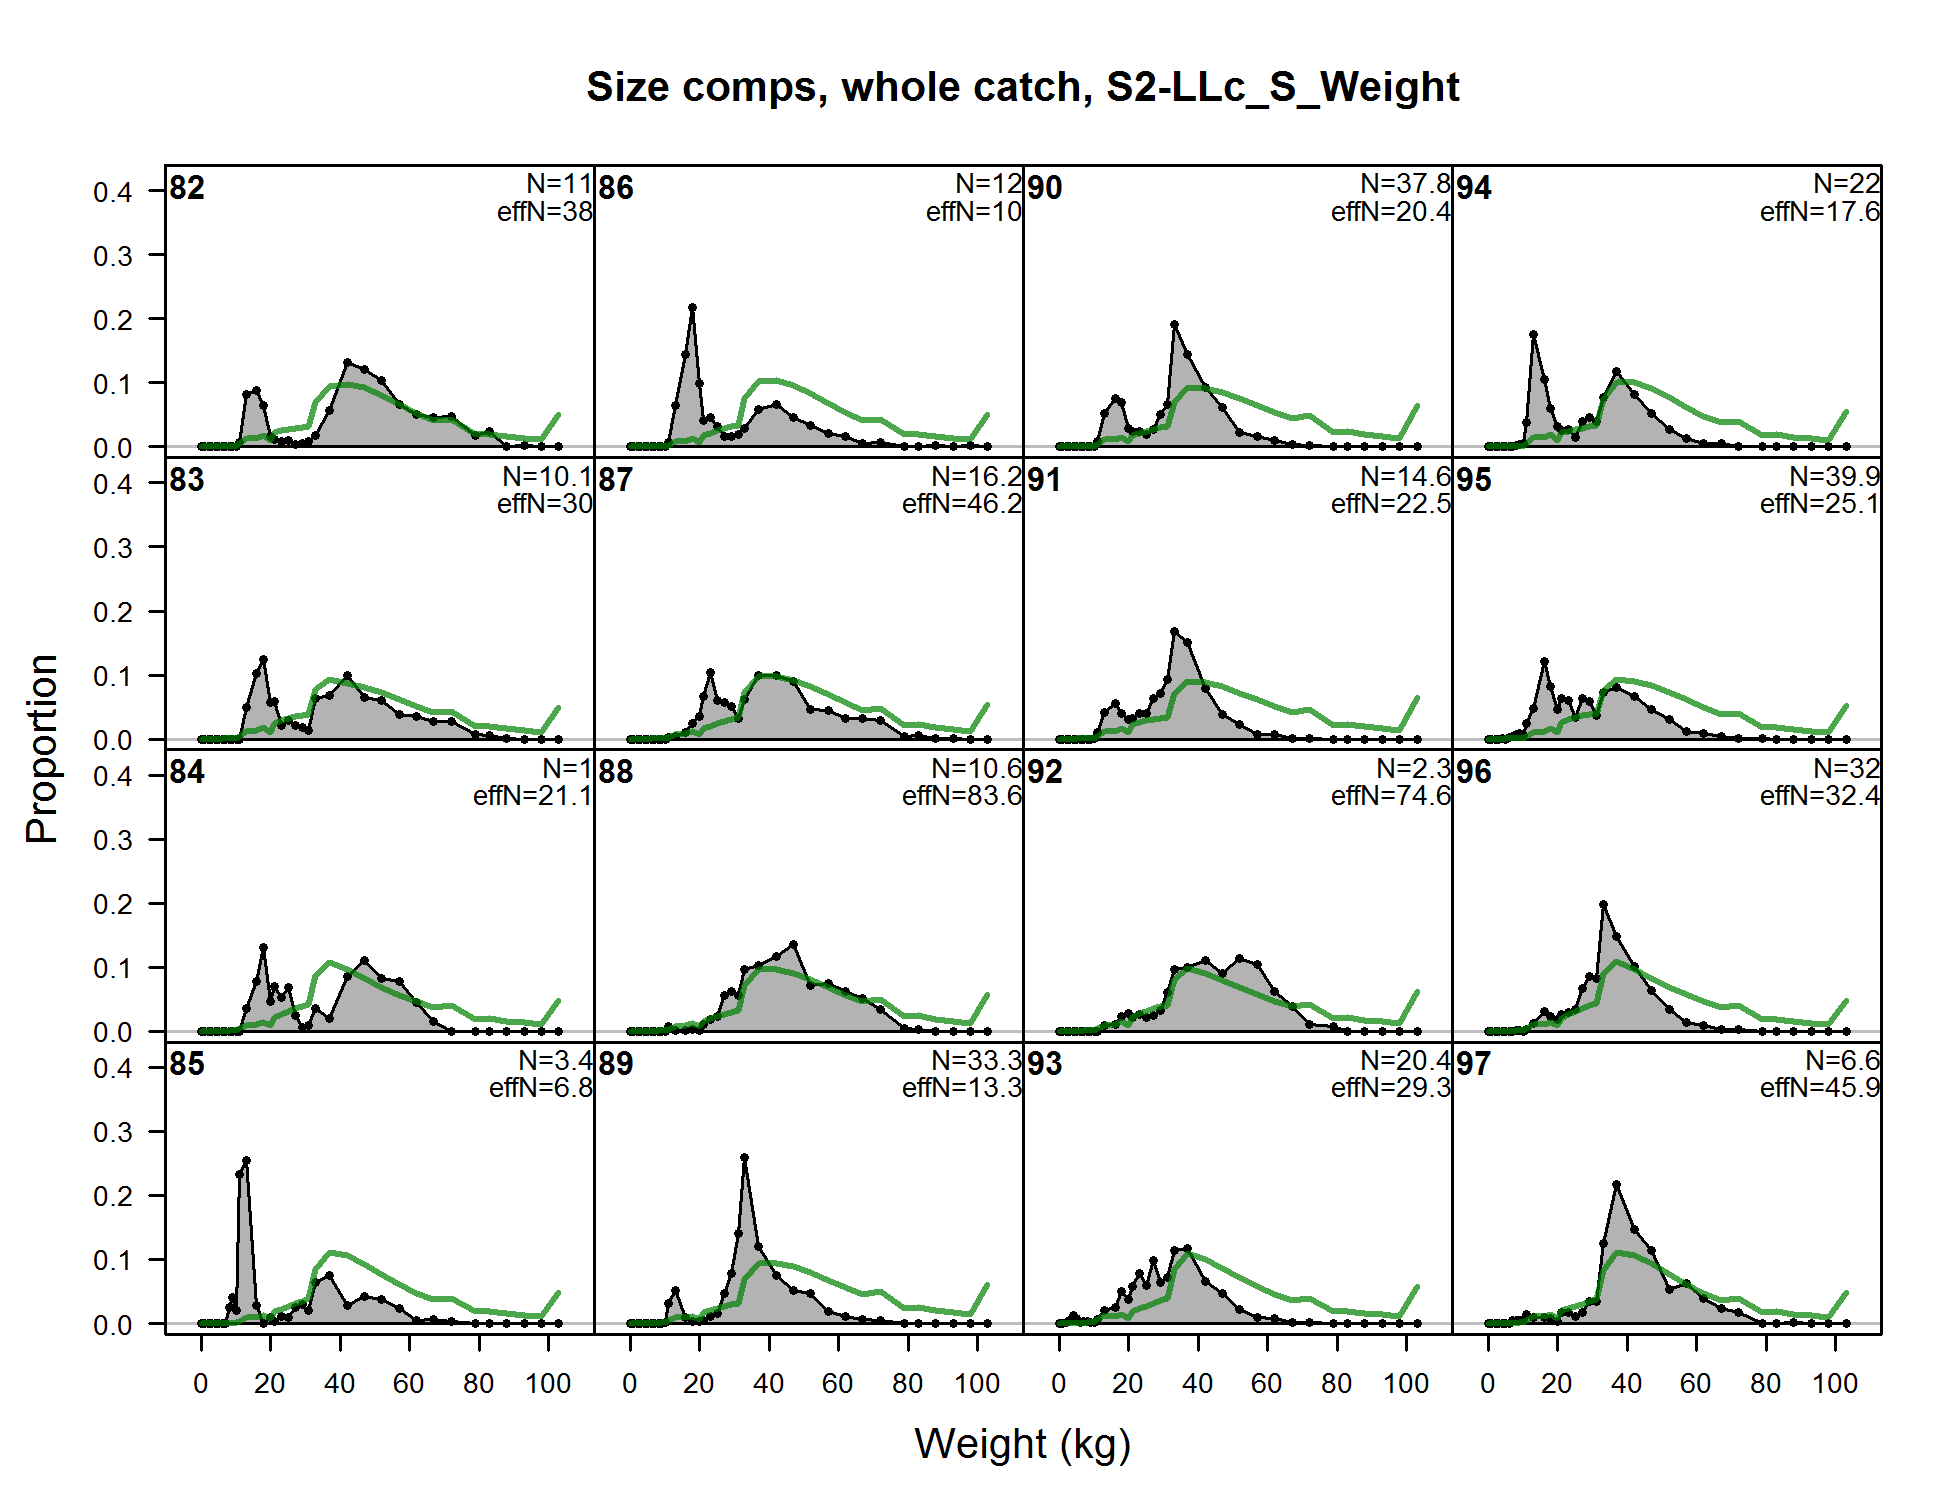
Size comps, whole catch, S2-LLc_S_Weight (plot 1 of 6) (plot 2 of 6)
file: comp_sizefit_flt18mkt0_page2.png
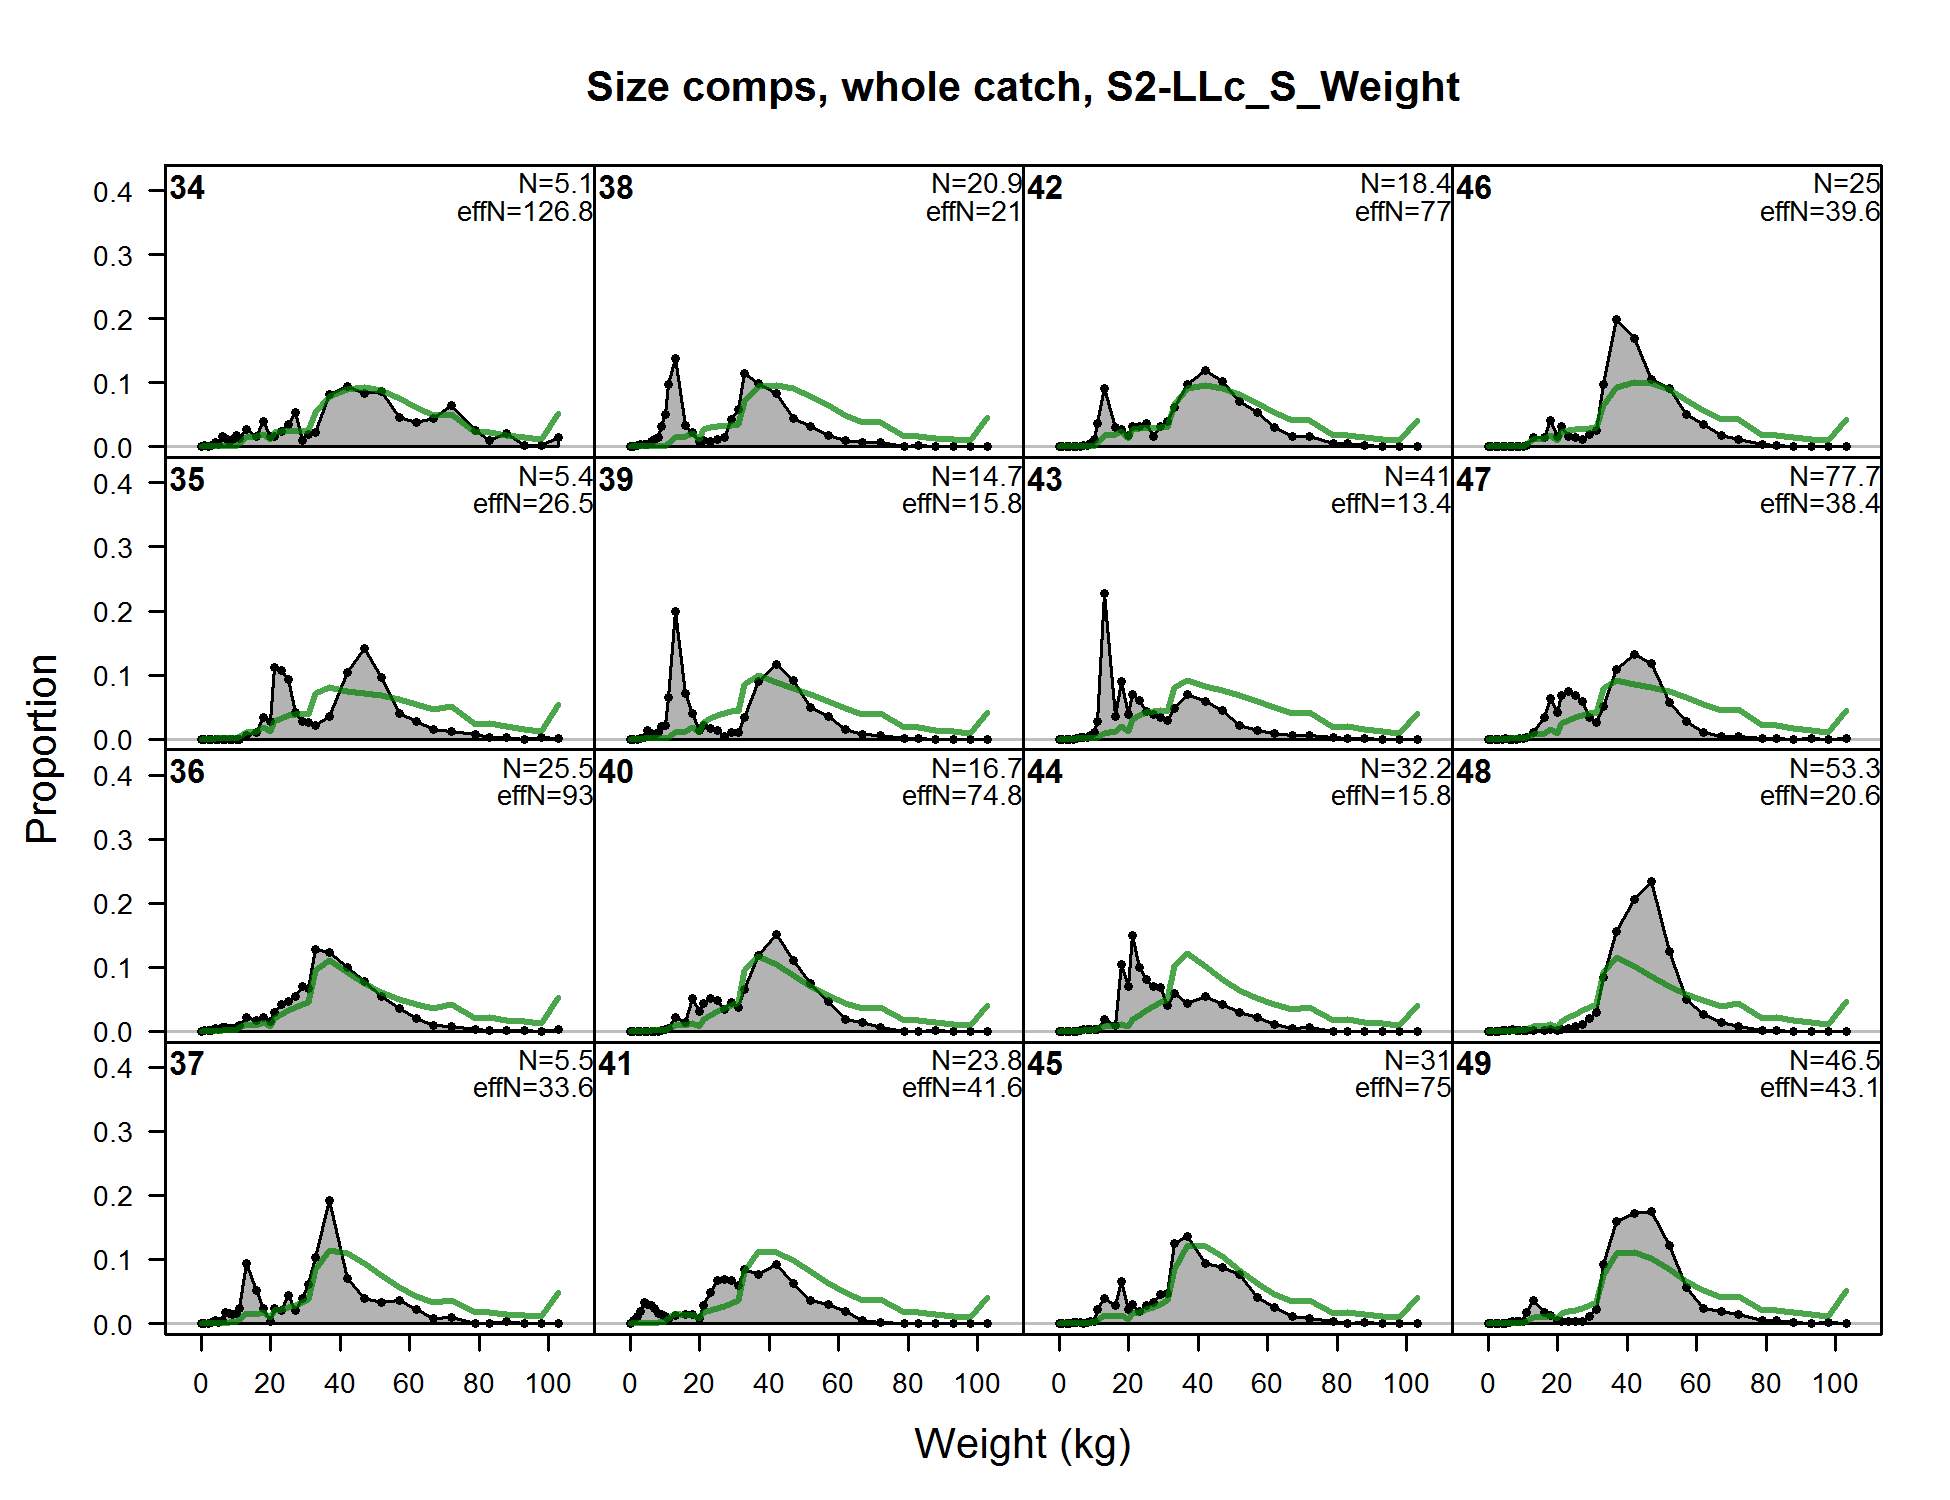
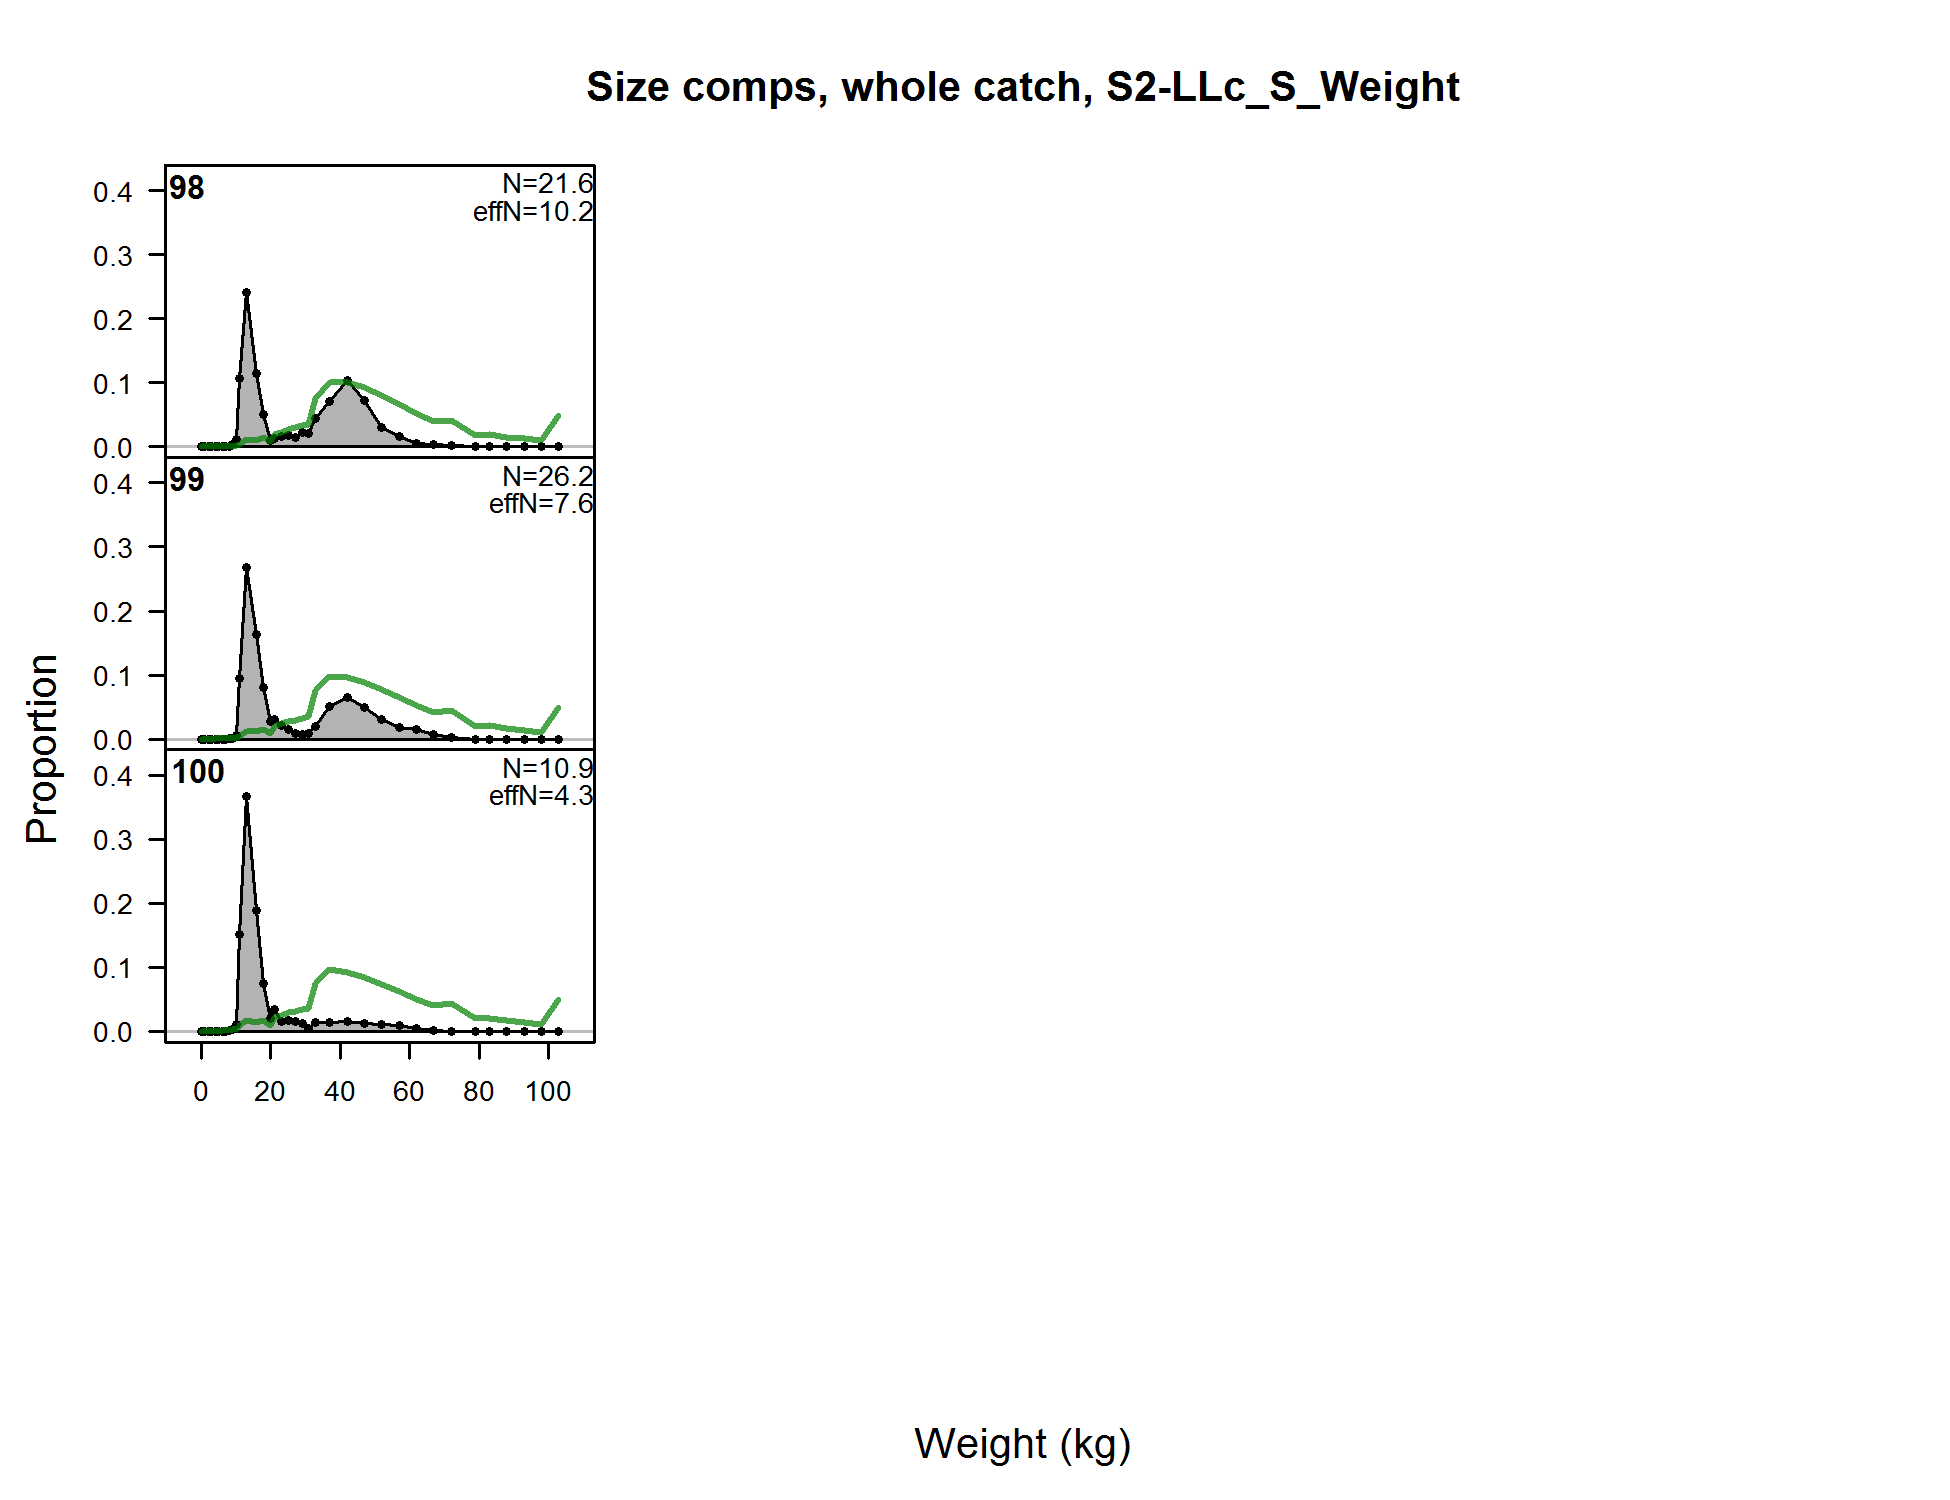
Size comps, whole catch, S2-LLc_S_Weight (plot 1 of 6) (plot 2 of 6) (plot 3 of 6)
file: comp_sizefit_flt18mkt0_page3.png
Size comps, whole catch, S2-LLc_S_Weight (plot 1 of 6) (plot 2 of 6) (plot 3 of 6) (plot 4 of 6)
file: comp_sizefit_flt18mkt0_page4.png
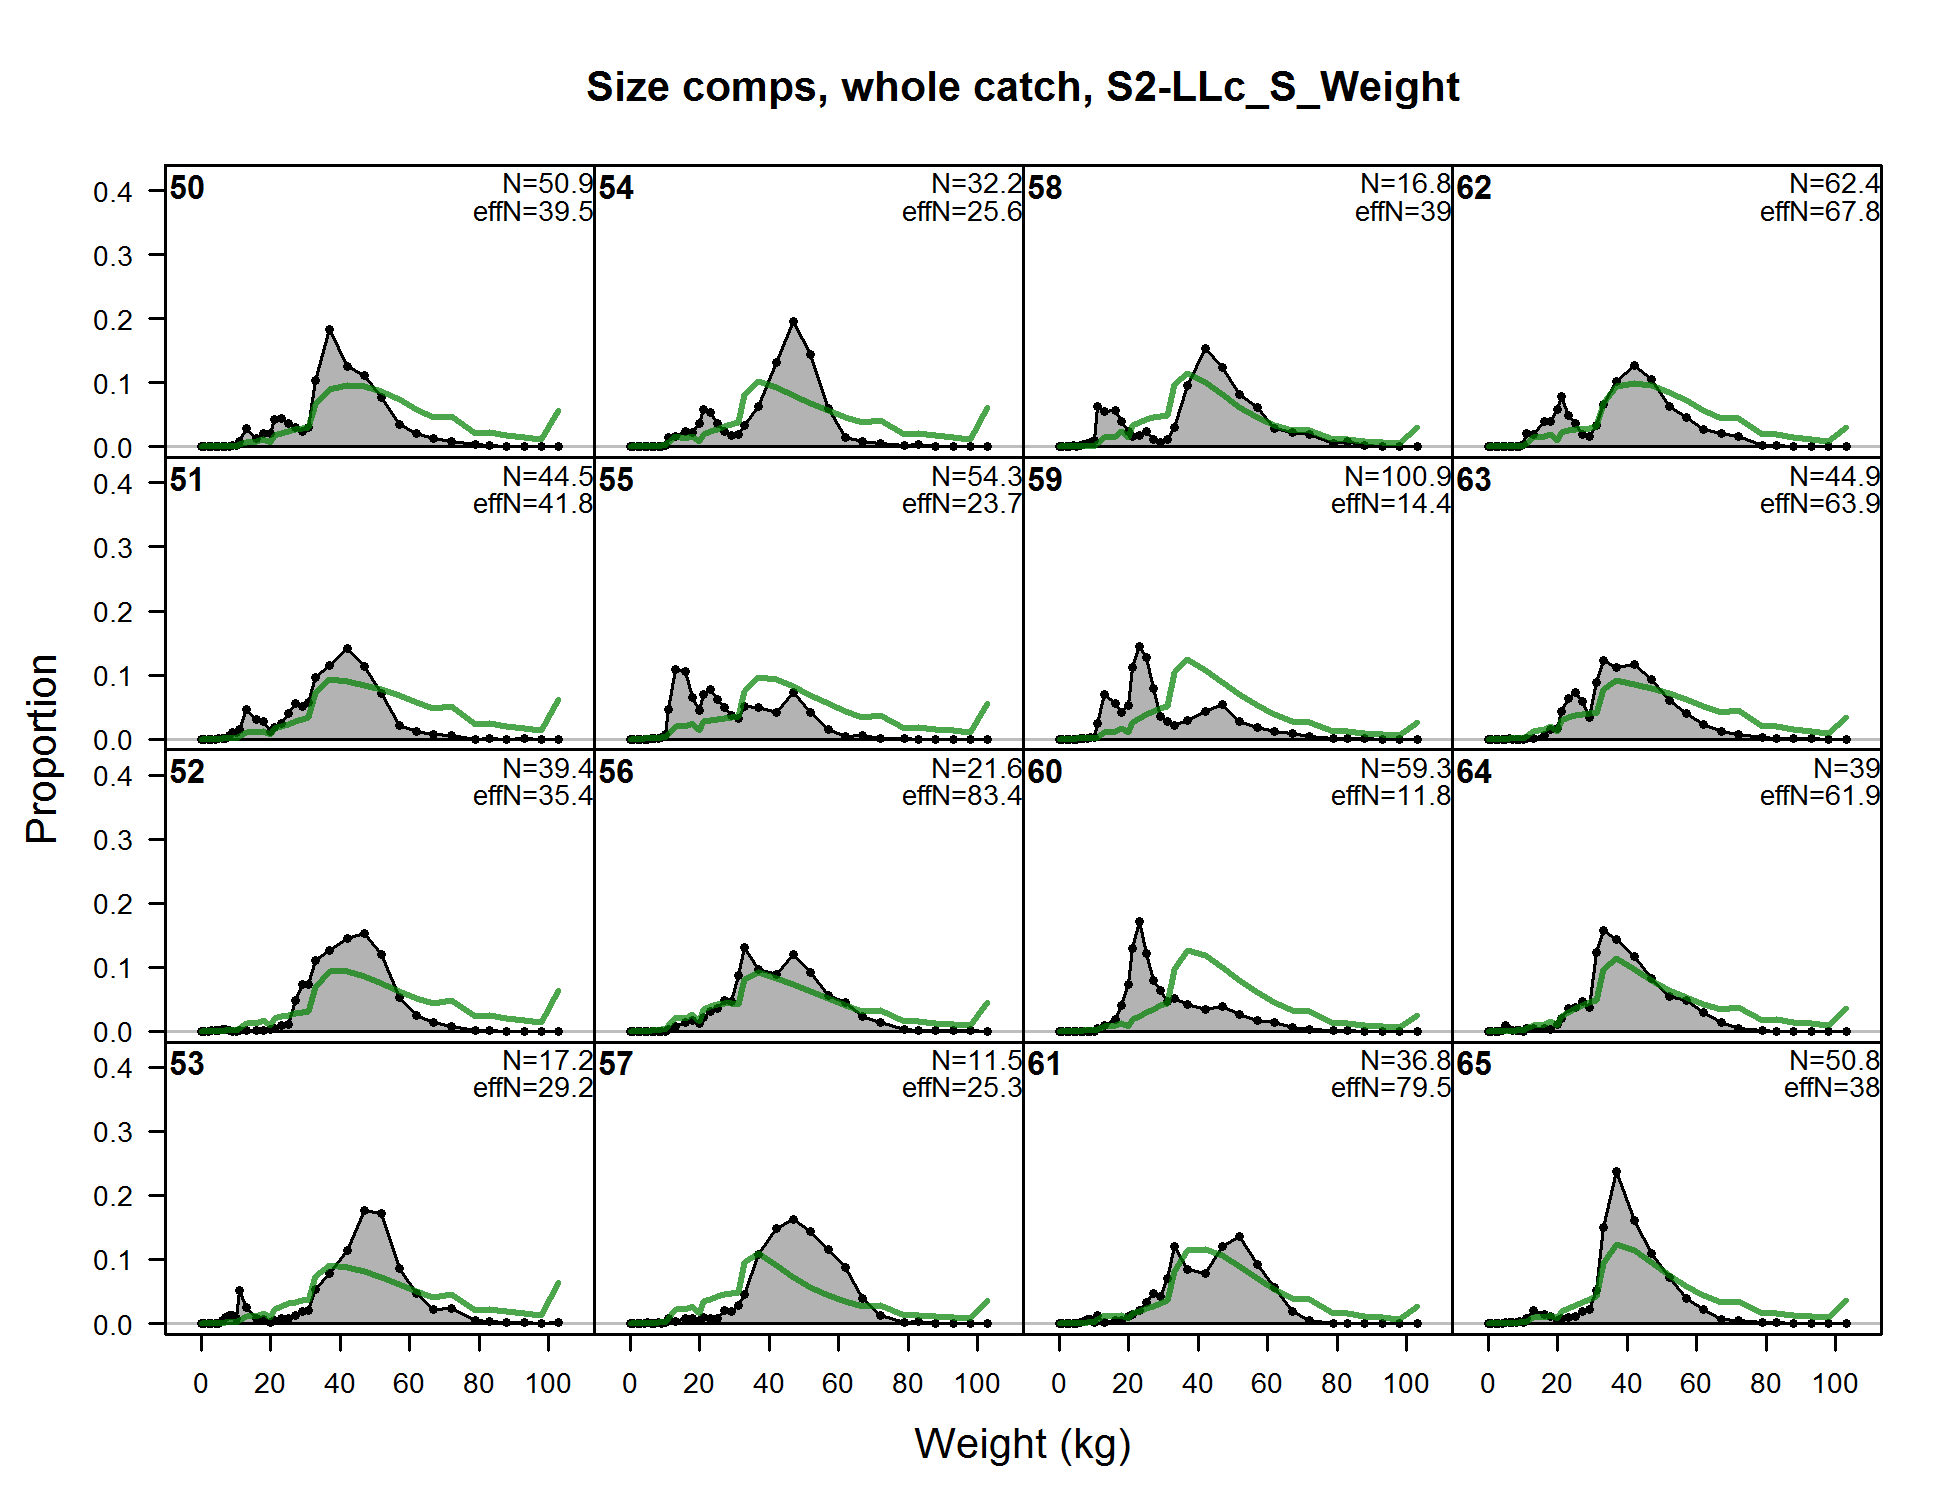
Size comps, whole catch, S2-LLc_S_Weight (plot 1 of 6) (plot 2 of 6) (plot 3 of 6) (plot 4 of 6) (plot 5 of 6)
file: comp_sizefit_flt18mkt0_page5.png
Size comps, whole catch, S2-LLc_S_Weight (plot 1 of 6) (plot 2 of 6) (plot 3 of 6) (plot 4 of 6) (plot 5 of 6) (plot 6 of 6)
file: comp_sizefit_flt18mkt0_page6.png
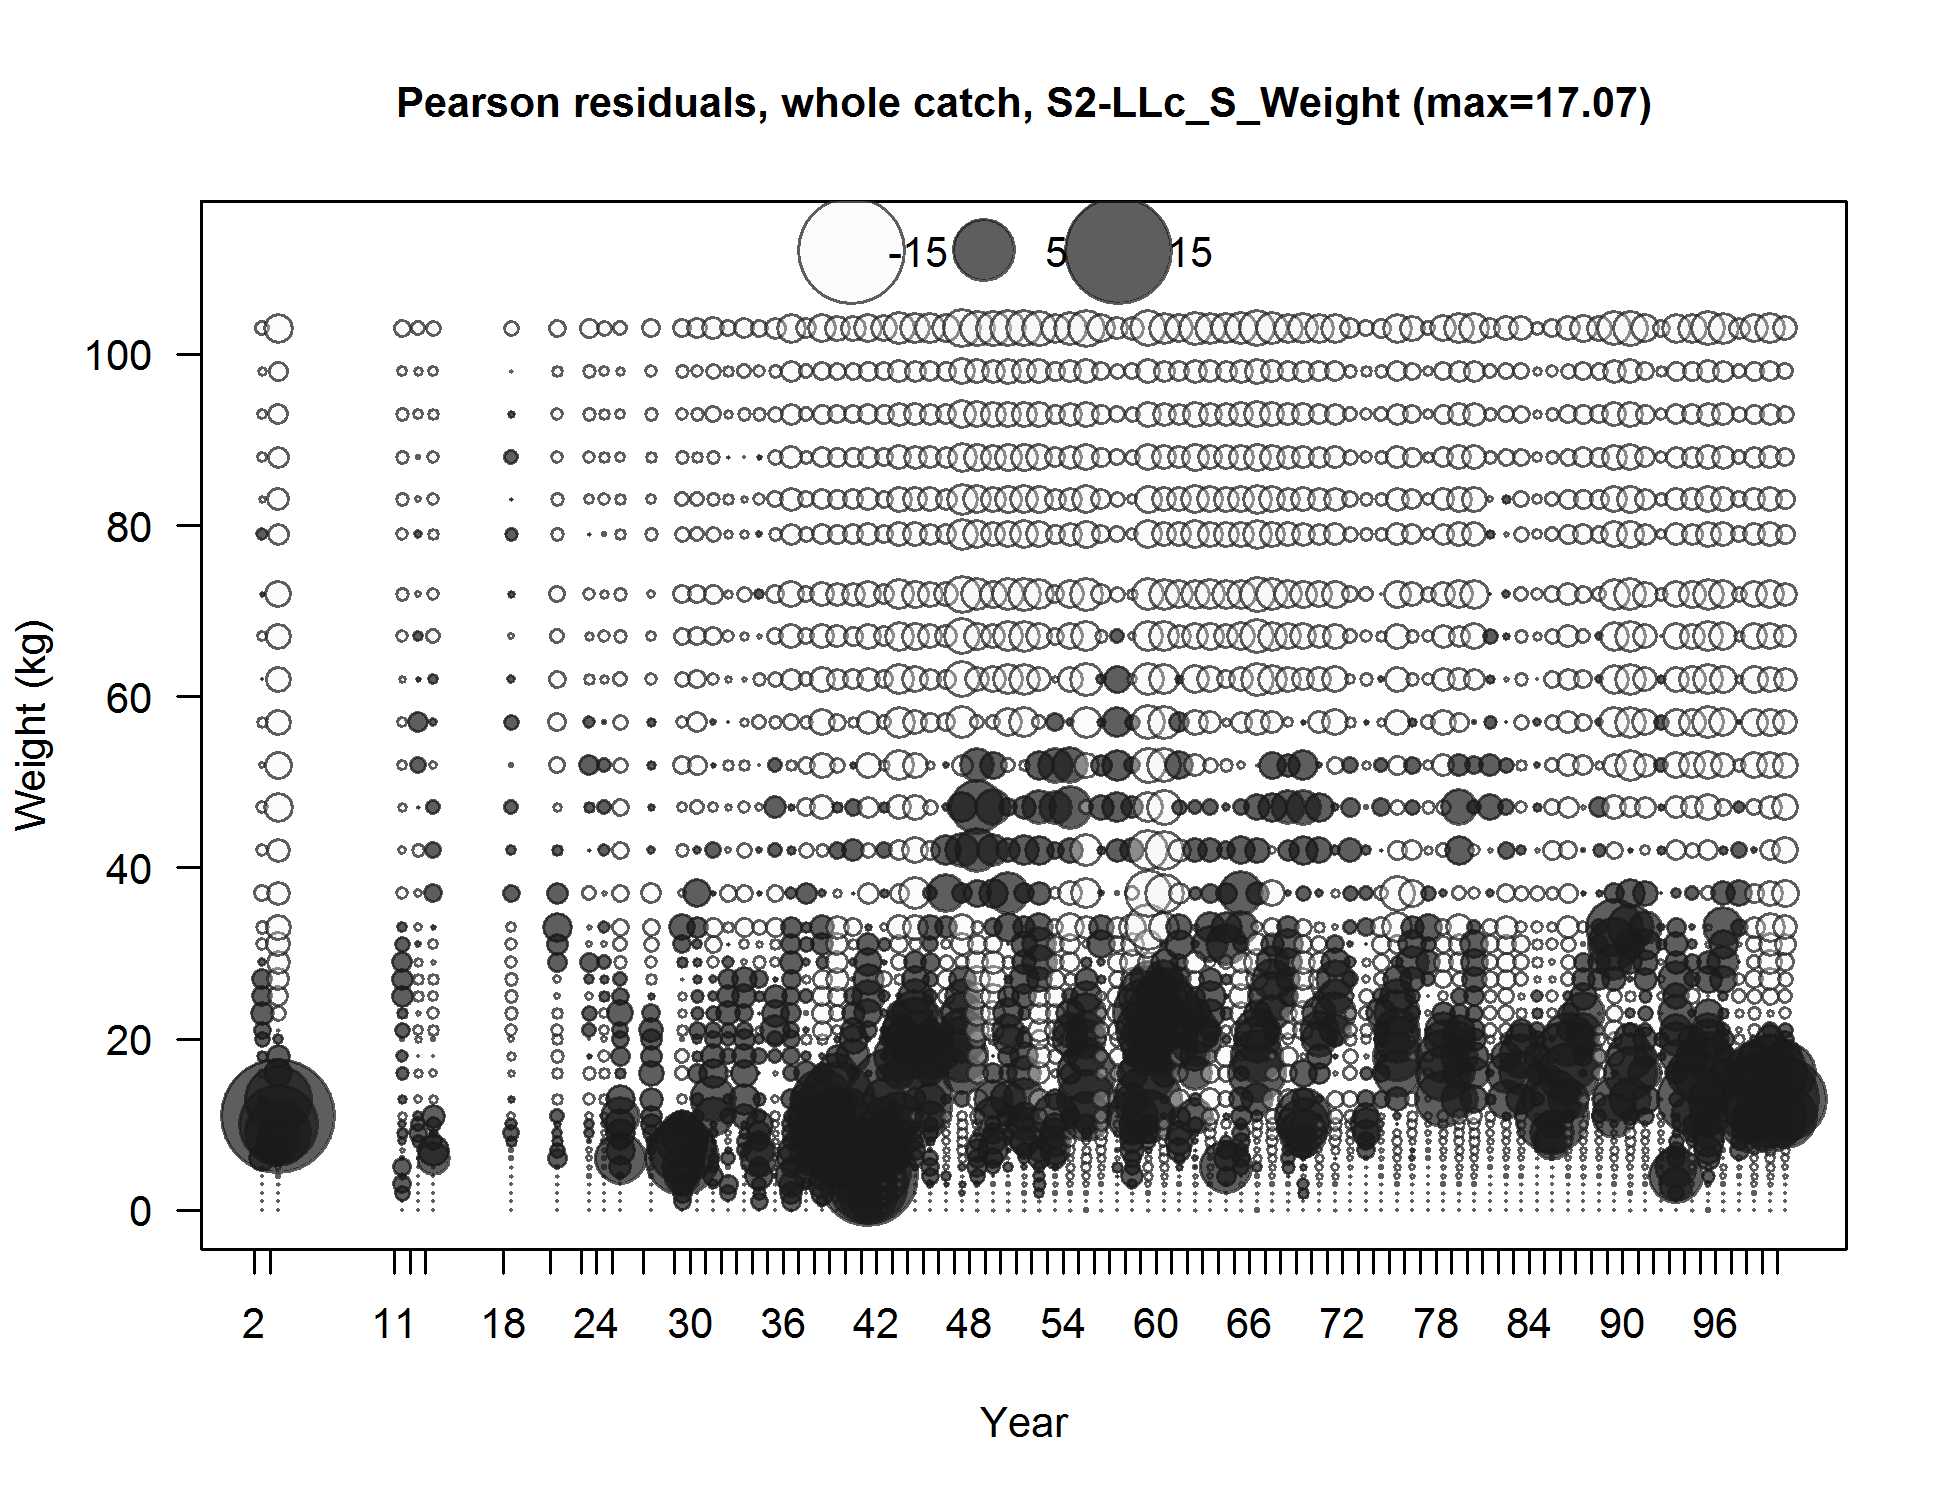
Pearson residuals, whole catch, S2-LLc_S_Weight (max=17.07) (plot 6 of 6)
Closed bubbles are positive residuals (observed > expected) and open bubbles are negative residuals (observed < expected).
file: comp_sizefit_residsflt18mkt0_page6.png
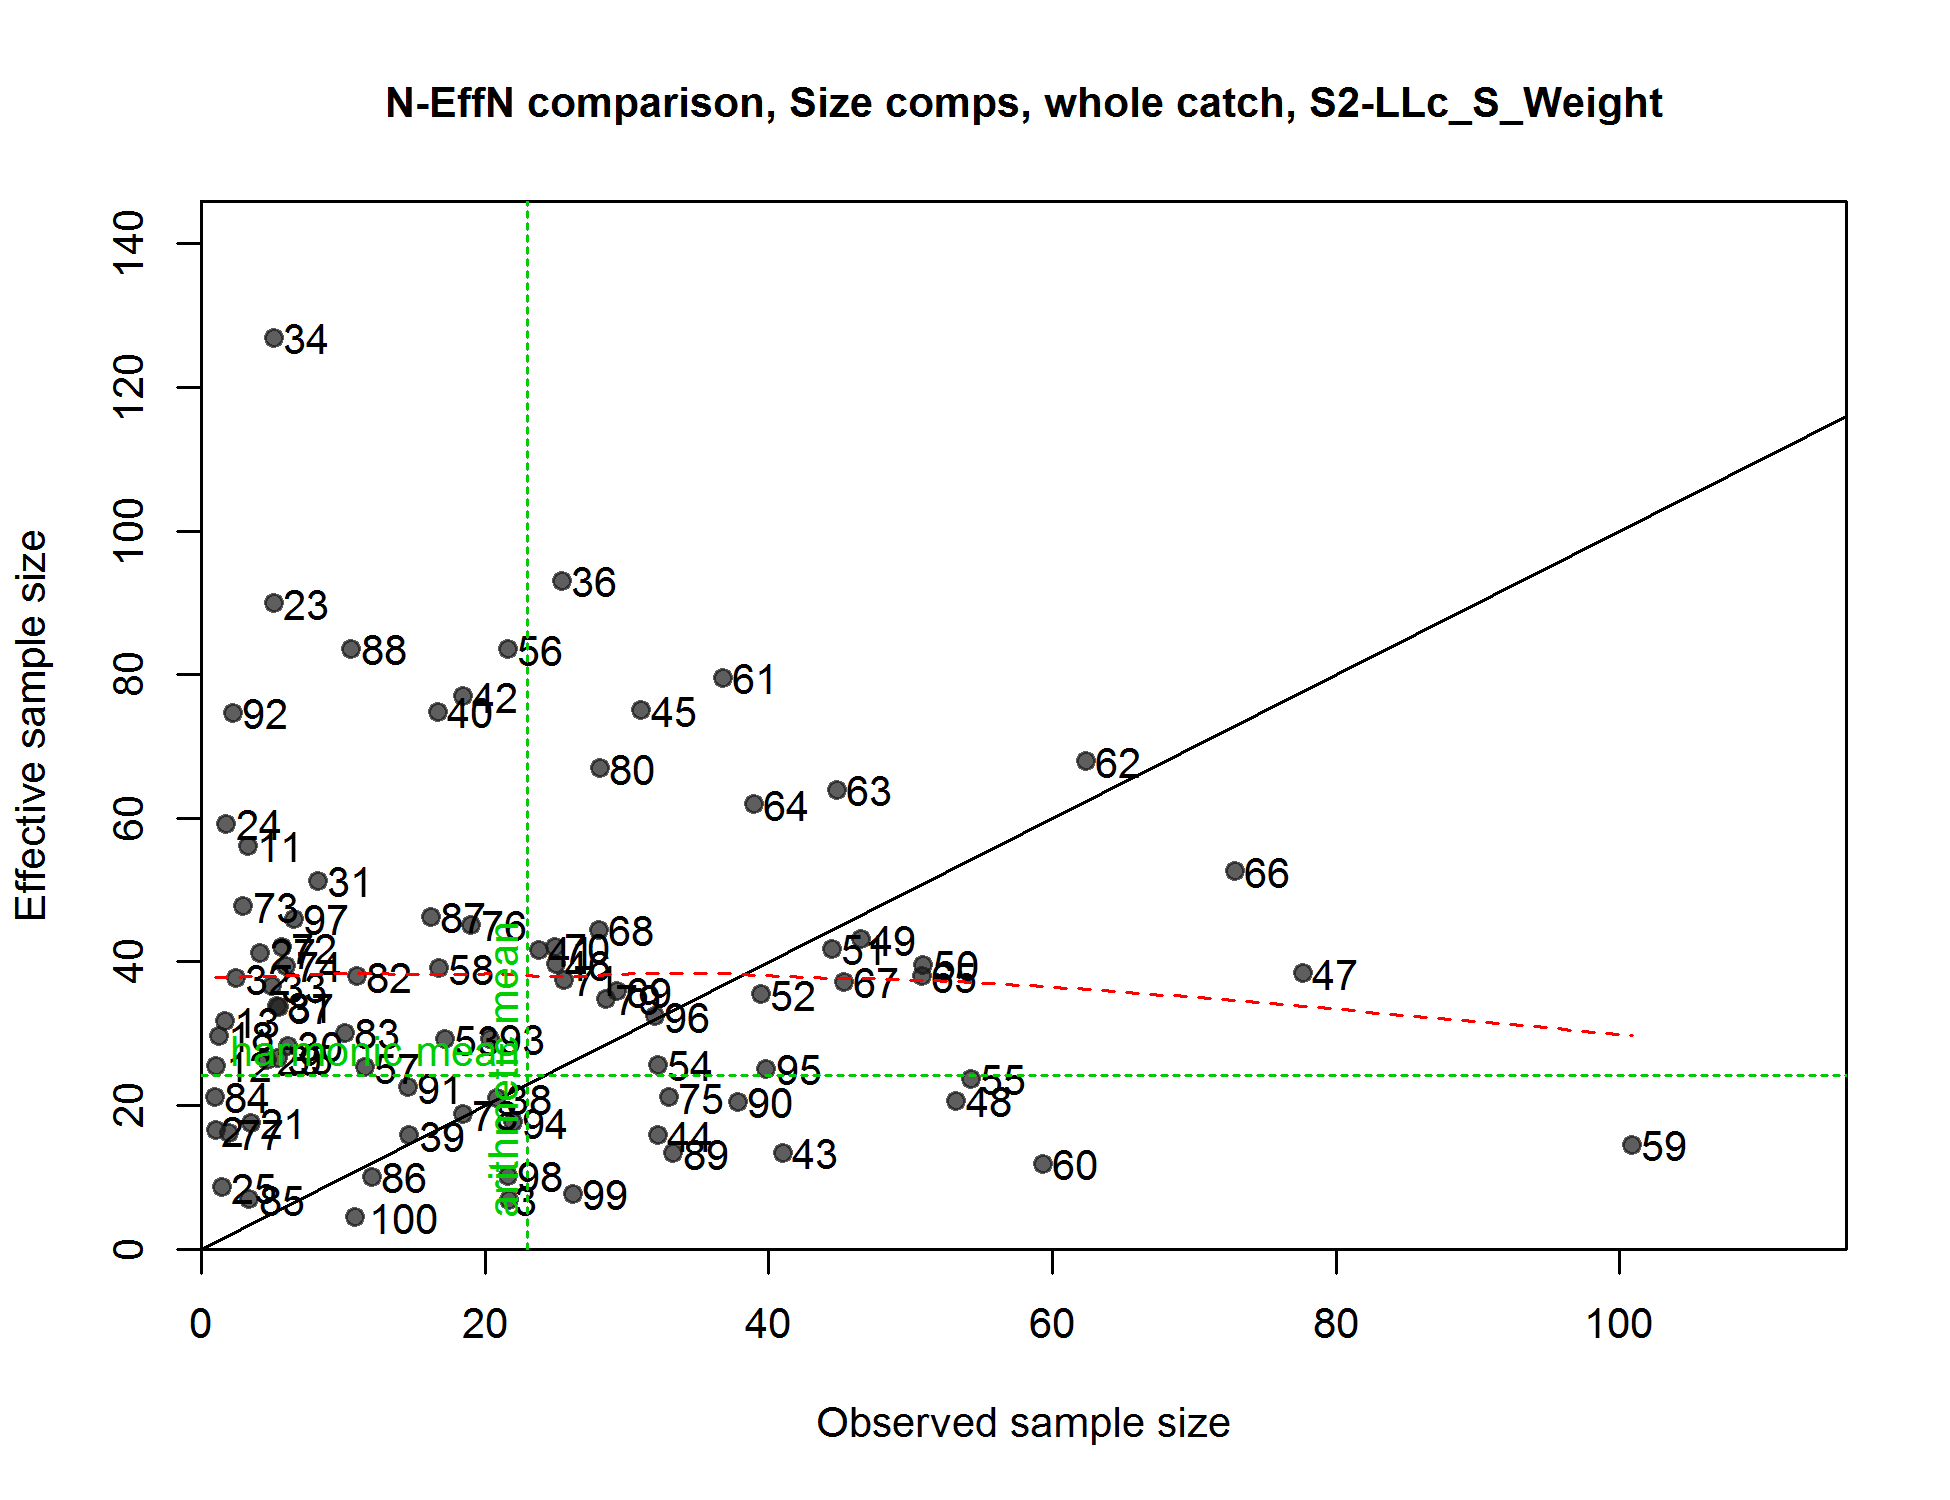
N-EffN comparison, Size comps, whole catch, S2-LLc_S_Weight
file: comp_sizefit_sampsize_flt18mkt0.png
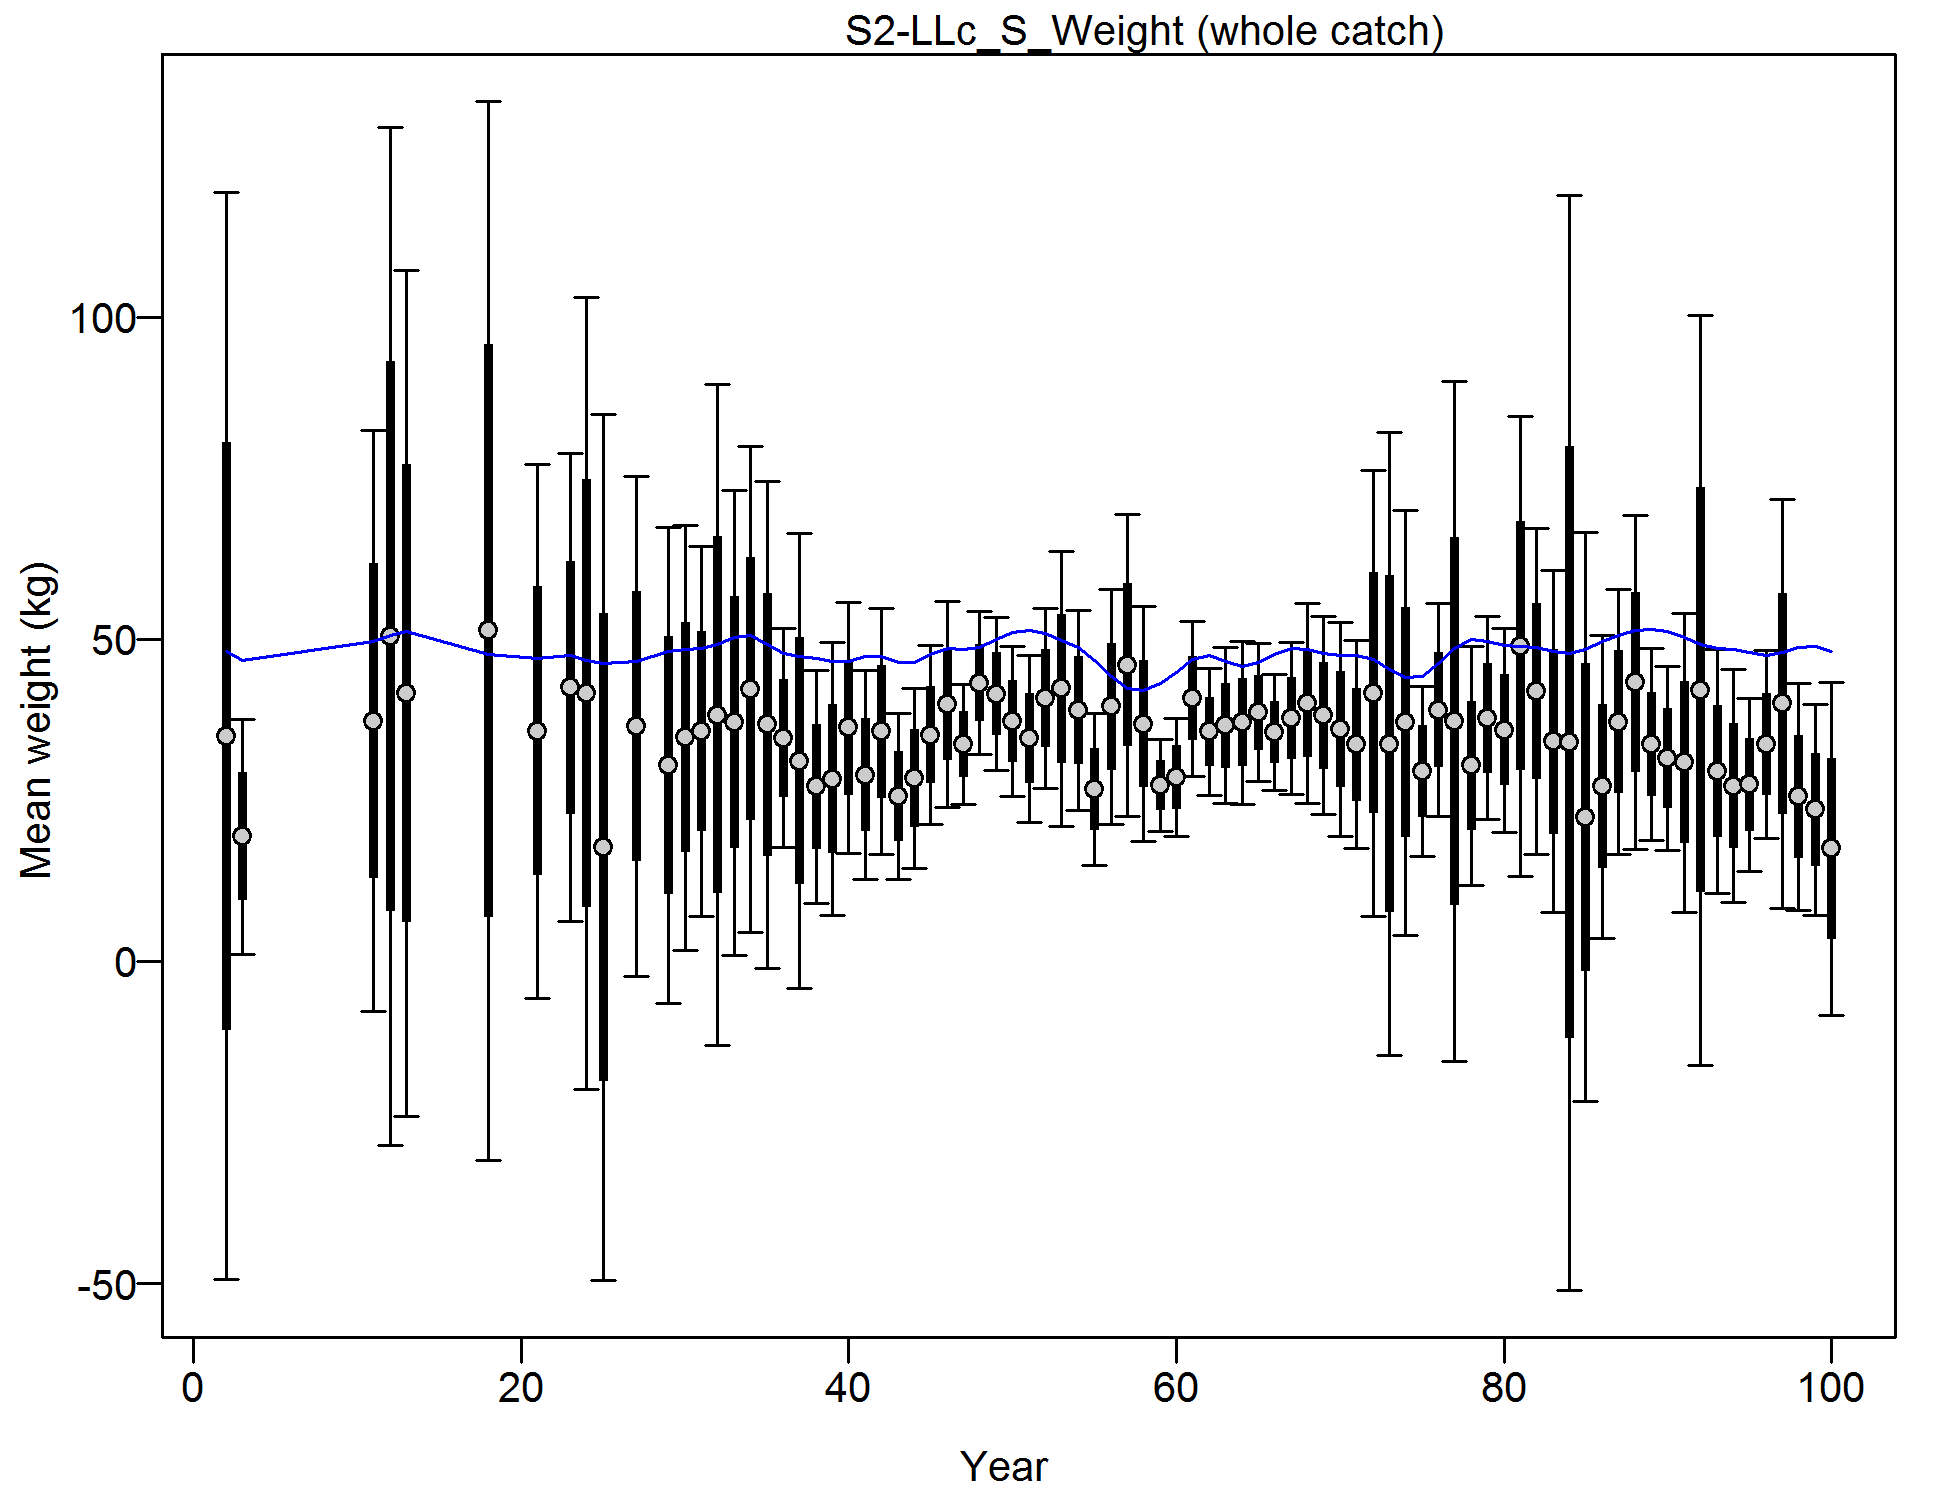
Mean size for S2-LLc_S_Weight with 95% confidence intervals based on current samples sizes.
Francis data weighting method TA1.8: thinner intervals (with capped ends) show result of further adjusting sample sizes based on suggested multiplier (with 95% interval) for size data from S2-LLc_S_Weight:
0.2924 (0.228-0.4121)
For more info, see
Francis, R.I.C.C. (2011). Data weighting in statistical fisheries stock assessment models. Can. J. Fish. Aquat. Sci. 68: 1124-1138.
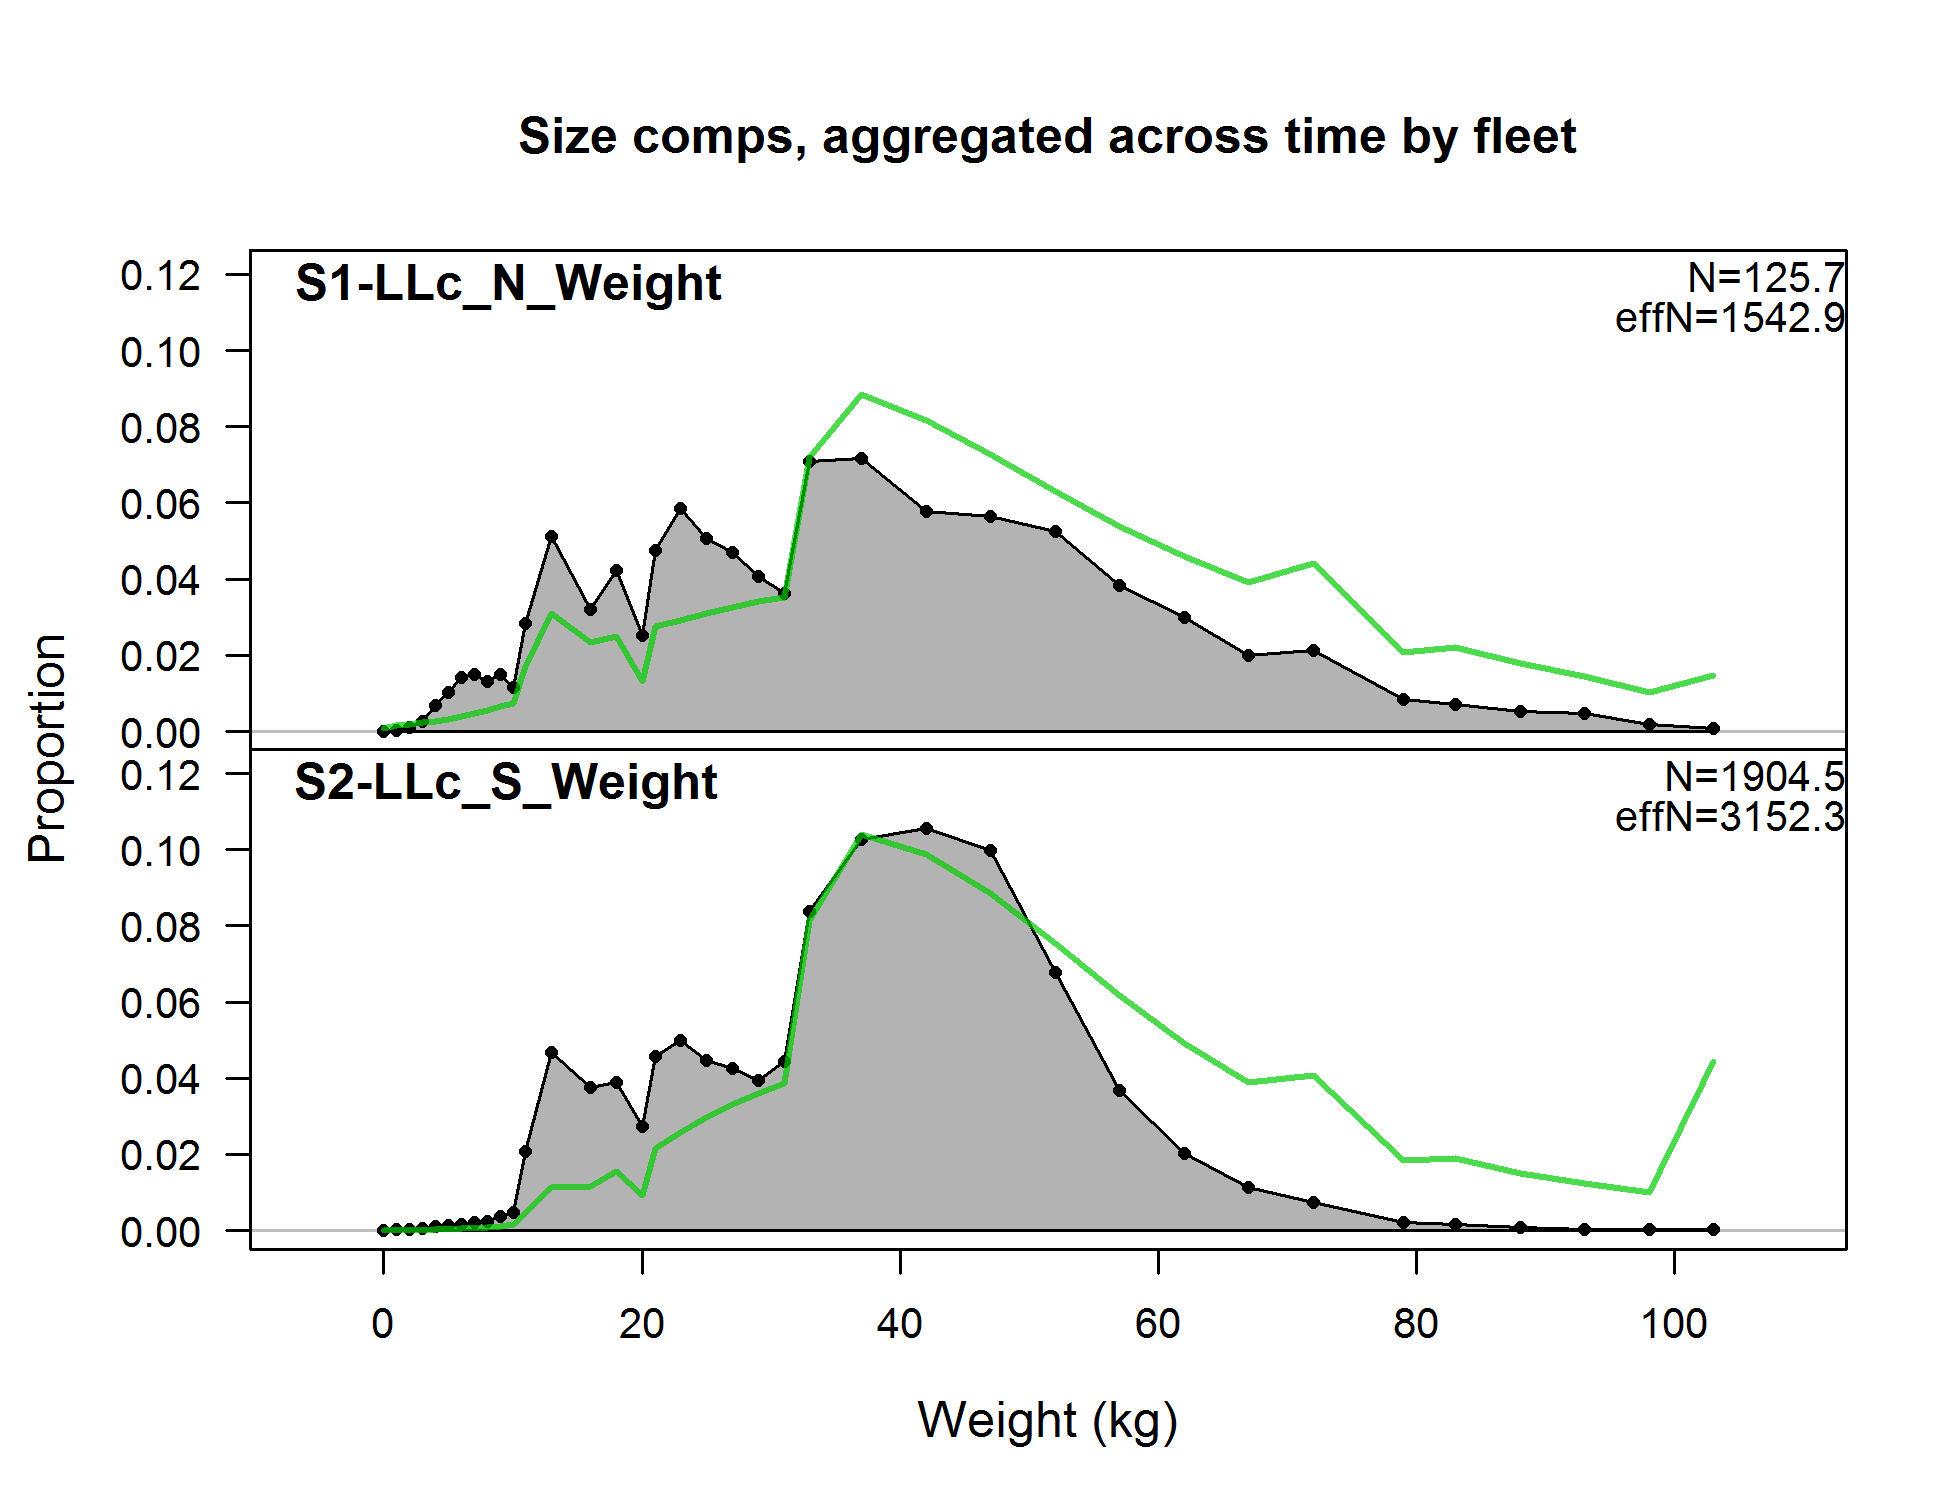
Size comps, aggregated across time by fleet.
Labels 'retained' and 'discard' indicate discarded or retained sampled for each fleet. Panels without this designation represent the whole catch.
file: comp_sizefit__aggregated_across_time.png