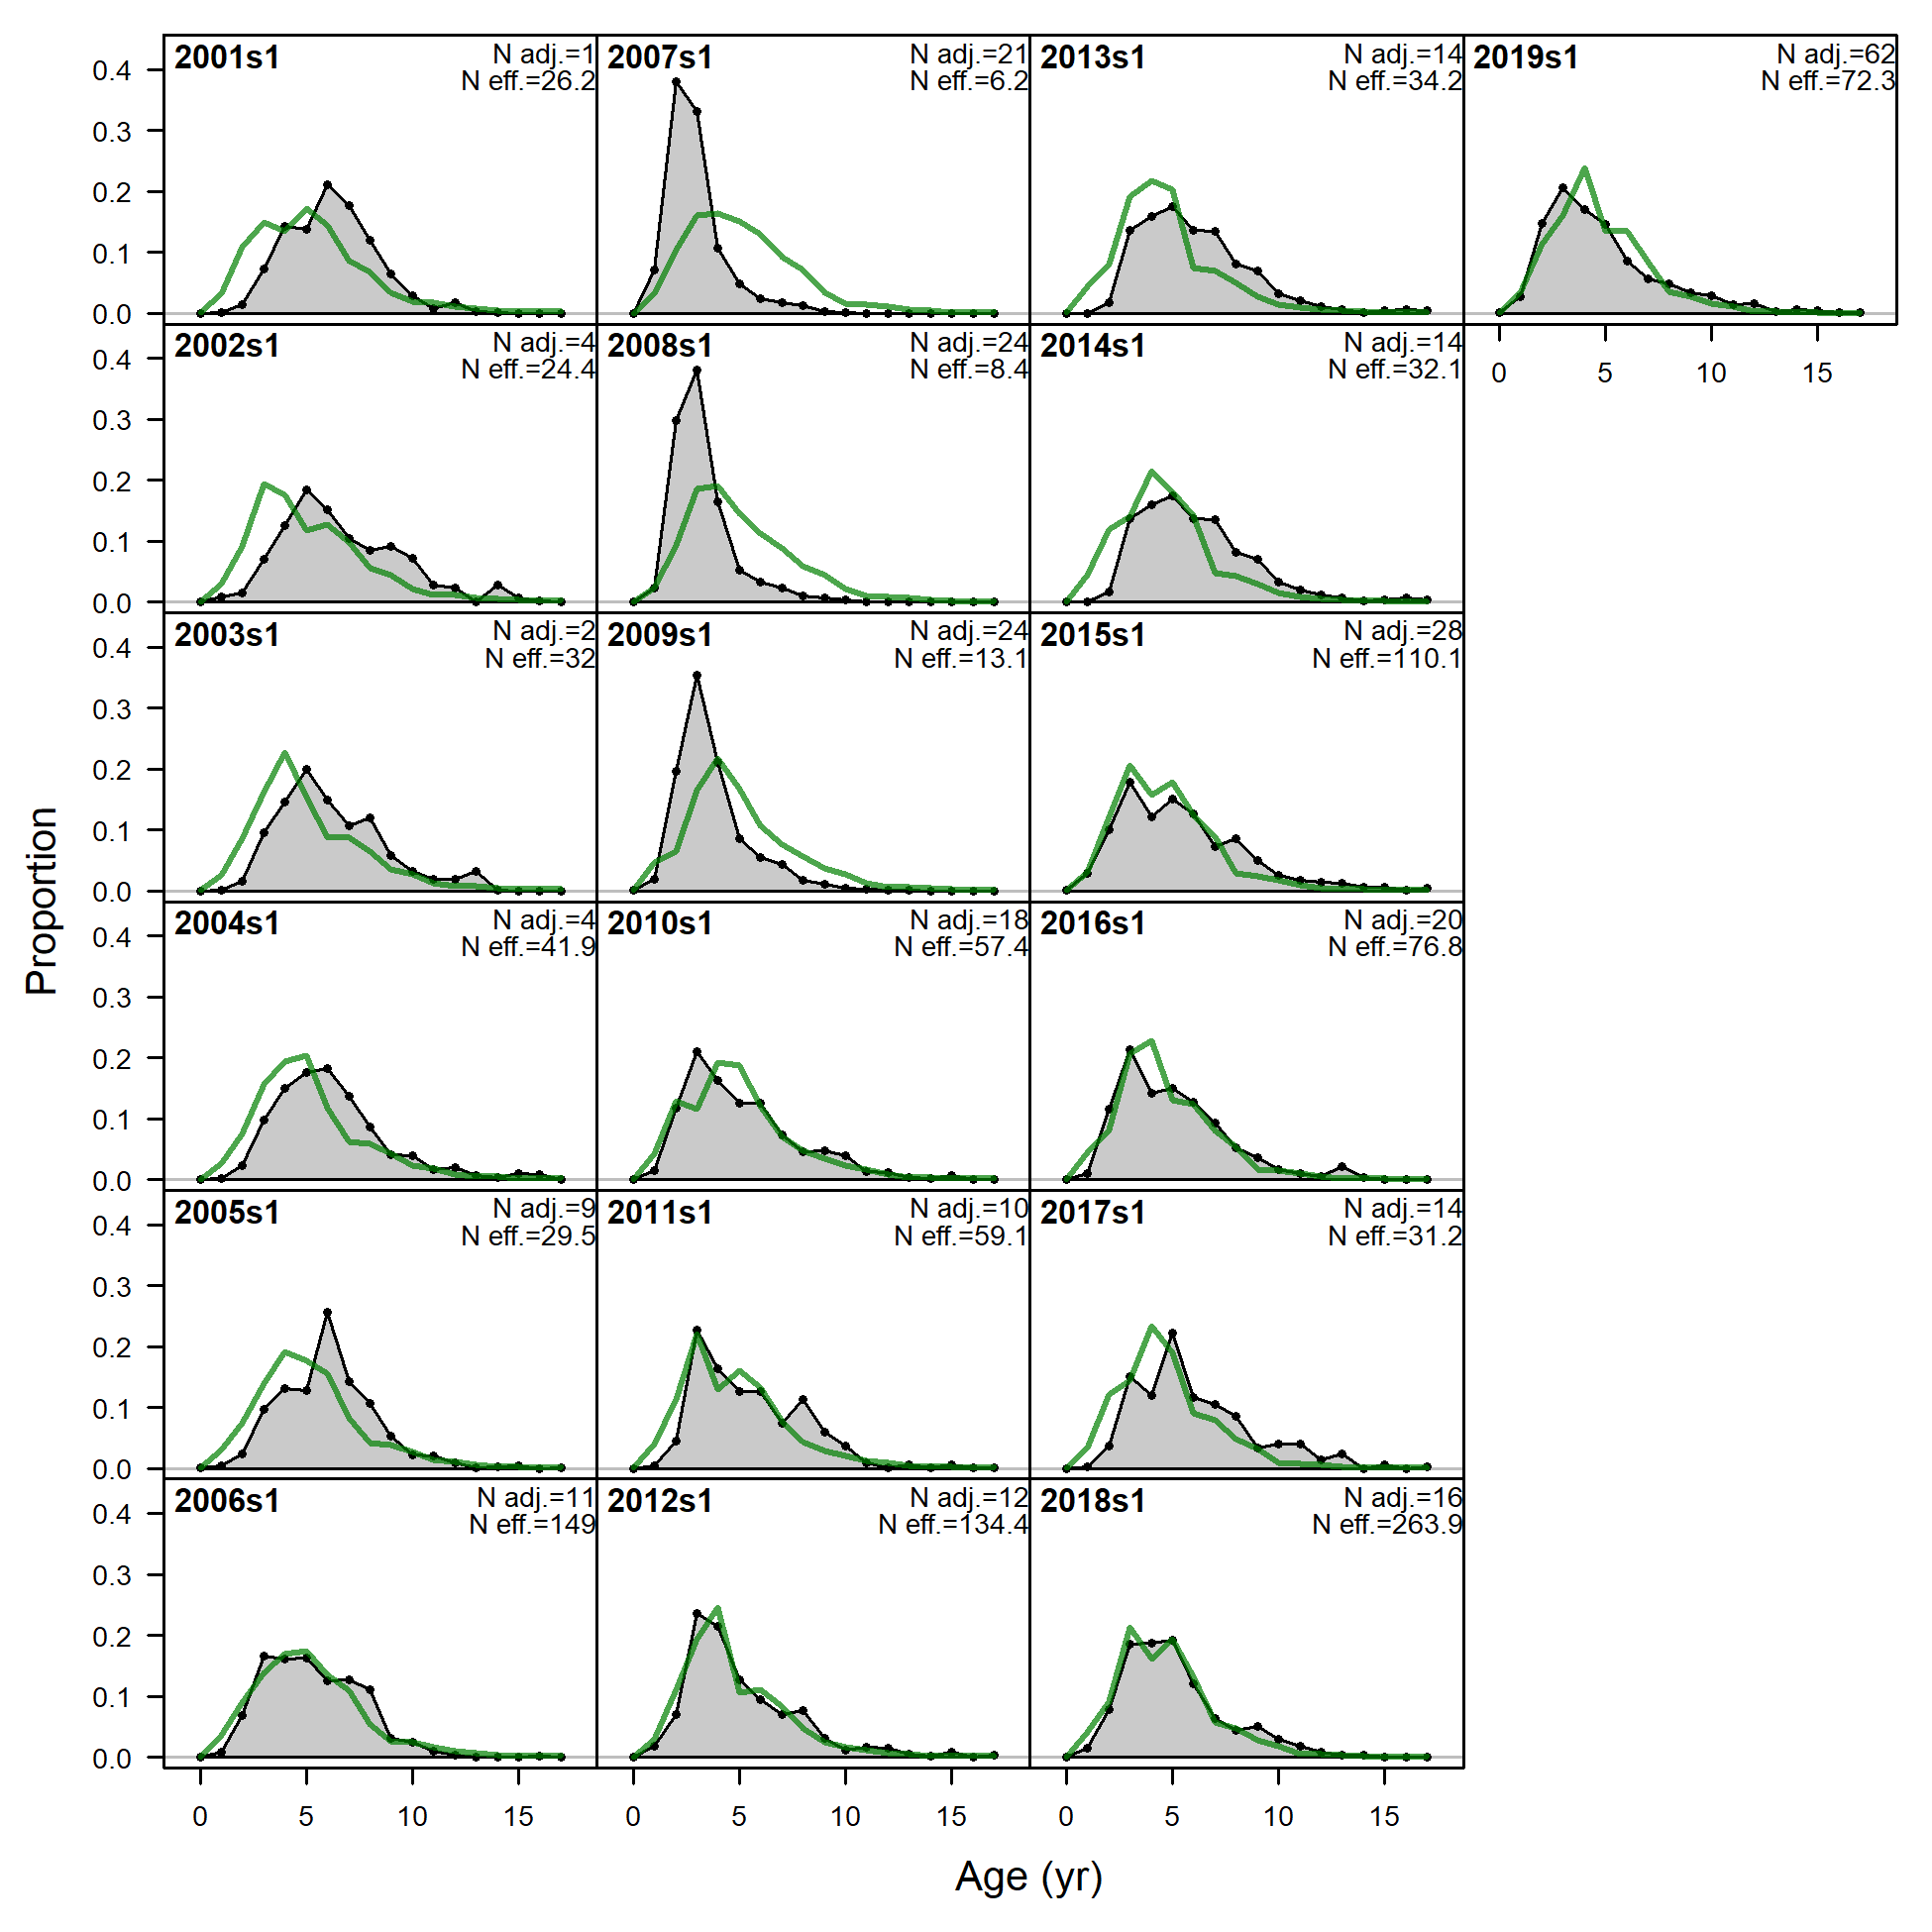
Age comps, aggregated across time by fleet.
Labels 'retained' and 'discard' indicate discarded or retained sampled for each fleet. Panels without this designation represent the whole catch.
file: comp_agefit__aggregated_across_time.png
Age comps, aggregated across time by fleet.
Labels 'retained' and 'discard' indicate discarded or retained sampled for each fleet. Panels without this designation represent the whole catch.
file: comp_agefit__aggregated_across_time.png

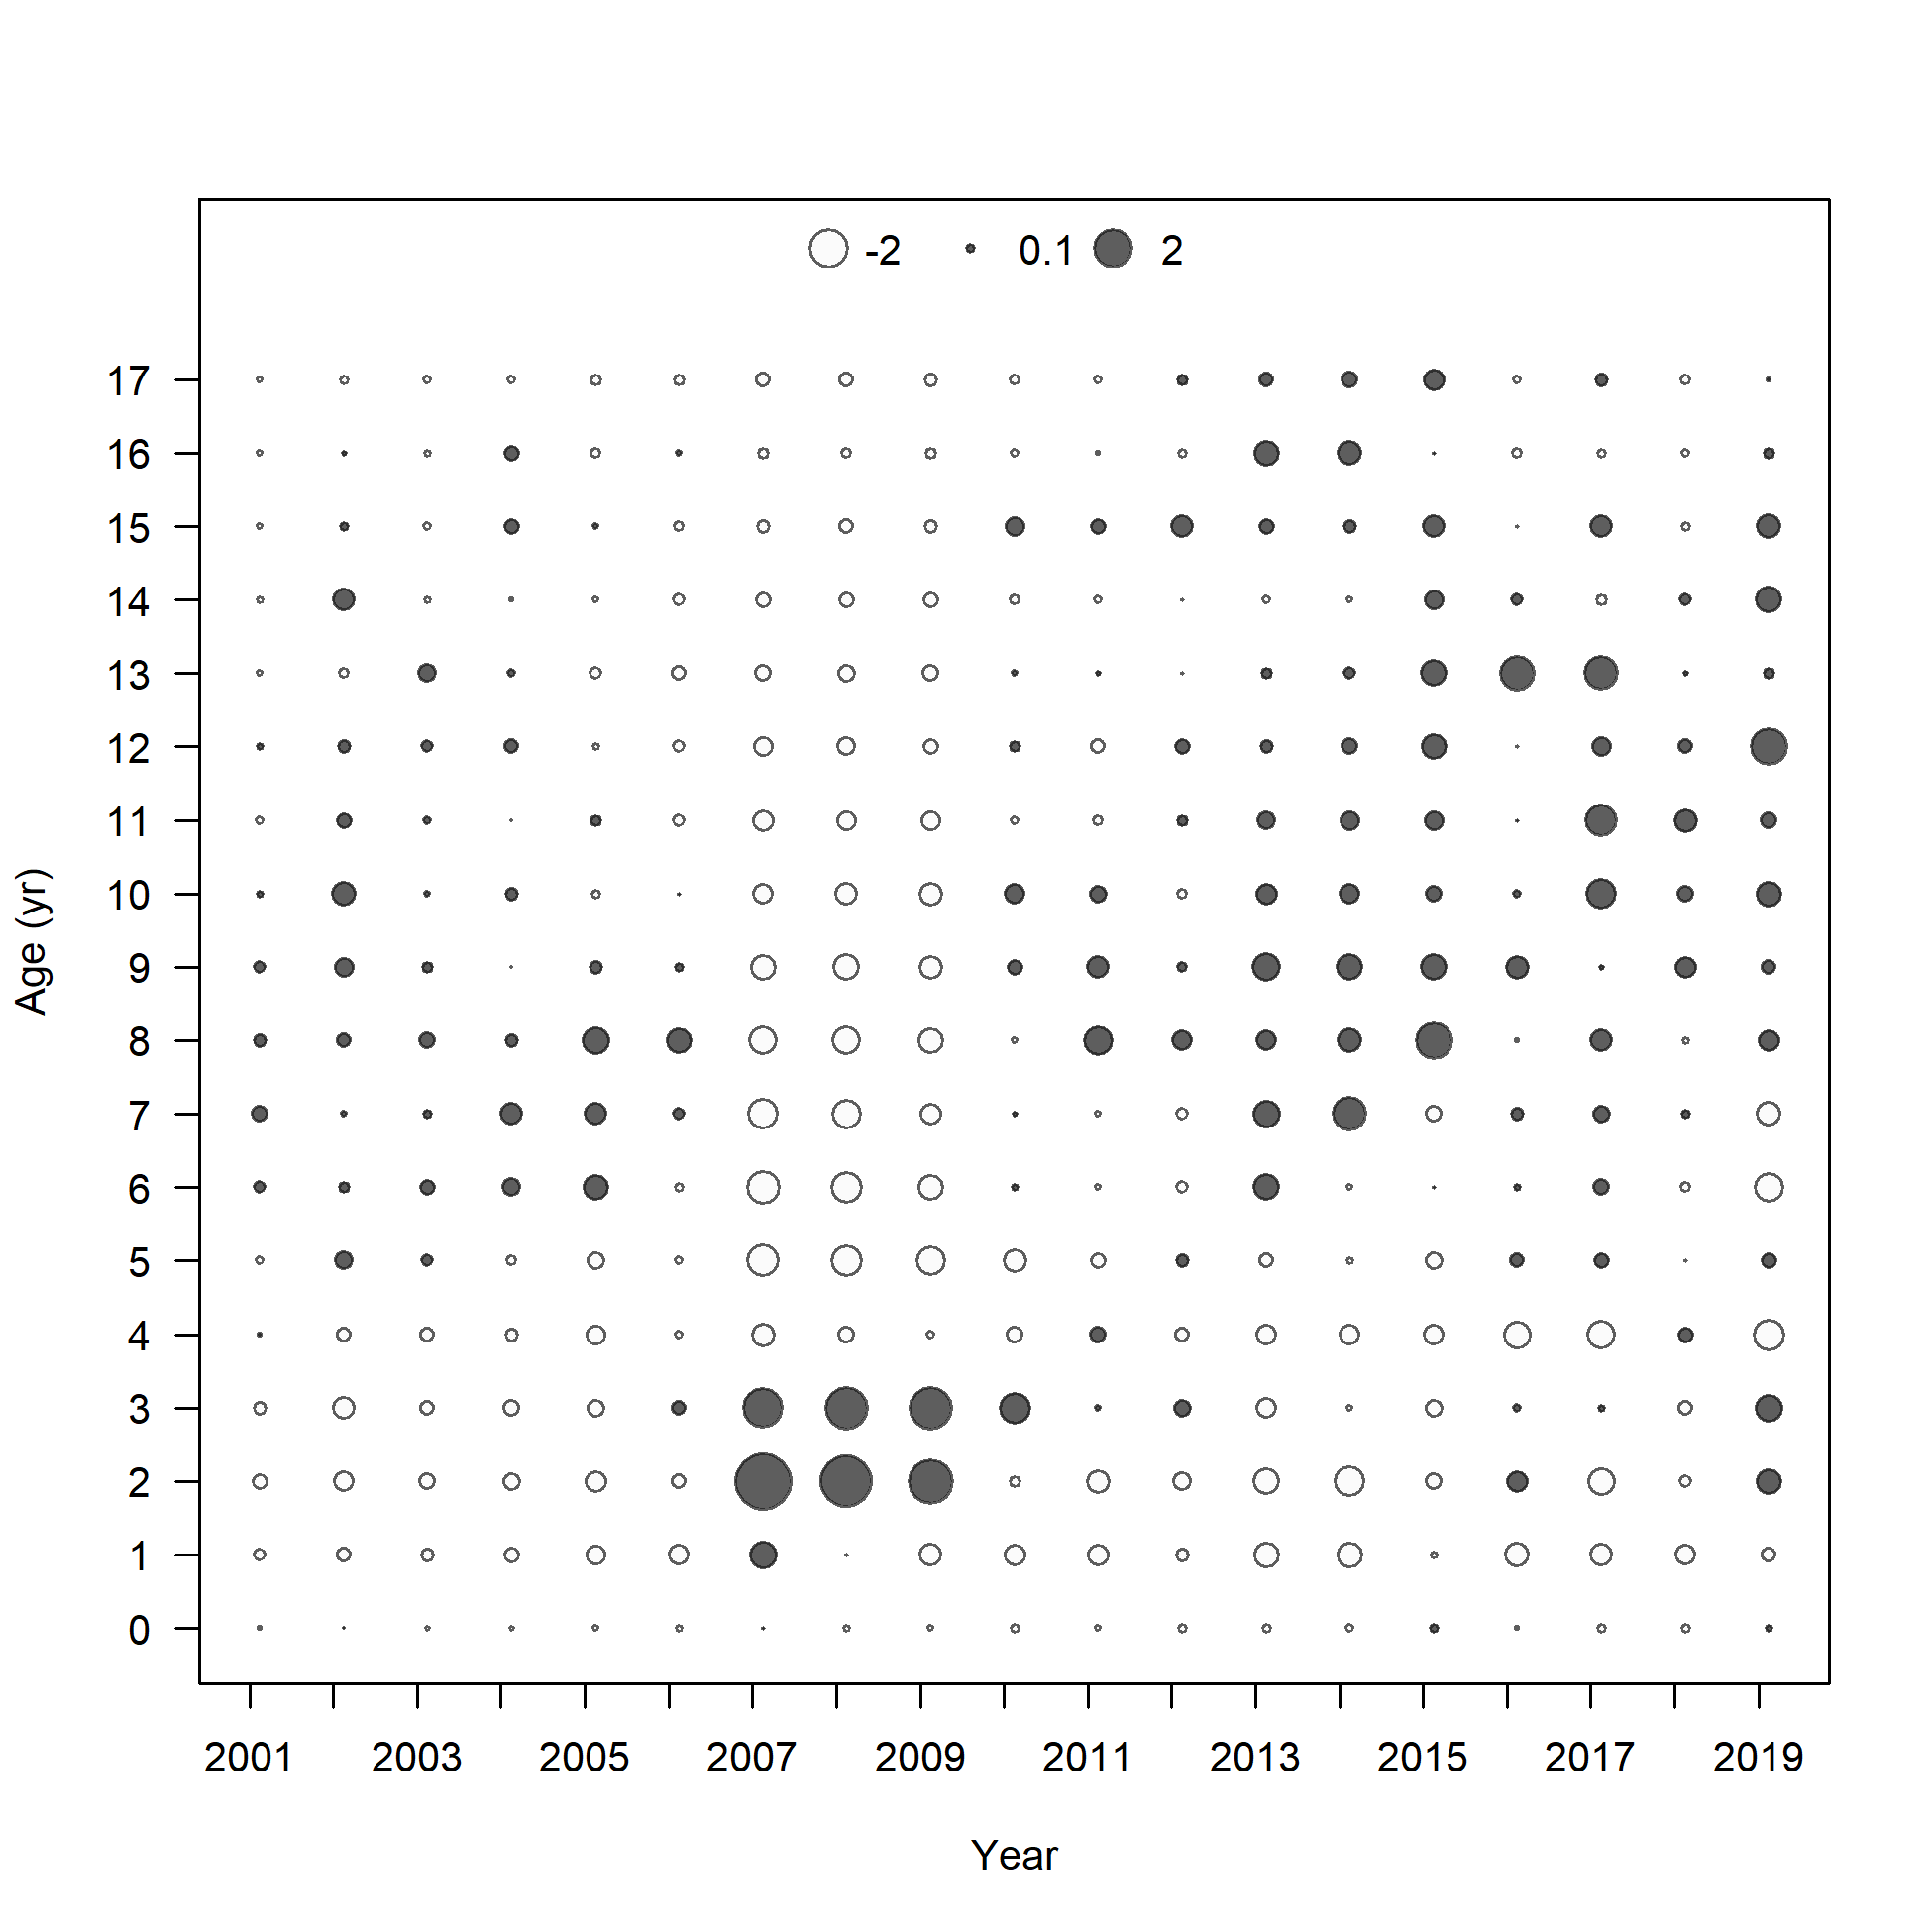
Pearson residuals, comparing across fleets
Closed bubbles are positive residuals (observed > expected) and open bubbles are negative residuals (observed < expected).
file: comp_agefit__multi-fleet_comparison.png
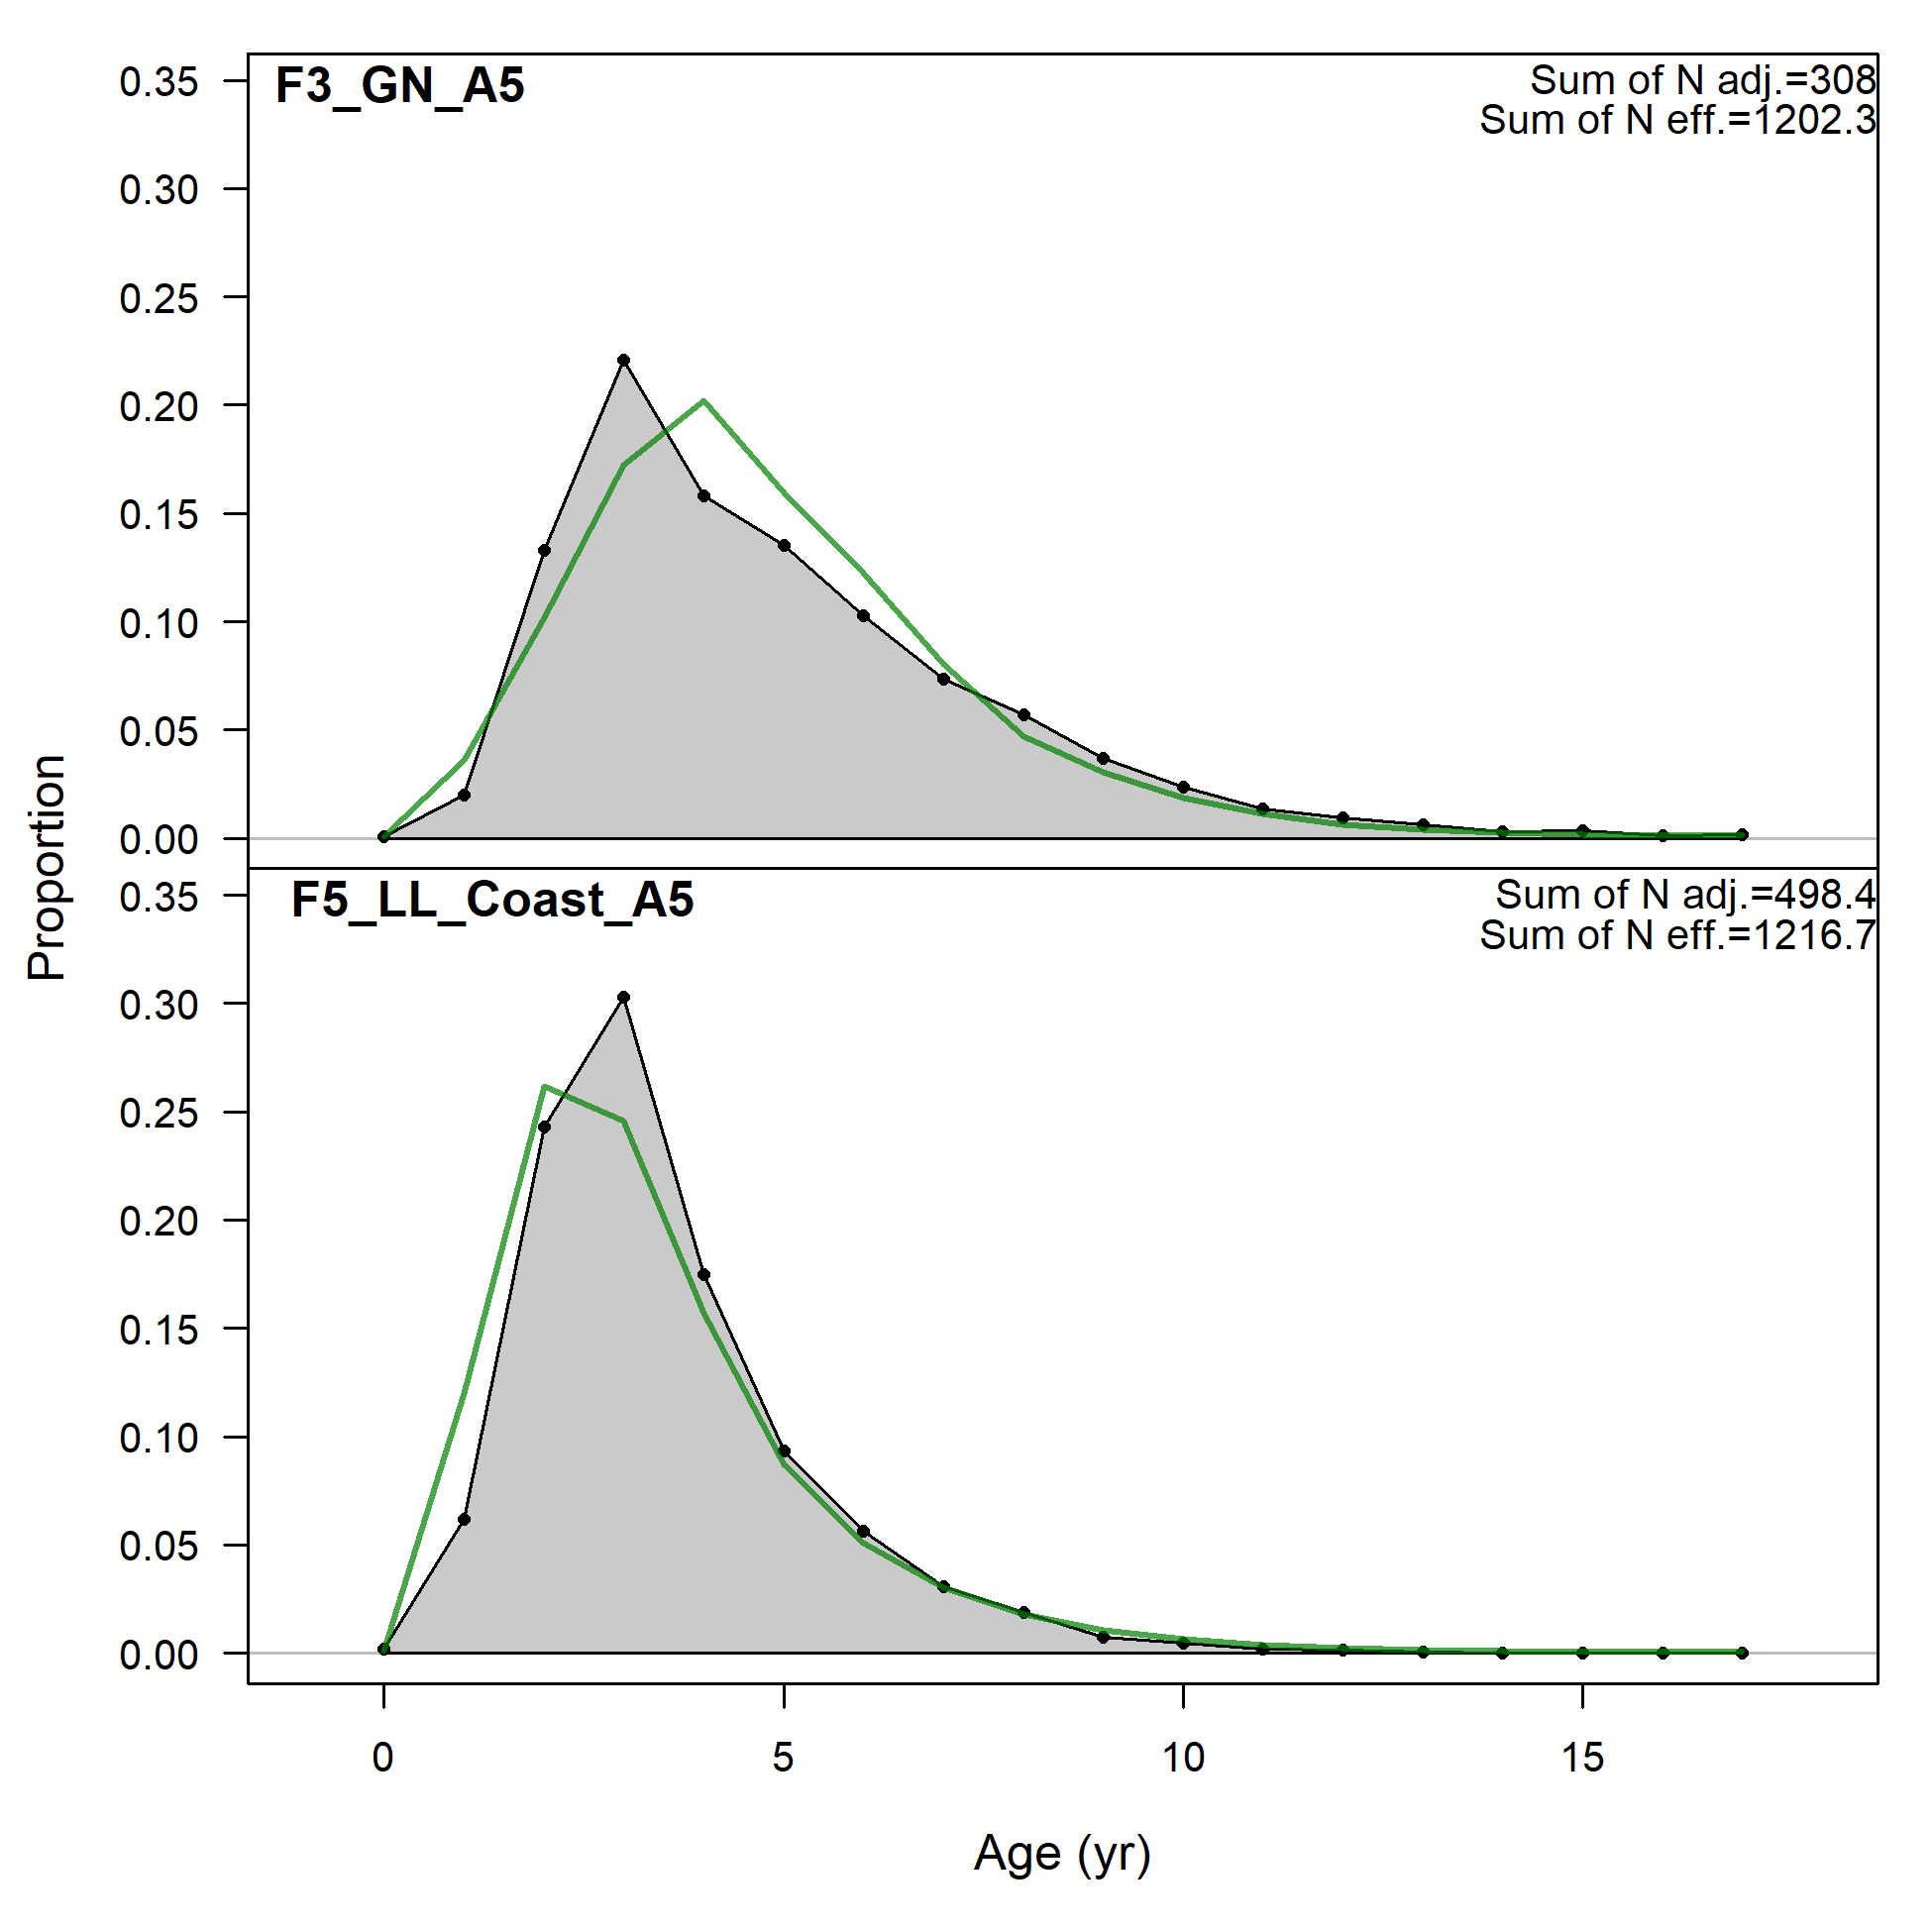
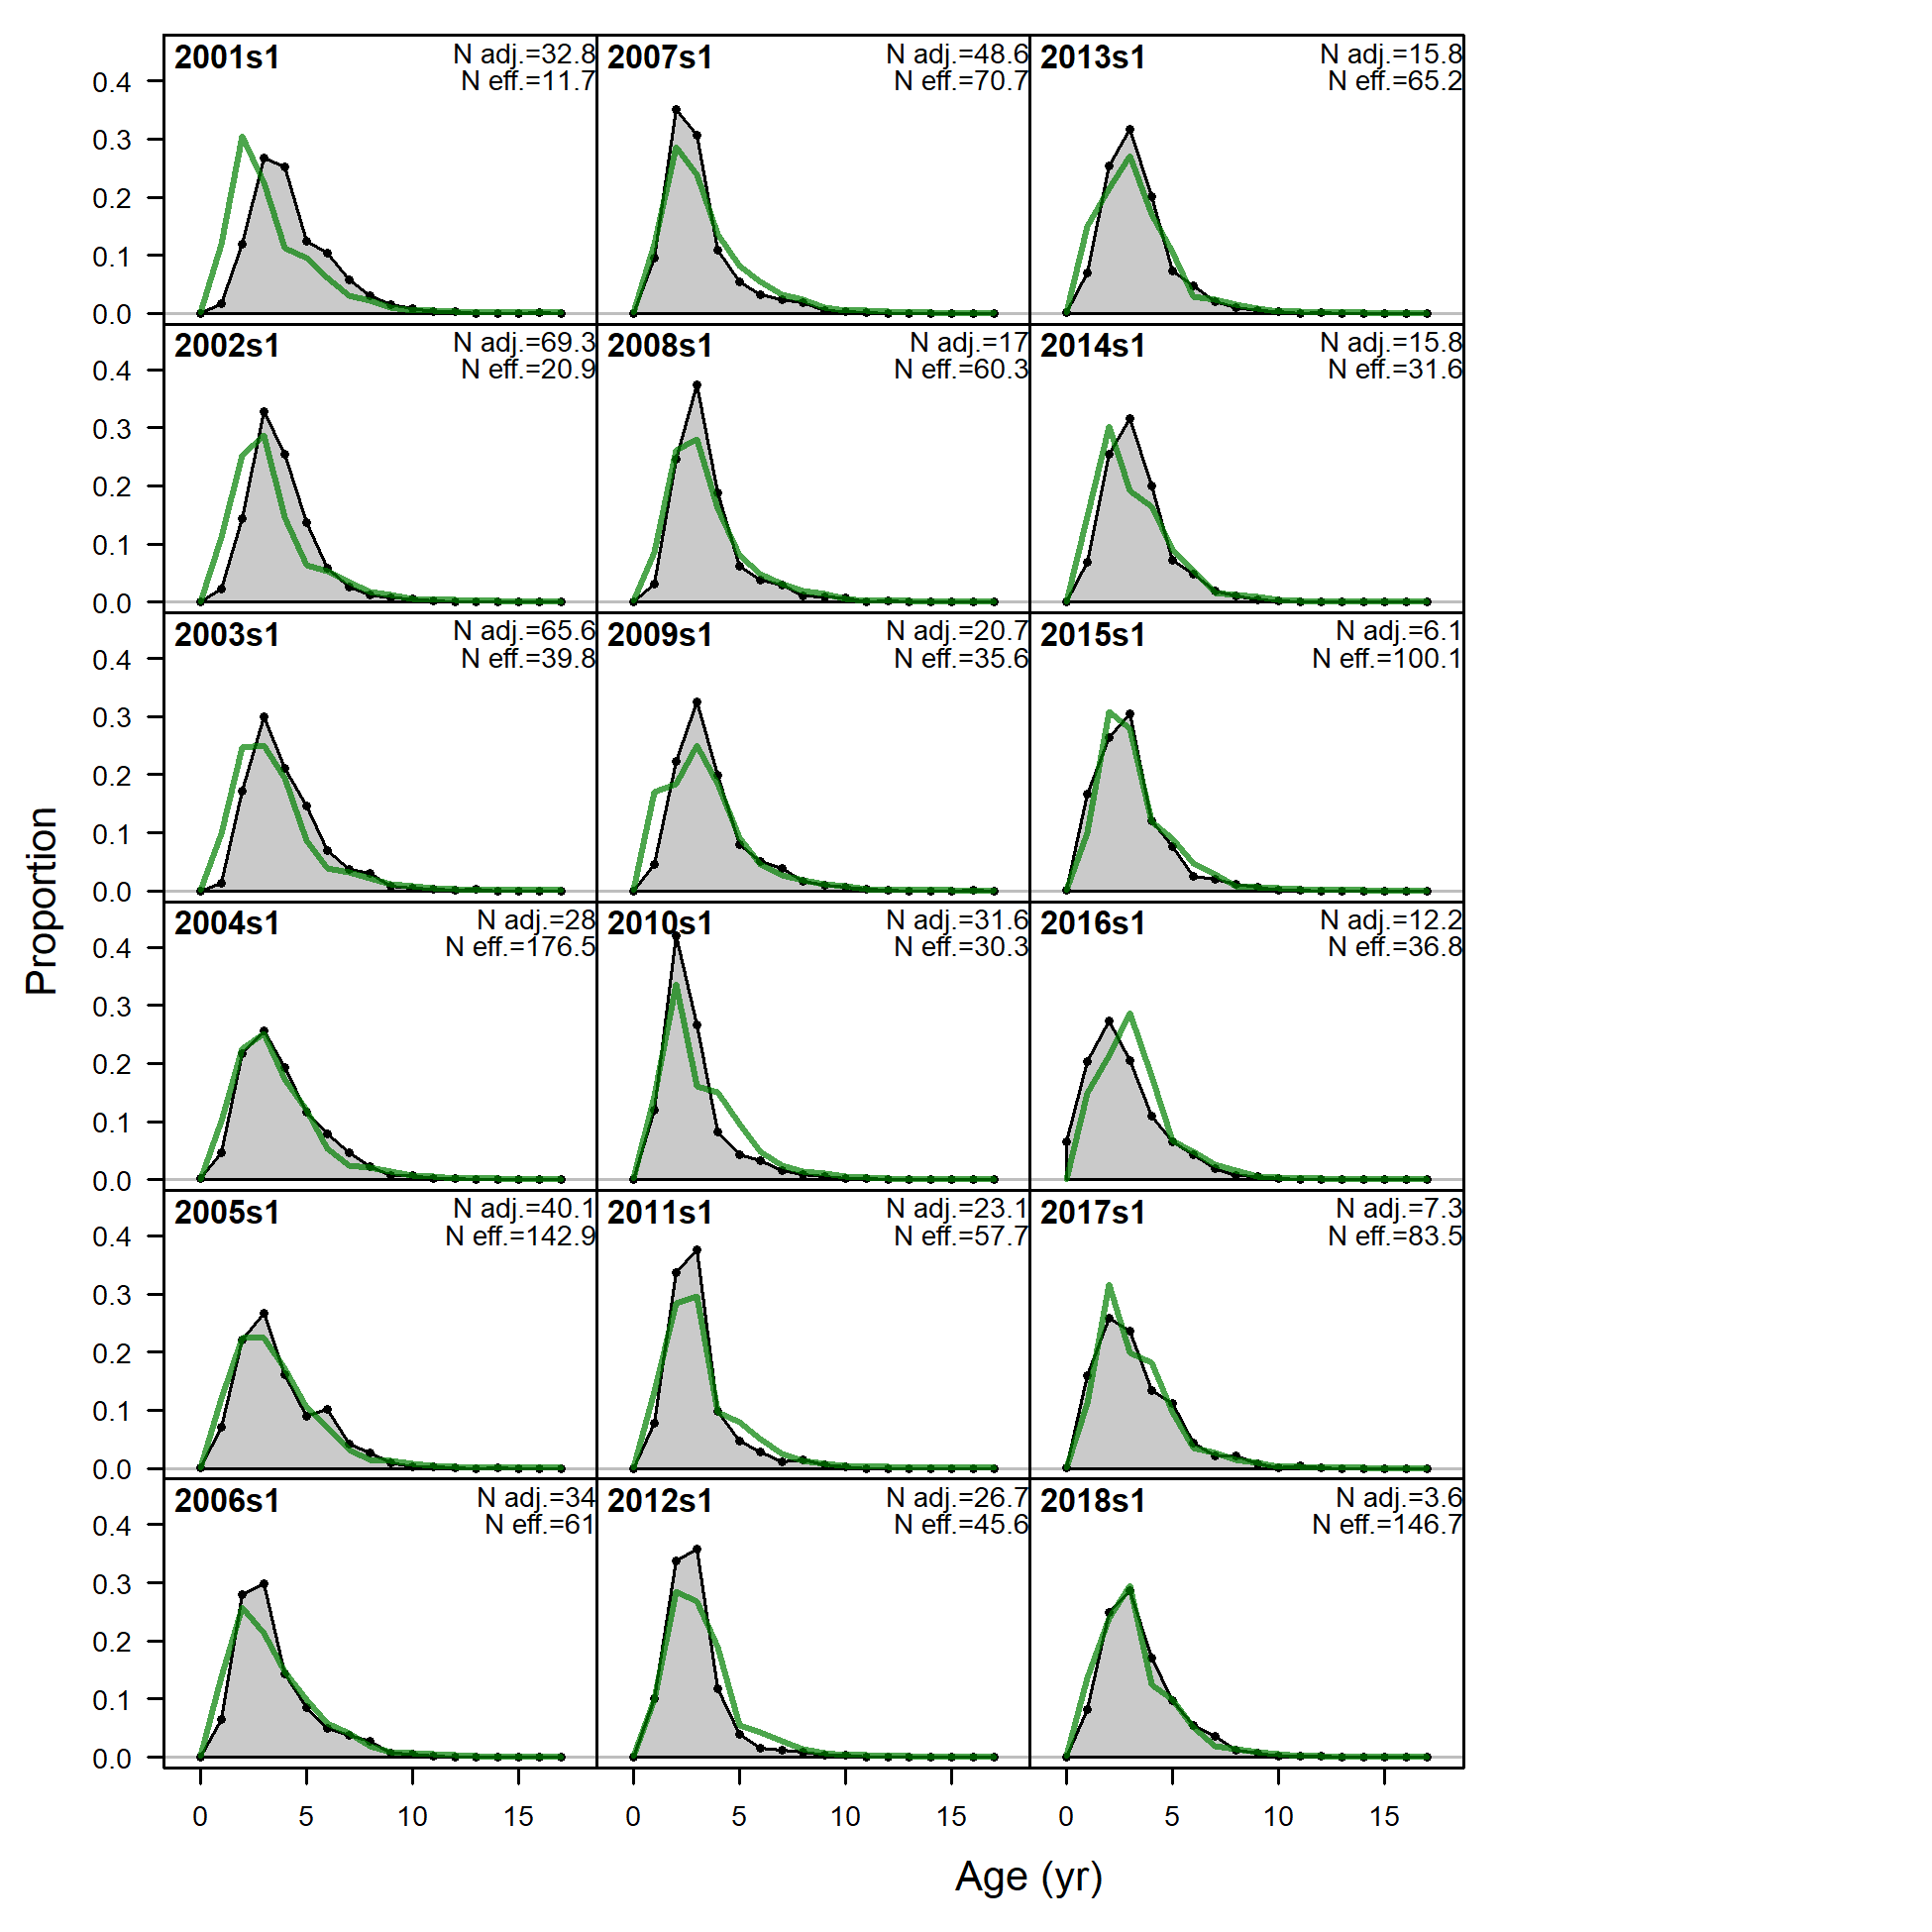
Age comps, whole catch, F3_GN_A5.
'N adj.' is the input sample size after data-weighting adjustment. N eff. is the calculated effective sample size used in the McAllister-Ianelli tuning method.
file: comp_agefit_flt3mkt0.png
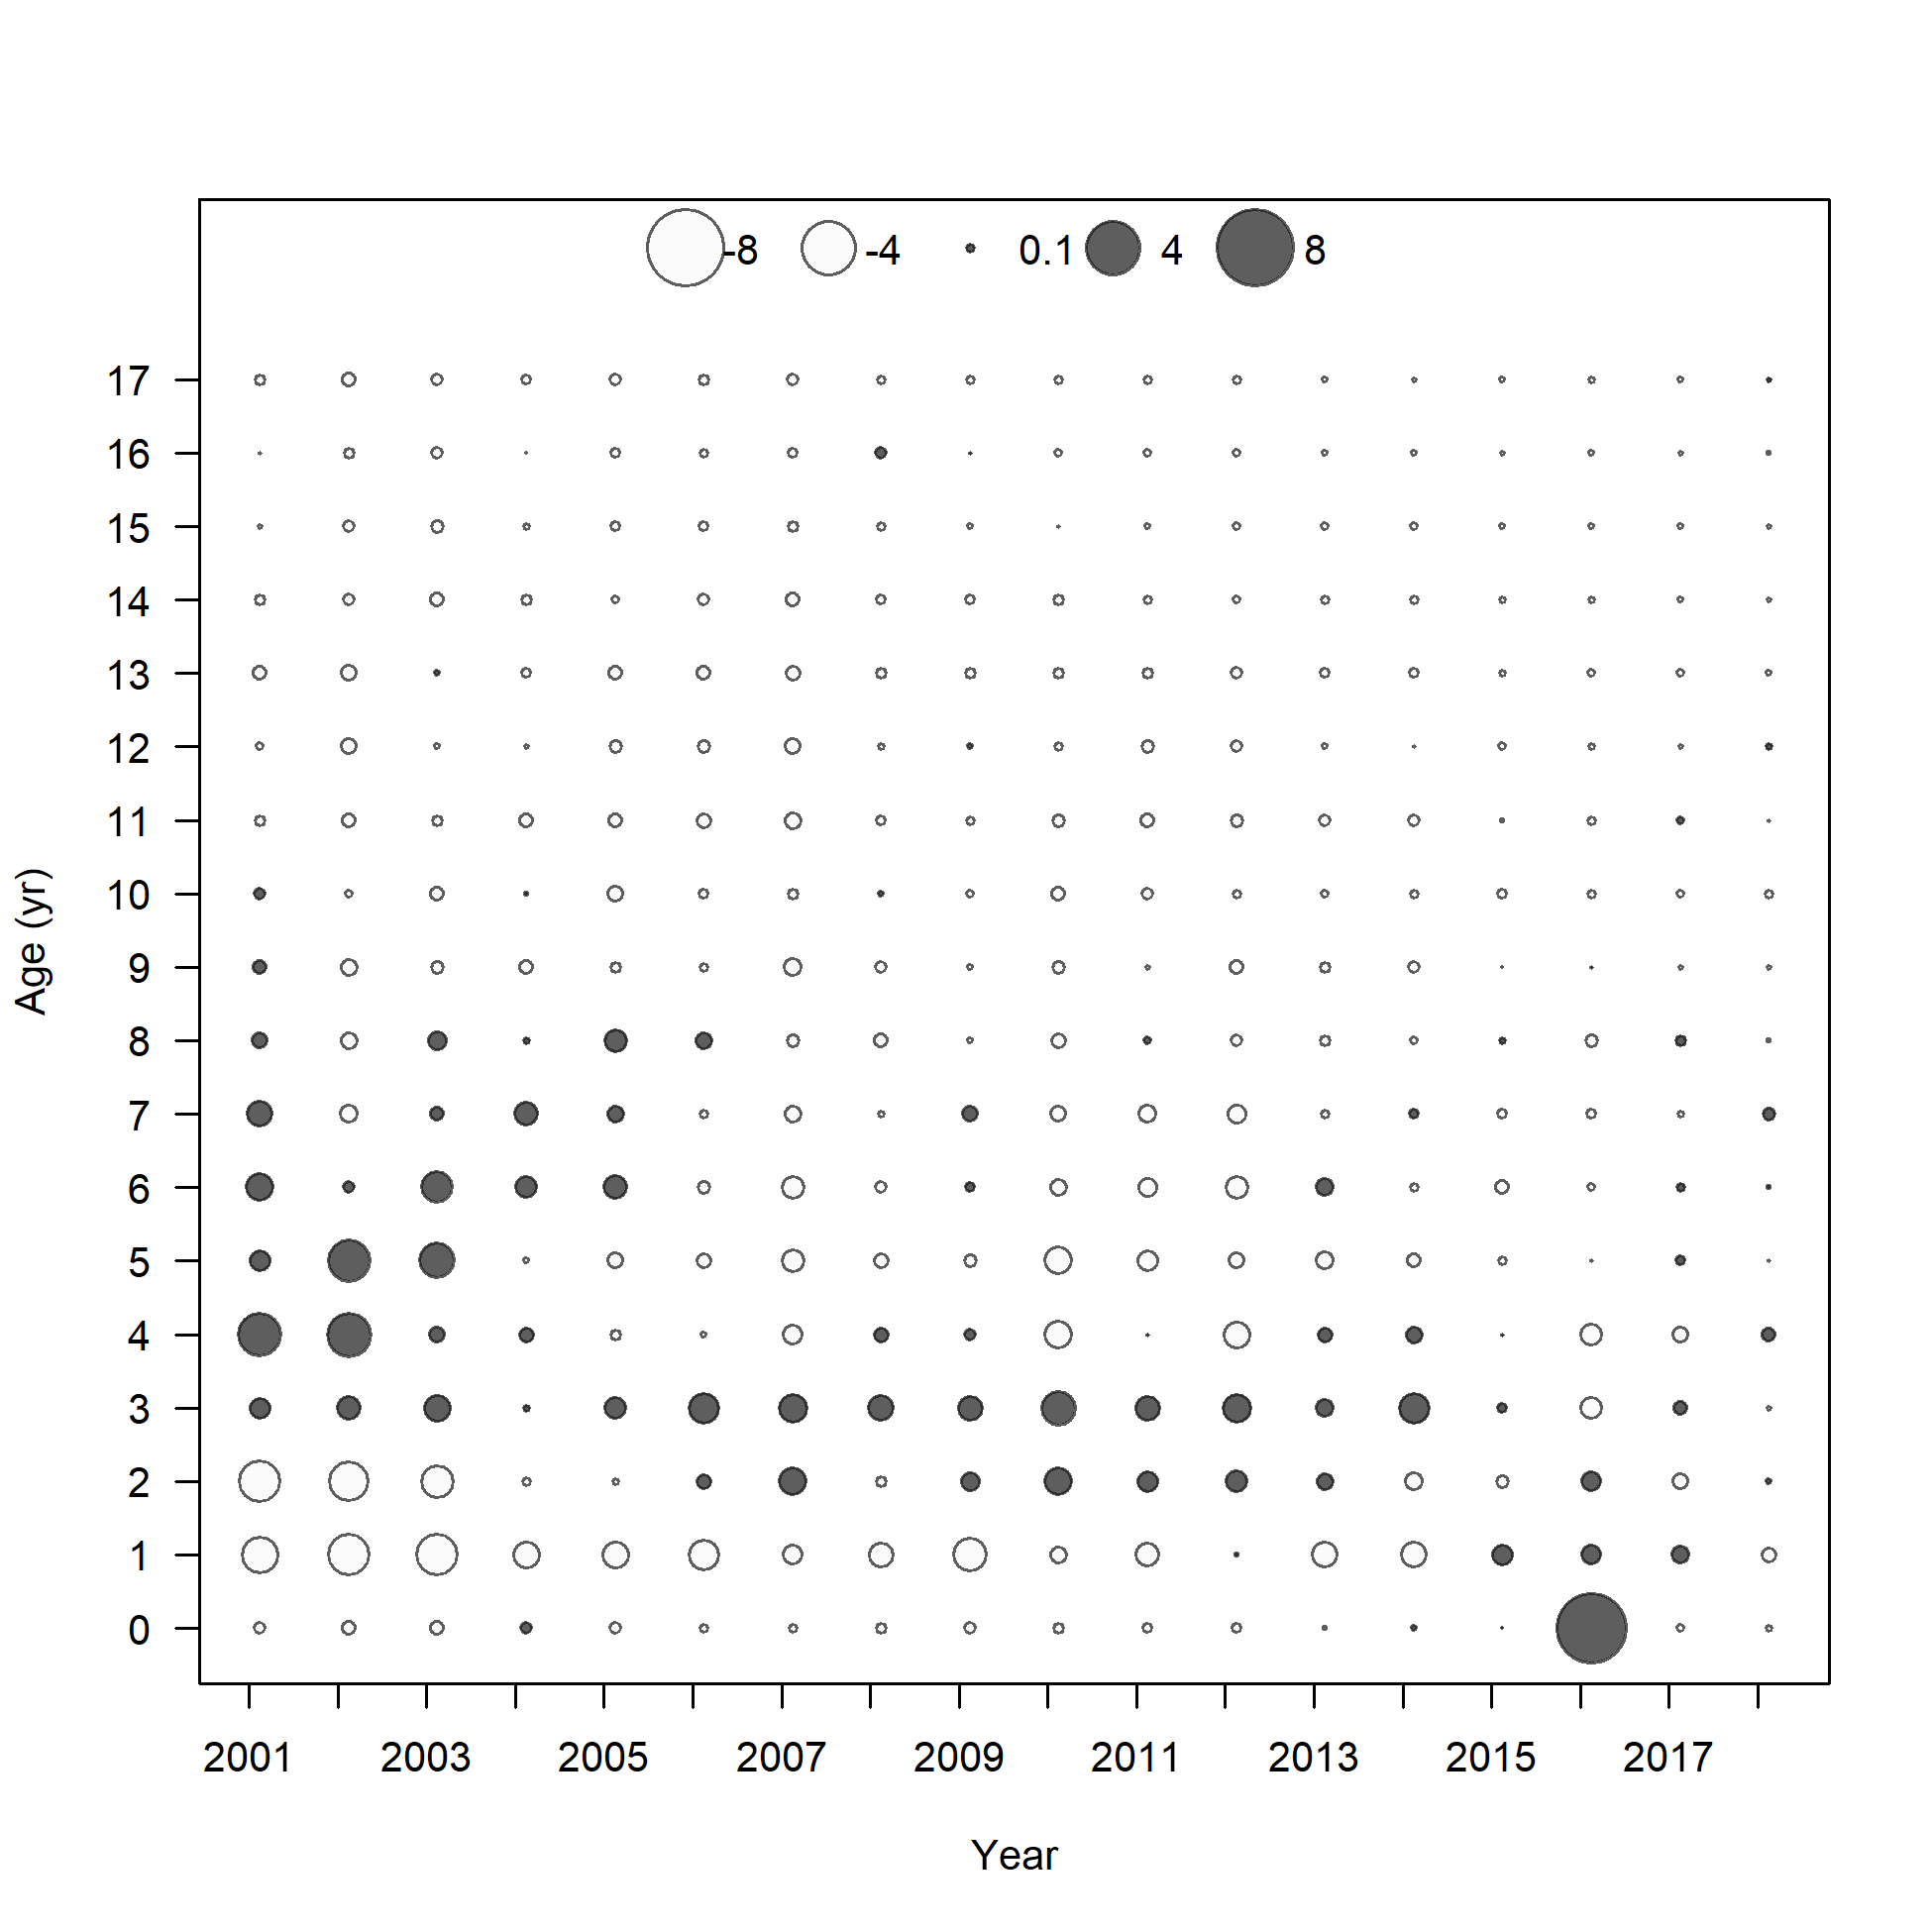
Pearson residuals, whole catch, F3_GN_A5 (max=4.17)
Closed bubbles are positive residuals (observed > expected) and open bubbles are negative residuals (observed < expected).
file: comp_agefit_residsflt3mkt0.png
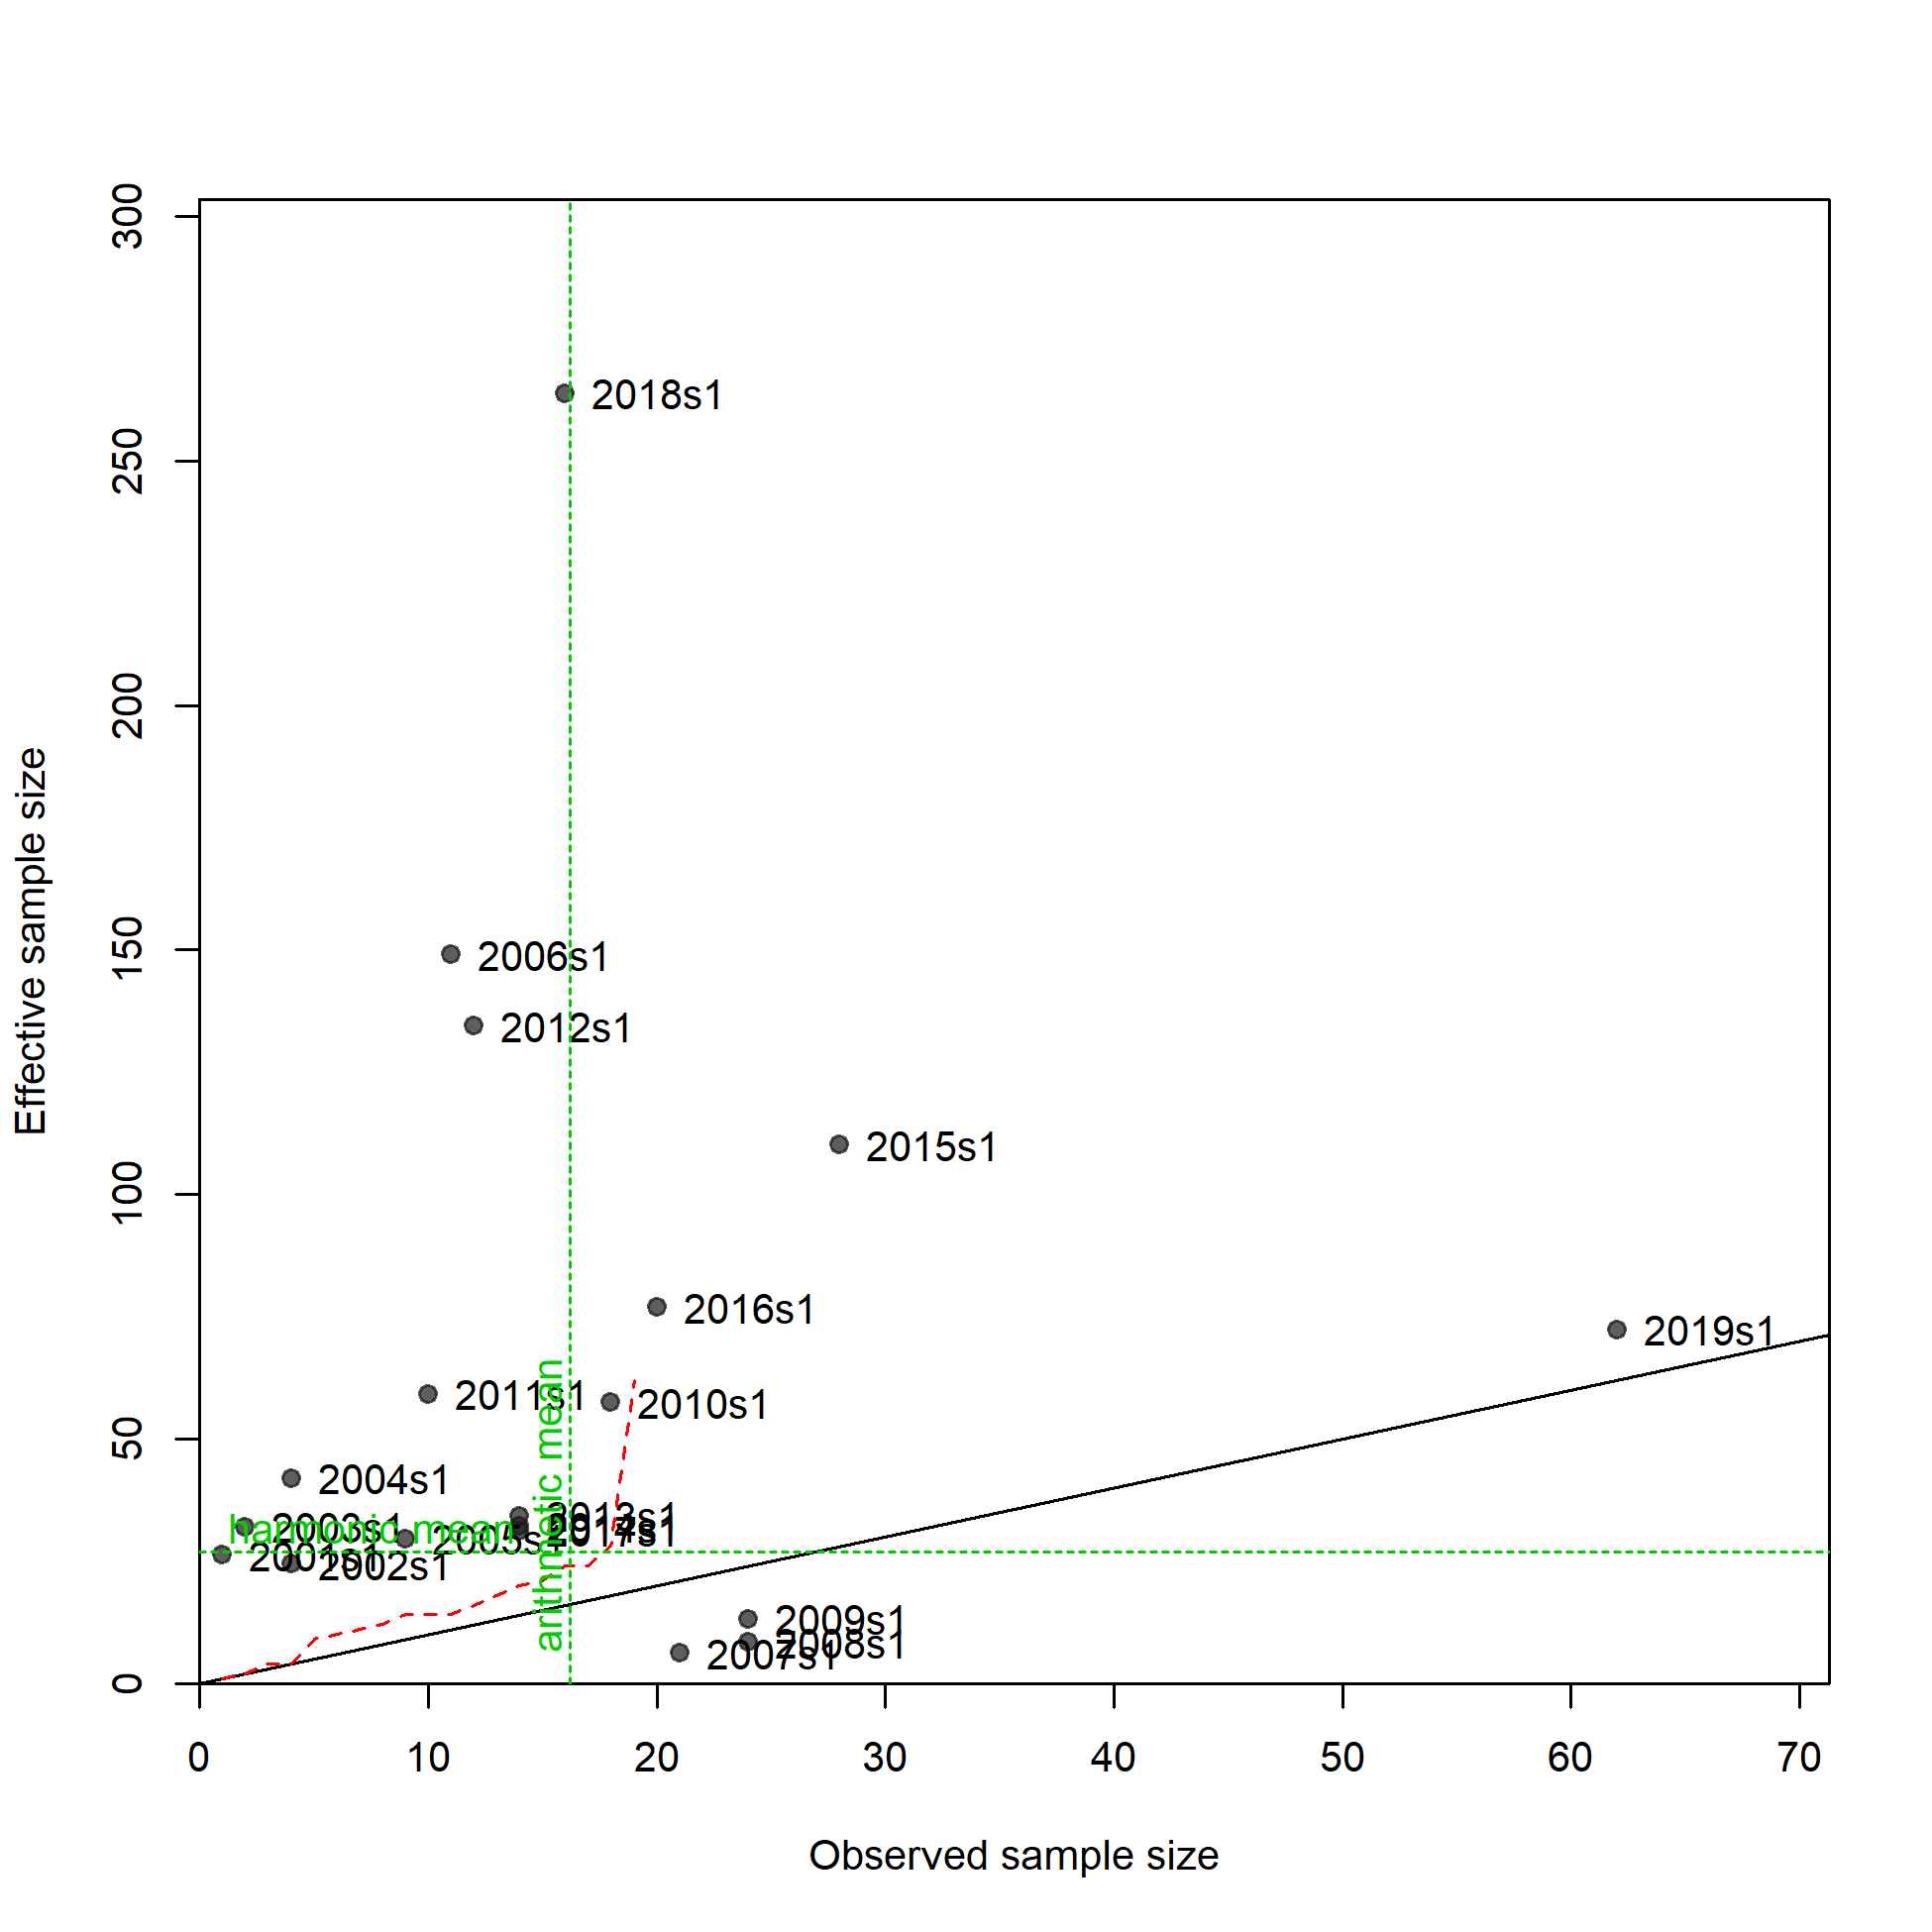
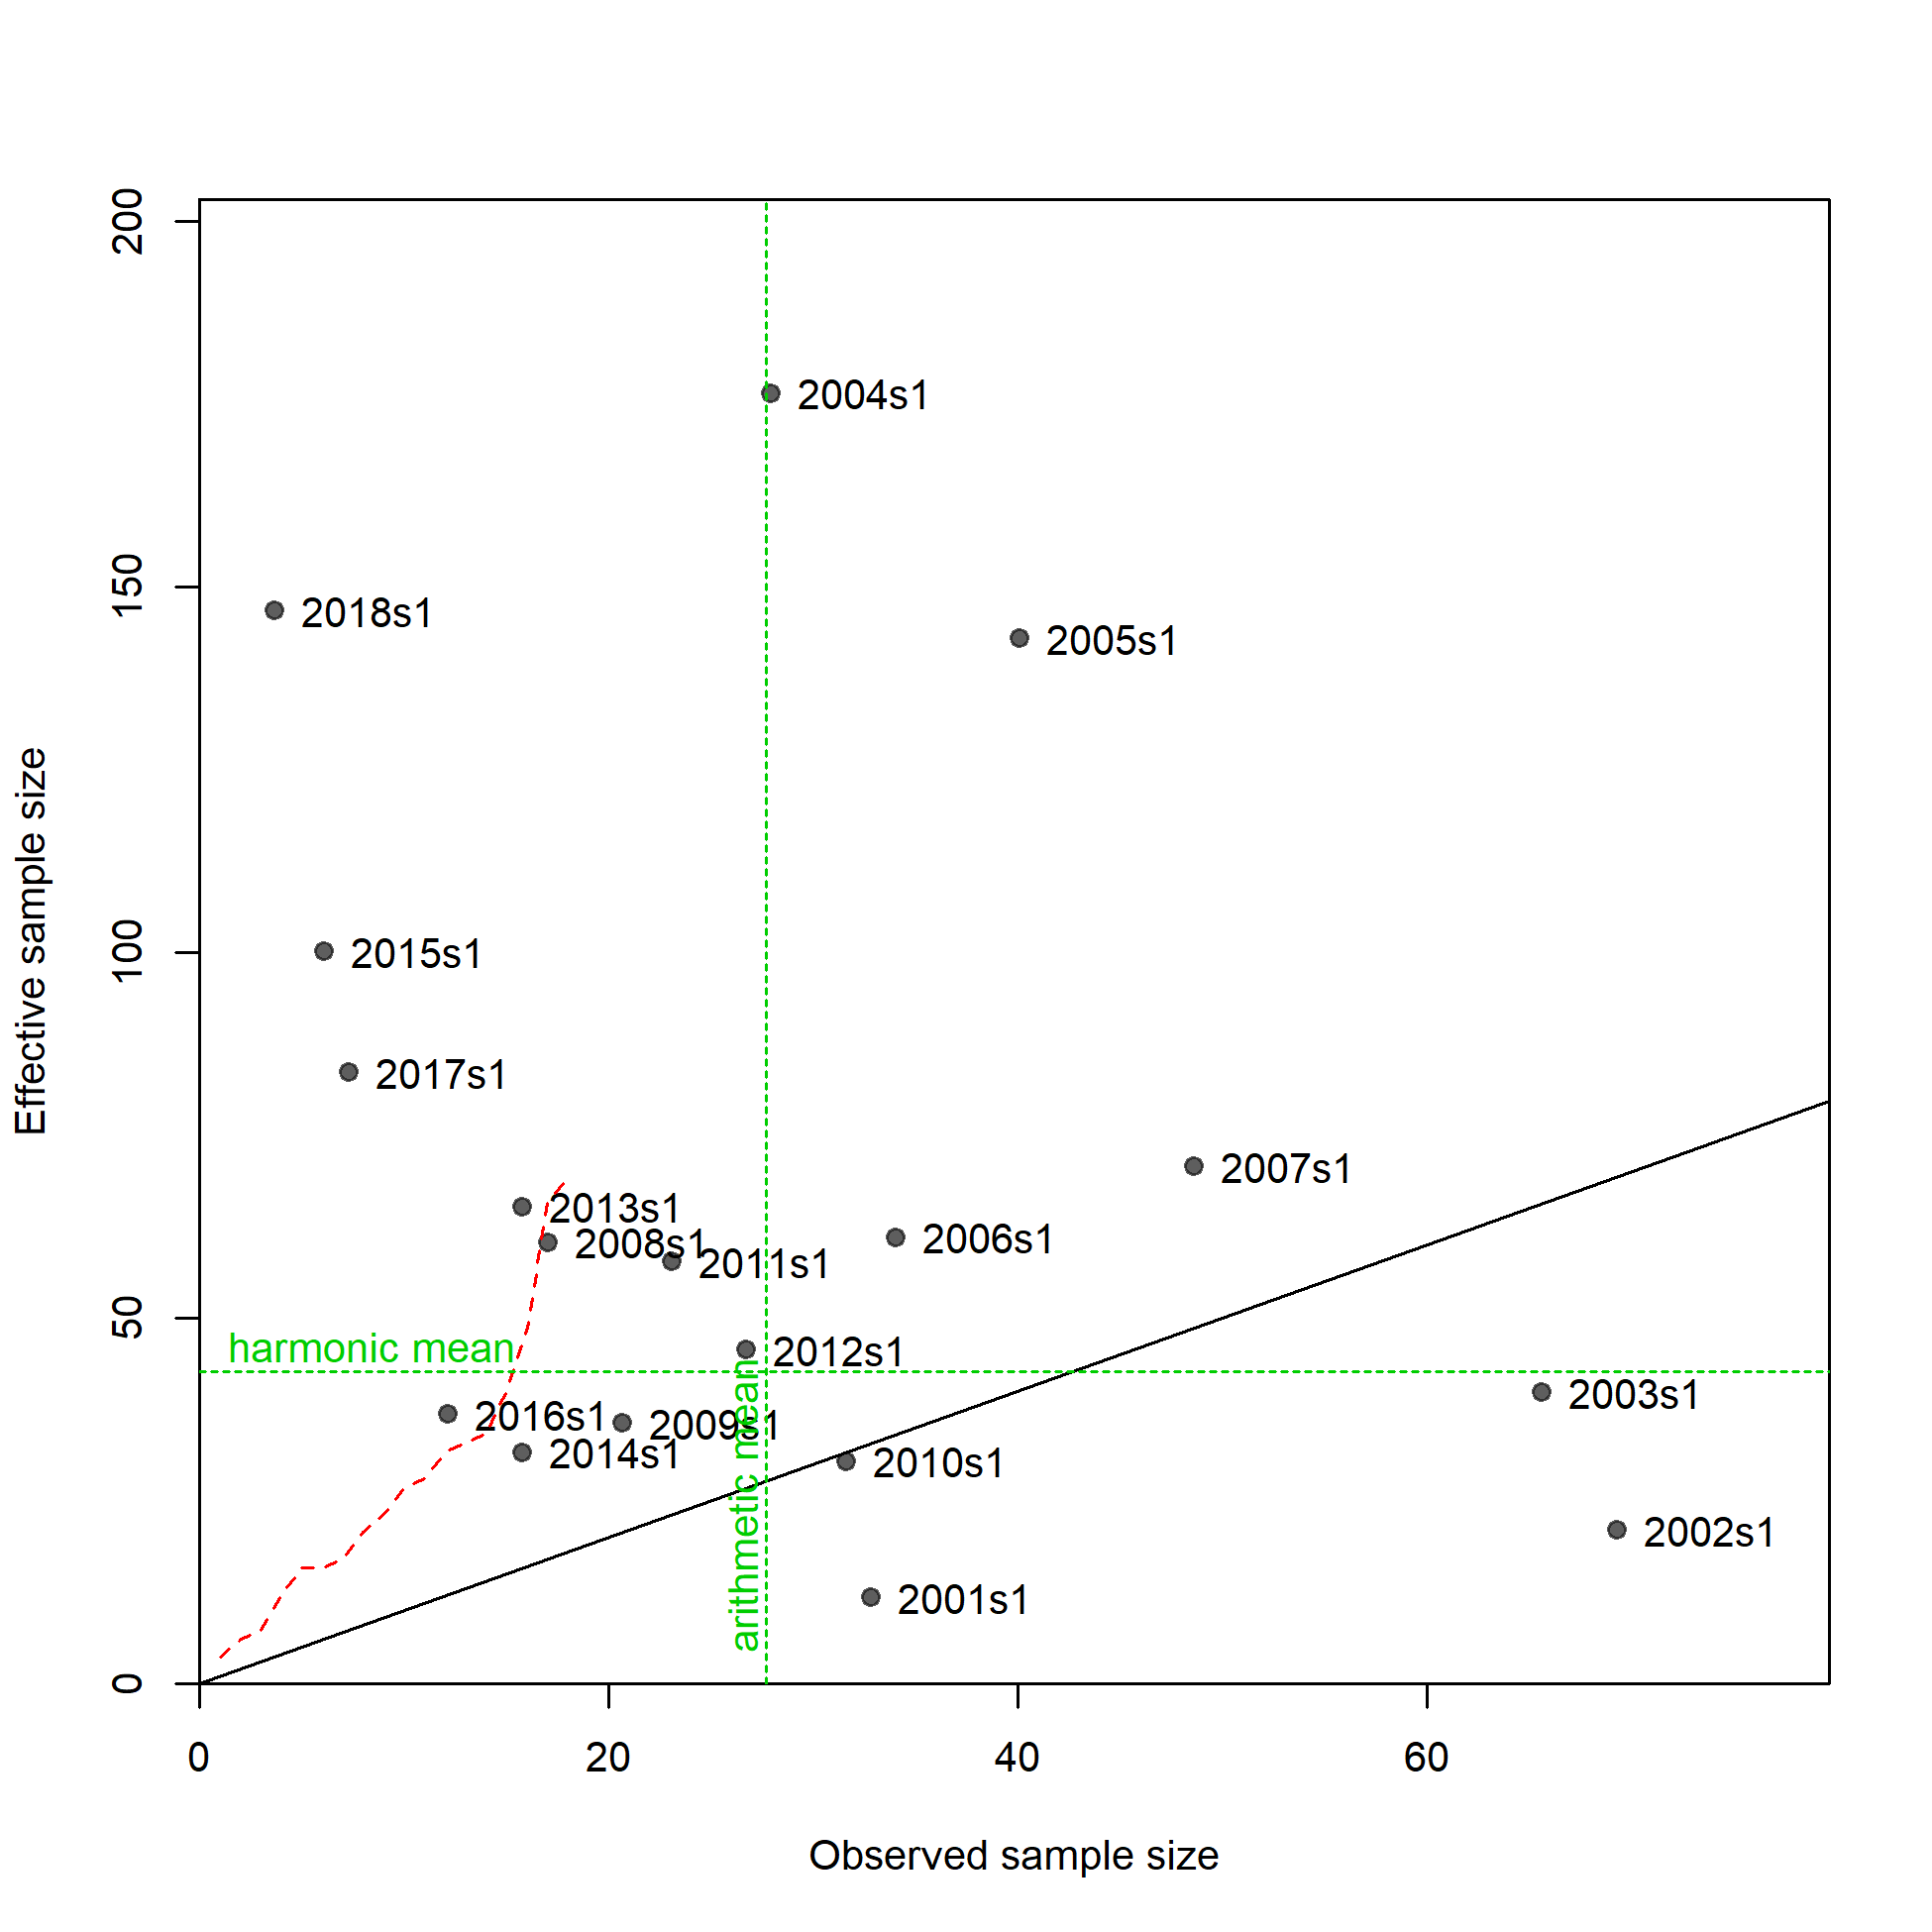
N-EffN comparison, Age comps, whole catch, F3_GN_A5
file: comp_agefit_sampsize_flt3mkt0.png
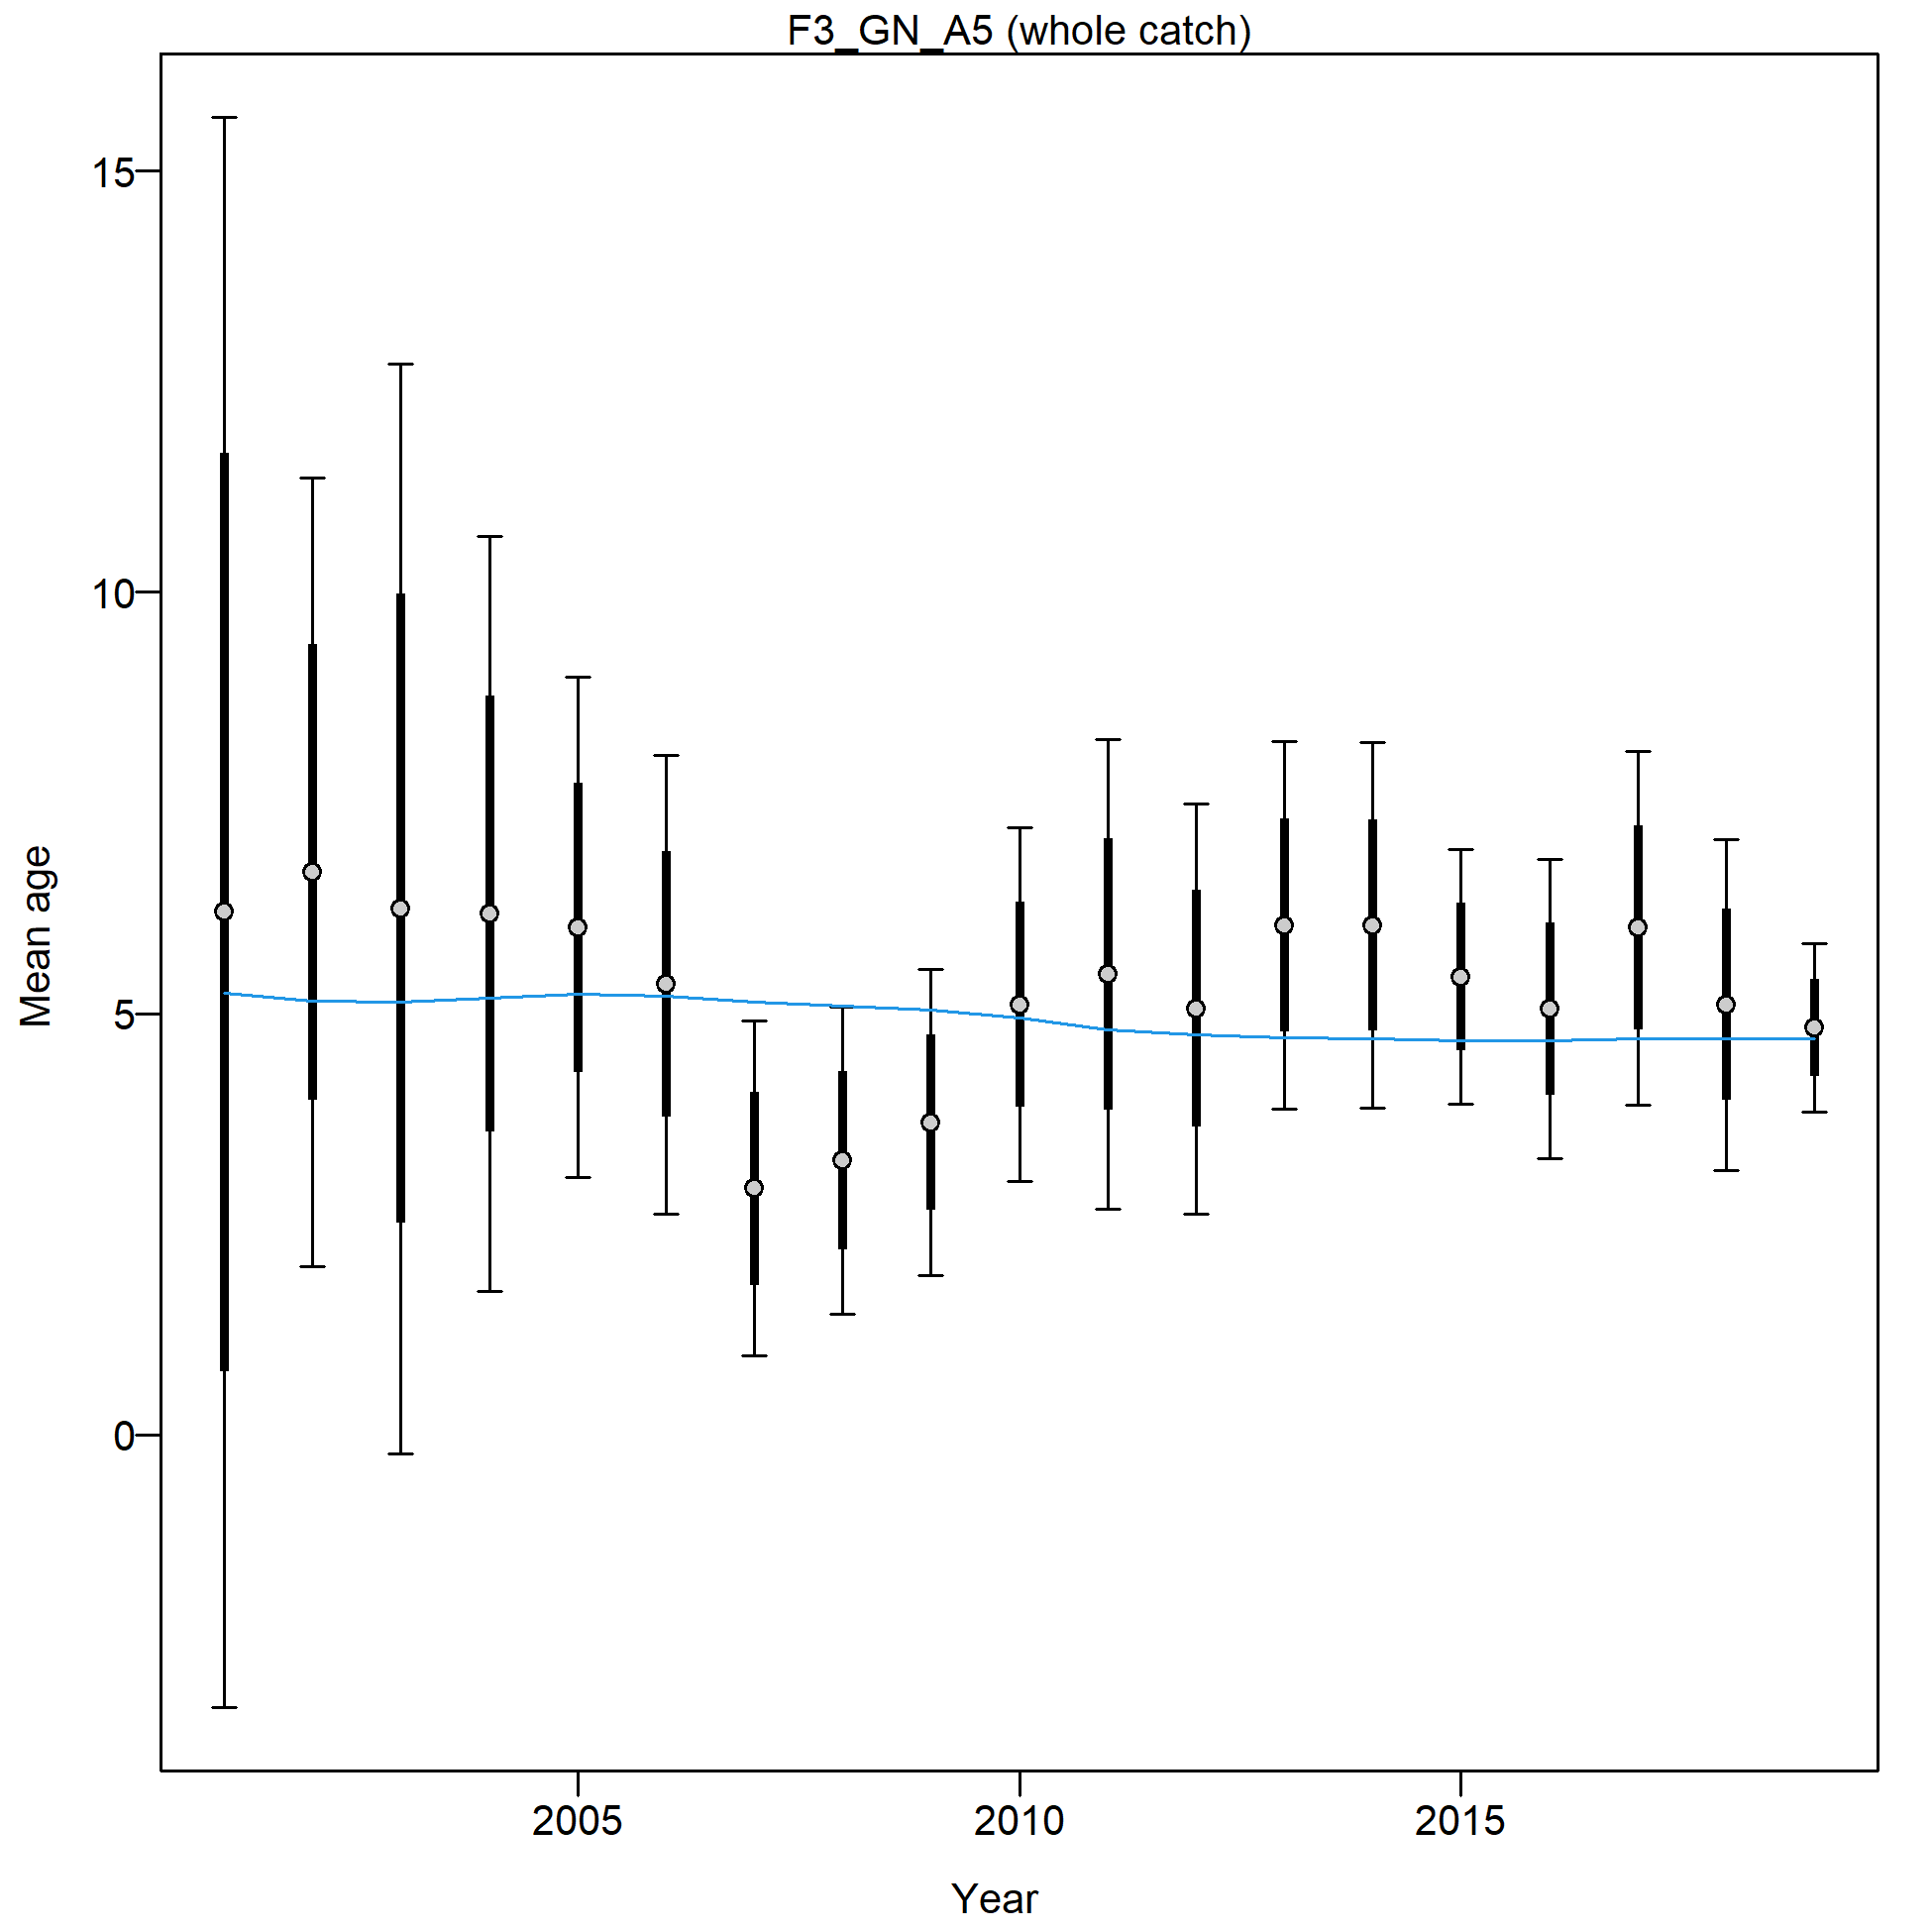
Mean age for F3_GN_A5 with 95% confidence intervals based on current samples sizes.
Francis data weighting method TA1.8: thinner intervals (with capped ends) show result of further adjusting sample sizes based on suggested multiplier (with 95% interval) for age data from F3_GN_A5:
0.3336 (0.1978-1.9441)
For more info, see
Francis, R.I.C.C. (2011). Data weighting in statistical fisheries stock assessment models. Can. J. Fish. Aquat. Sci. 68: 1124-1138. https://doi.org/10.1139/f2011-025
Age comps, whole catch, F5_LL_Coast_A5.
'N adj.' is the input sample size after data-weighting adjustment. N eff. is the calculated effective sample size used in the McAllister-Ianelli tuning method.
file: comp_agefit_flt5mkt0.png
Pearson residuals, whole catch, F5_LL_Coast_A5 (max=6.58)
Closed bubbles are positive residuals (observed > expected) and open bubbles are negative residuals (observed < expected).
file: comp_agefit_residsflt5mkt0.png
N-EffN comparison, Age comps, whole catch, F5_LL_Coast_A5
file: comp_agefit_sampsize_flt5mkt0.png
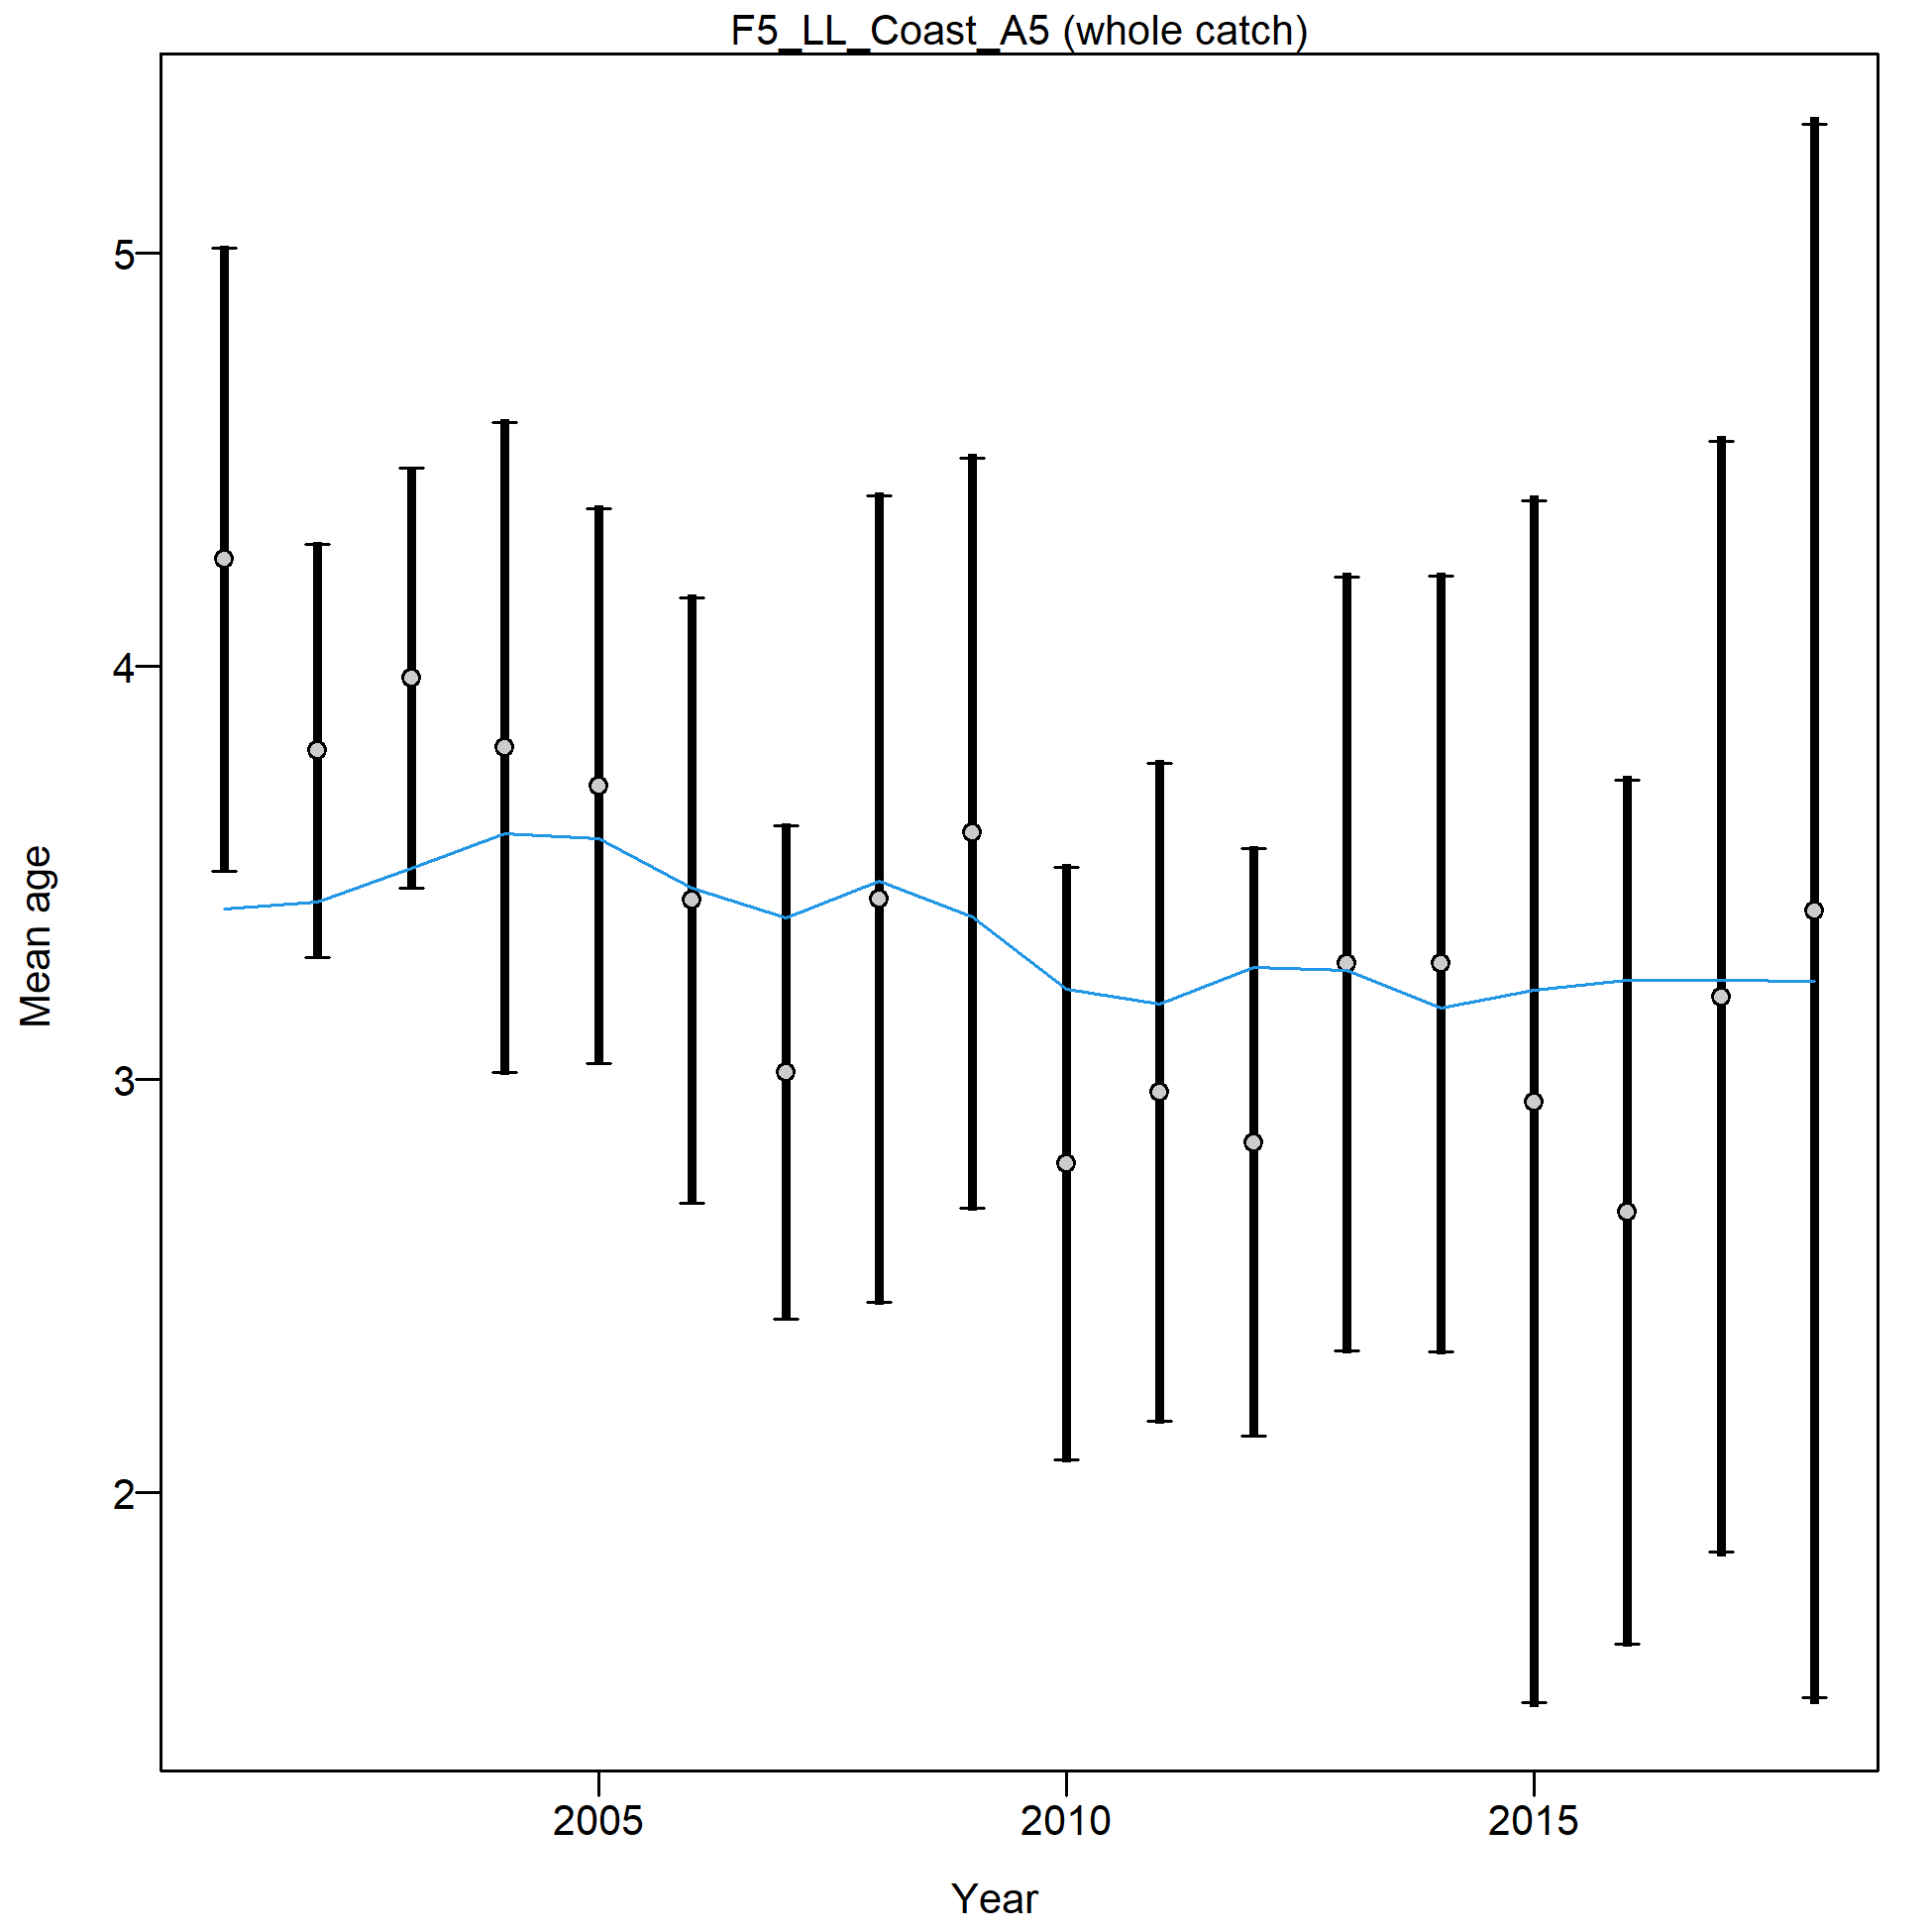
Mean age for F5_LL_Coast_A5 with 95% confidence intervals based on current samples sizes.
Francis data weighting method TA1.8: thinner intervals (with capped ends) show result of further adjusting sample sizes based on suggested multiplier (with 95% interval) for age data from F5_LL_Coast_A5:
1.0174 (0.6422-2.7449)
For more info, see
Francis, R.I.C.C. (2011). Data weighting in statistical fisheries stock assessment models. Can. J. Fish. Aquat. Sci. 68: 1124-1138. https://doi.org/10.1139/f2011-025