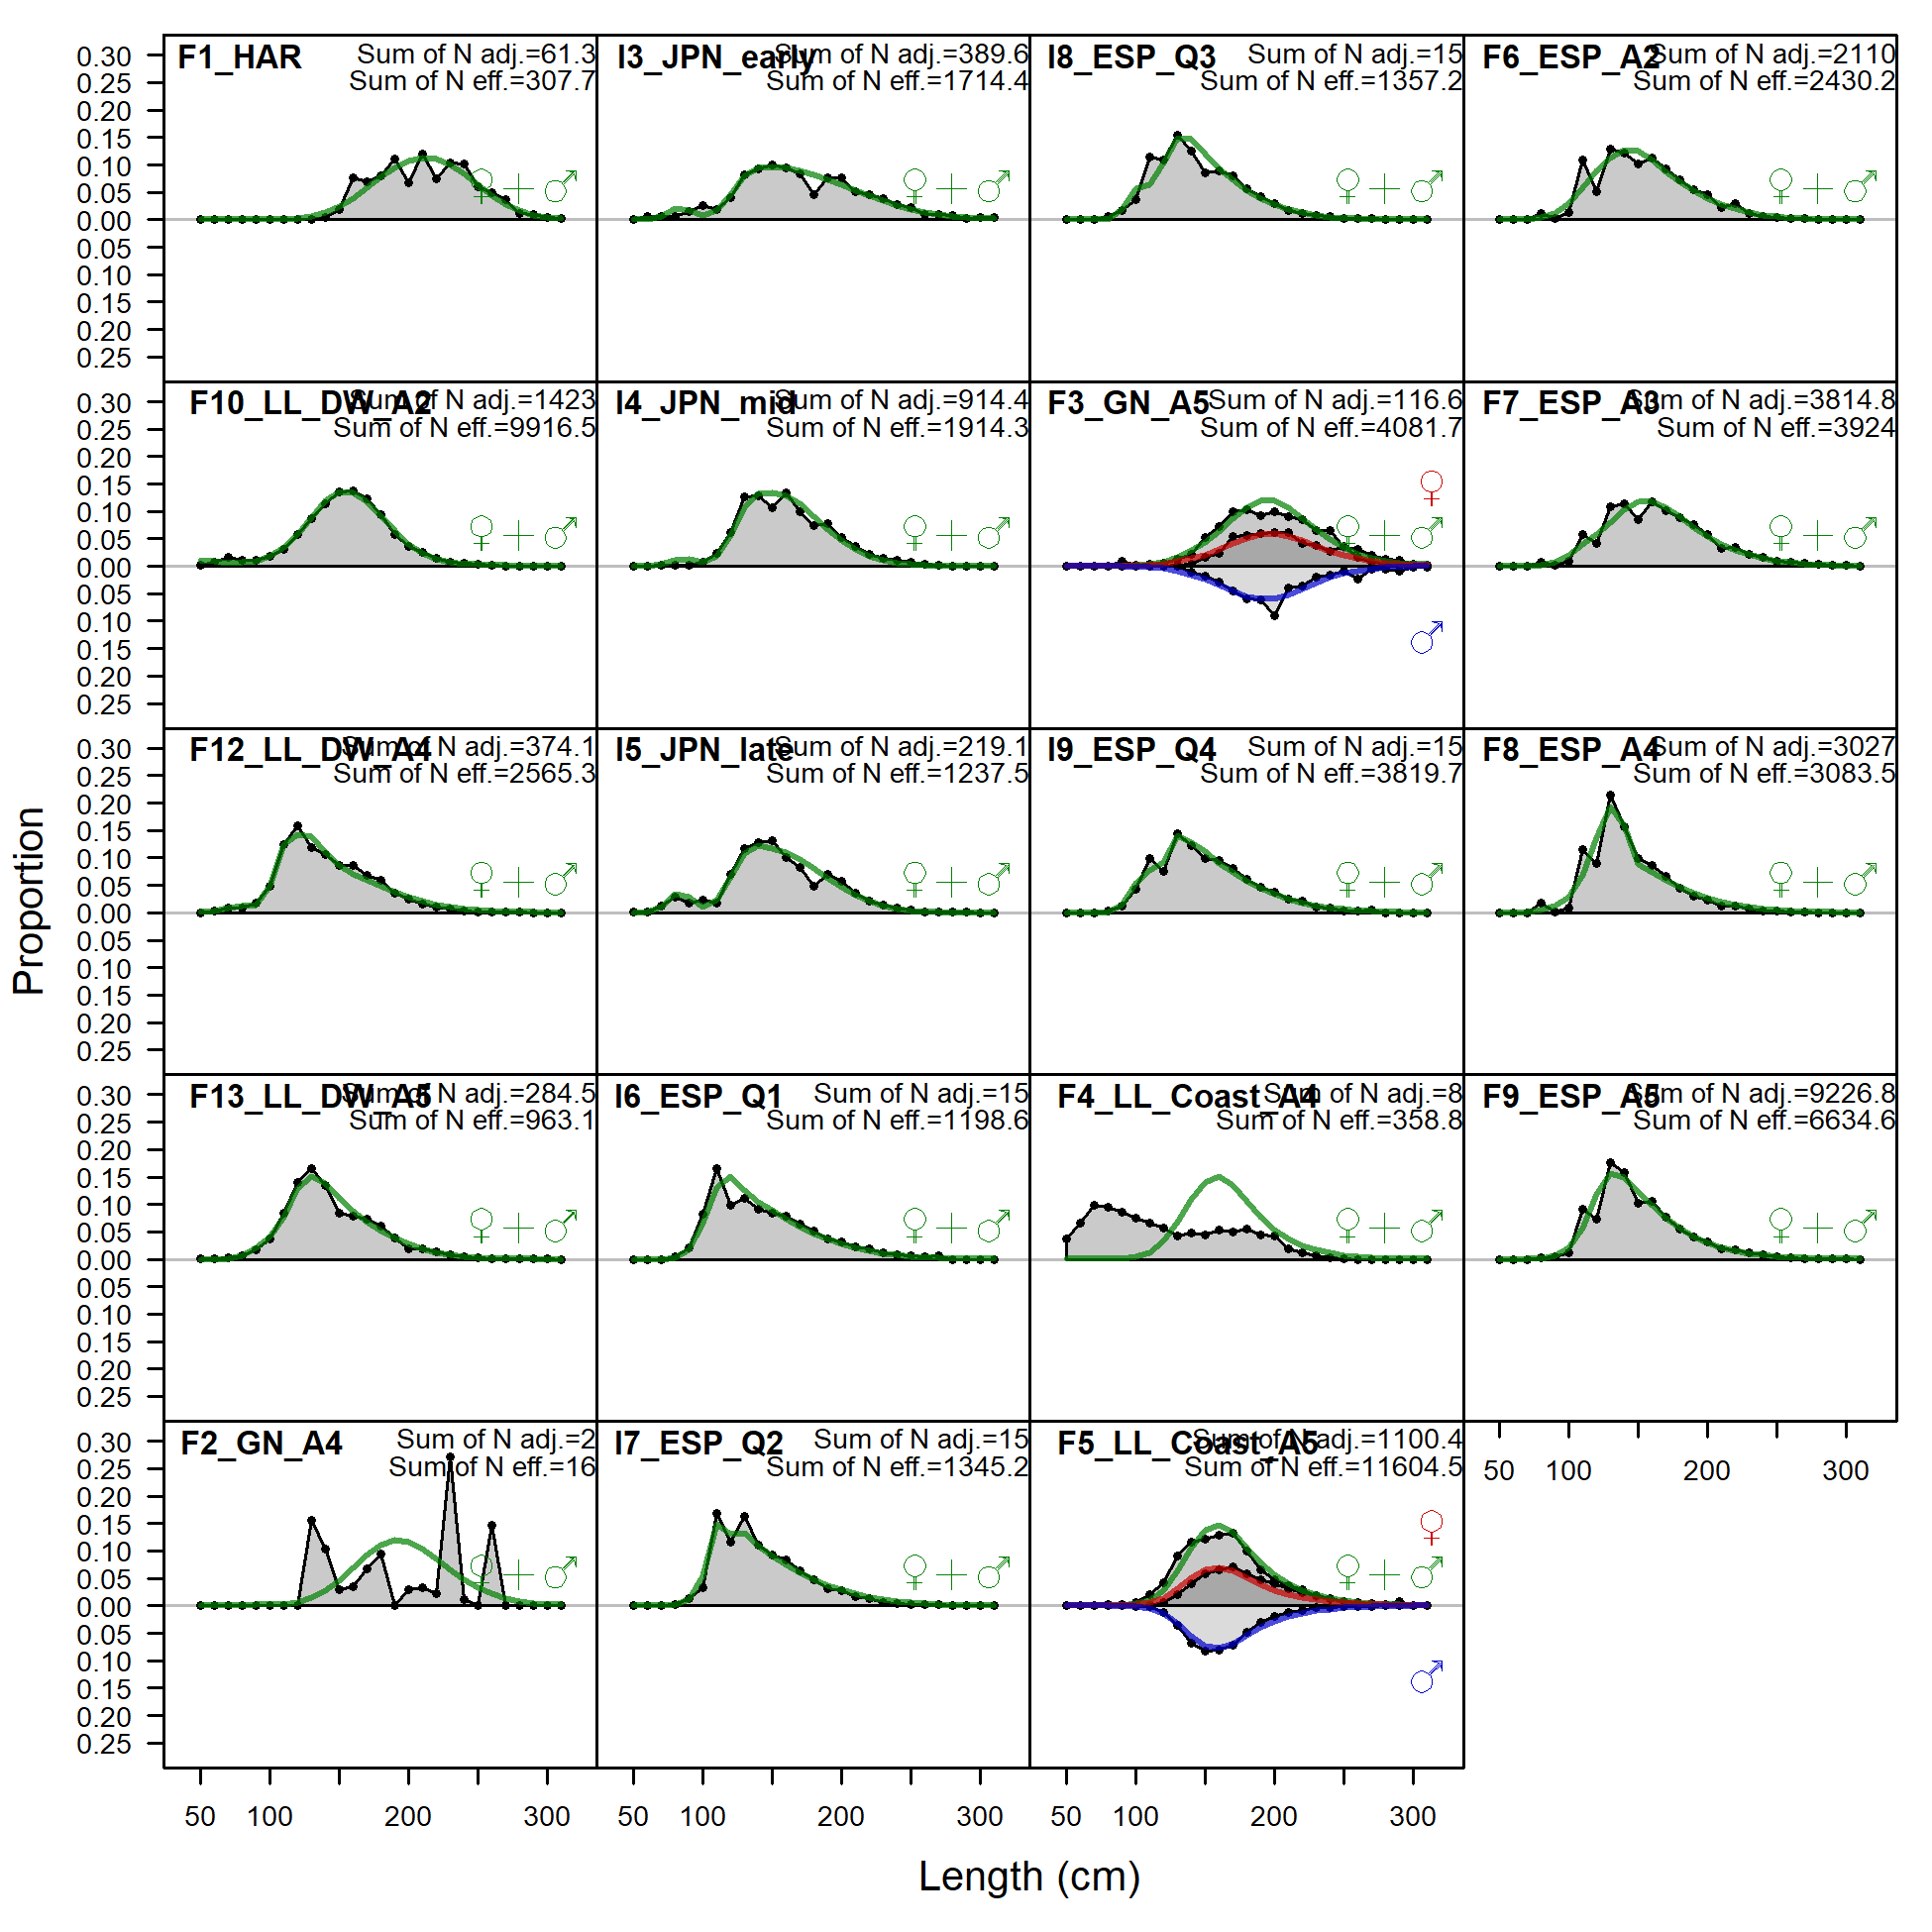
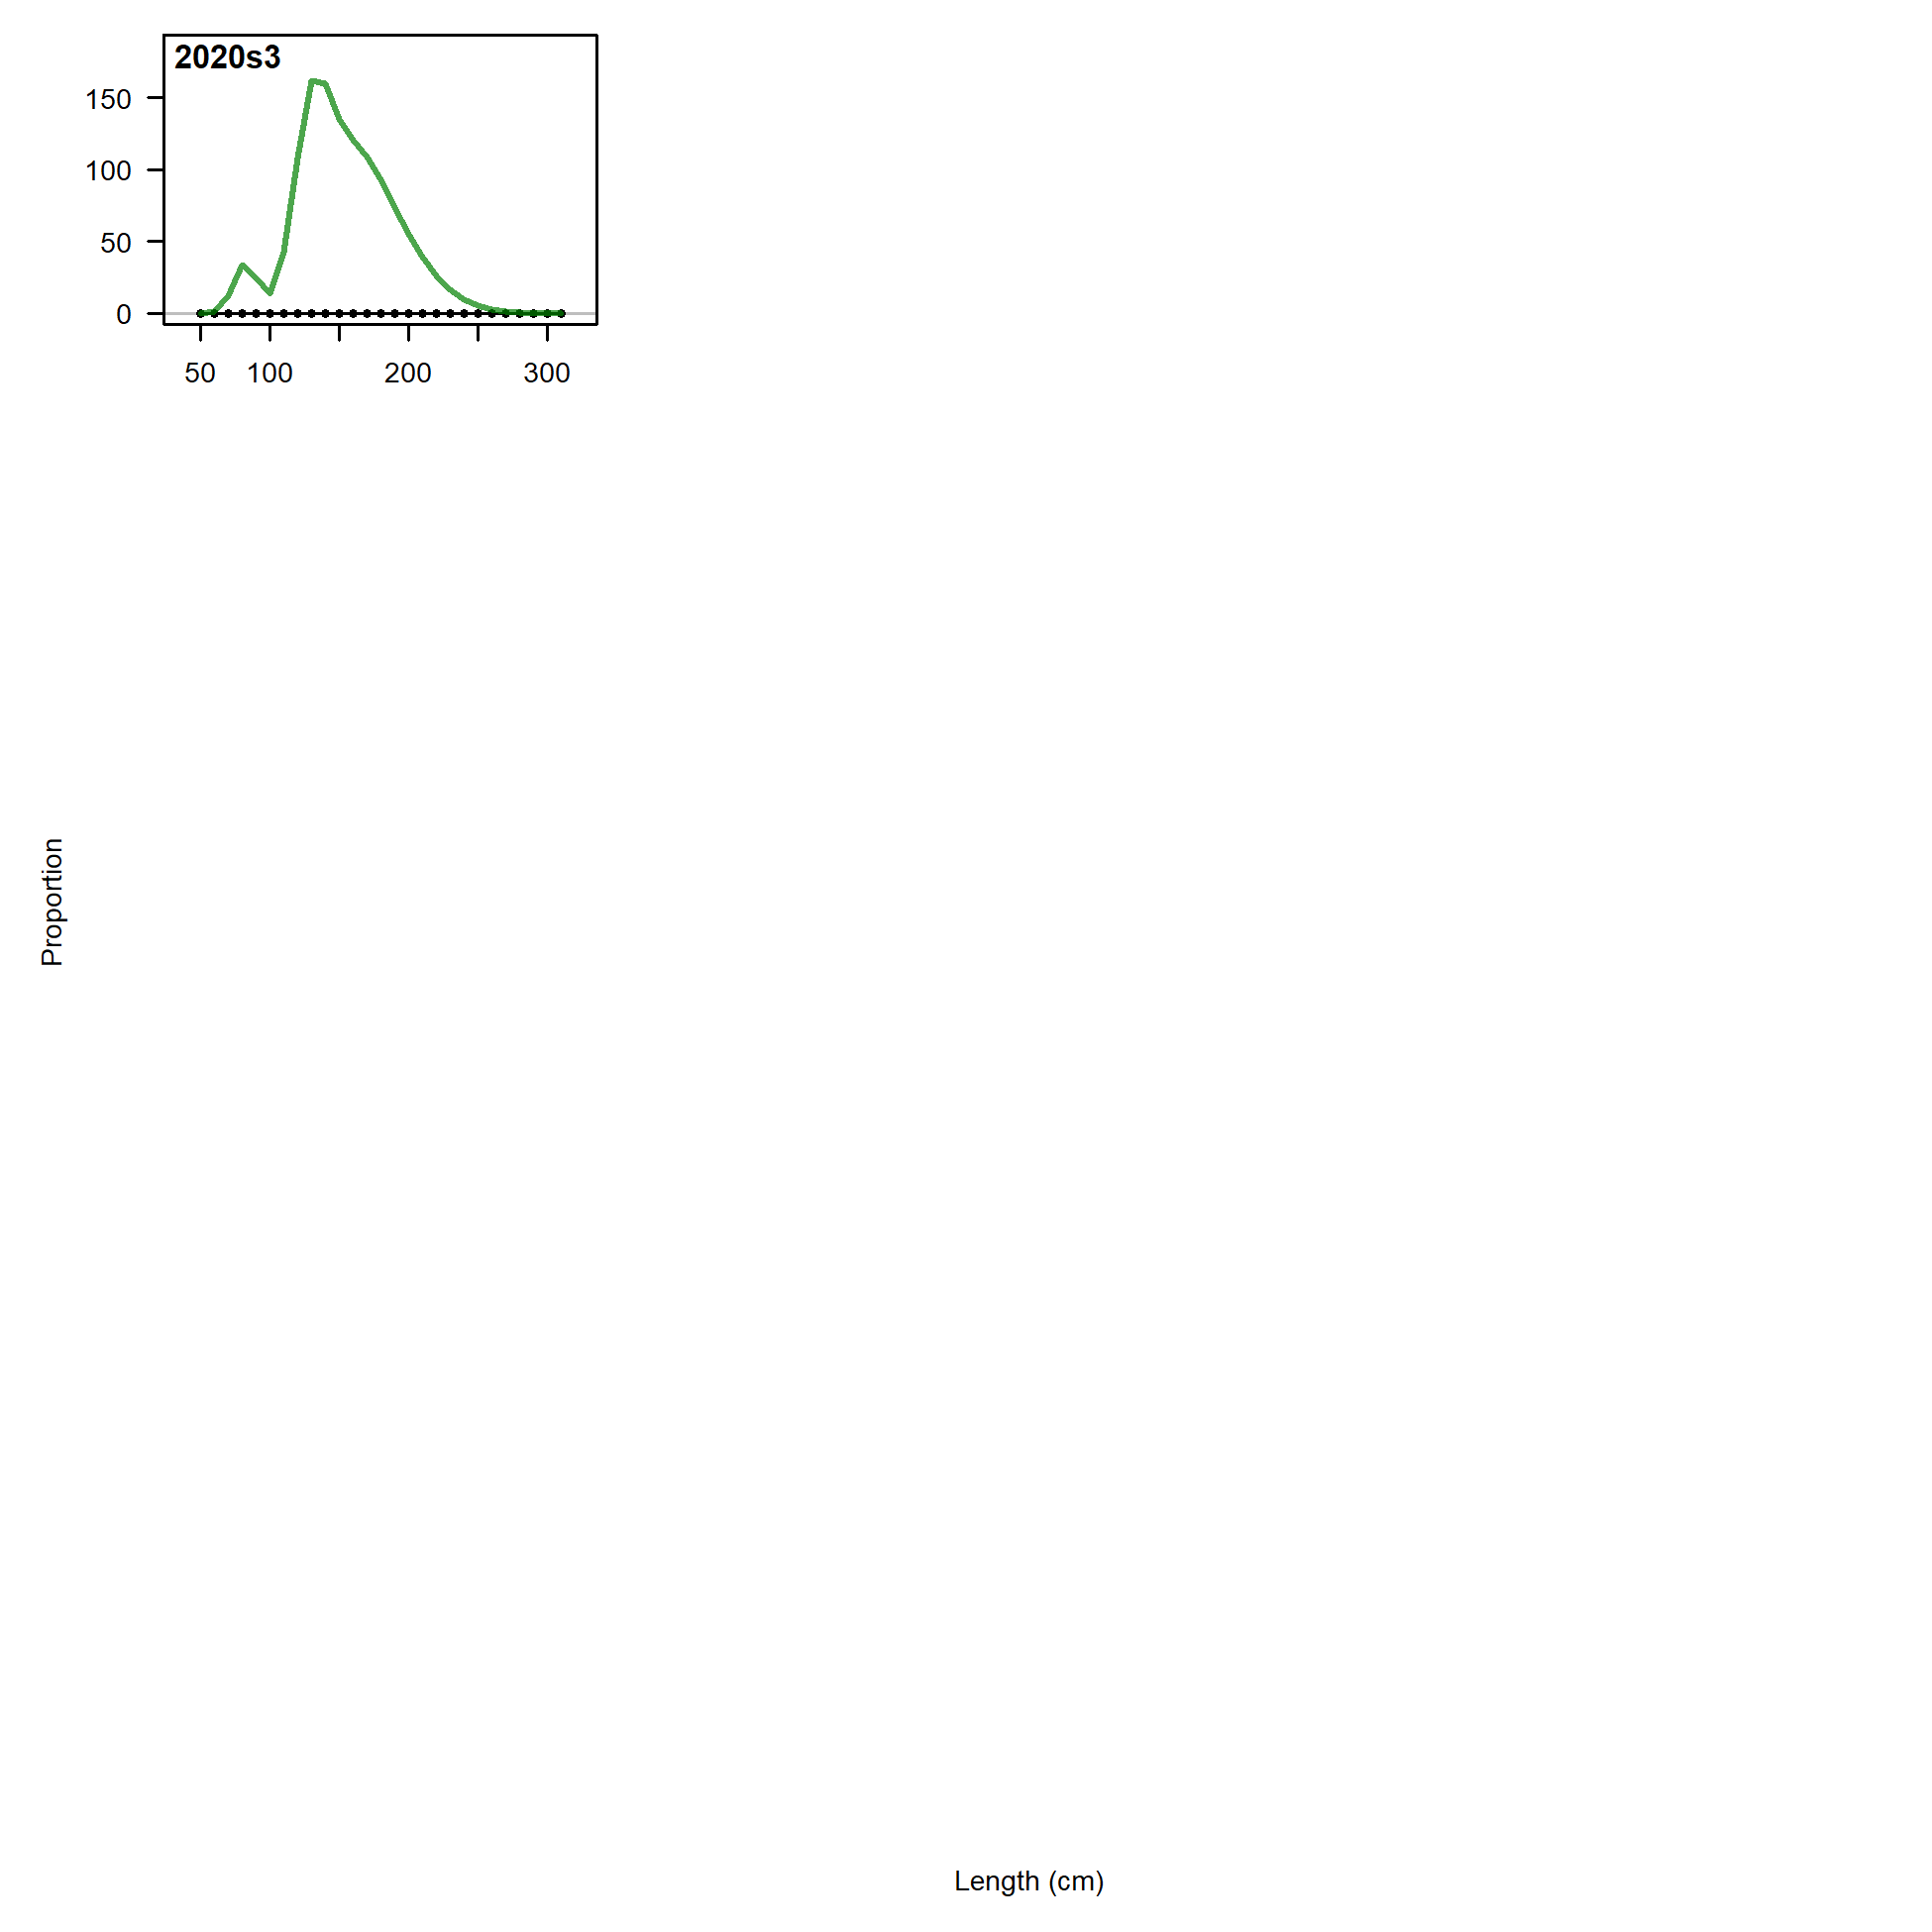
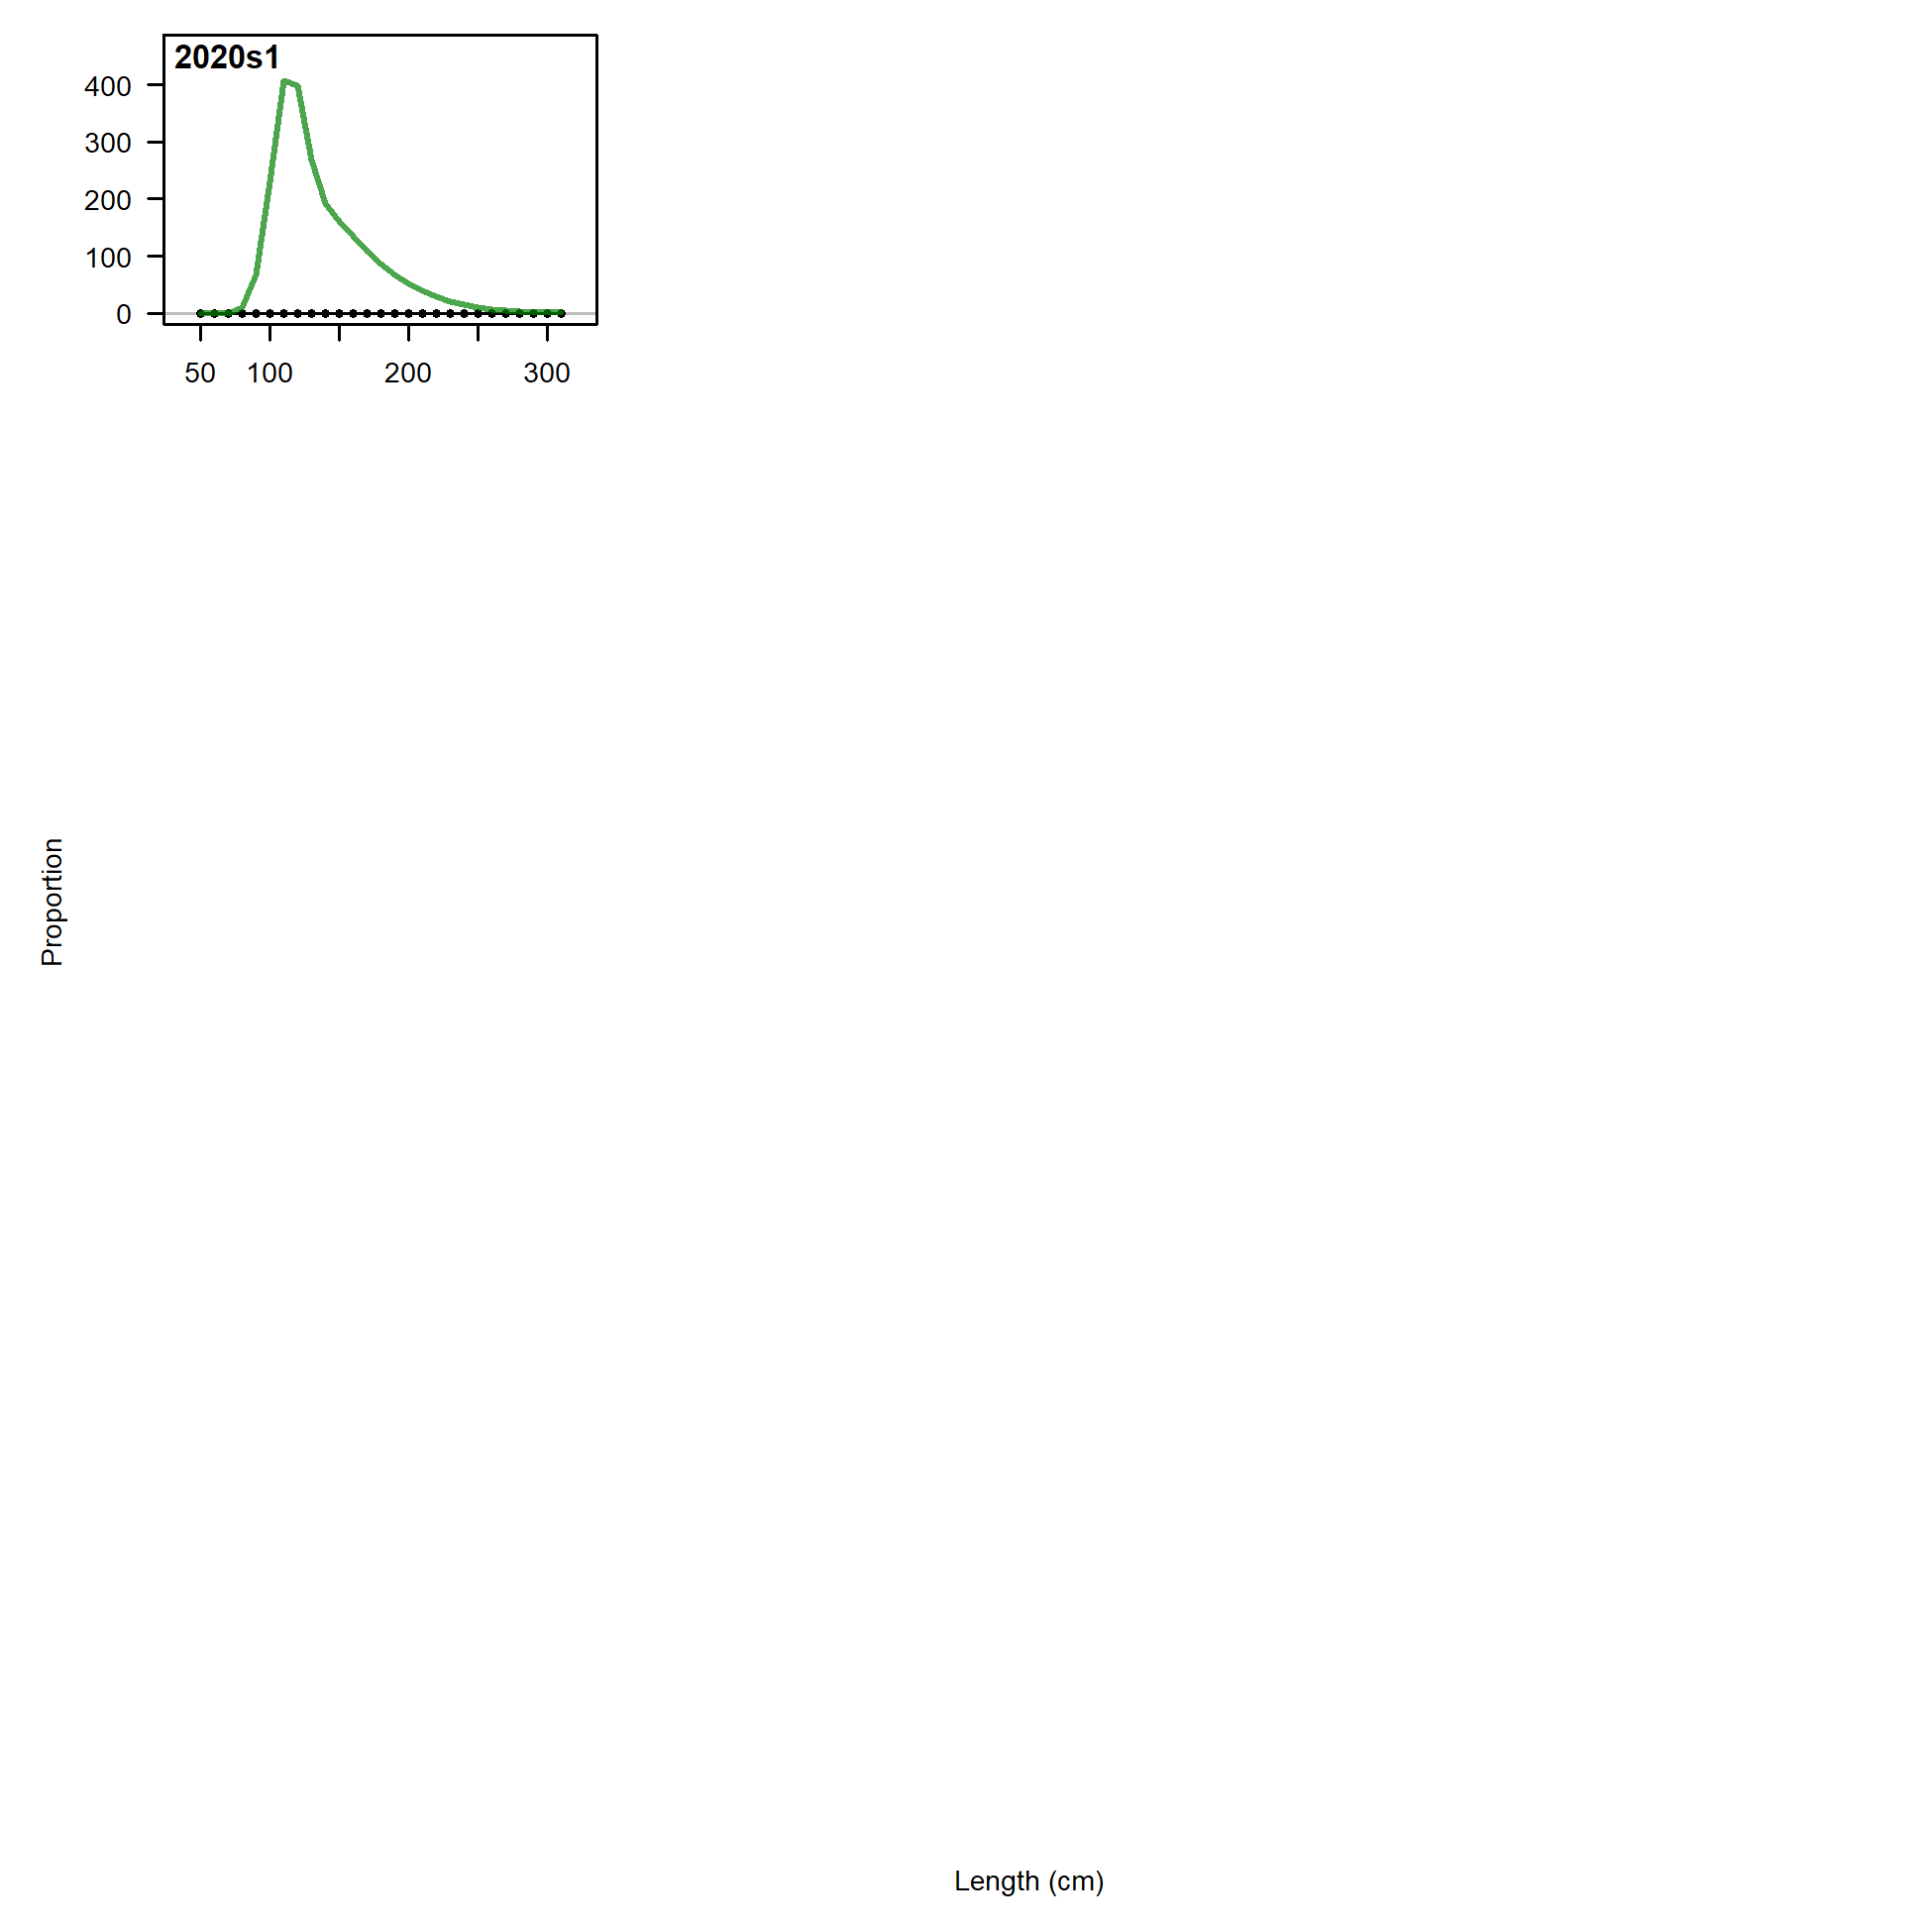
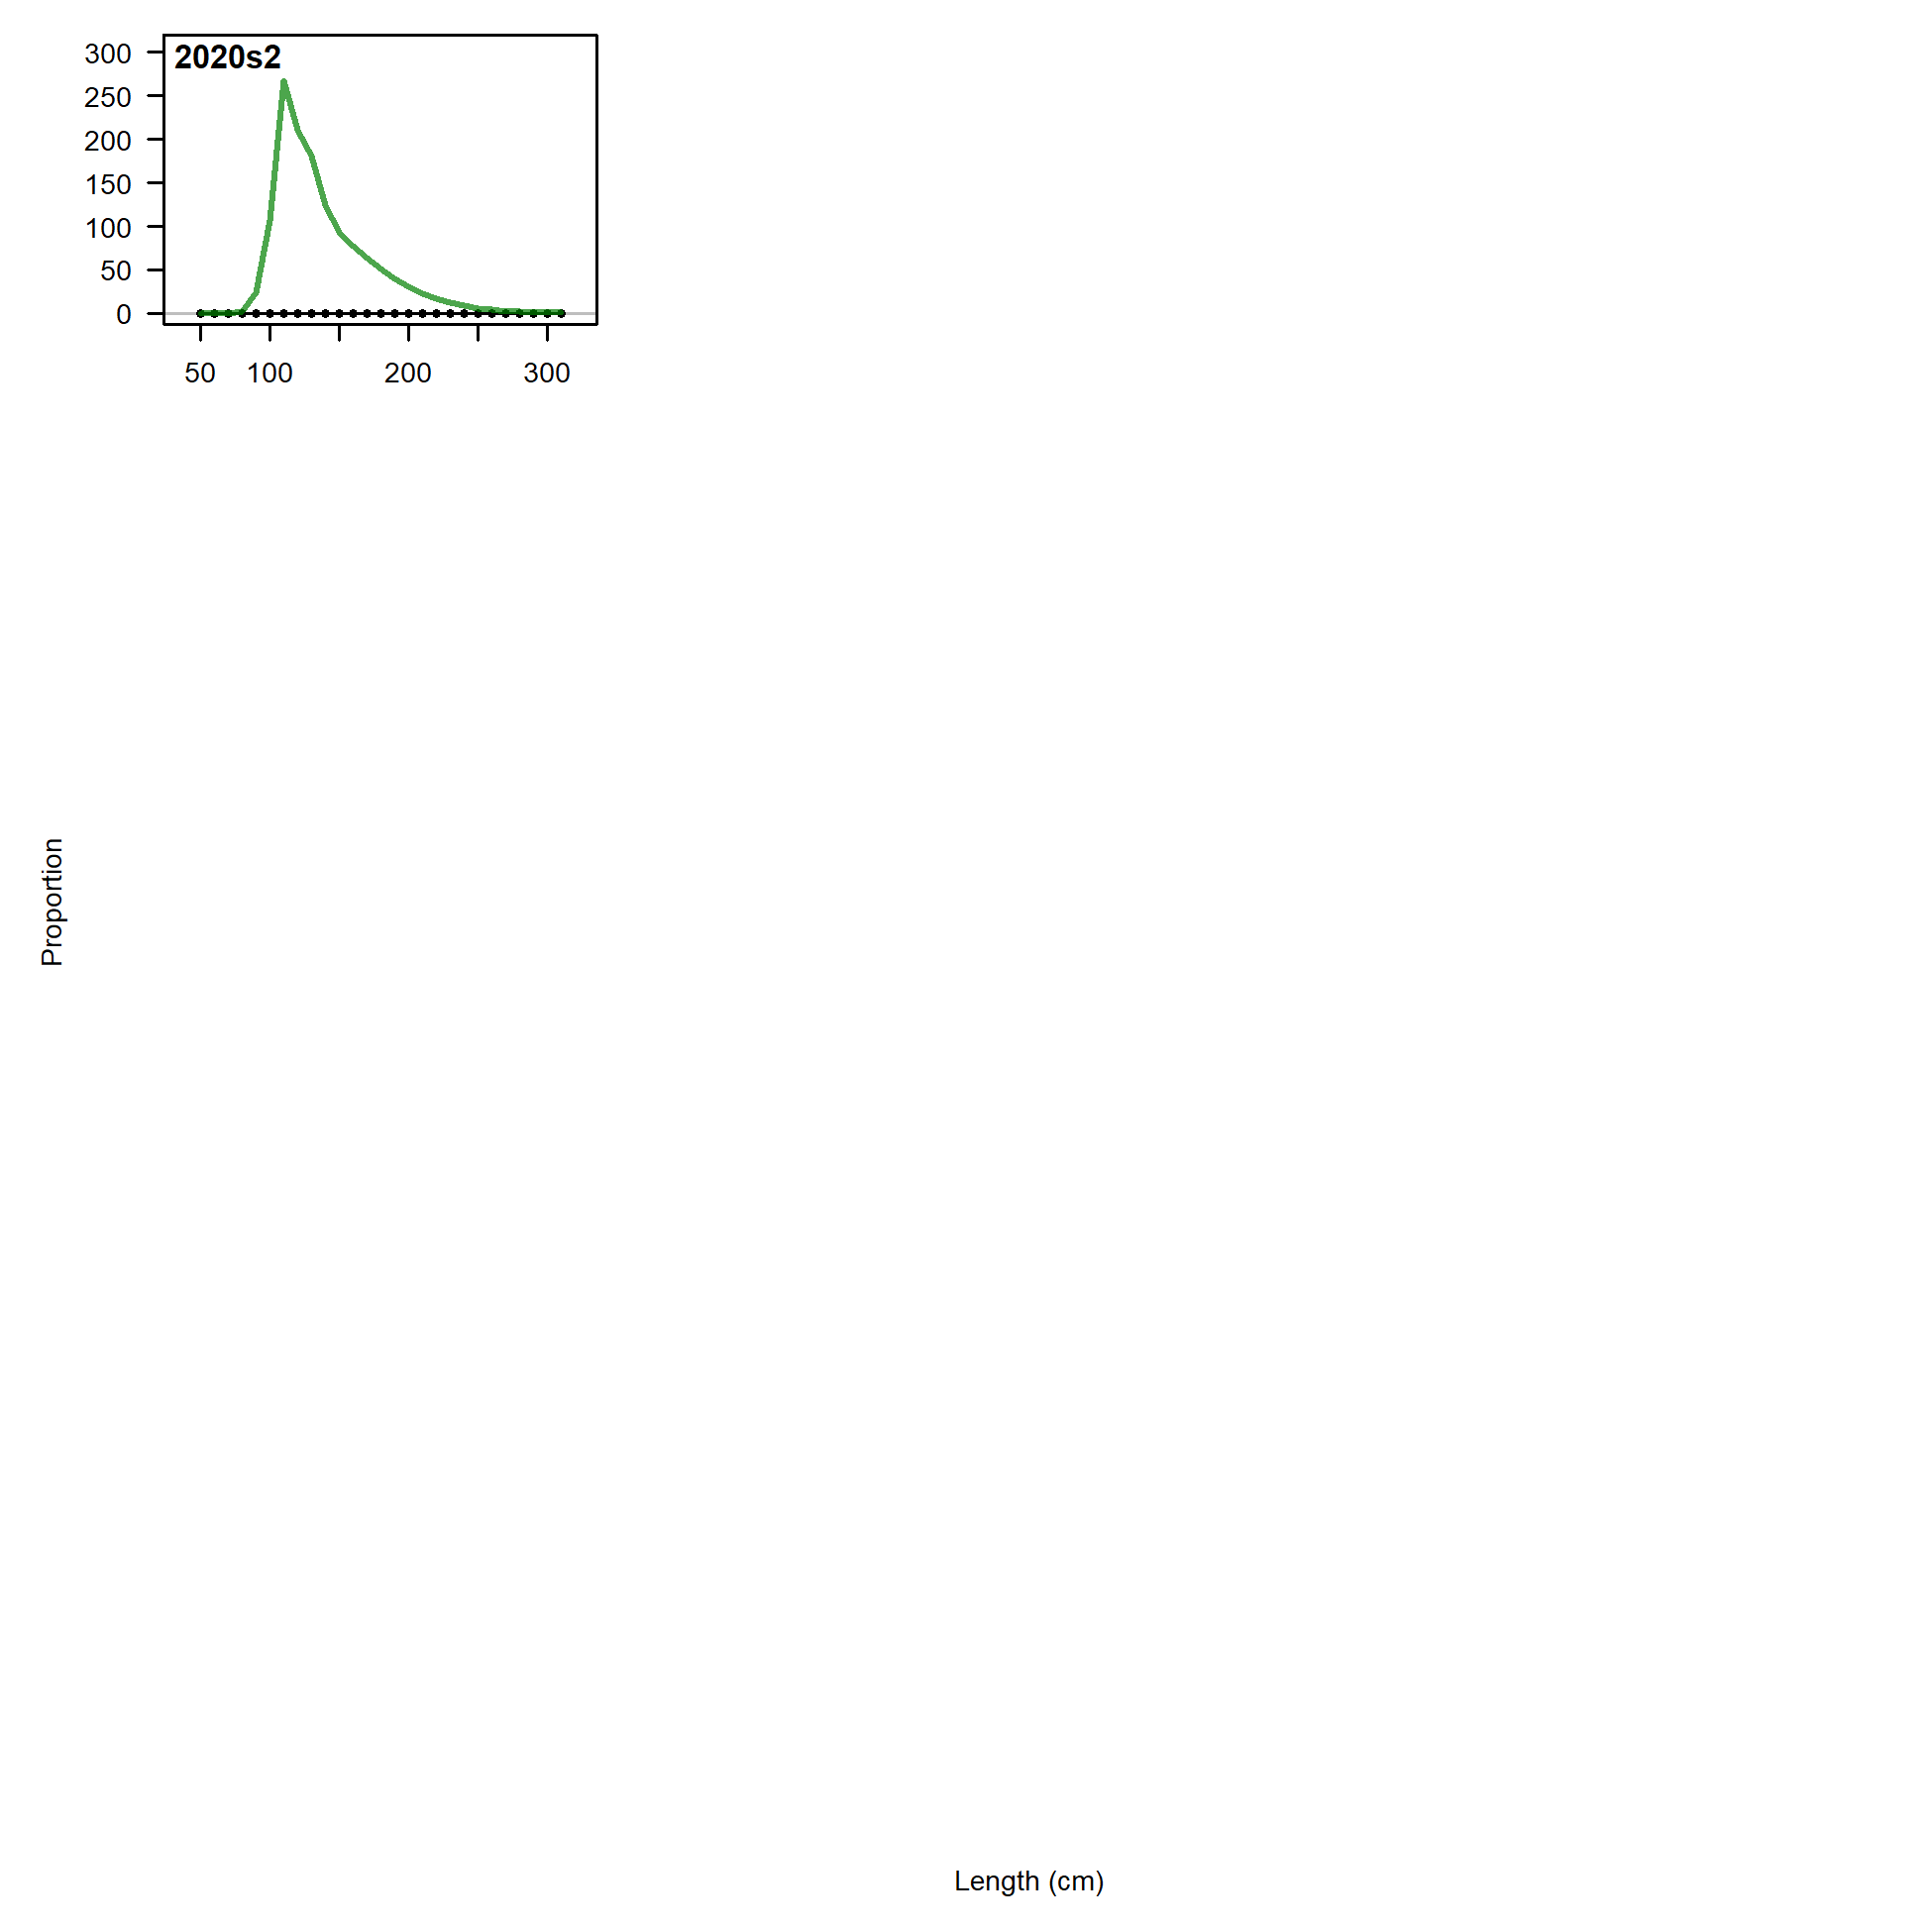
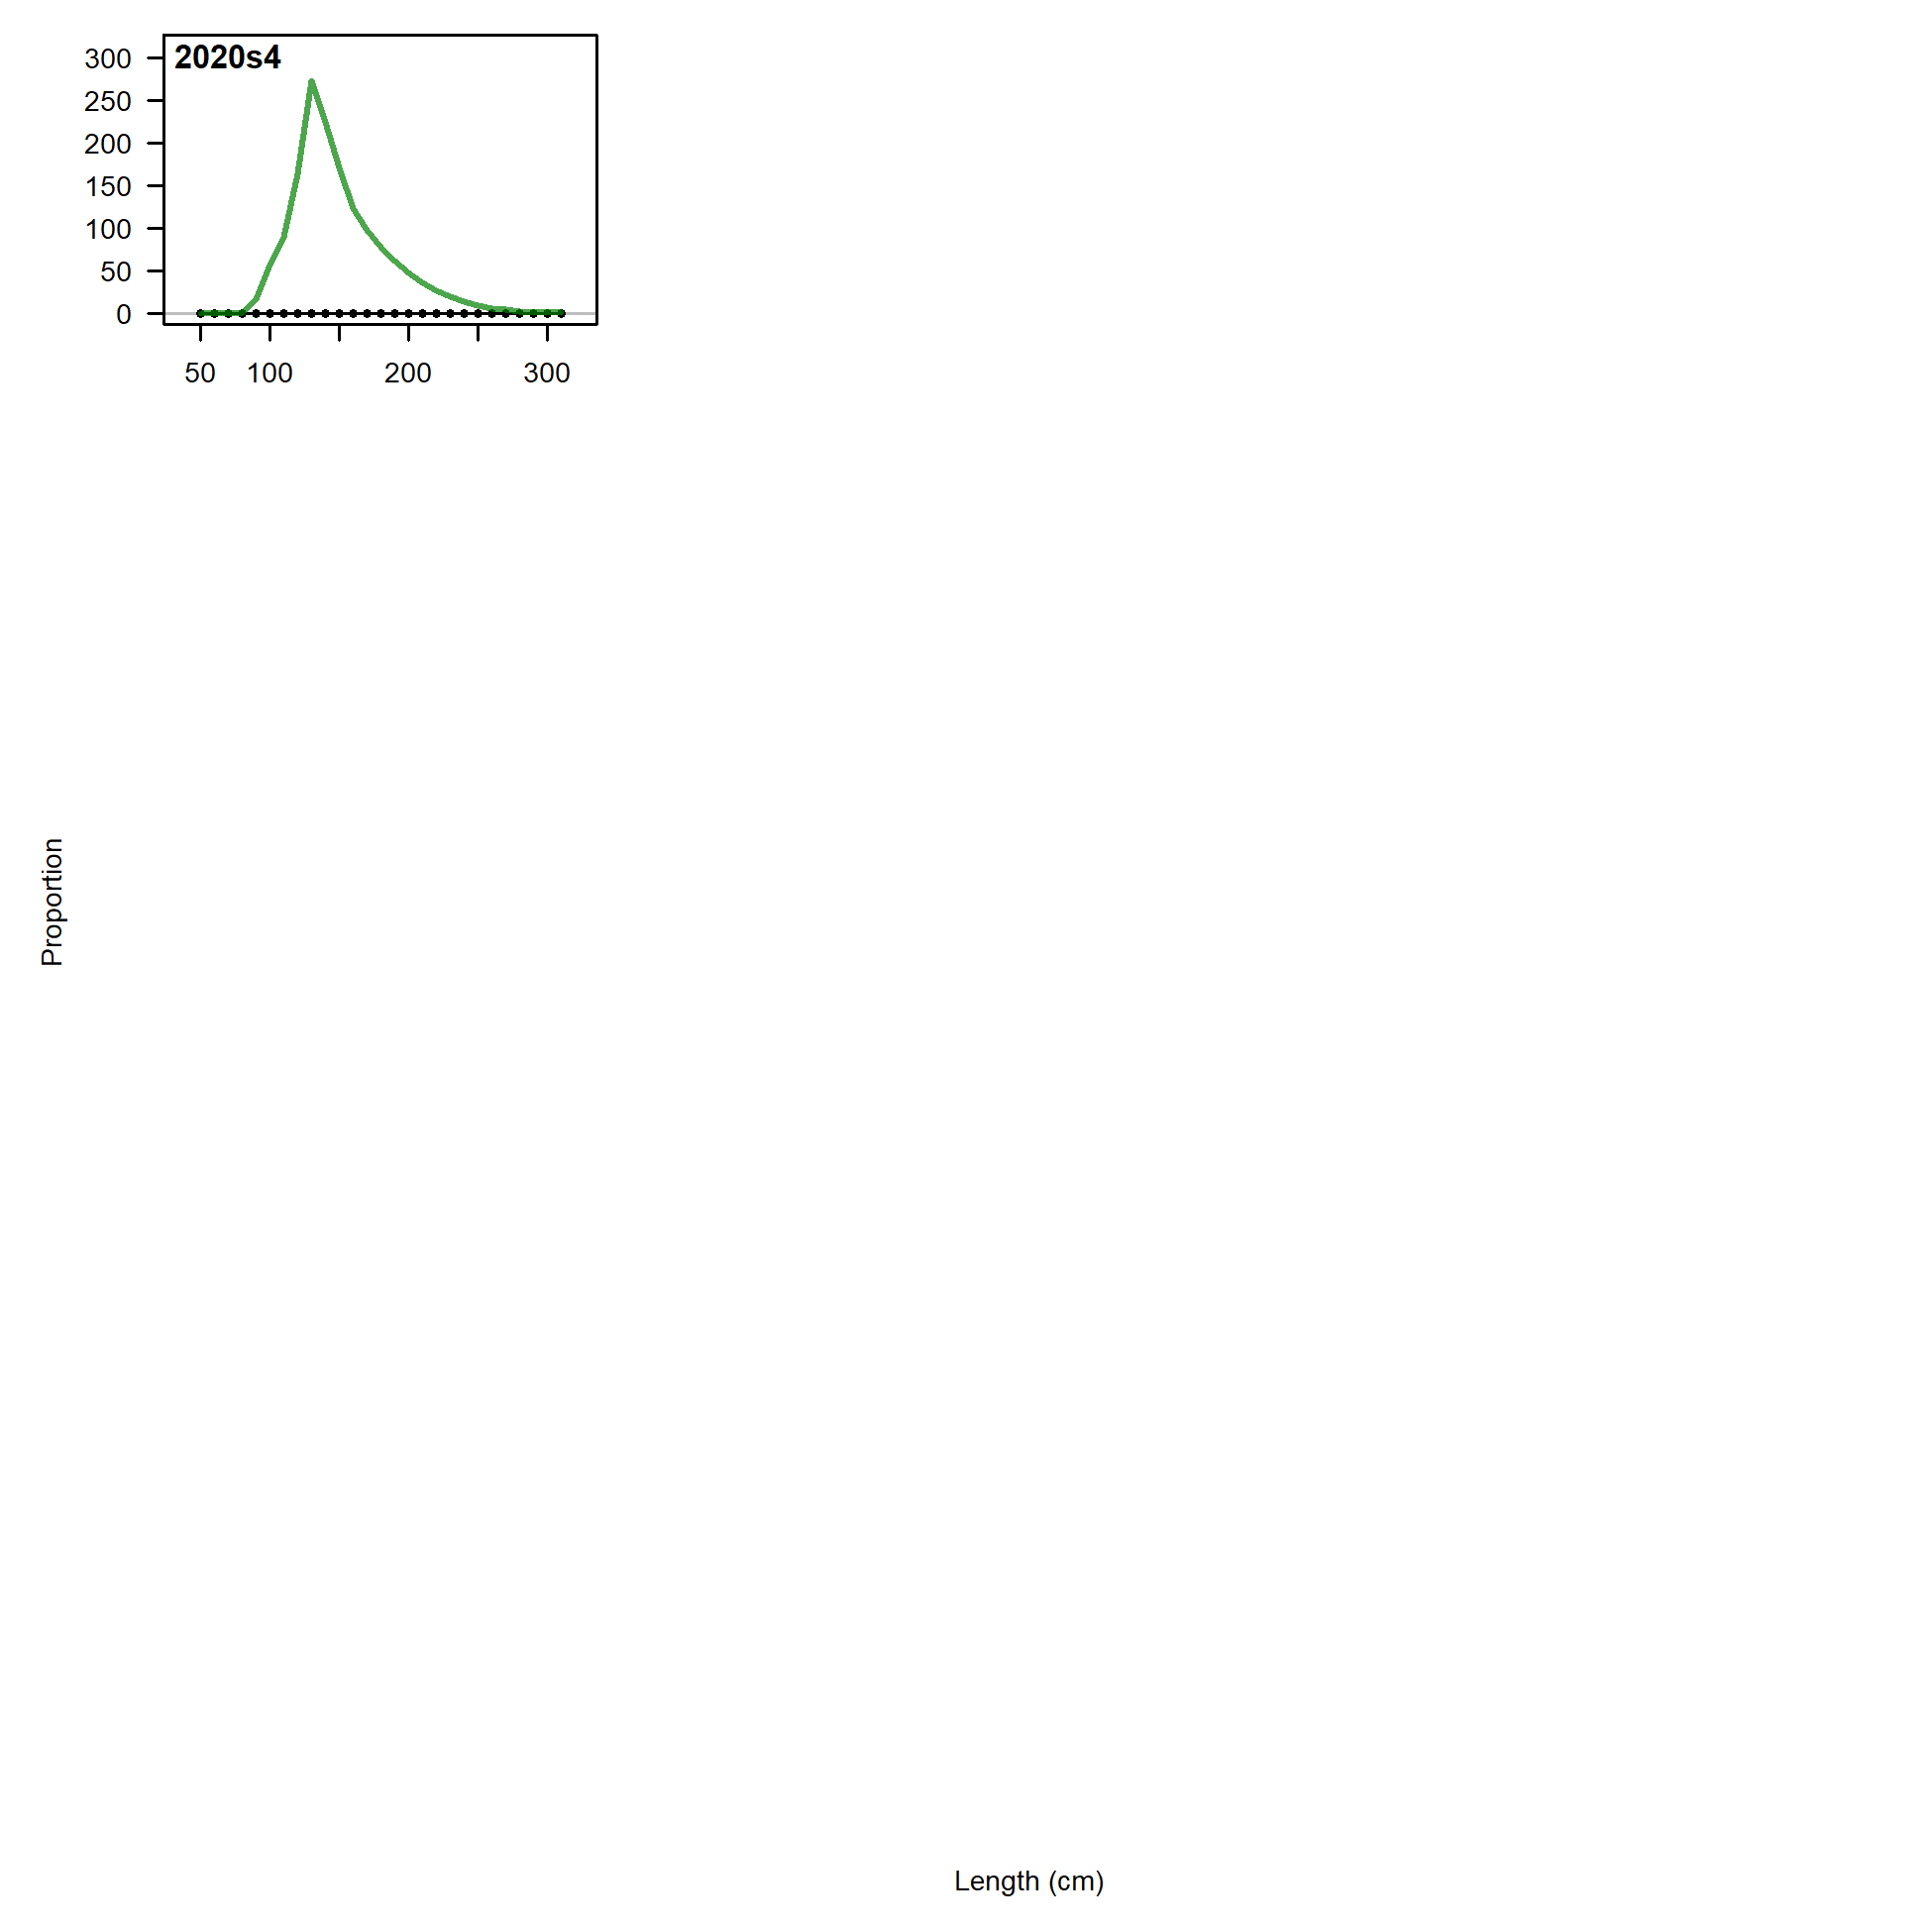
Length comps, aggregated across time by fleet.
Labels 'retained' and 'discard' indicate discarded or retained sampled for each fleet. Panels without this designation represent the whole catch.
file: comp_lenfit__aggregated_across_time.png
Length comps, aggregated across time by fleet.
Labels 'retained' and 'discard' indicate discarded or retained sampled for each fleet. Panels without this designation represent the whole catch.
file: comp_lenfit__aggregated_across_time.png
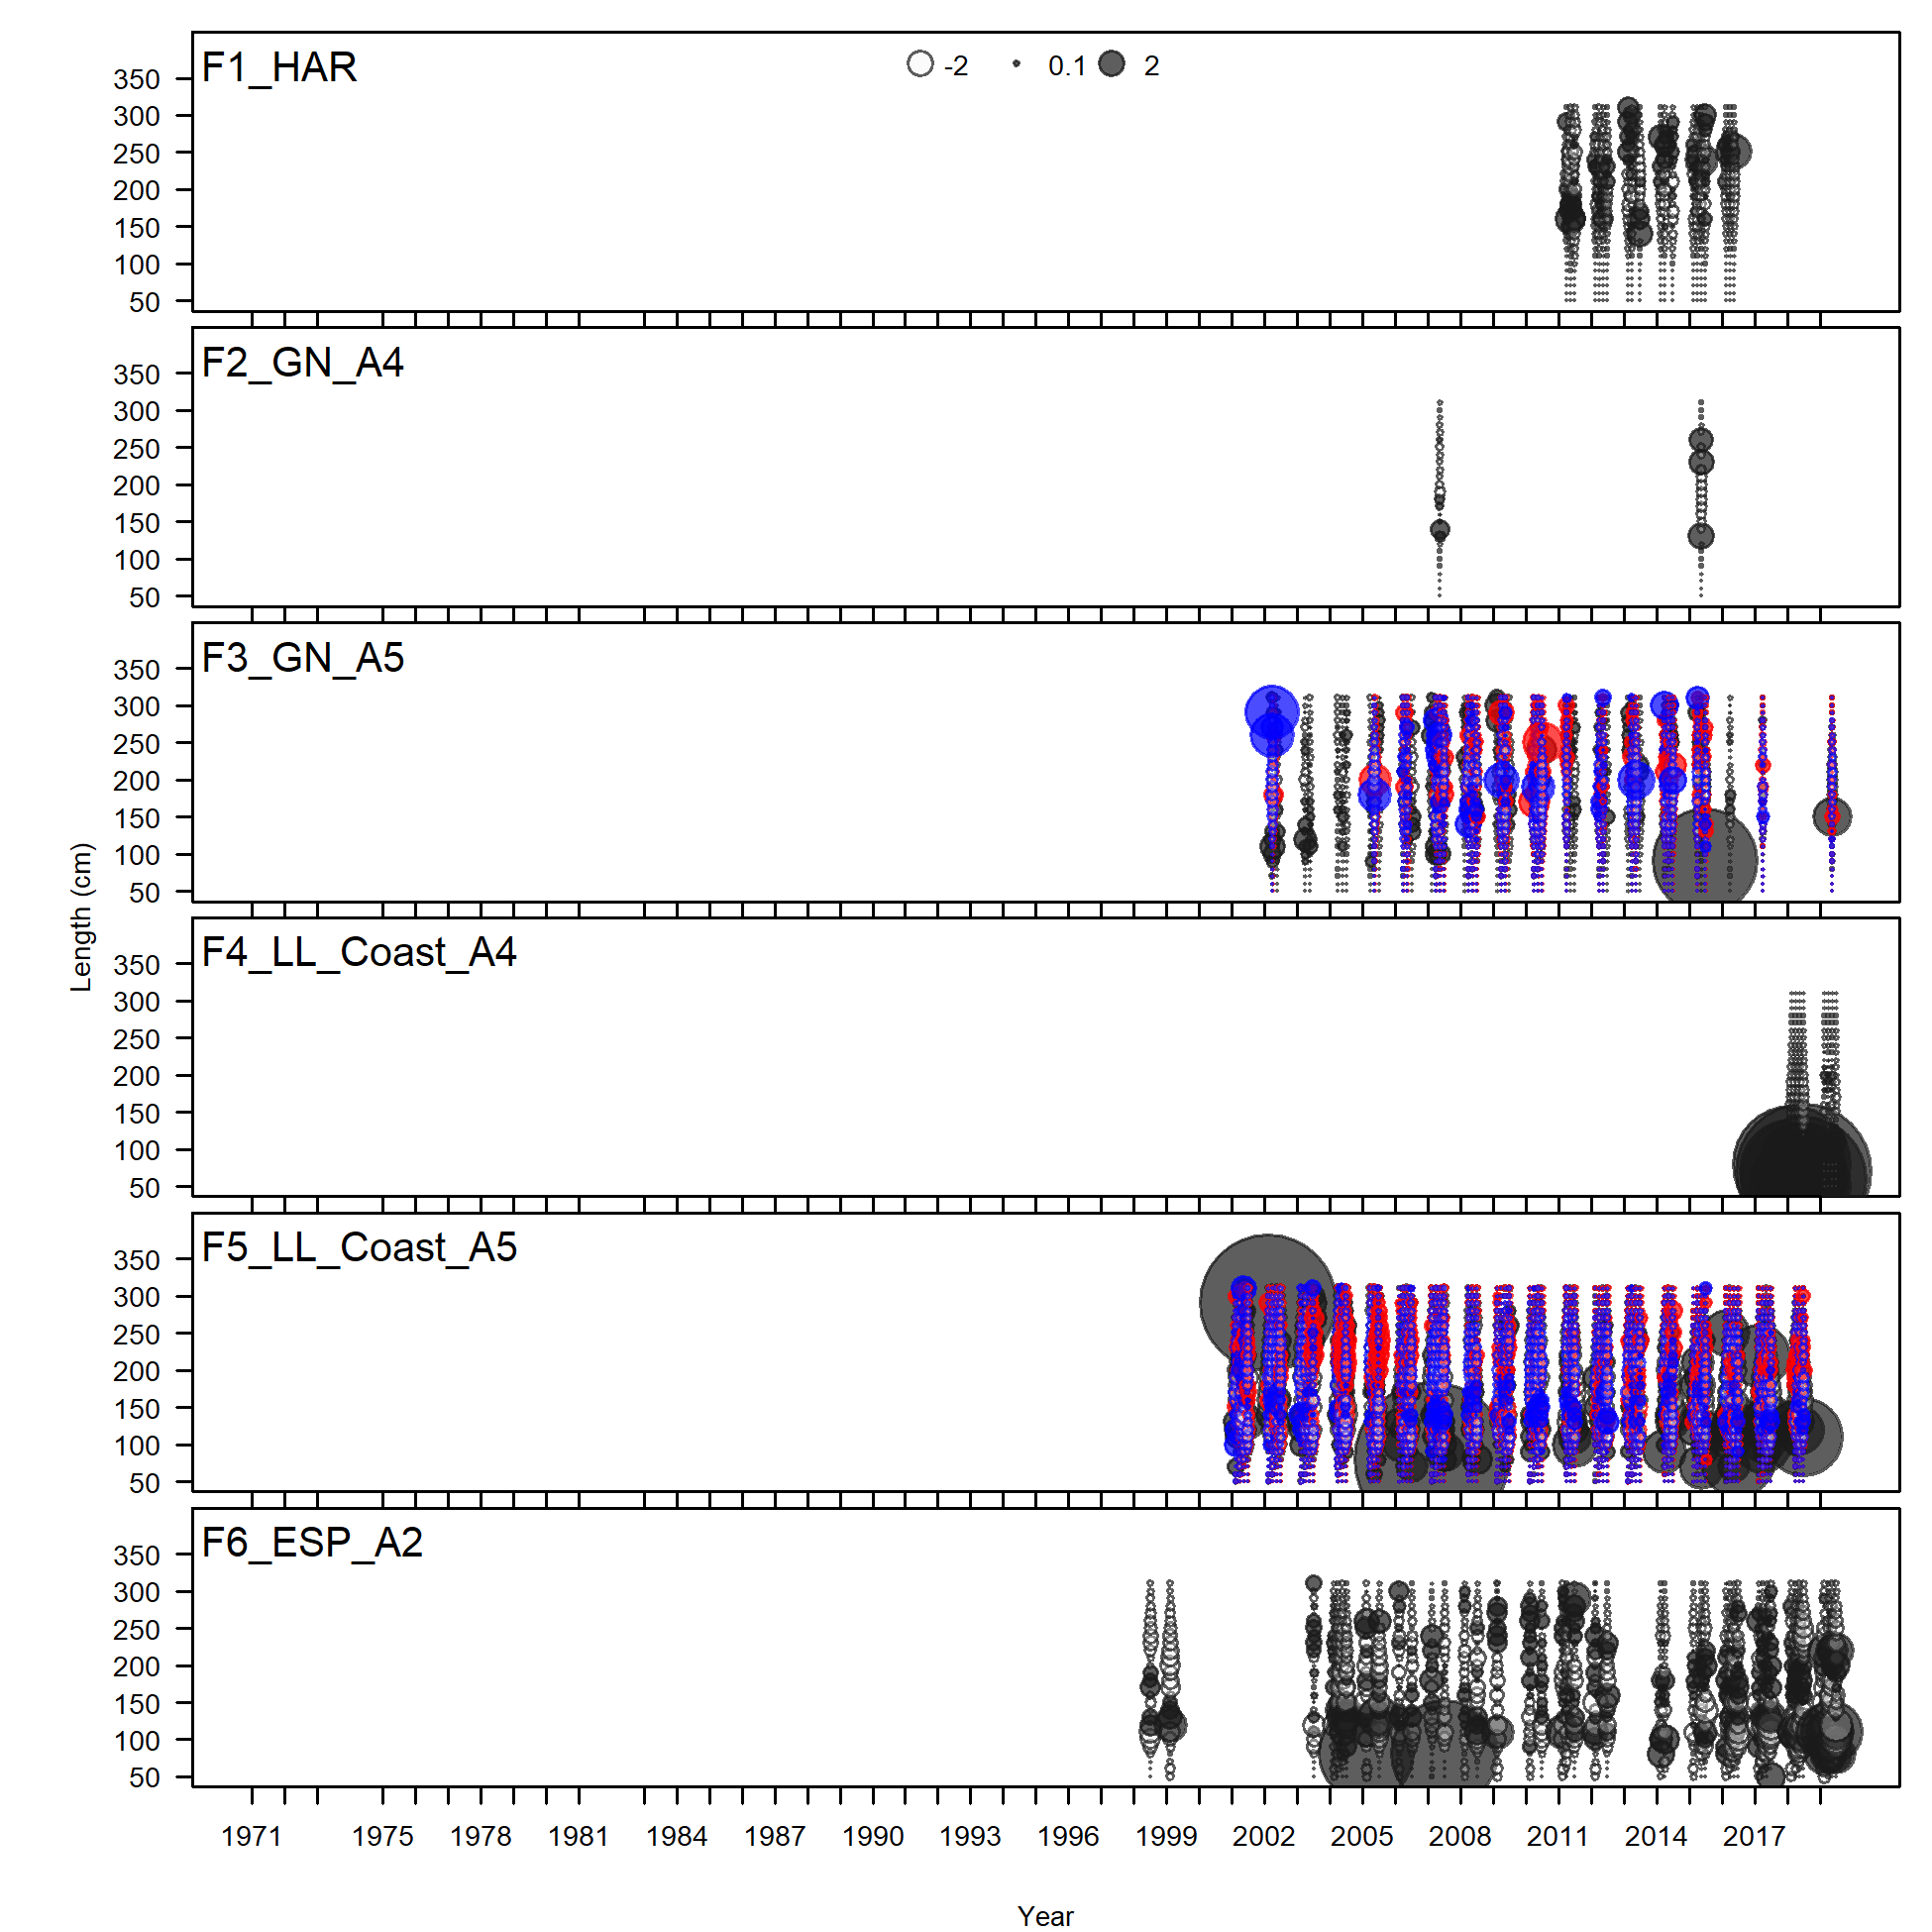
Pearson residuals, comparing across fleets (plot 1 of 4)
Closed bubbles are positive residuals (observed > expected) and open bubbles are negative residuals (observed < expected).
file: comp_lenfit__page1_multi-fleet_comparison.png
Pearson residuals, comparing across fleets (plot 2 of 4)
file: comp_lenfit__page2_multi-fleet_comparison.png
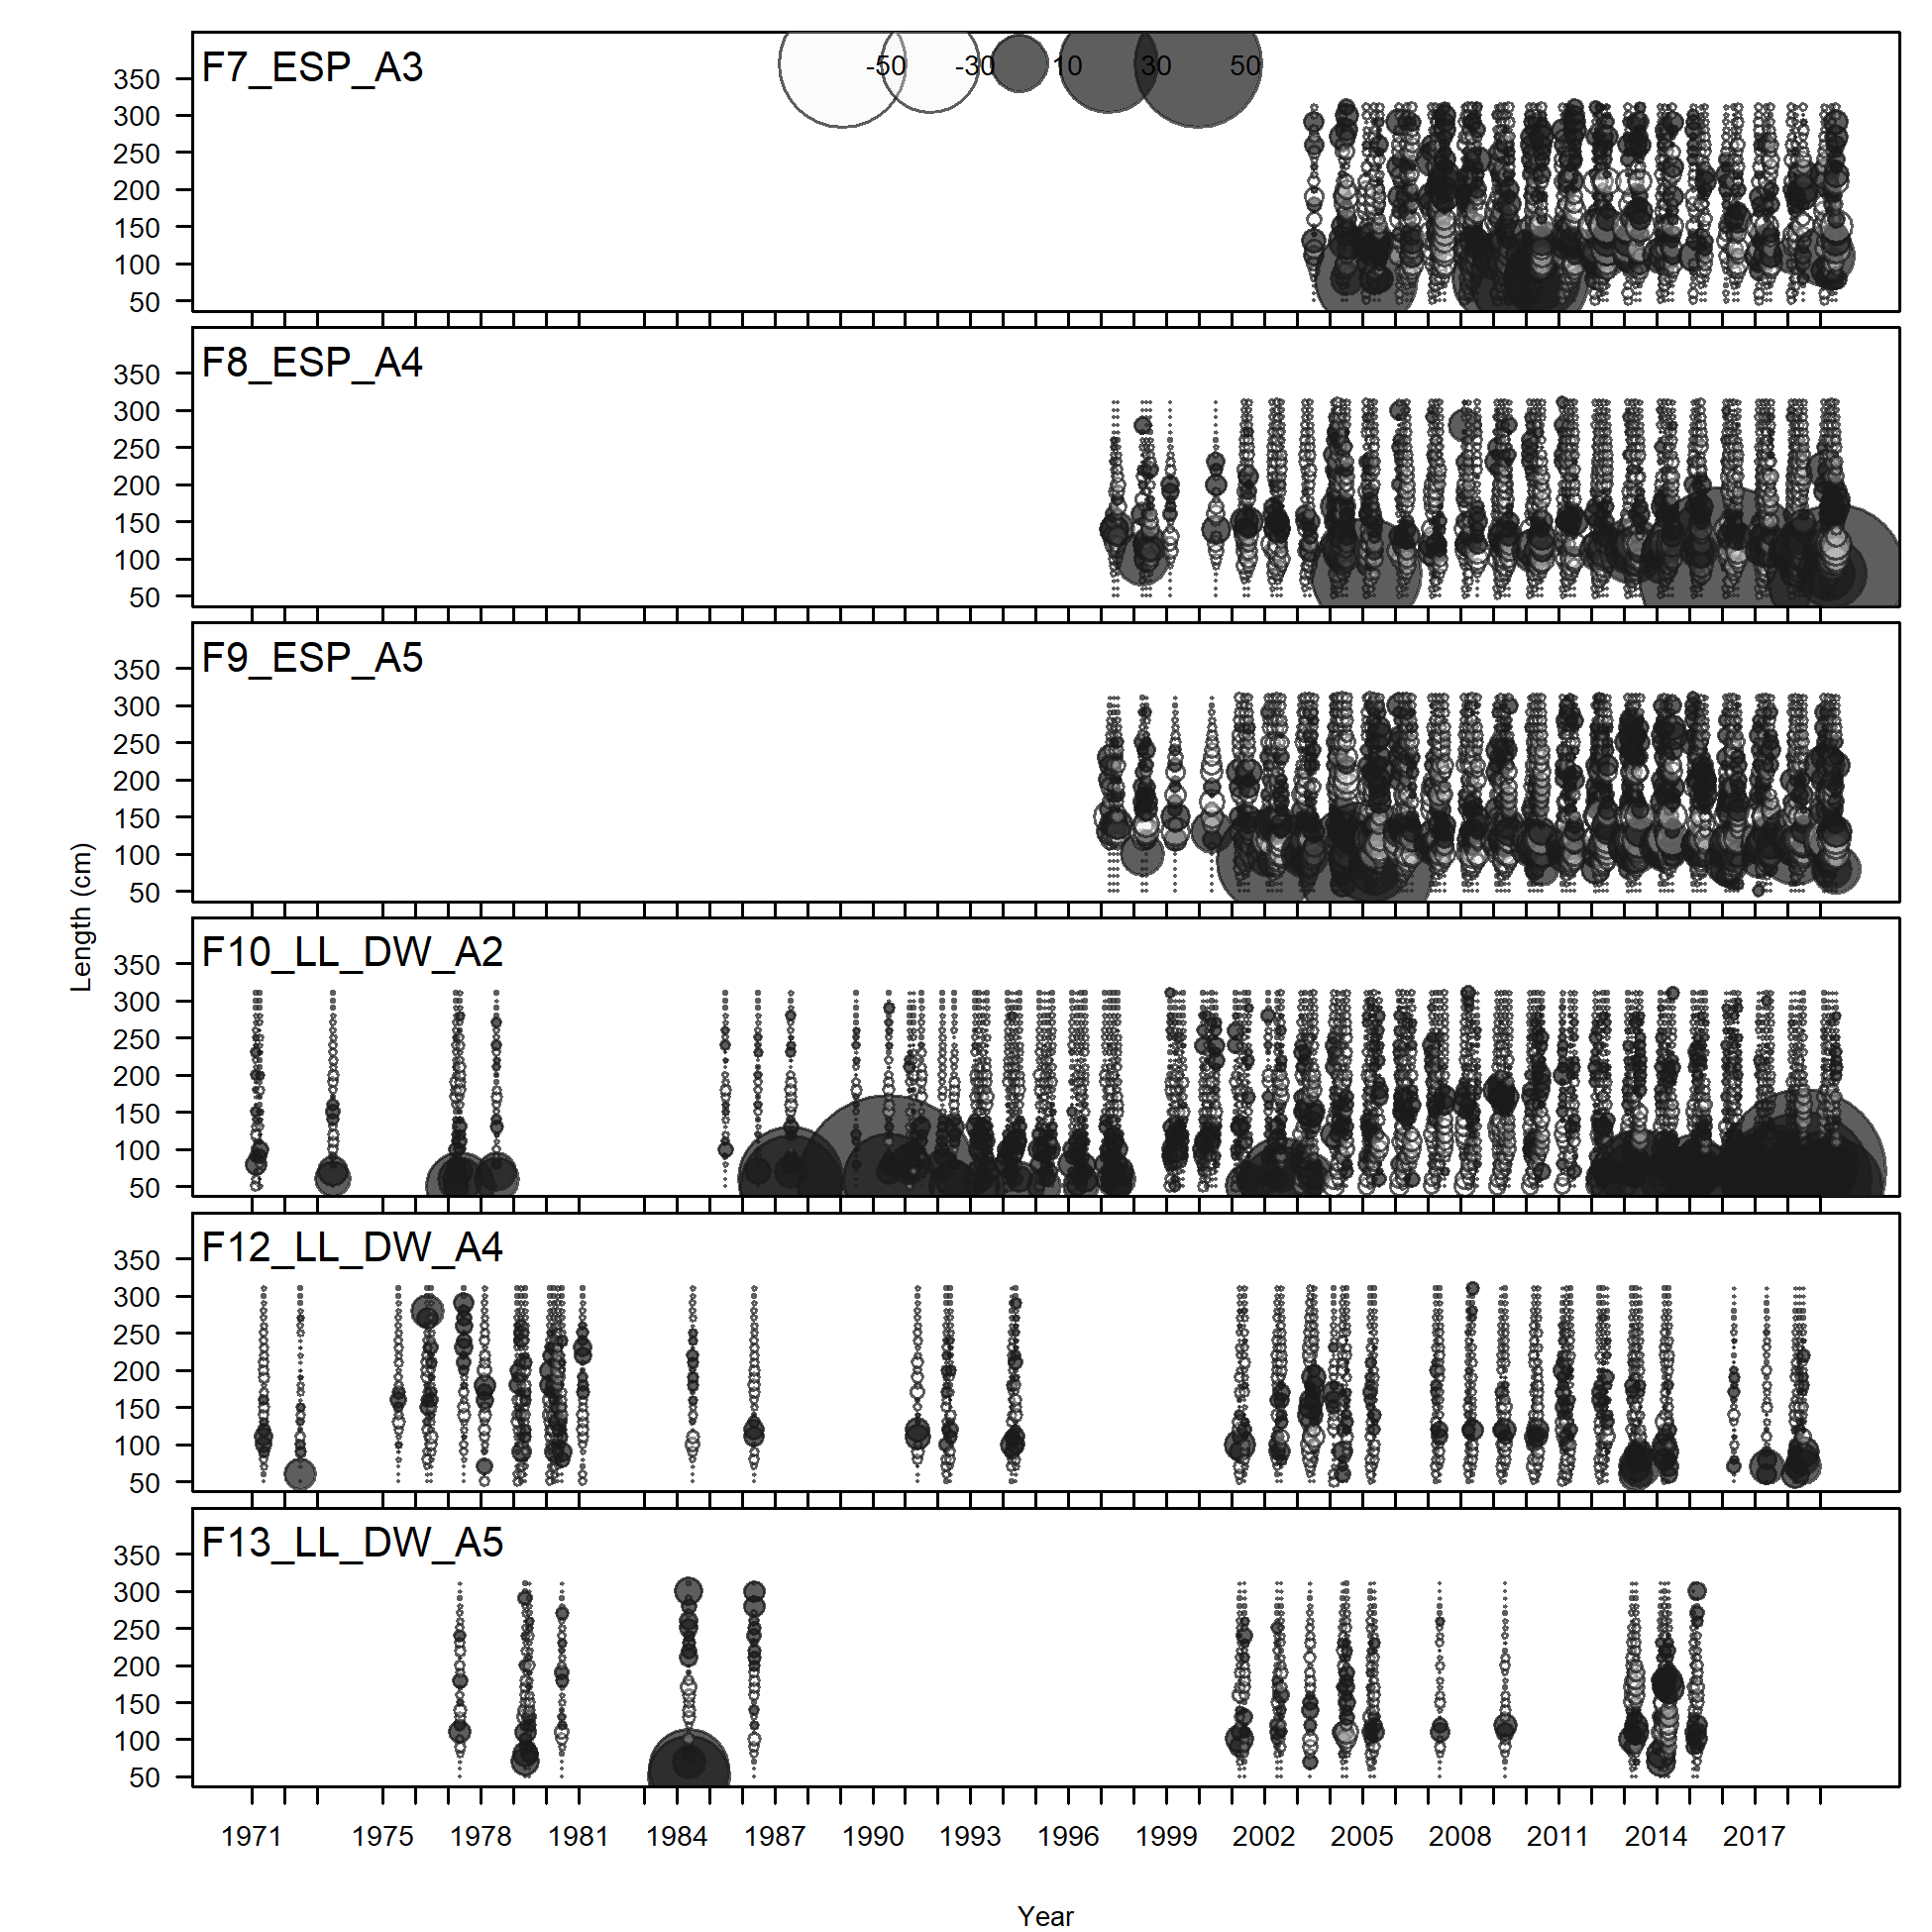
Pearson residuals, comparing across fleets (plot 3 of 4)
file: comp_lenfit__page3_multi-fleet_comparison.png
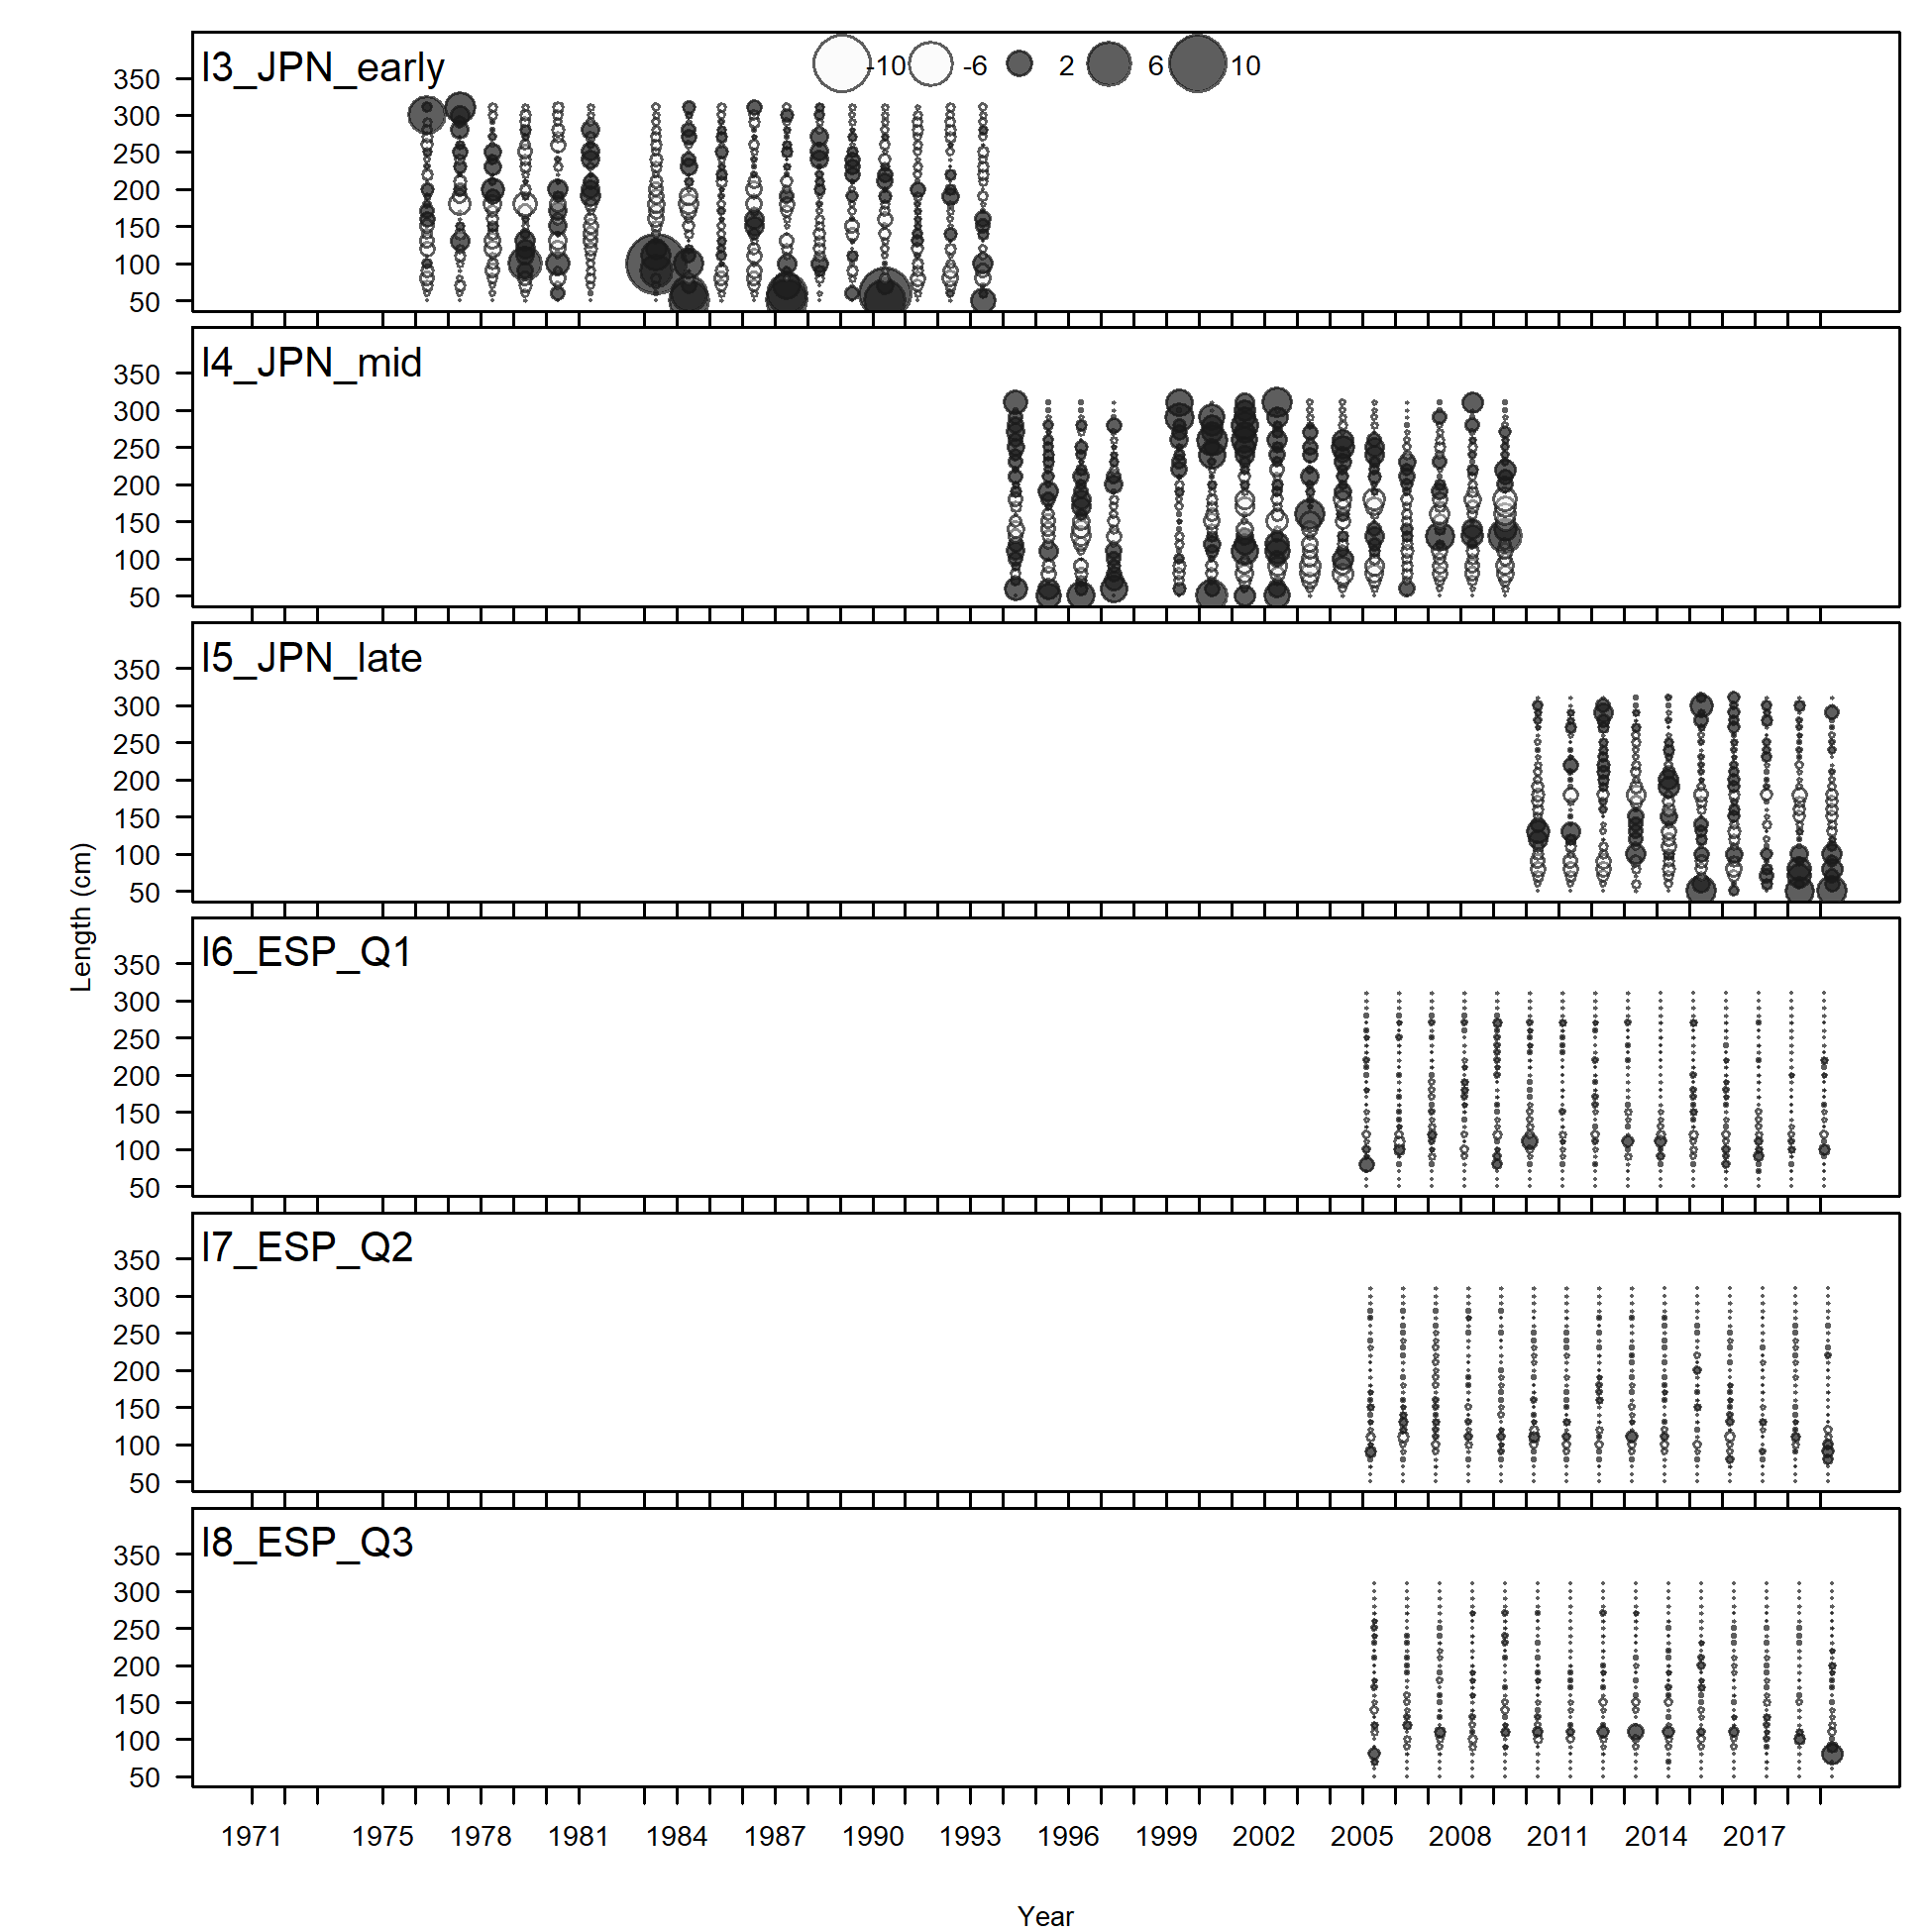
Pearson residuals, comparing across fleets (plot 4 of 4)
file: comp_lenfit__page4_multi-fleet_comparison.png
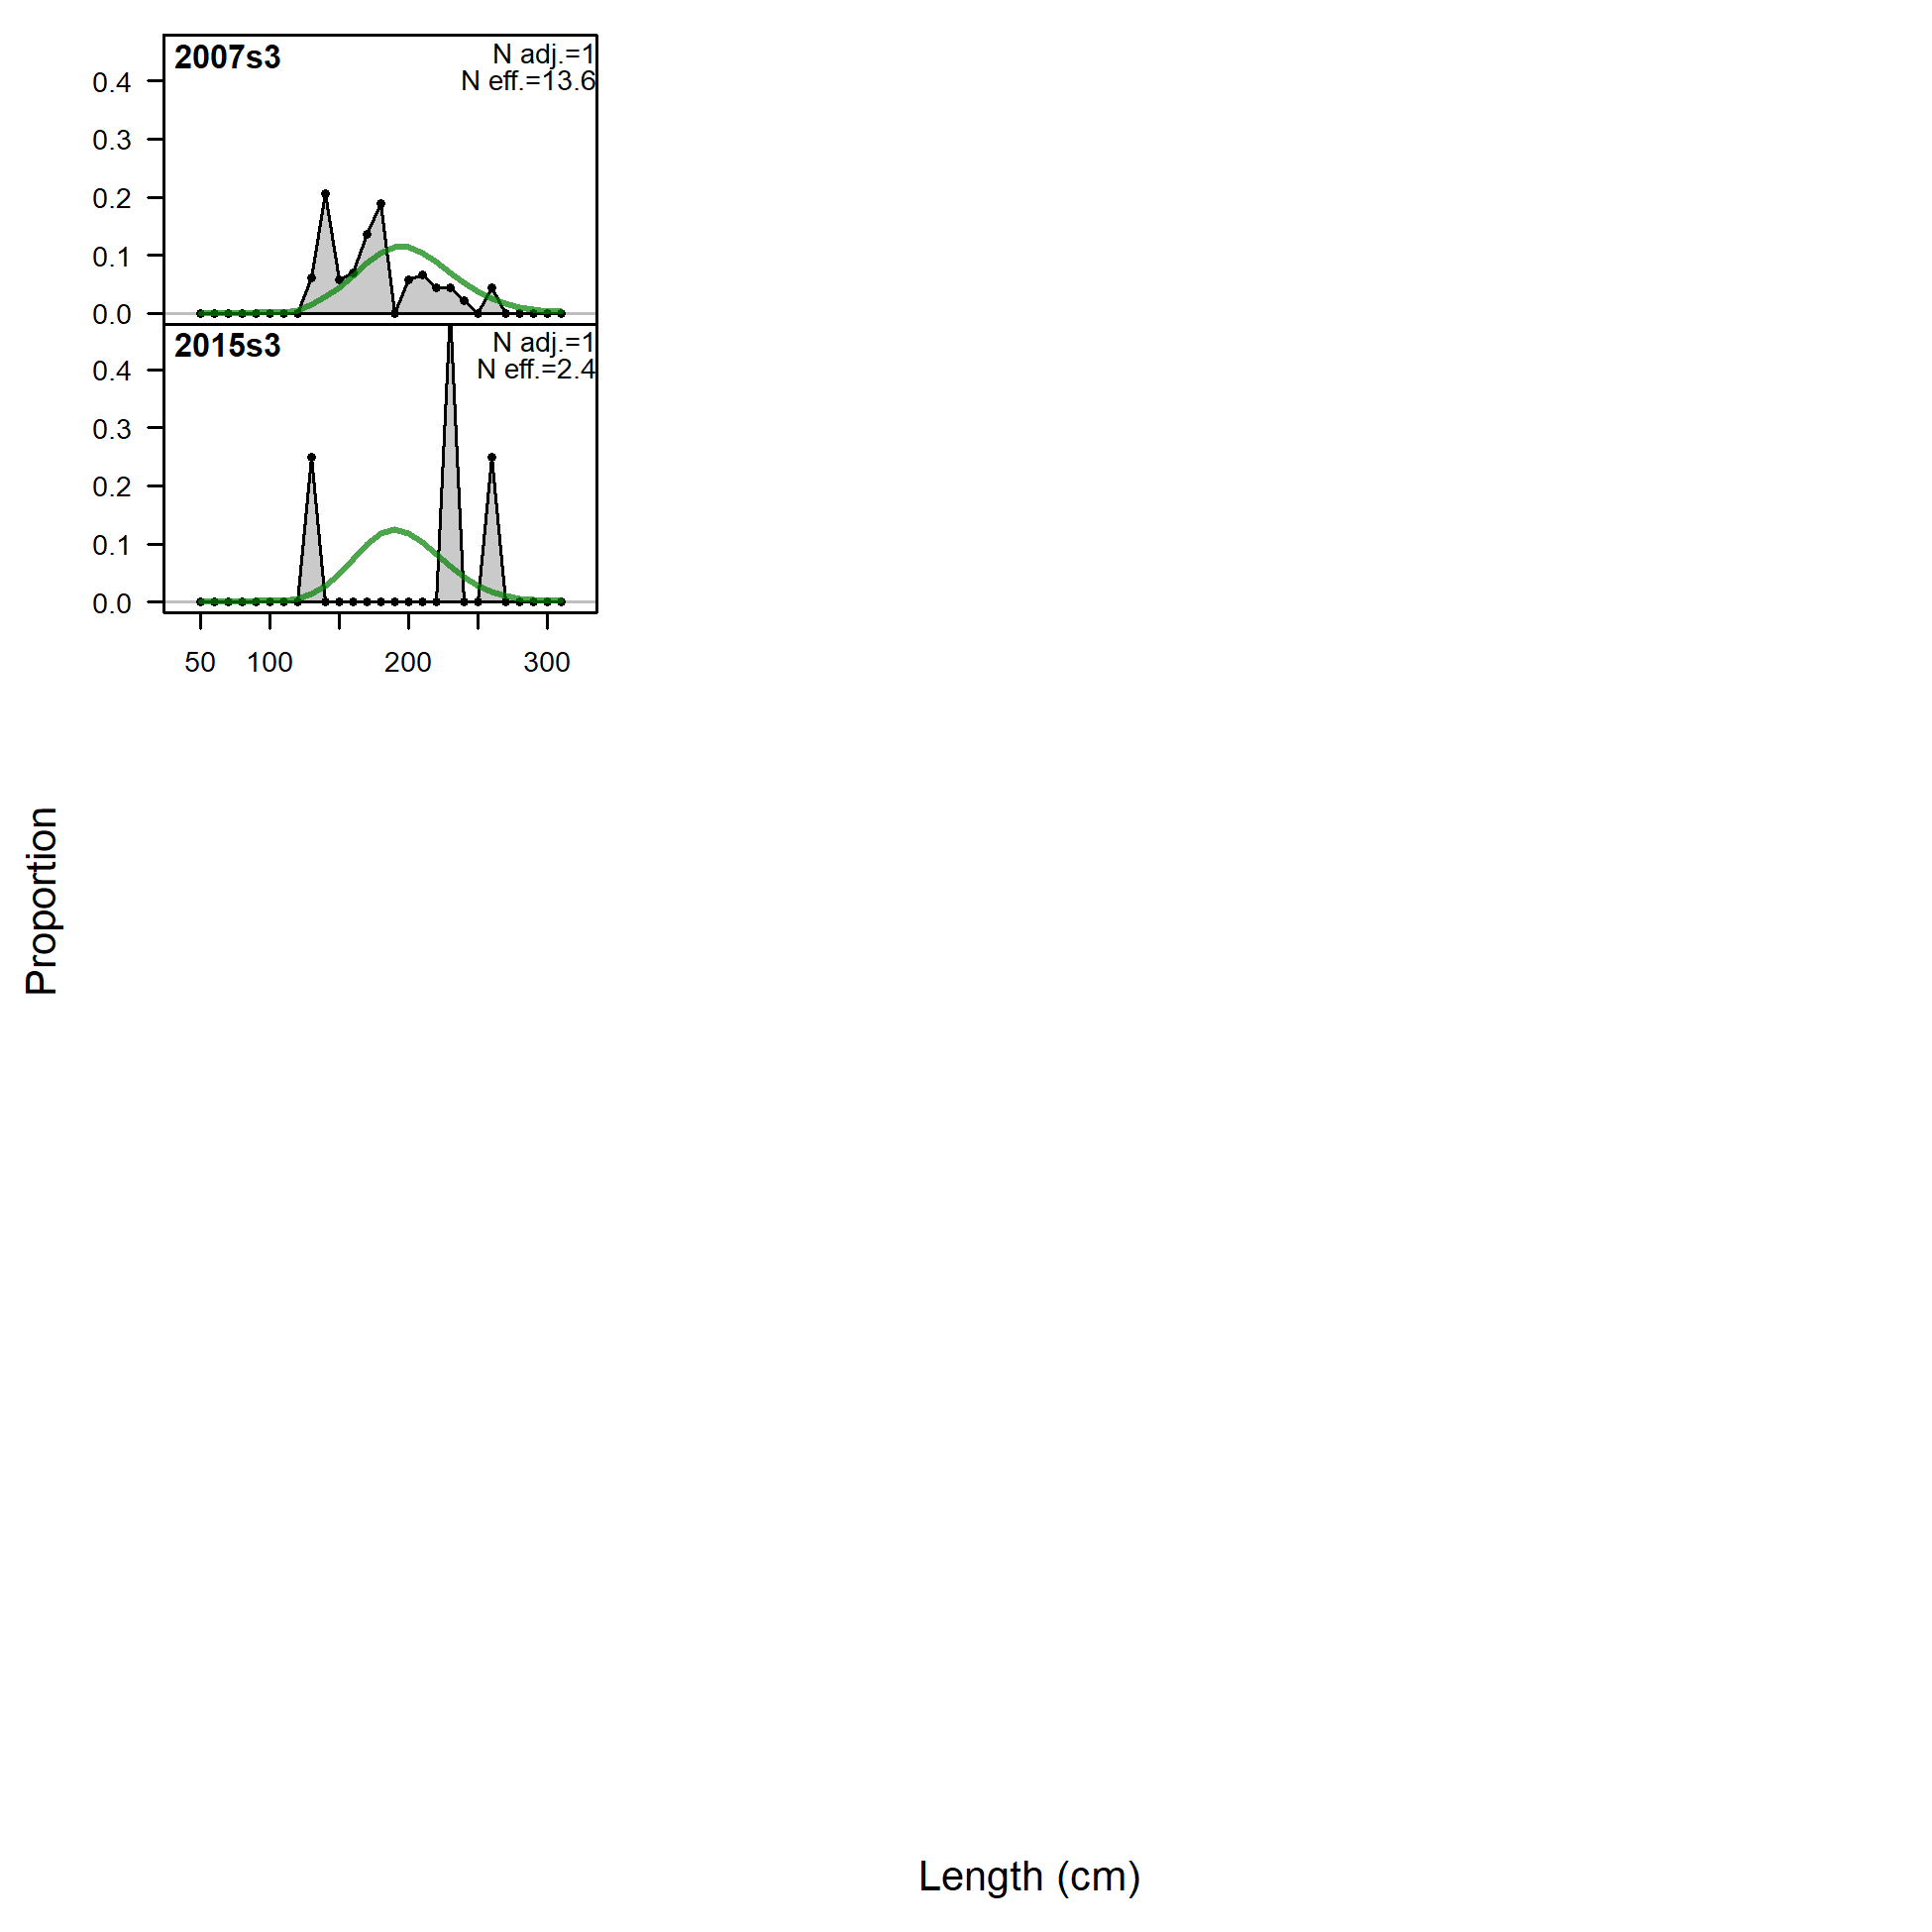
Length comps, whole catch, F1_HAR.
'N adj.' is the input sample size after data-weighting adjustment. N eff. is the calculated effective sample size used in the McAllister-Ianelli tuning method.
file: comp_lenfit_flt1mkt0.png
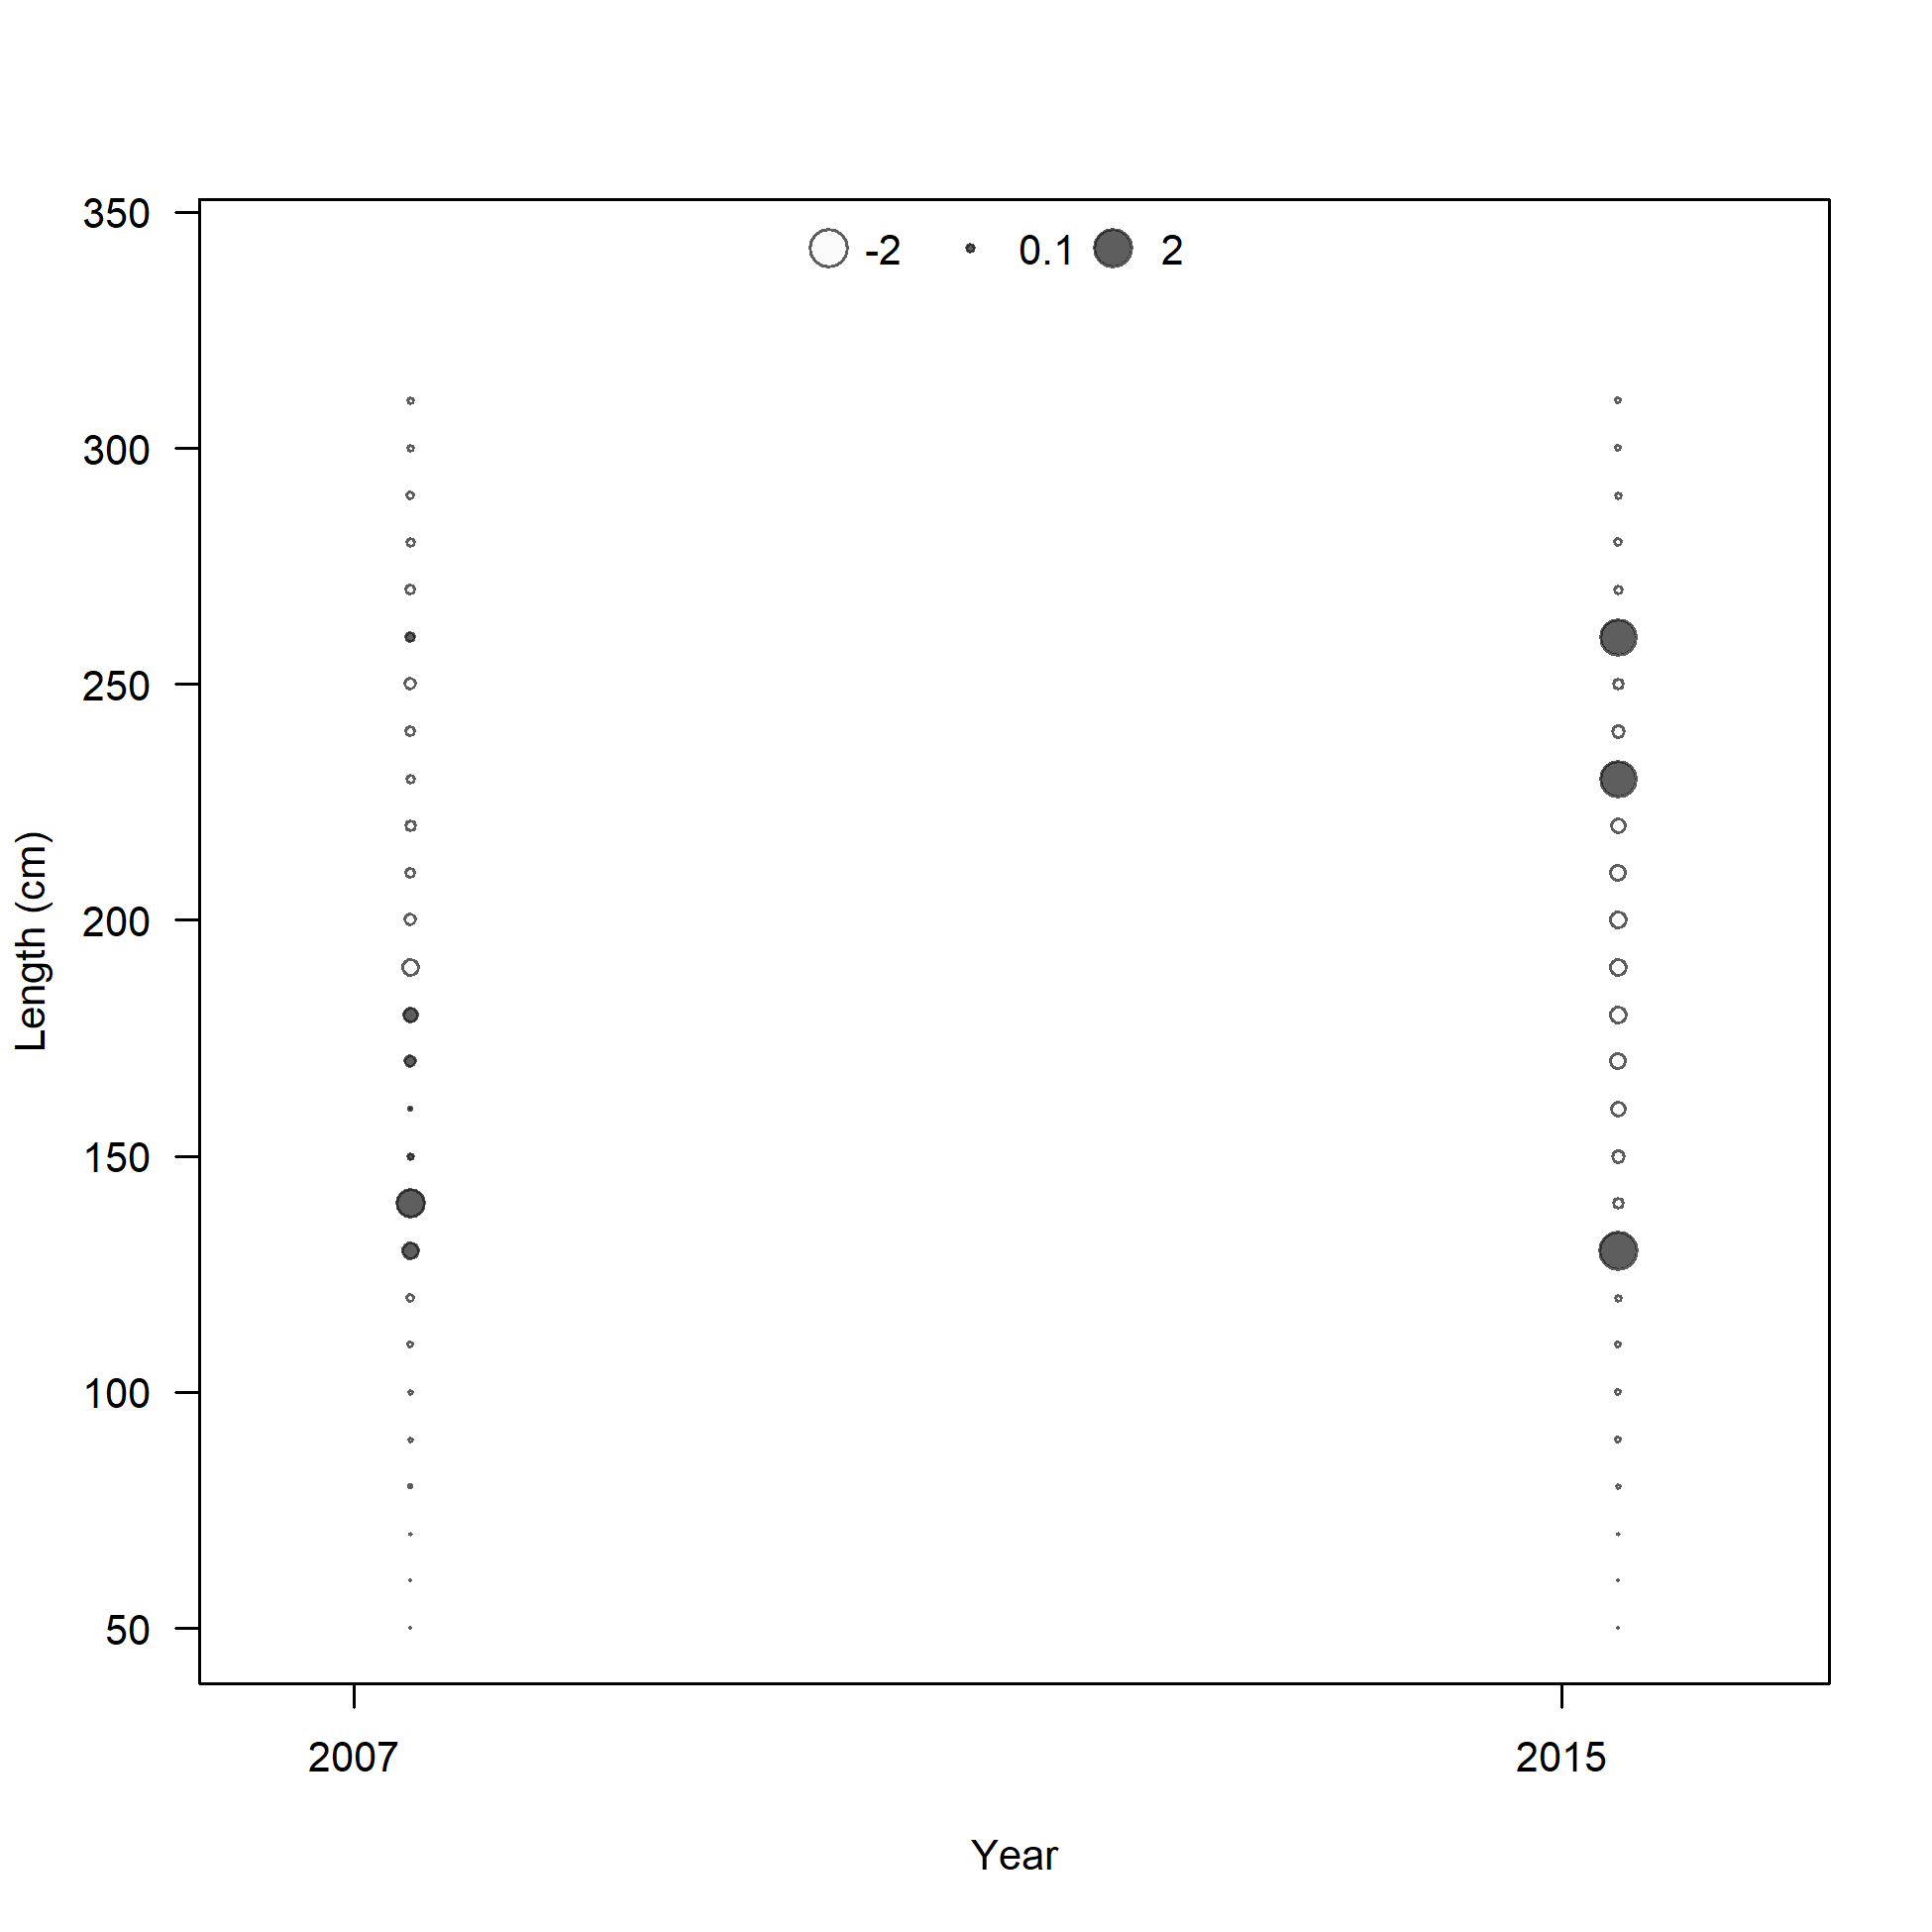
Pearson residuals, whole catch, F1_HAR (max=3.88)
Closed bubbles are positive residuals (observed > expected) and open bubbles are negative residuals (observed < expected).
file: comp_lenfit_residsflt1mkt0.png
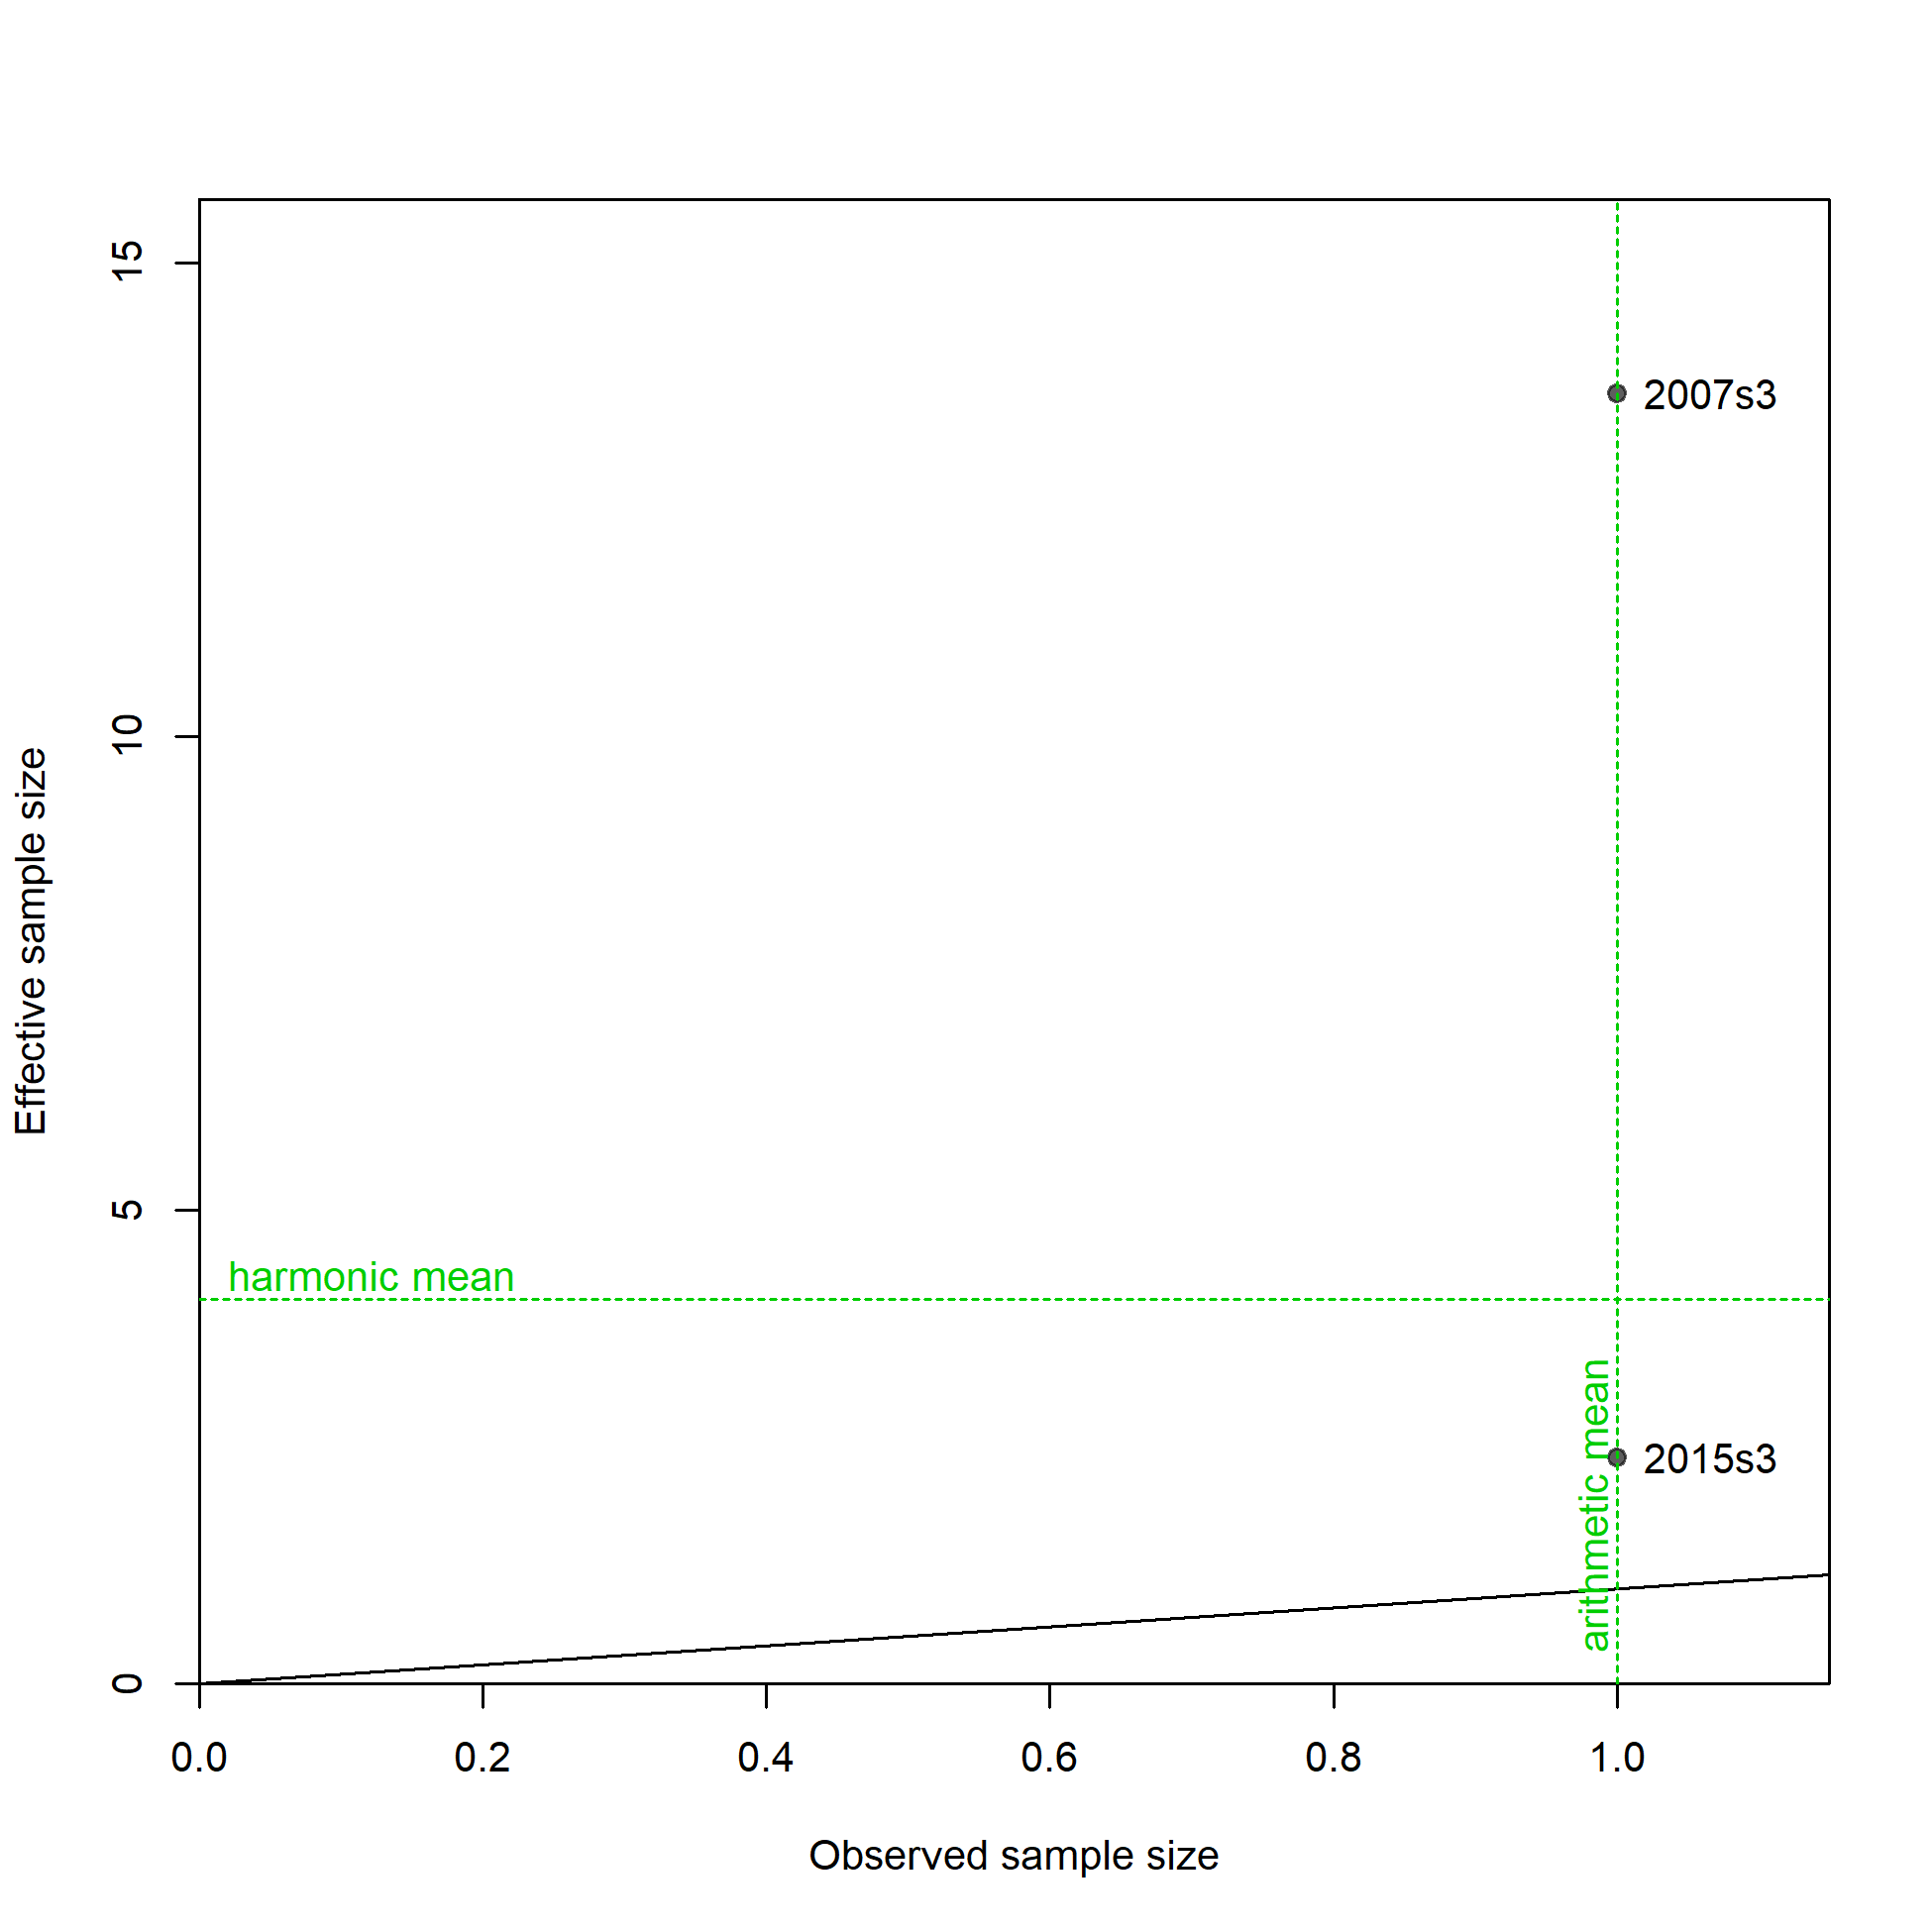
N-EffN comparison, Length comps, whole catch, F1_HAR
file: comp_lenfit_sampsize_flt1mkt0.png
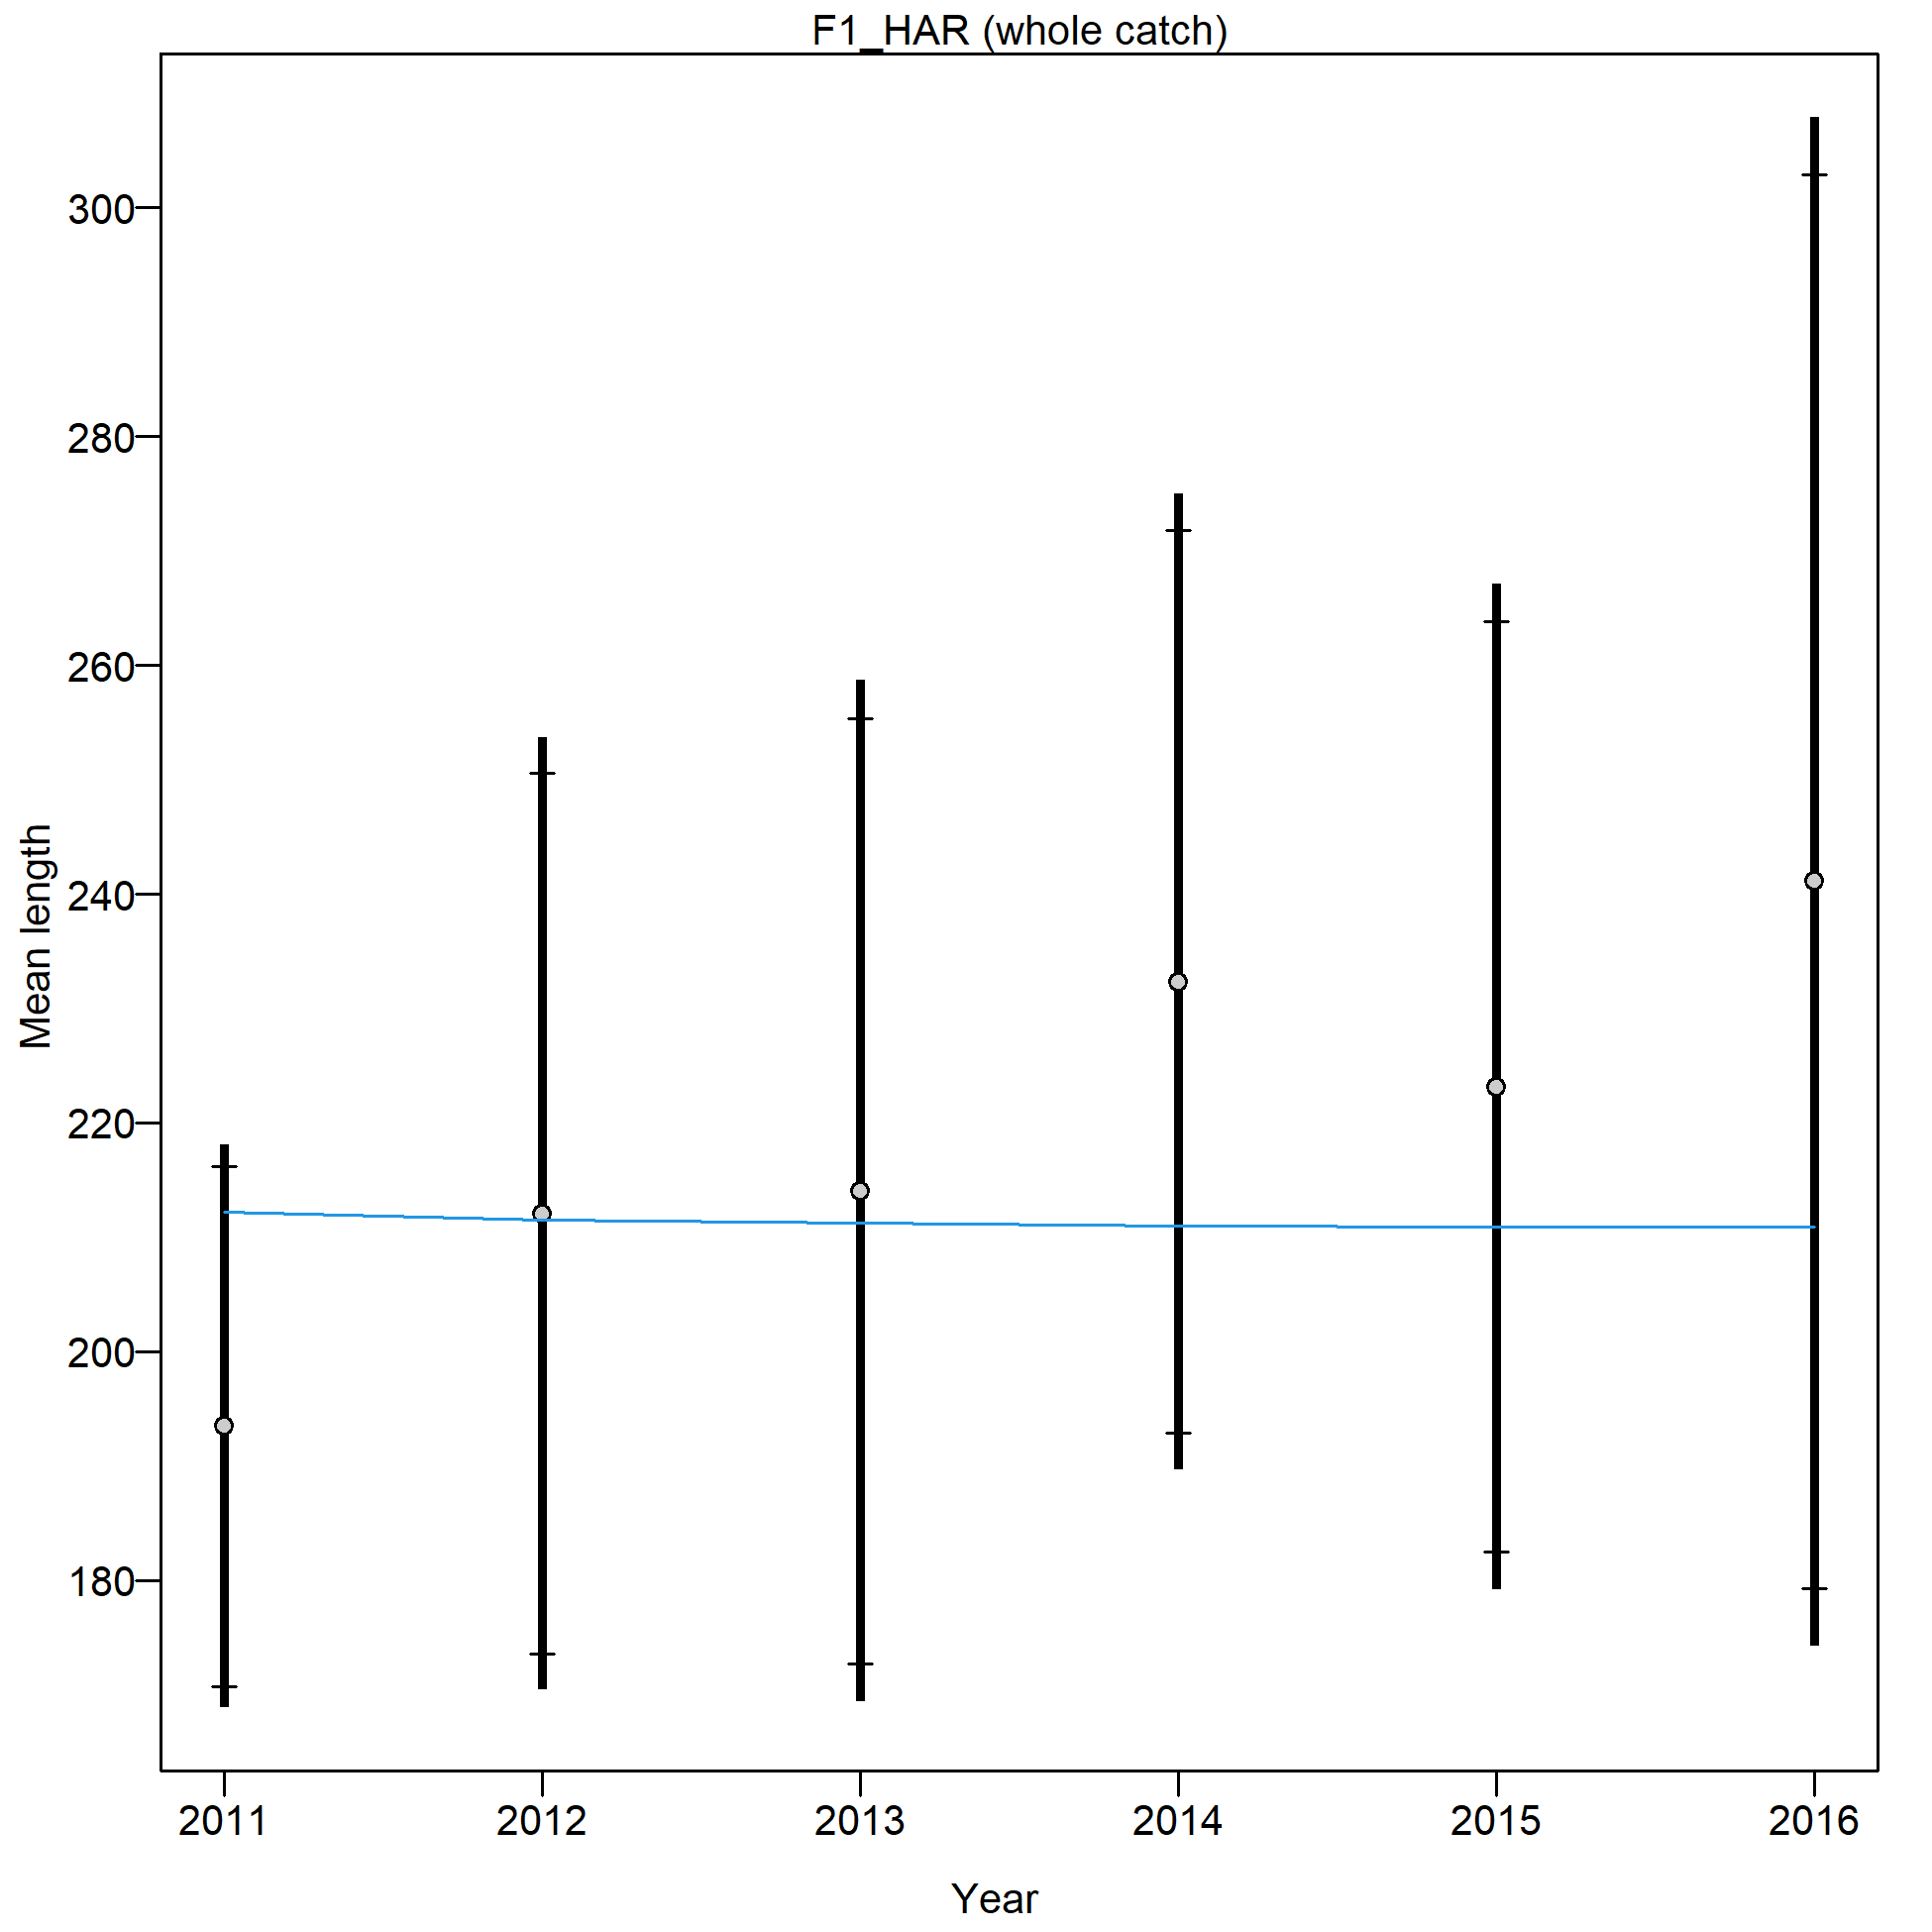
Mean length for F1_HAR with 95% confidence intervals based on current samples sizes.
Francis data weighting method TA1.8: thinner intervals (with capped ends) show result of further adjusting sample sizes based on suggested multiplier (with 95% interval) for len data from F1_HAR:
1.1693 (0.6445-13.1251)
For more info, see
Francis, R.I.C.C. (2011). Data weighting in statistical fisheries stock assessment models. Can. J. Fish. Aquat. Sci. 68: 1124-1138. https://doi.org/10.1139/f2011-025
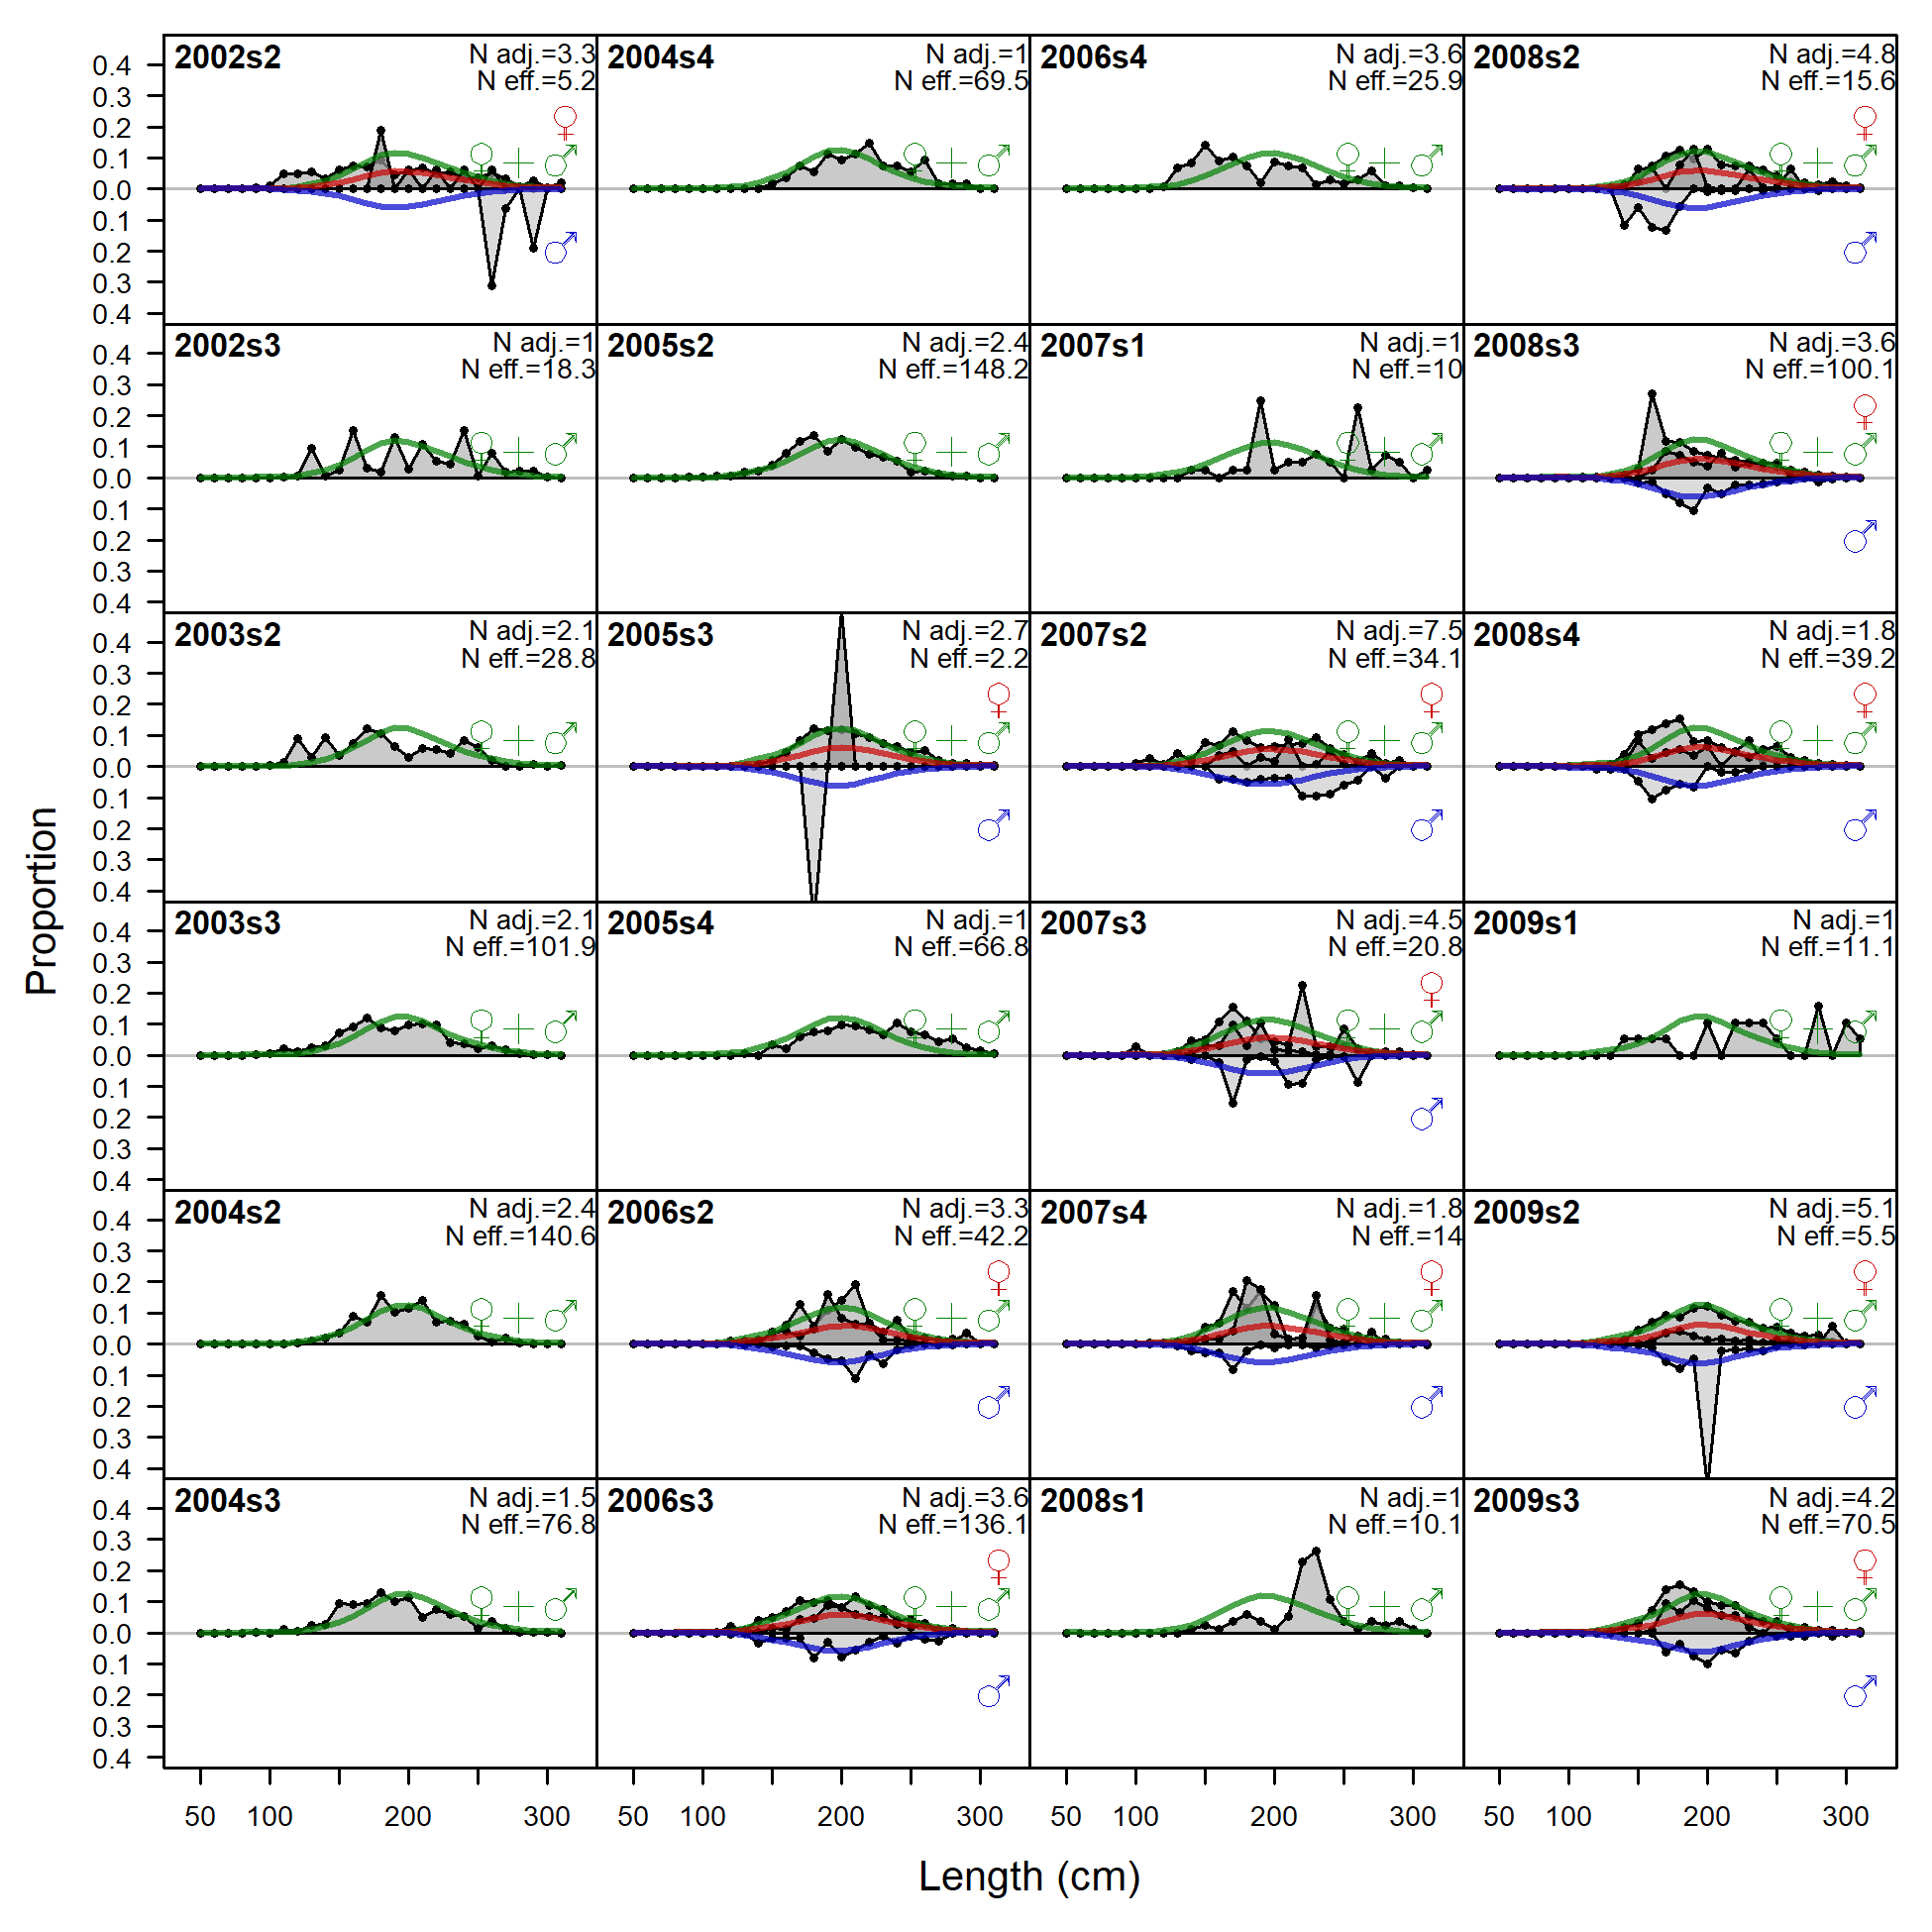
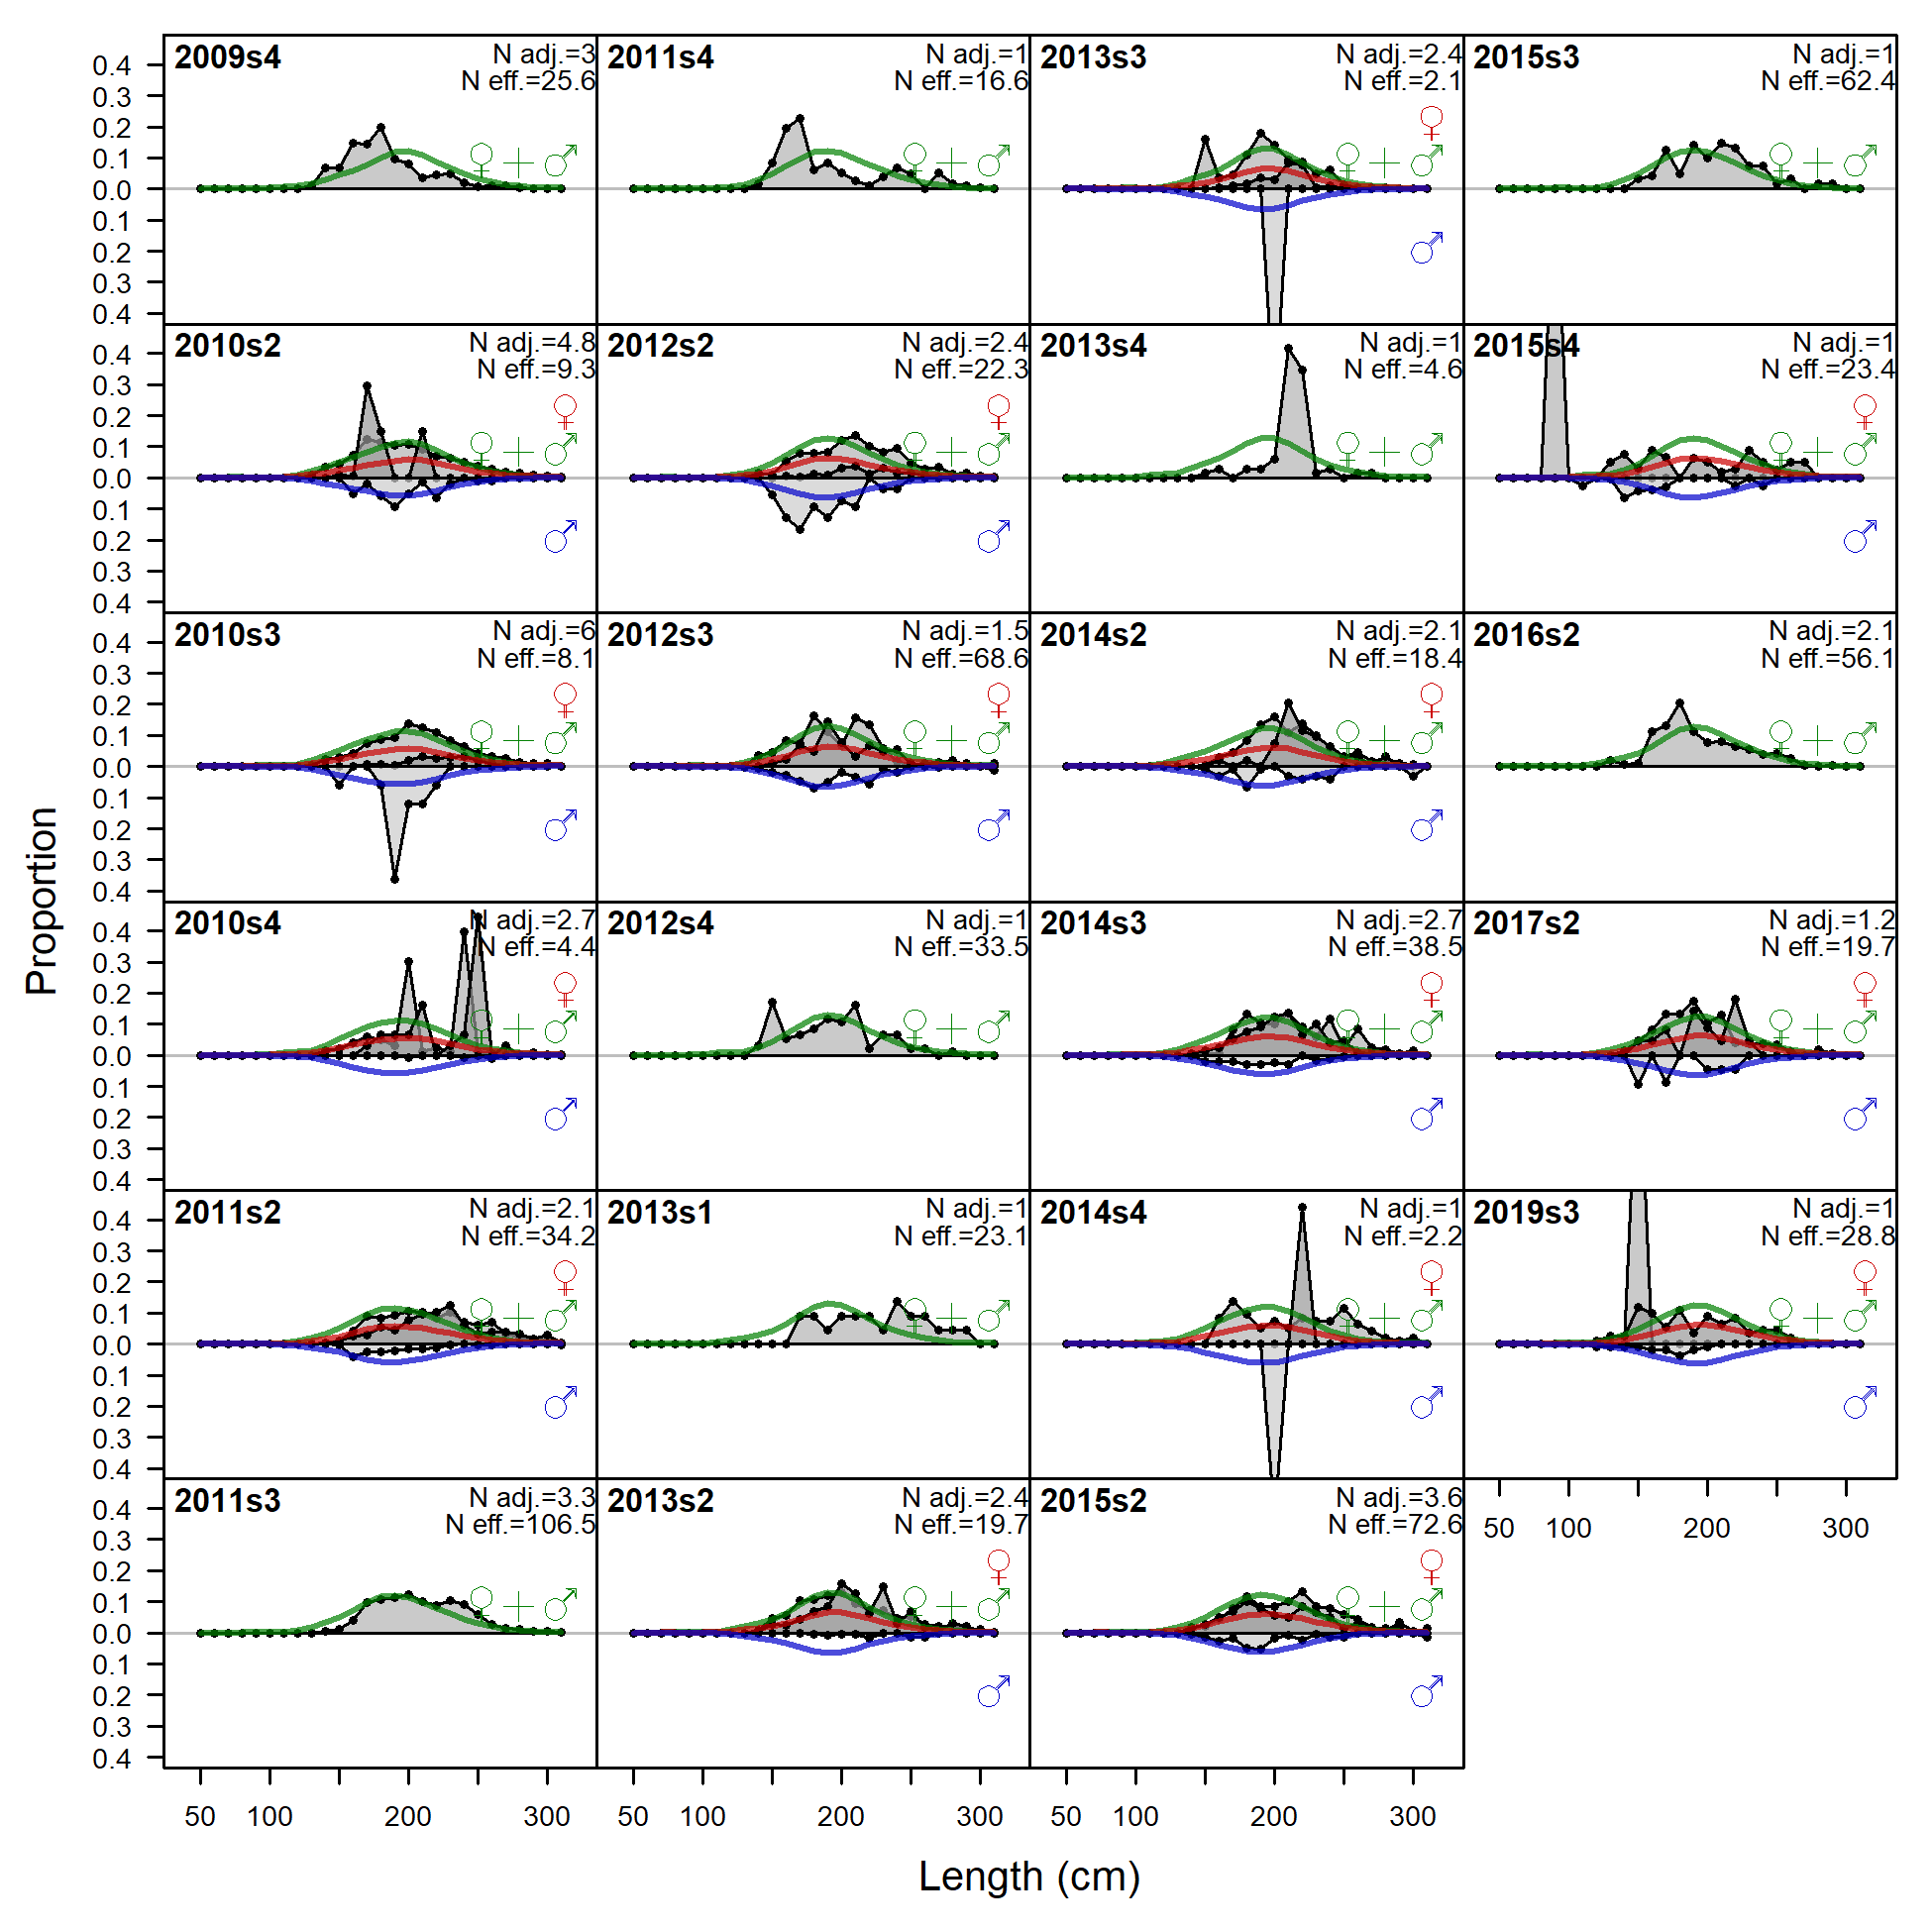
Length comps, whole catch, F2_GN_A4.
'N adj.' is the input sample size after data-weighting adjustment. N eff. is the calculated effective sample size used in the McAllister-Ianelli tuning method.
file: comp_lenfit_flt2mkt0.png
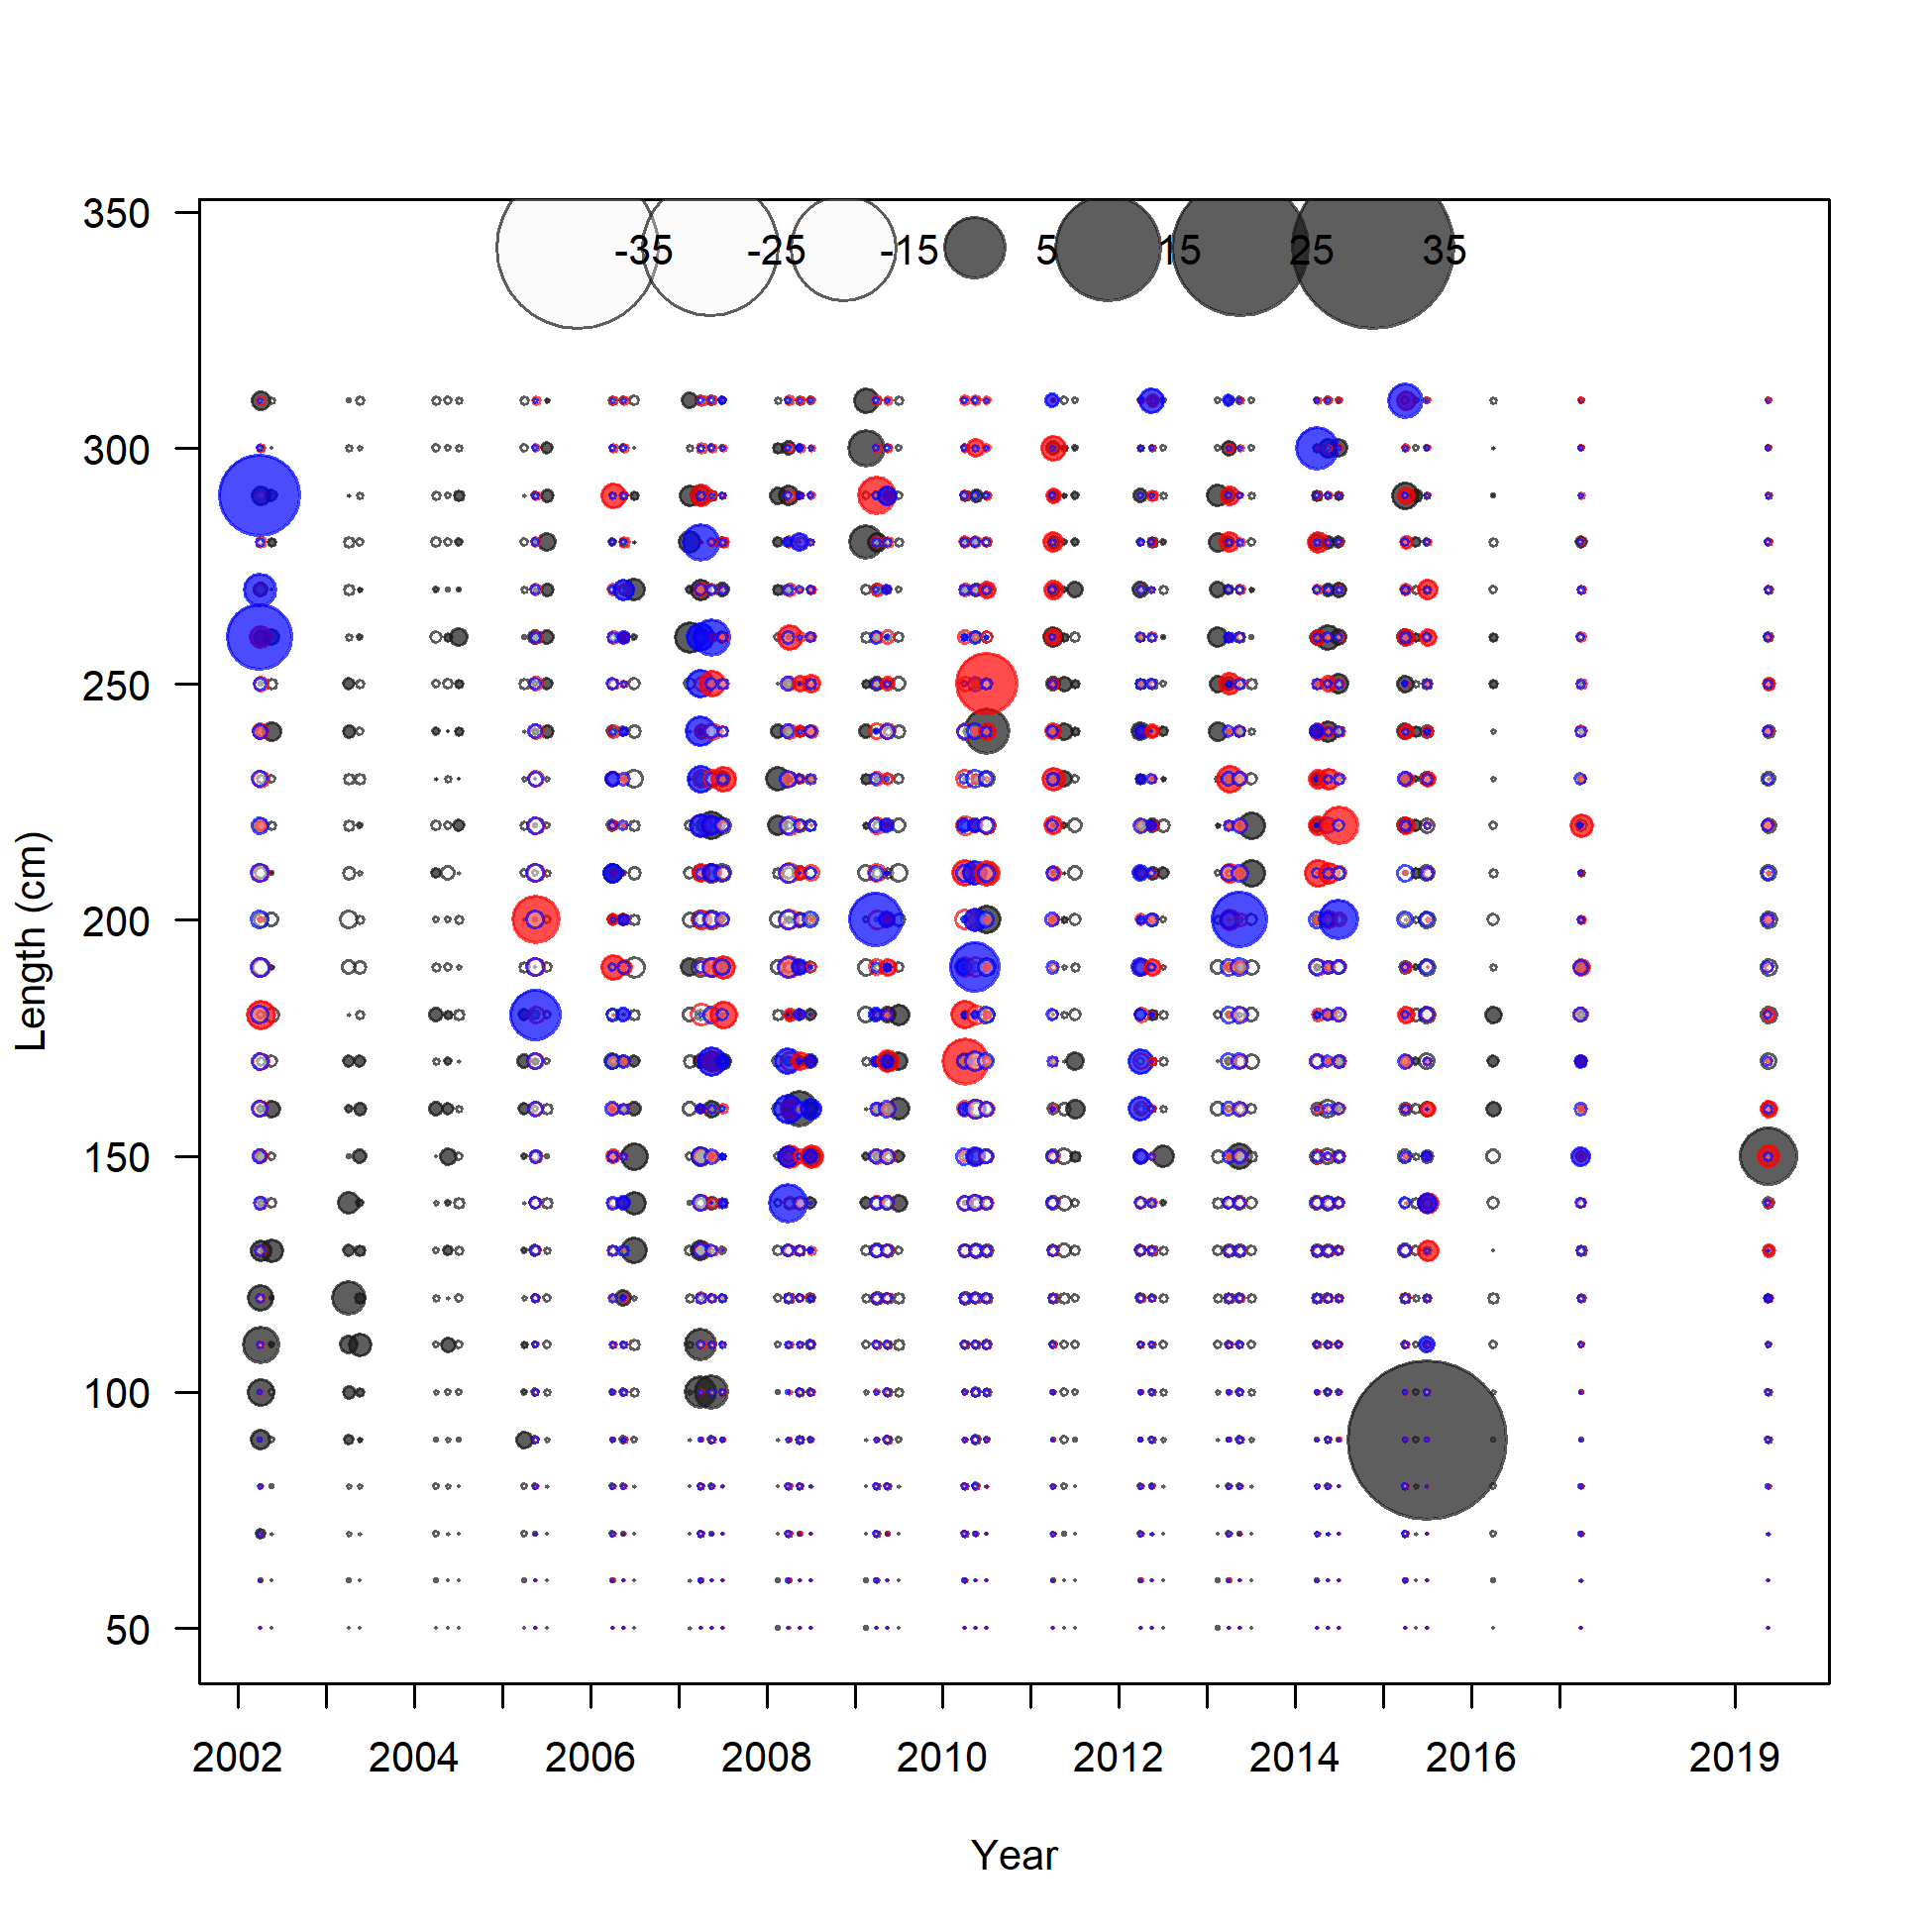
Pearson residuals, whole catch, F2_GN_A4 (max=1.99)
Closed bubbles are positive residuals (observed > expected) and open bubbles are negative residuals (observed < expected).
file: comp_lenfit_residsflt2mkt0.png
N-EffN comparison, Length comps, whole catch, F2_GN_A4
file: comp_lenfit_sampsize_flt2mkt0.png
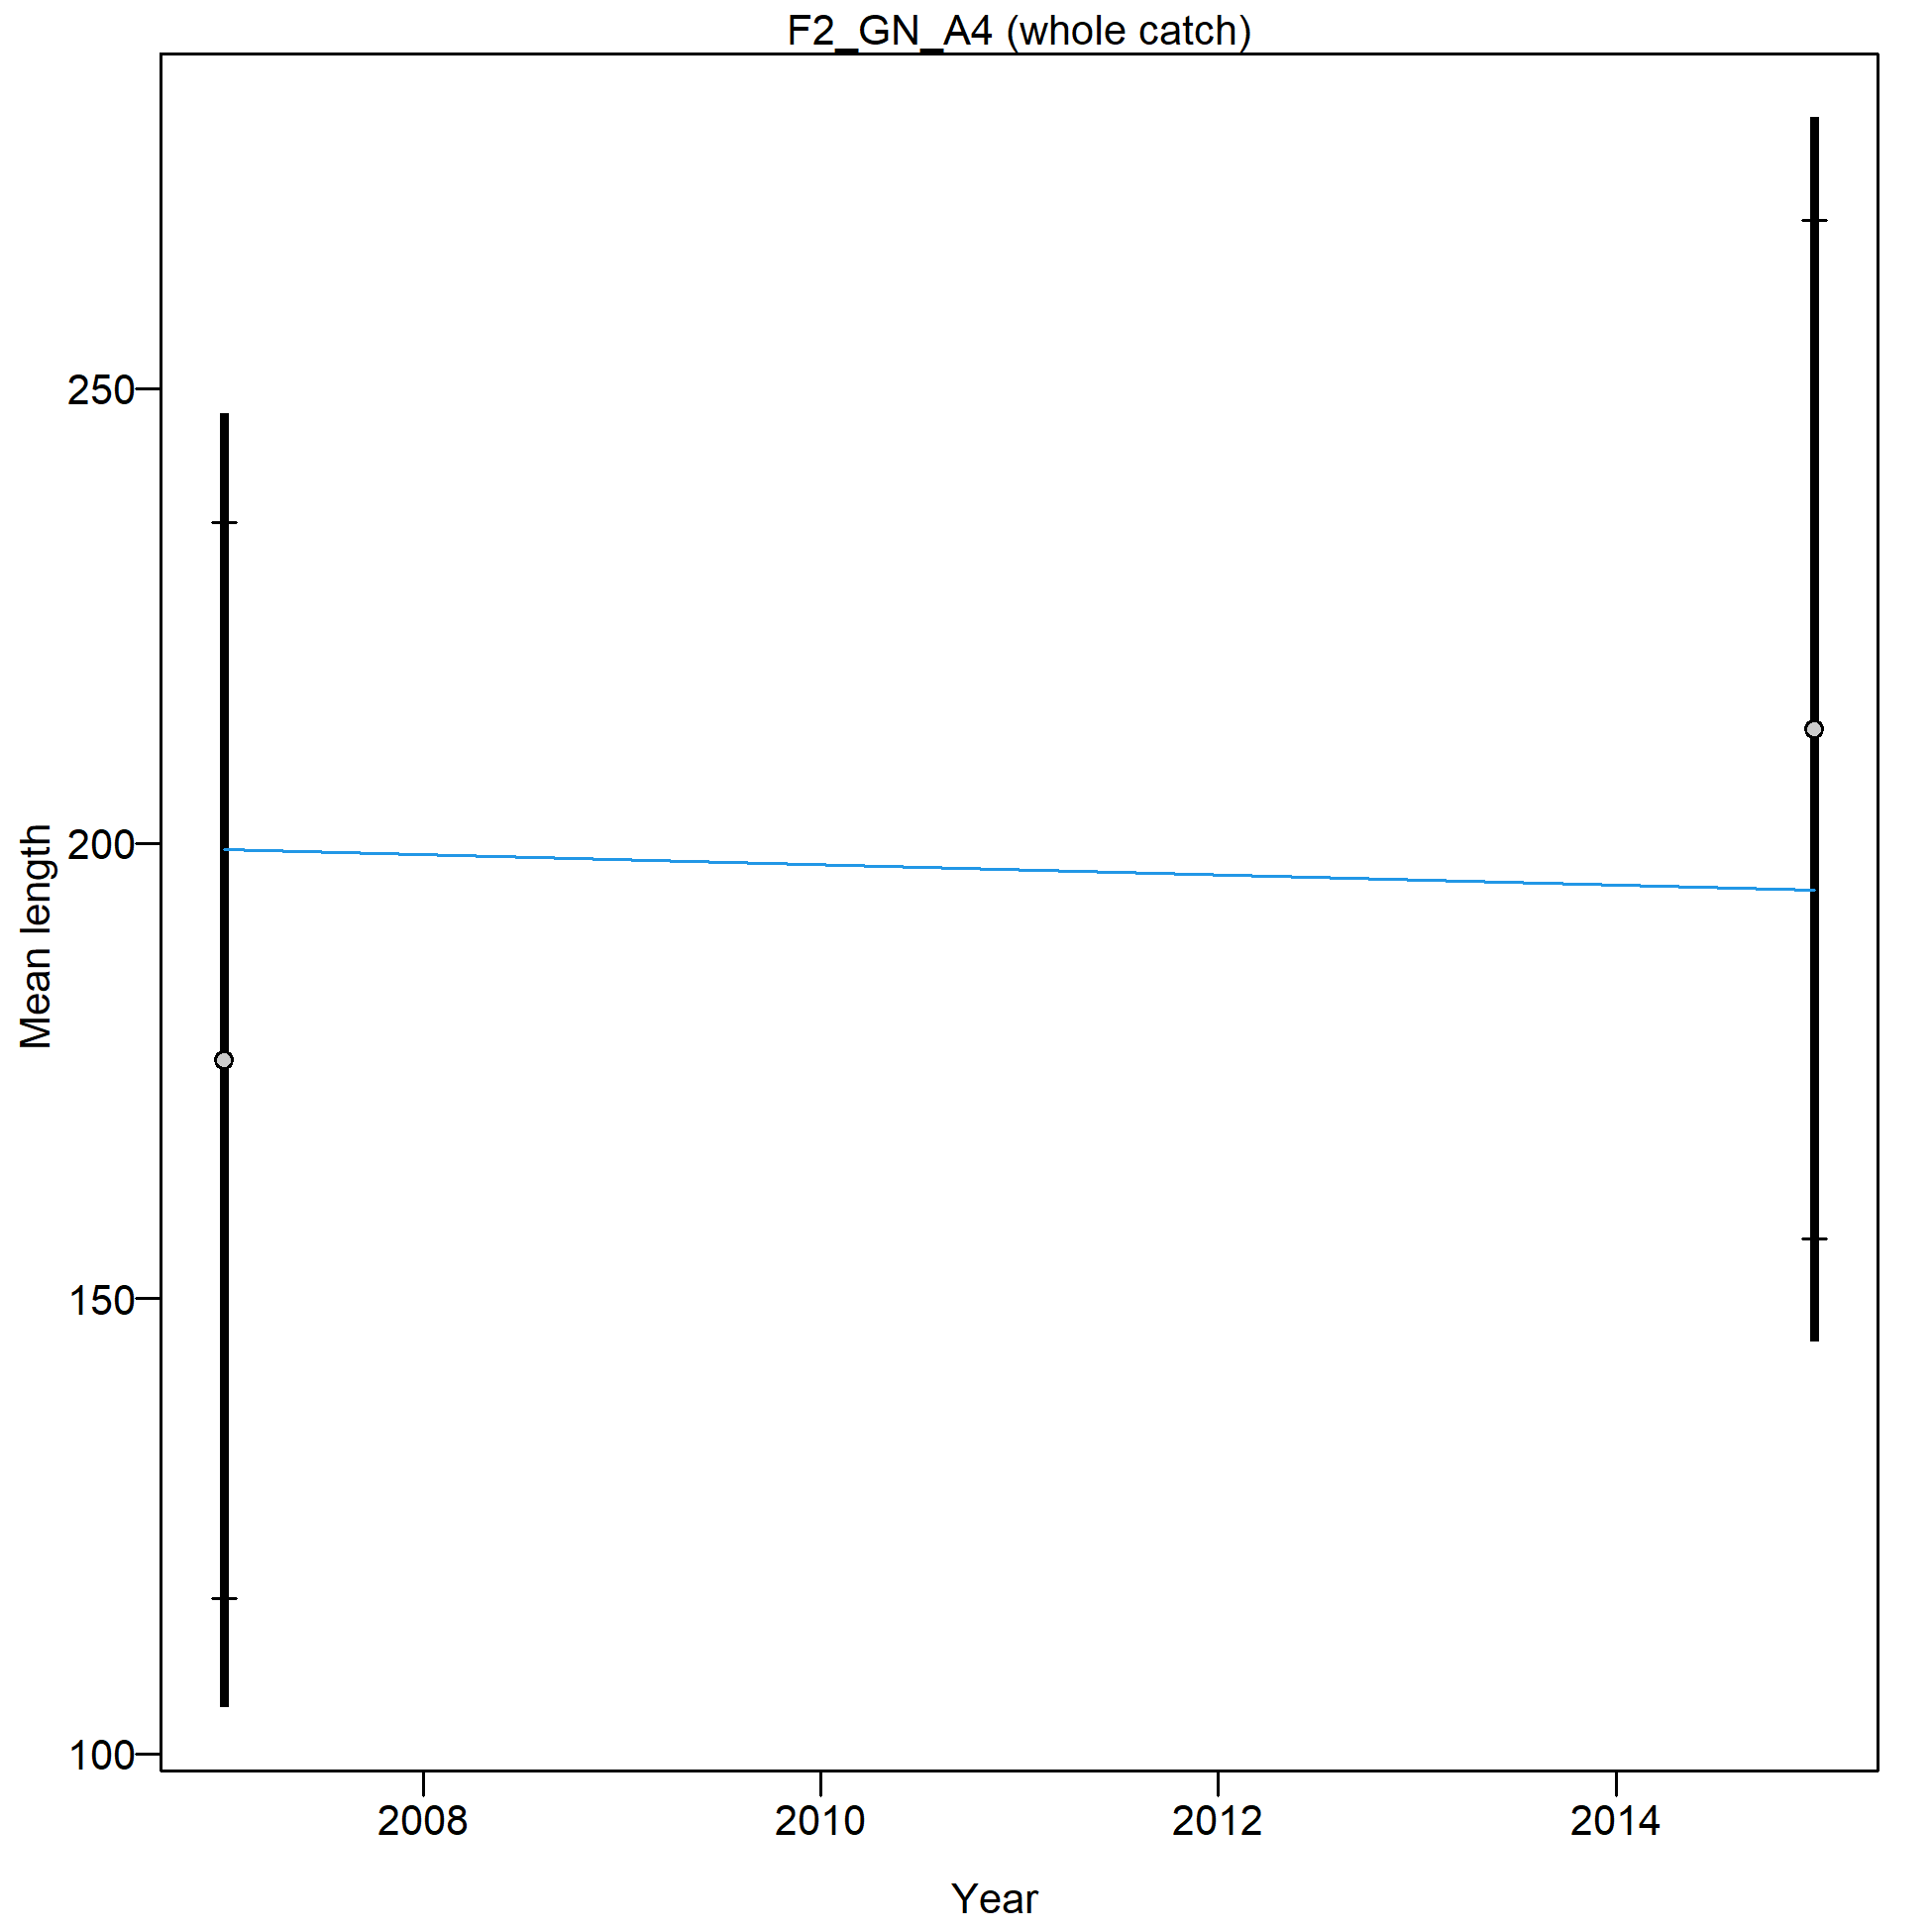
Mean length for F2_GN_A4 with 95% confidence intervals based on current samples sizes.
Francis data weighting method TA1.8: thinner intervals (with capped ends) show result of further adjusting sample sizes based on suggested multiplier (with 95% interval) for len data from F2_GN_A4:
1.4471 (1.4471-Inf)
For more info, see
Francis, R.I.C.C. (2011). Data weighting in statistical fisheries stock assessment models. Can. J. Fish. Aquat. Sci. 68: 1124-1138. https://doi.org/10.1139/f2011-025
Length comps, whole catch, F3_GN_A5 (plot 1 of 2).
'N adj.' is the input sample size after data-weighting adjustment. N eff. is the calculated effective sample size used in the McAllister-Ianelli tuning method.
file: comp_lenfit_flt3mkt0_page1.png
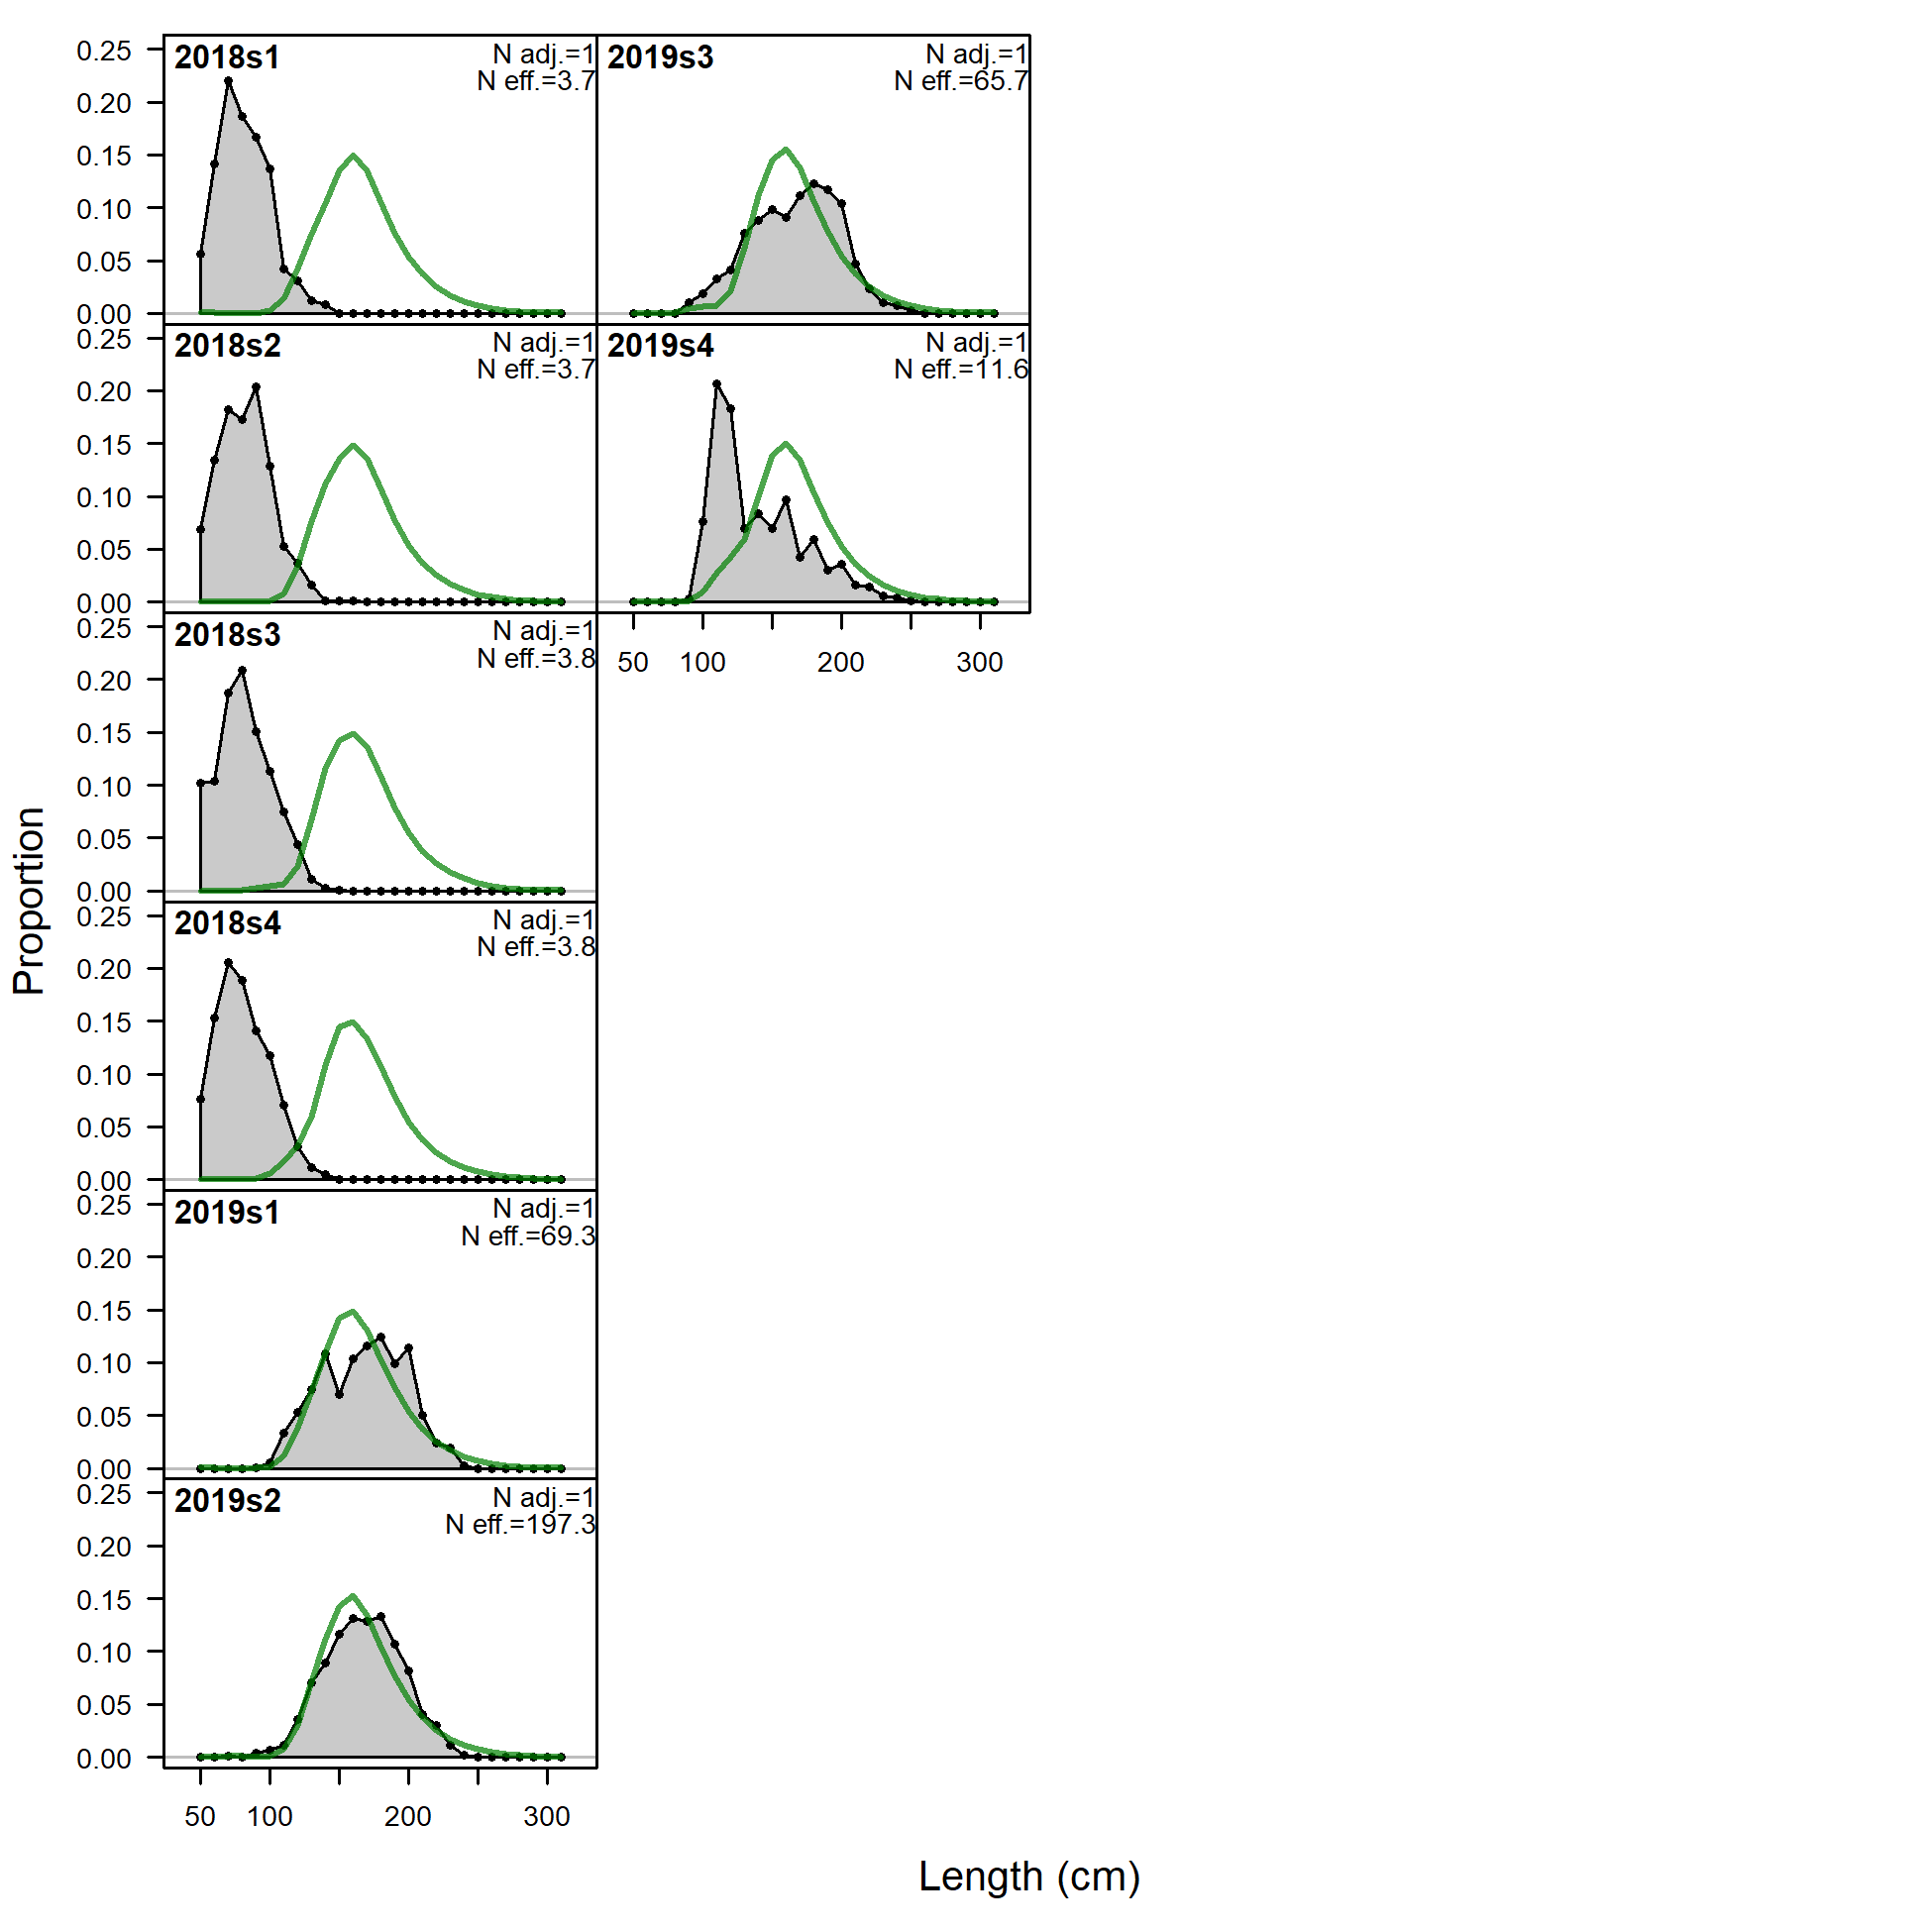
Length comps, whole catch, F3_GN_A5 (plot 1 of 2).
'N adj.' is the input sample size after data-weighting adjustment. N eff. is the calculated effective sample size used in the McAllister-Ianelli tuning method. (plot 2 of 2)
file: comp_lenfit_flt3mkt0_page2.png
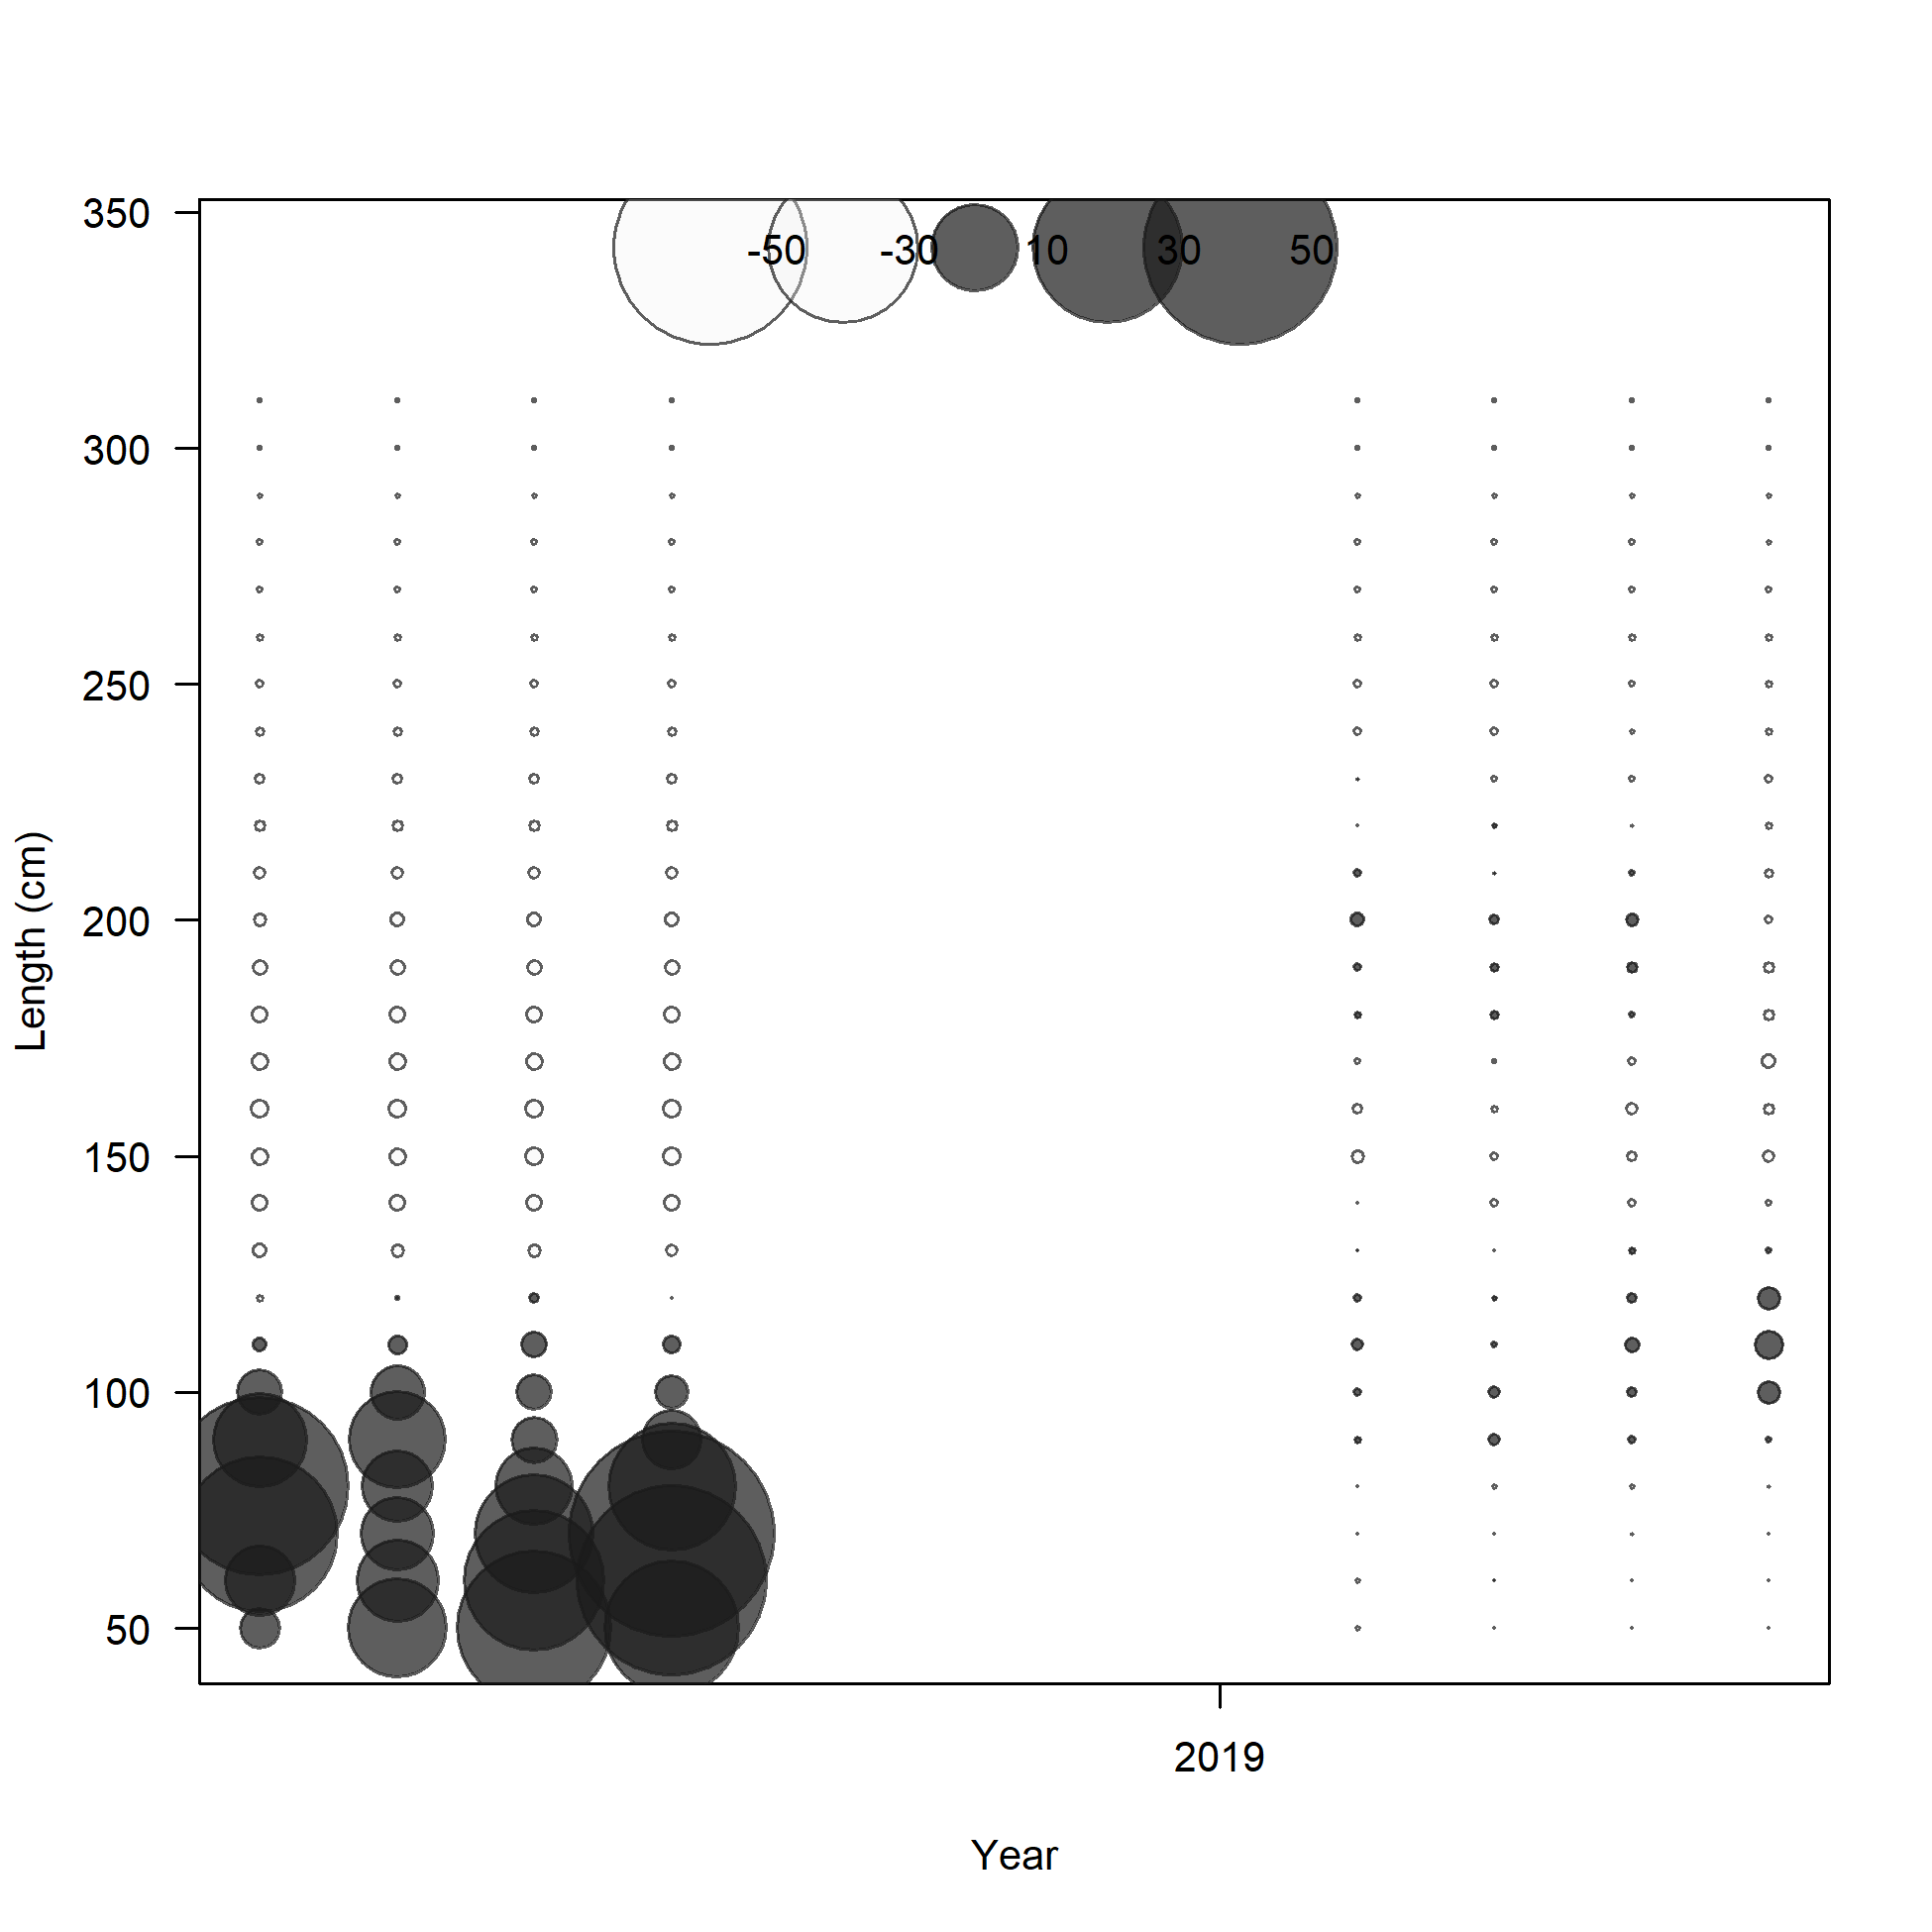
Pearson residuals, whole catch, F3_GN_A5 (max=33.76) (plot 2 of 2)
Closed bubbles are positive residuals (observed > expected) and open bubbles are negative residuals (observed < expected).
file: comp_lenfit_residsflt3mkt0_page2.png
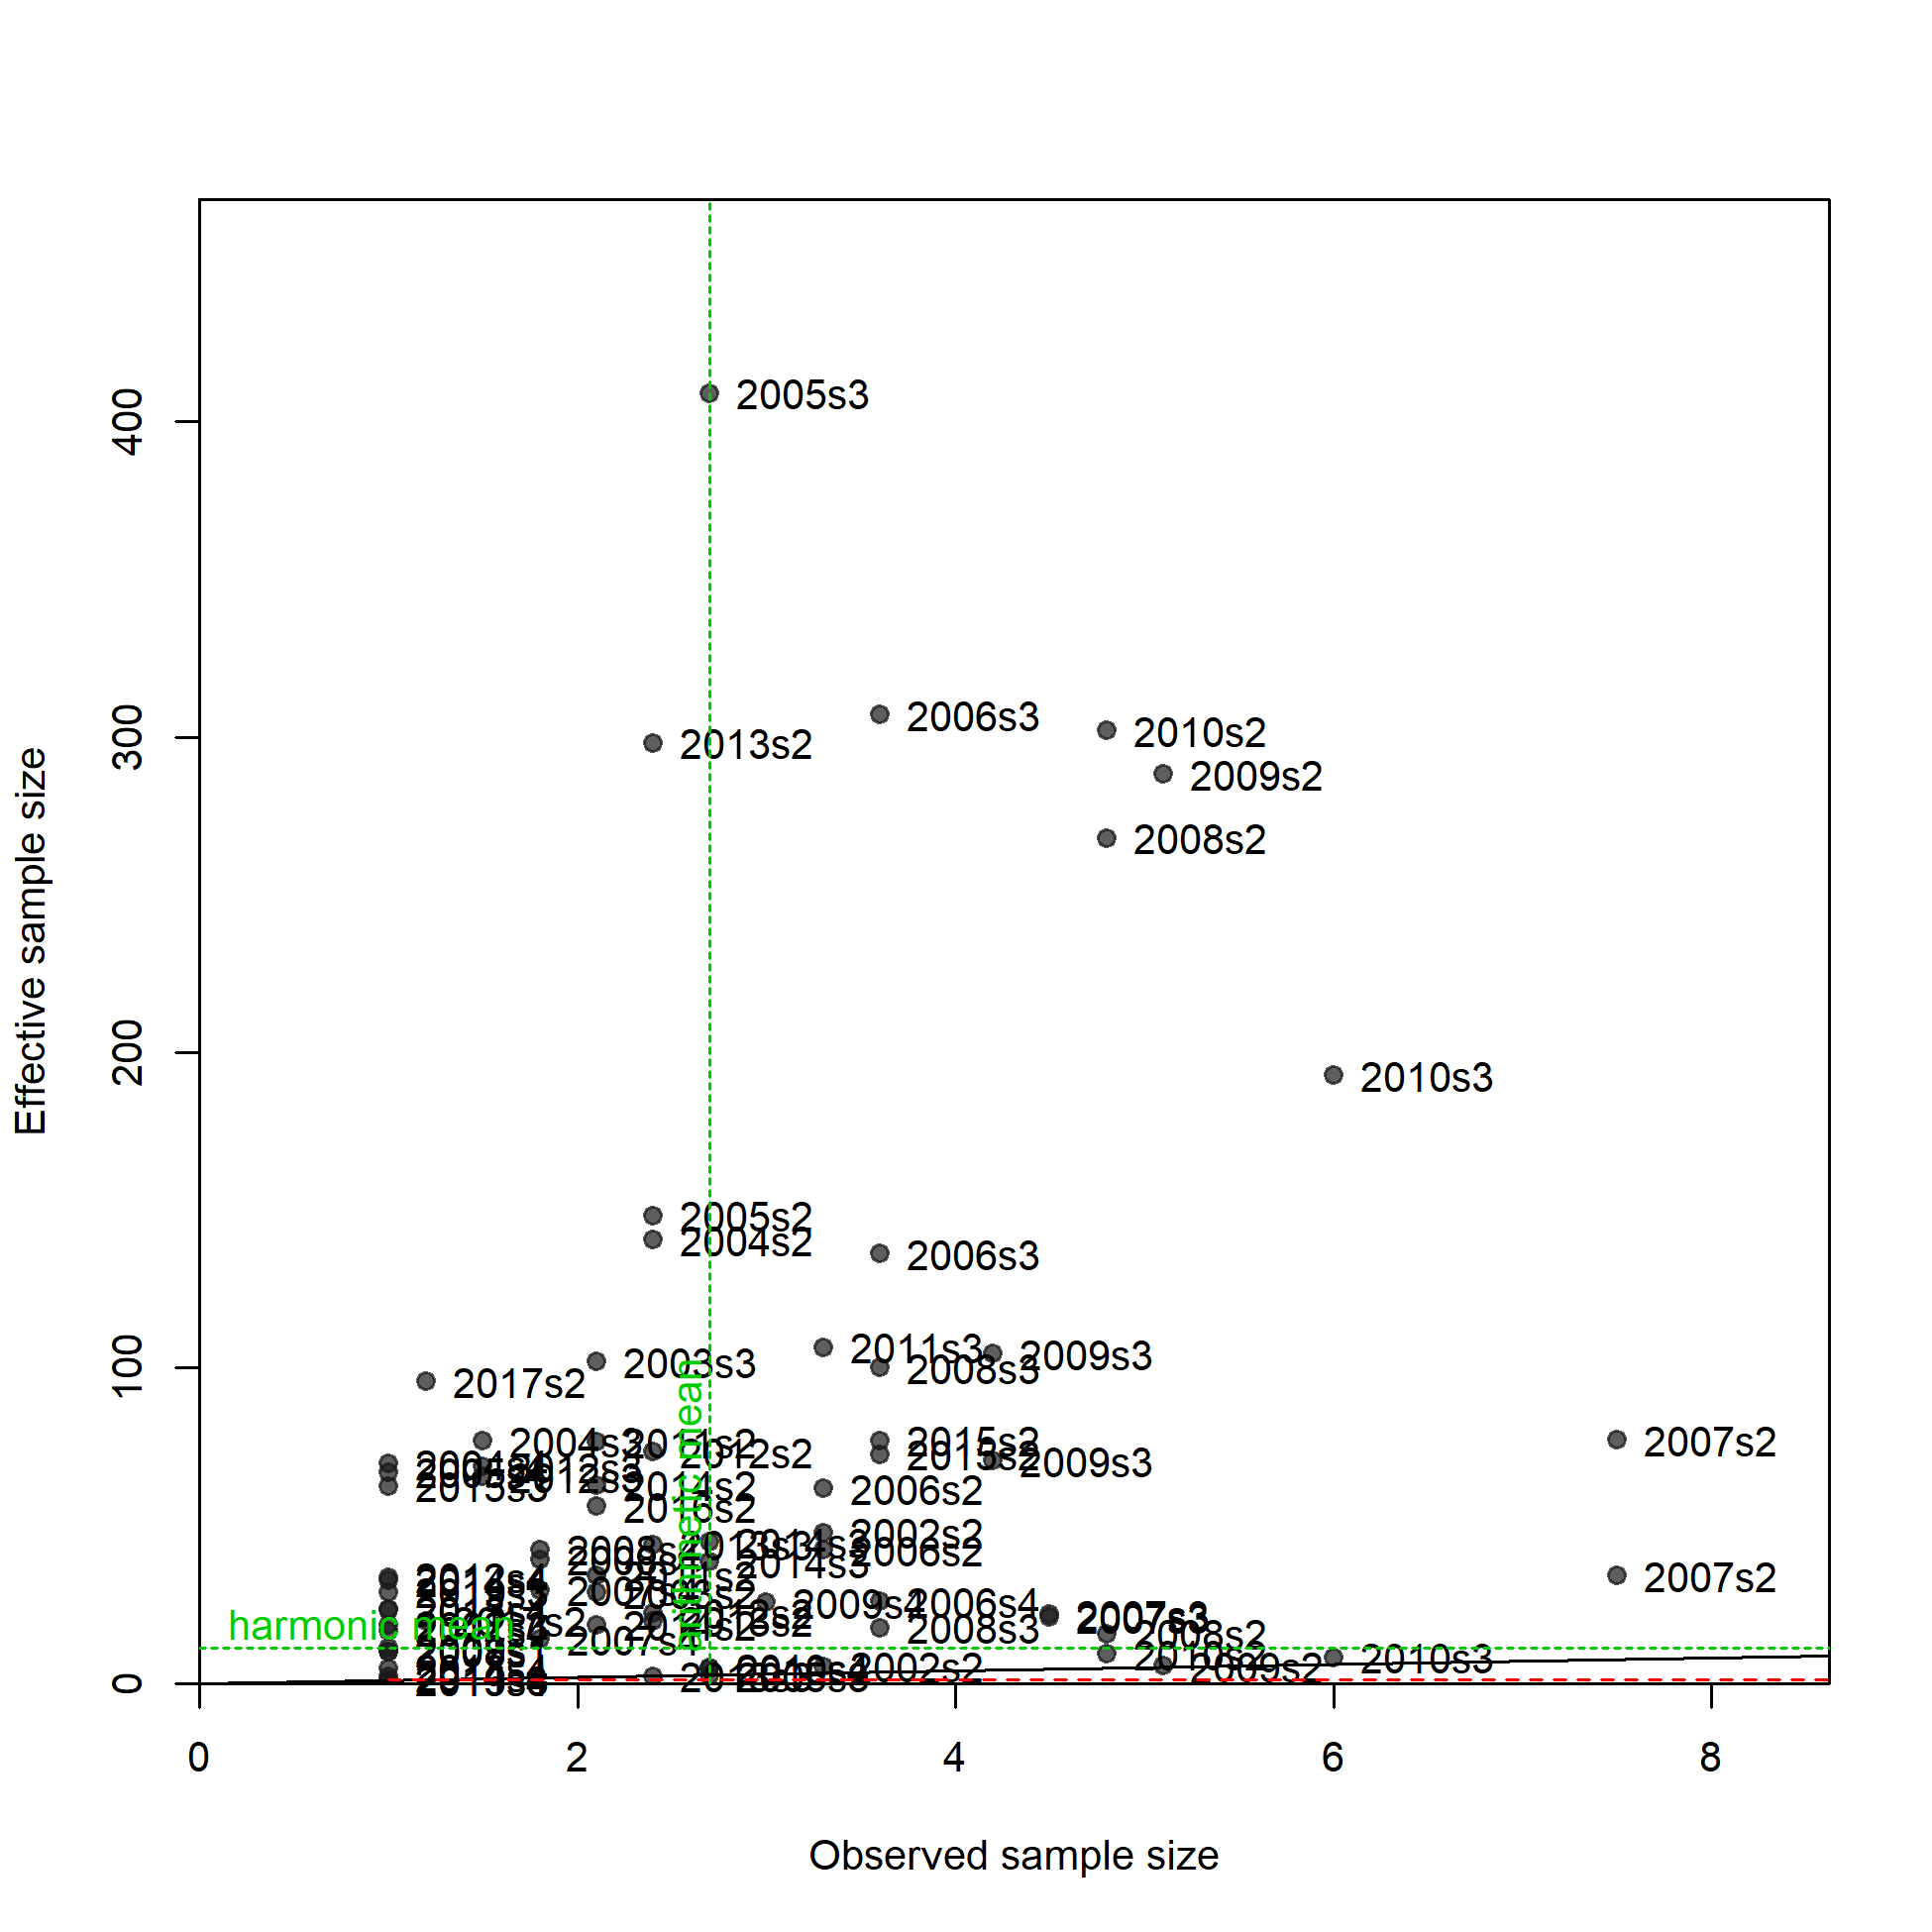
N-EffN comparison, Length comps, whole catch, F3_GN_A5
file: comp_lenfit_sampsize_flt3mkt0.png
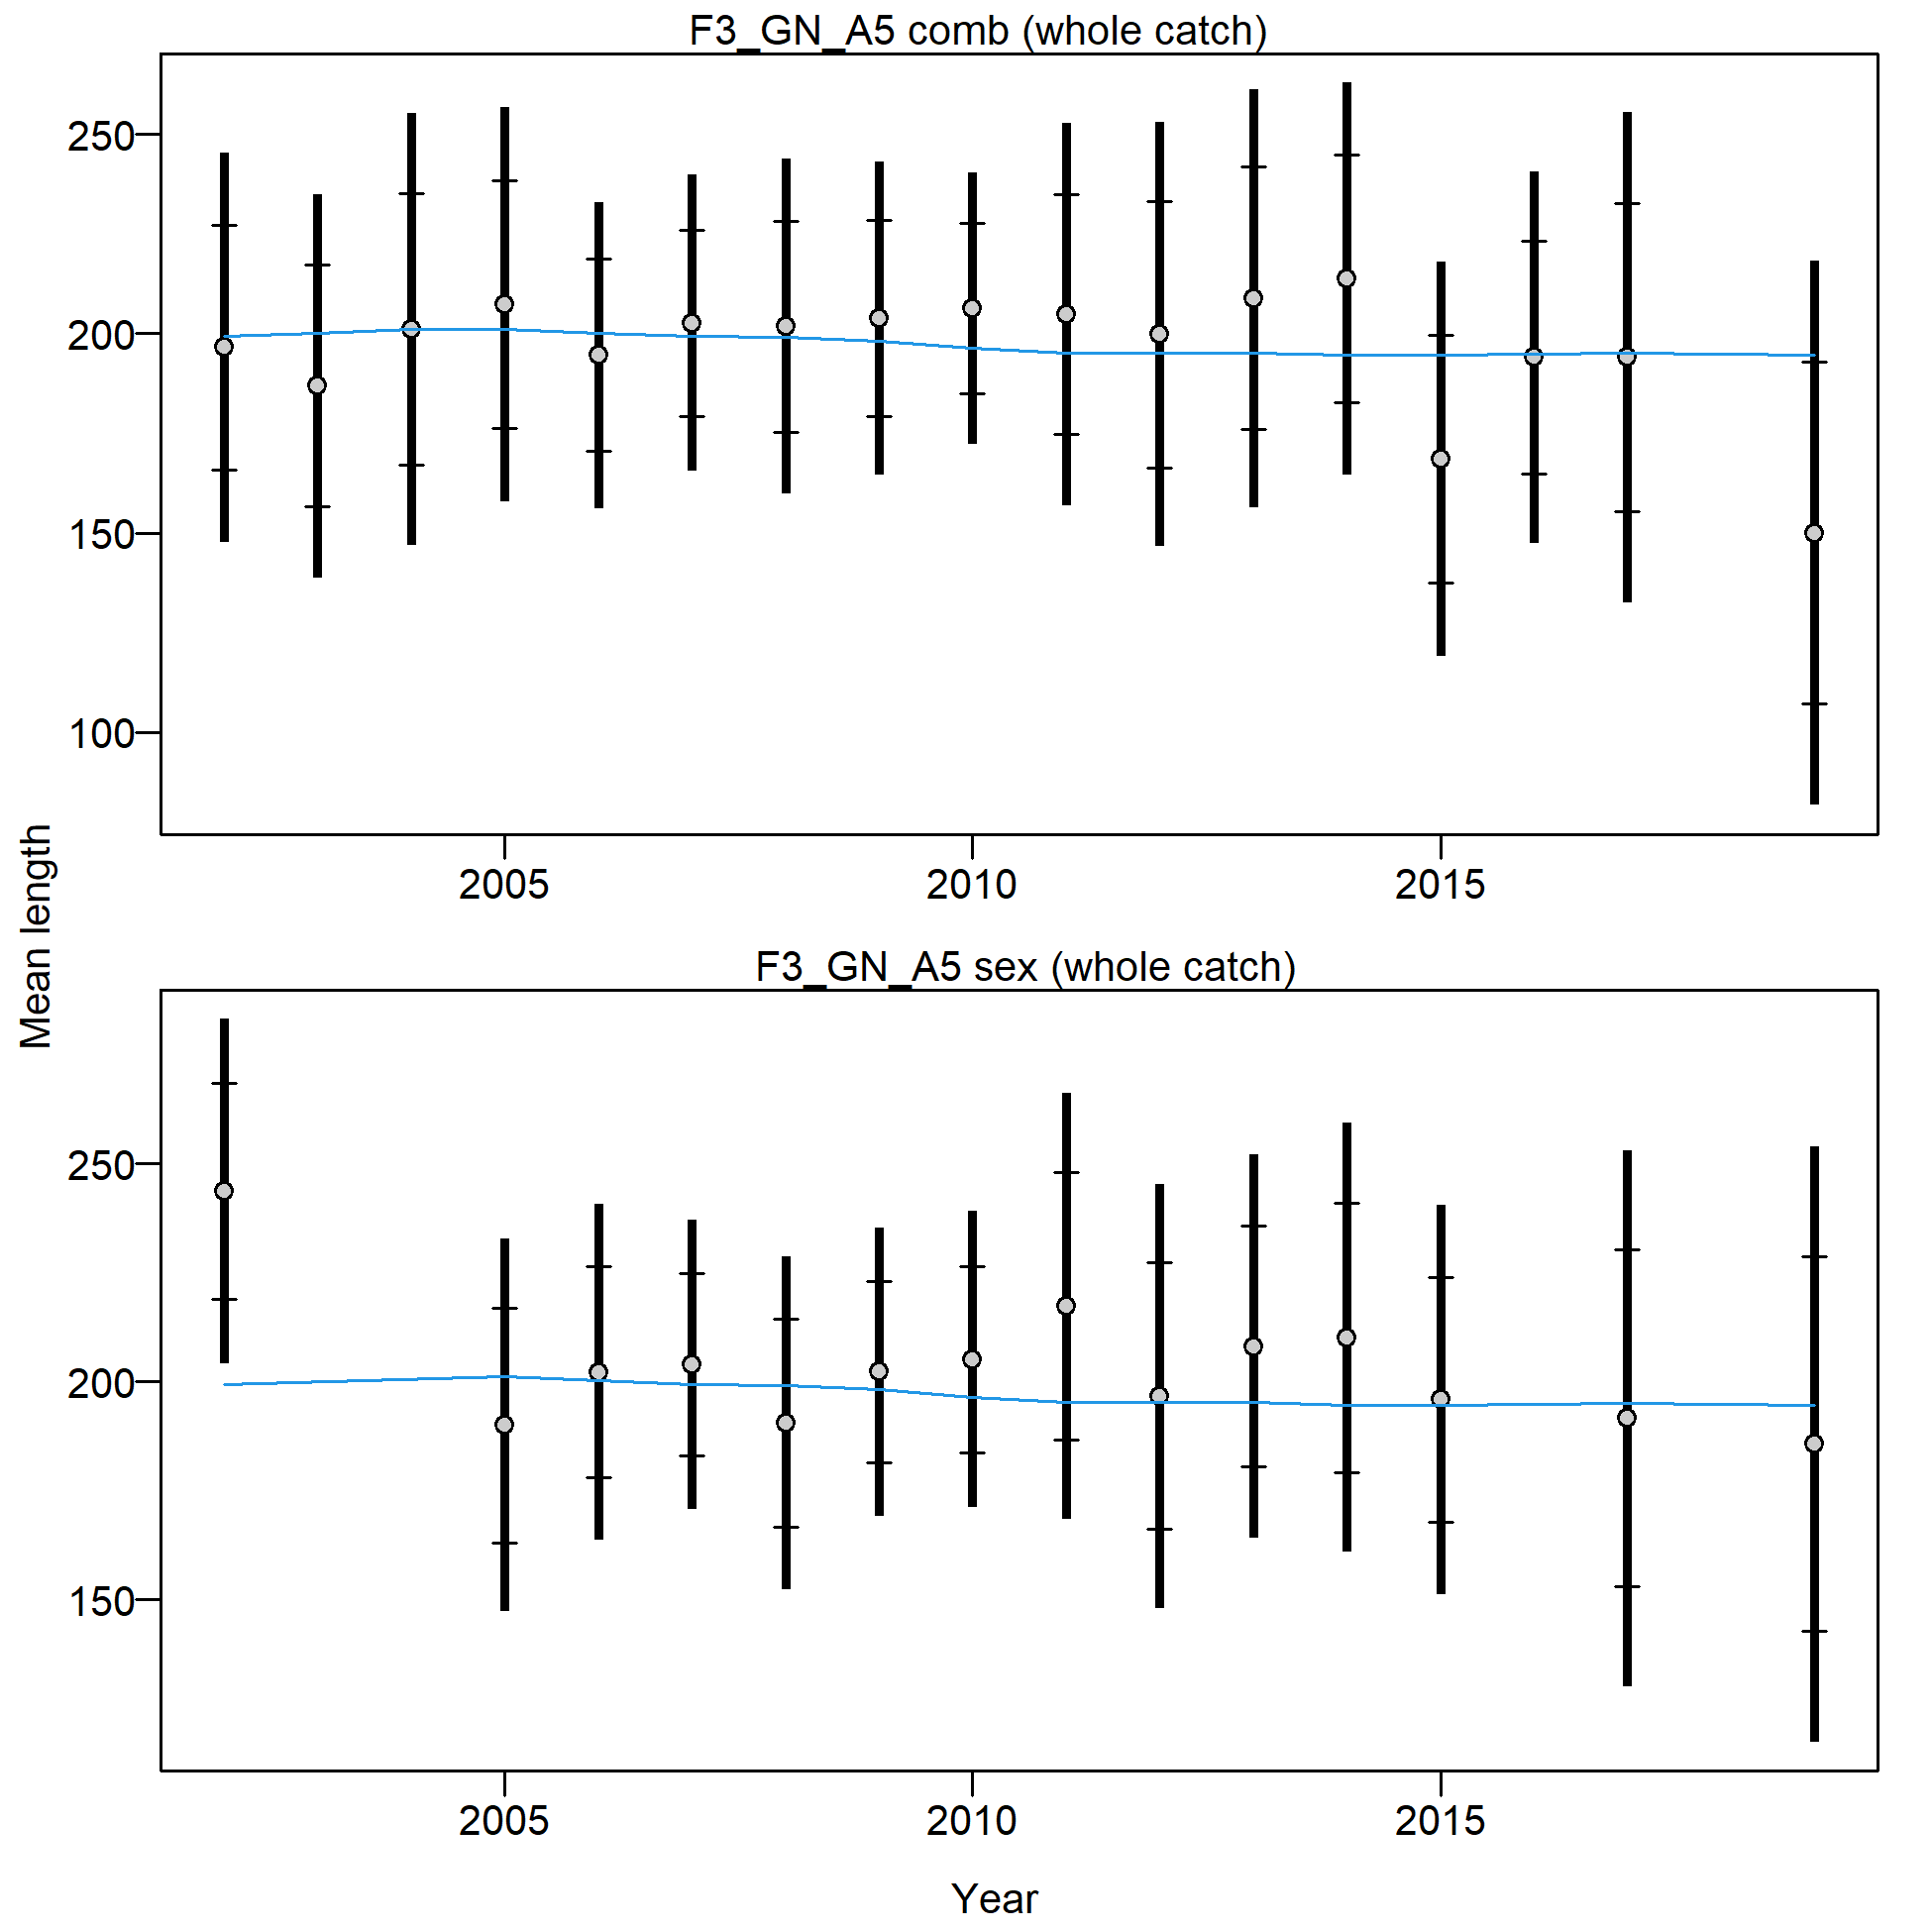
Mean length for F3_GN_A5 with 95% confidence intervals based on current samples sizes.
Francis data weighting method TA1.8: thinner intervals (with capped ends) show result of further adjusting sample sizes based on suggested multiplier (with 95% interval) for len data from F3_GN_A5:
2.5317 (1.34-7.3778)
For more info, see
Francis, R.I.C.C. (2011). Data weighting in statistical fisheries stock assessment models. Can. J. Fish. Aquat. Sci. 68: 1124-1138. https://doi.org/10.1139/f2011-025
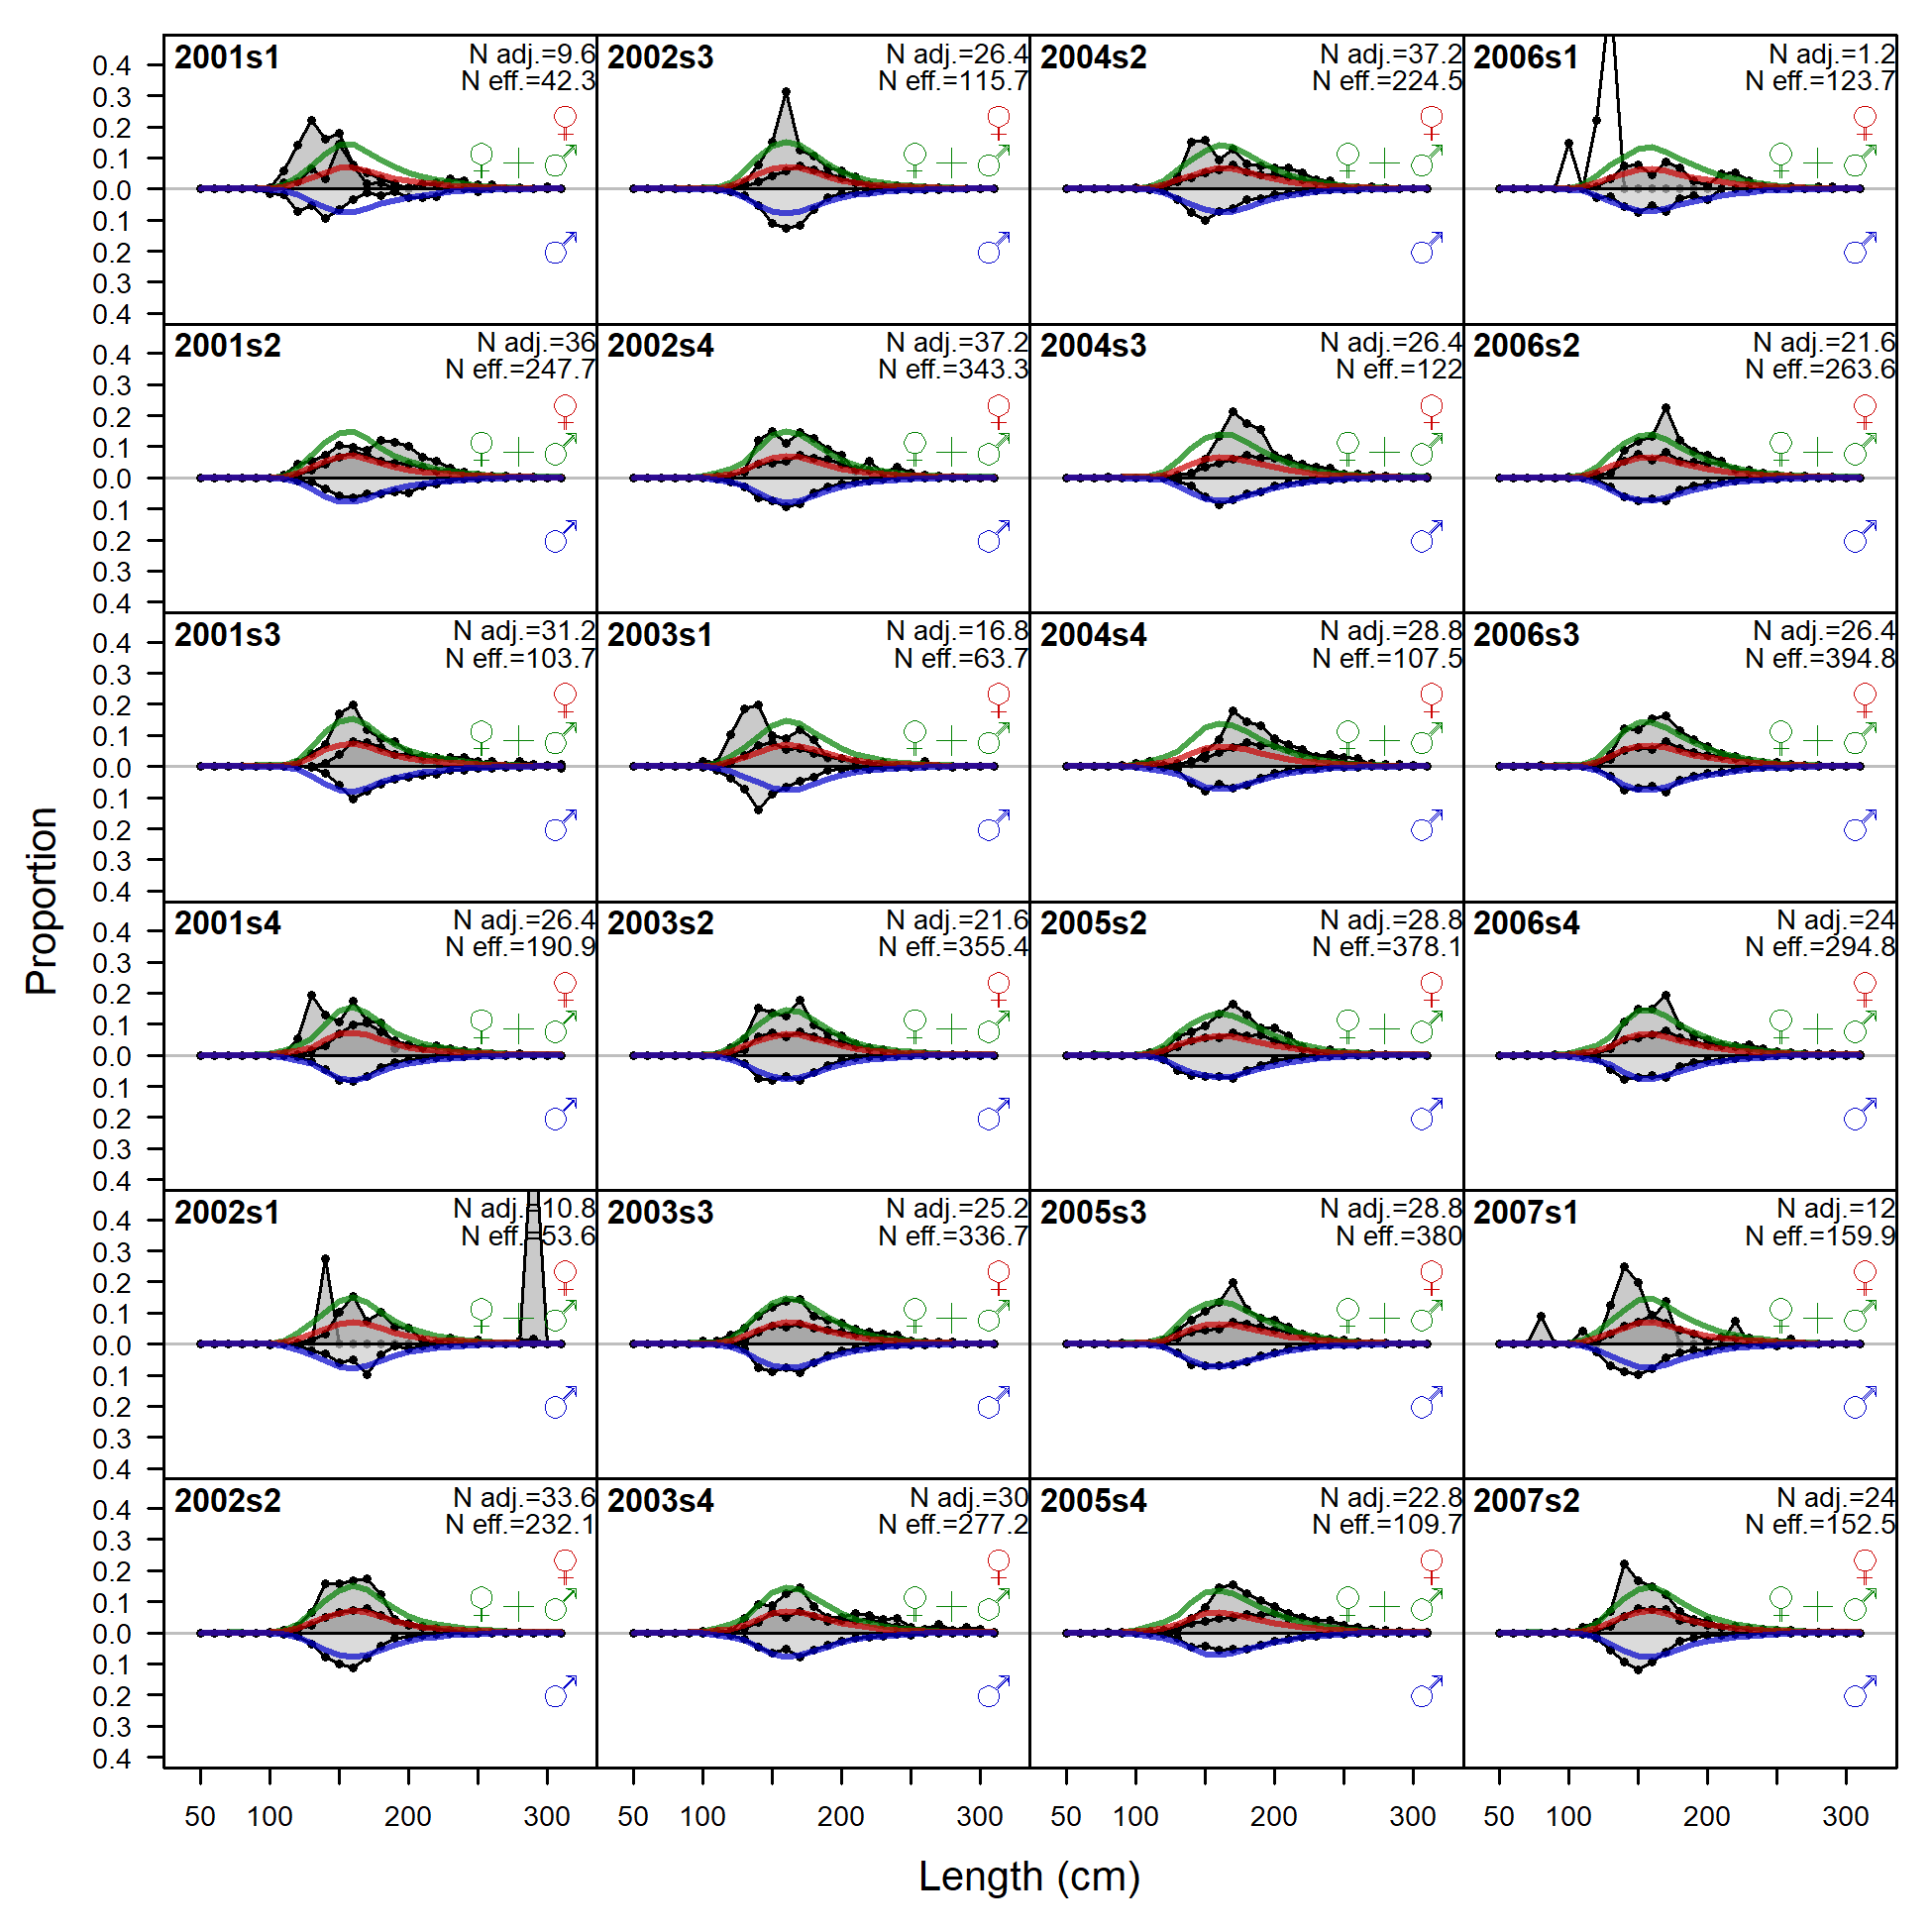
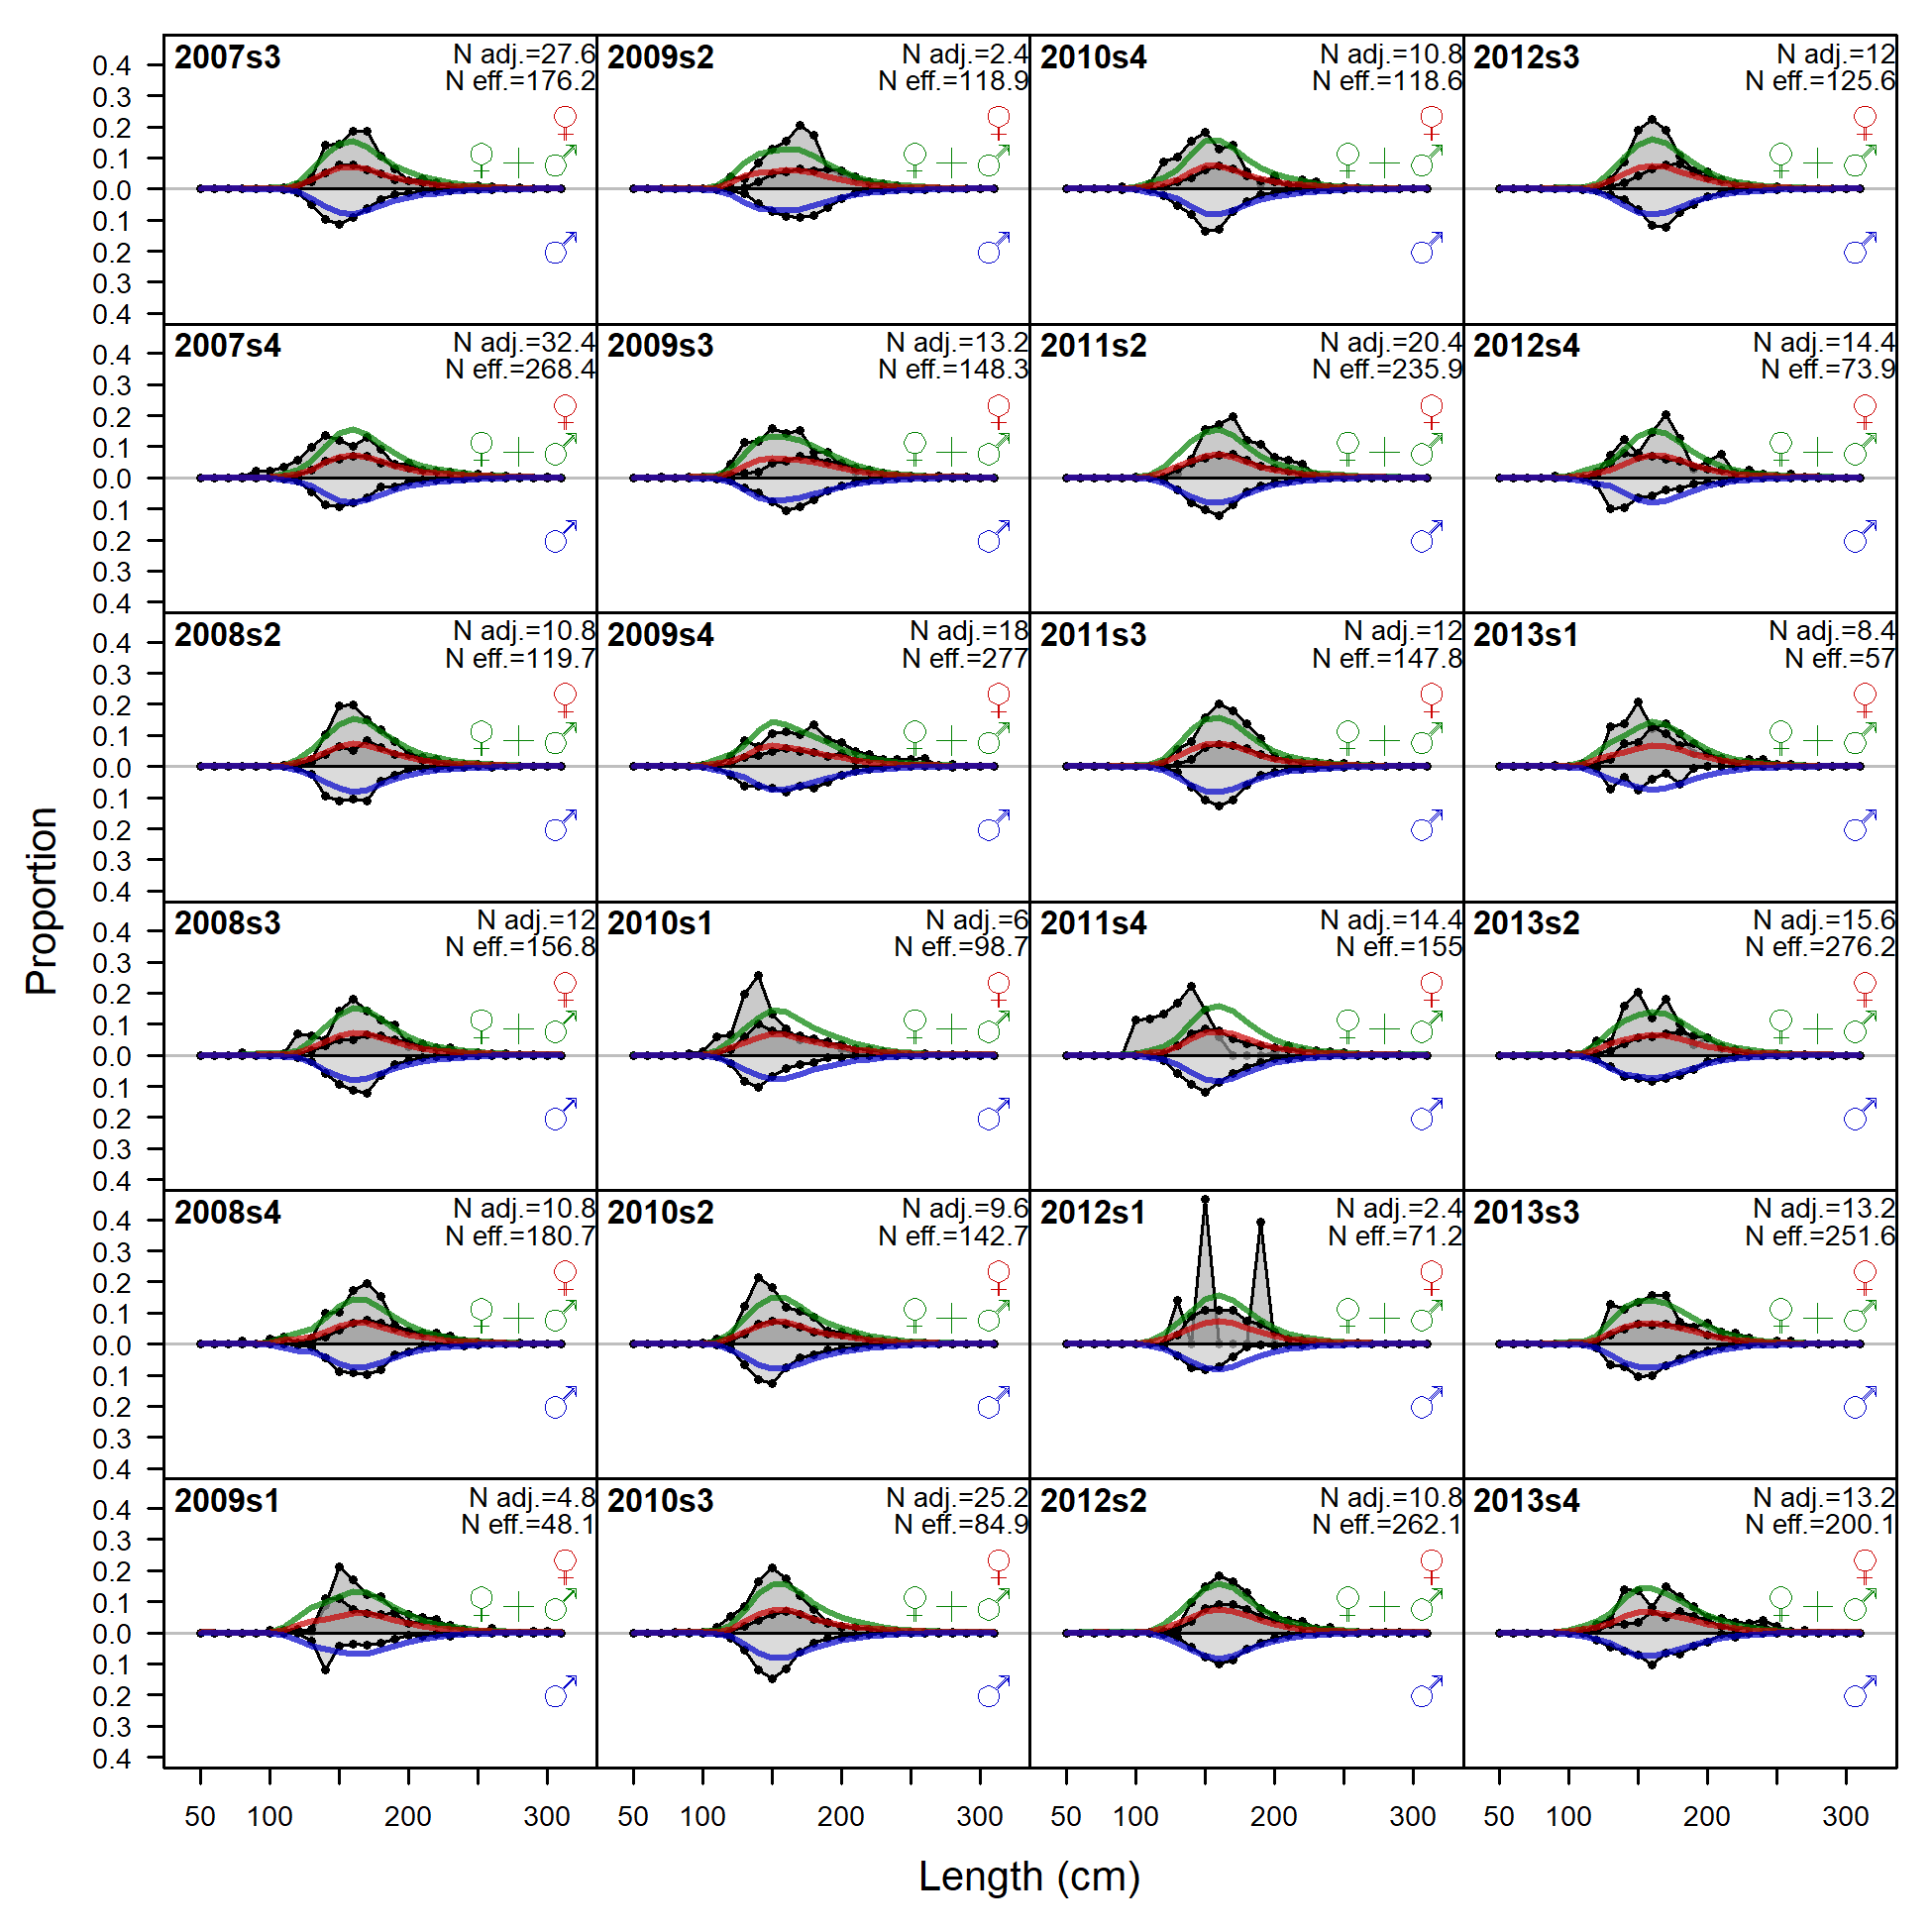
Length comps, whole catch, F4_LL_Coast_A4.
'N adj.' is the input sample size after data-weighting adjustment. N eff. is the calculated effective sample size used in the McAllister-Ianelli tuning method.
file: comp_lenfit_flt4mkt0.png
Pearson residuals, whole catch, F4_LL_Coast_A4 (max=56.65)
Closed bubbles are positive residuals (observed > expected) and open bubbles are negative residuals (observed < expected).
file: comp_lenfit_residsflt4mkt0.png
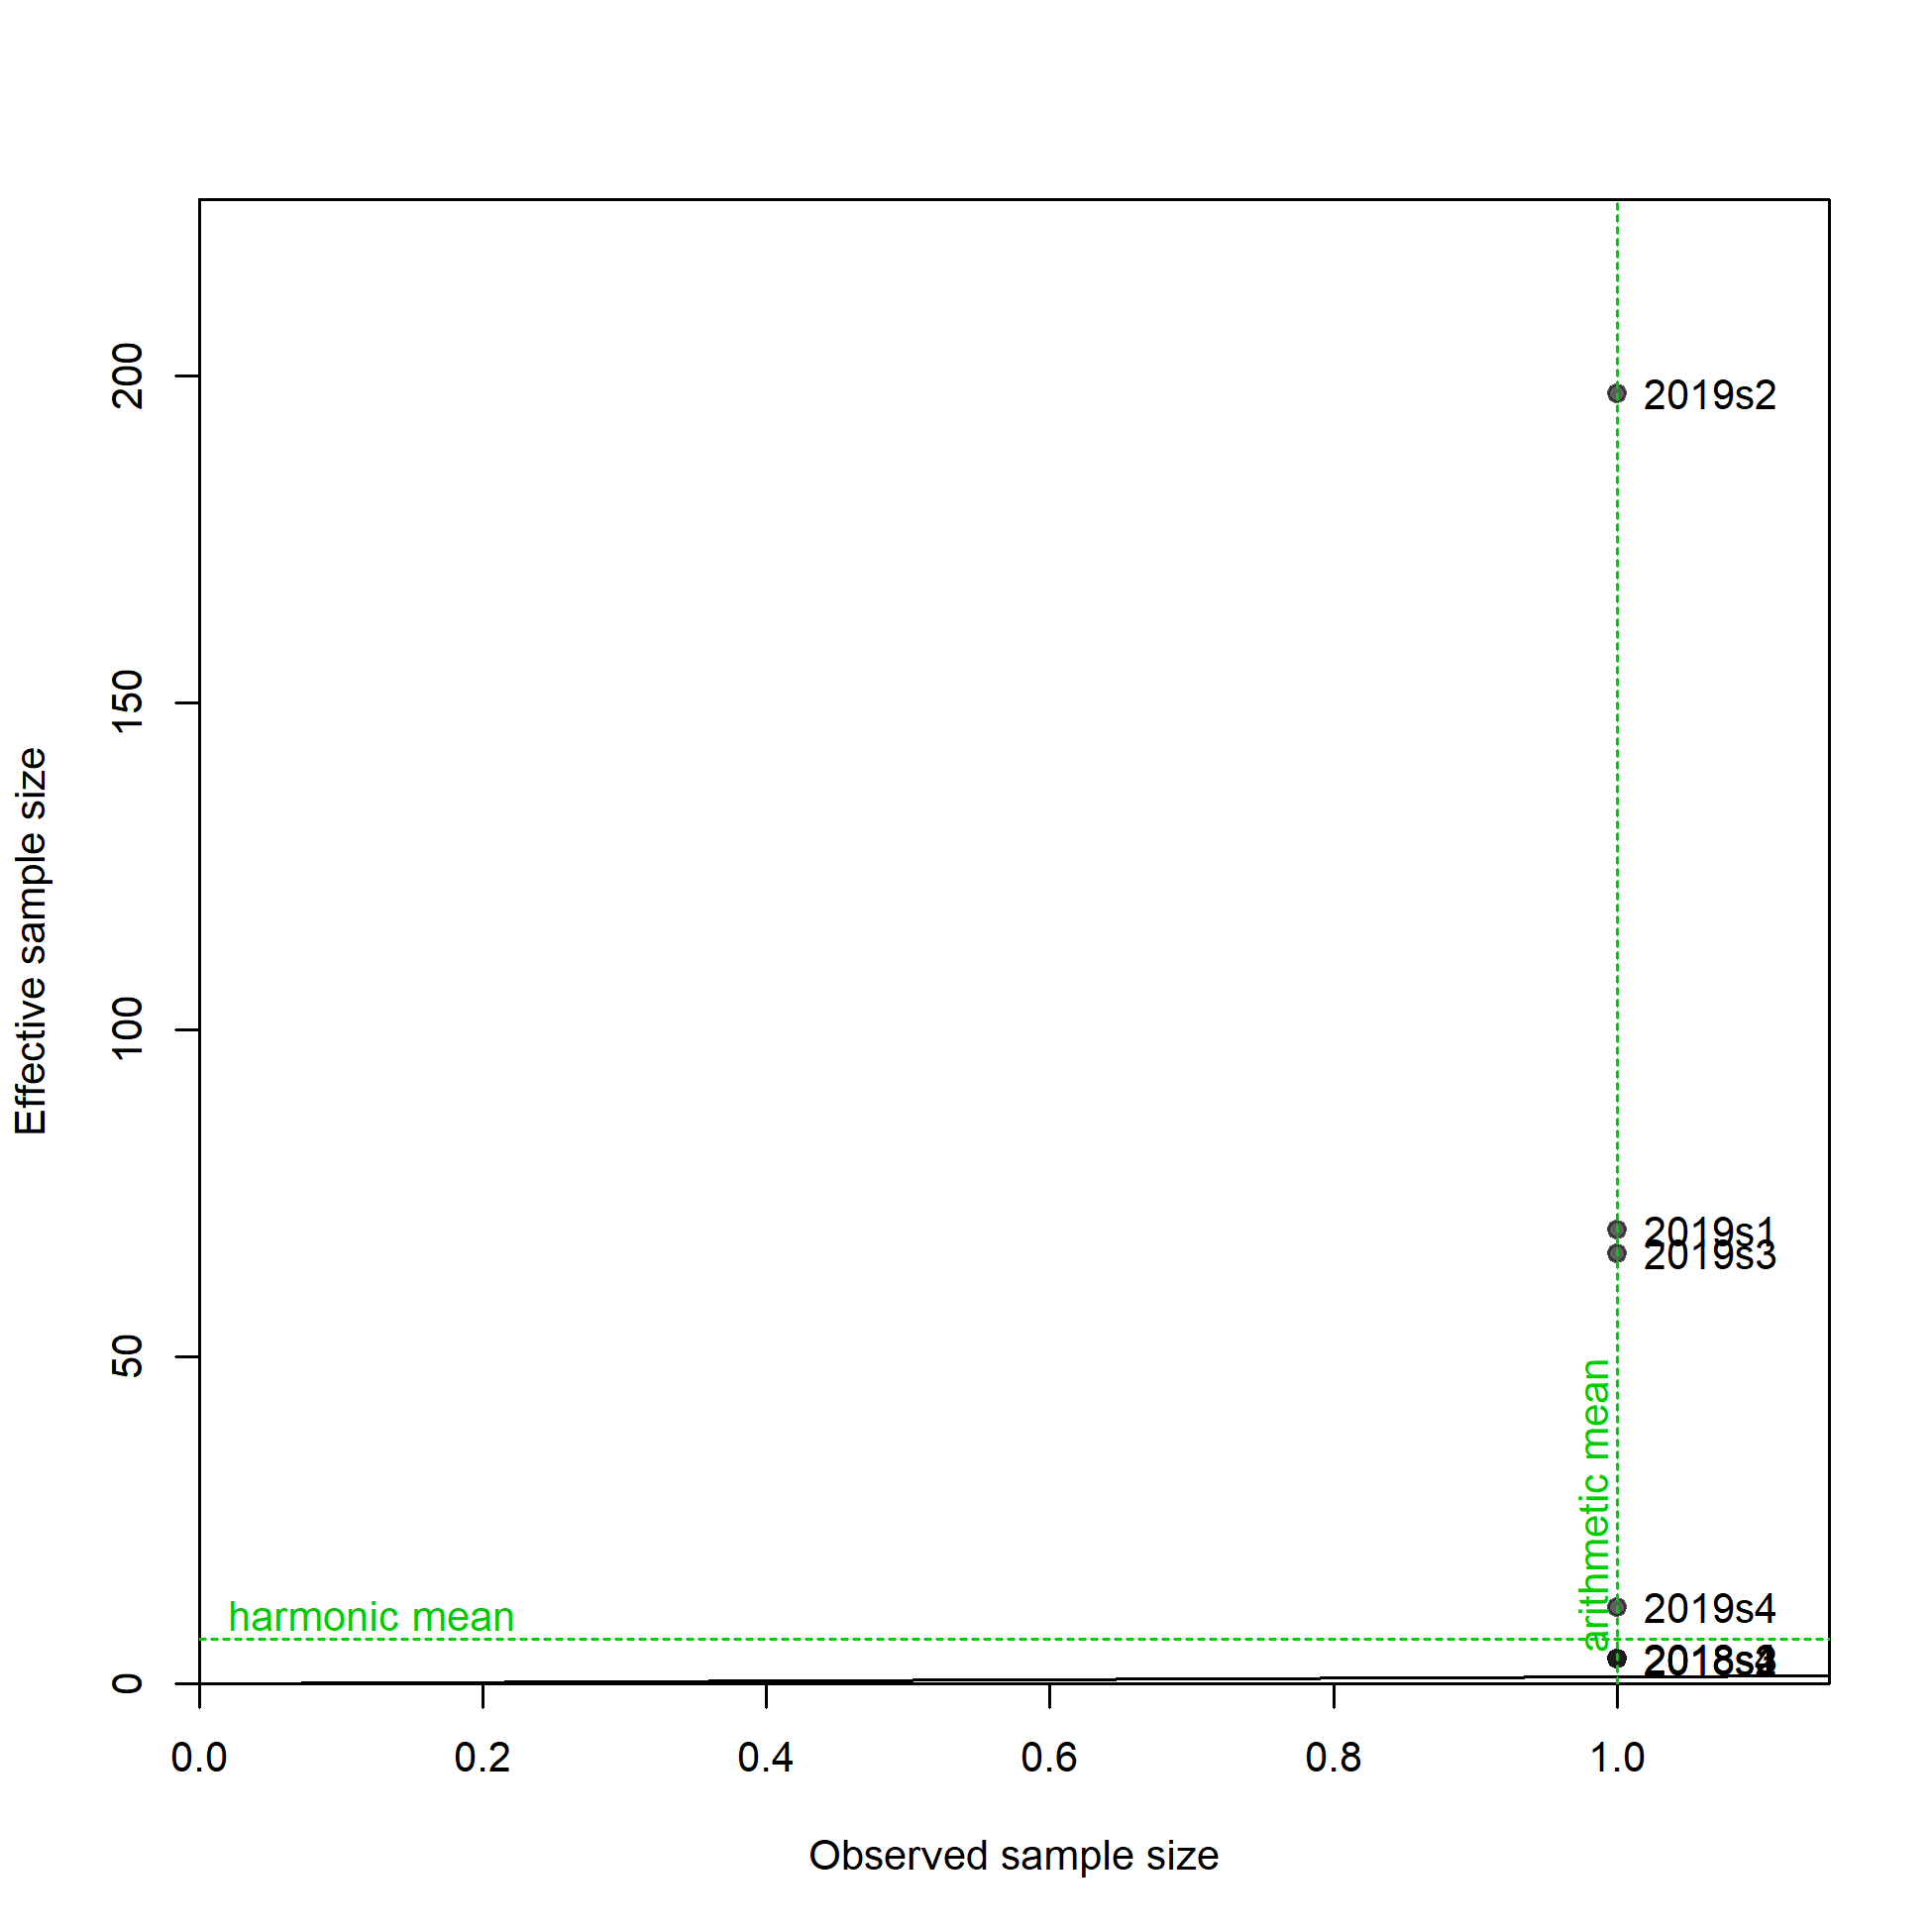
N-EffN comparison, Length comps, whole catch, F4_LL_Coast_A4
file: comp_lenfit_sampsize_flt4mkt0.png
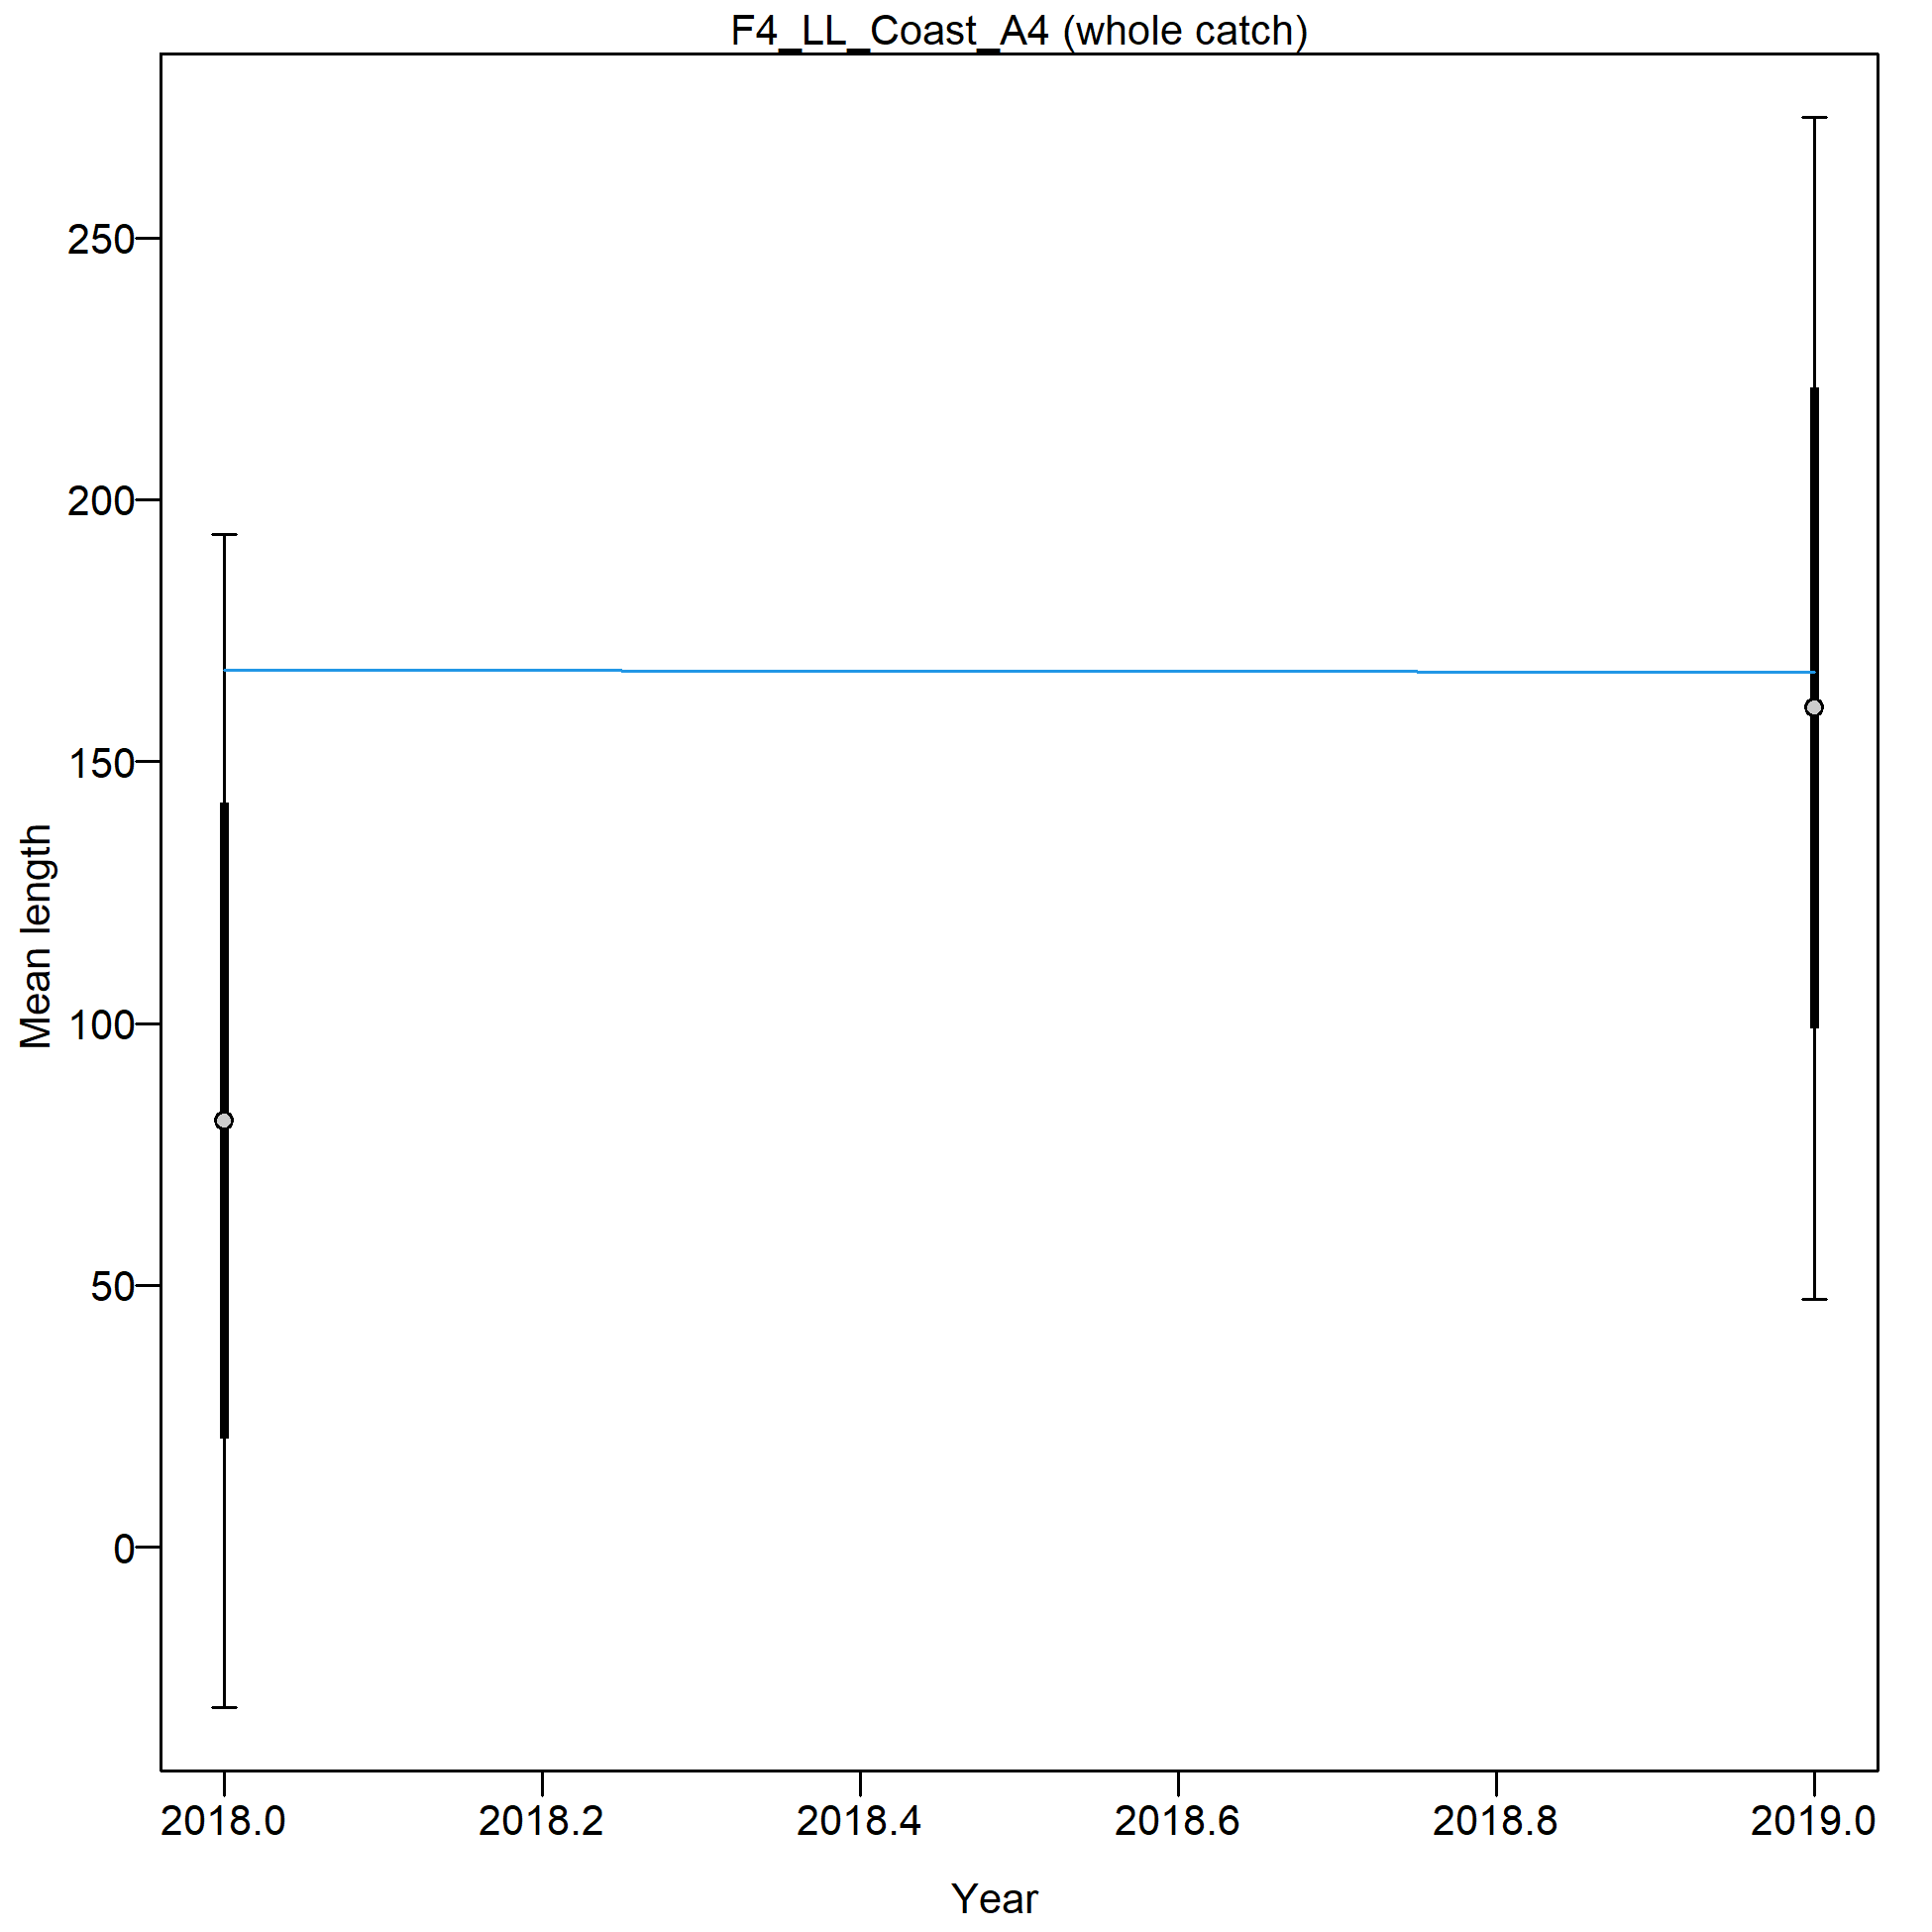
Mean length for F4_LL_Coast_A4 with 95% confidence intervals based on current samples sizes.
Francis data weighting method TA1.8: thinner intervals (with capped ends) show result of further adjusting sample sizes based on suggested multiplier (with 95% interval) for len data from F4_LL_Coast_A4:
0.2941 (0.2941-Inf)
For more info, see
Francis, R.I.C.C. (2011). Data weighting in statistical fisheries stock assessment models. Can. J. Fish. Aquat. Sci. 68: 1124-1138. https://doi.org/10.1139/f2011-025
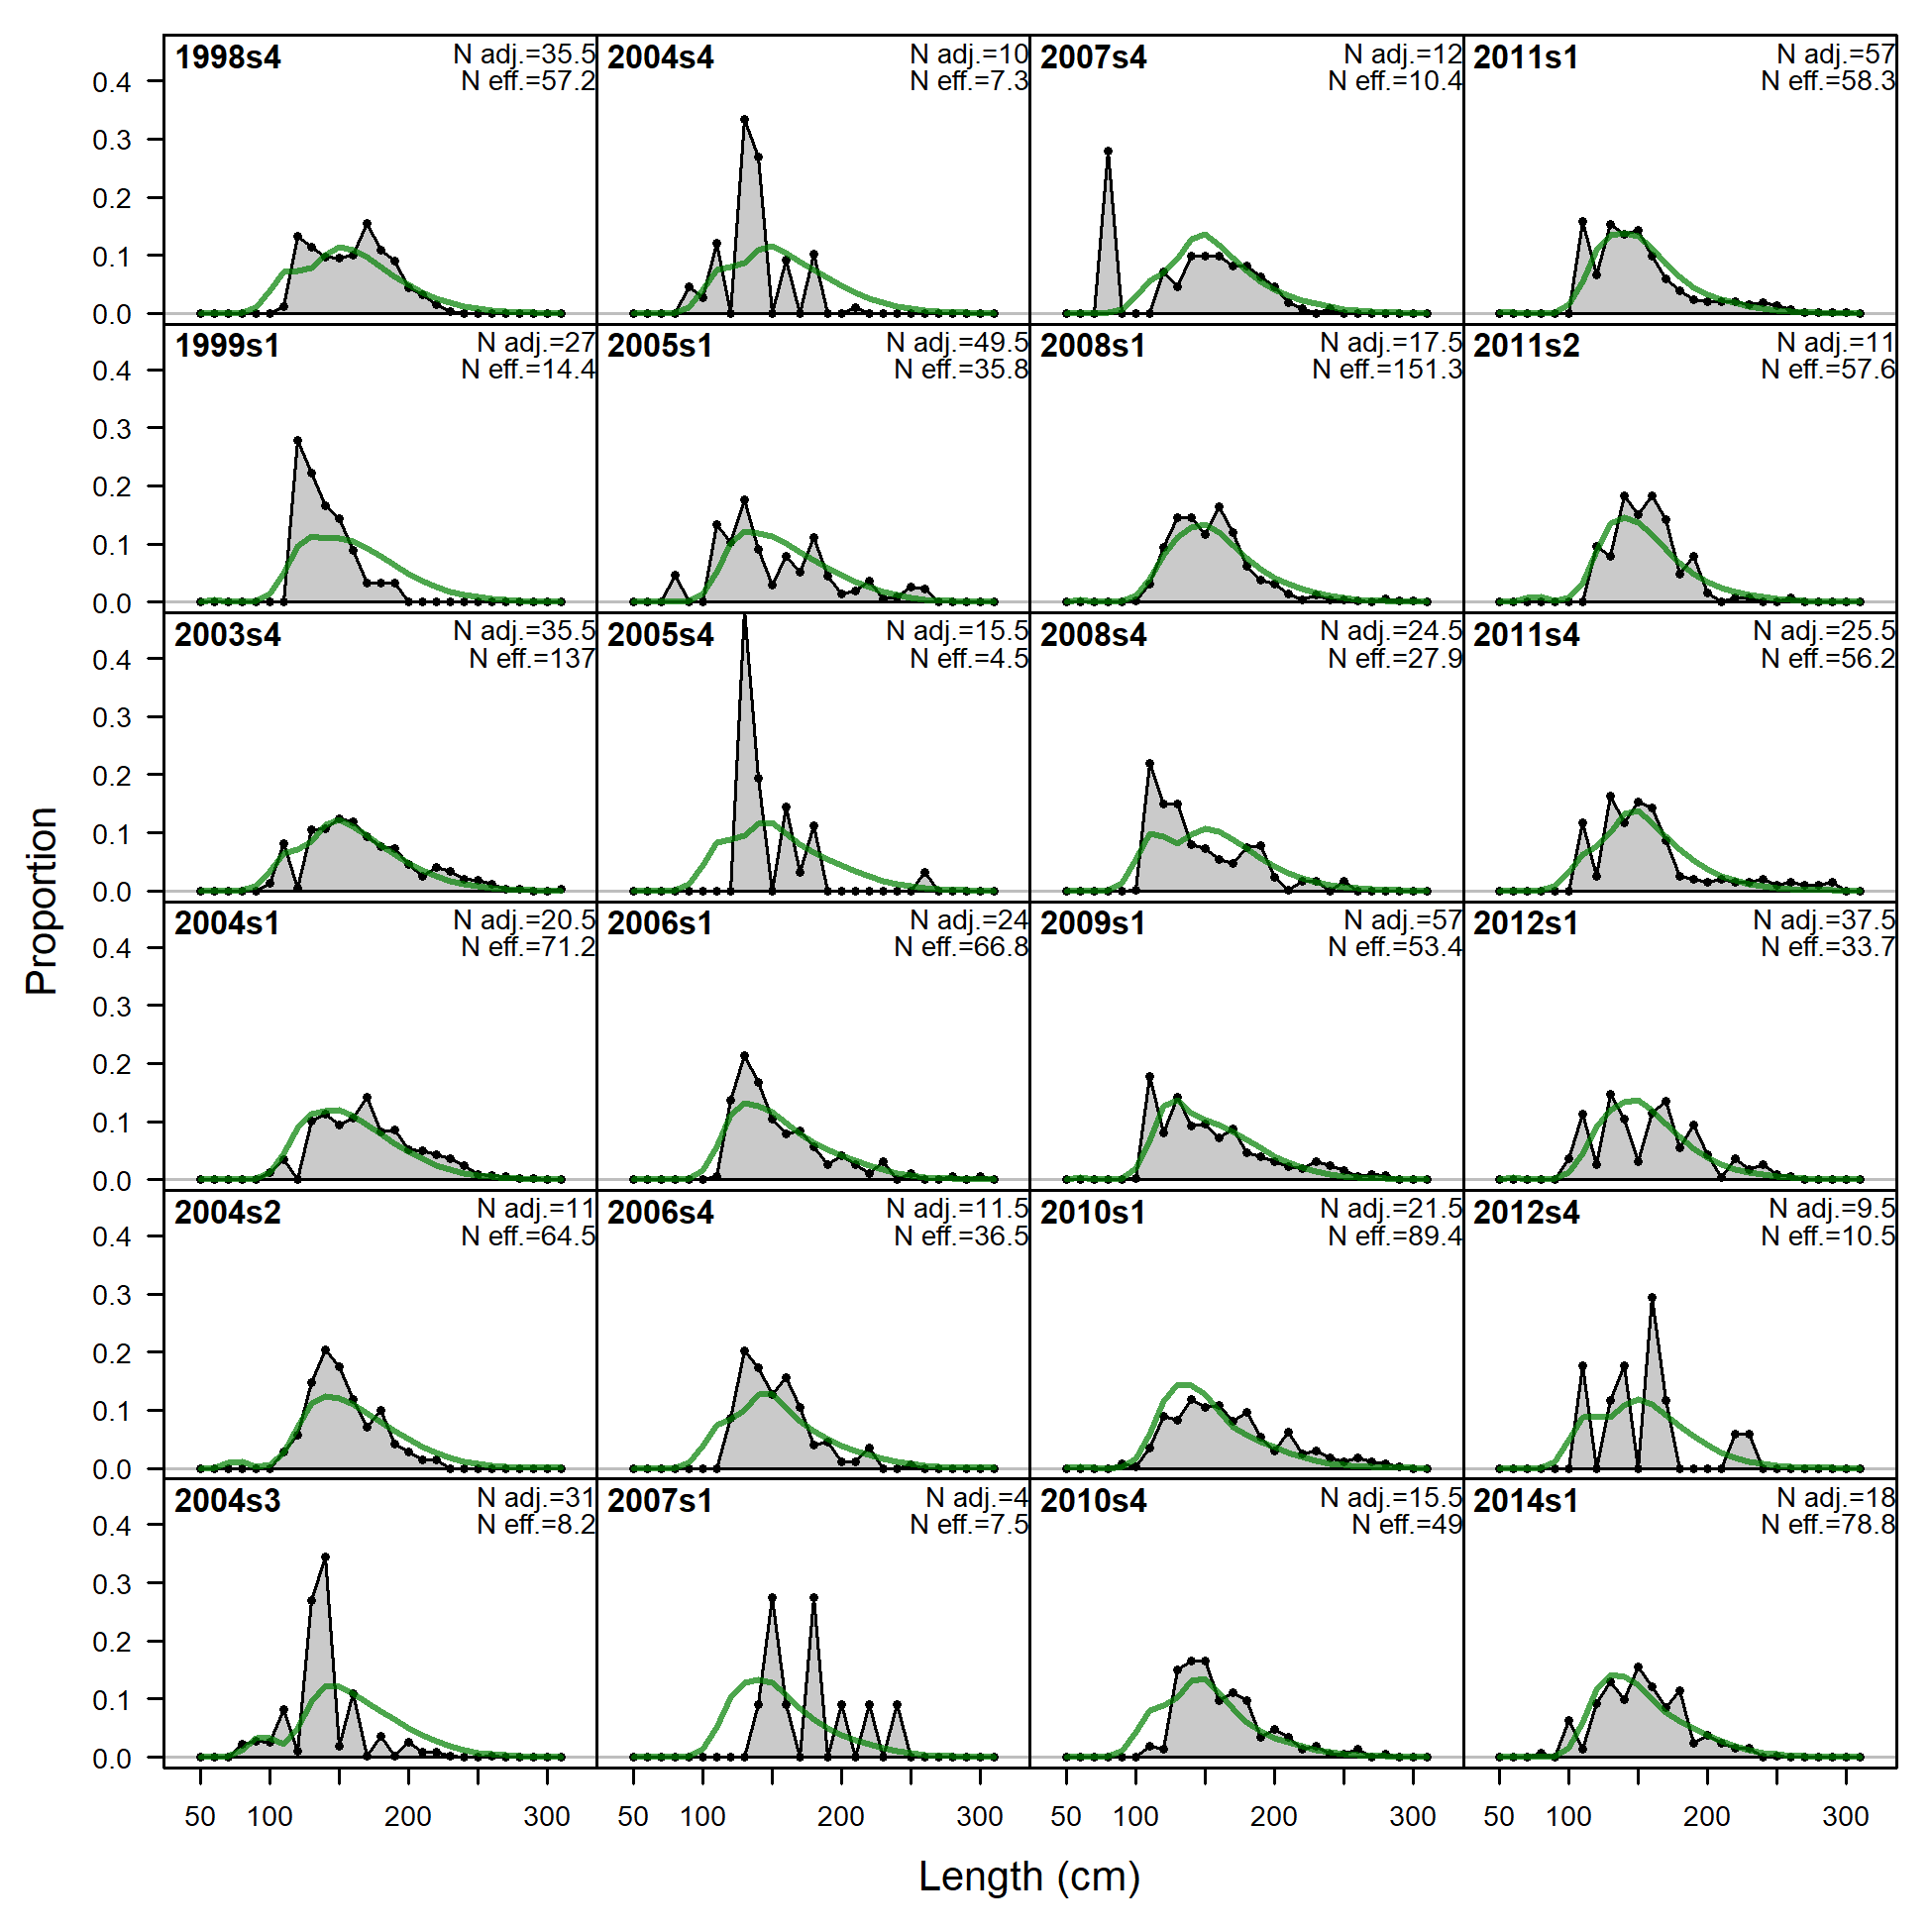
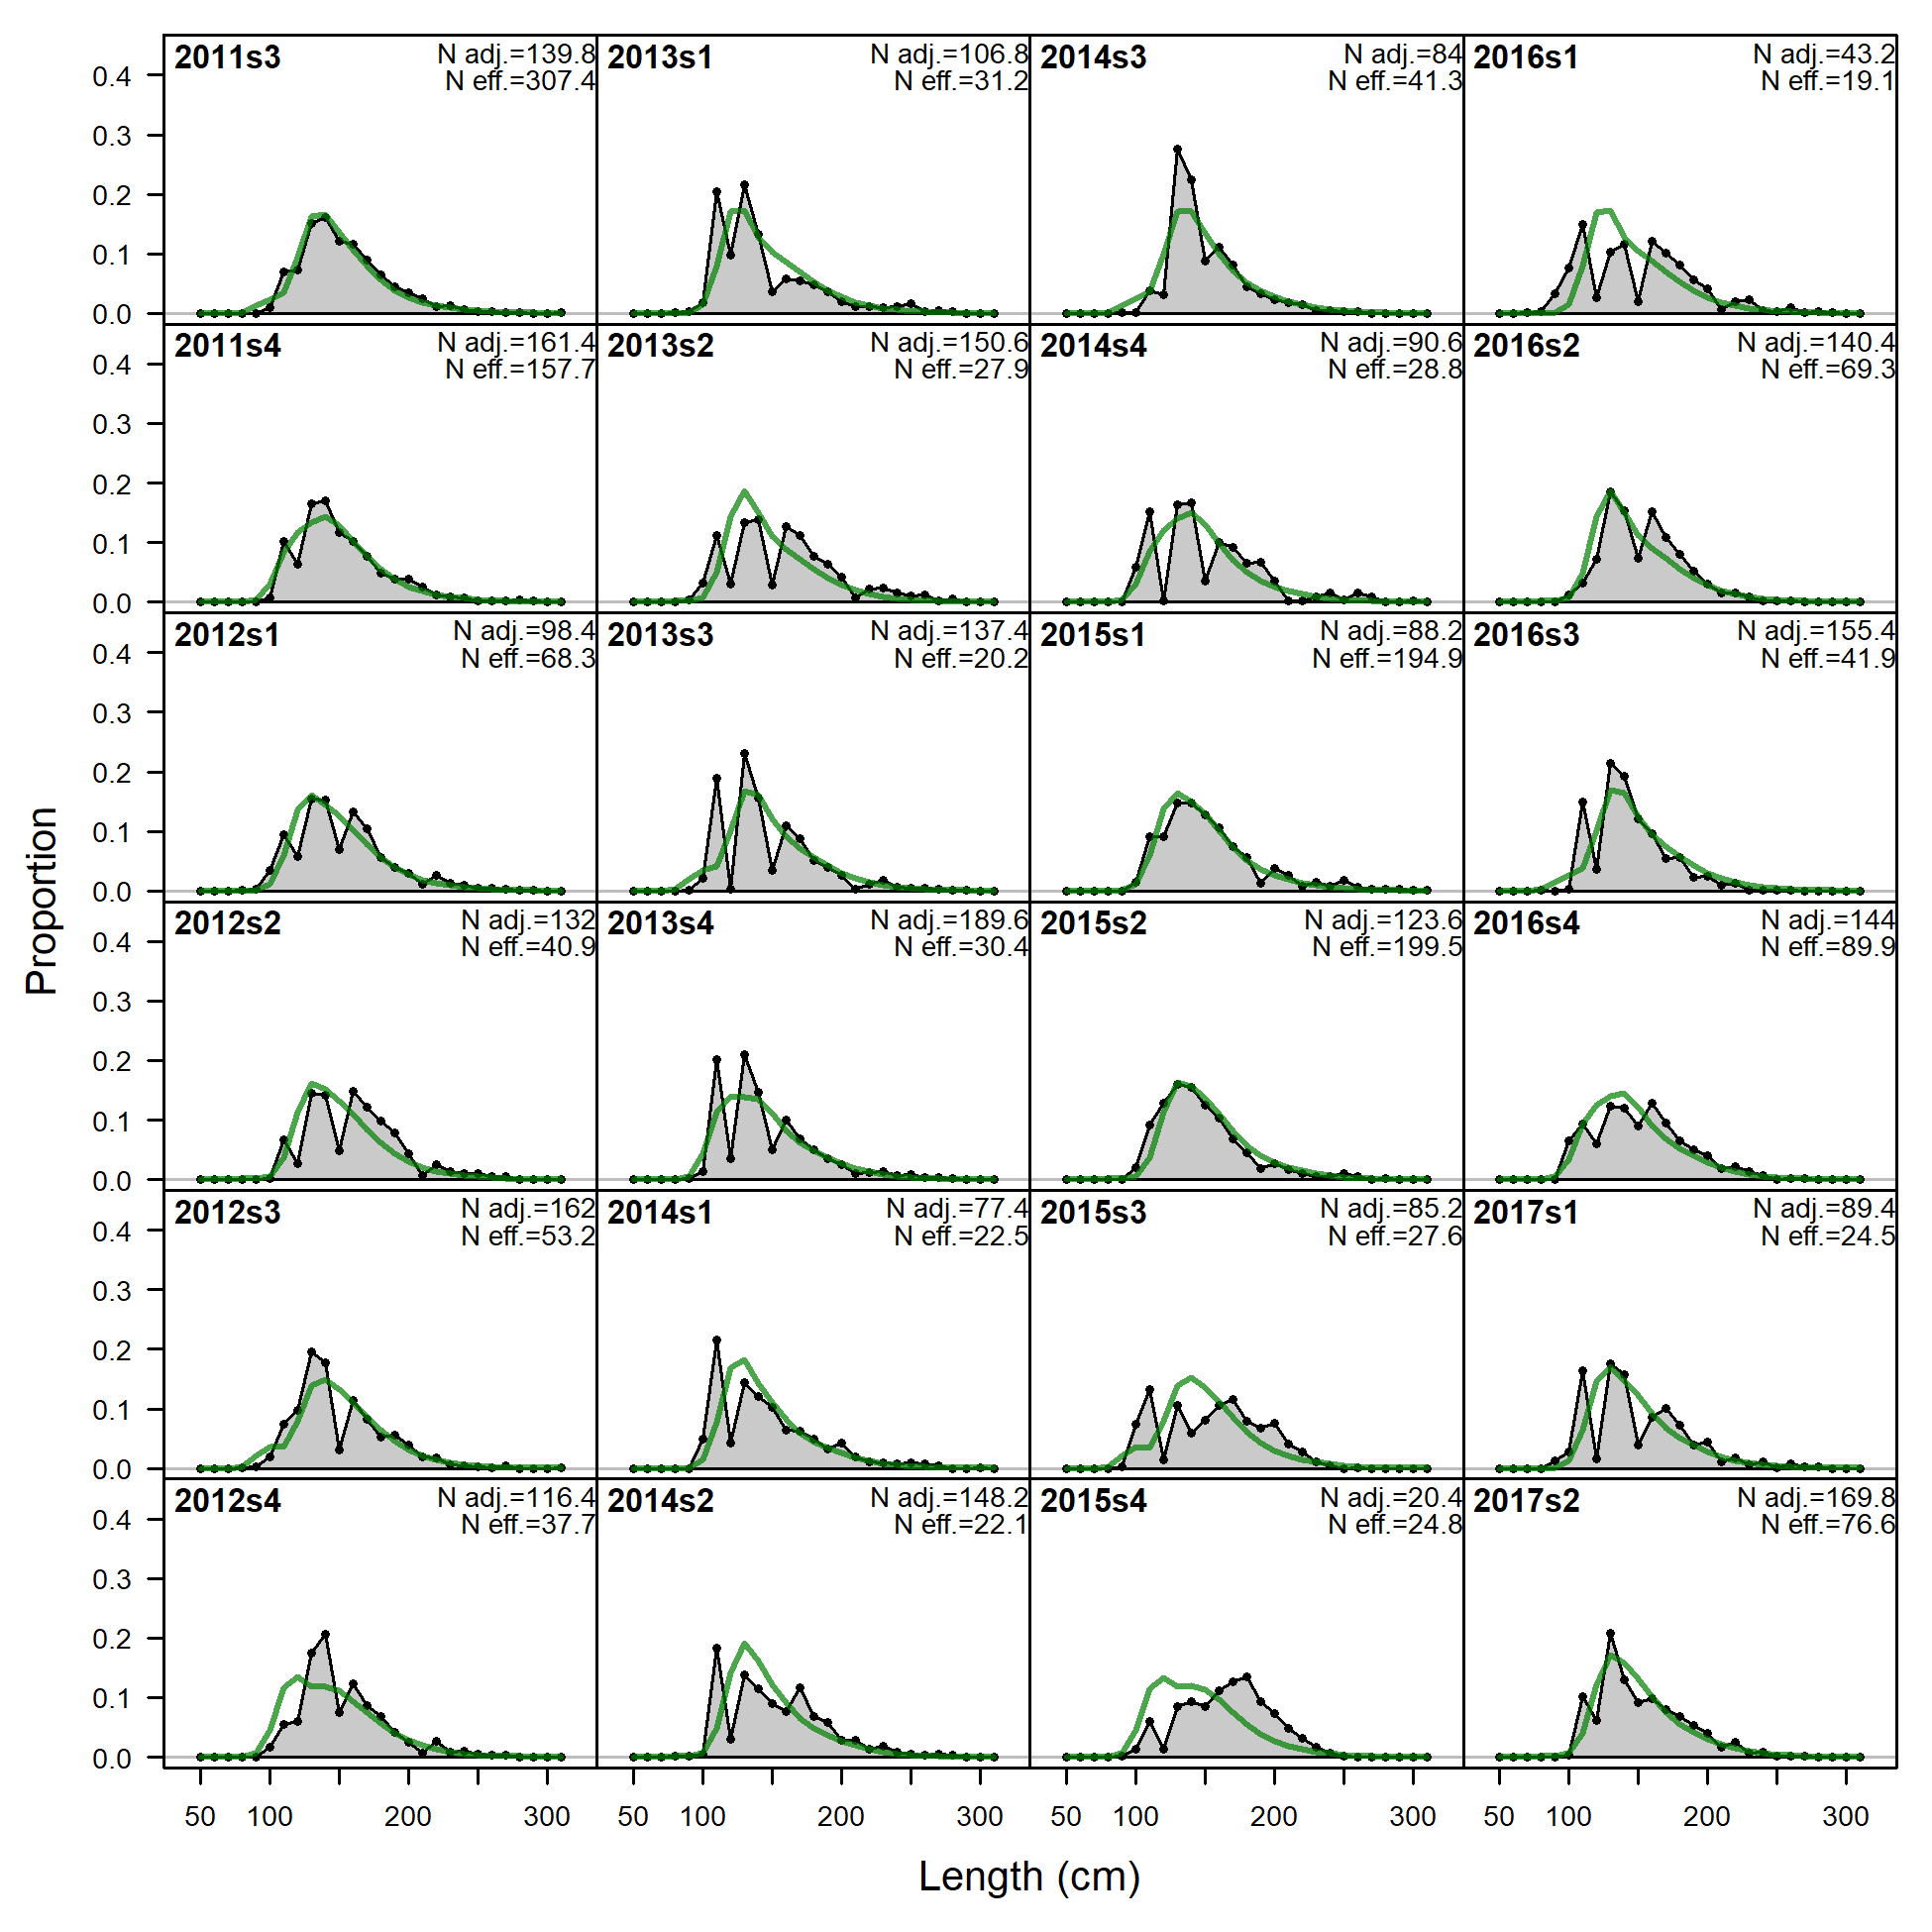
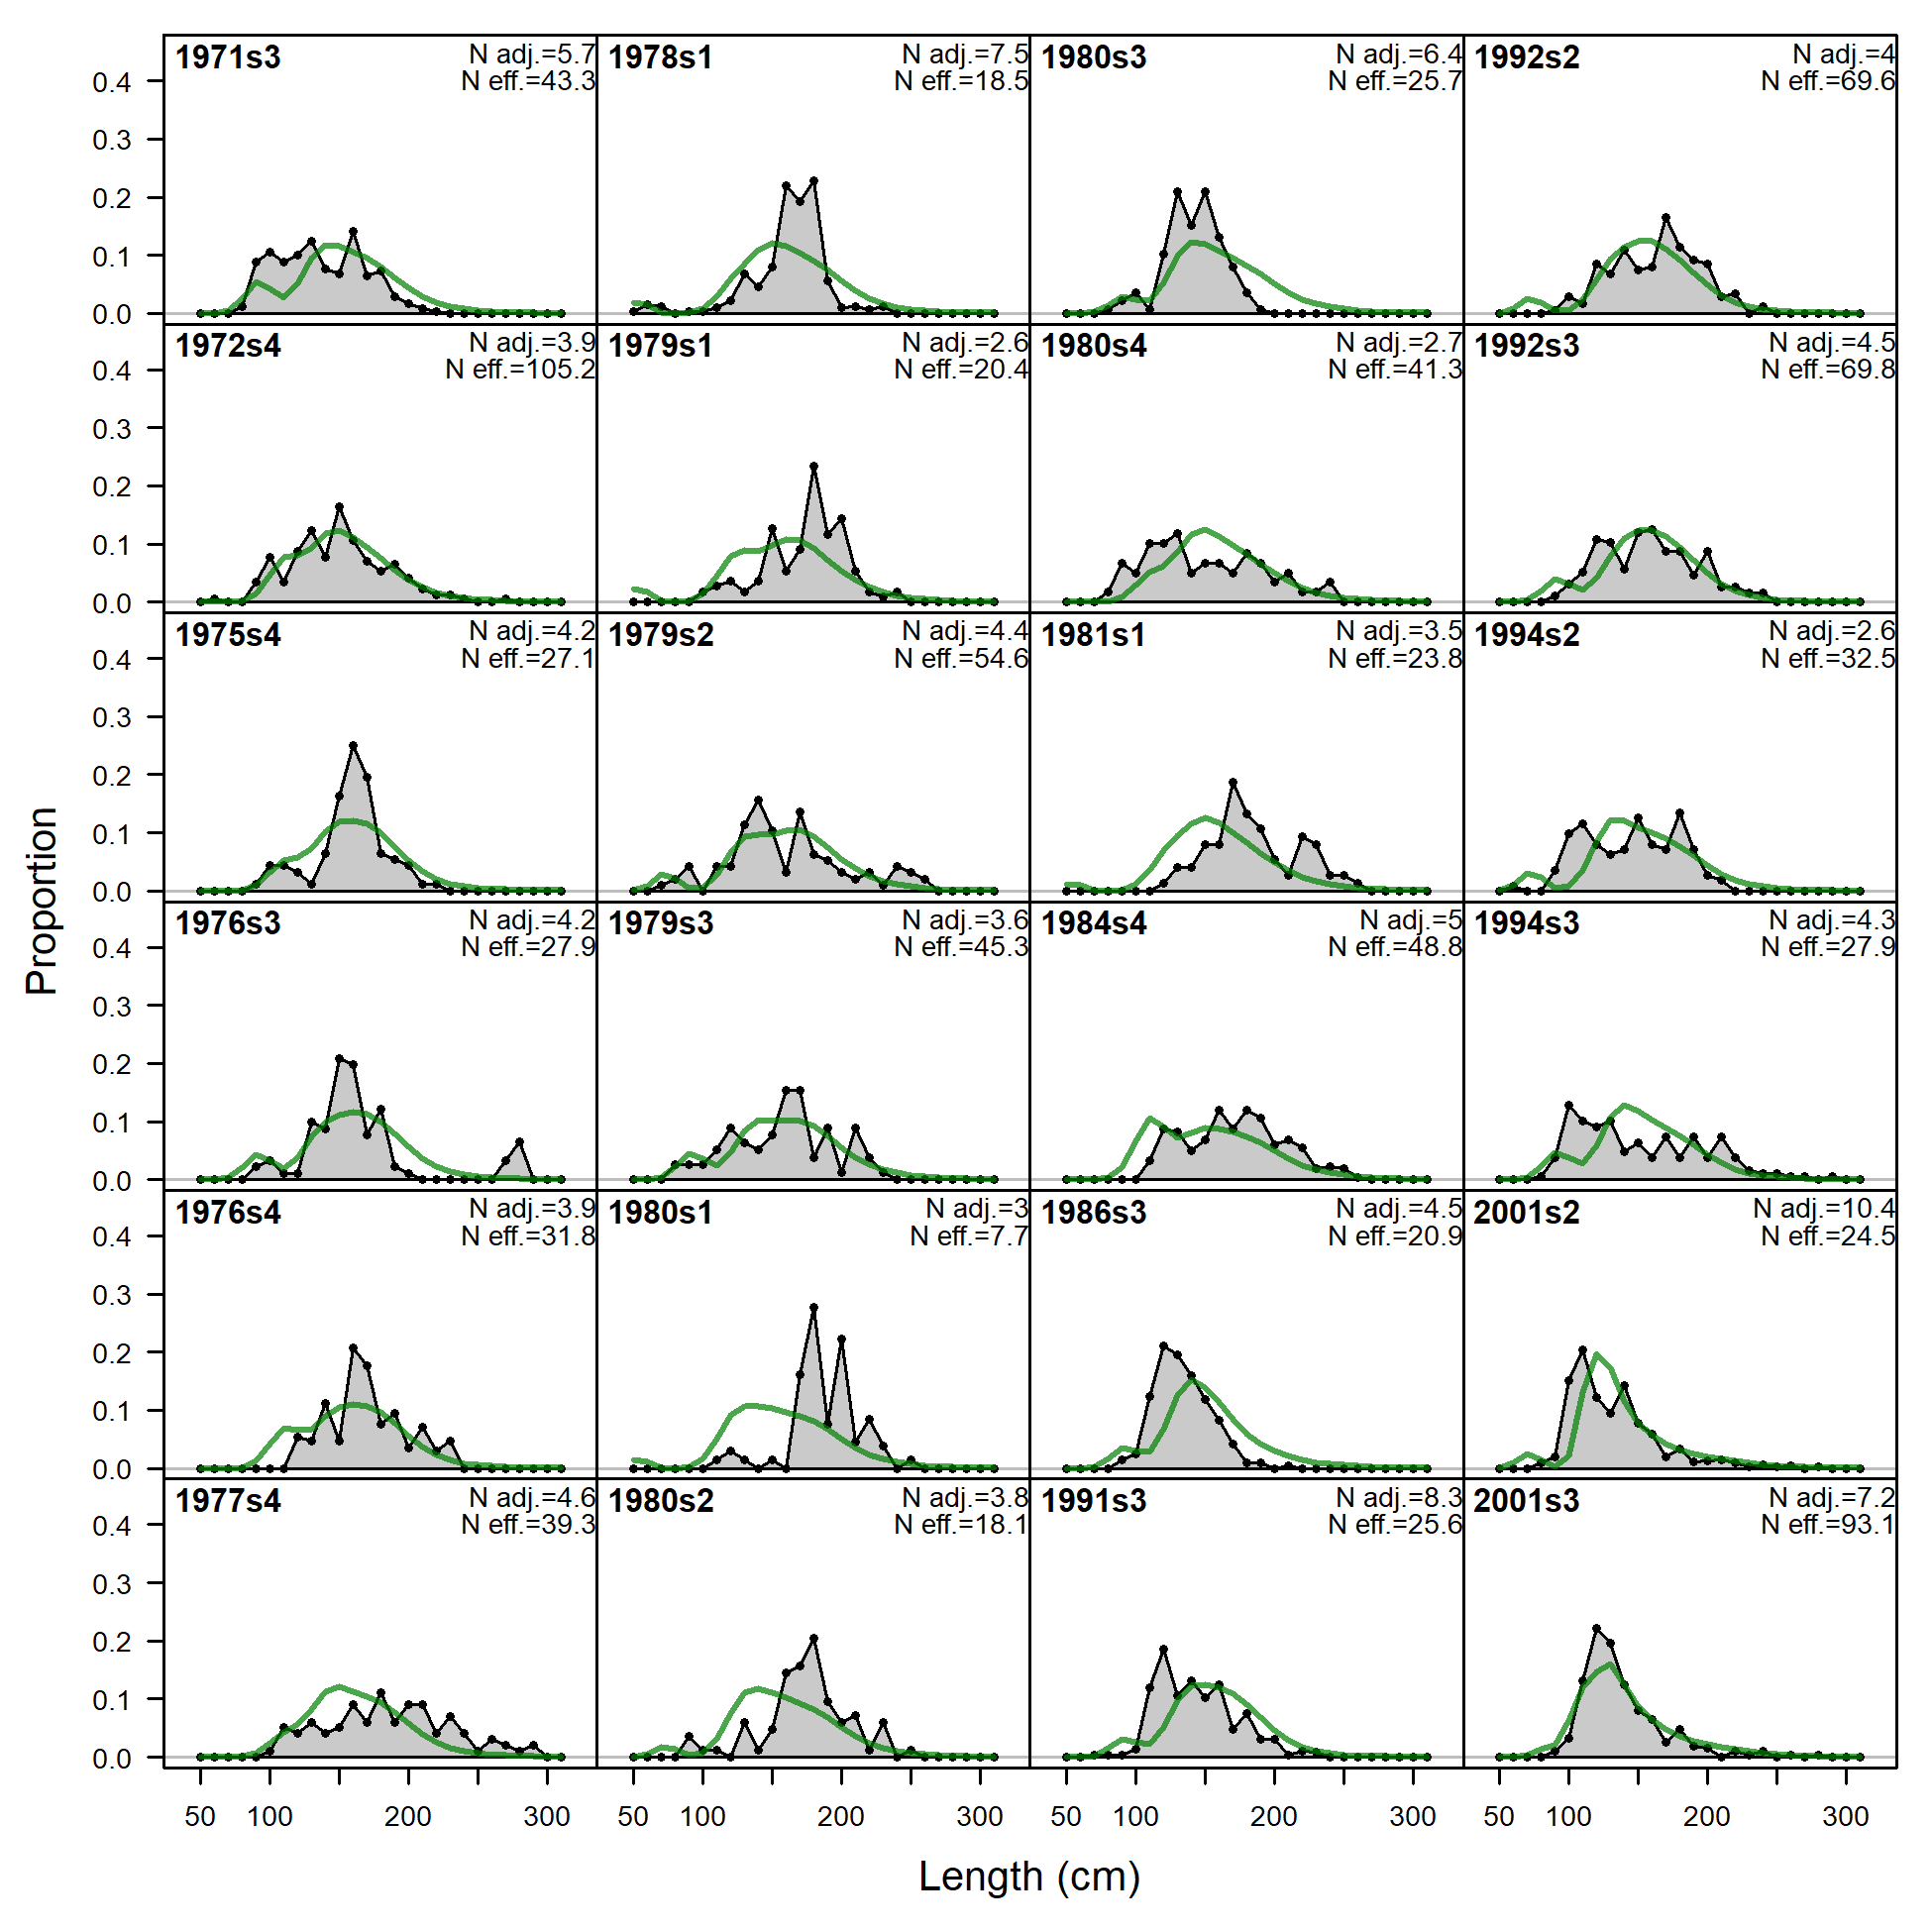
Length comps, whole catch, F5_LL_Coast_A5 (plot 1 of 3).
'N adj.' is the input sample size after data-weighting adjustment. N eff. is the calculated effective sample size used in the McAllister-Ianelli tuning method.
file: comp_lenfit_flt5mkt0_page1.png
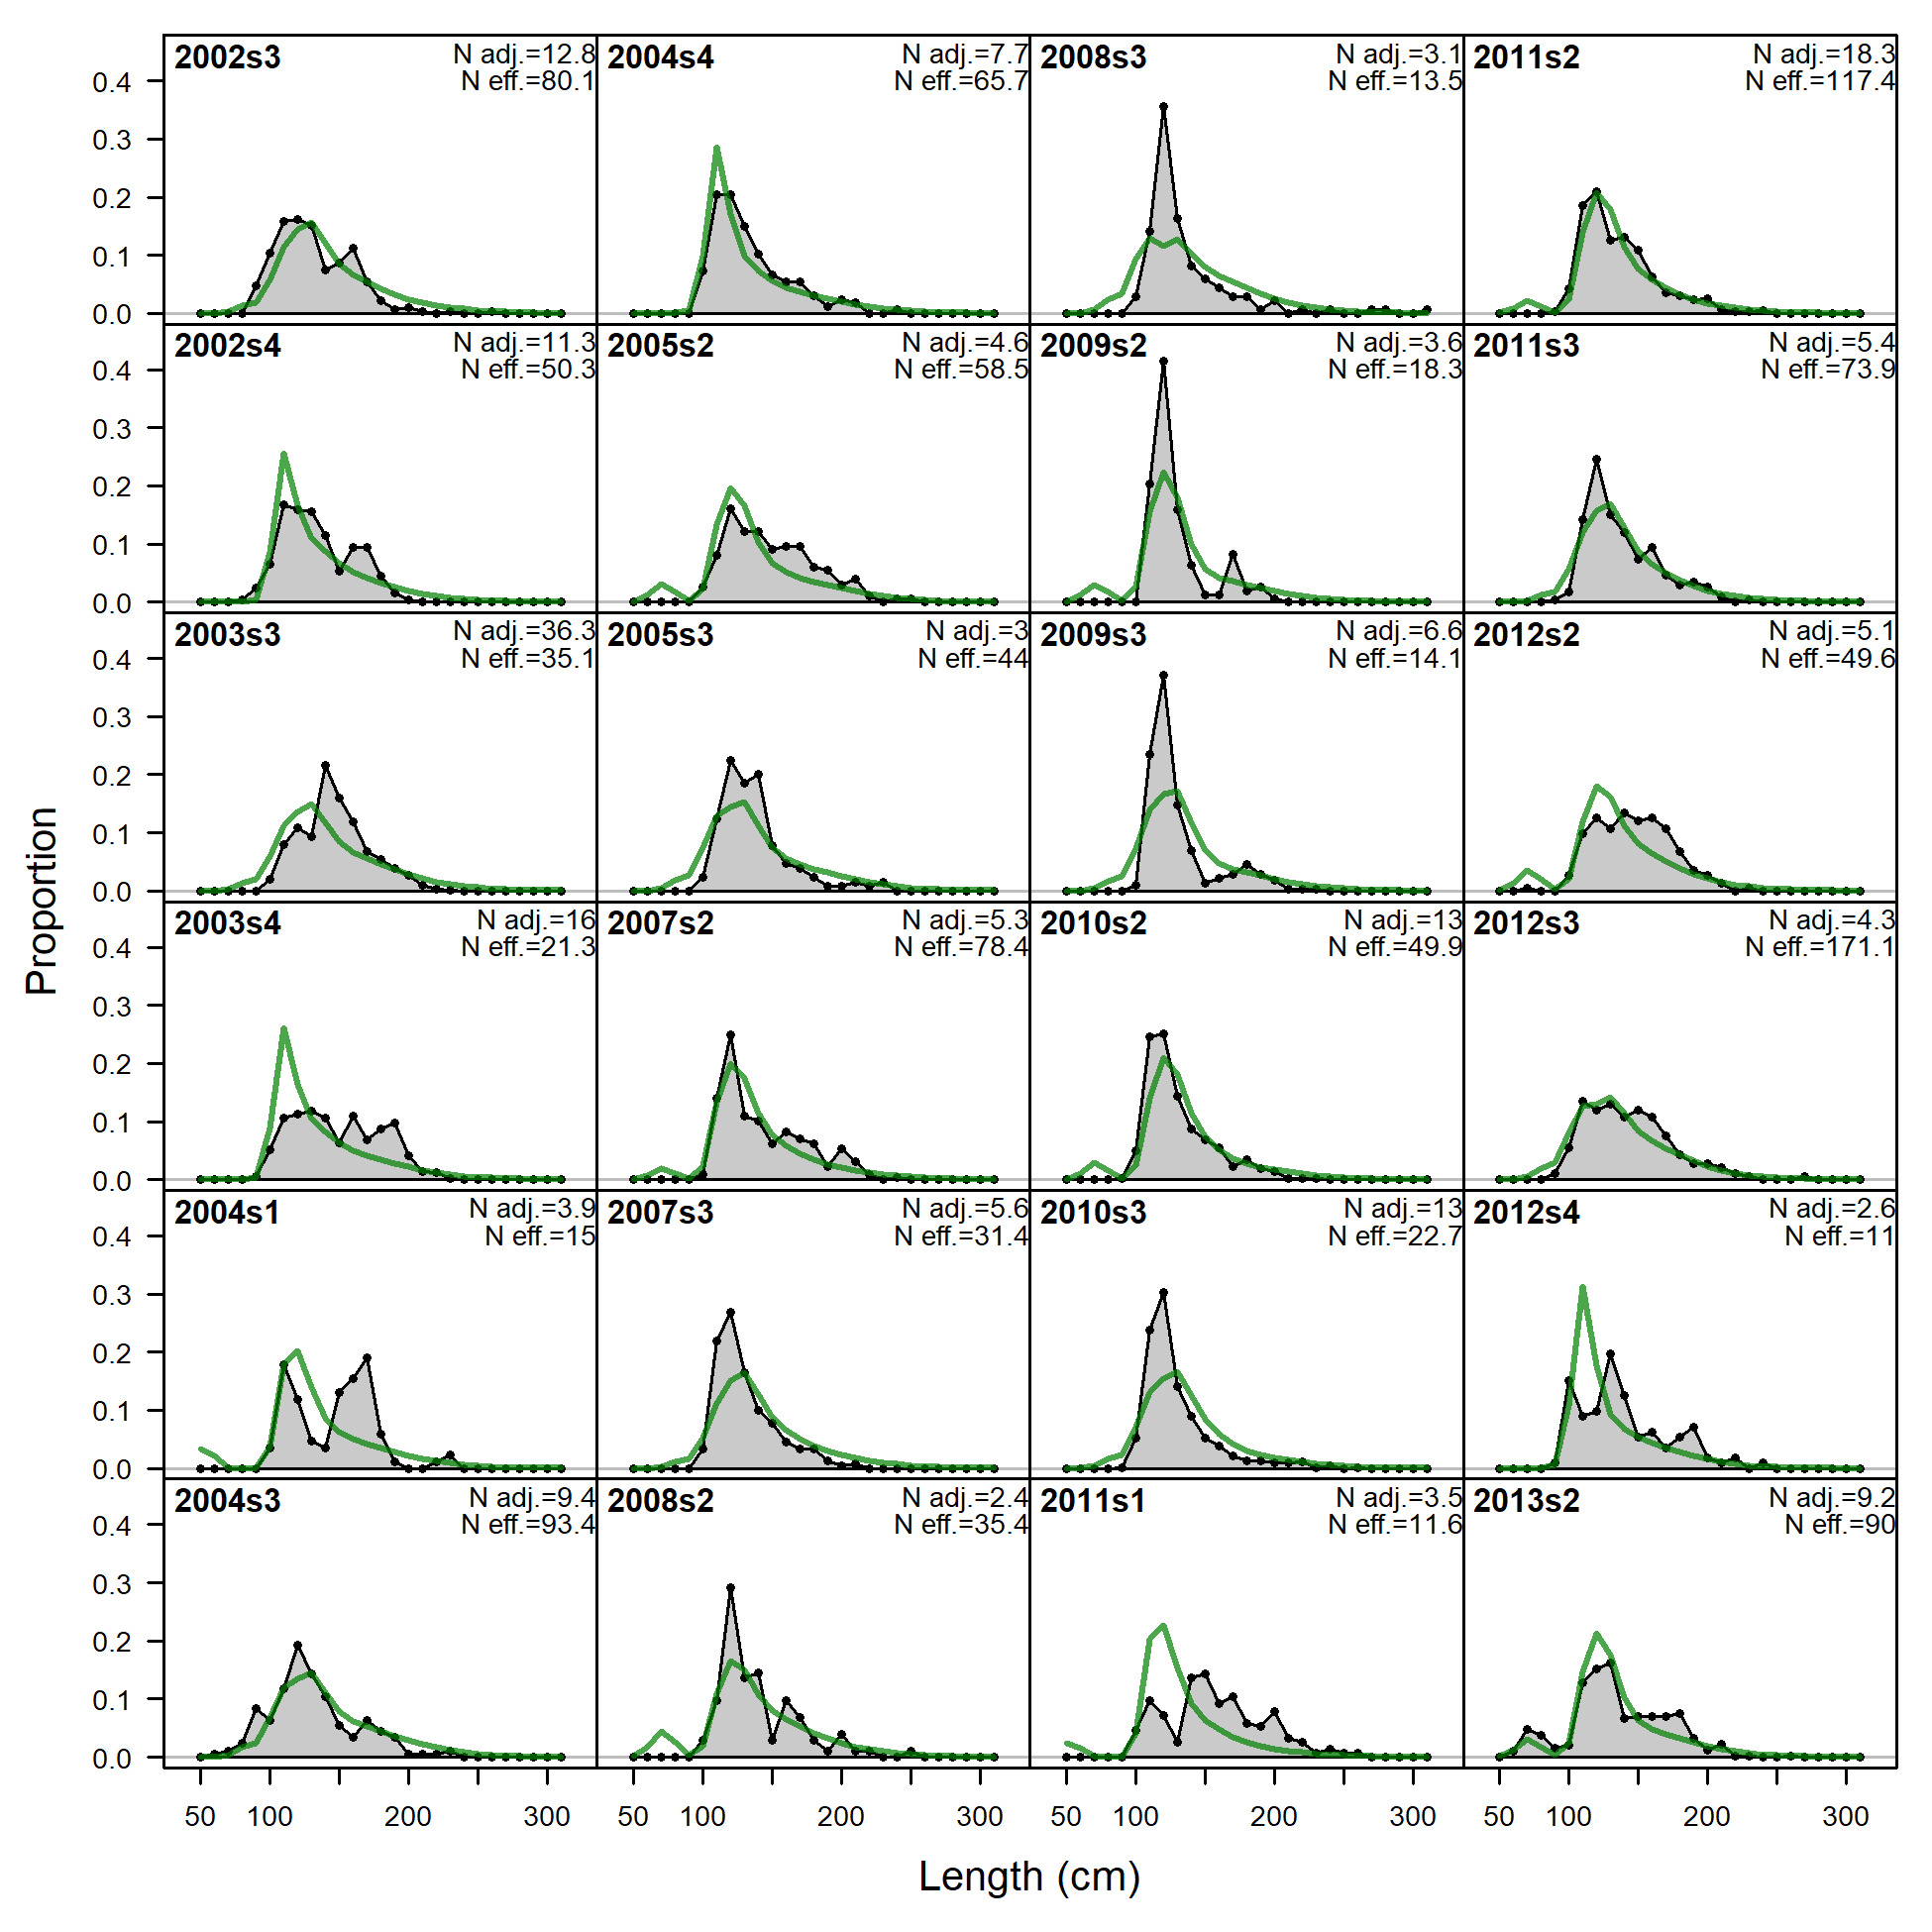
Length comps, whole catch, F5_LL_Coast_A5 (plot 1 of 3).
'N adj.' is the input sample size after data-weighting adjustment. N eff. is the calculated effective sample size used in the McAllister-Ianelli tuning method. (plot 2 of 3)
file: comp_lenfit_flt5mkt0_page2.png
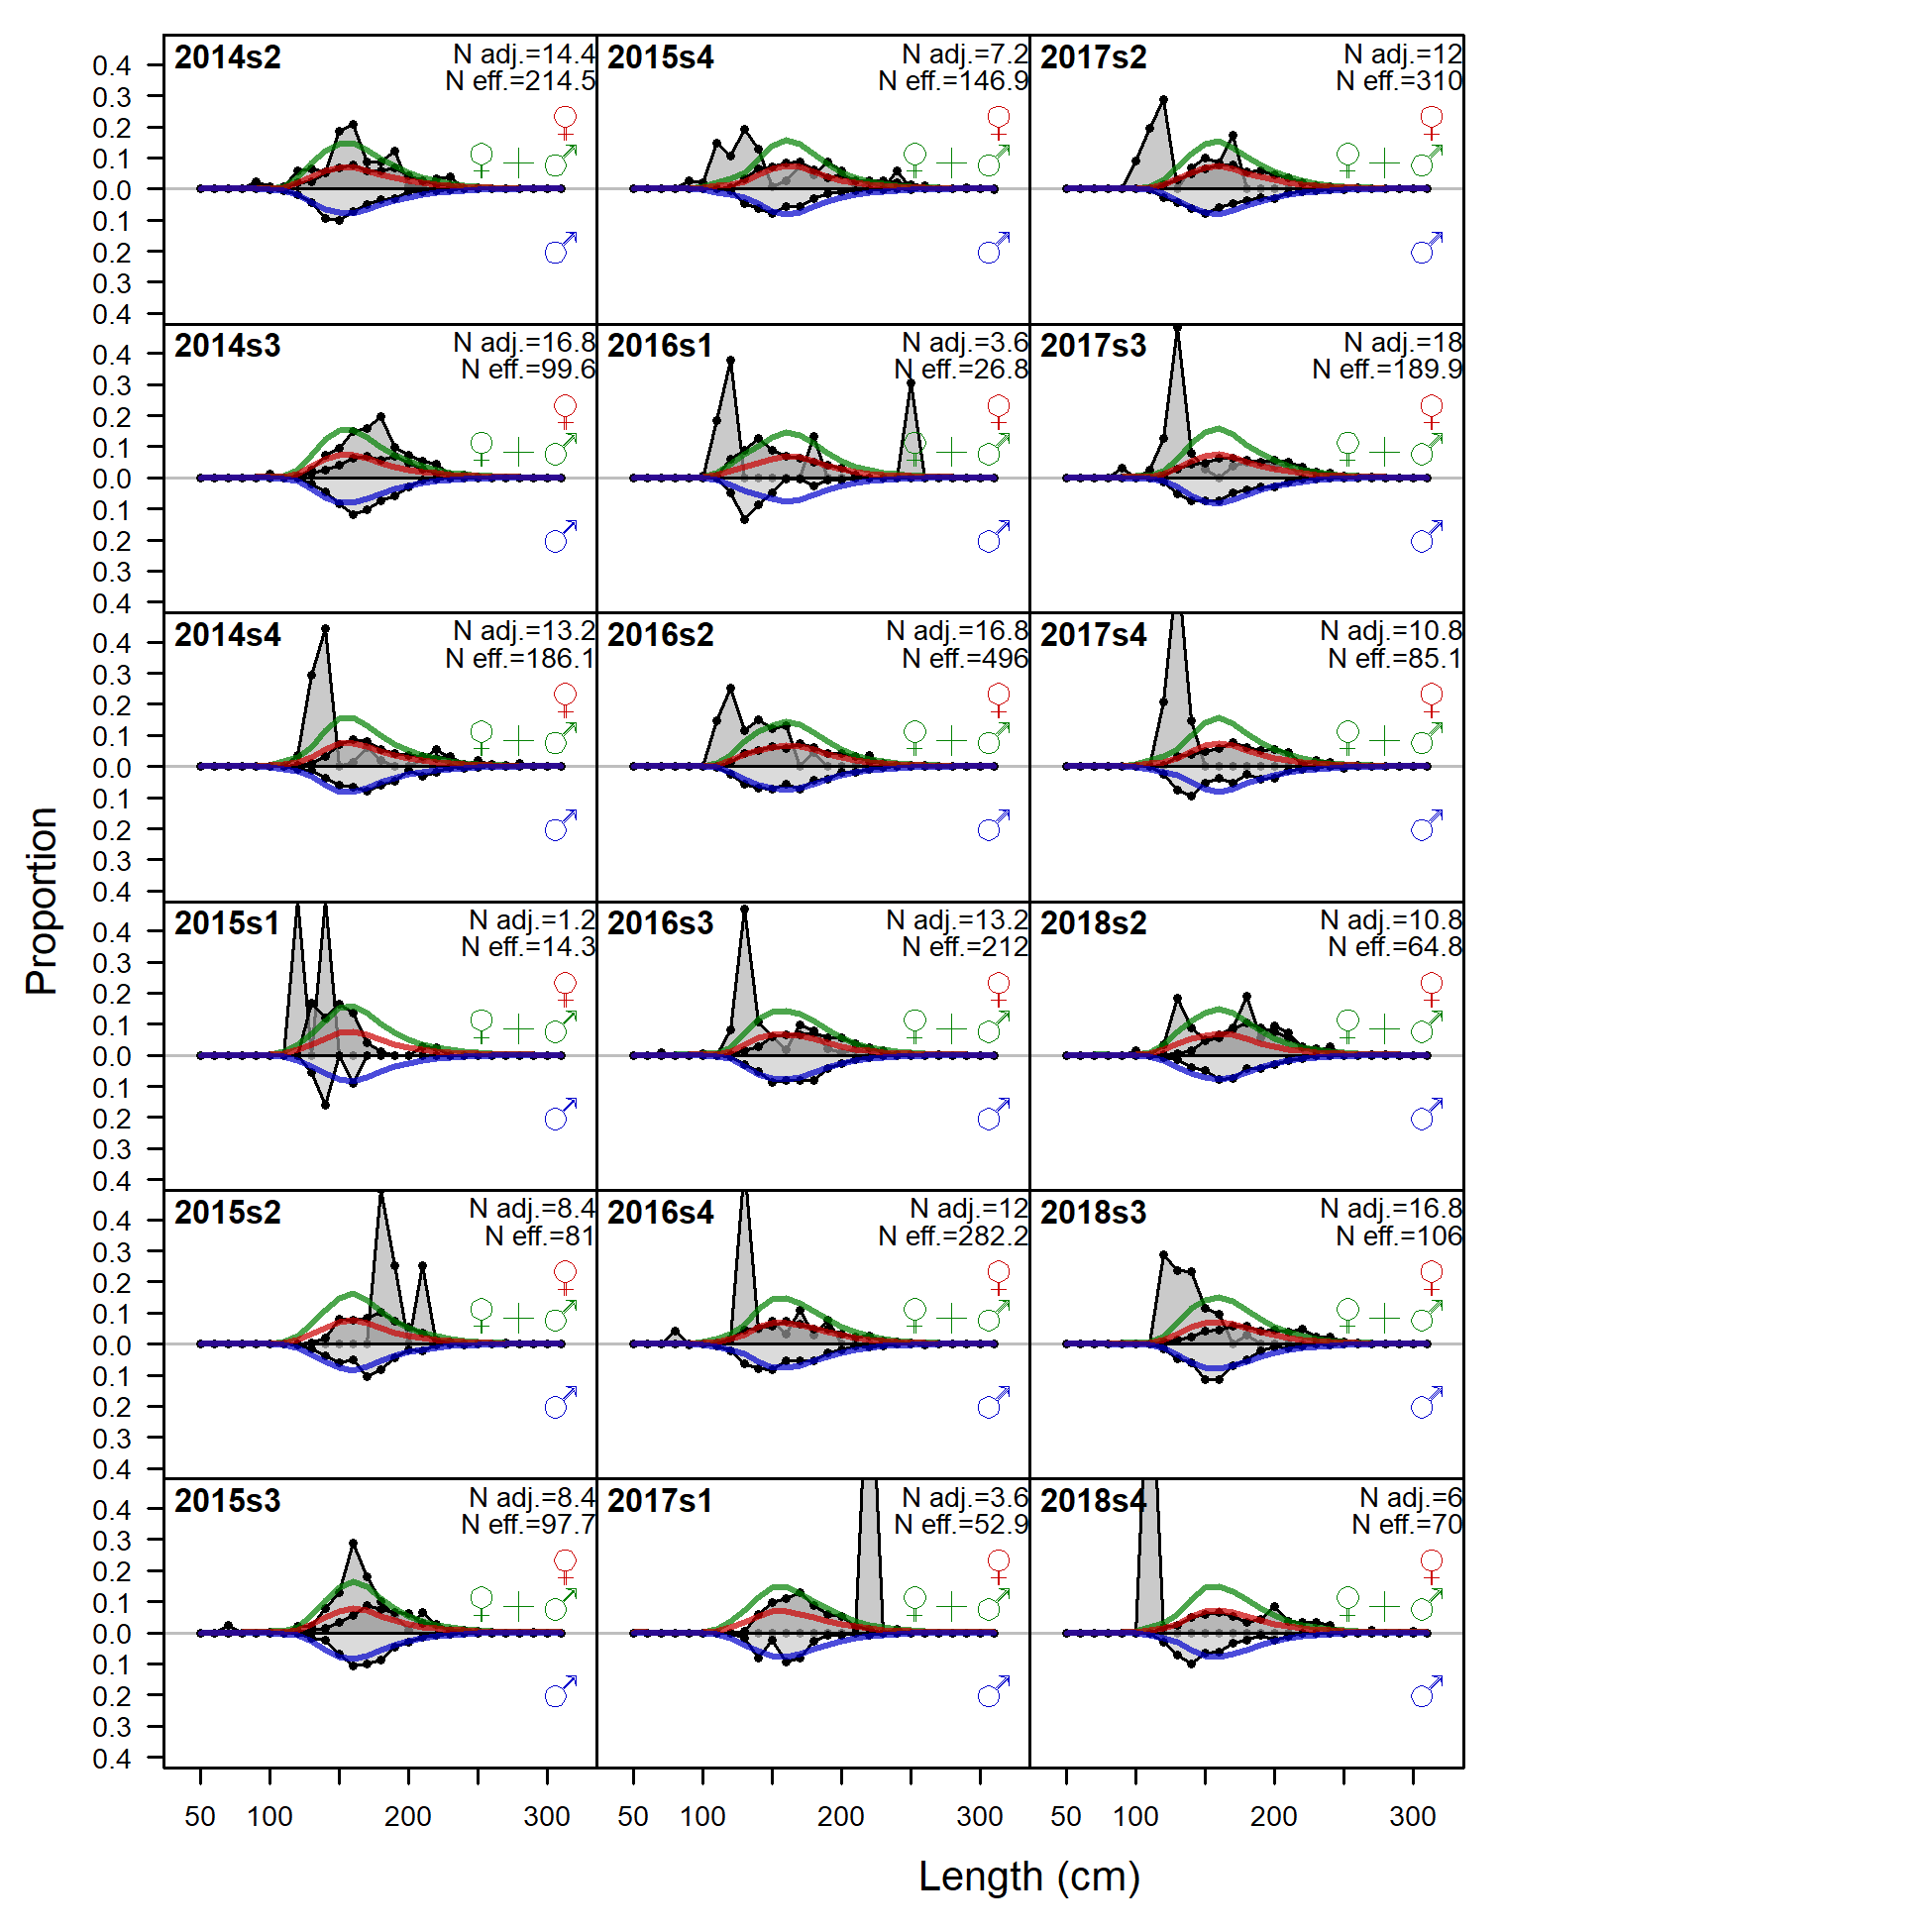
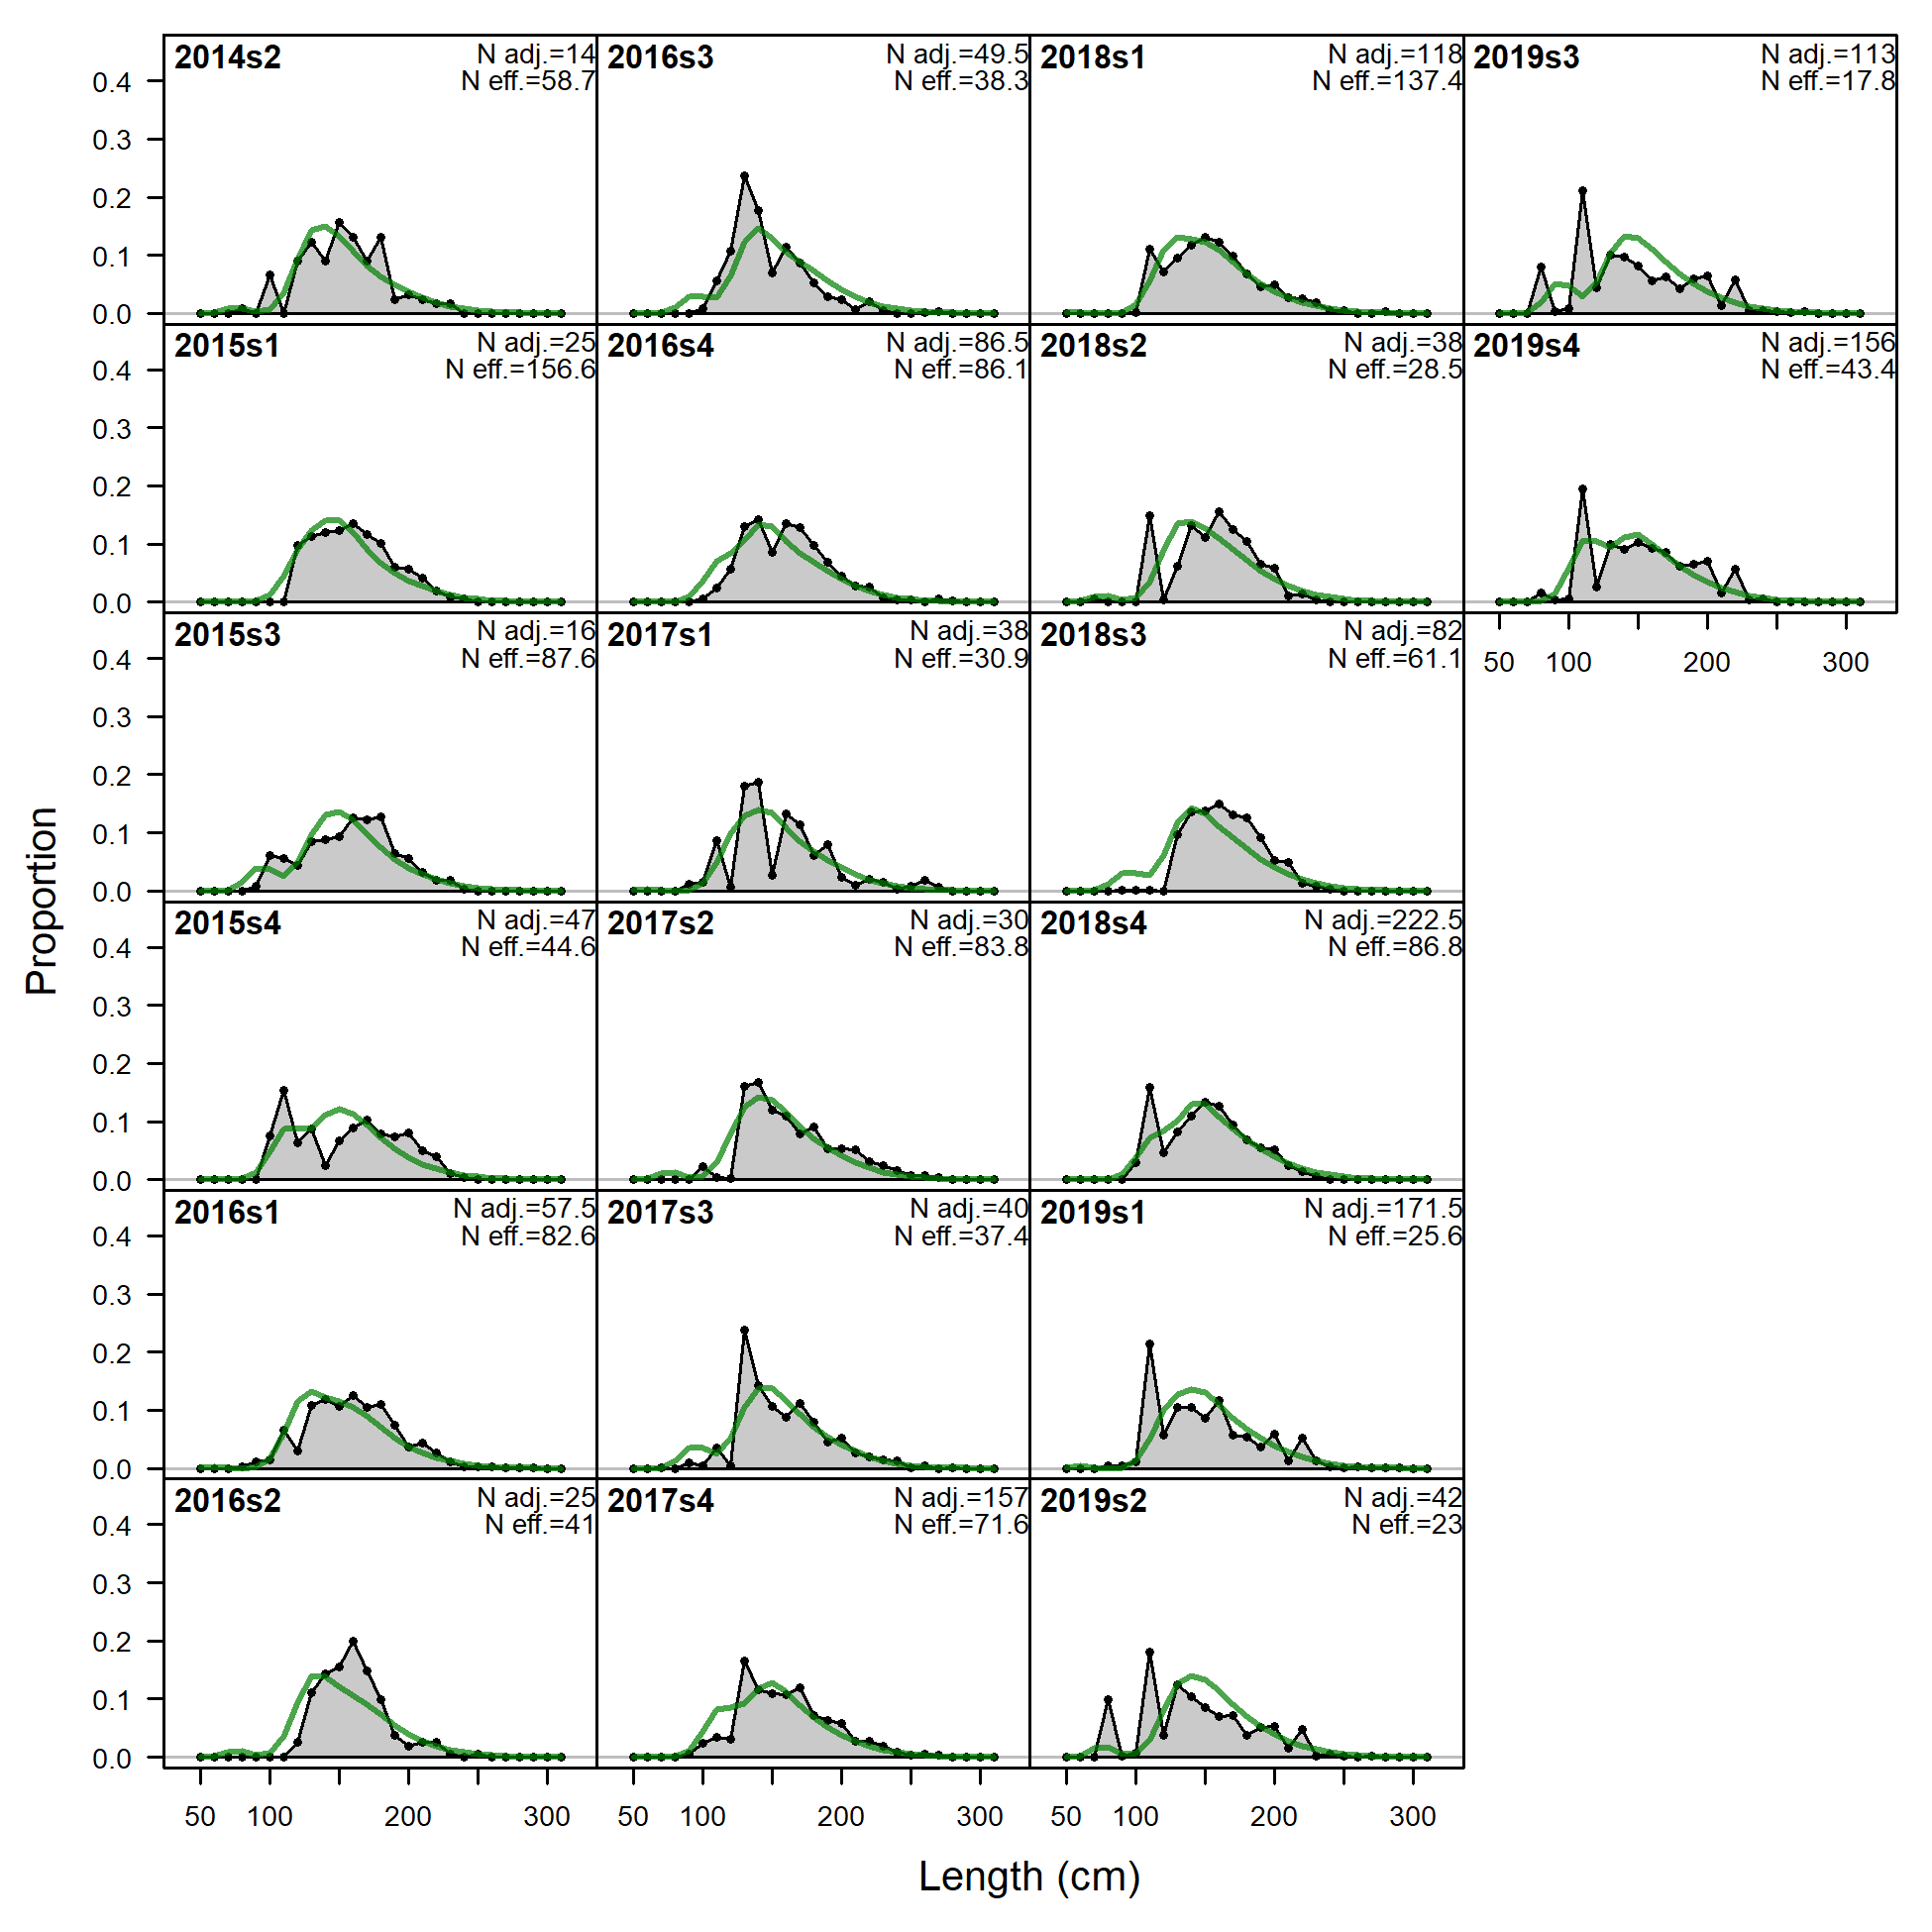
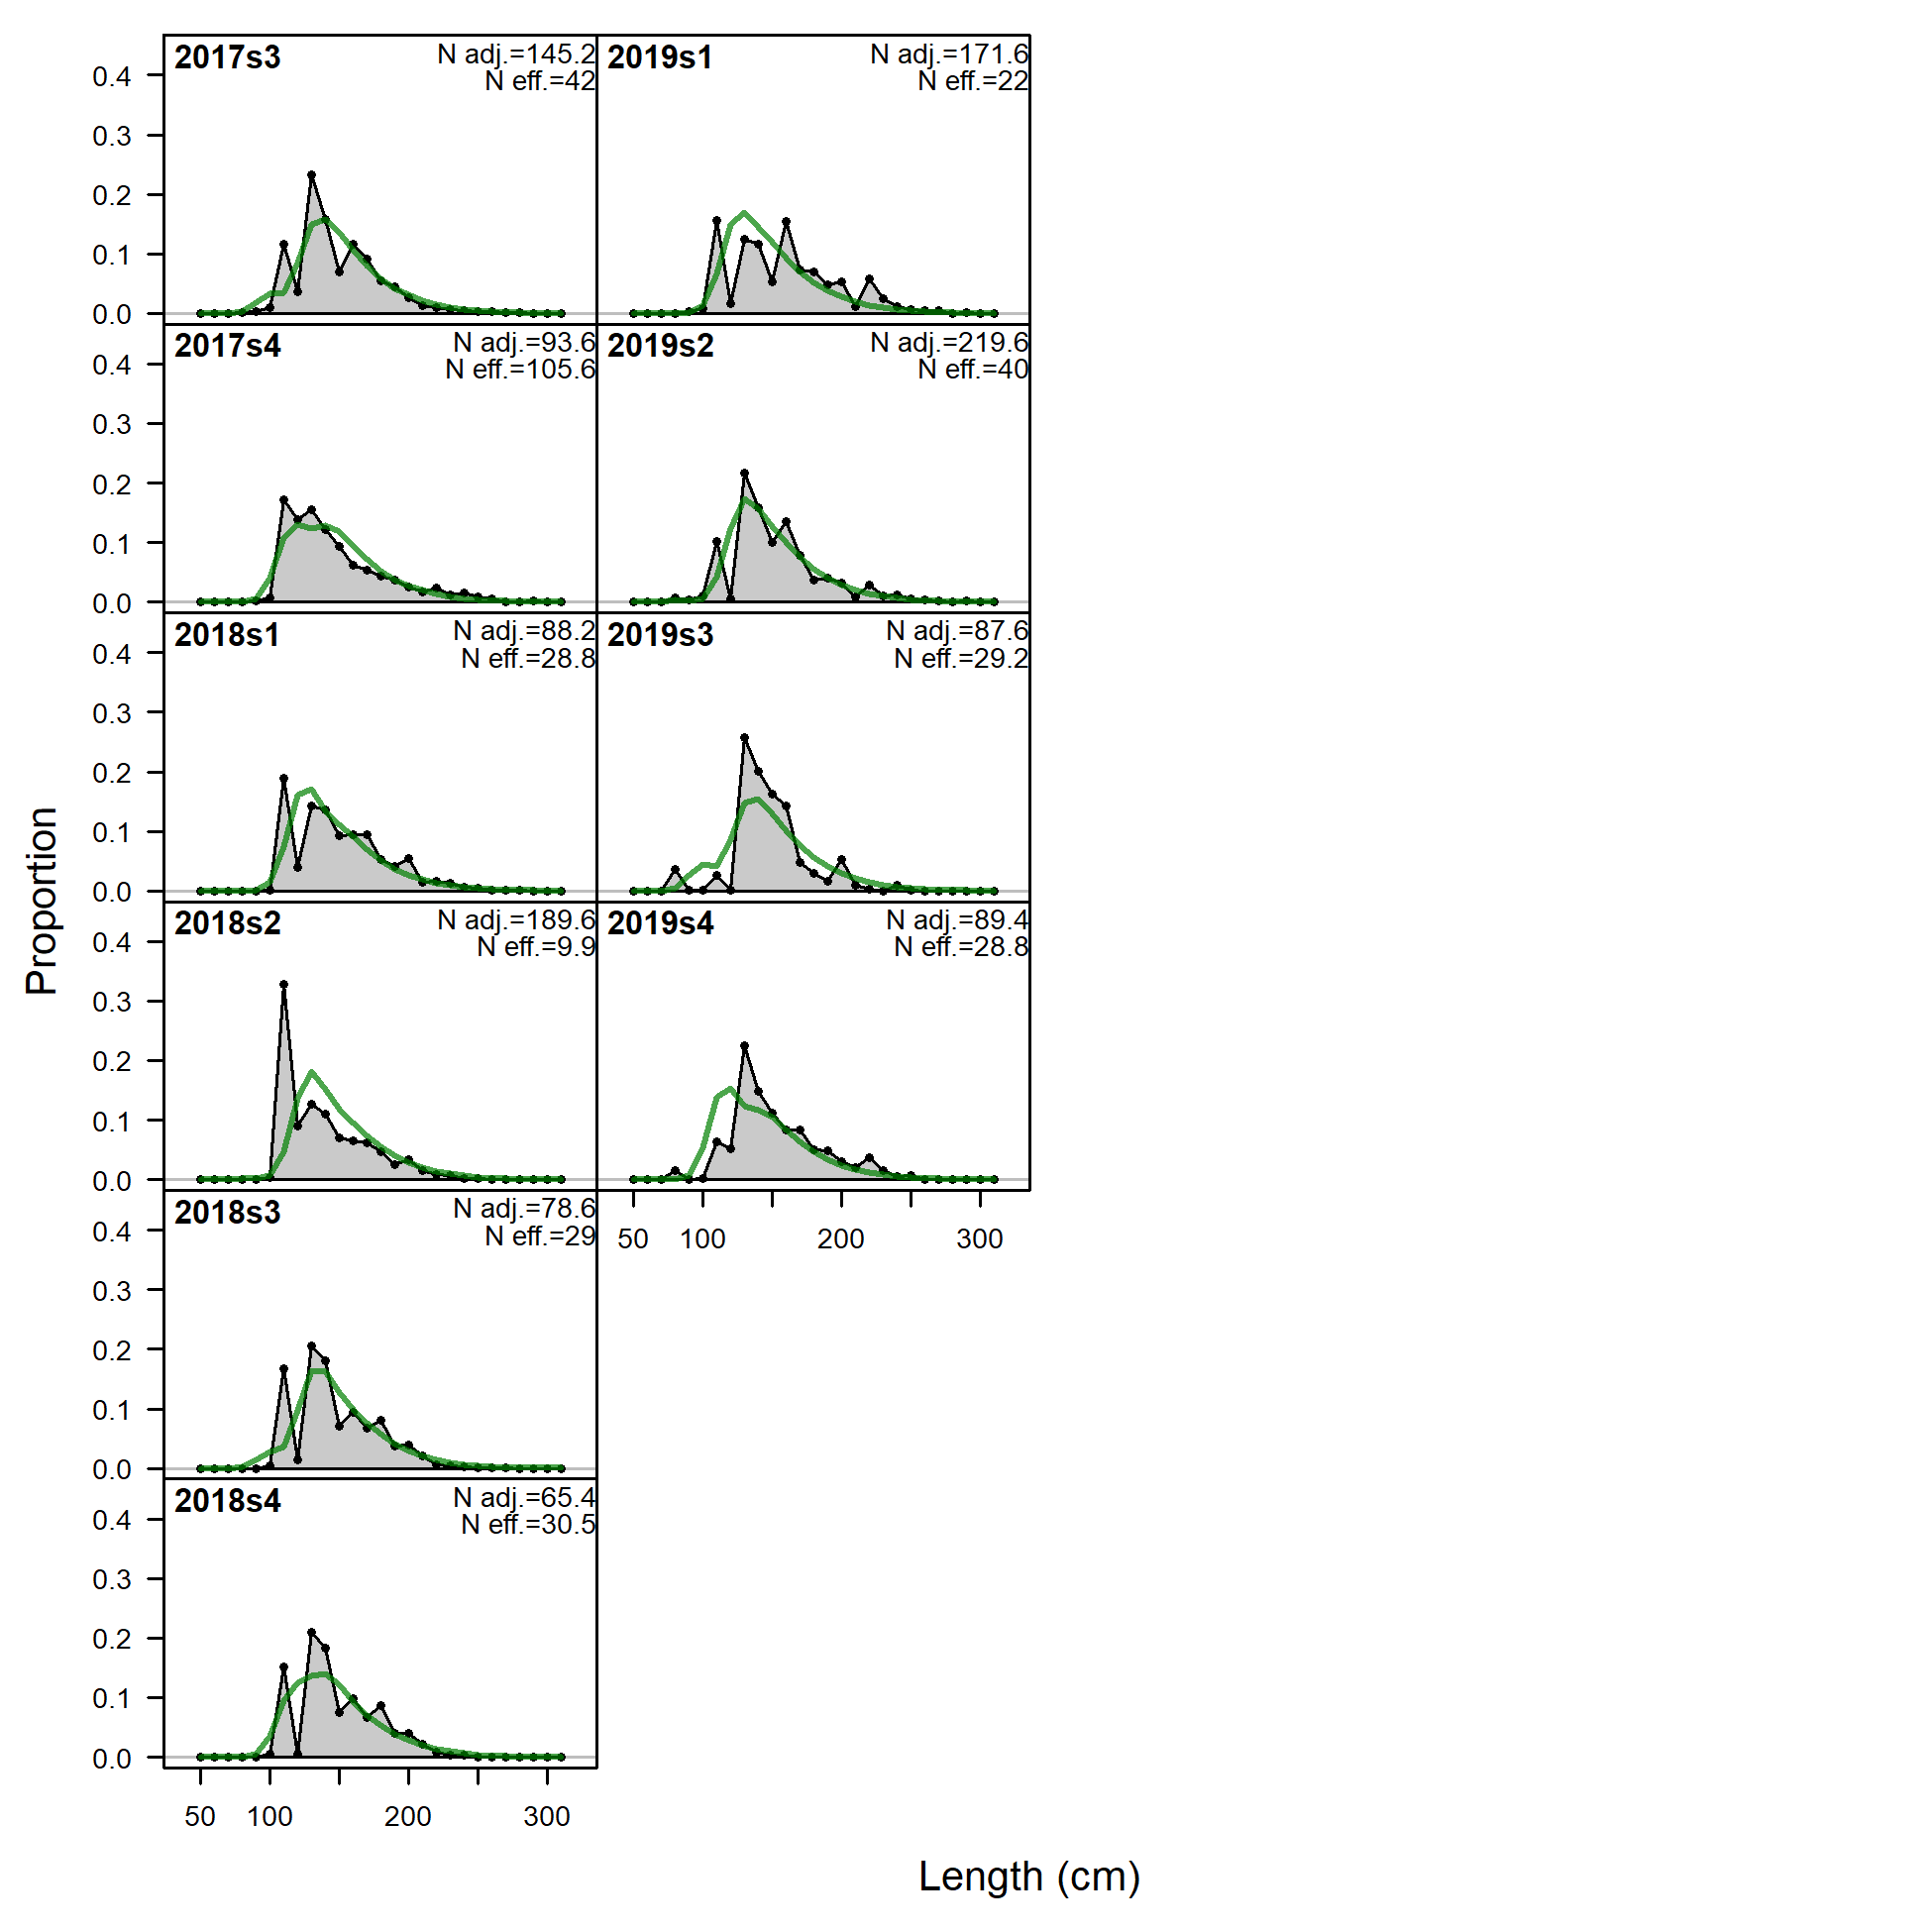
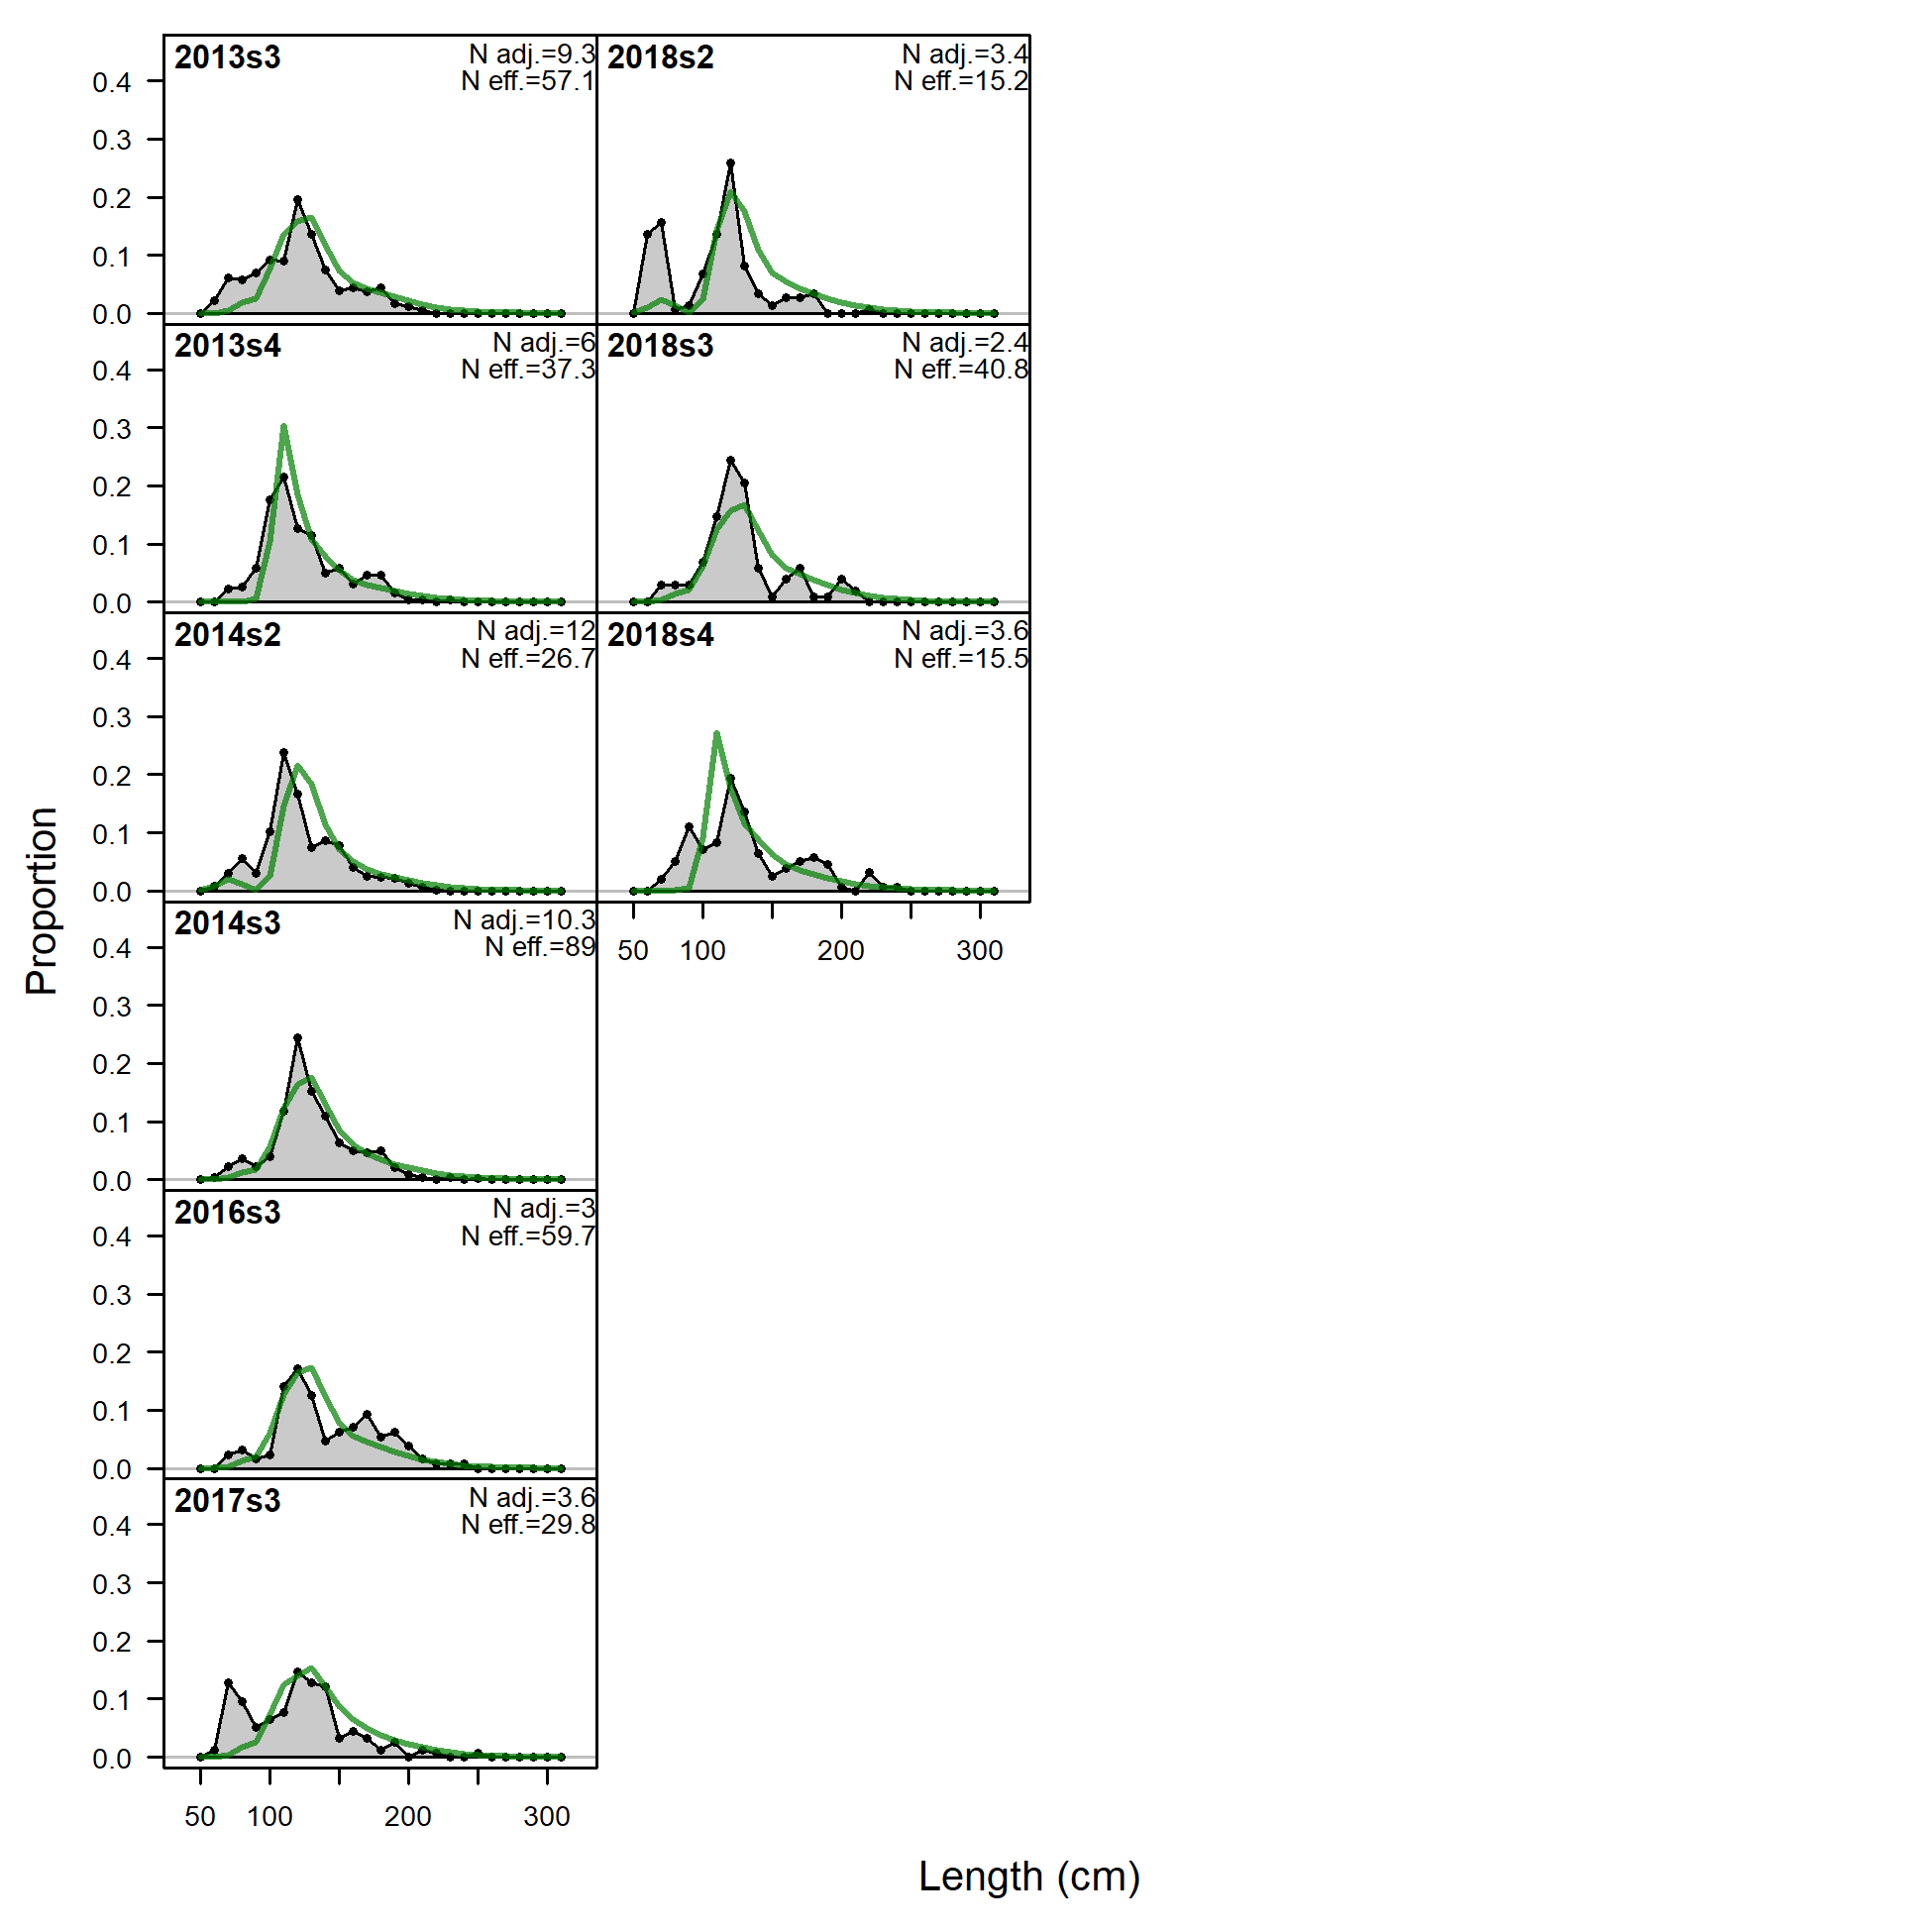
Length comps, whole catch, F5_LL_Coast_A5 (plot 1 of 3).
'N adj.' is the input sample size after data-weighting adjustment. N eff. is the calculated effective sample size used in the McAllister-Ianelli tuning method. (plot 2 of 3) (plot 3 of 3)
file: comp_lenfit_flt5mkt0_page3.png
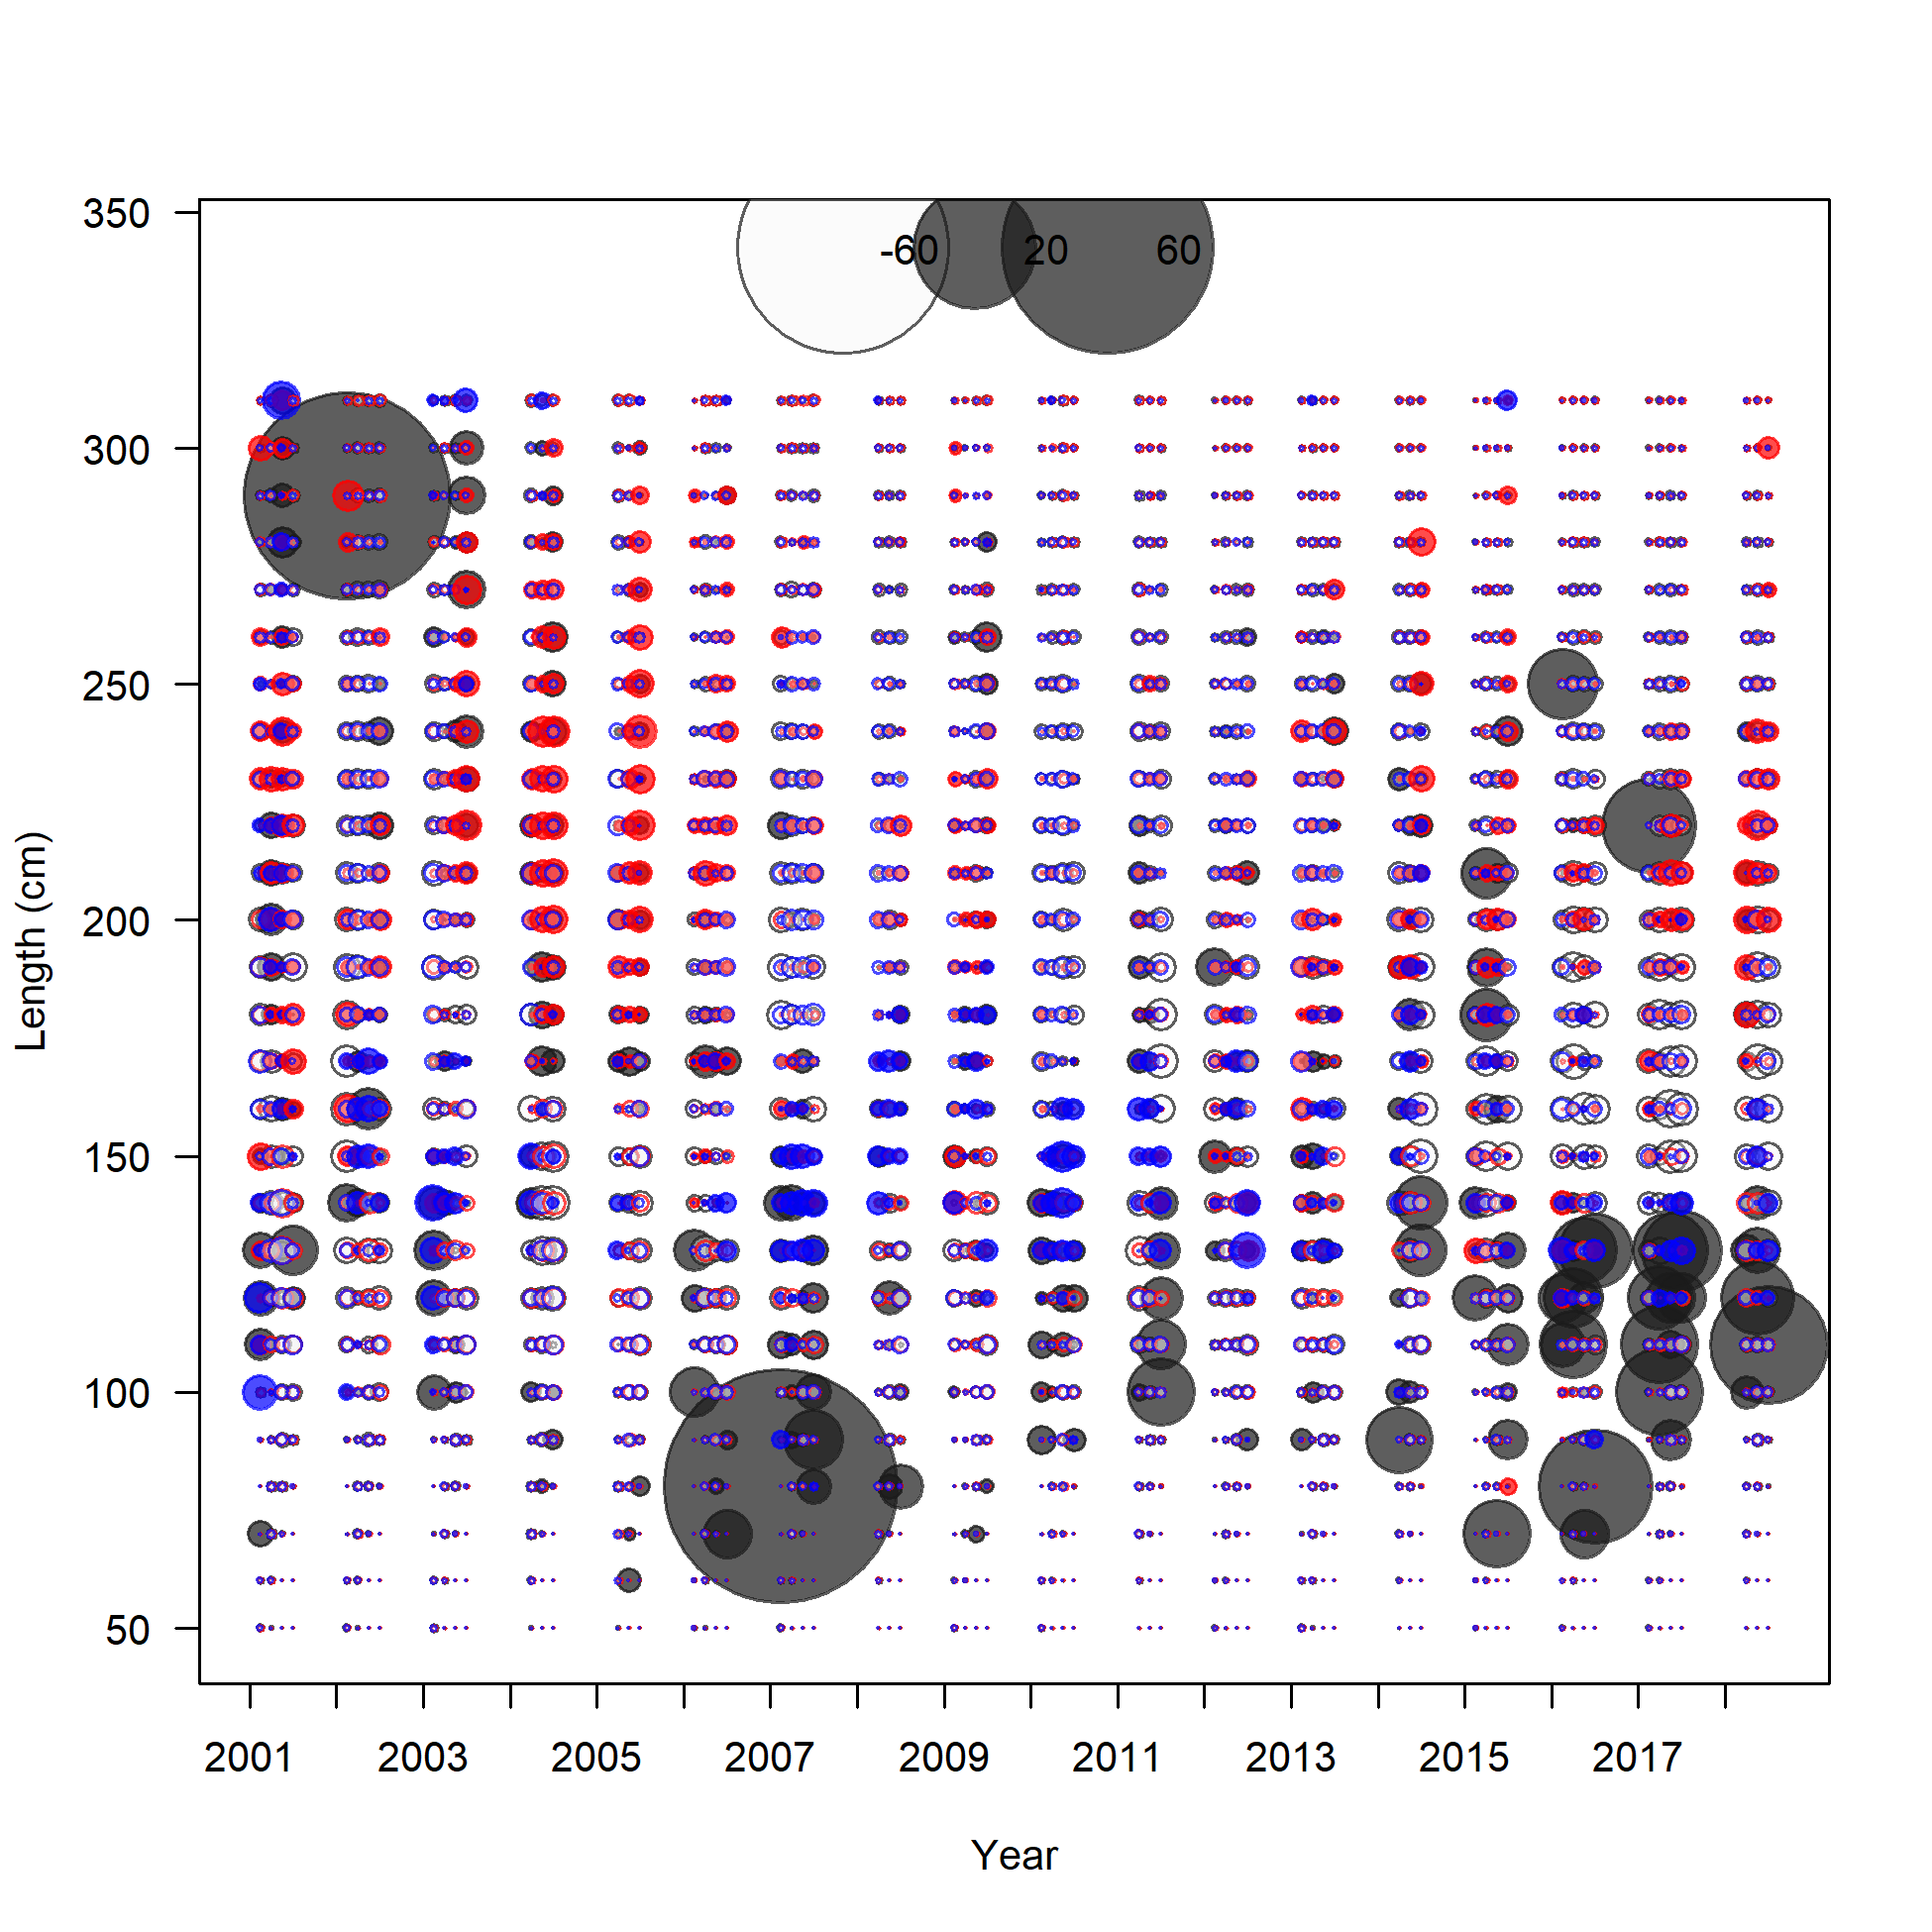
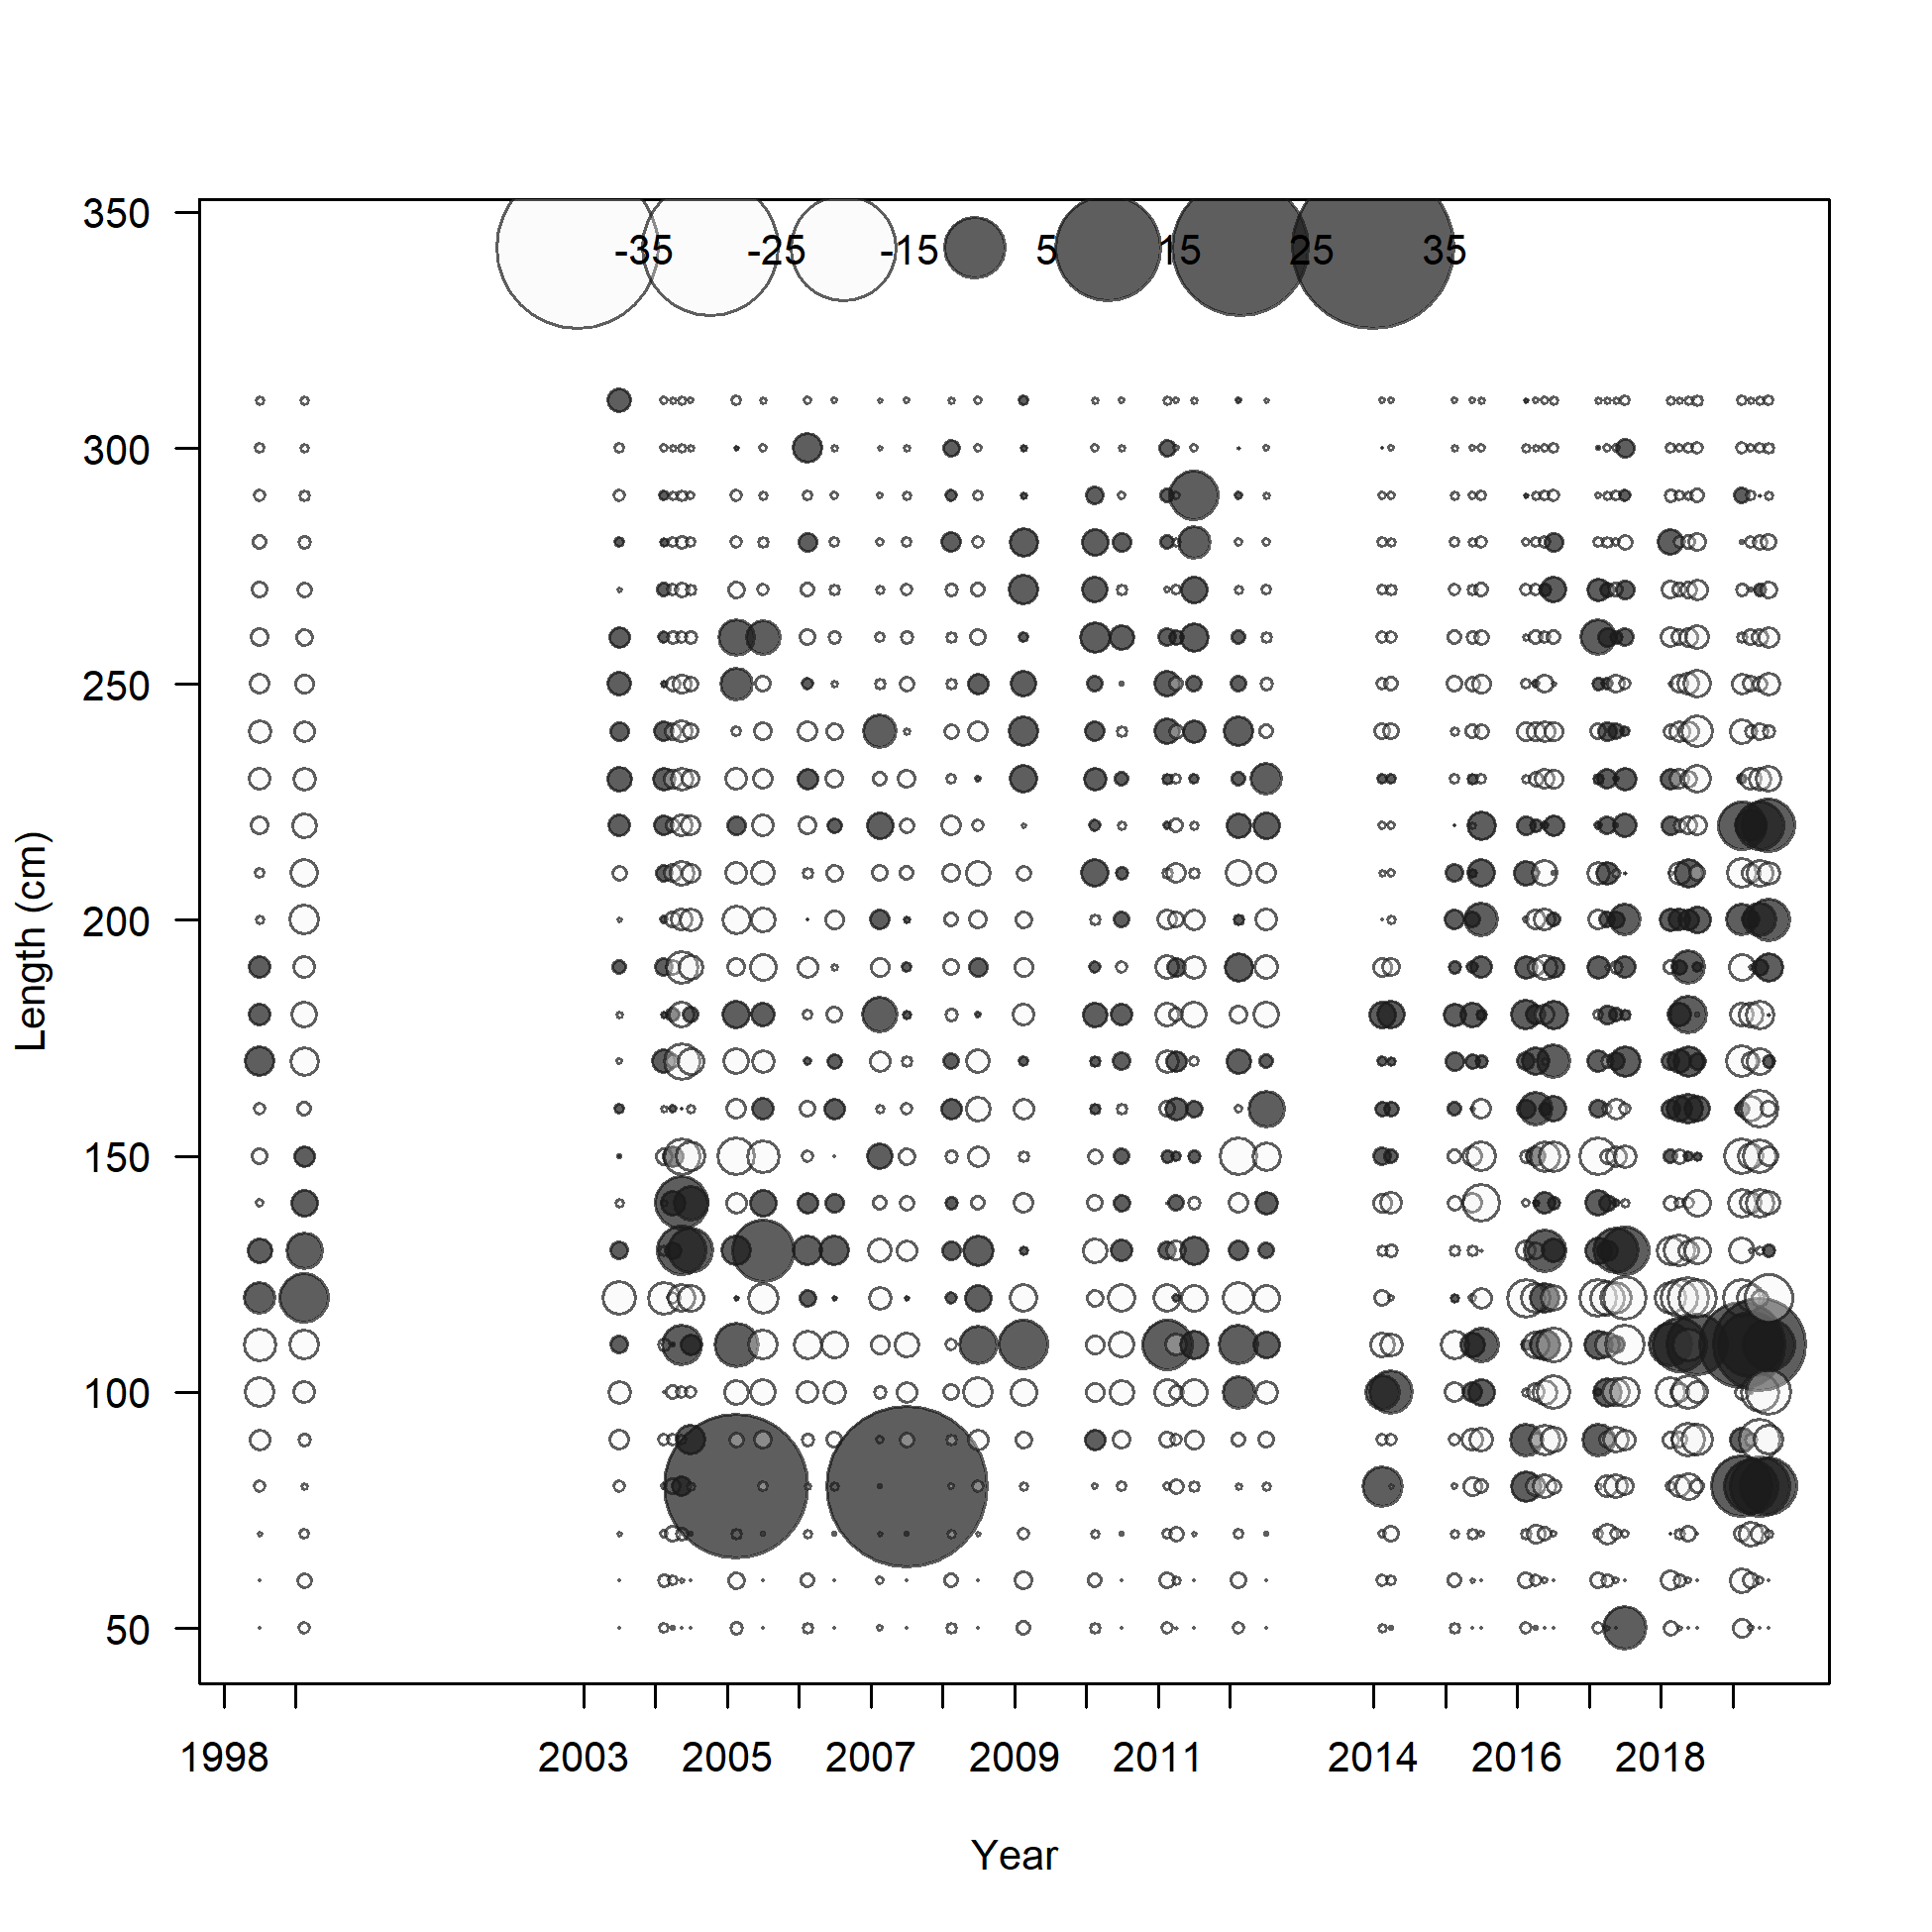
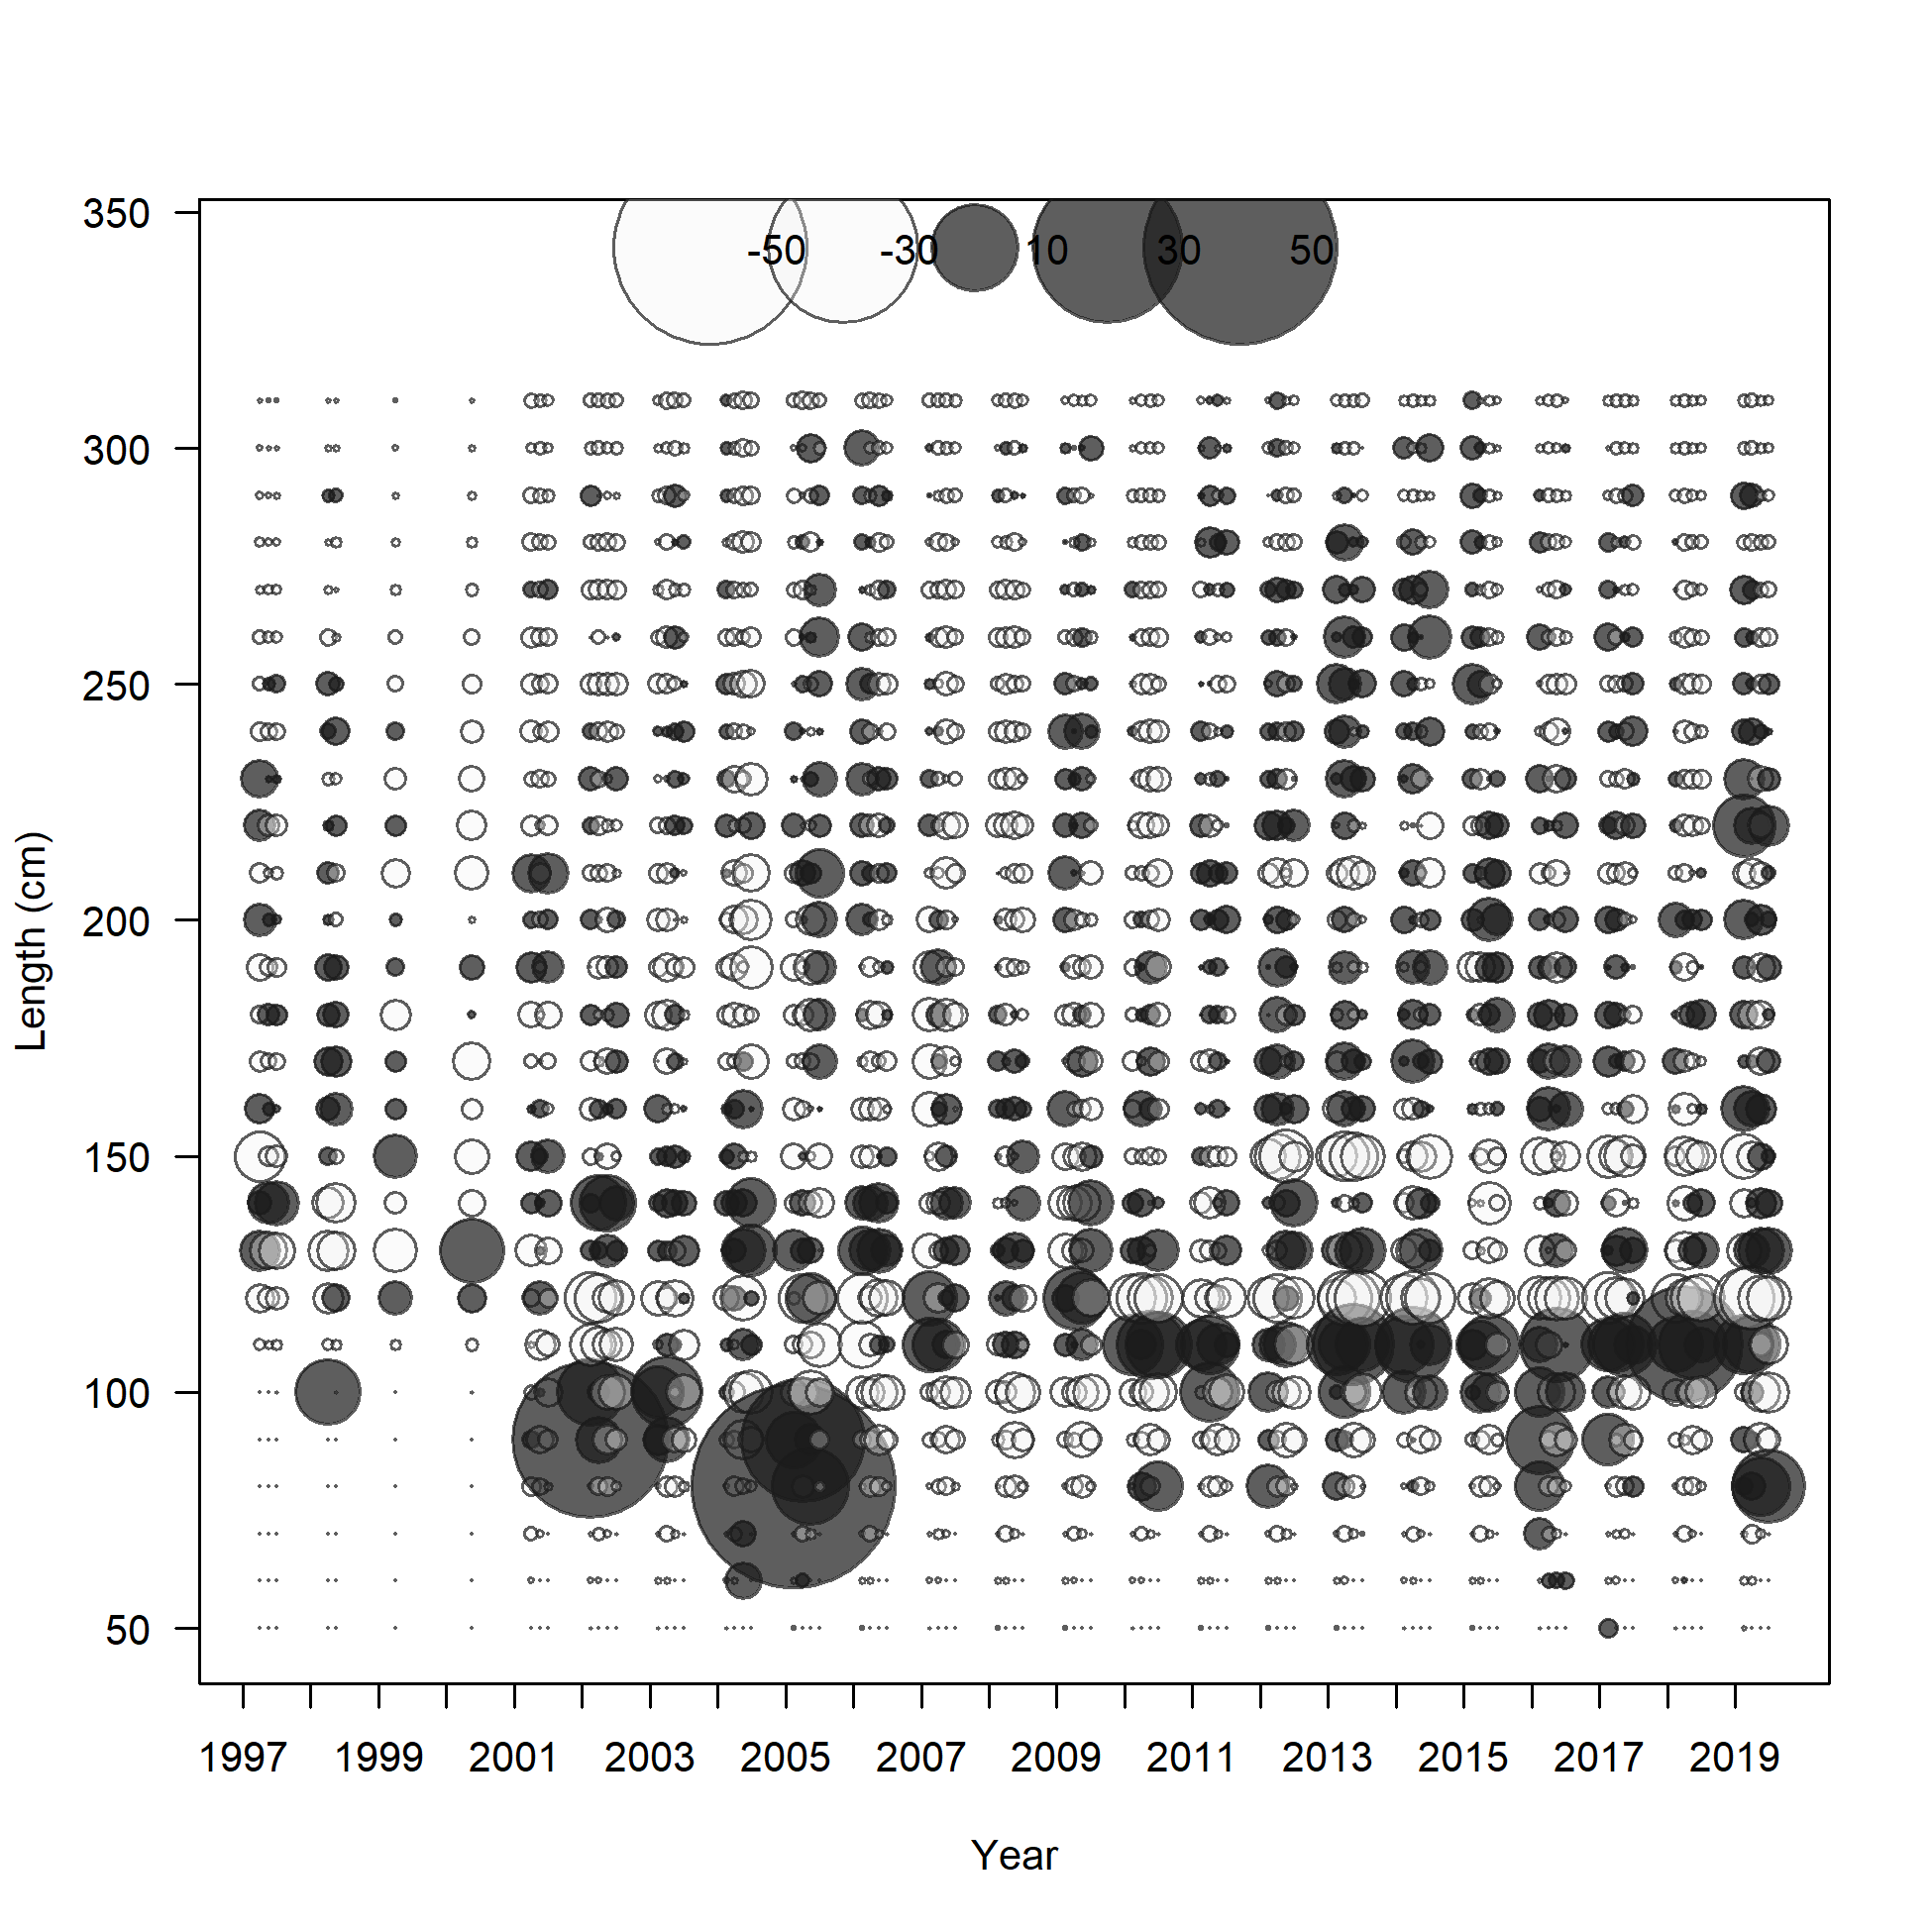
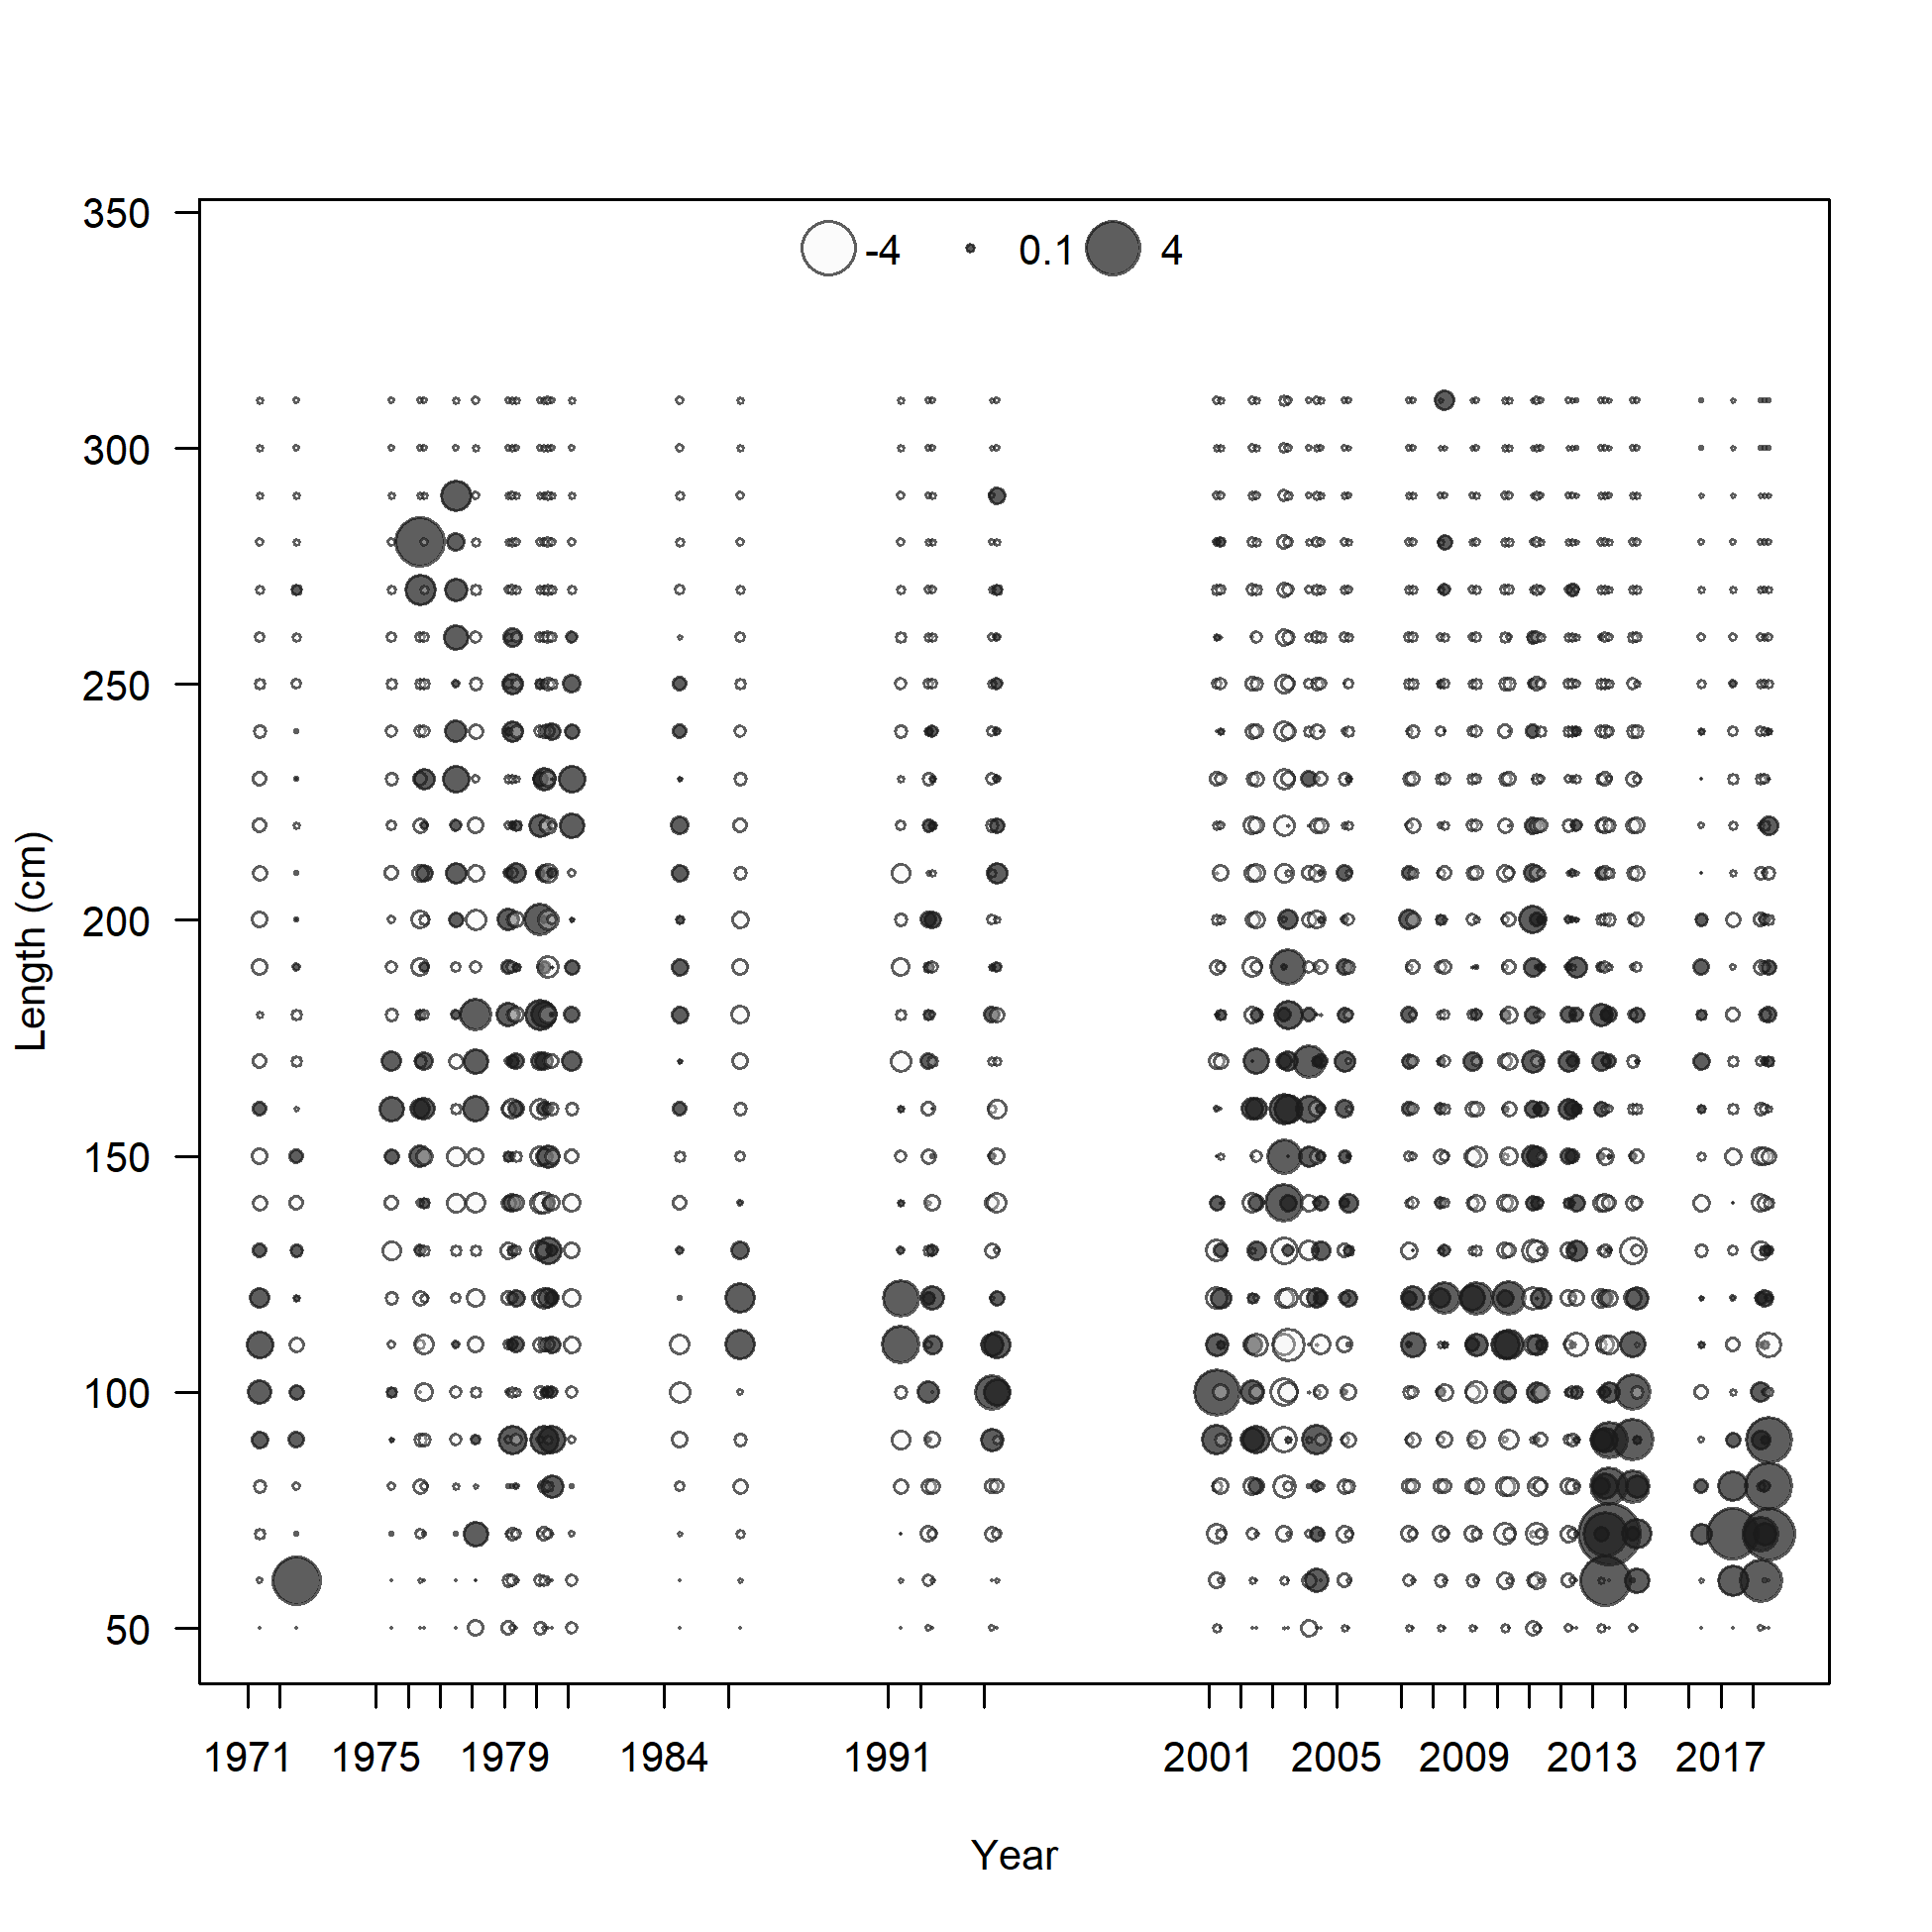
Pearson residuals, whole catch, F5_LL_Coast_A5 (max=72.9) (plot 3 of 3)
Closed bubbles are positive residuals (observed > expected) and open bubbles are negative residuals (observed < expected).
file: comp_lenfit_residsflt5mkt0_page3.png
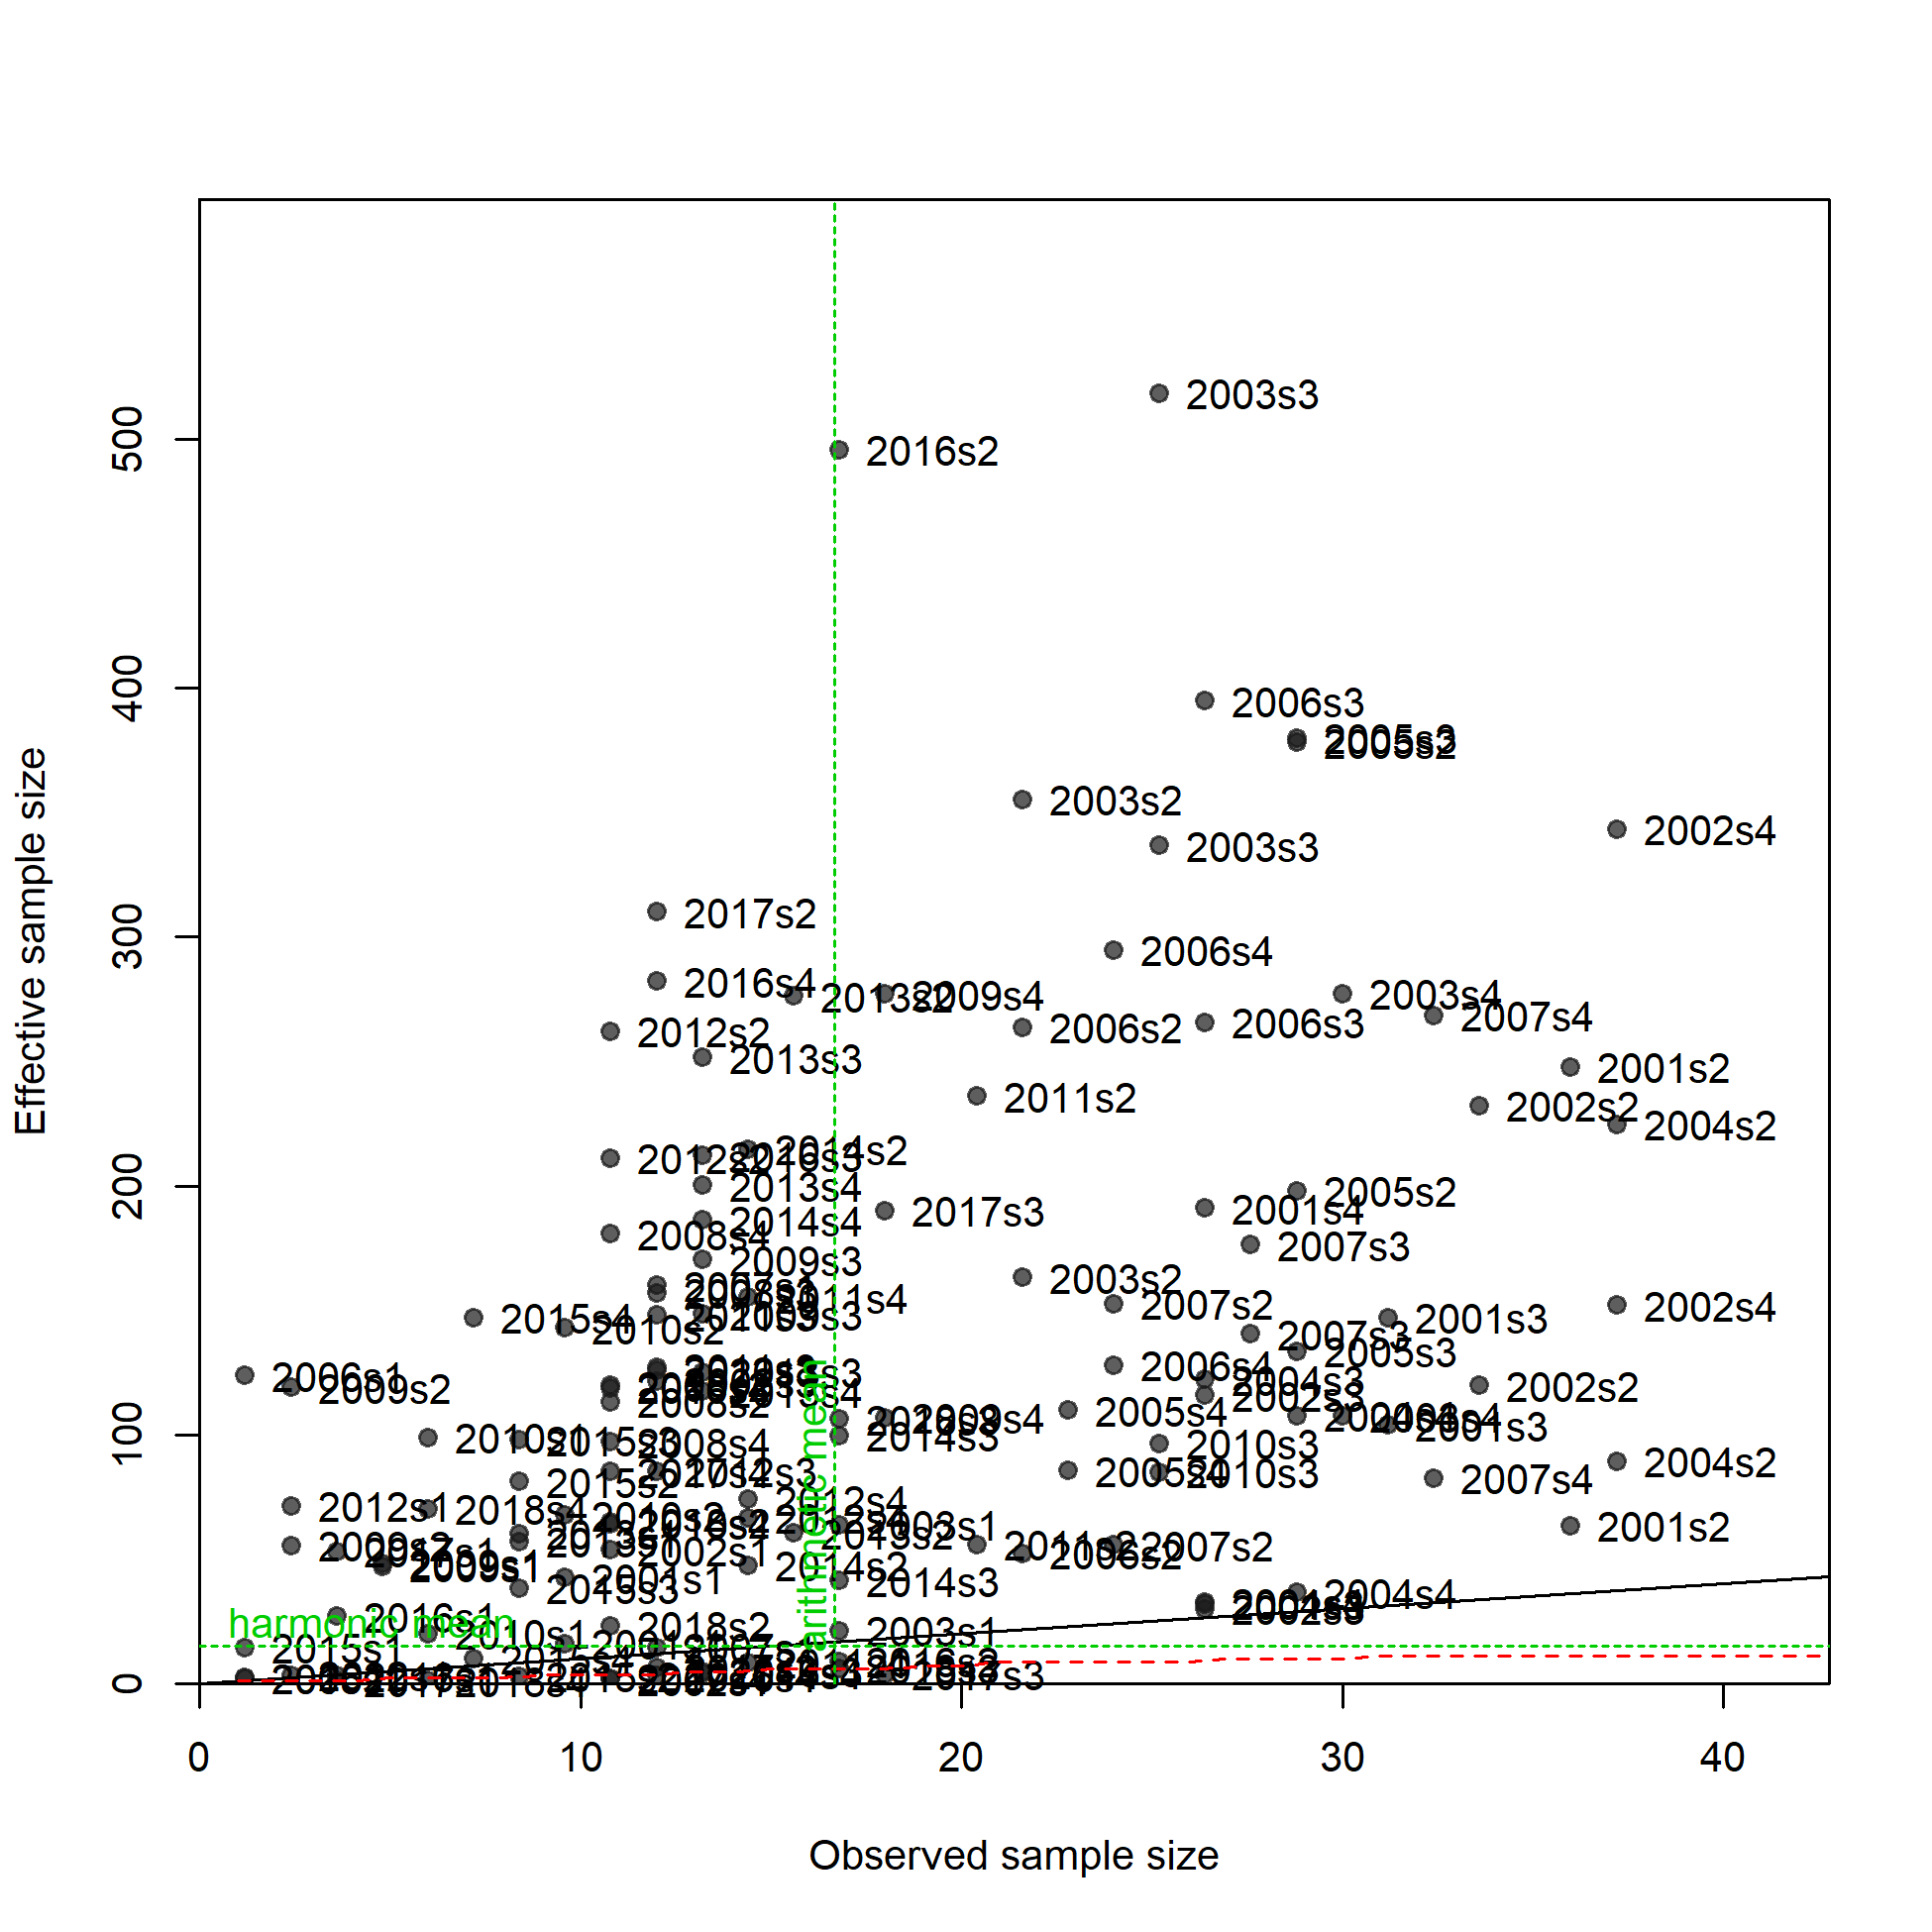
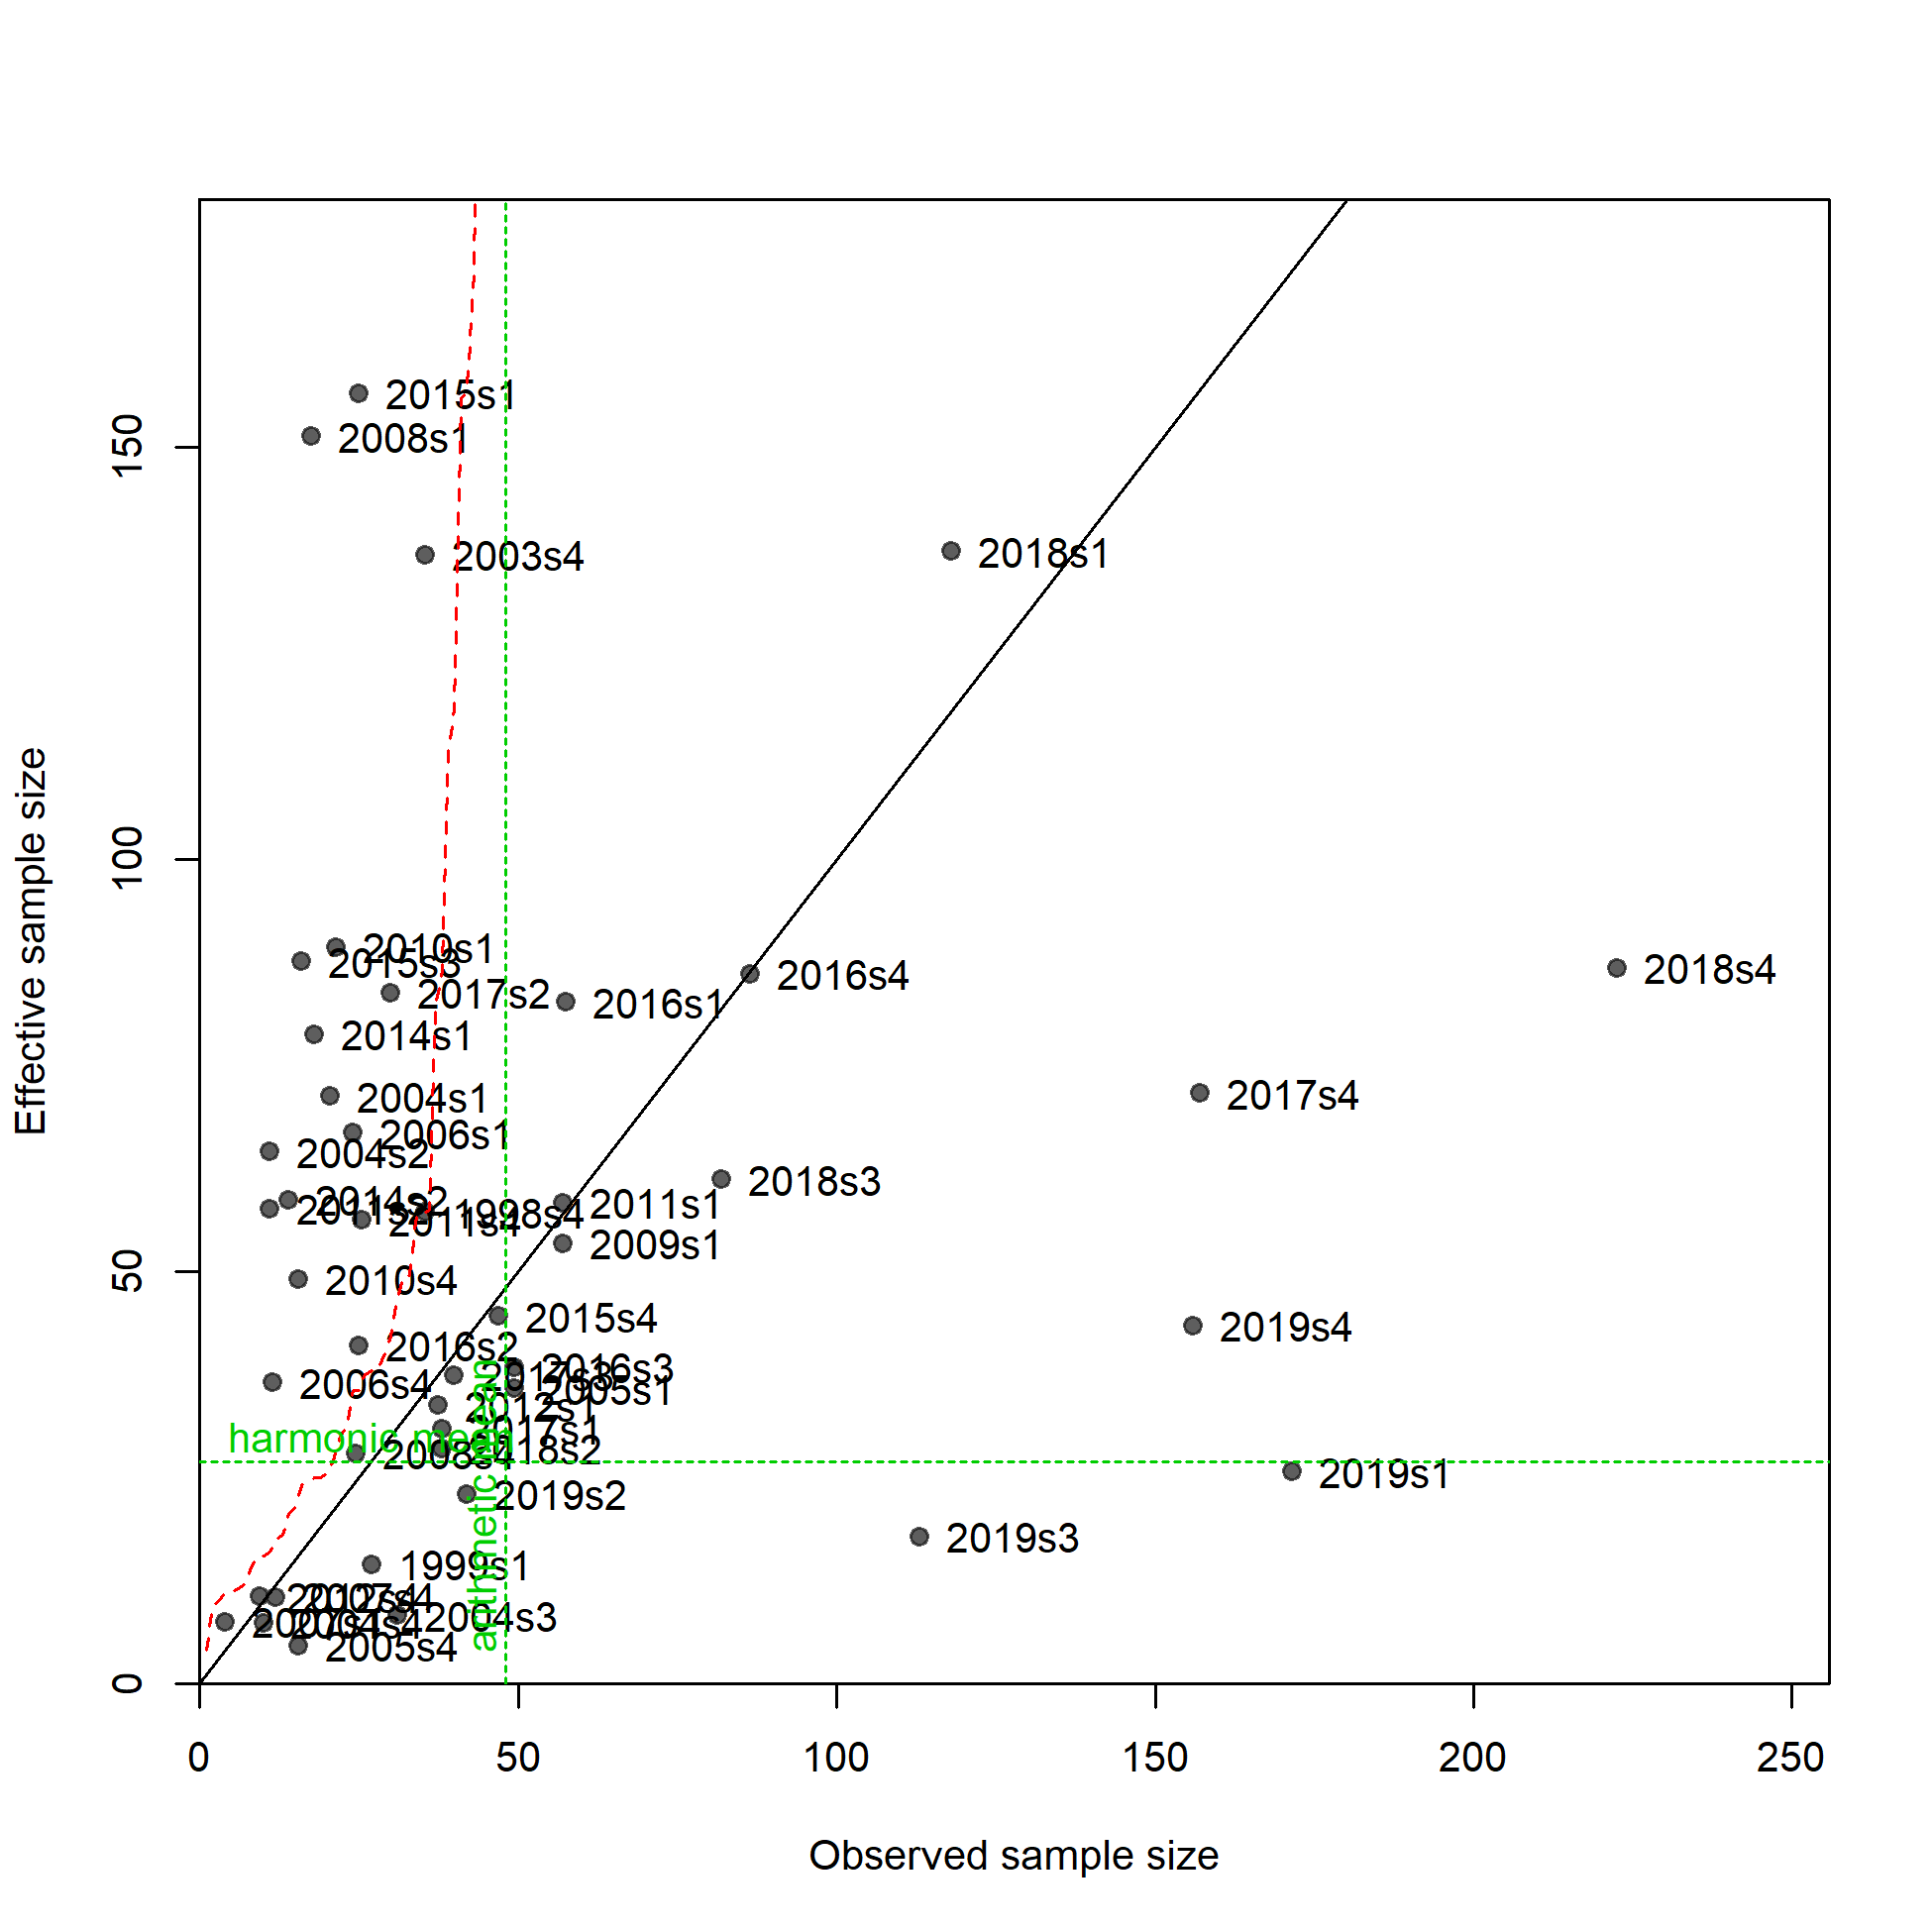
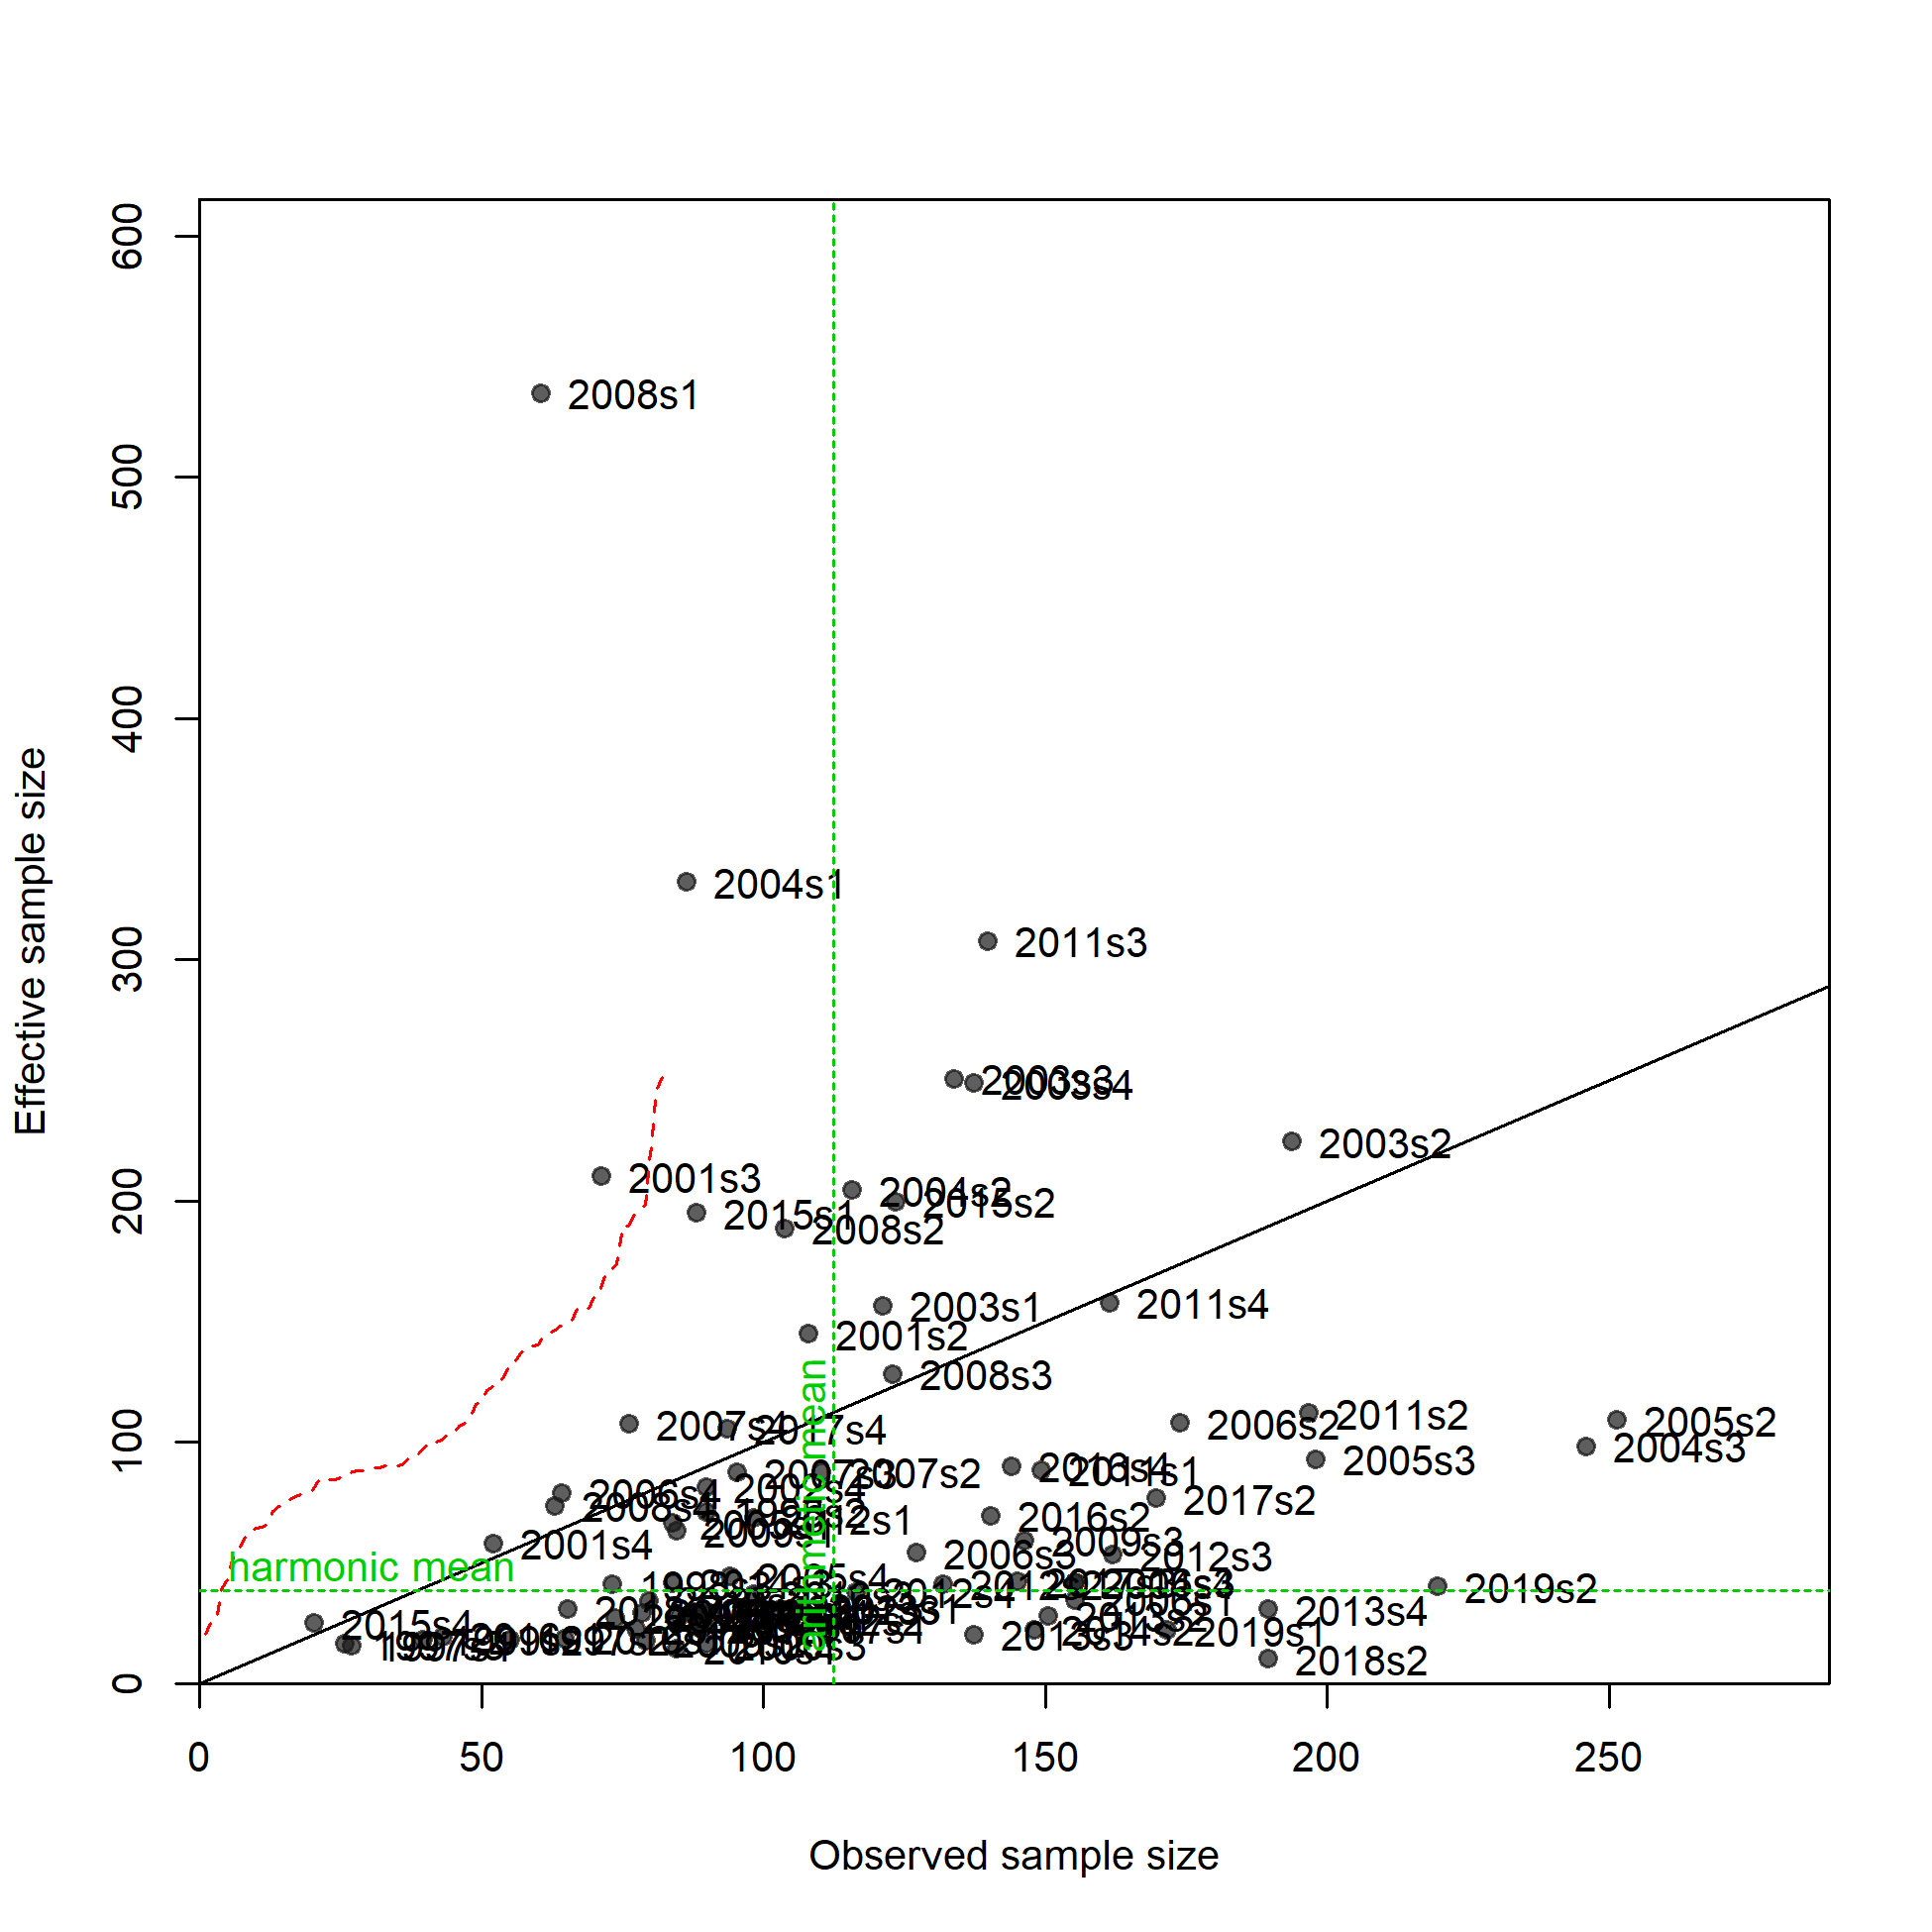
N-EffN comparison, Length comps, whole catch, F5_LL_Coast_A5
file: comp_lenfit_sampsize_flt5mkt0.png
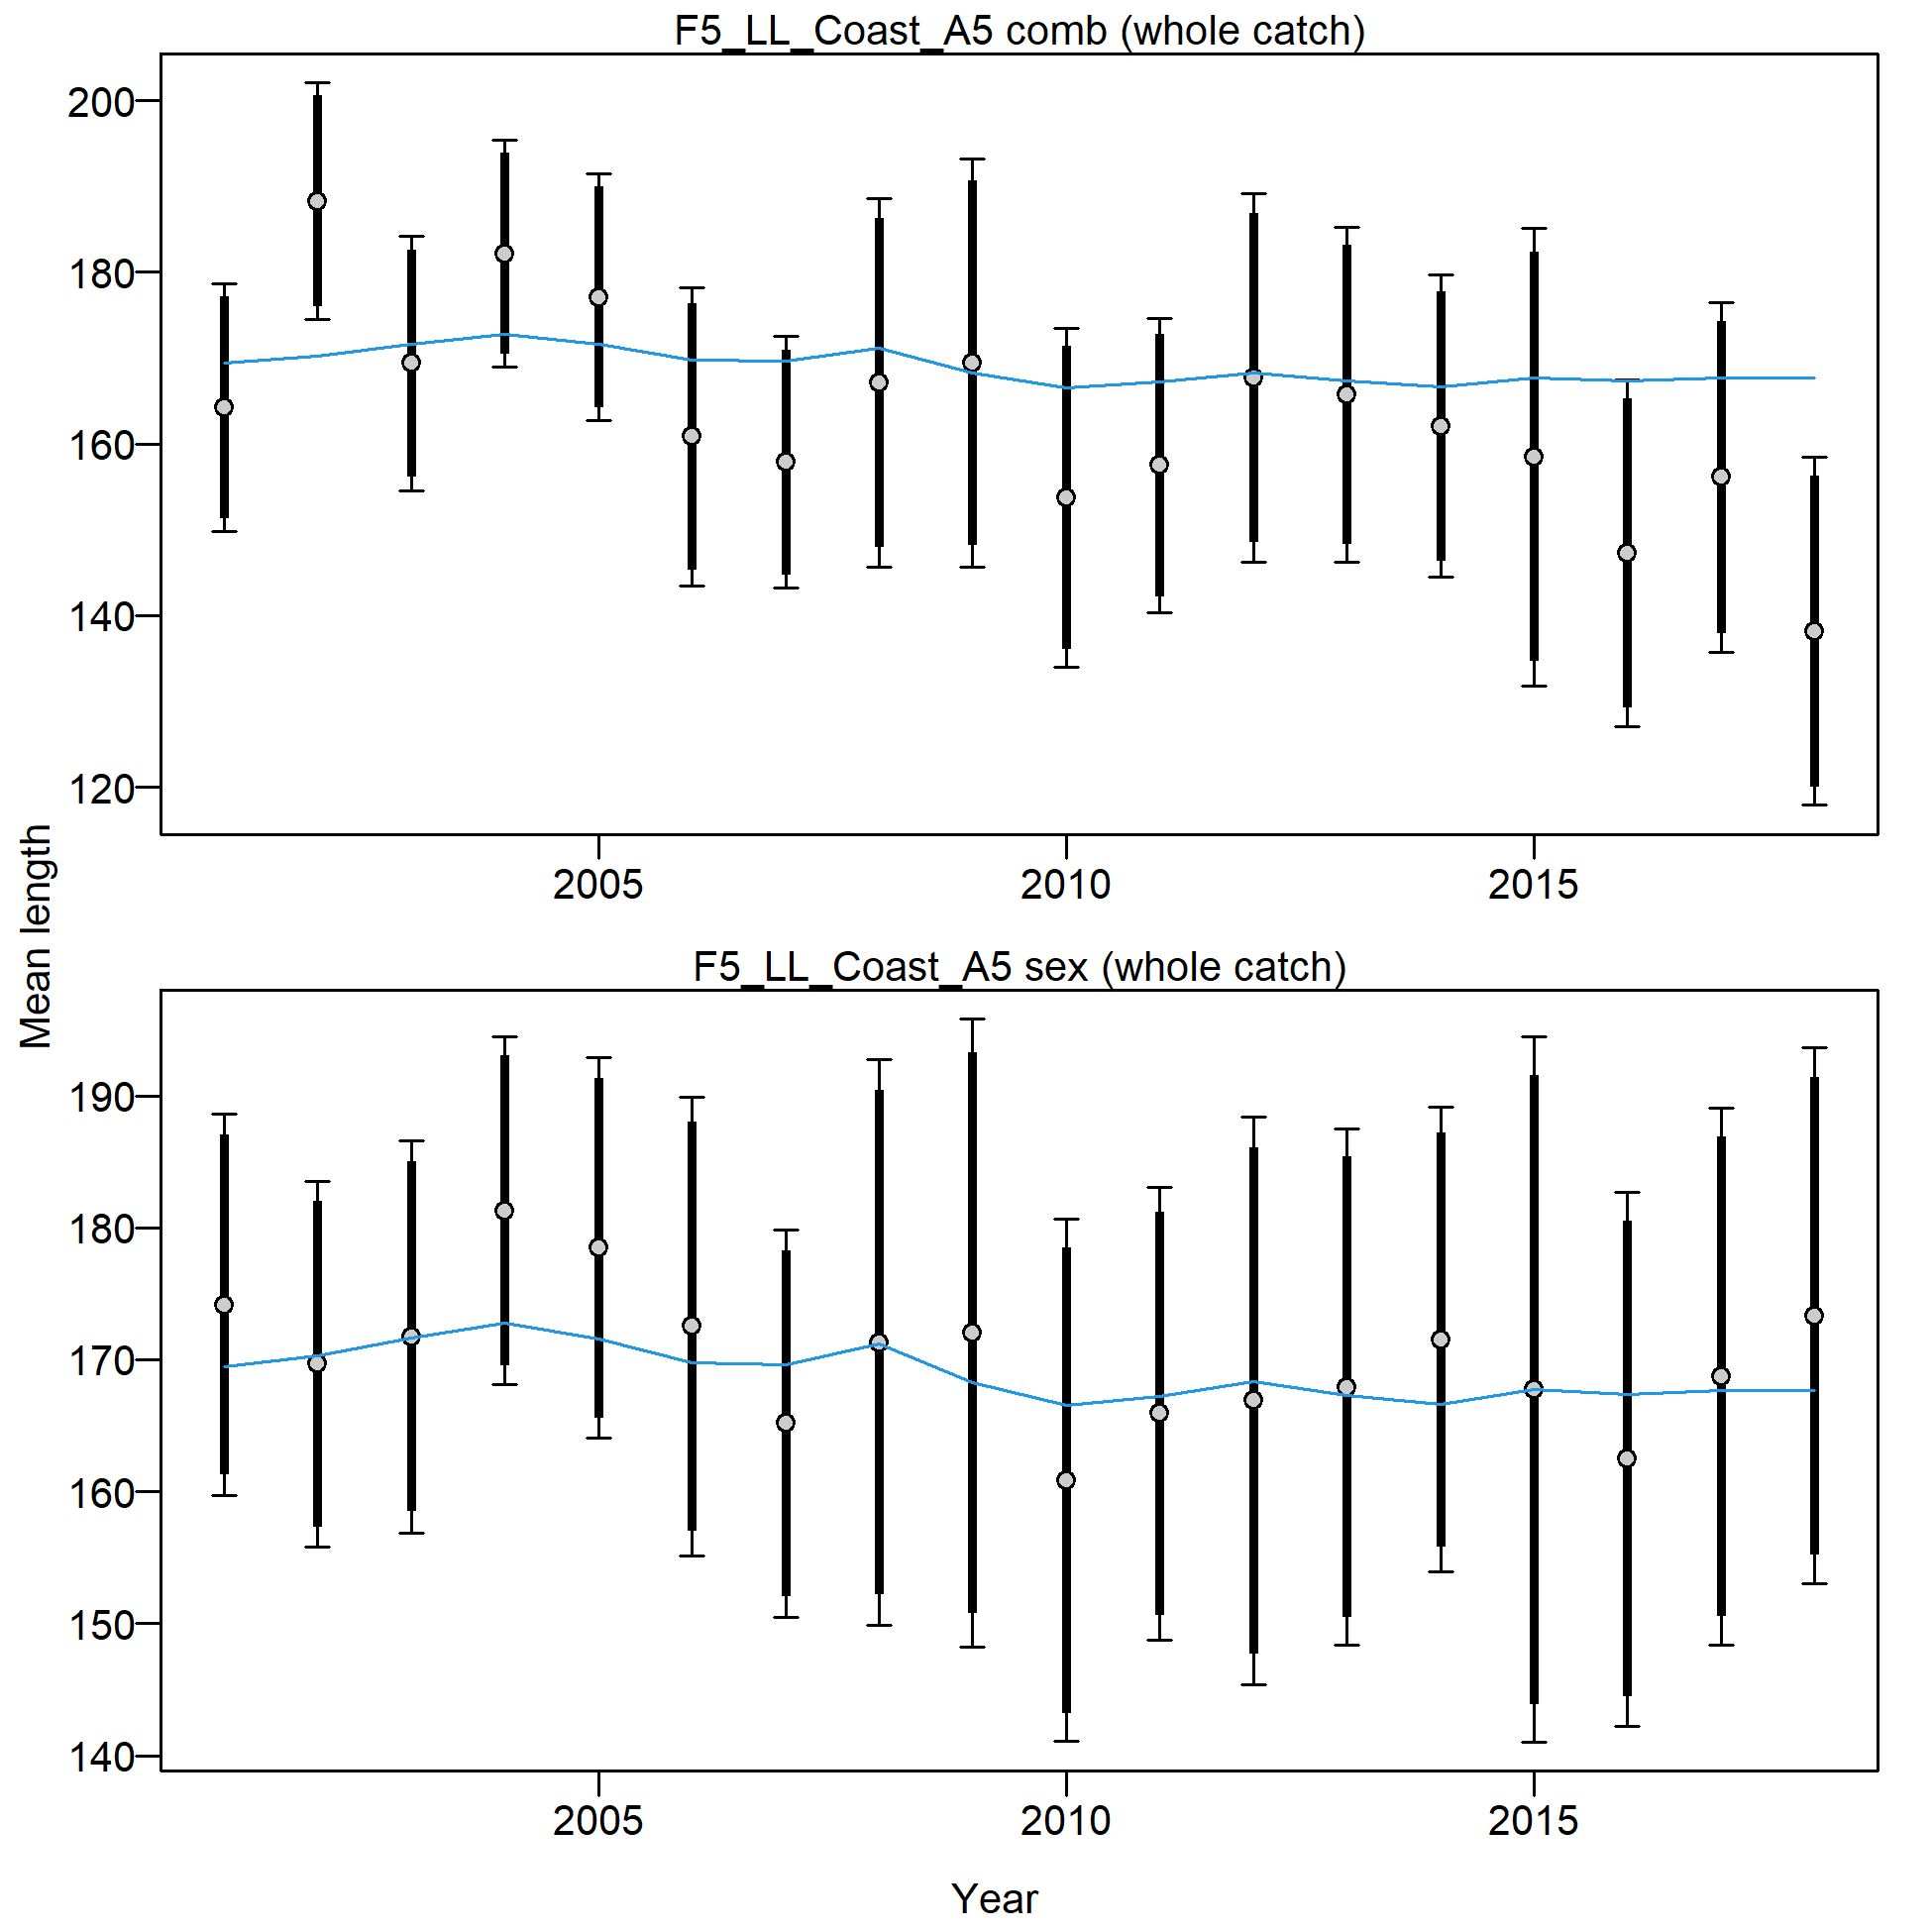
Mean length for F5_LL_Coast_A5 with 95% confidence intervals based on current samples sizes.
Francis data weighting method TA1.8: thinner intervals (with capped ends) show result of further adjusting sample sizes based on suggested multiplier (with 95% interval) for len data from F5_LL_Coast_A5:
0.7957 (0.458-1.7958)
For more info, see
Francis, R.I.C.C. (2011). Data weighting in statistical fisheries stock assessment models. Can. J. Fish. Aquat. Sci. 68: 1124-1138. https://doi.org/10.1139/f2011-025
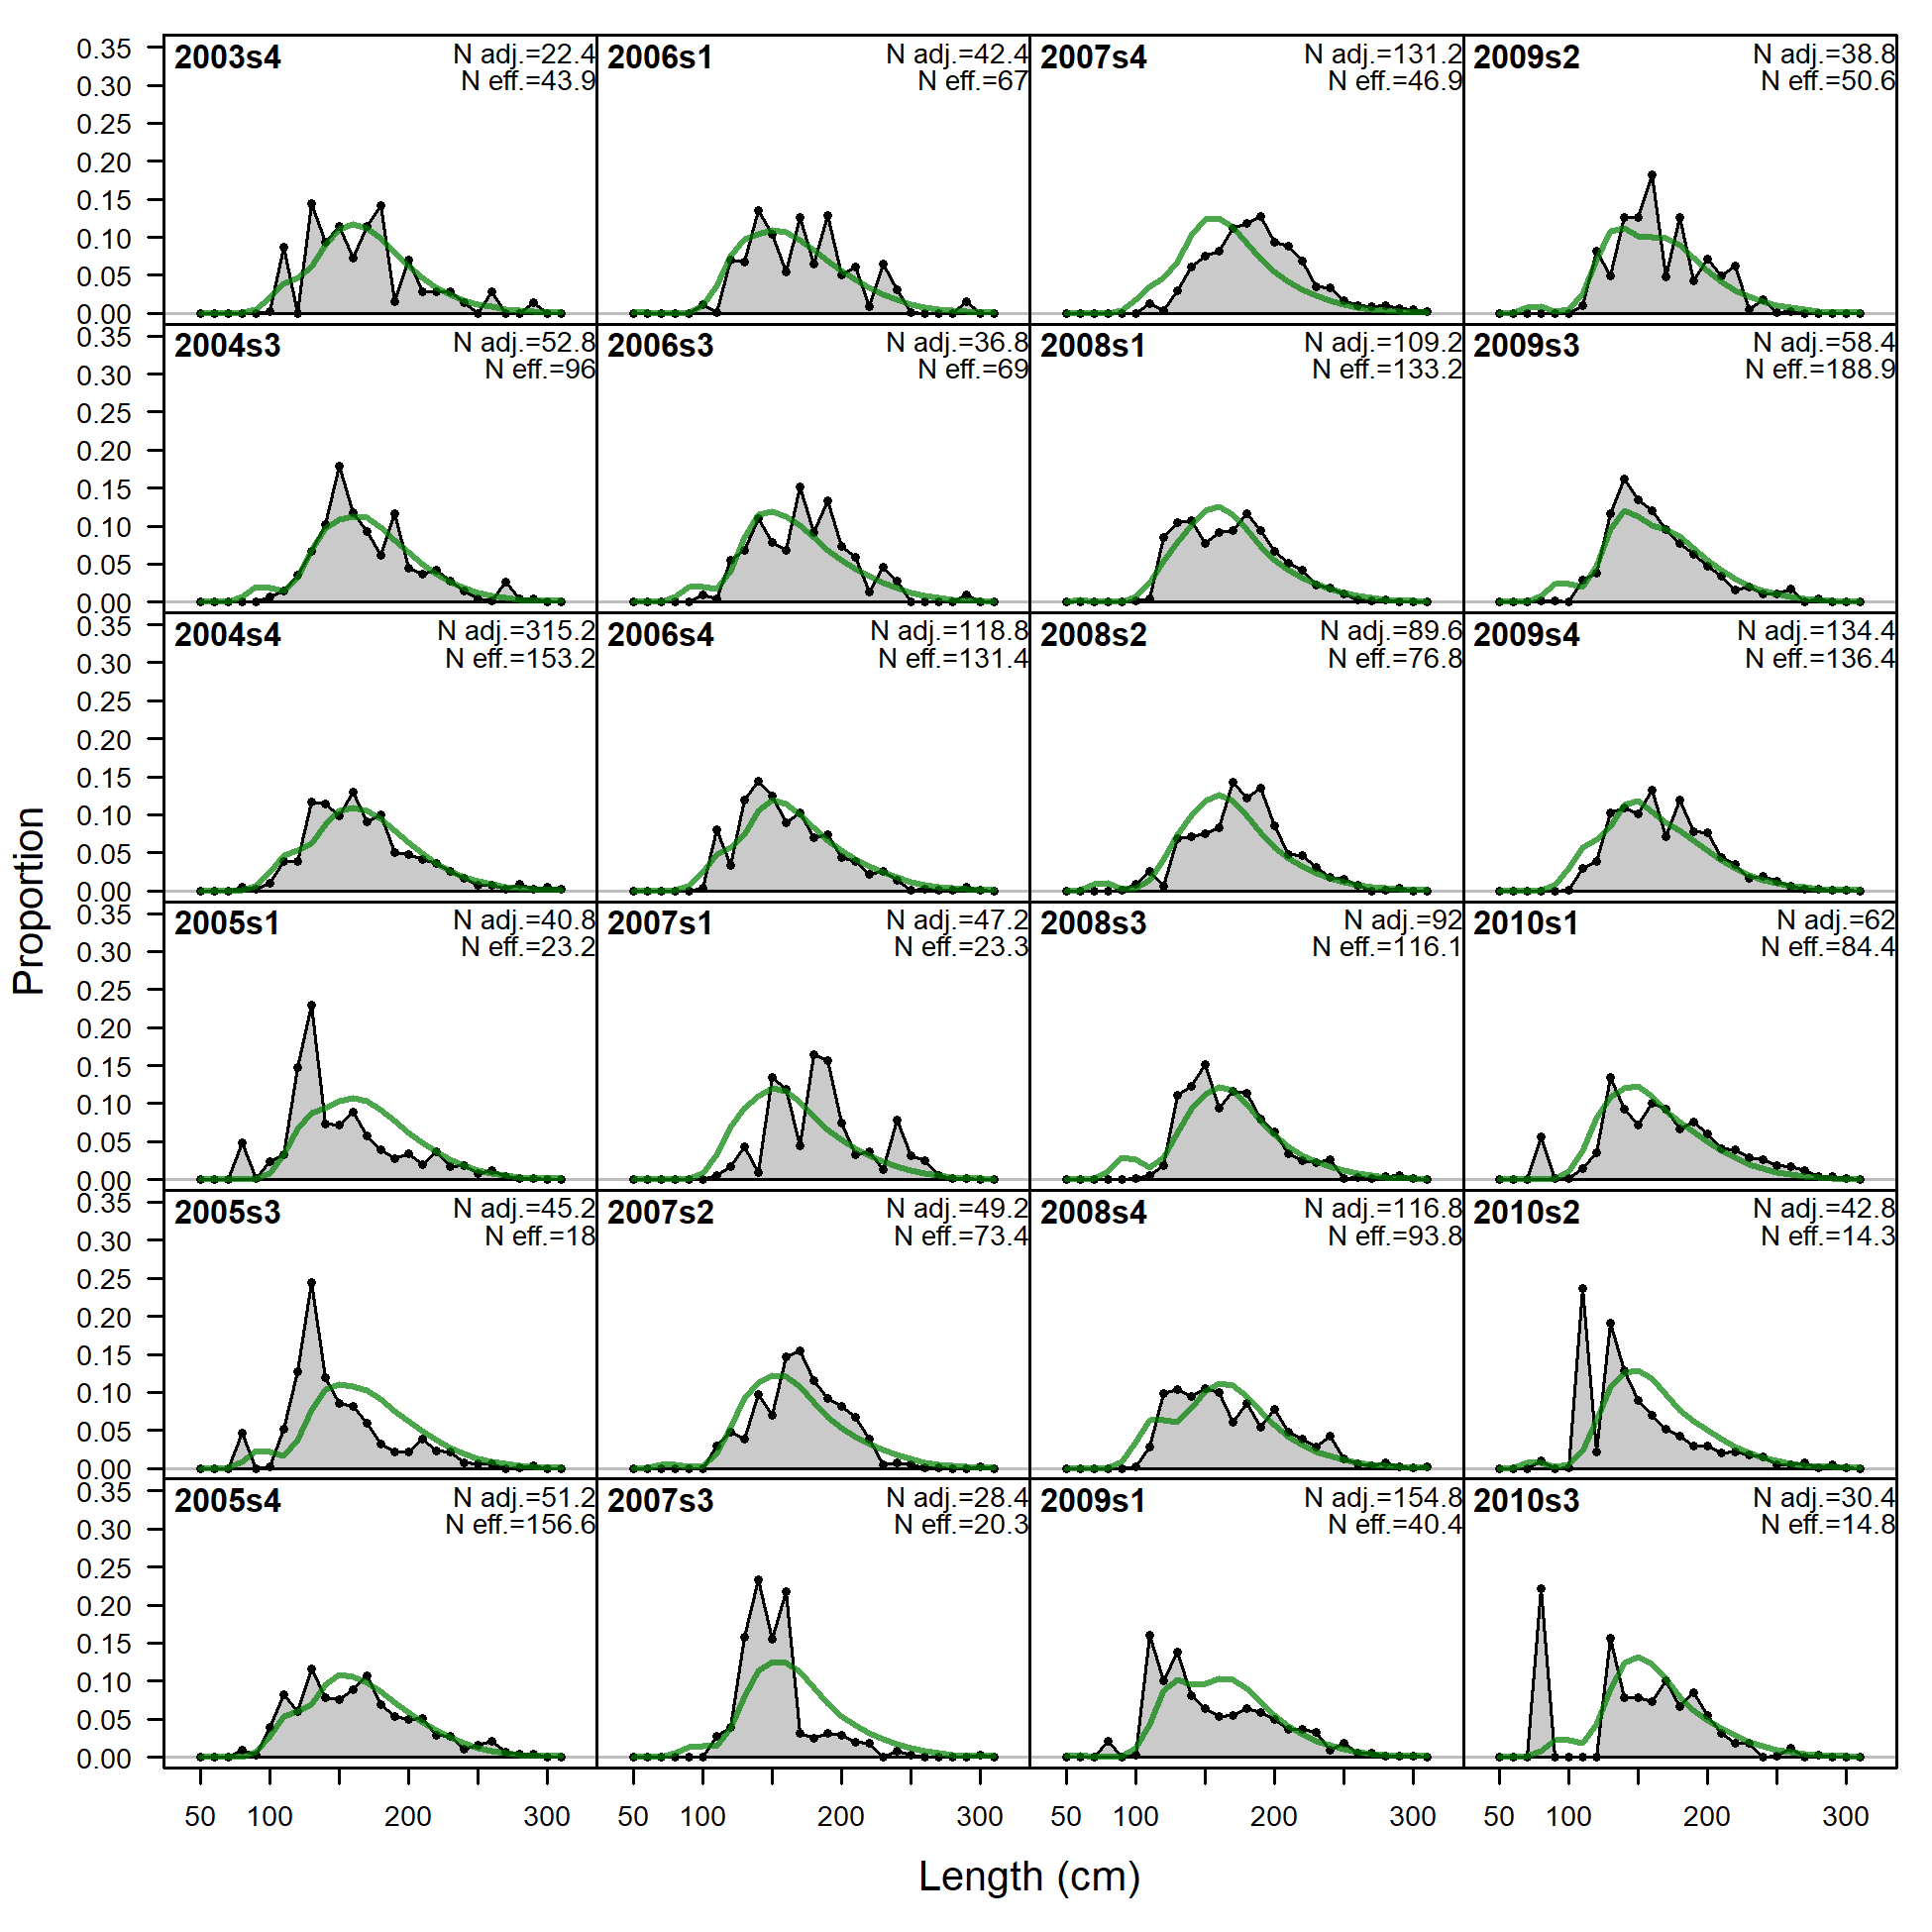
Length comps, whole catch, F6_ESP_A2 (plot 1 of 2).
'N adj.' is the input sample size after data-weighting adjustment. N eff. is the calculated effective sample size used in the McAllister-Ianelli tuning method.
file: comp_lenfit_flt6mkt0_page1.png
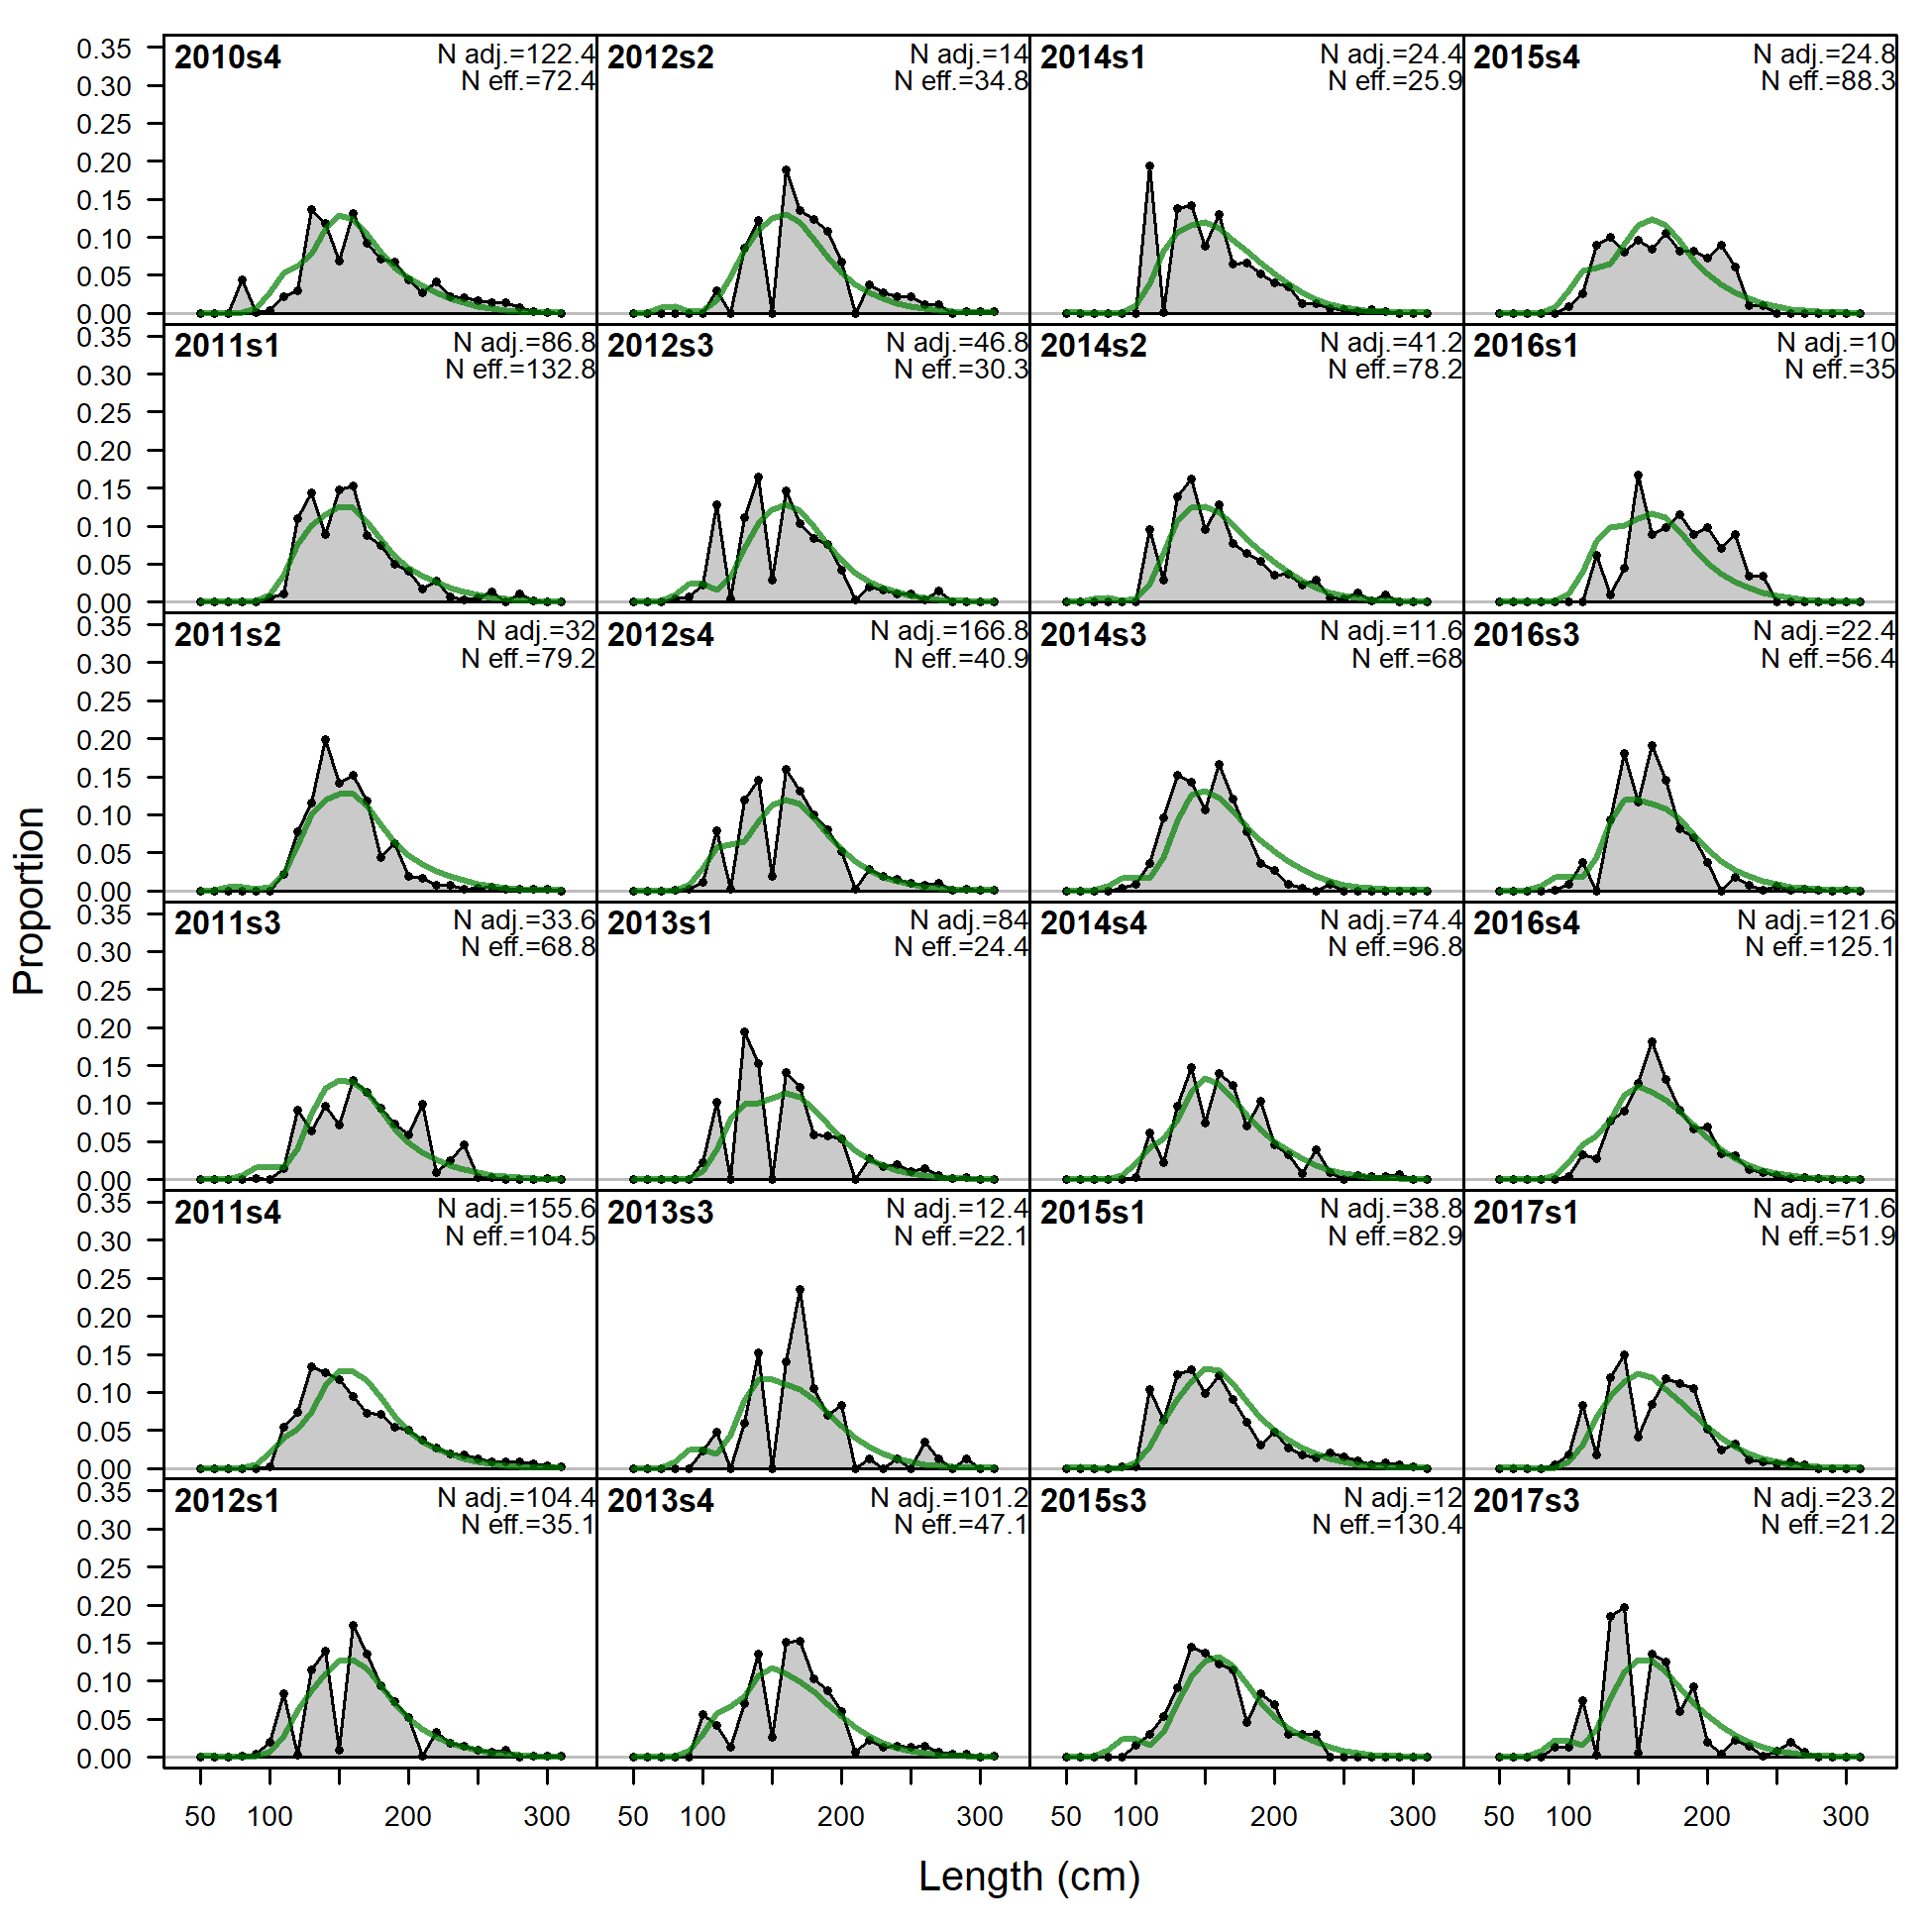
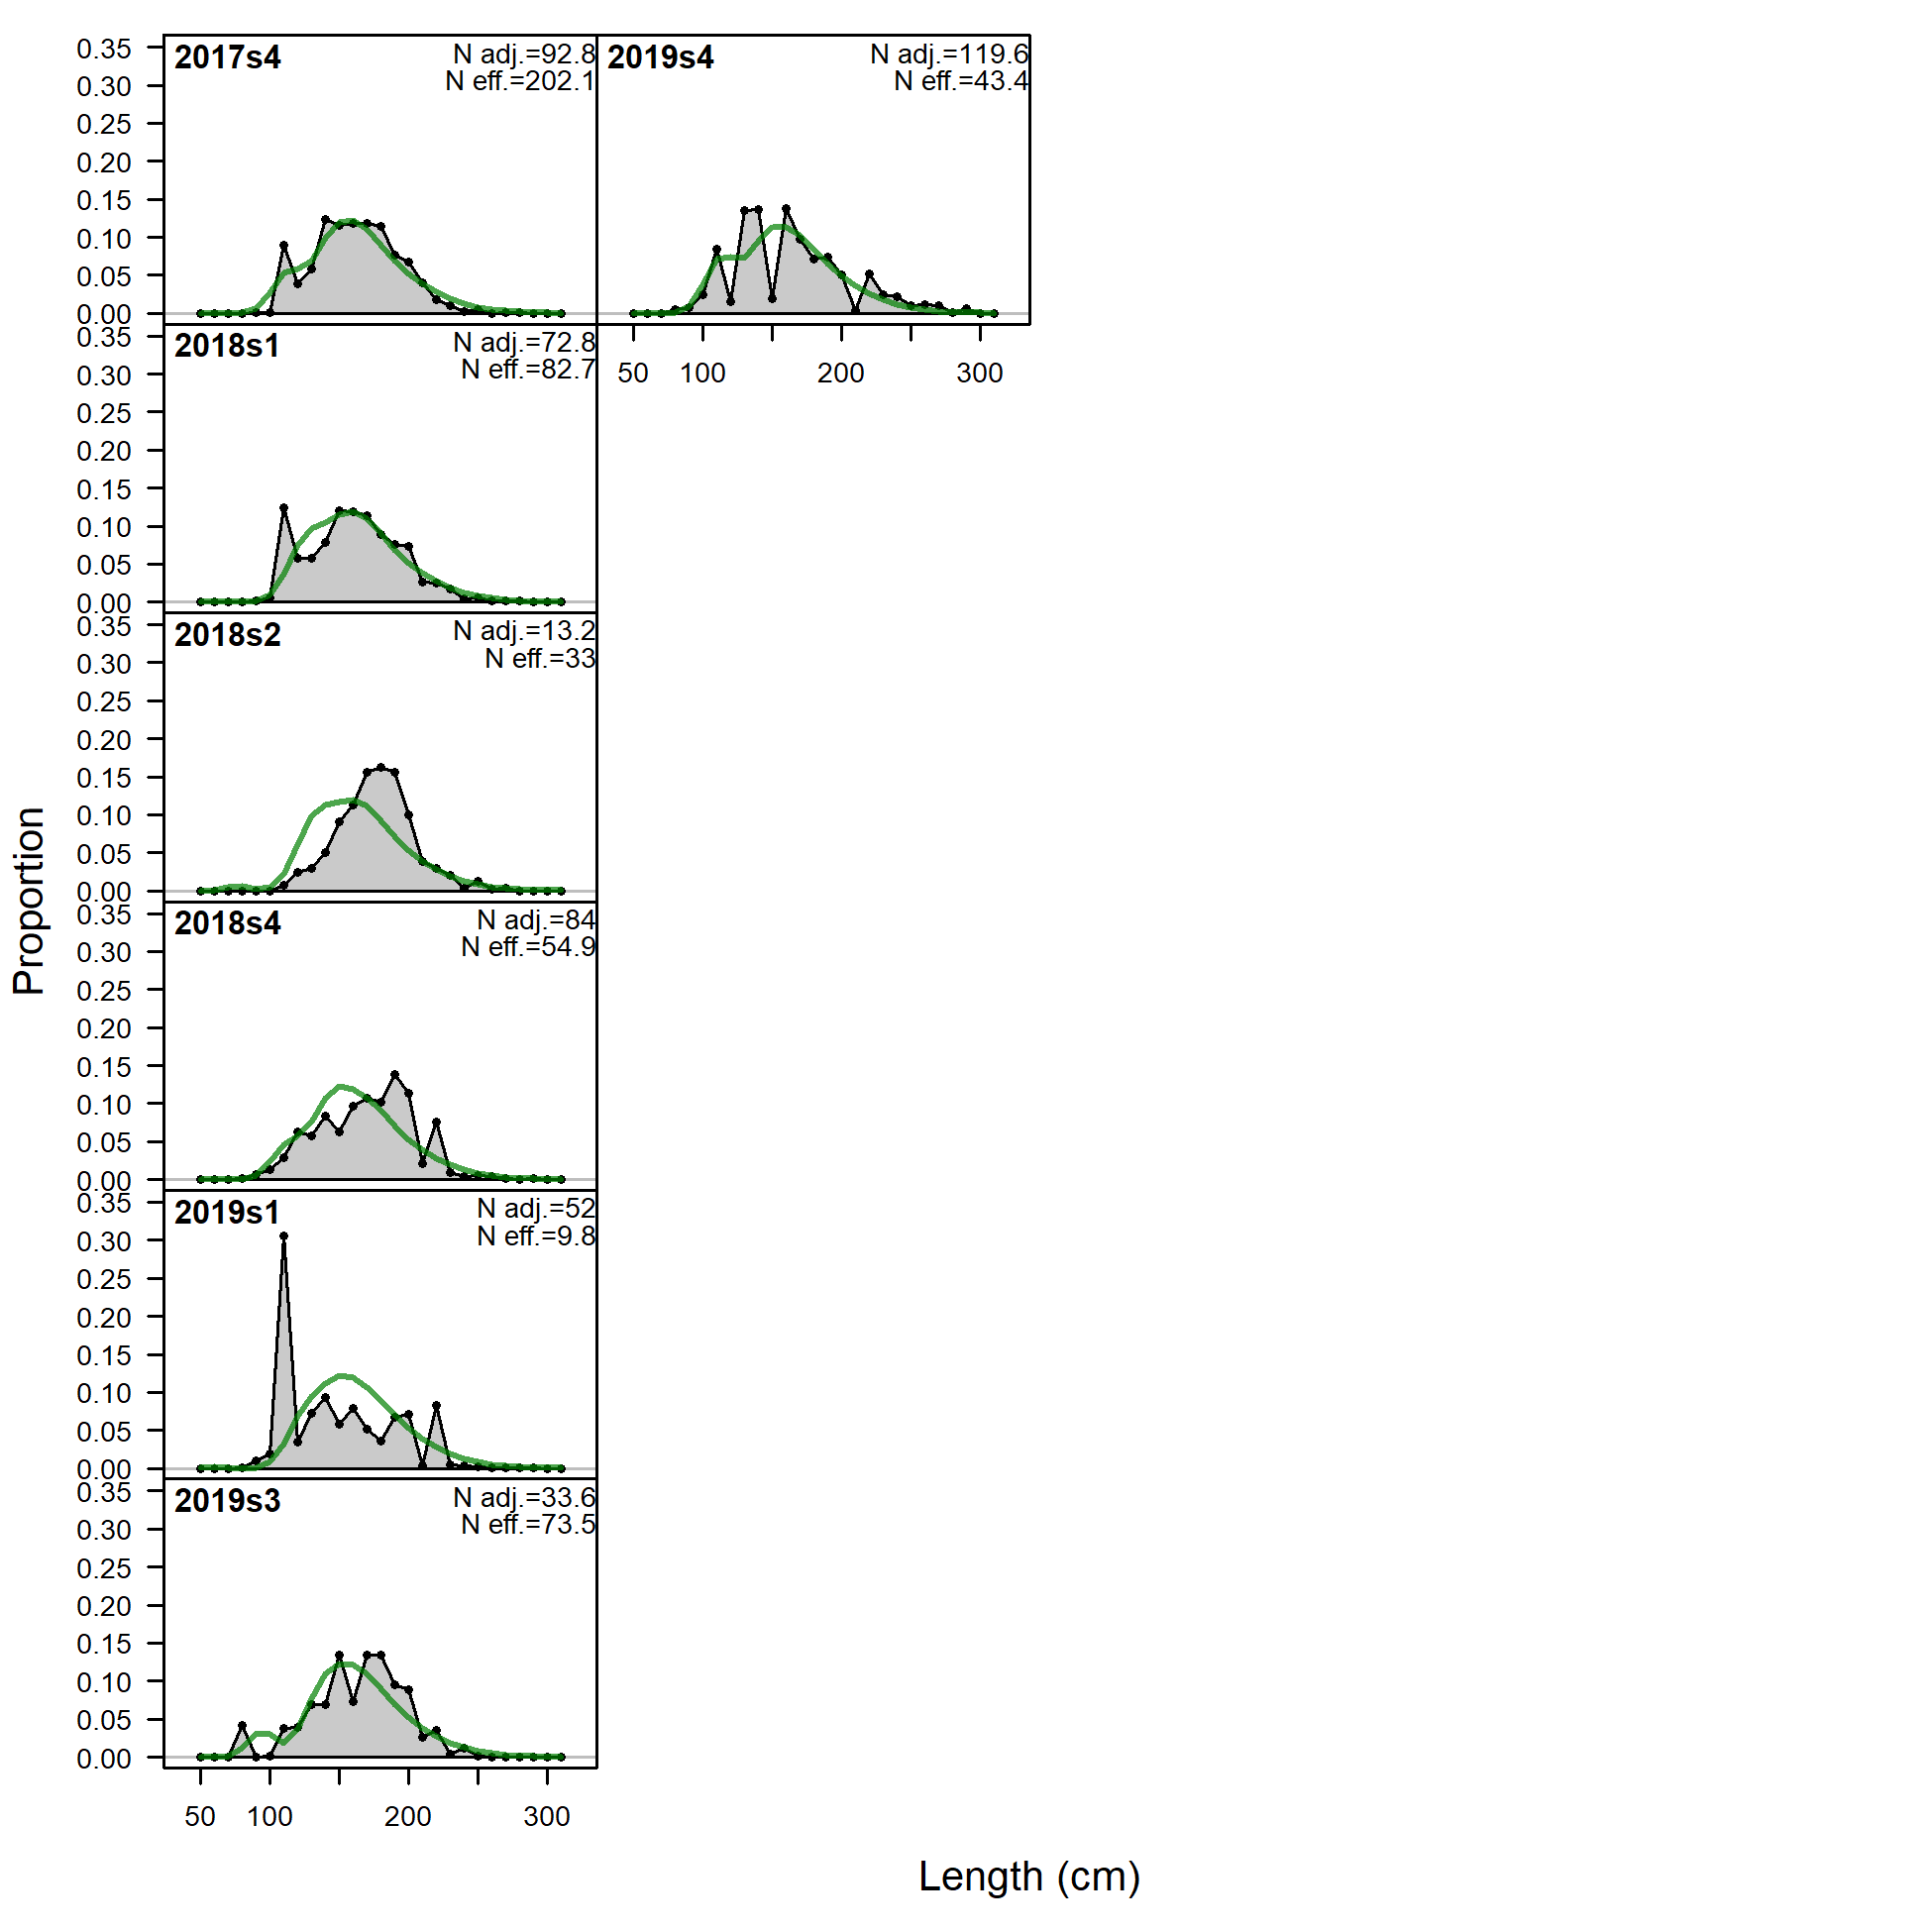
Length comps, whole catch, F6_ESP_A2 (plot 1 of 2).
'N adj.' is the input sample size after data-weighting adjustment. N eff. is the calculated effective sample size used in the McAllister-Ianelli tuning method. (plot 2 of 2)
file: comp_lenfit_flt6mkt0_page2.png
Pearson residuals, whole catch, F6_ESP_A2 (max=34.75) (plot 2 of 2)
Closed bubbles are positive residuals (observed > expected) and open bubbles are negative residuals (observed < expected).
file: comp_lenfit_residsflt6mkt0_page2.png
N-EffN comparison, Length comps, whole catch, F6_ESP_A2
file: comp_lenfit_sampsize_flt6mkt0.png
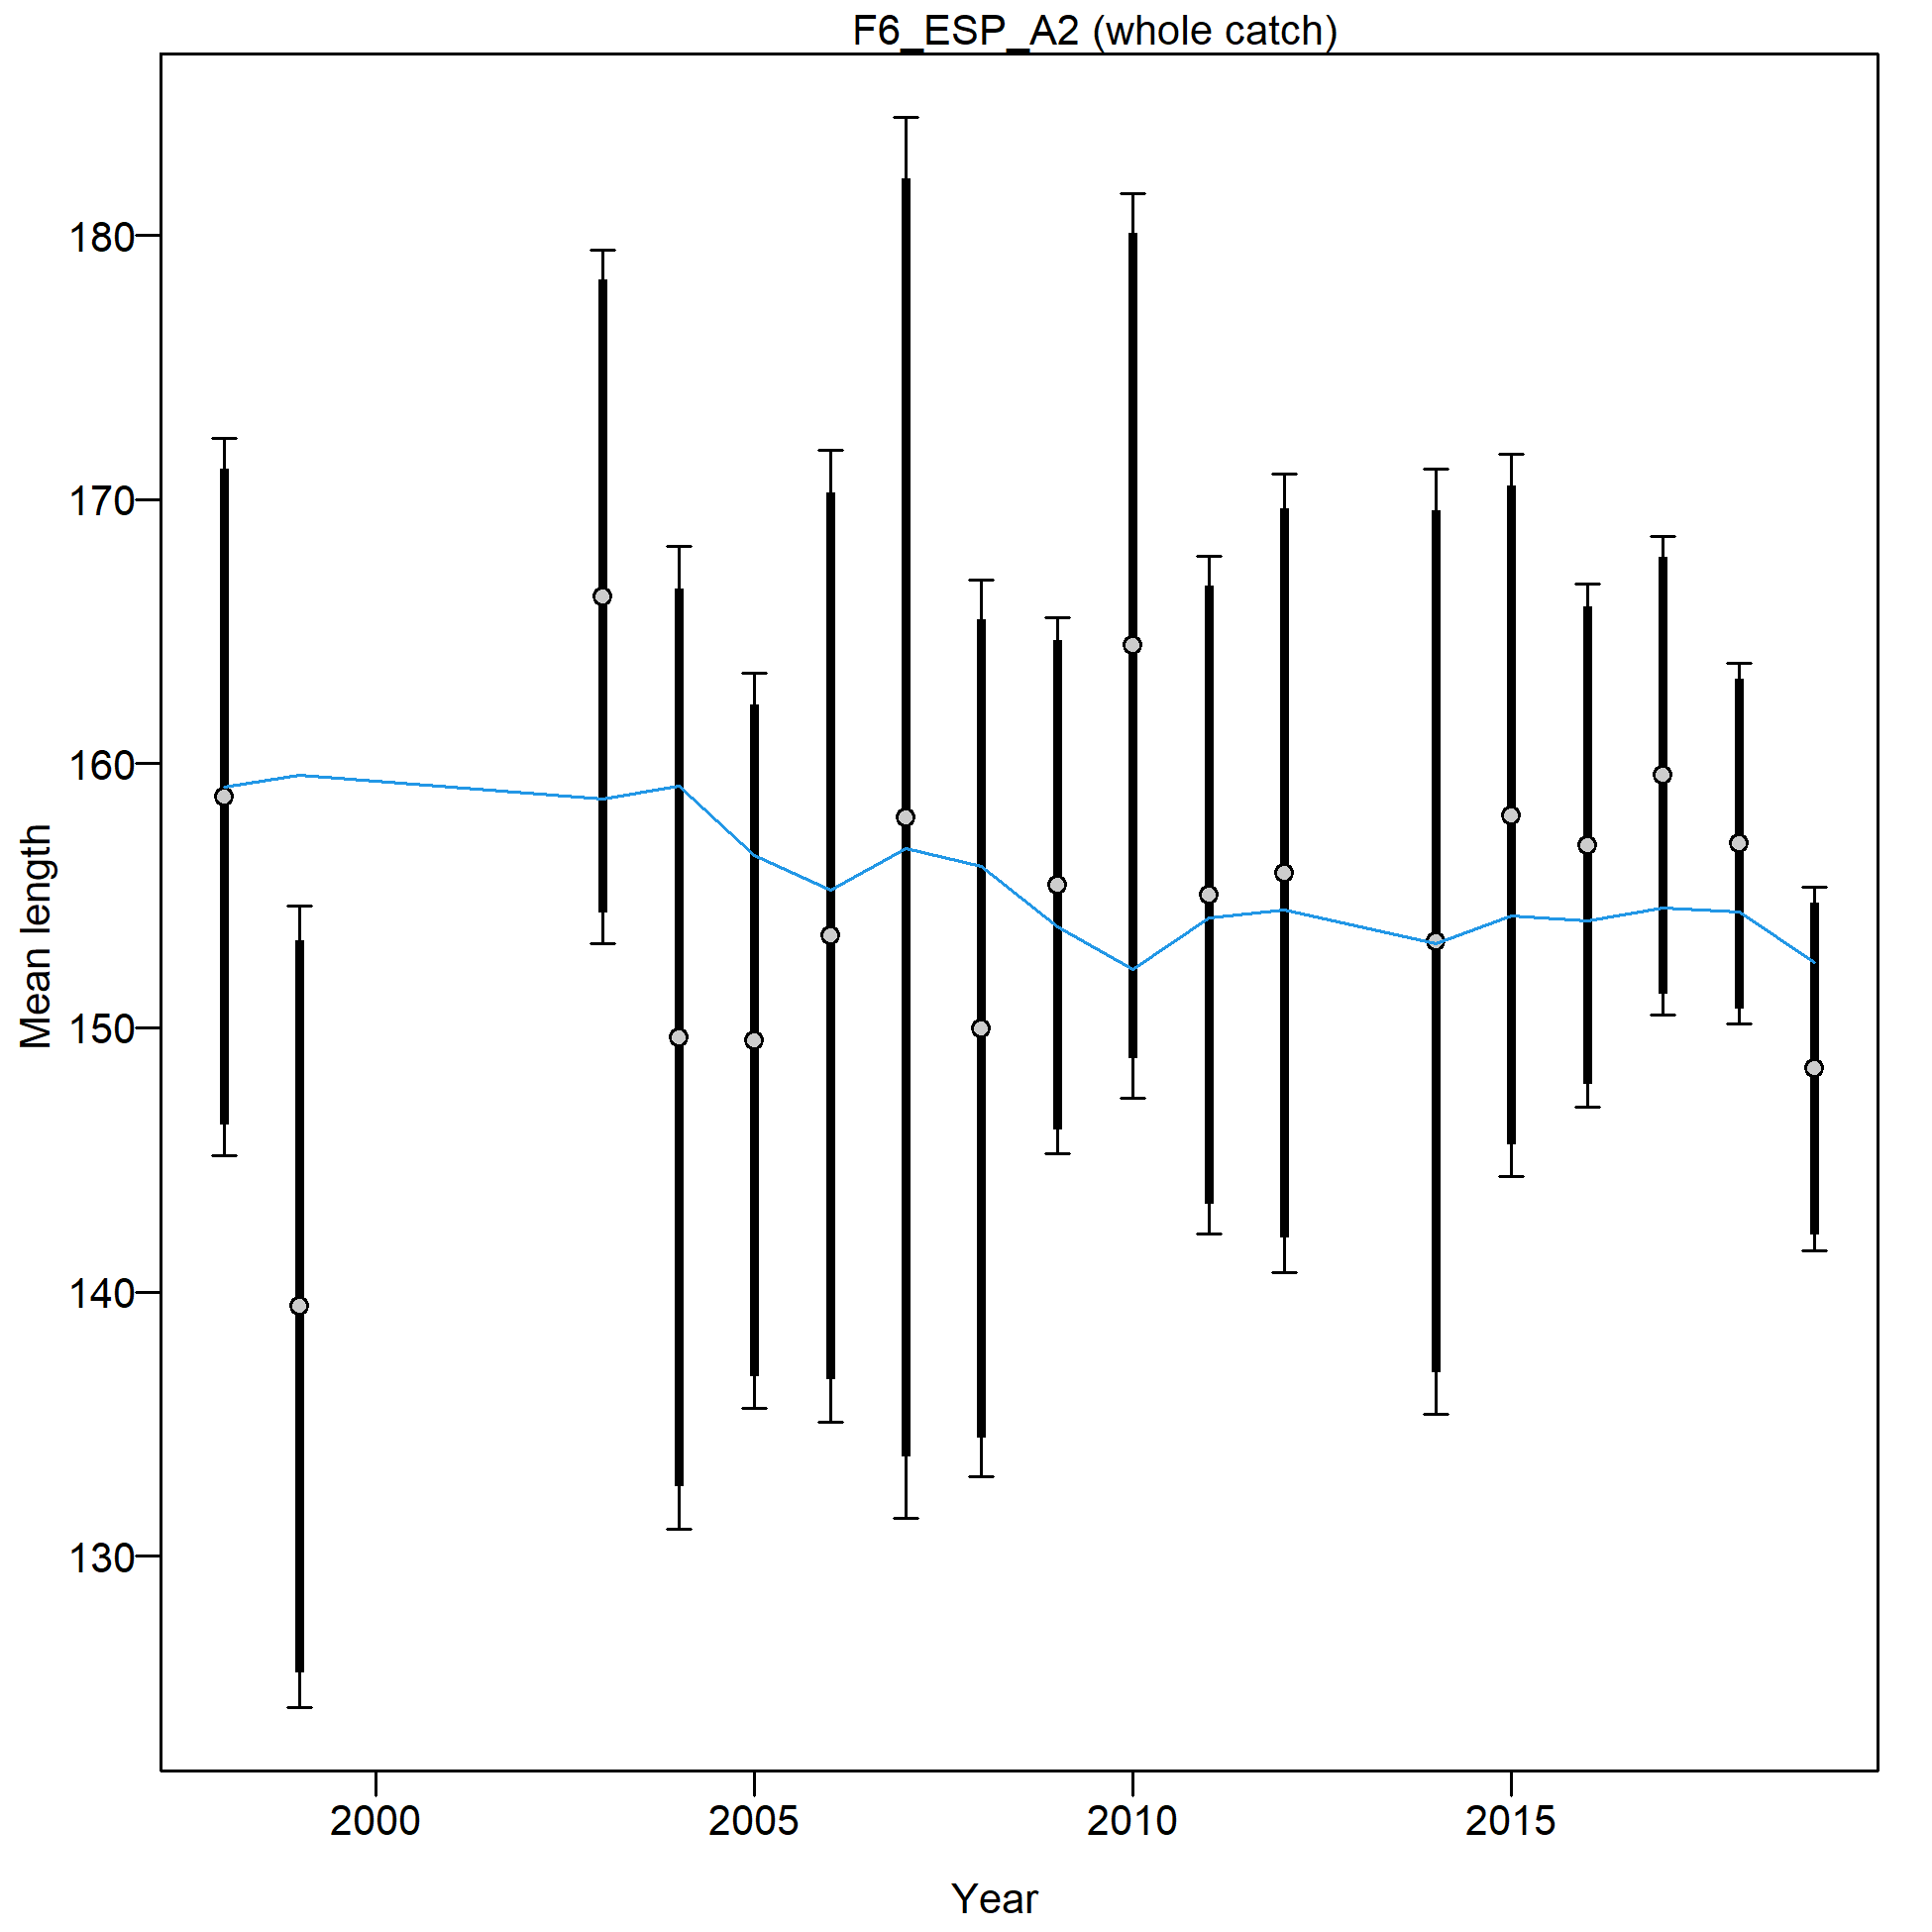
Mean length for F6_ESP_A2 with 95% confidence intervals based on current samples sizes.
Francis data weighting method TA1.8: thinner intervals (with capped ends) show result of further adjusting sample sizes based on suggested multiplier (with 95% interval) for len data from F6_ESP_A2:
0.8331 (0.4559-2.3516)
For more info, see
Francis, R.I.C.C. (2011). Data weighting in statistical fisheries stock assessment models. Can. J. Fish. Aquat. Sci. 68: 1124-1138. https://doi.org/10.1139/f2011-025
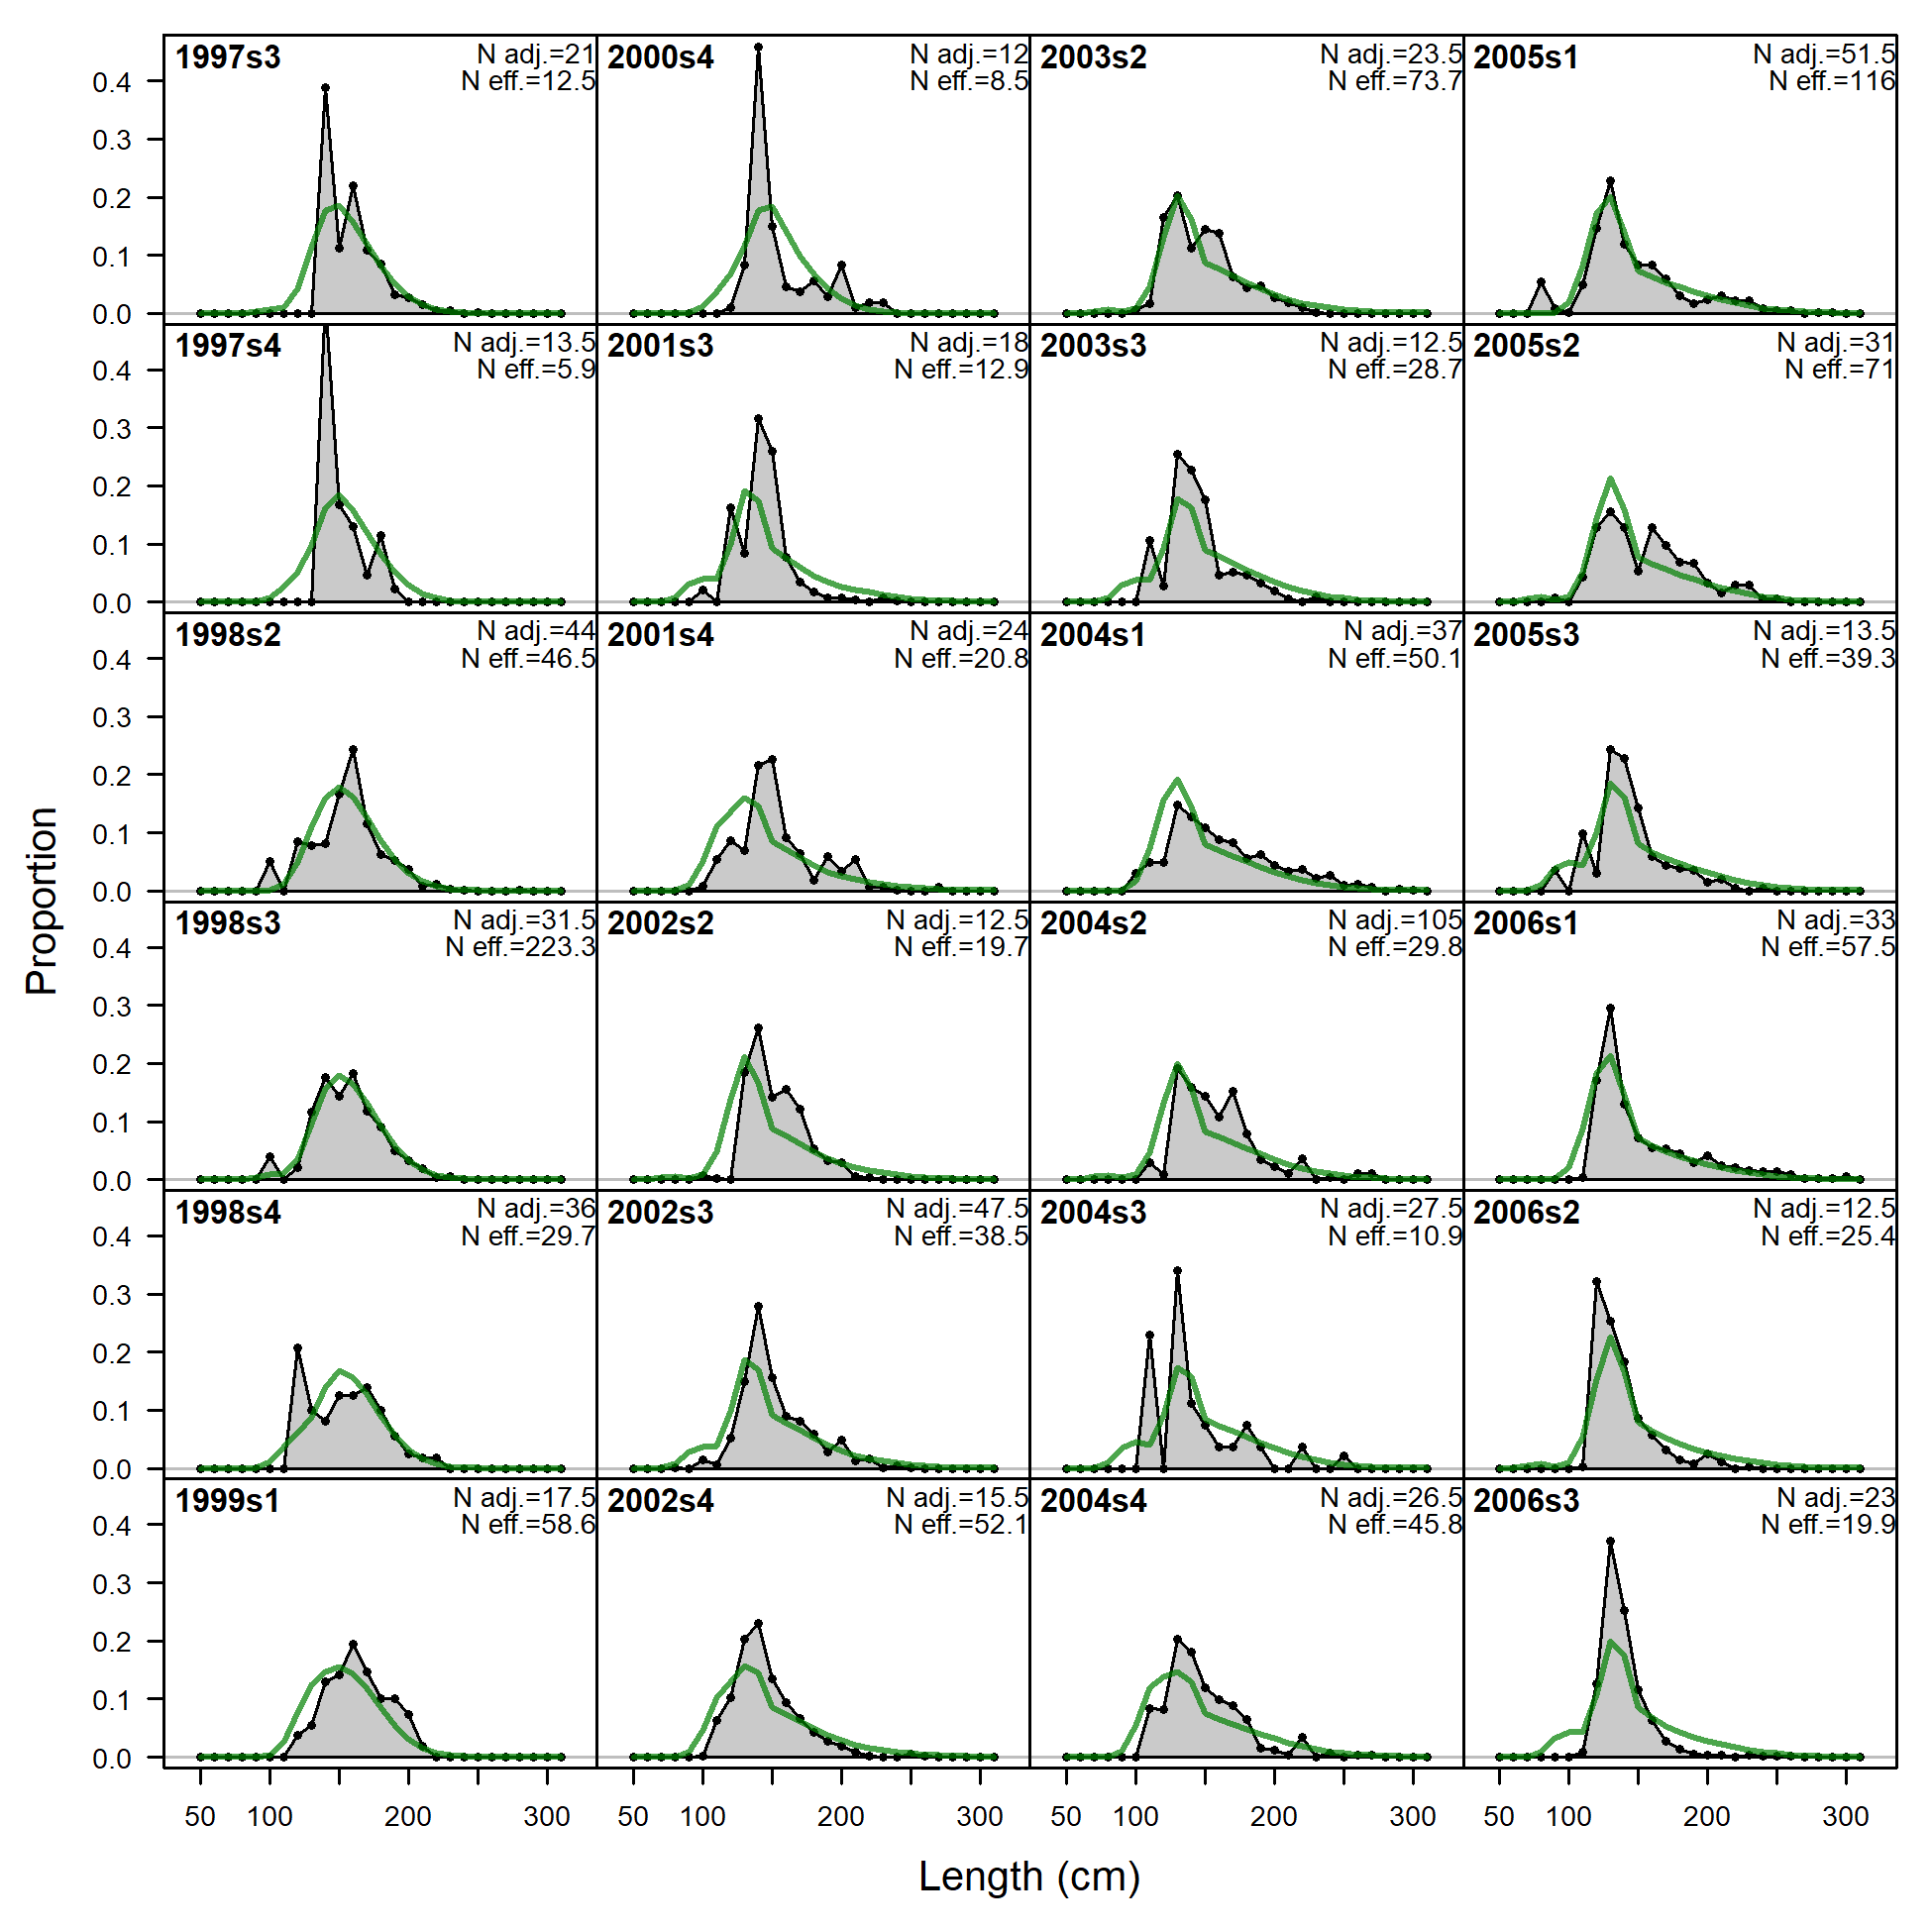
Length comps, whole catch, F7_ESP_A3 (plot 1 of 3).
'N adj.' is the input sample size after data-weighting adjustment. N eff. is the calculated effective sample size used in the McAllister-Ianelli tuning method.
file: comp_lenfit_flt7mkt0_page1.png
Length comps, whole catch, F7_ESP_A3 (plot 1 of 3).
'N adj.' is the input sample size after data-weighting adjustment. N eff. is the calculated effective sample size used in the McAllister-Ianelli tuning method. (plot 2 of 3)
file: comp_lenfit_flt7mkt0_page2.png
Length comps, whole catch, F7_ESP_A3 (plot 1 of 3).
'N adj.' is the input sample size after data-weighting adjustment. N eff. is the calculated effective sample size used in the McAllister-Ianelli tuning method. (plot 2 of 3) (plot 3 of 3)
file: comp_lenfit_flt7mkt0_page3.png
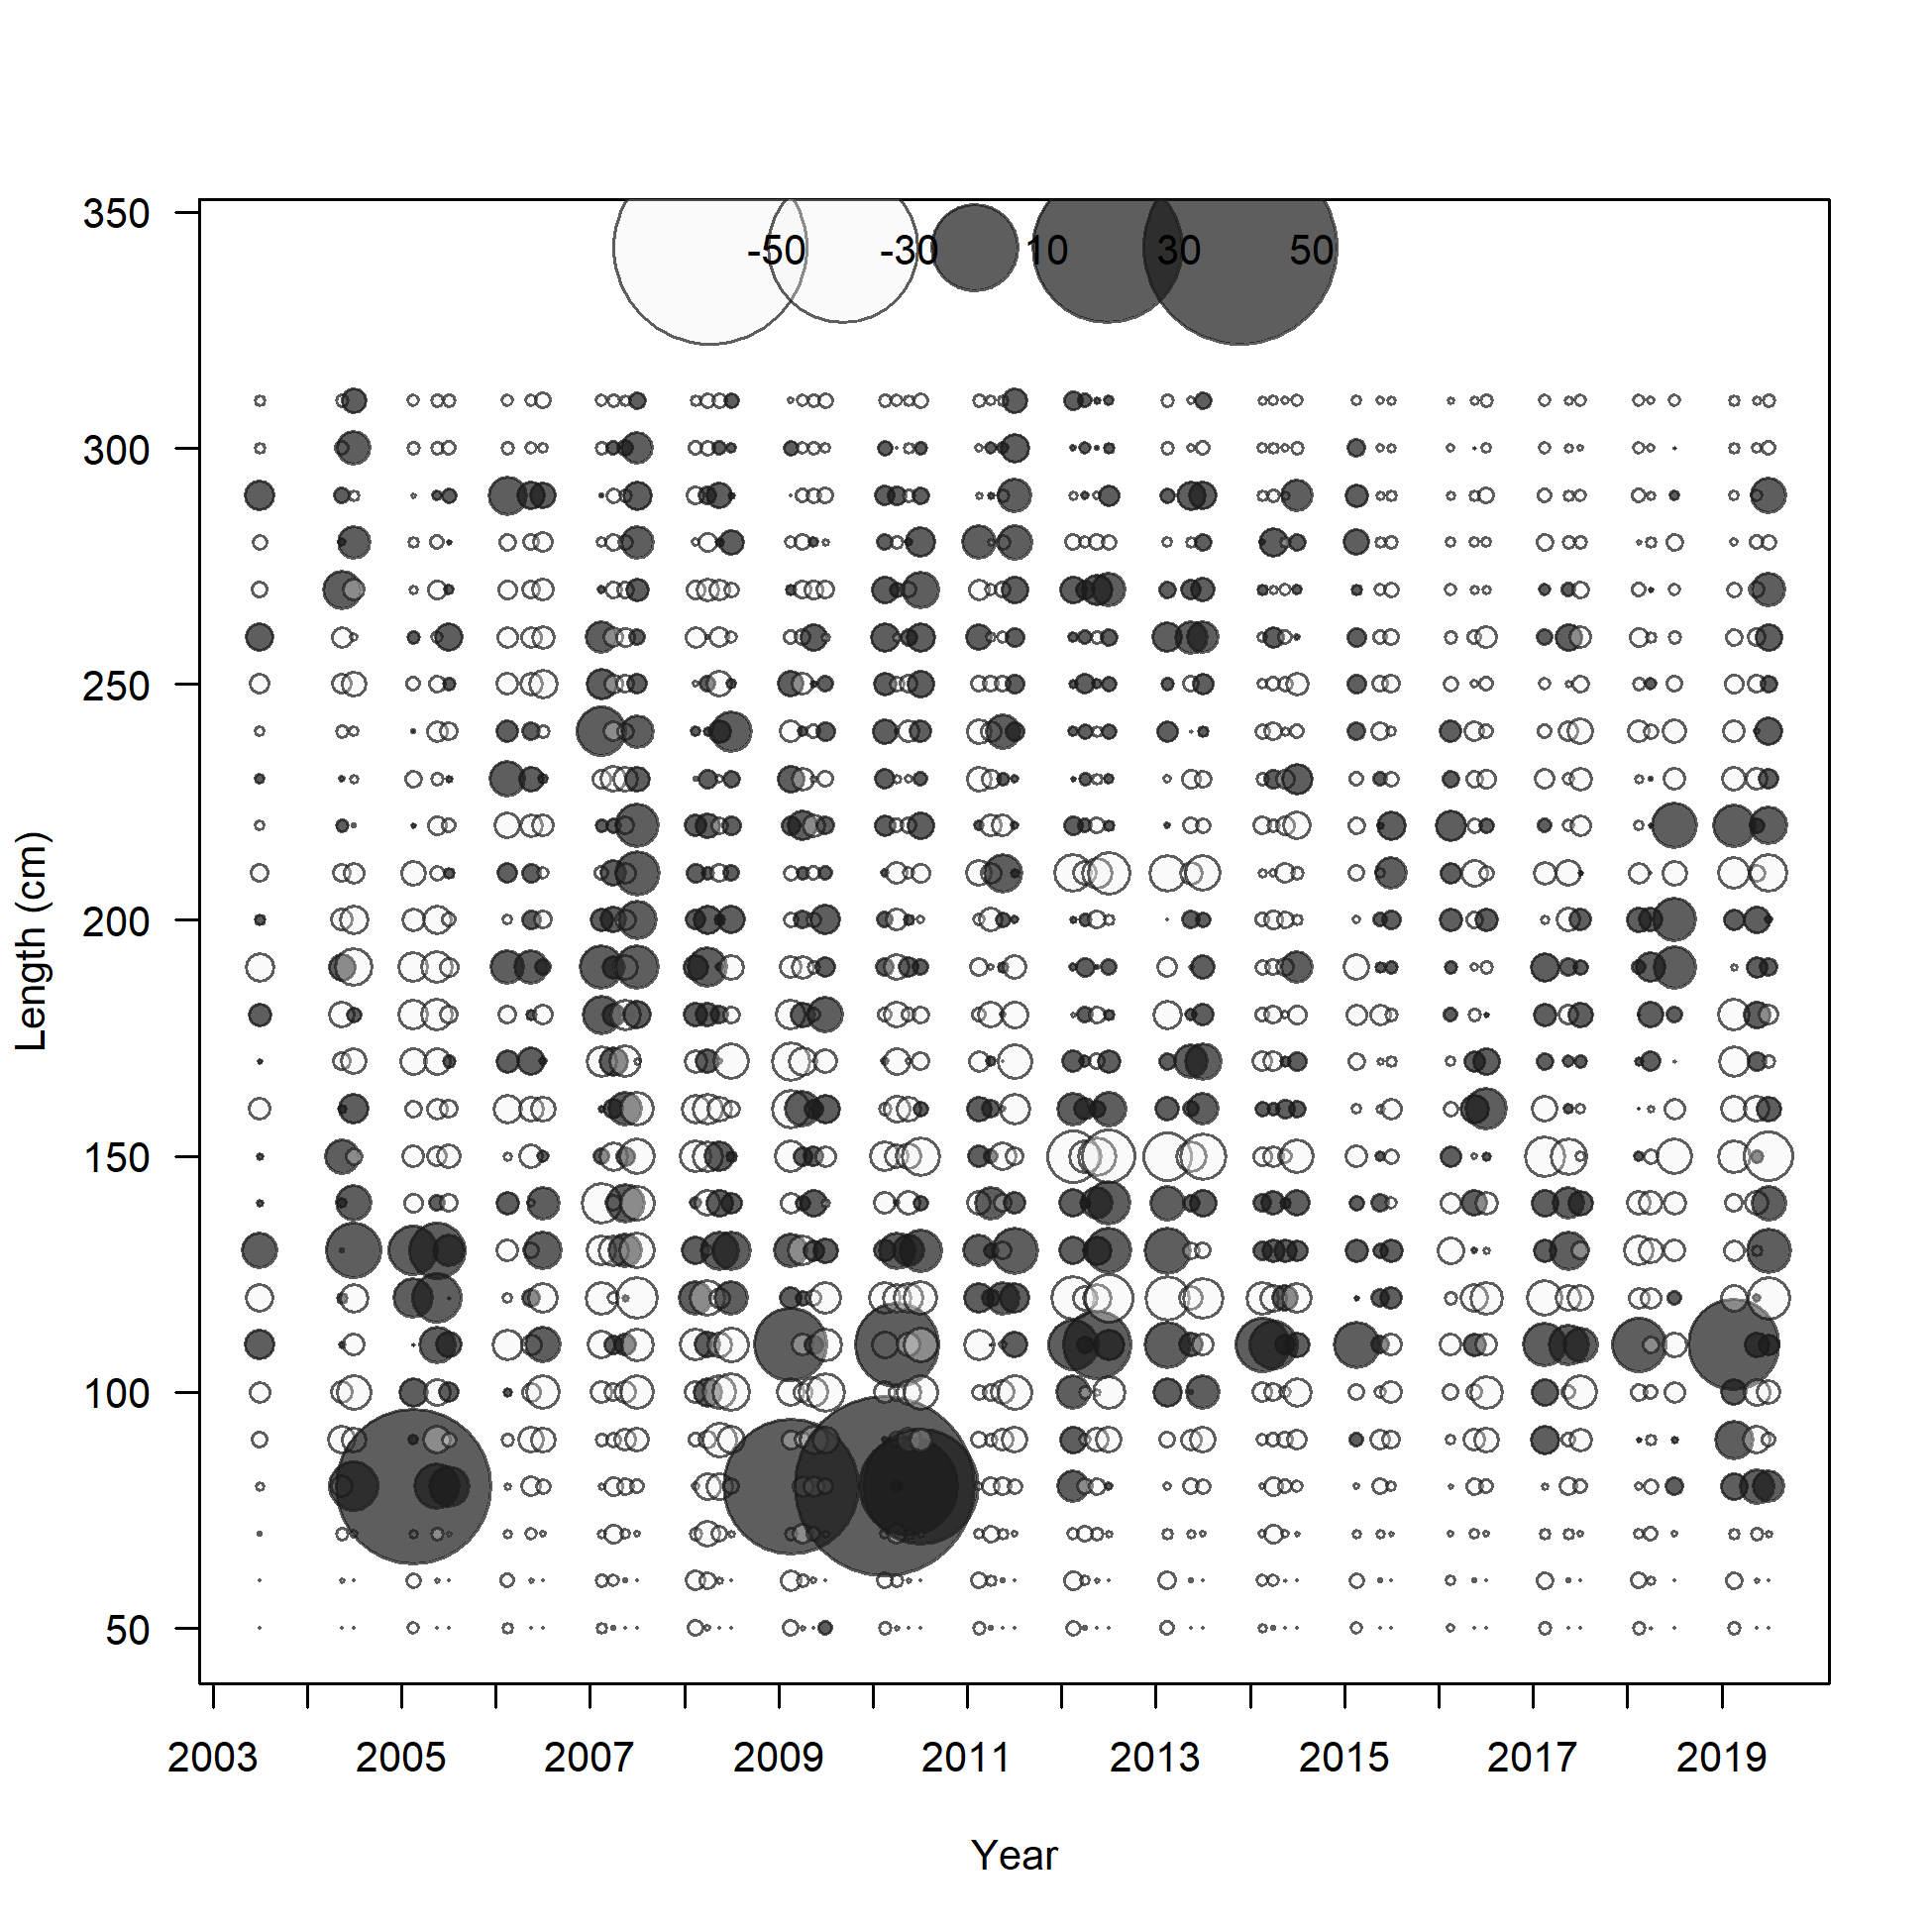
Pearson residuals, whole catch, F7_ESP_A3 (max=43.28) (plot 3 of 3)
Closed bubbles are positive residuals (observed > expected) and open bubbles are negative residuals (observed < expected).
file: comp_lenfit_residsflt7mkt0_page3.png
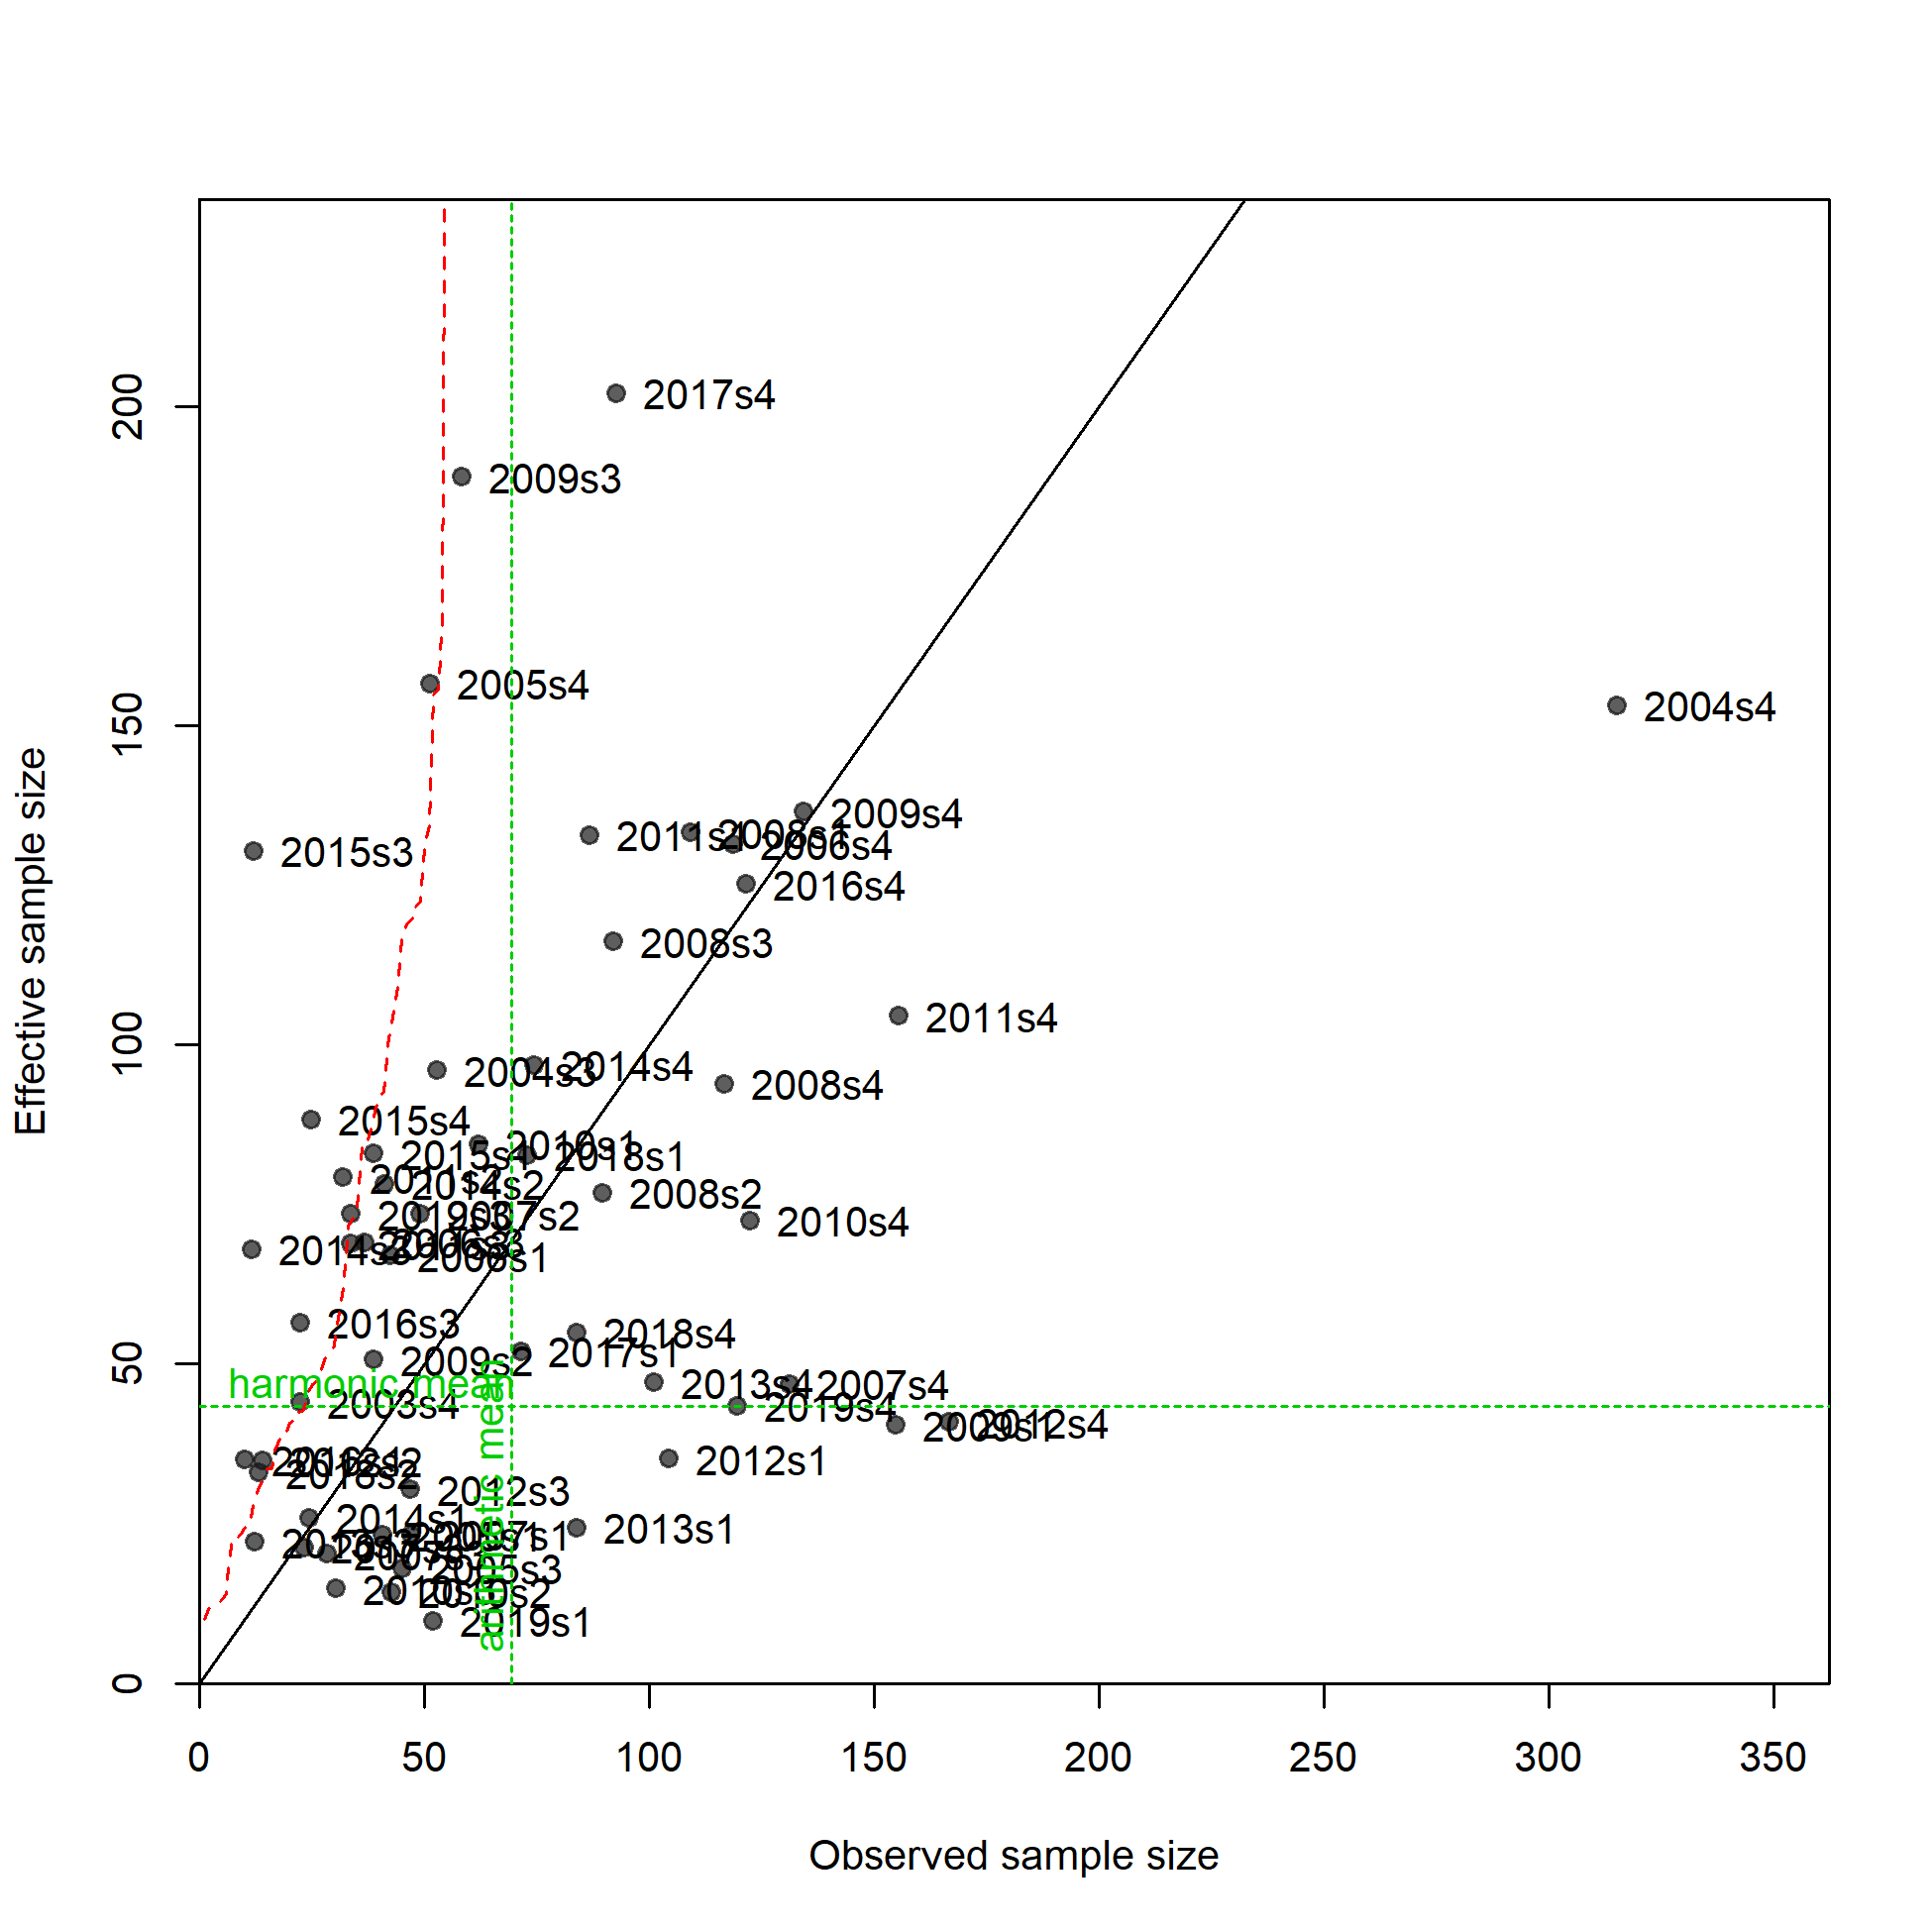
N-EffN comparison, Length comps, whole catch, F7_ESP_A3
file: comp_lenfit_sampsize_flt7mkt0.png
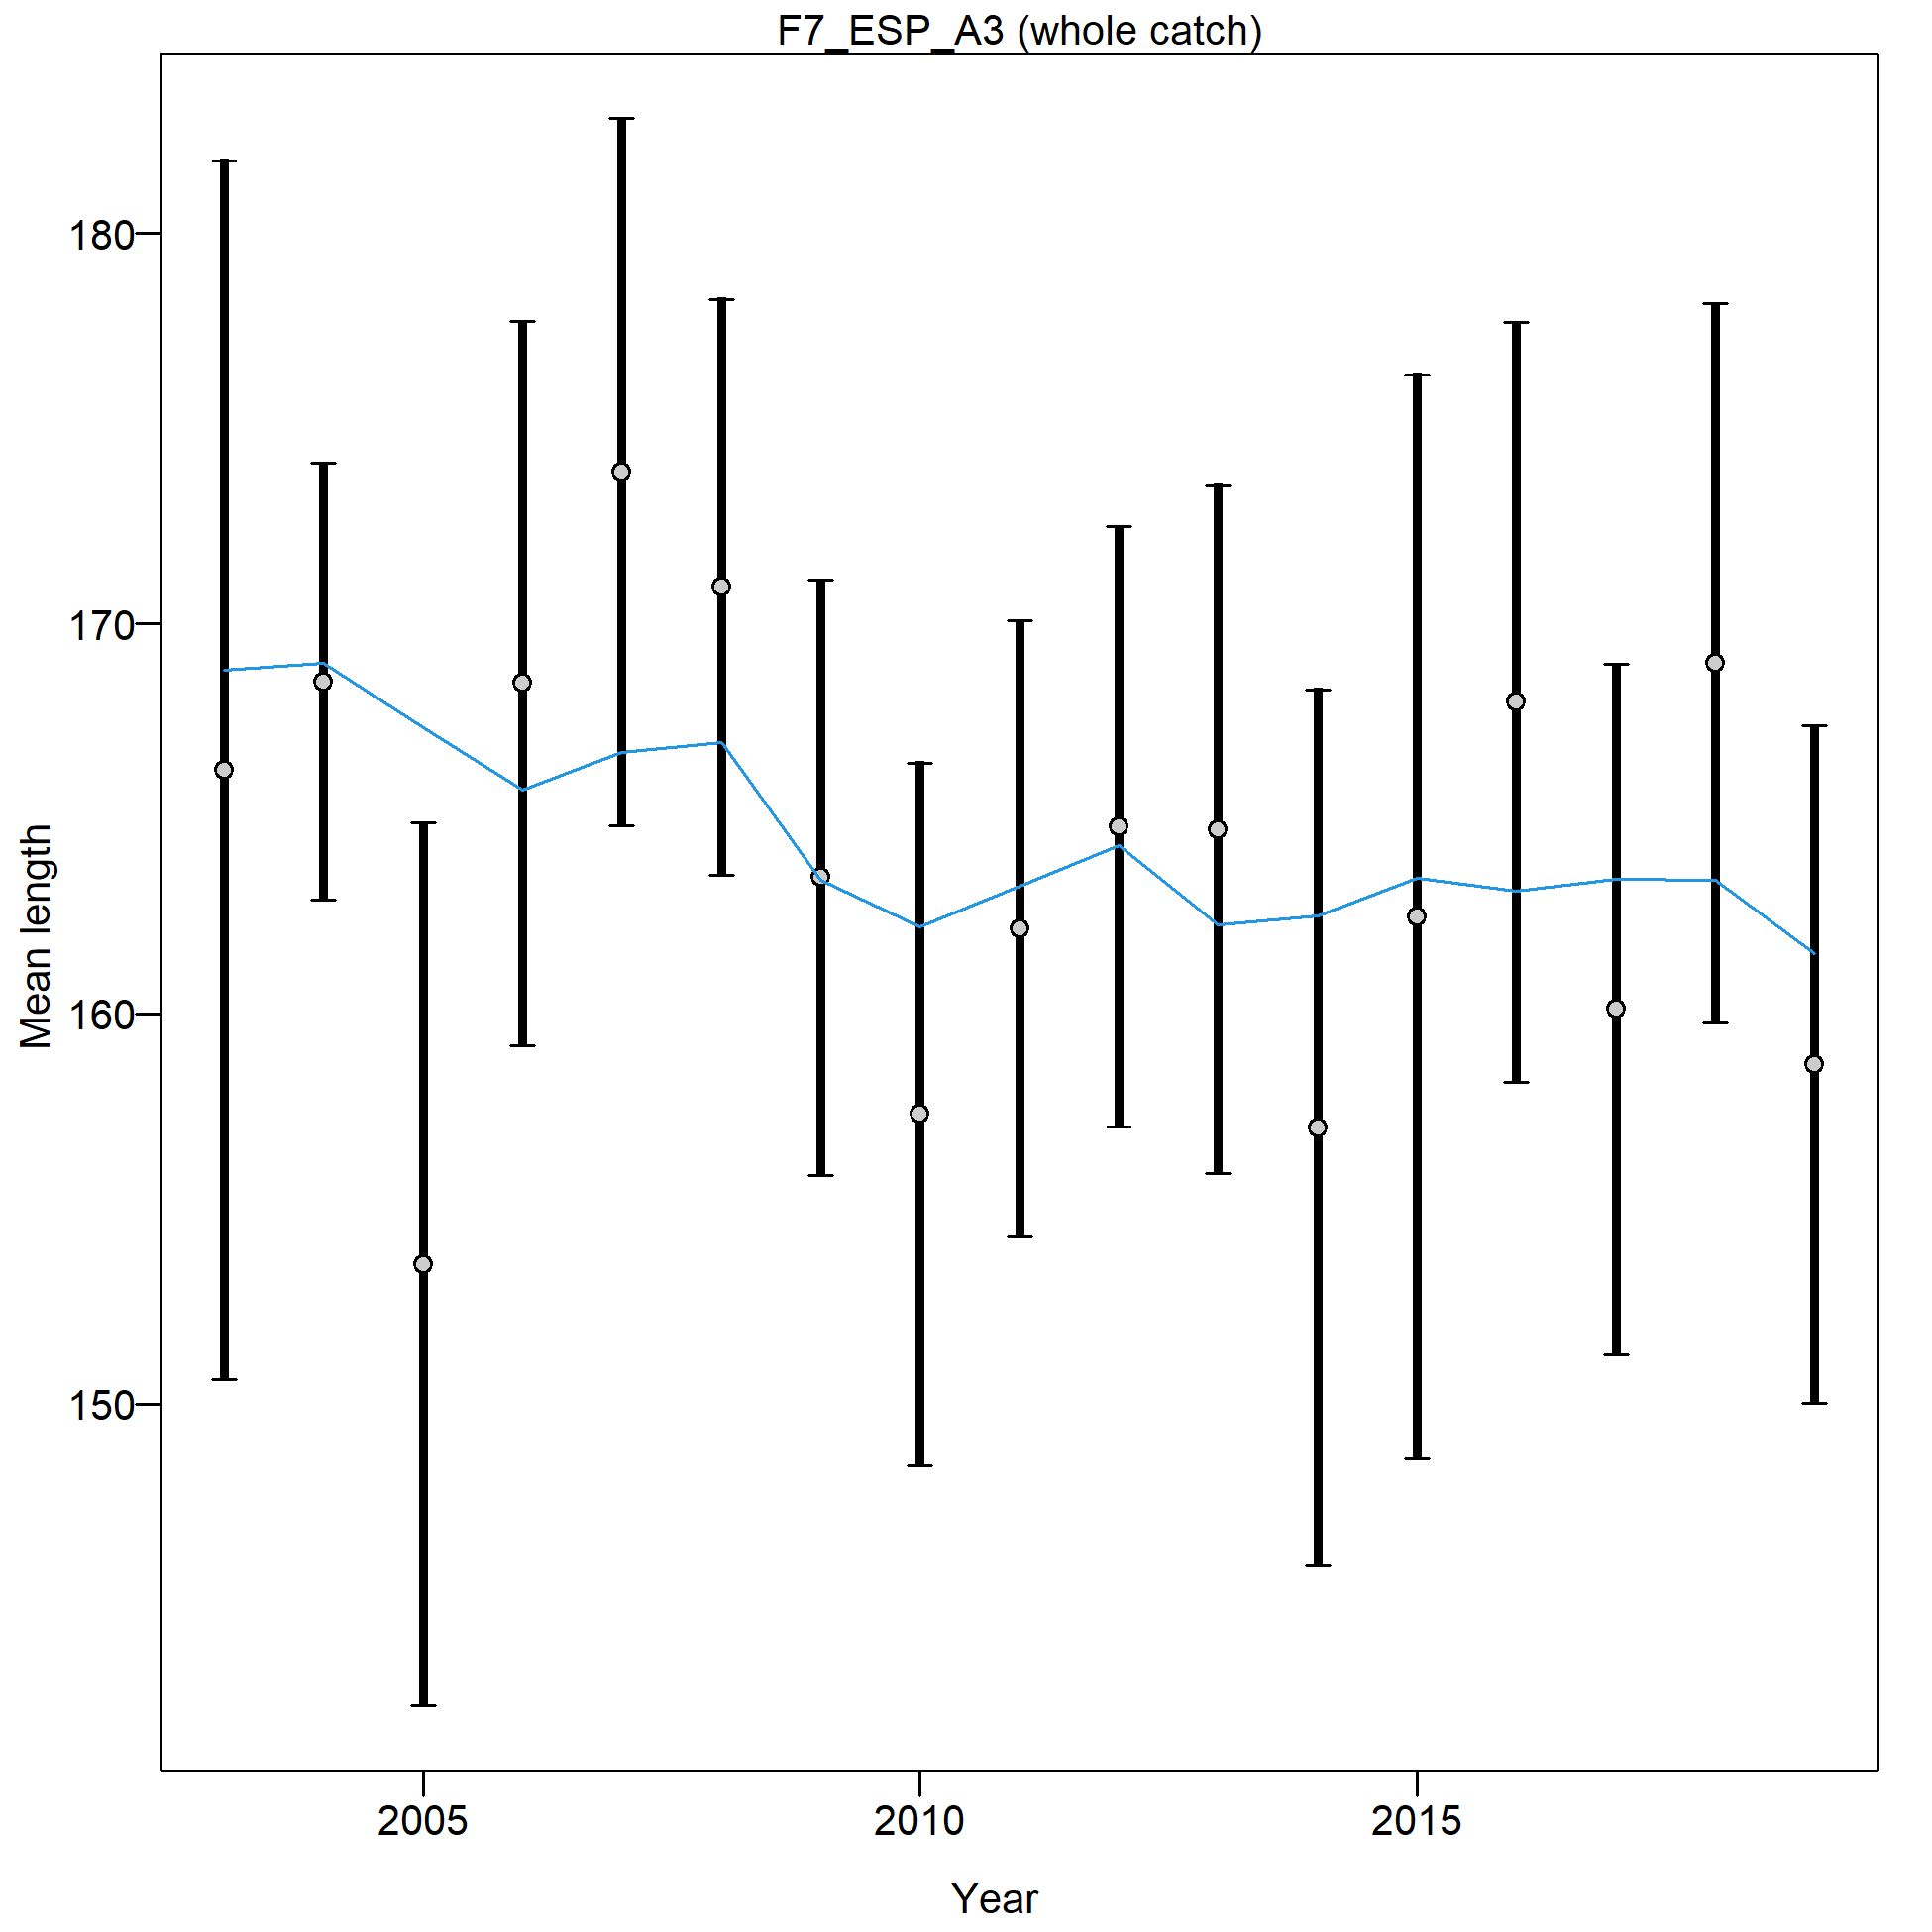
Mean length for F7_ESP_A3 with 95% confidence intervals based on current samples sizes.
Francis data weighting method TA1.8: thinner intervals (with capped ends) show result of further adjusting sample sizes based on suggested multiplier (with 95% interval) for len data from F7_ESP_A3:
1.0074 (0.6037-2.6077)
For more info, see
Francis, R.I.C.C. (2011). Data weighting in statistical fisheries stock assessment models. Can. J. Fish. Aquat. Sci. 68: 1124-1138. https://doi.org/10.1139/f2011-025
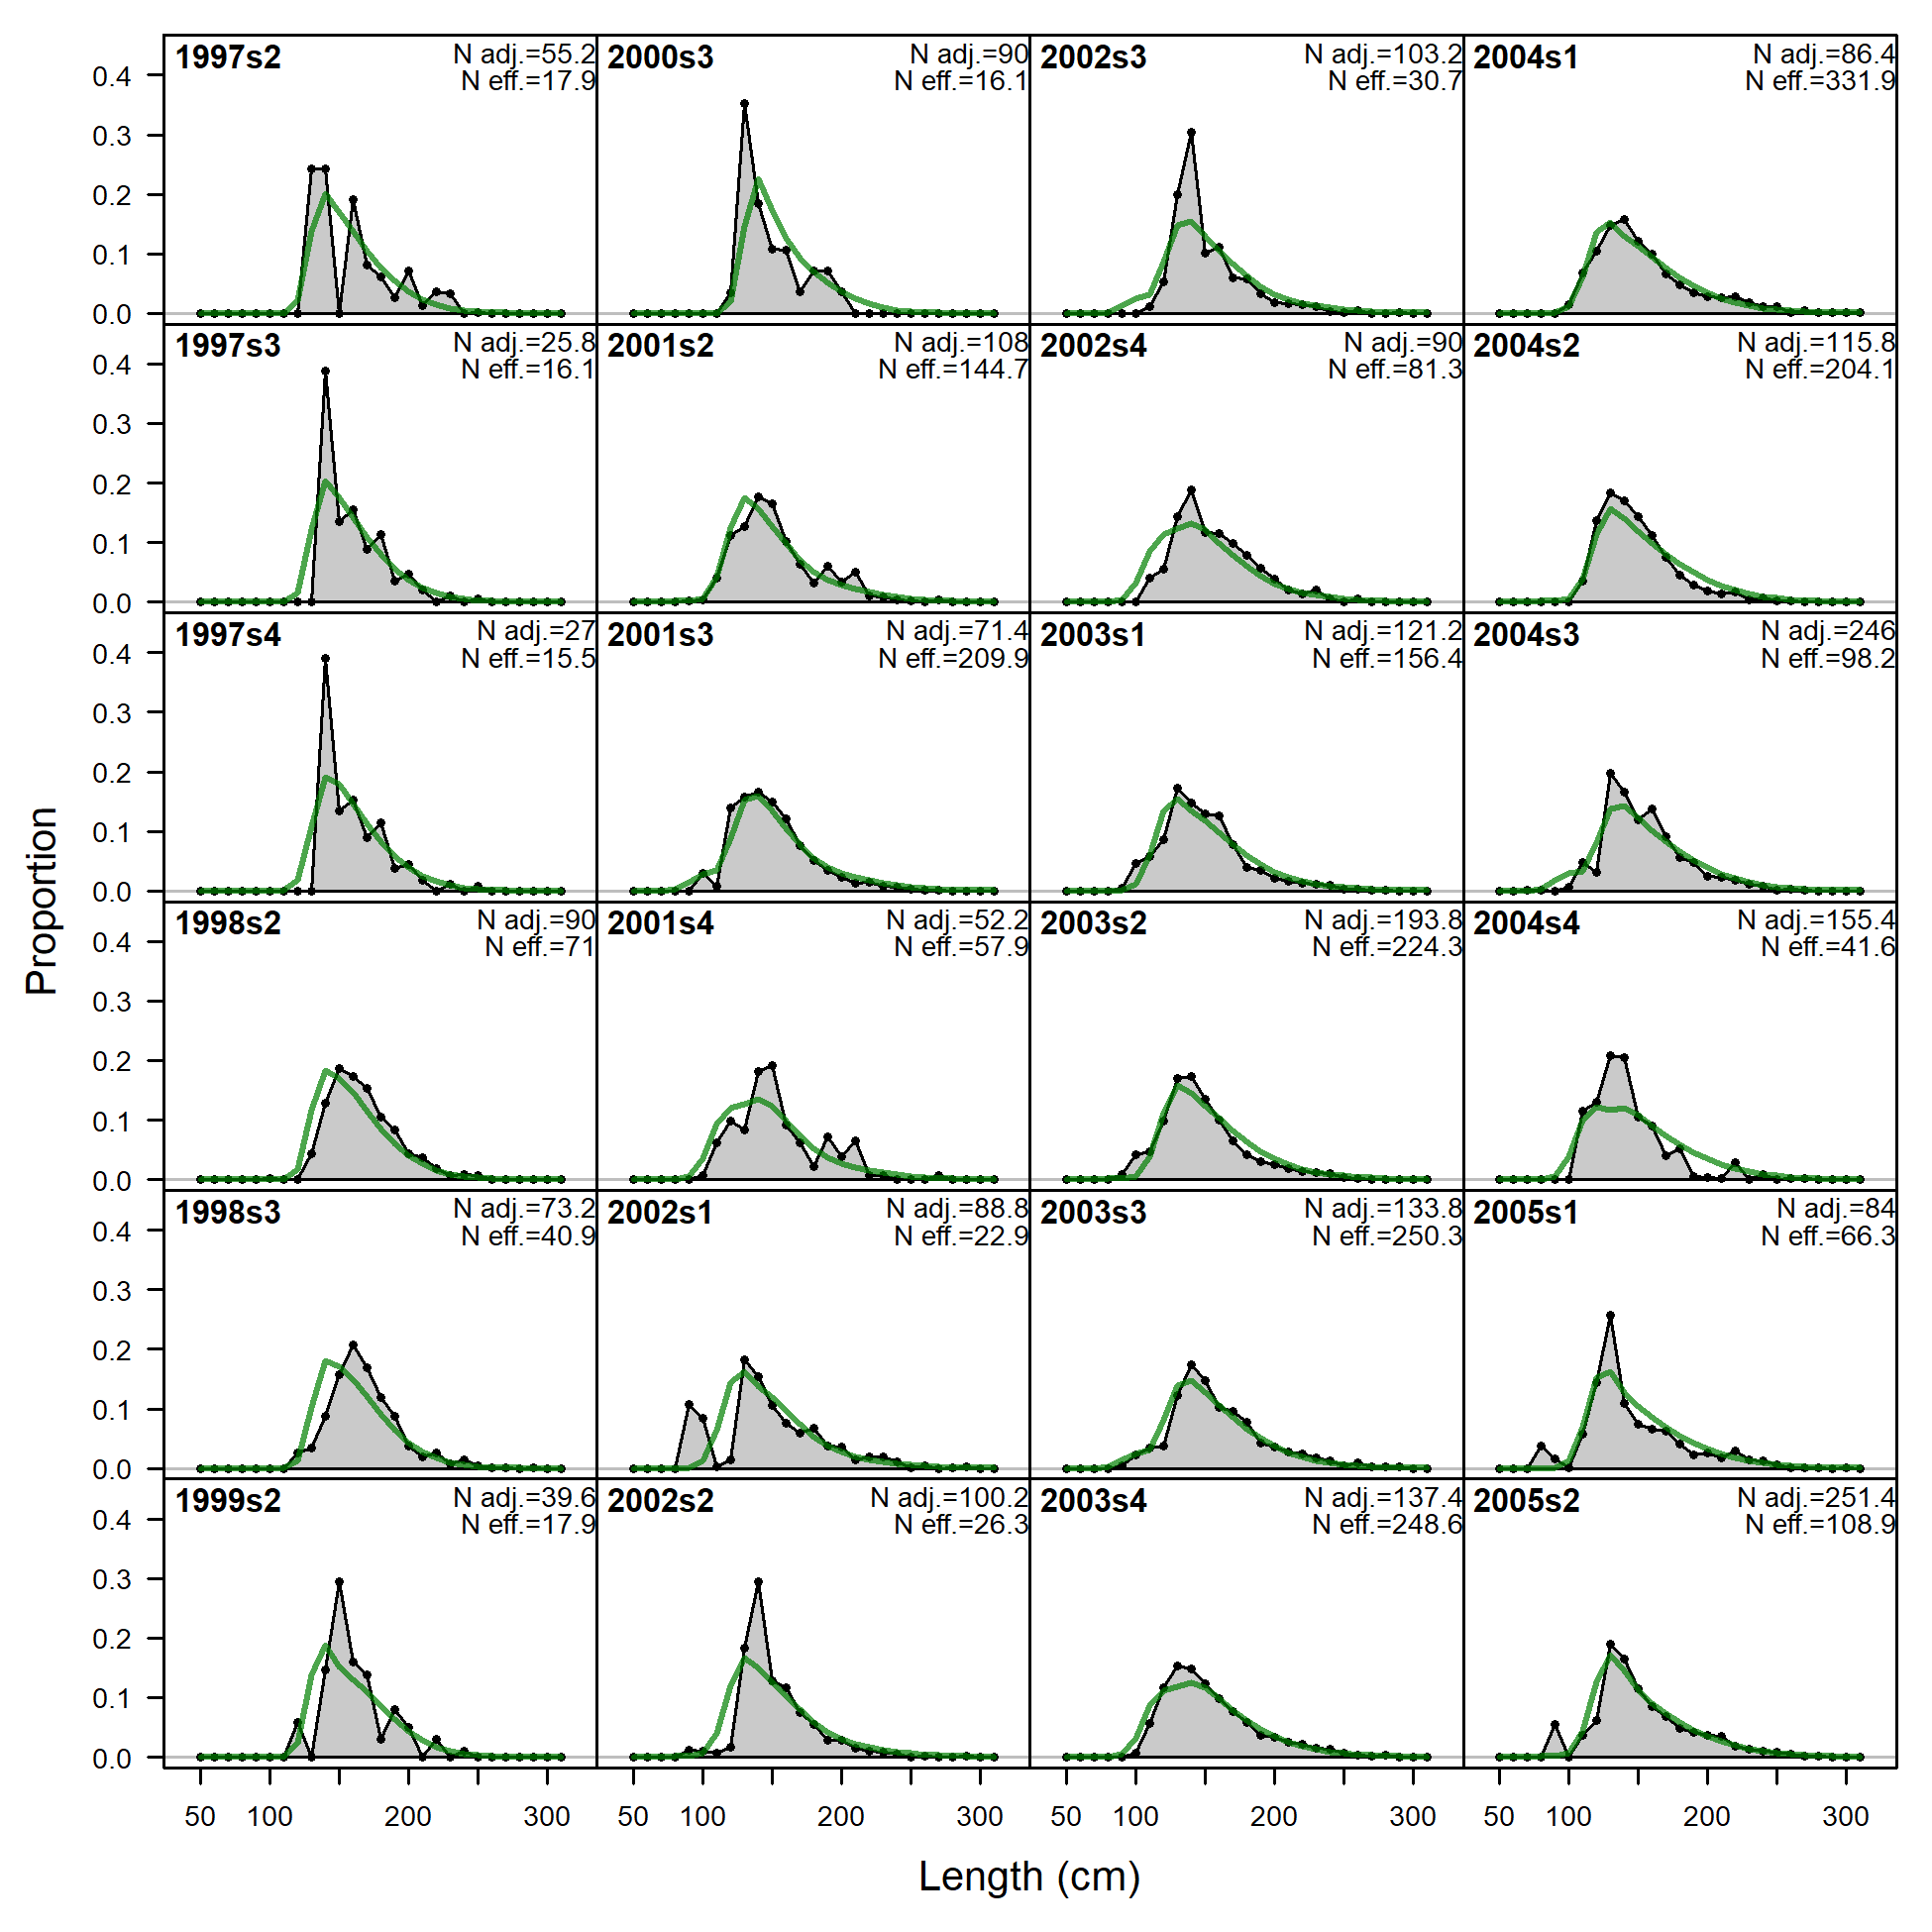
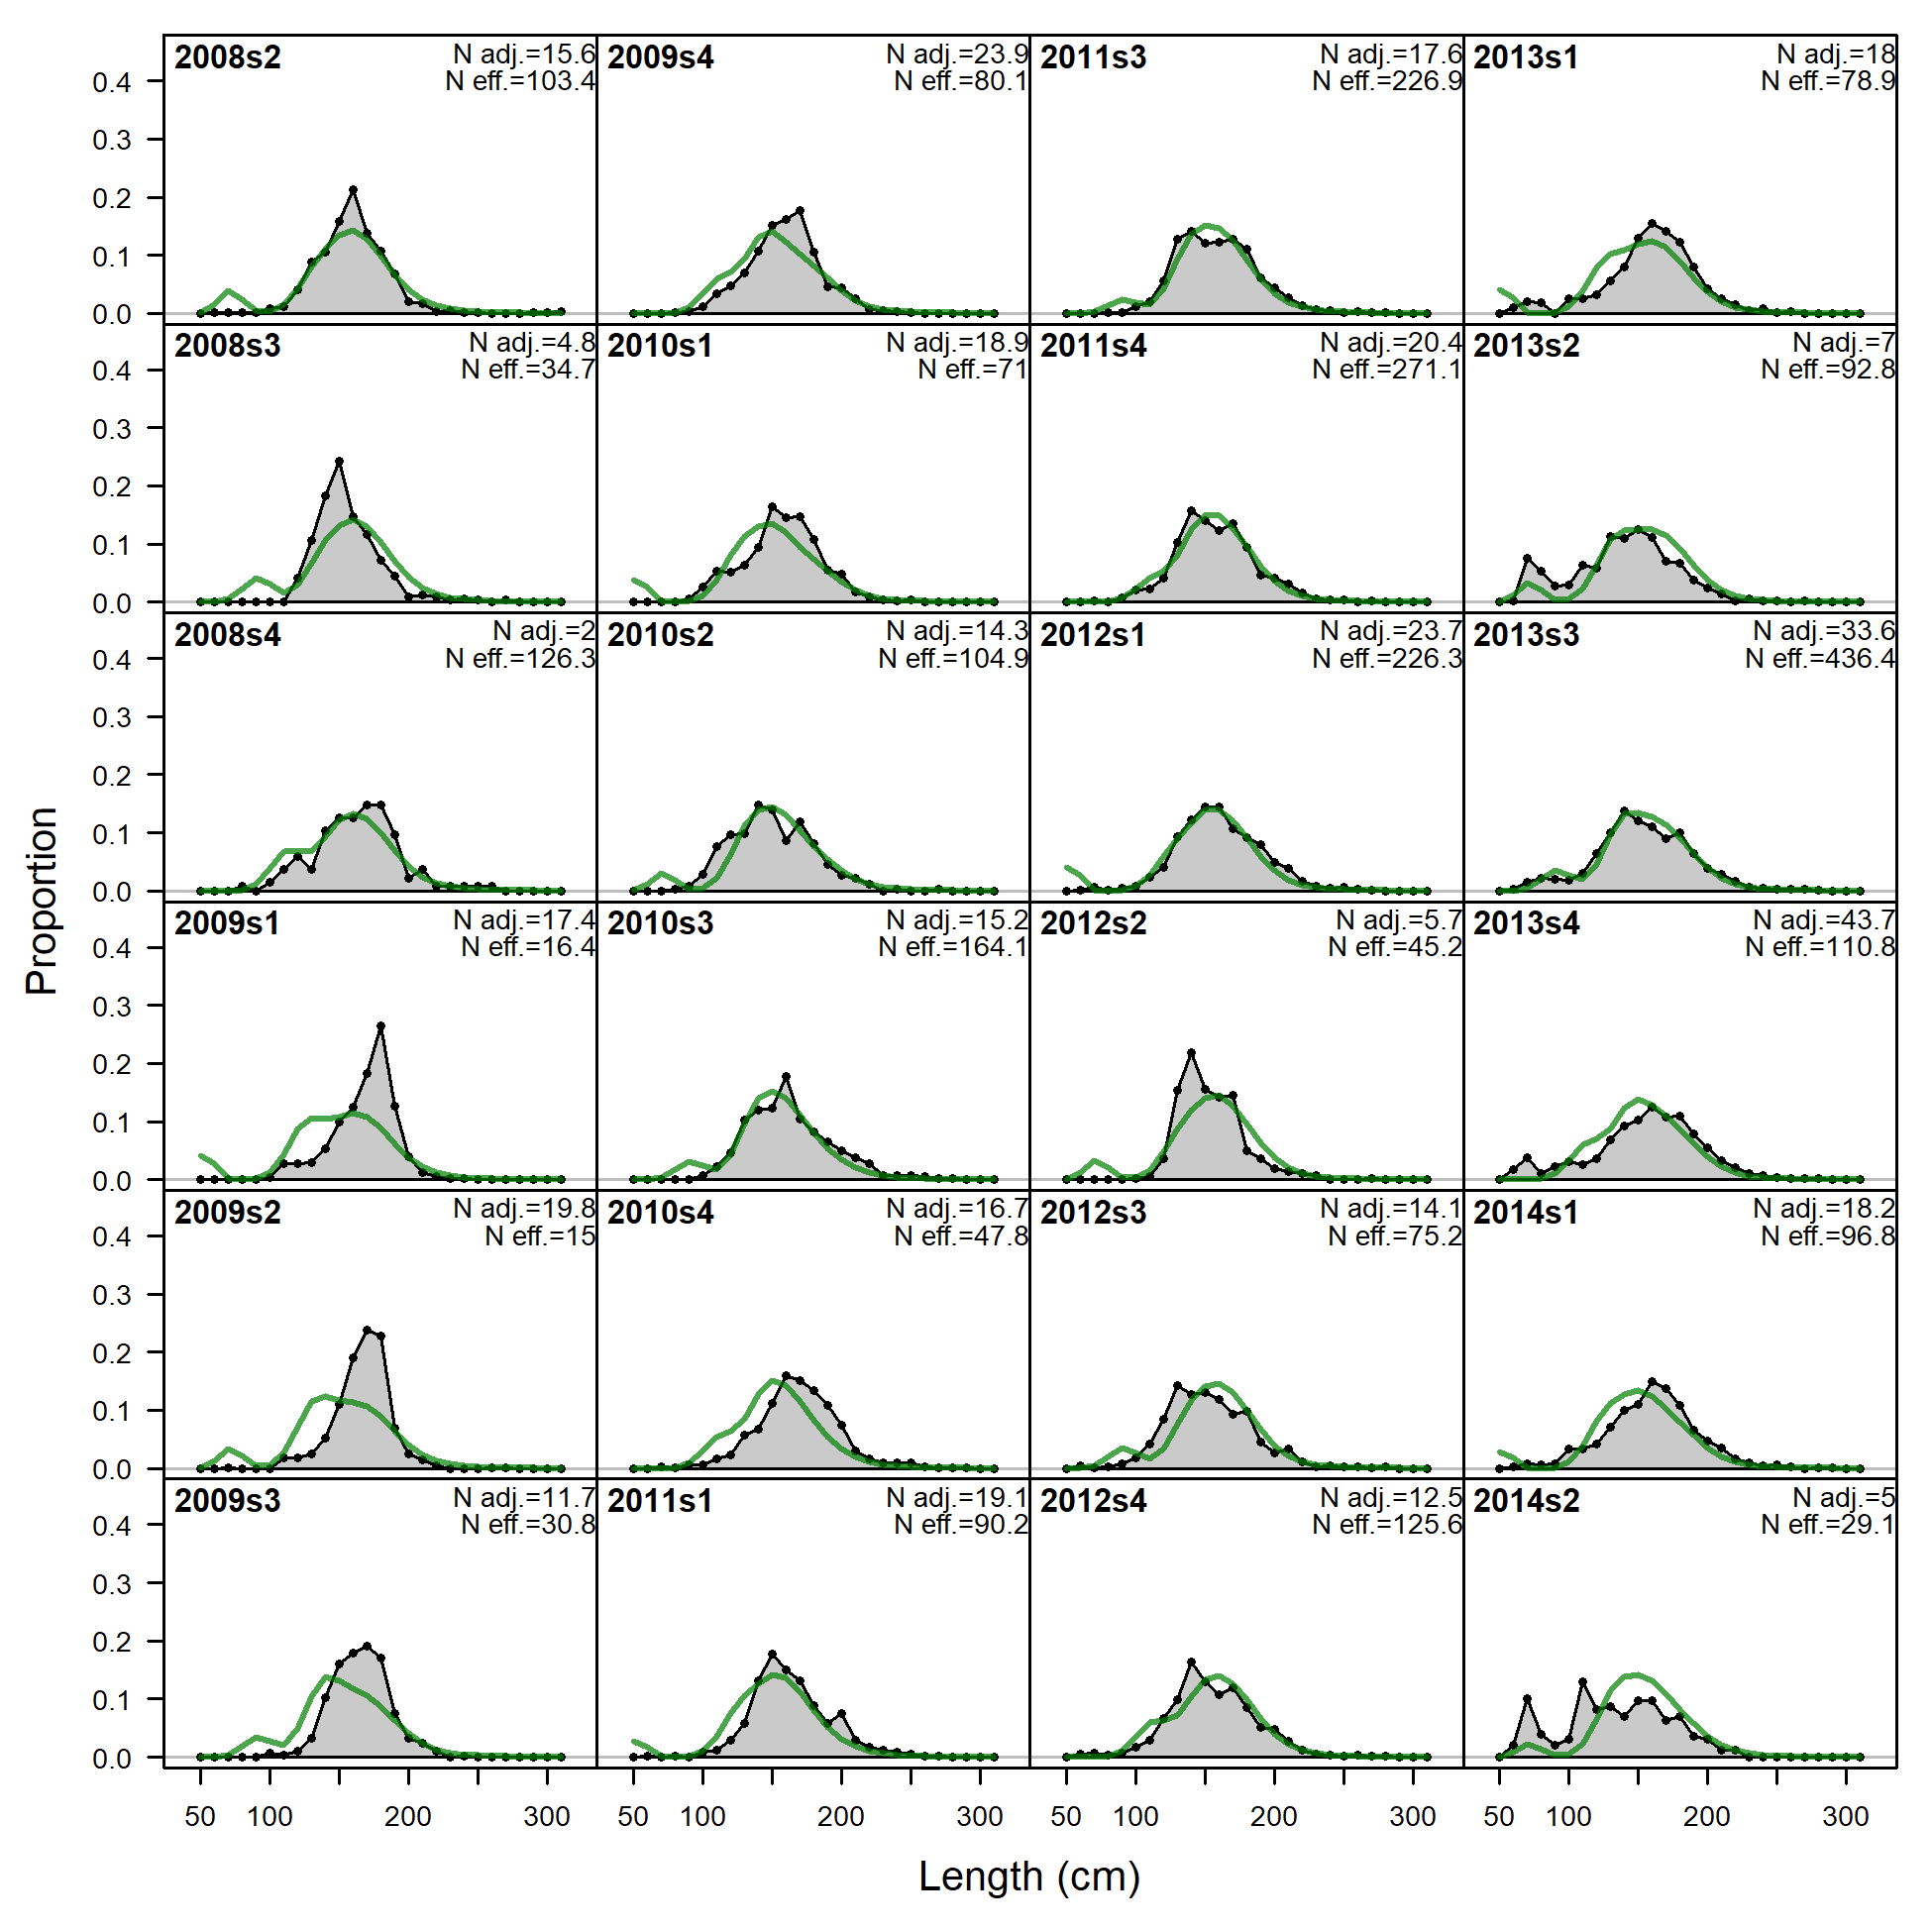
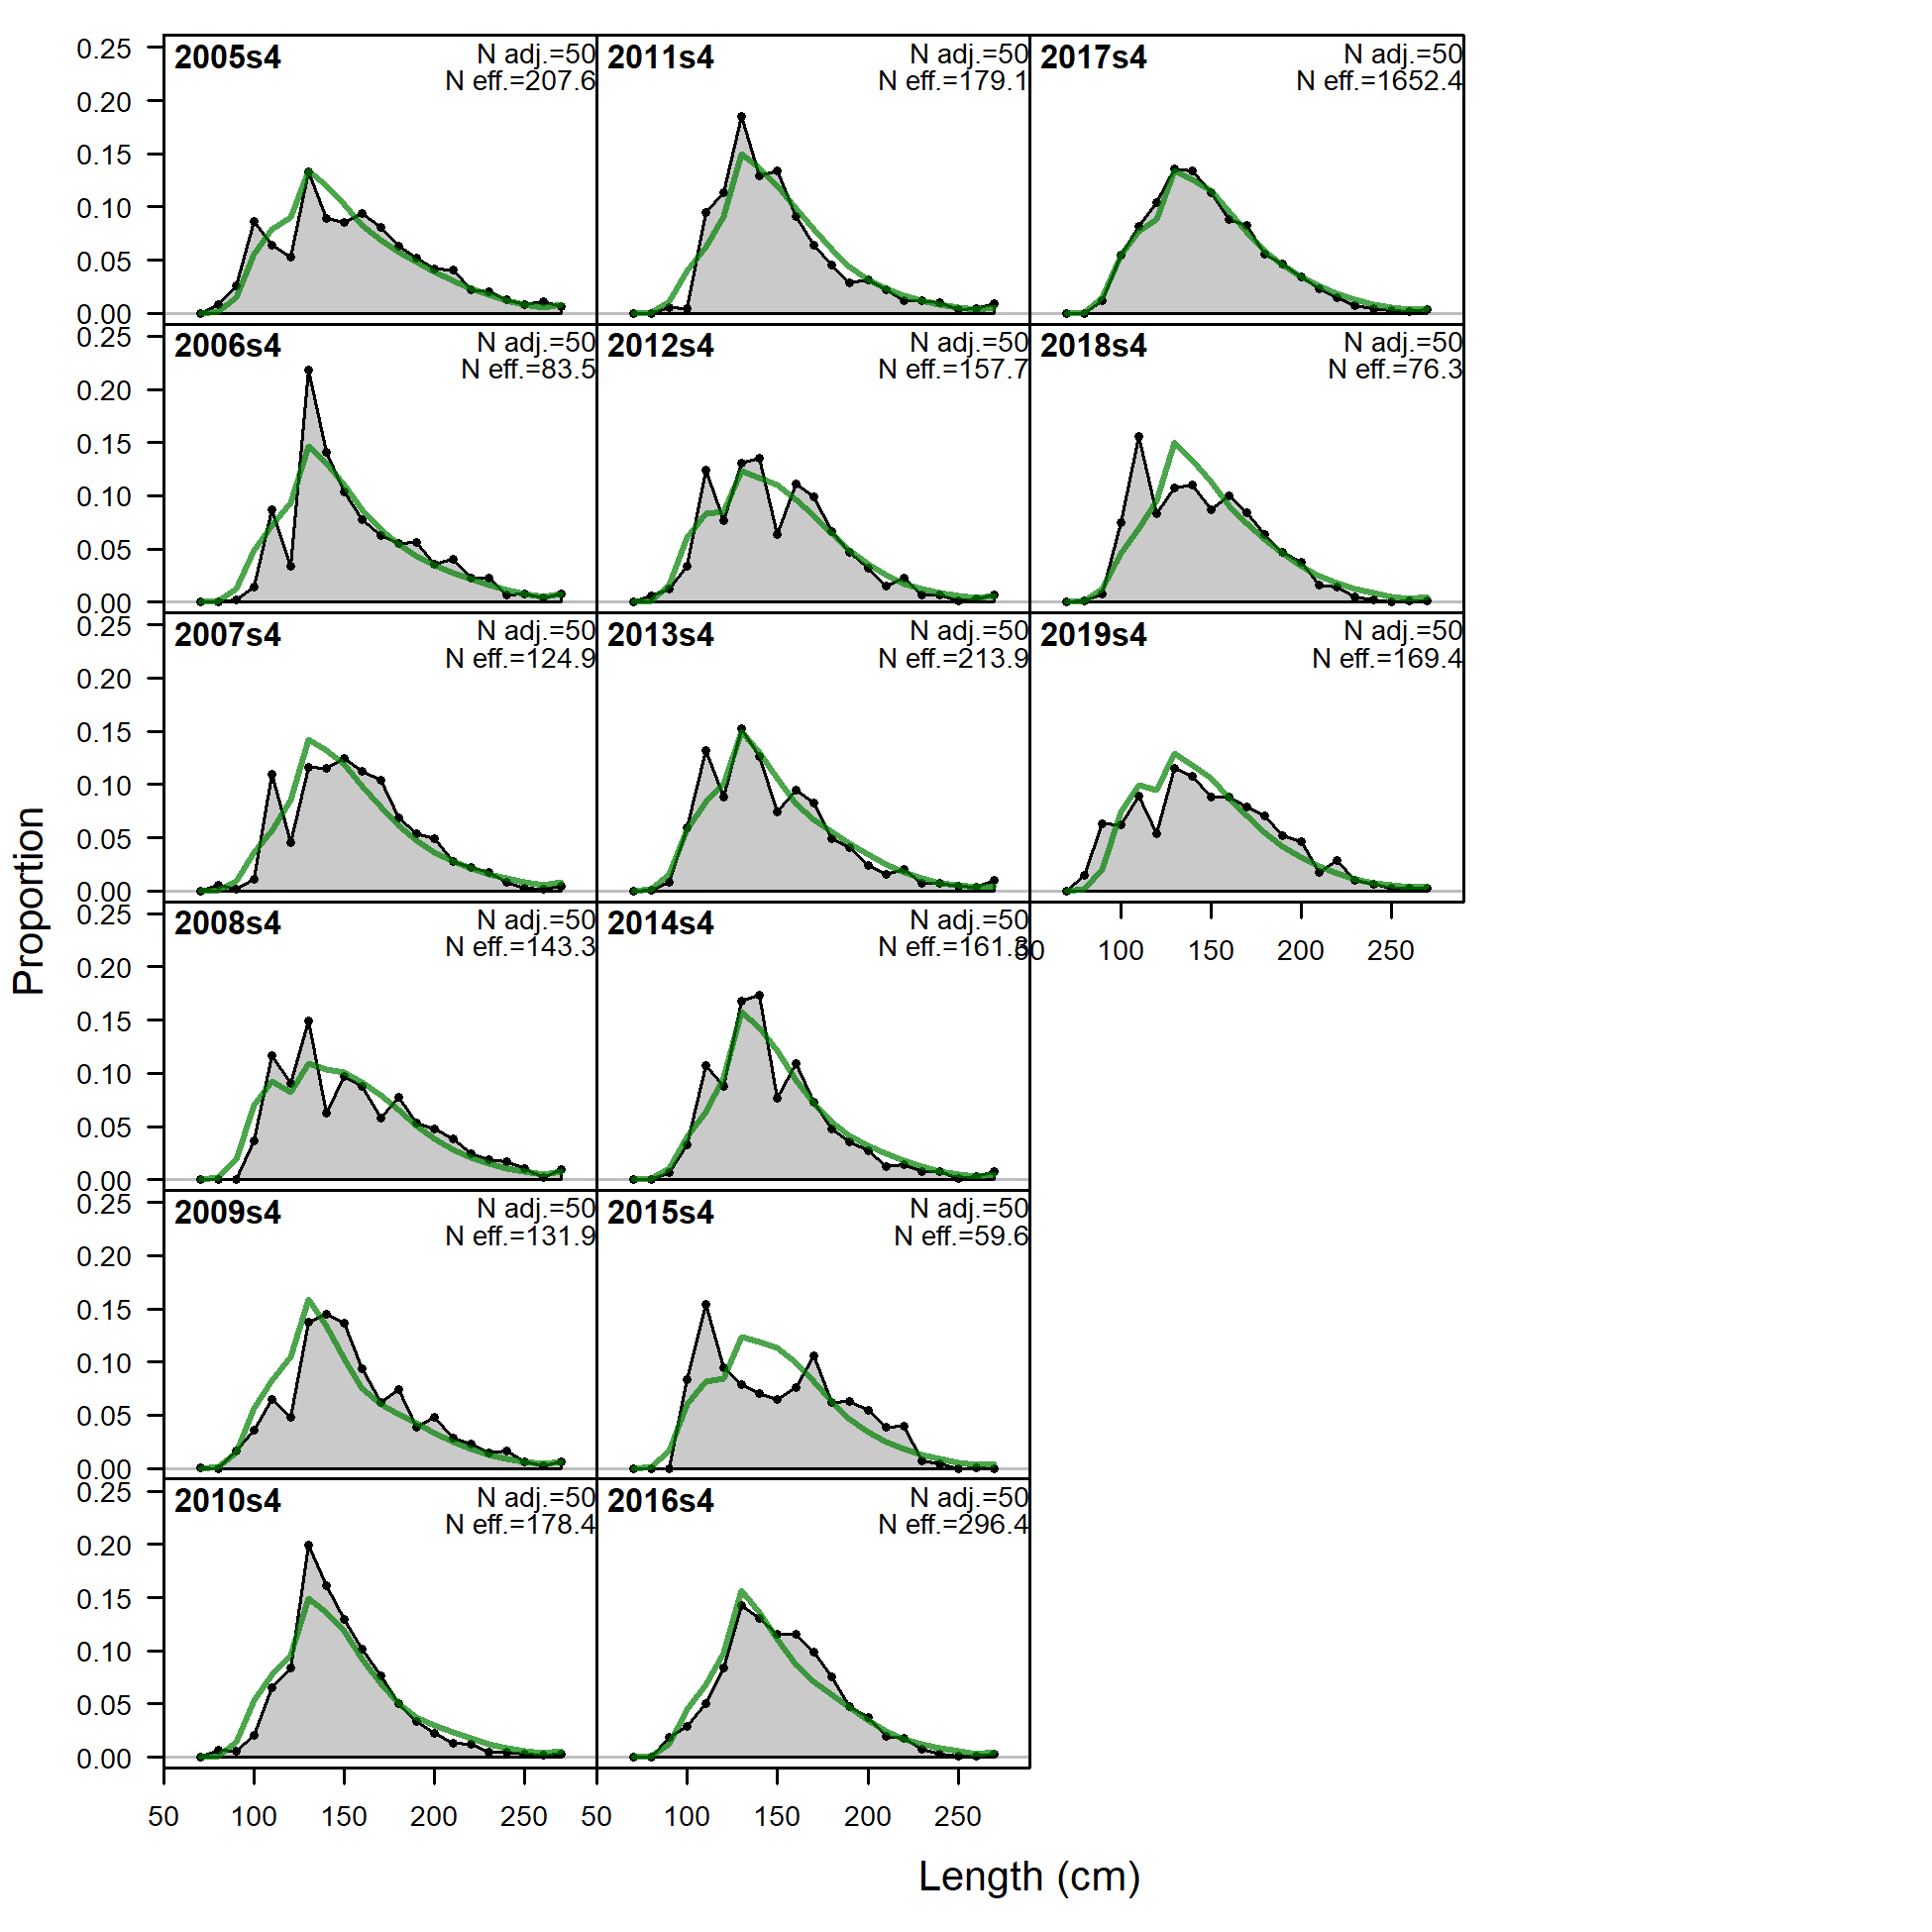
Length comps, whole catch, F8_ESP_A4 (plot 1 of 4).
'N adj.' is the input sample size after data-weighting adjustment. N eff. is the calculated effective sample size used in the McAllister-Ianelli tuning method.
file: comp_lenfit_flt8mkt0_page1.png
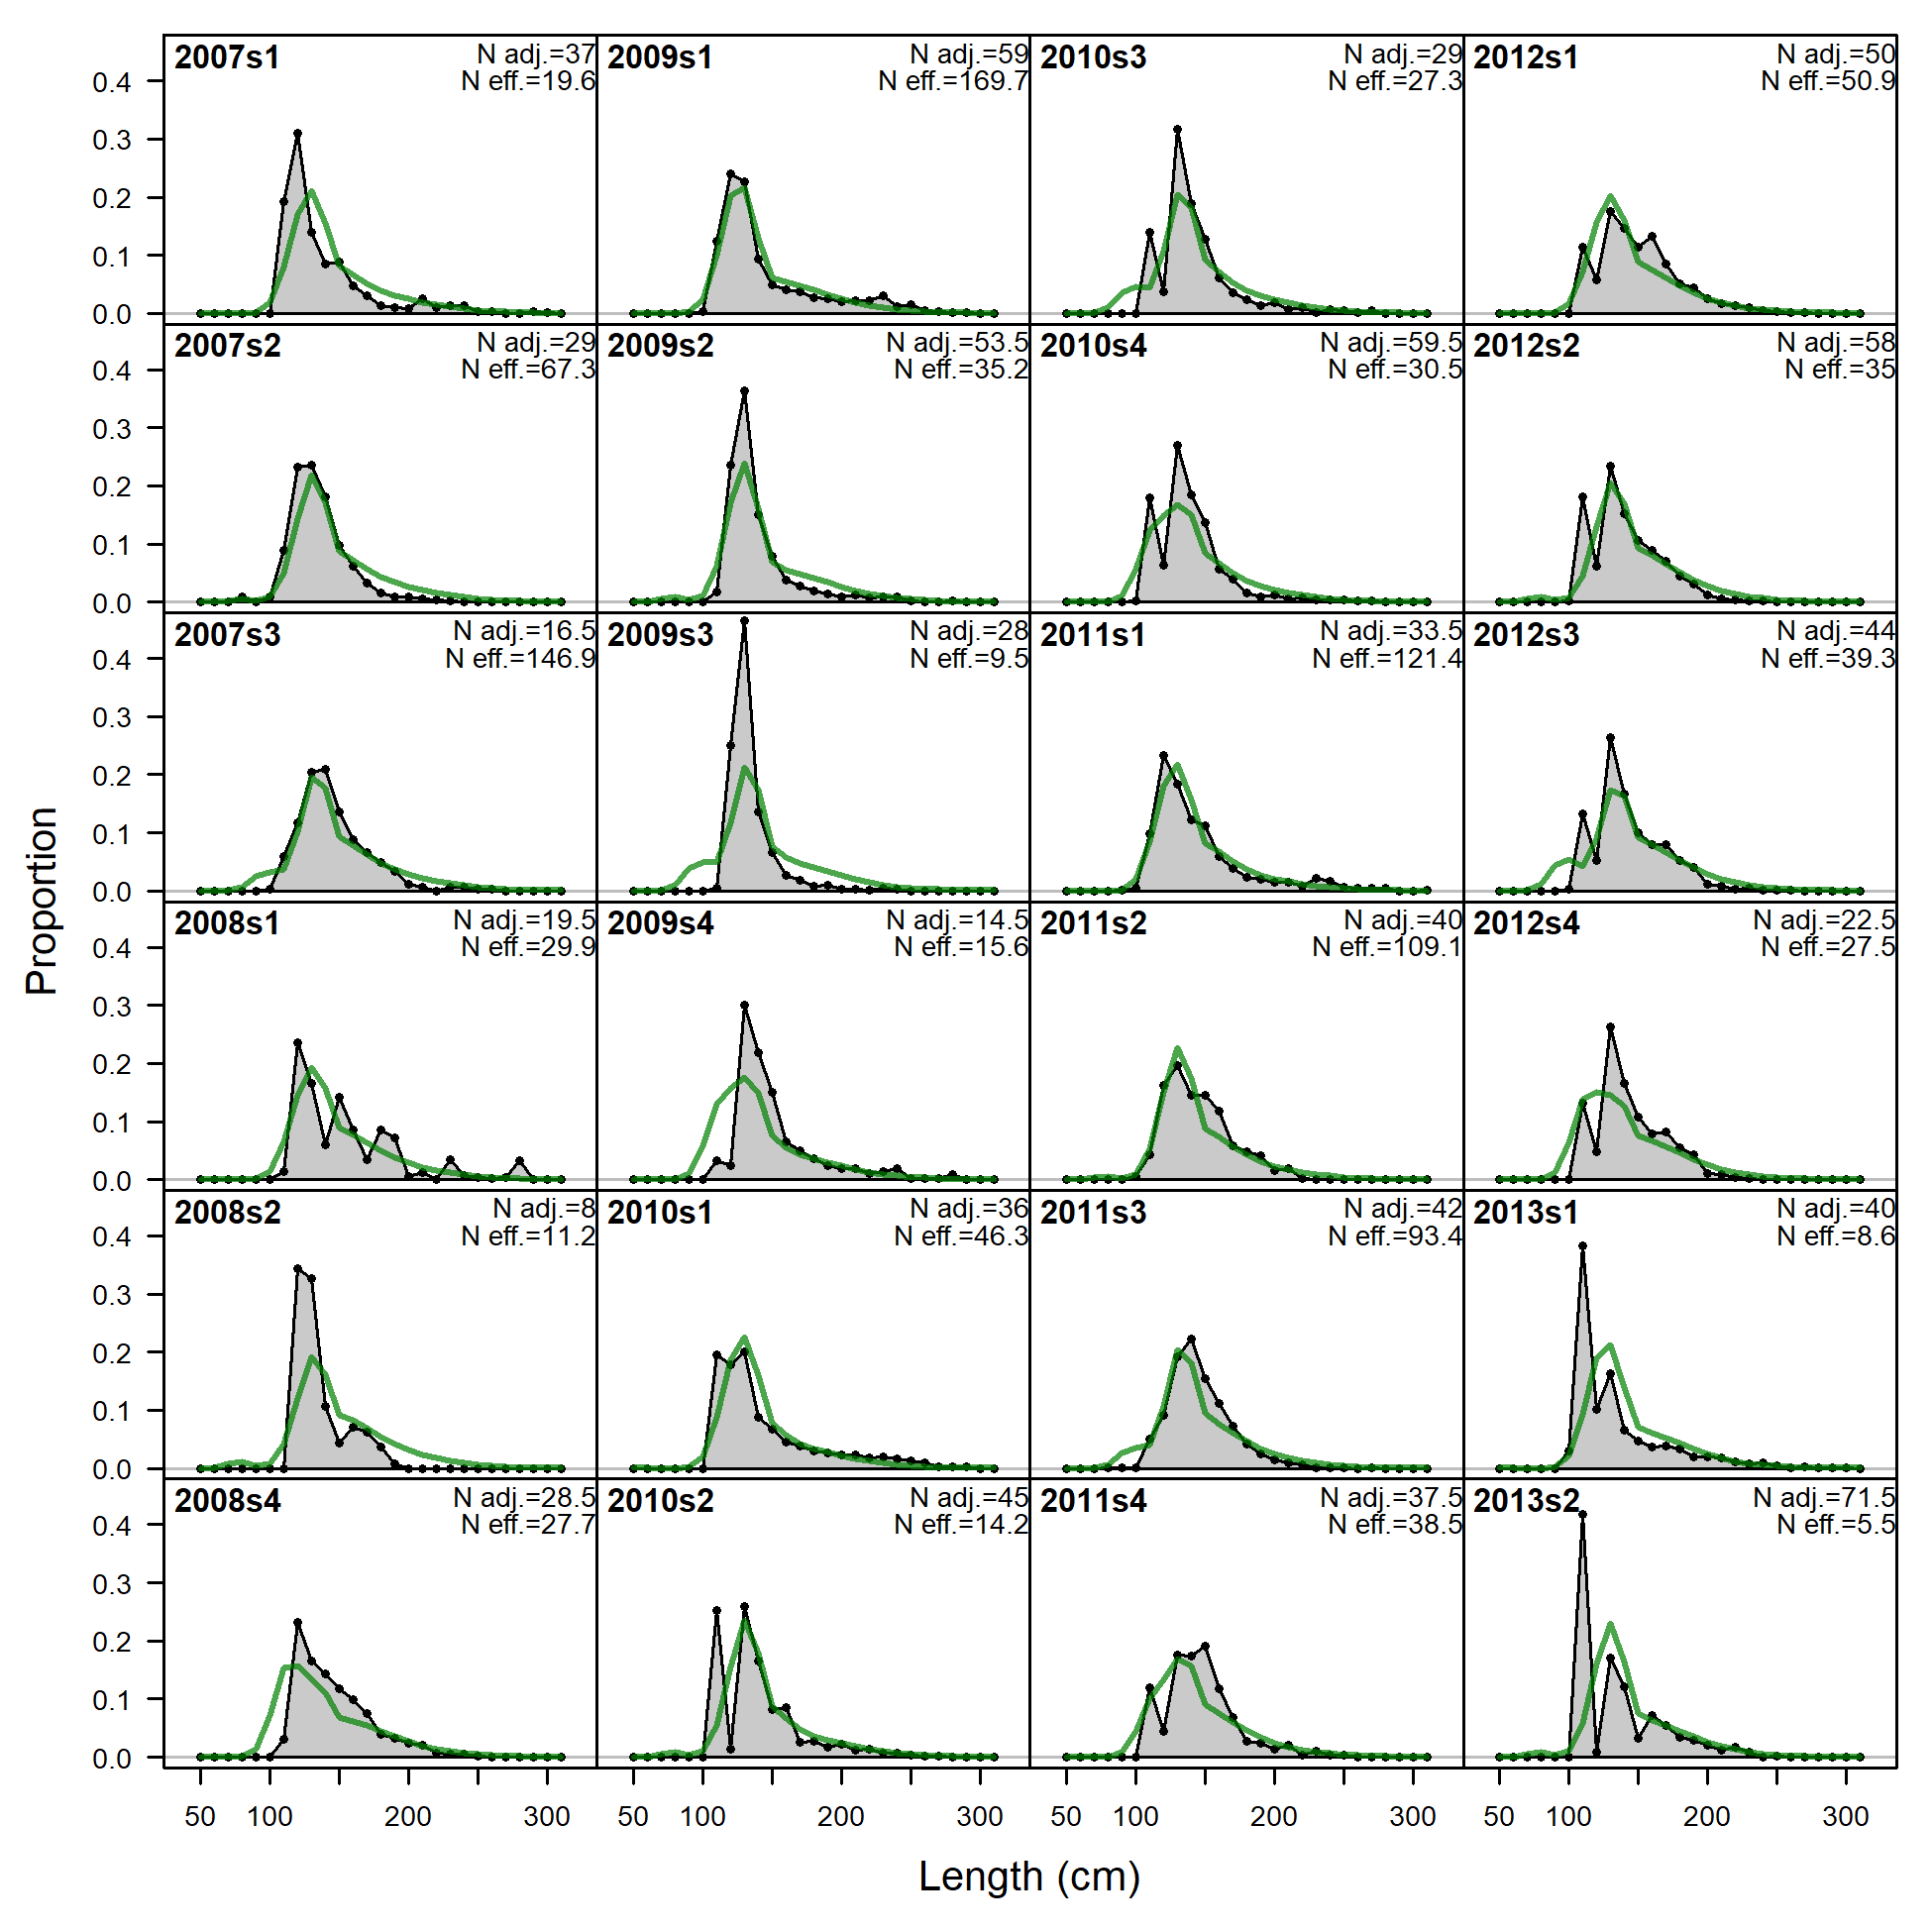
Length comps, whole catch, F8_ESP_A4 (plot 1 of 4).
'N adj.' is the input sample size after data-weighting adjustment. N eff. is the calculated effective sample size used in the McAllister-Ianelli tuning method. (plot 2 of 4)
file: comp_lenfit_flt8mkt0_page2.png
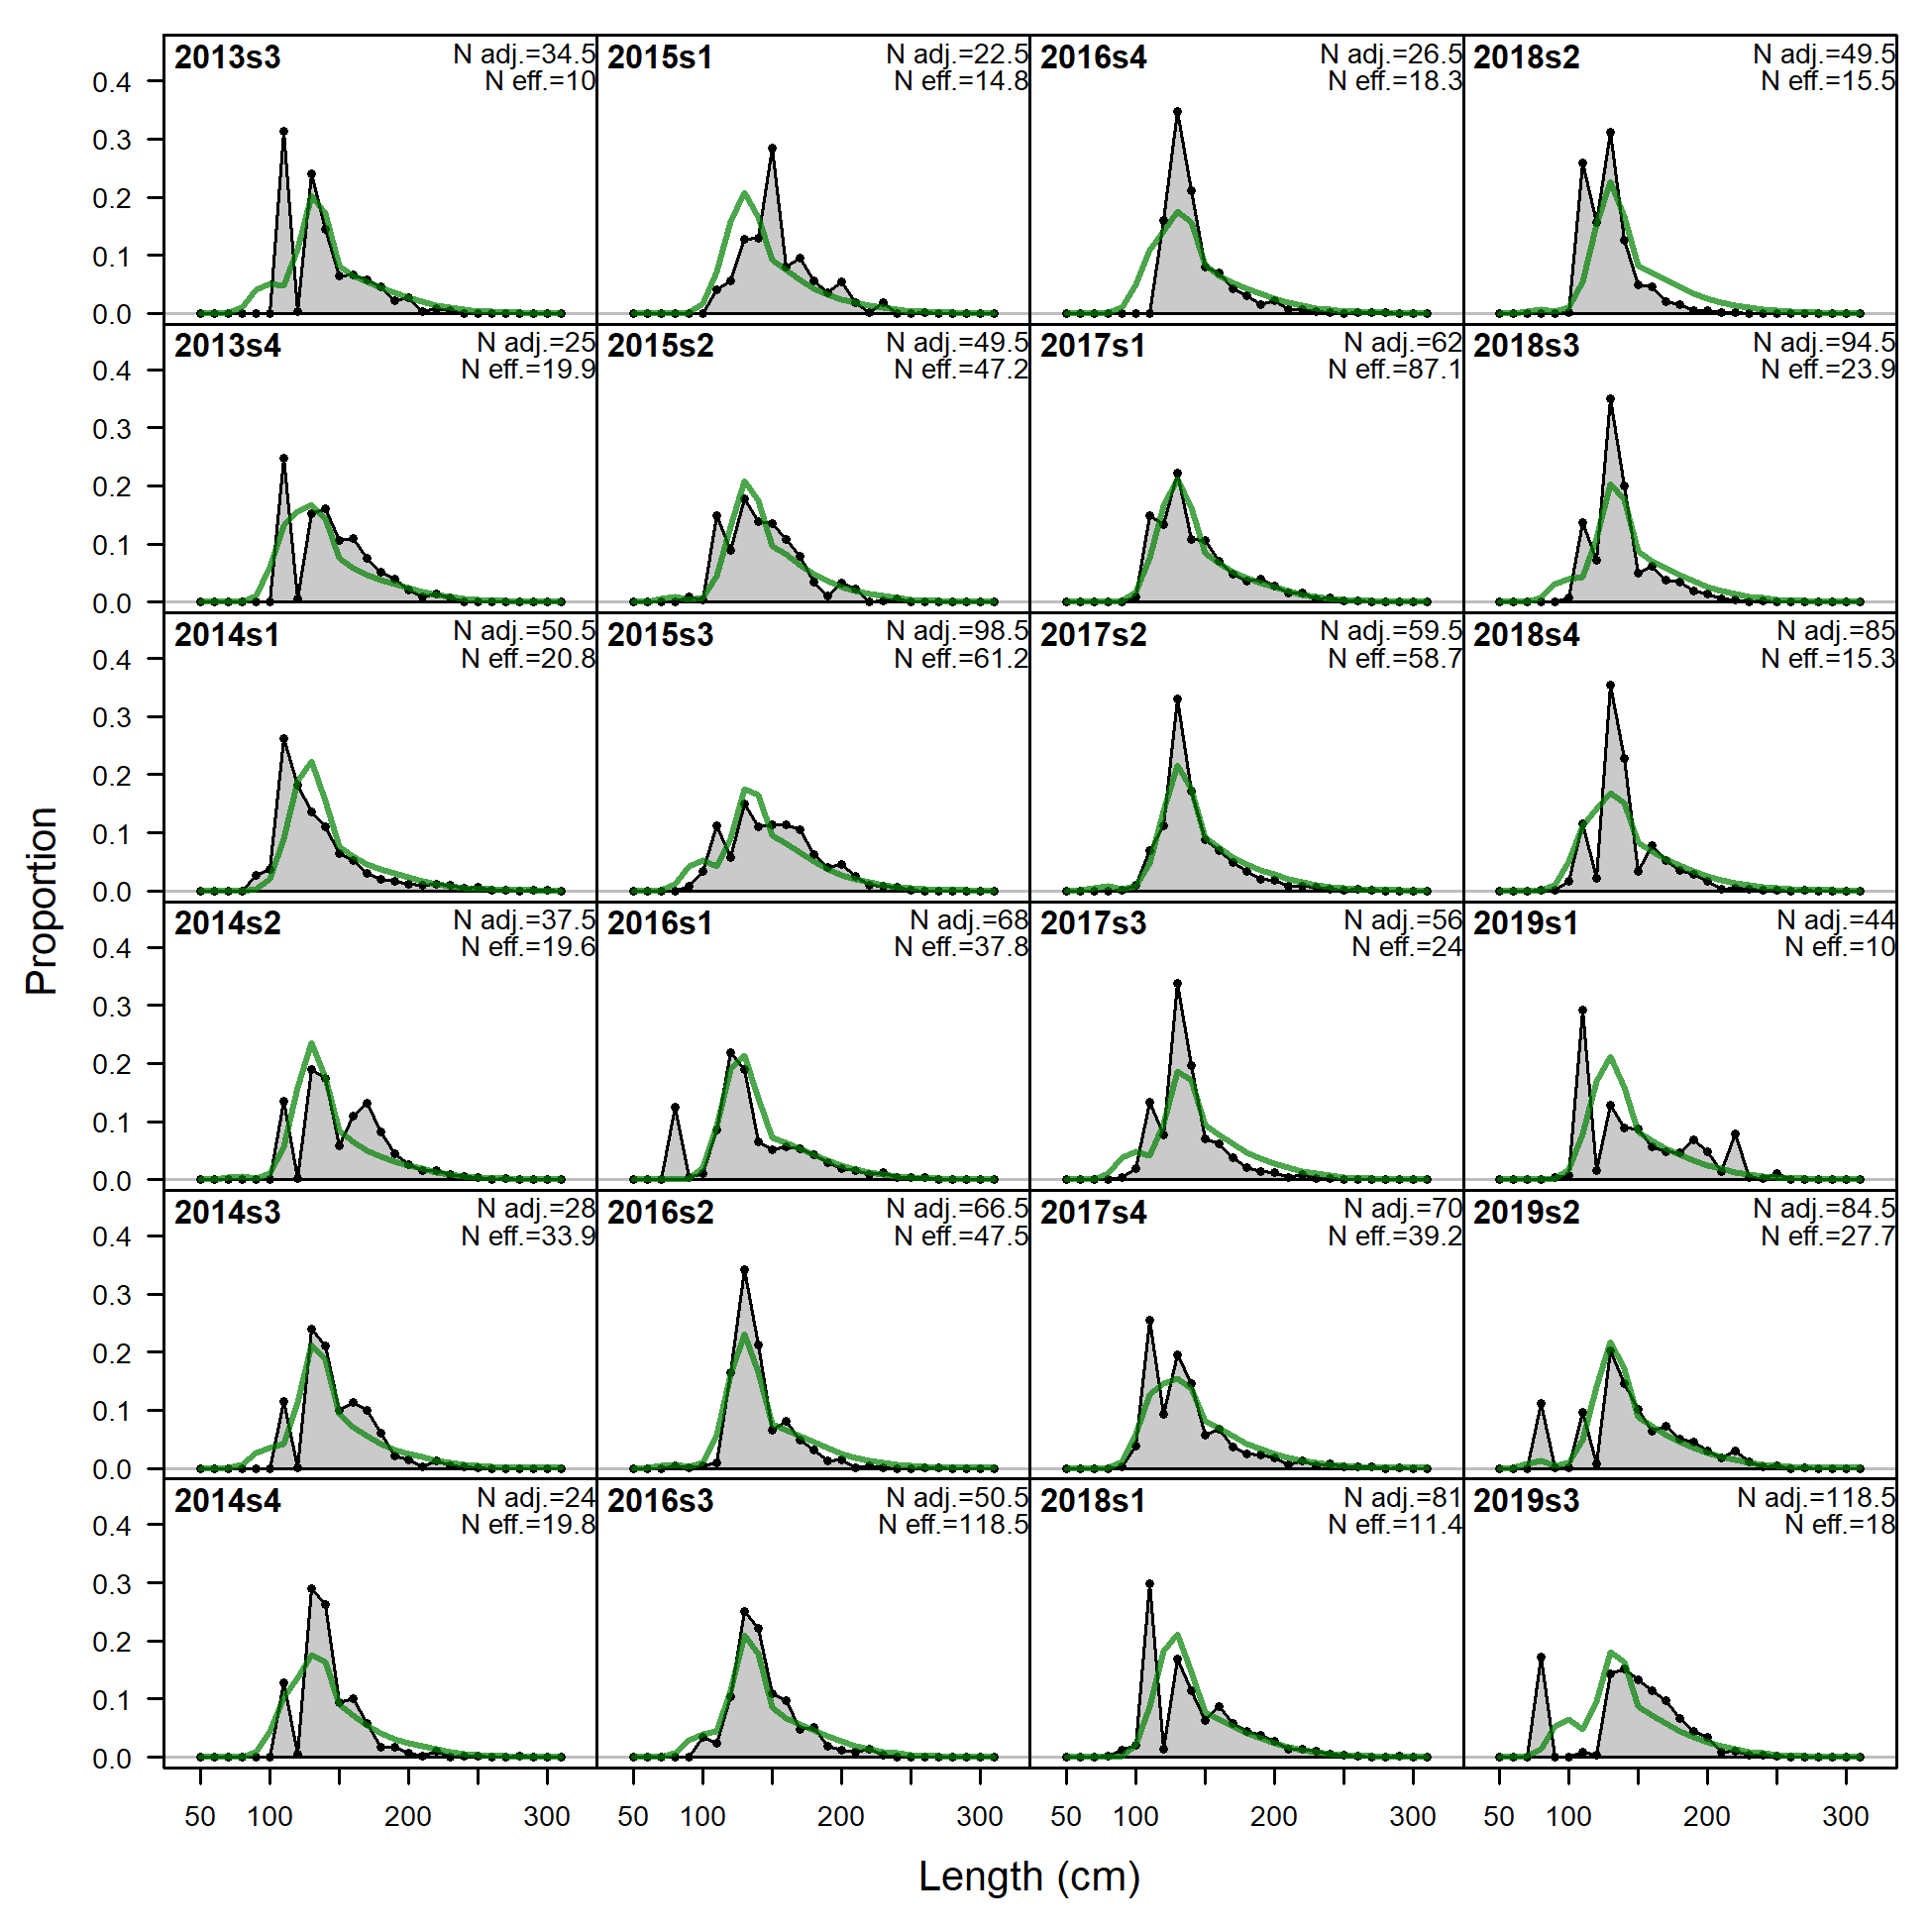
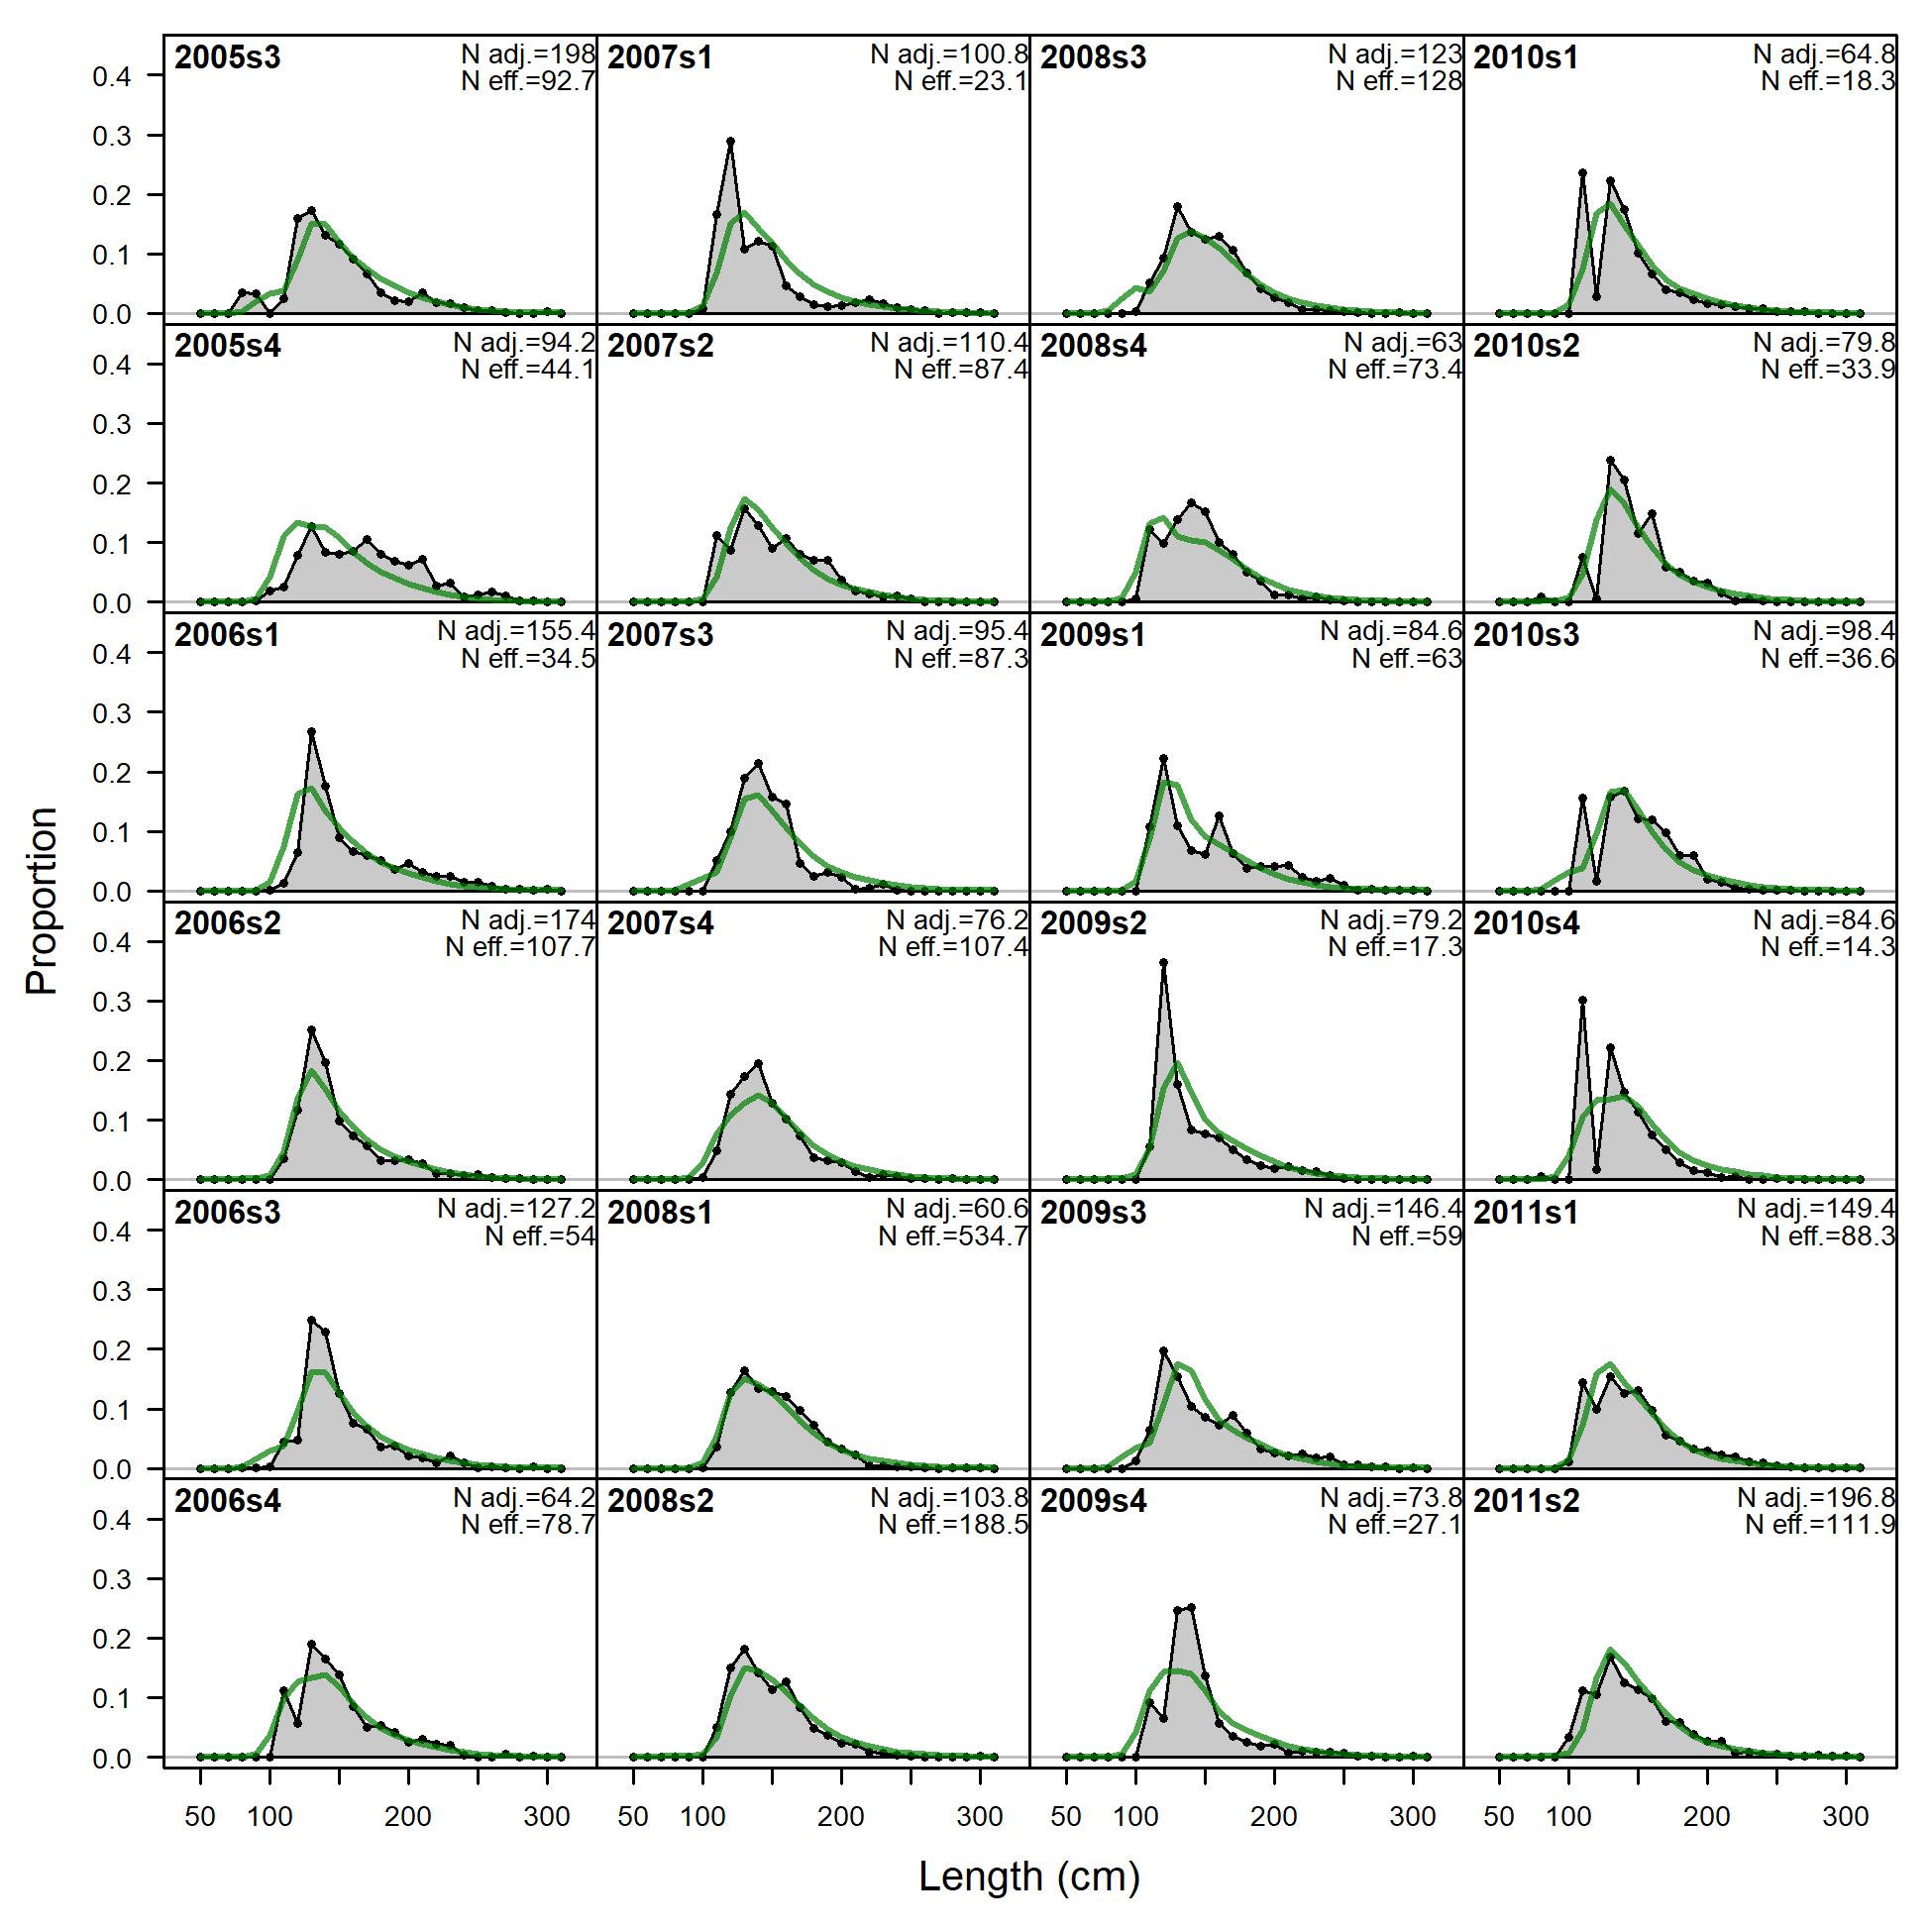
Length comps, whole catch, F8_ESP_A4 (plot 1 of 4).
'N adj.' is the input sample size after data-weighting adjustment. N eff. is the calculated effective sample size used in the McAllister-Ianelli tuning method. (plot 2 of 4) (plot 3 of 4)
file: comp_lenfit_flt8mkt0_page3.png
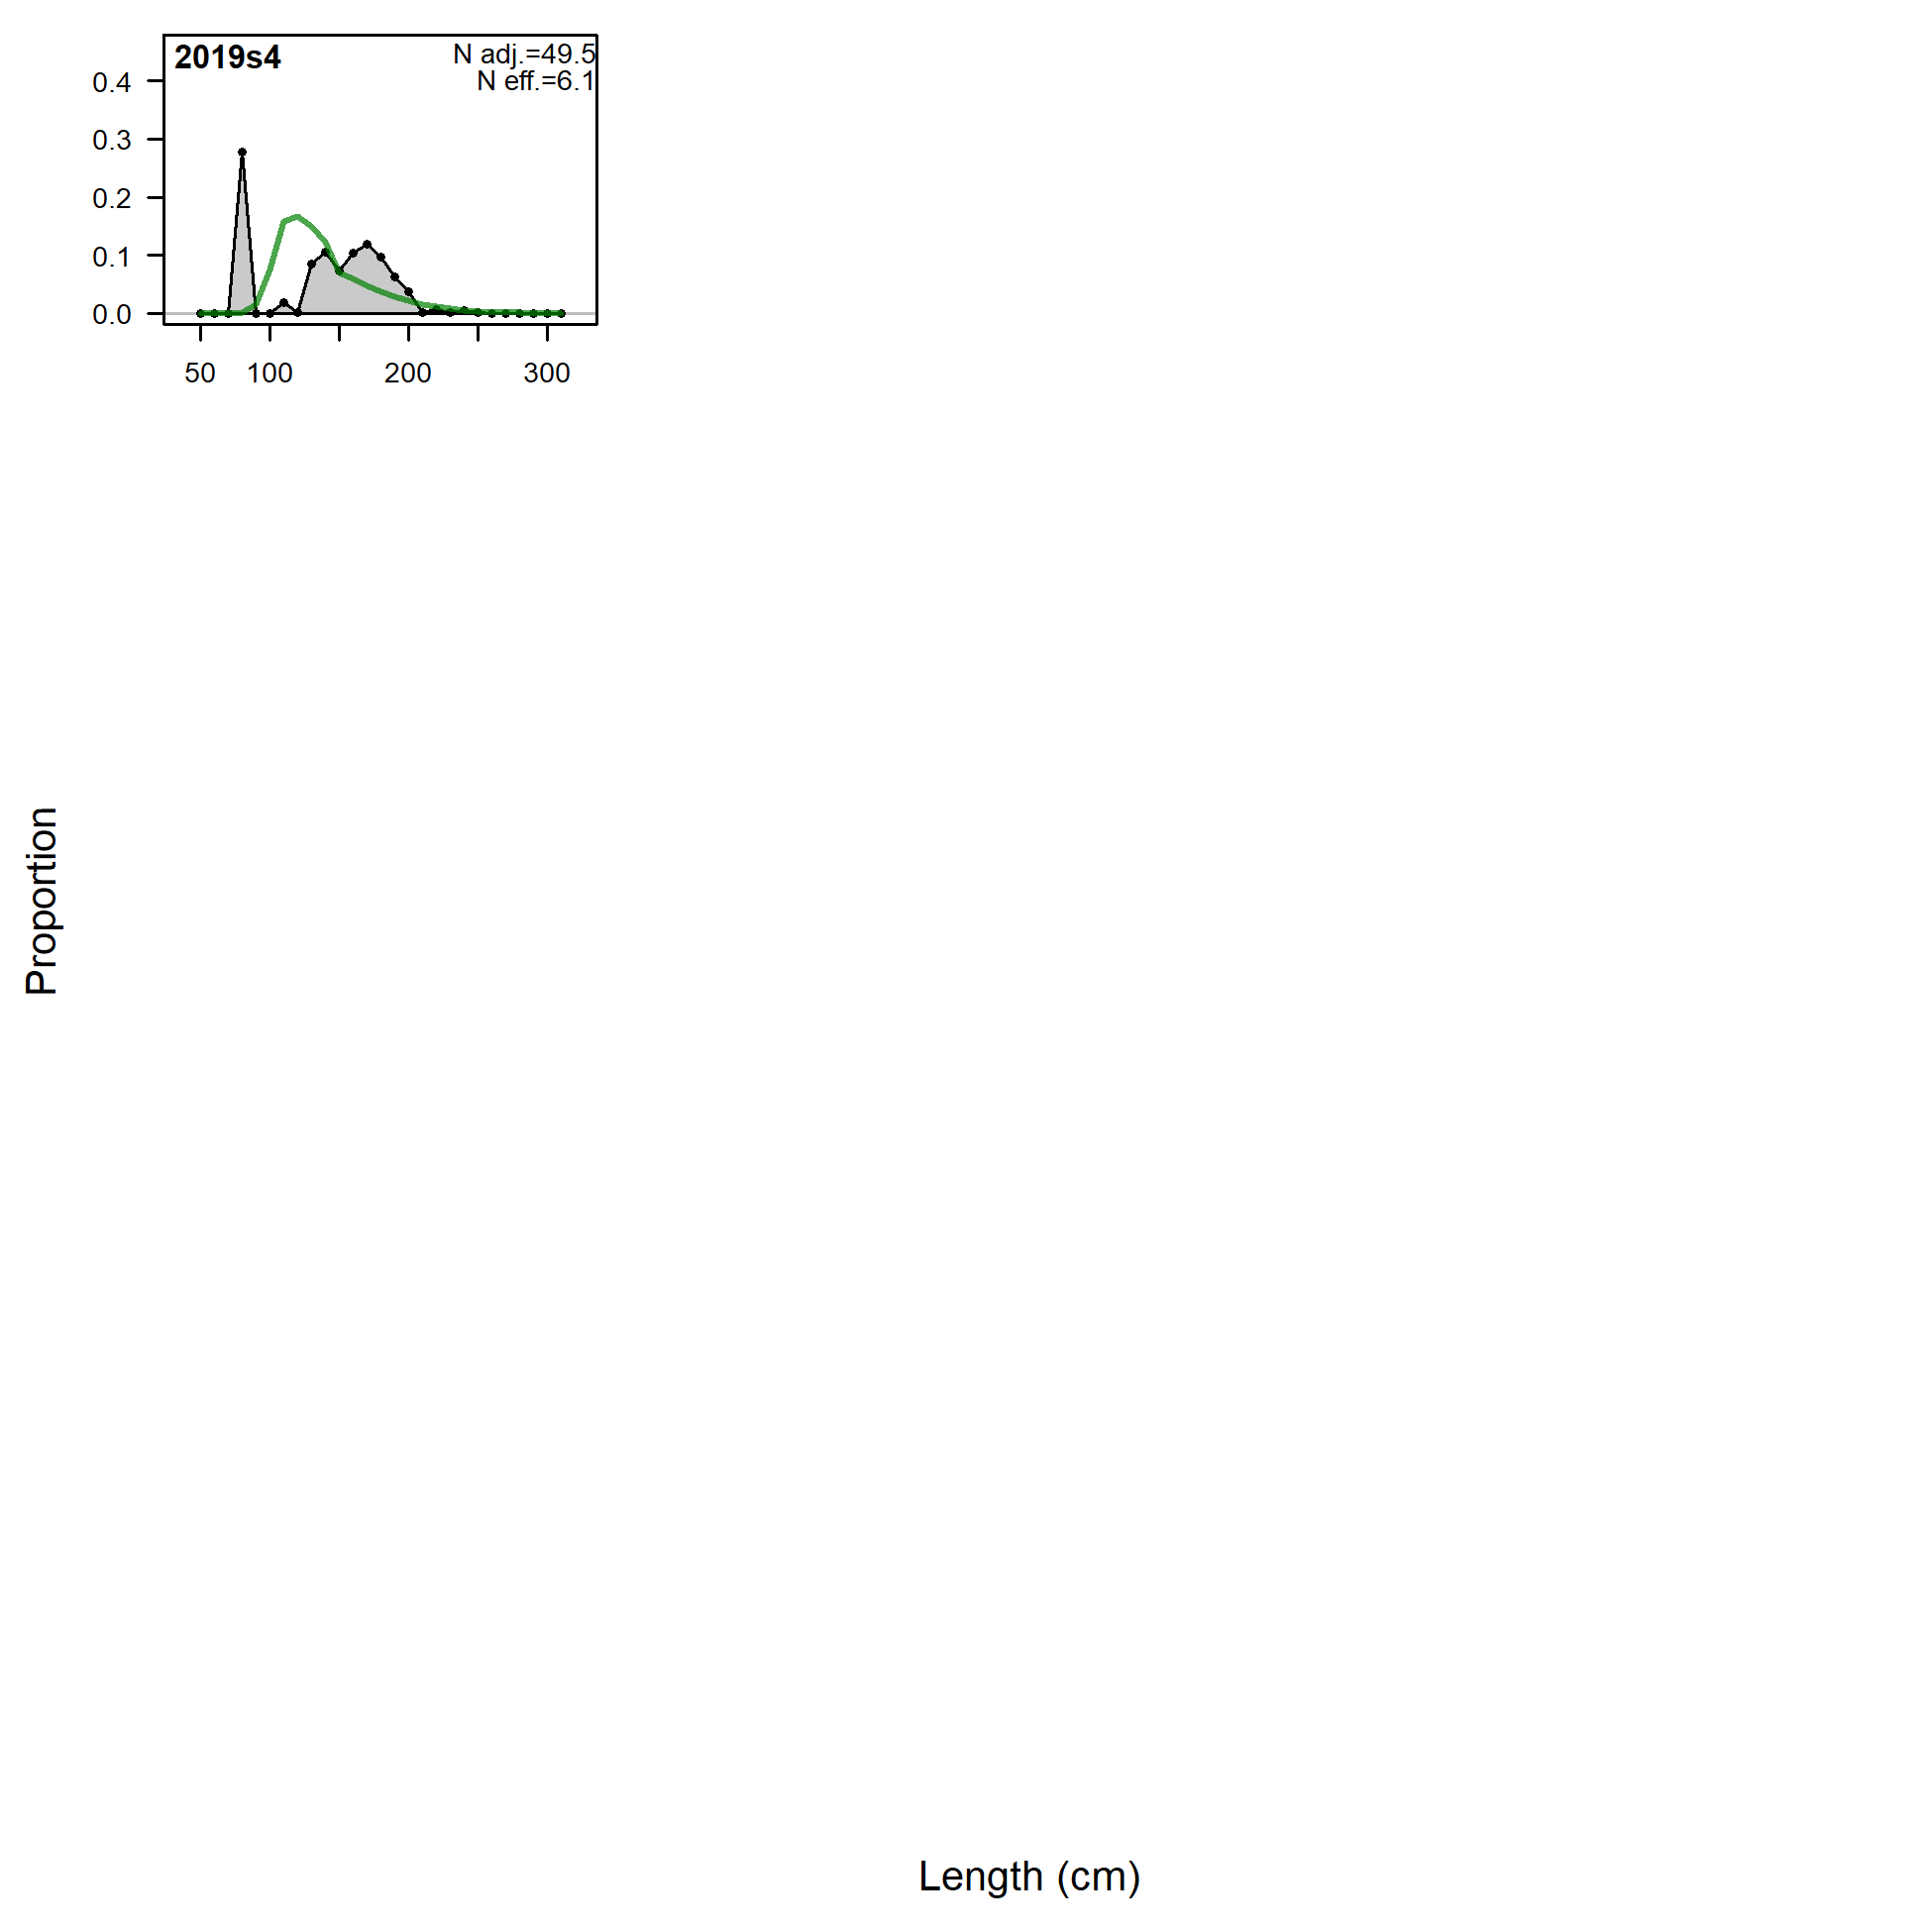
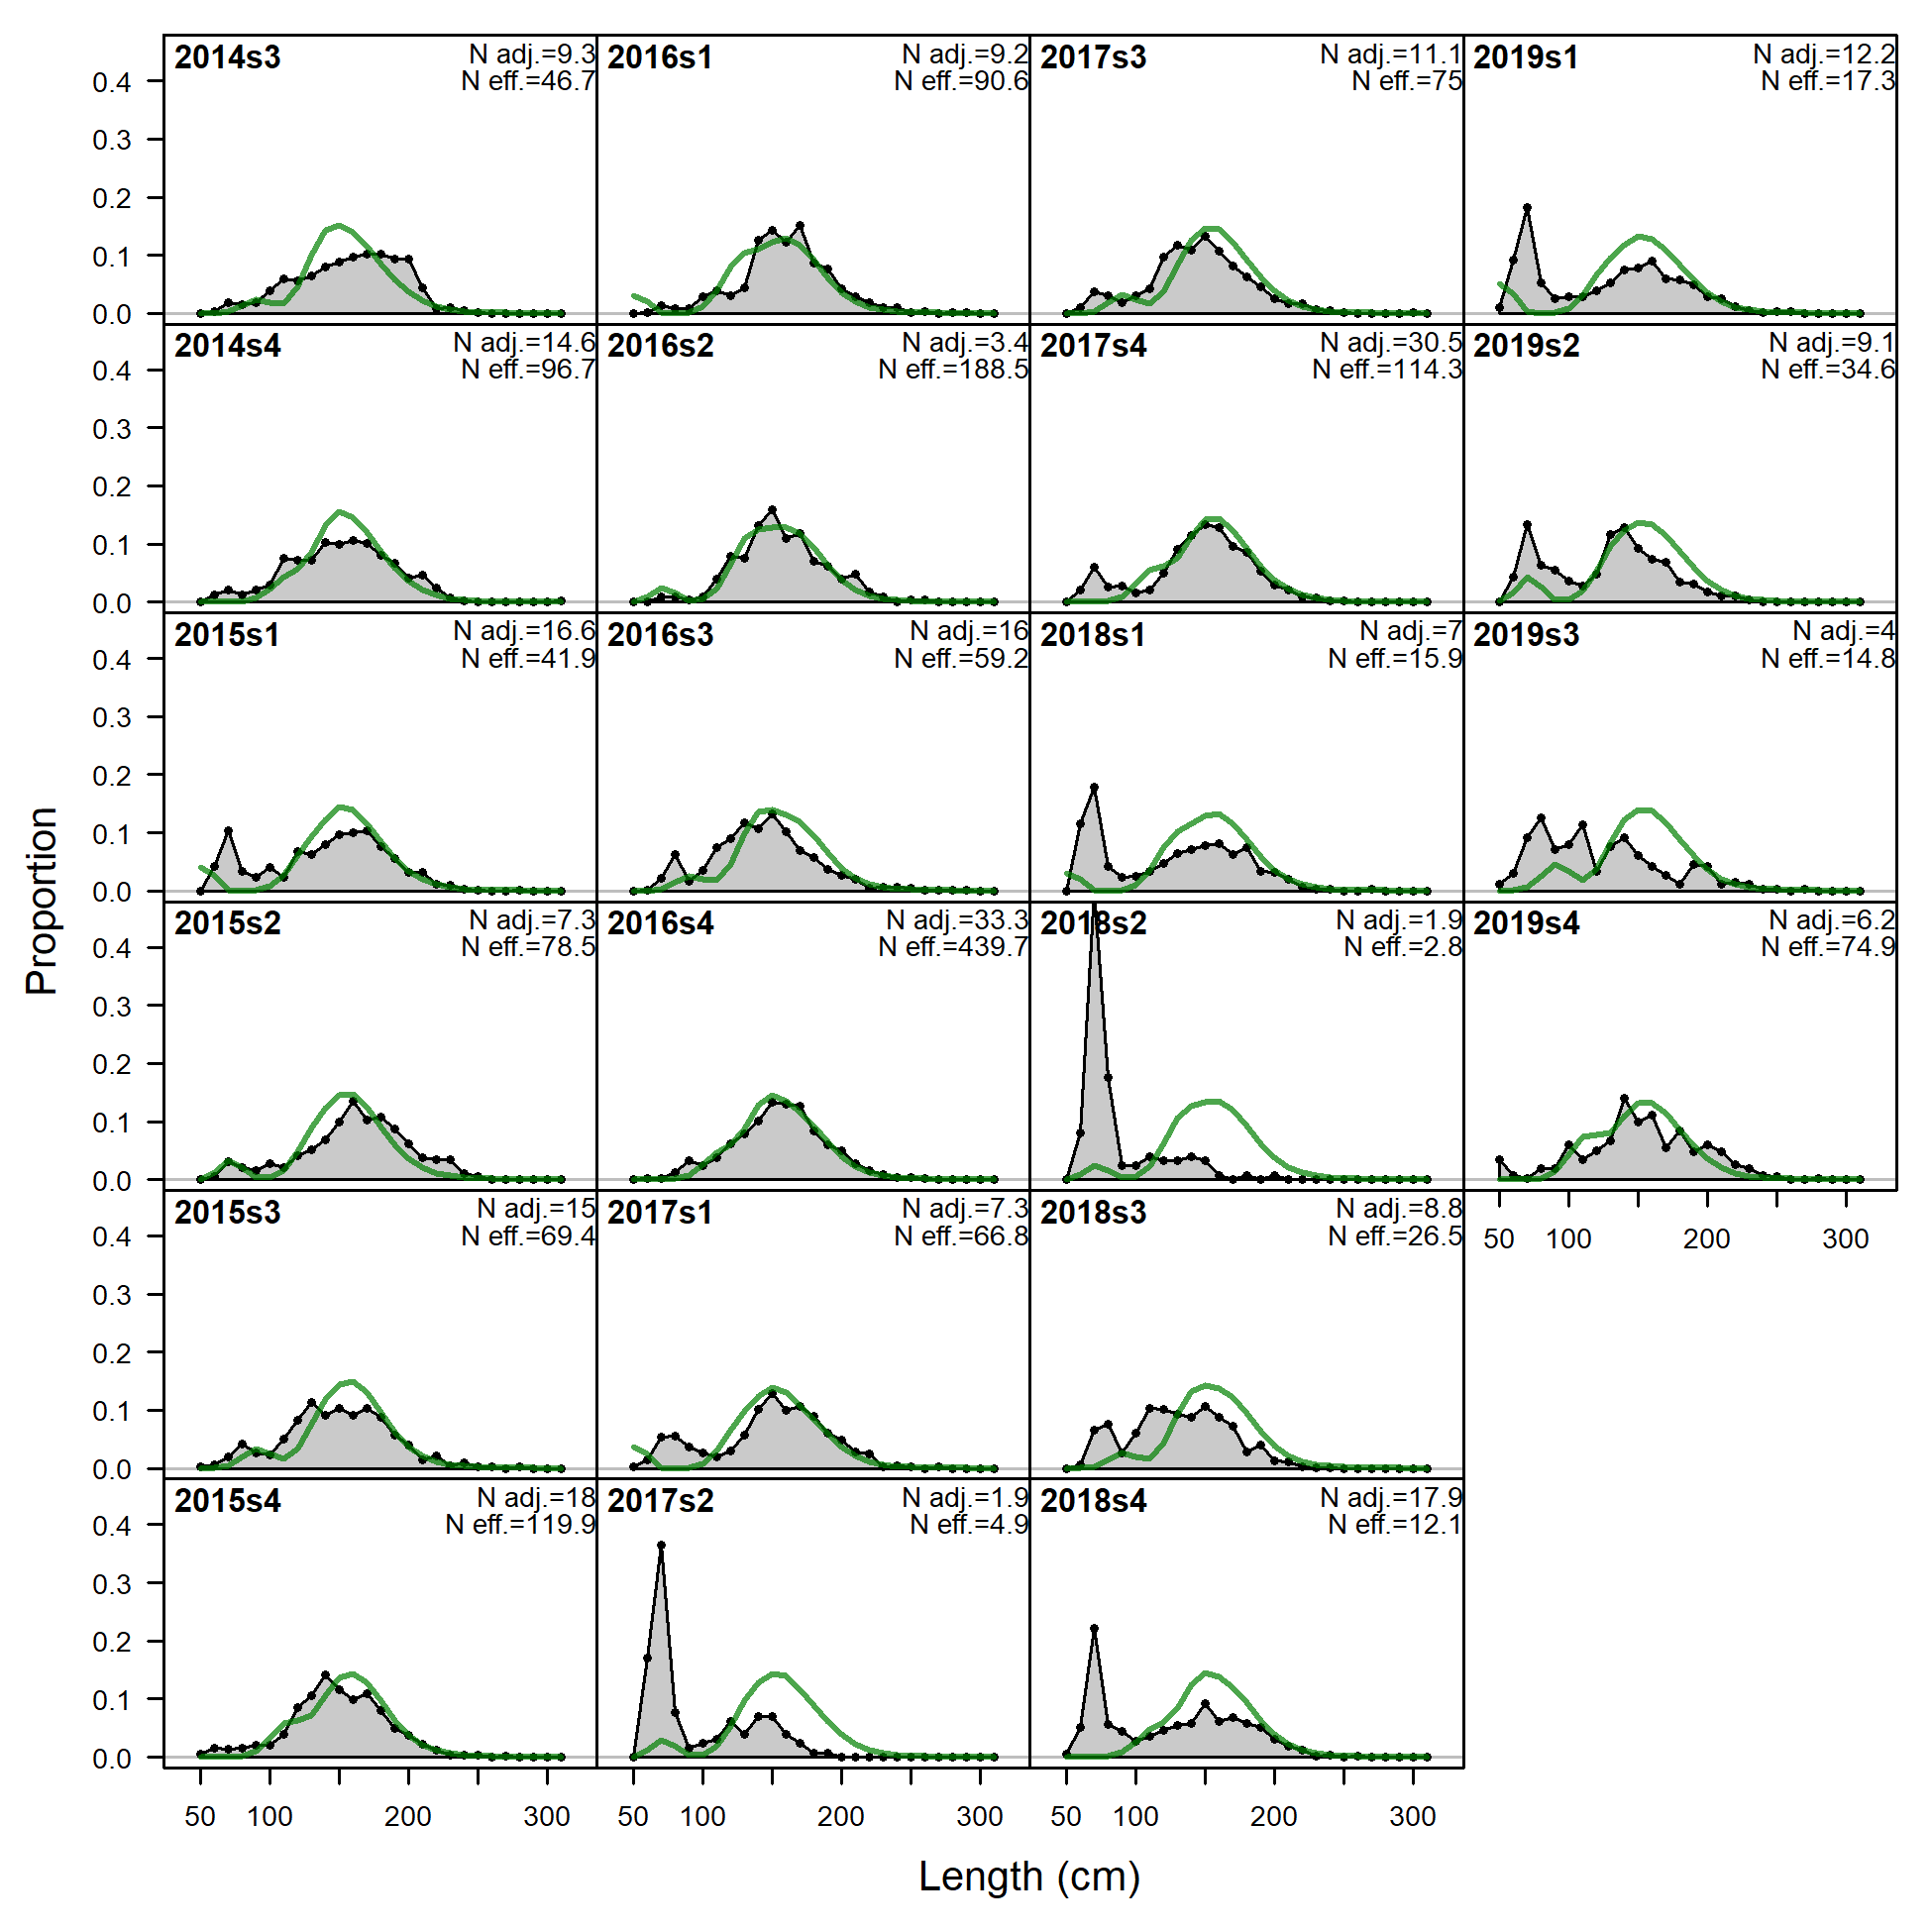
Length comps, whole catch, F8_ESP_A4 (plot 1 of 4).
'N adj.' is the input sample size after data-weighting adjustment. N eff. is the calculated effective sample size used in the McAllister-Ianelli tuning method. (plot 2 of 4) (plot 3 of 4) (plot 4 of 4)
file: comp_lenfit_flt8mkt0_page4.png
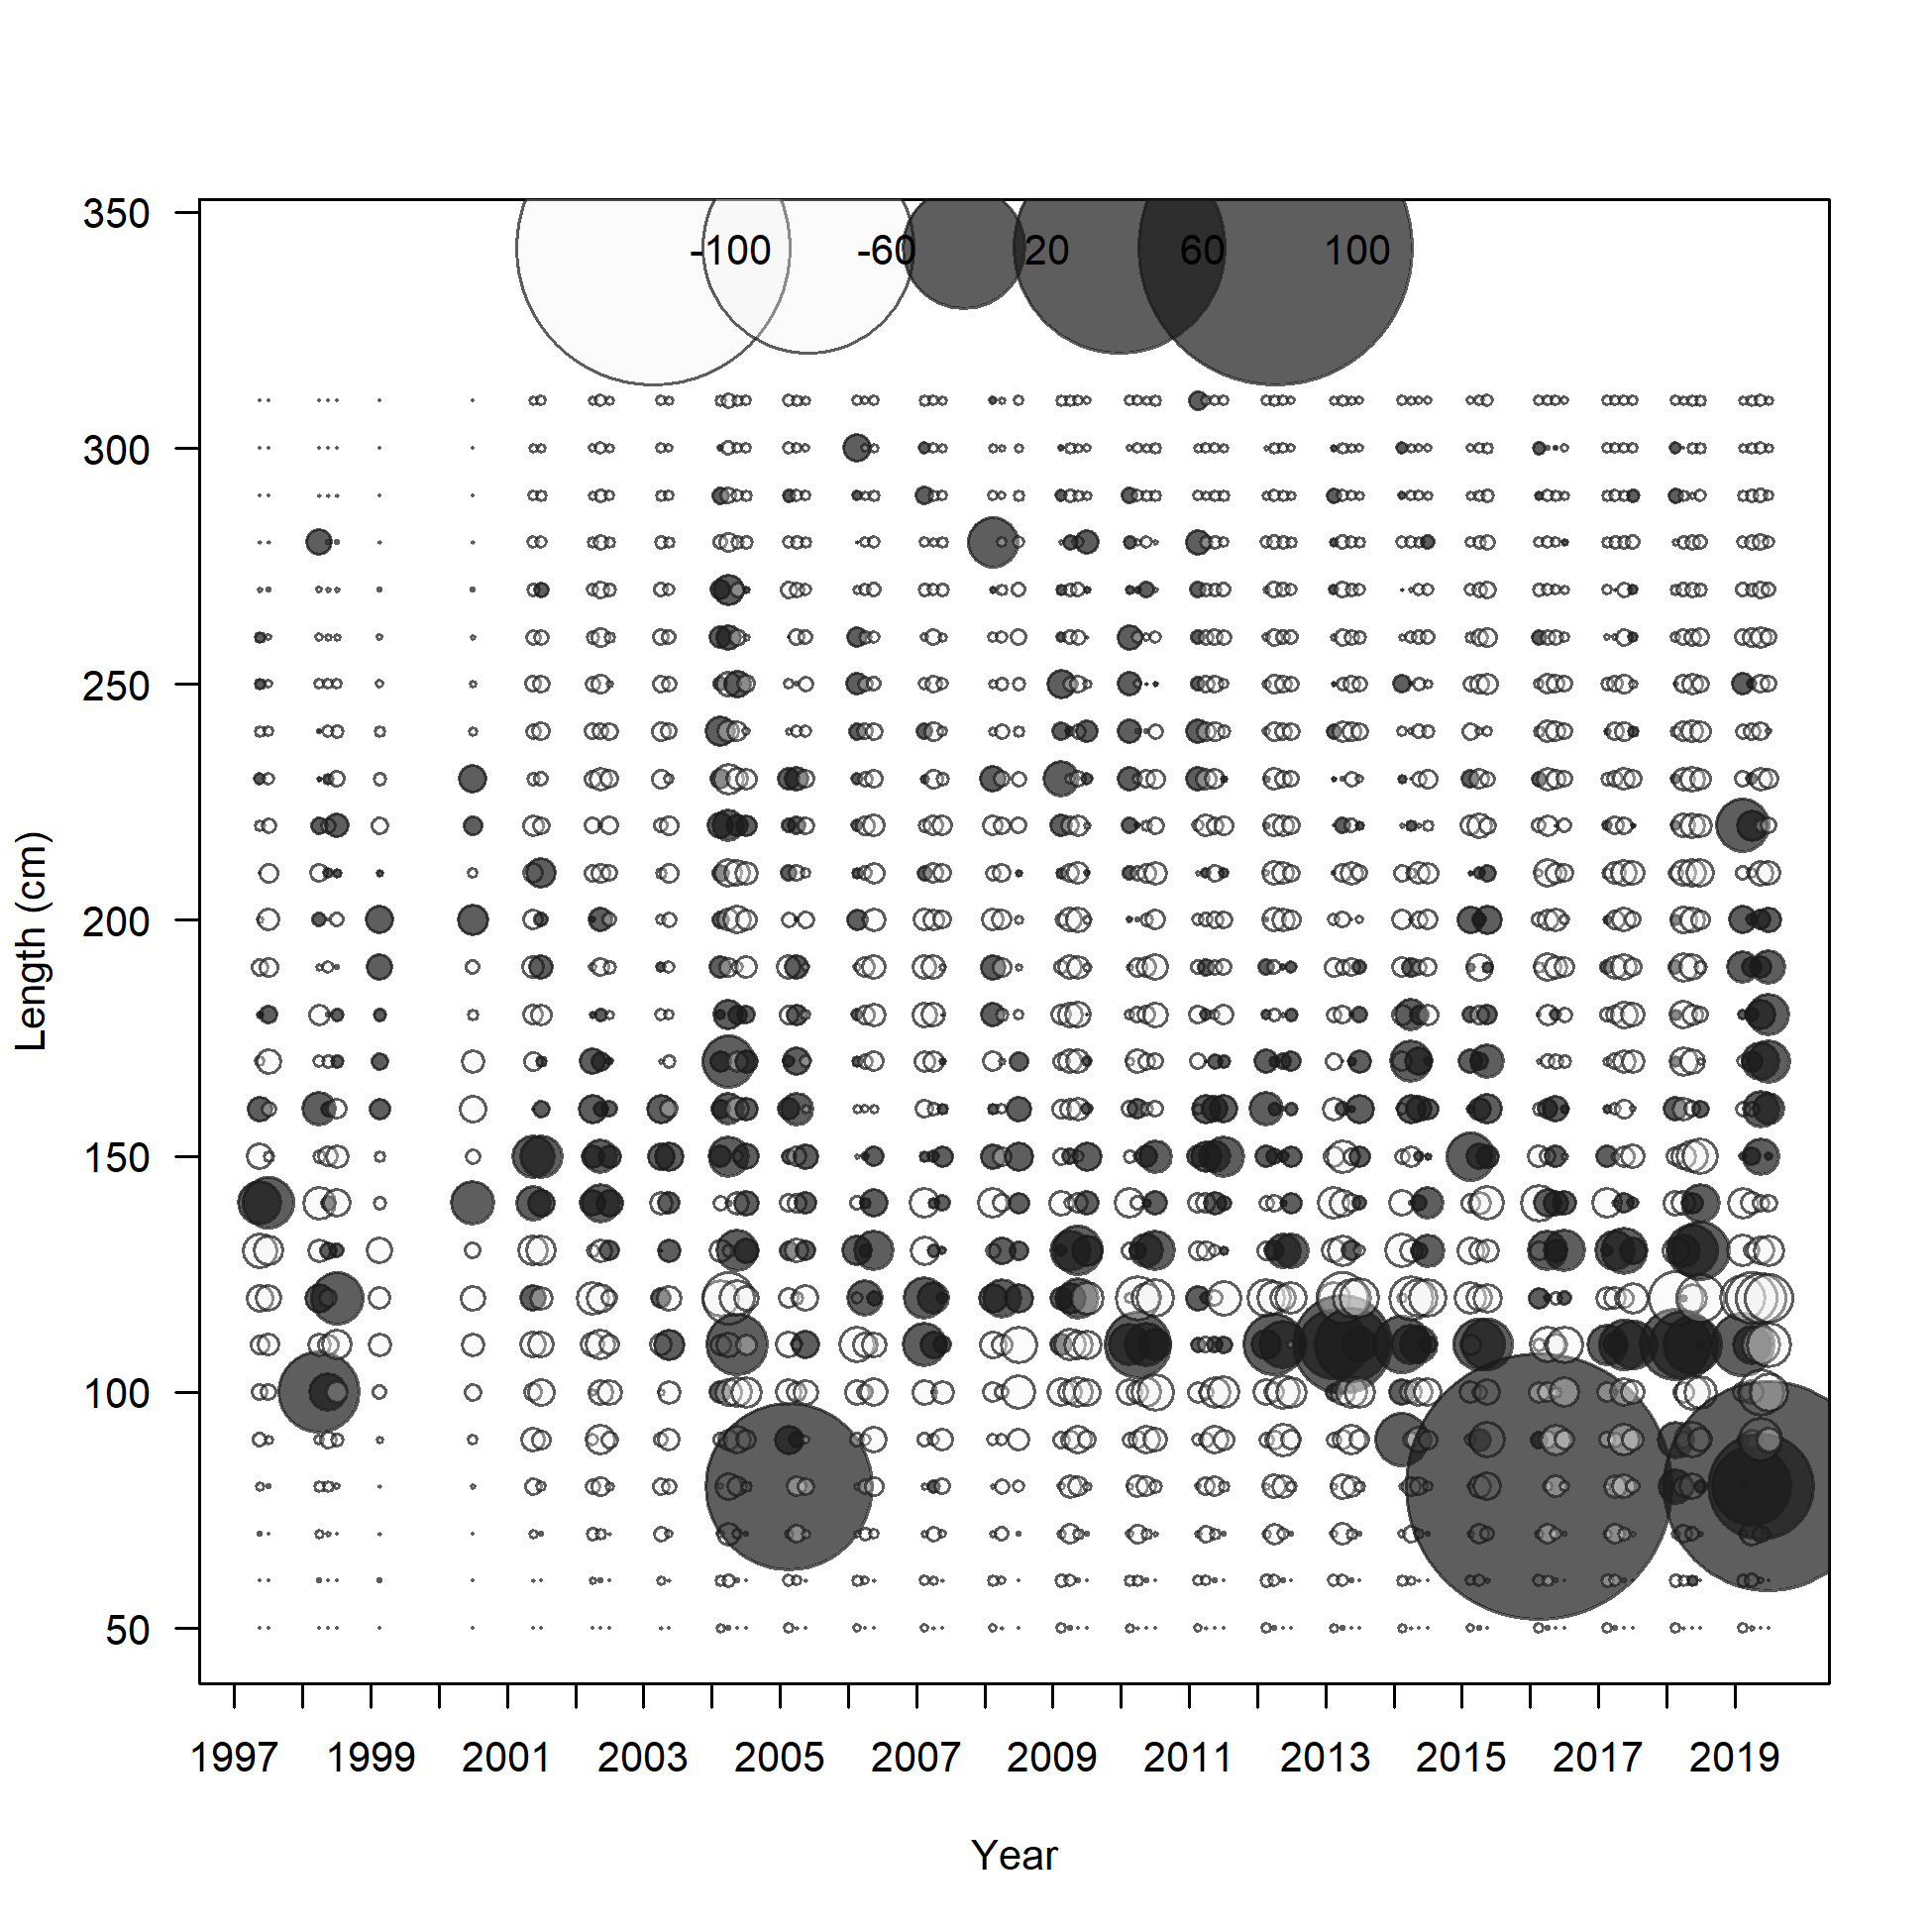
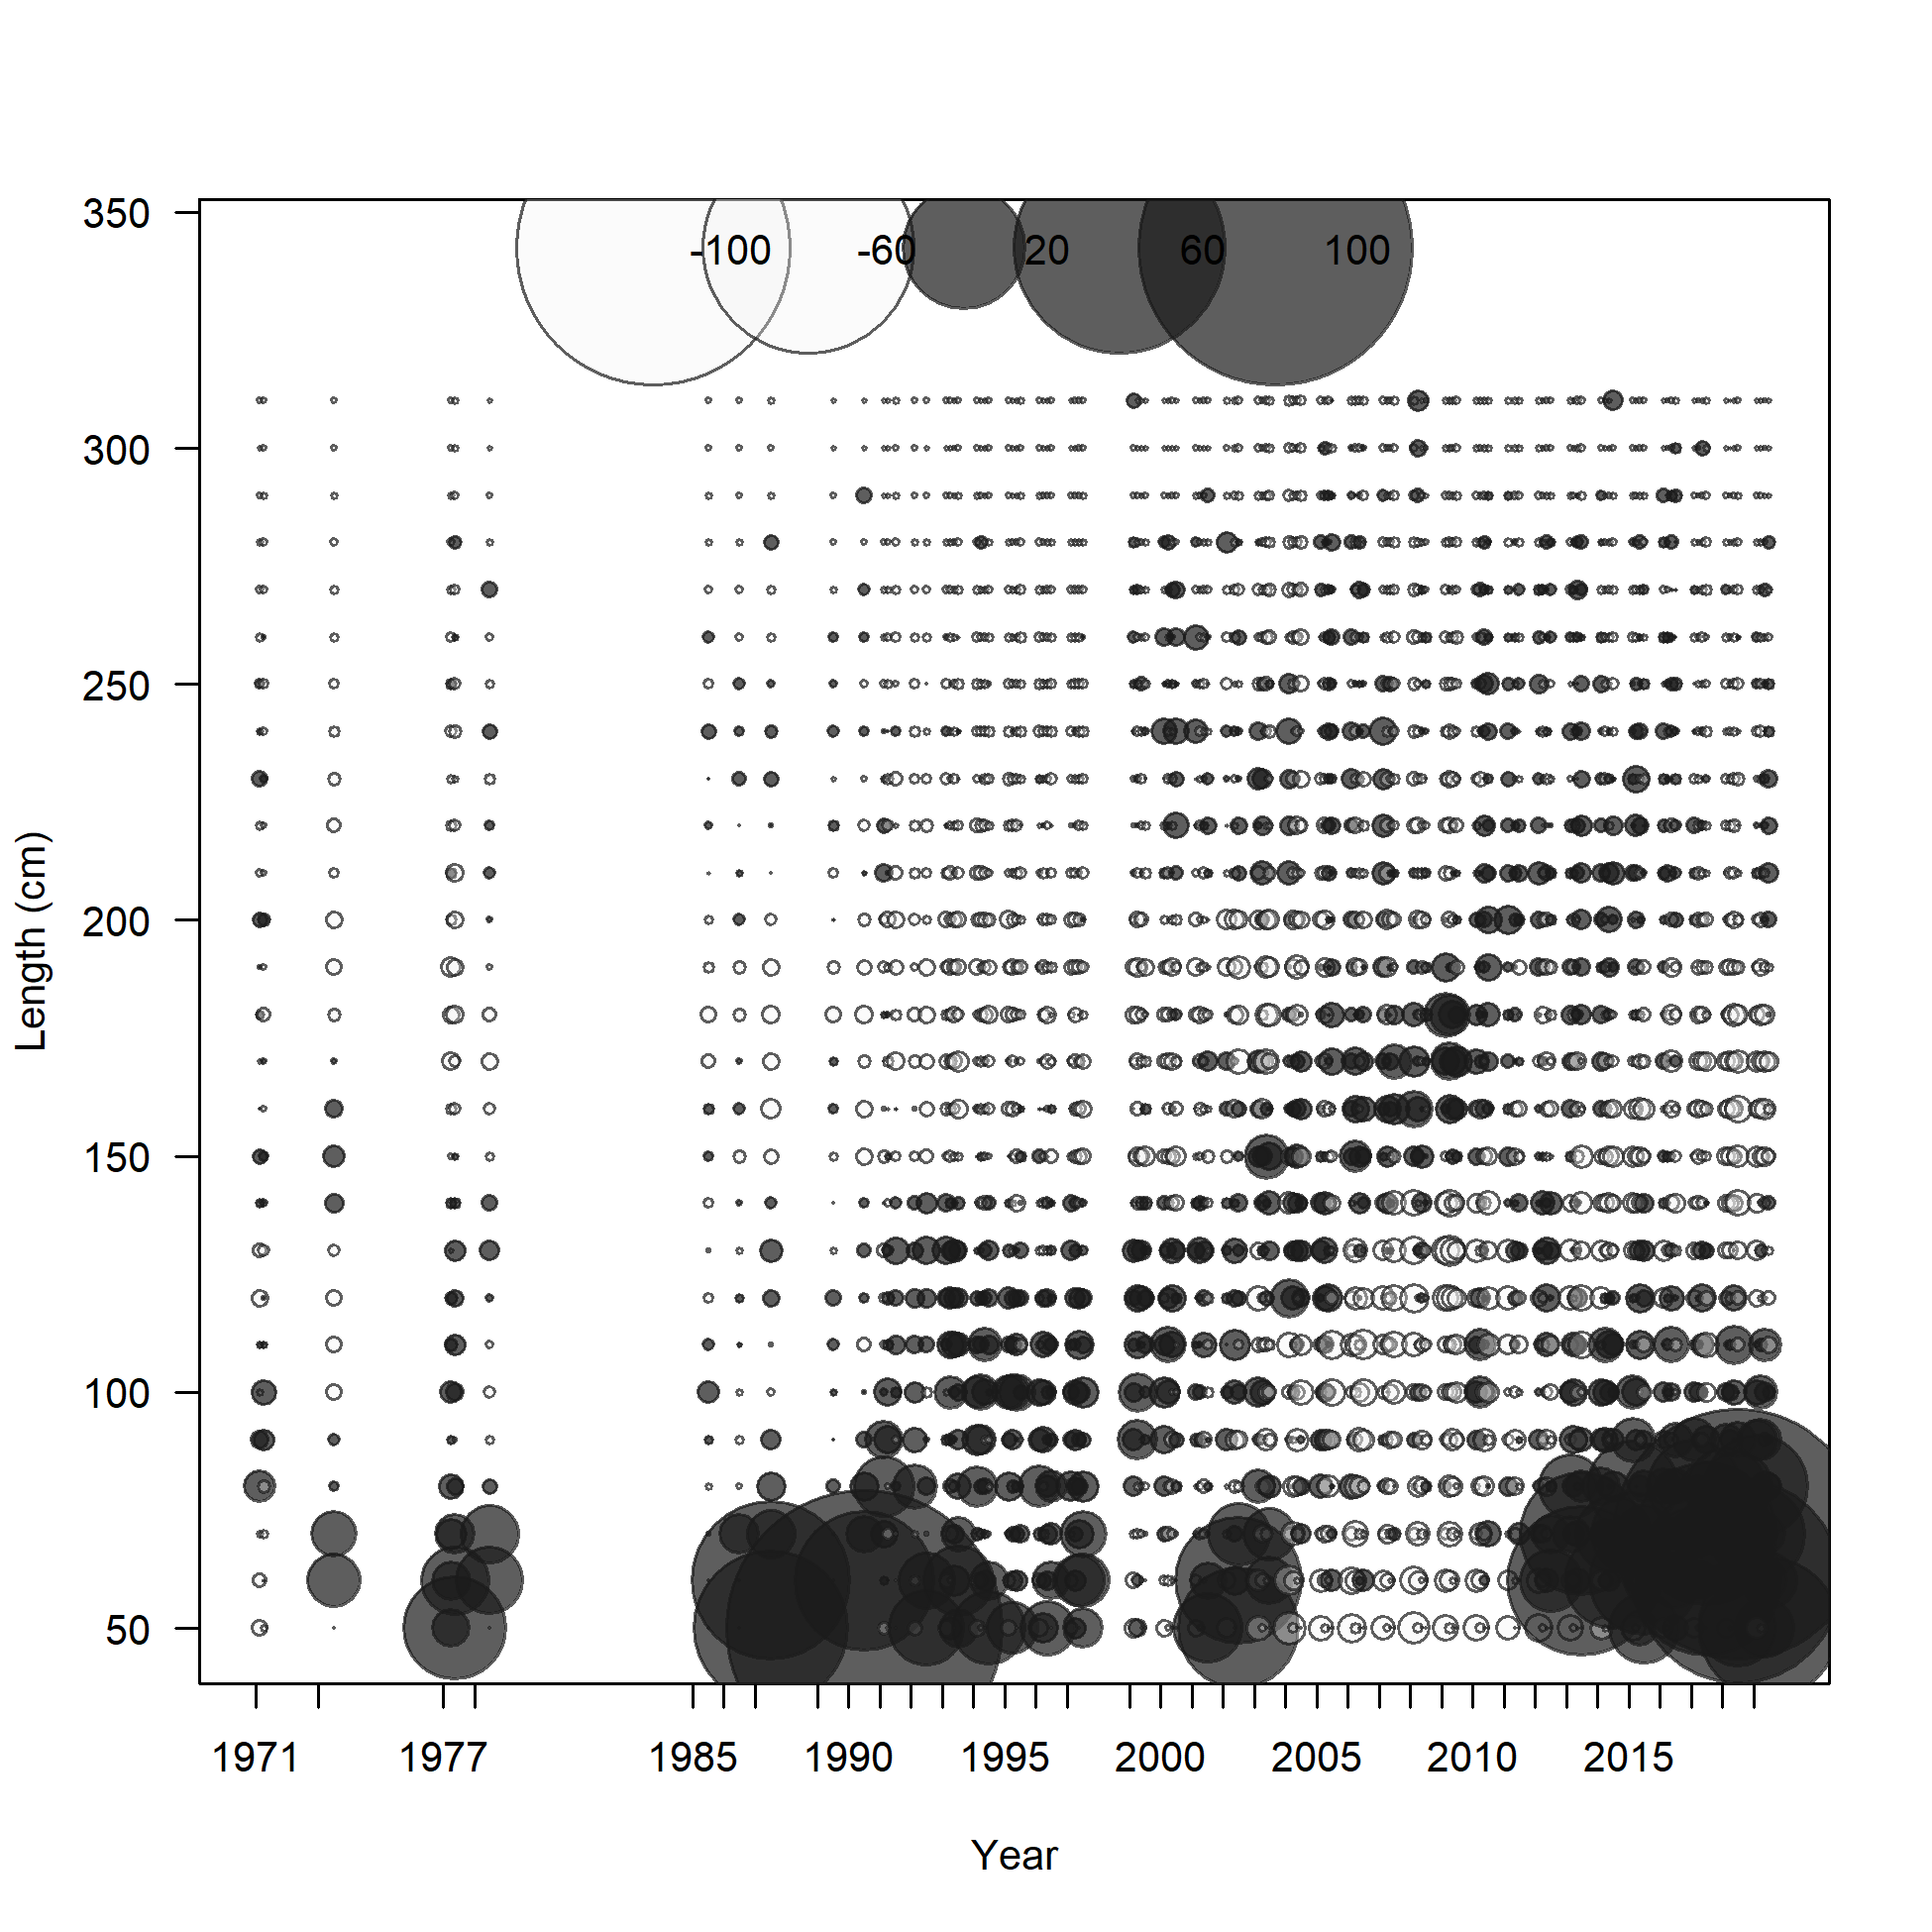
Pearson residuals, whole catch, F8_ESP_A4 (max=94.31) (plot 4 of 4)
Closed bubbles are positive residuals (observed > expected) and open bubbles are negative residuals (observed < expected).
file: comp_lenfit_residsflt8mkt0_page4.png
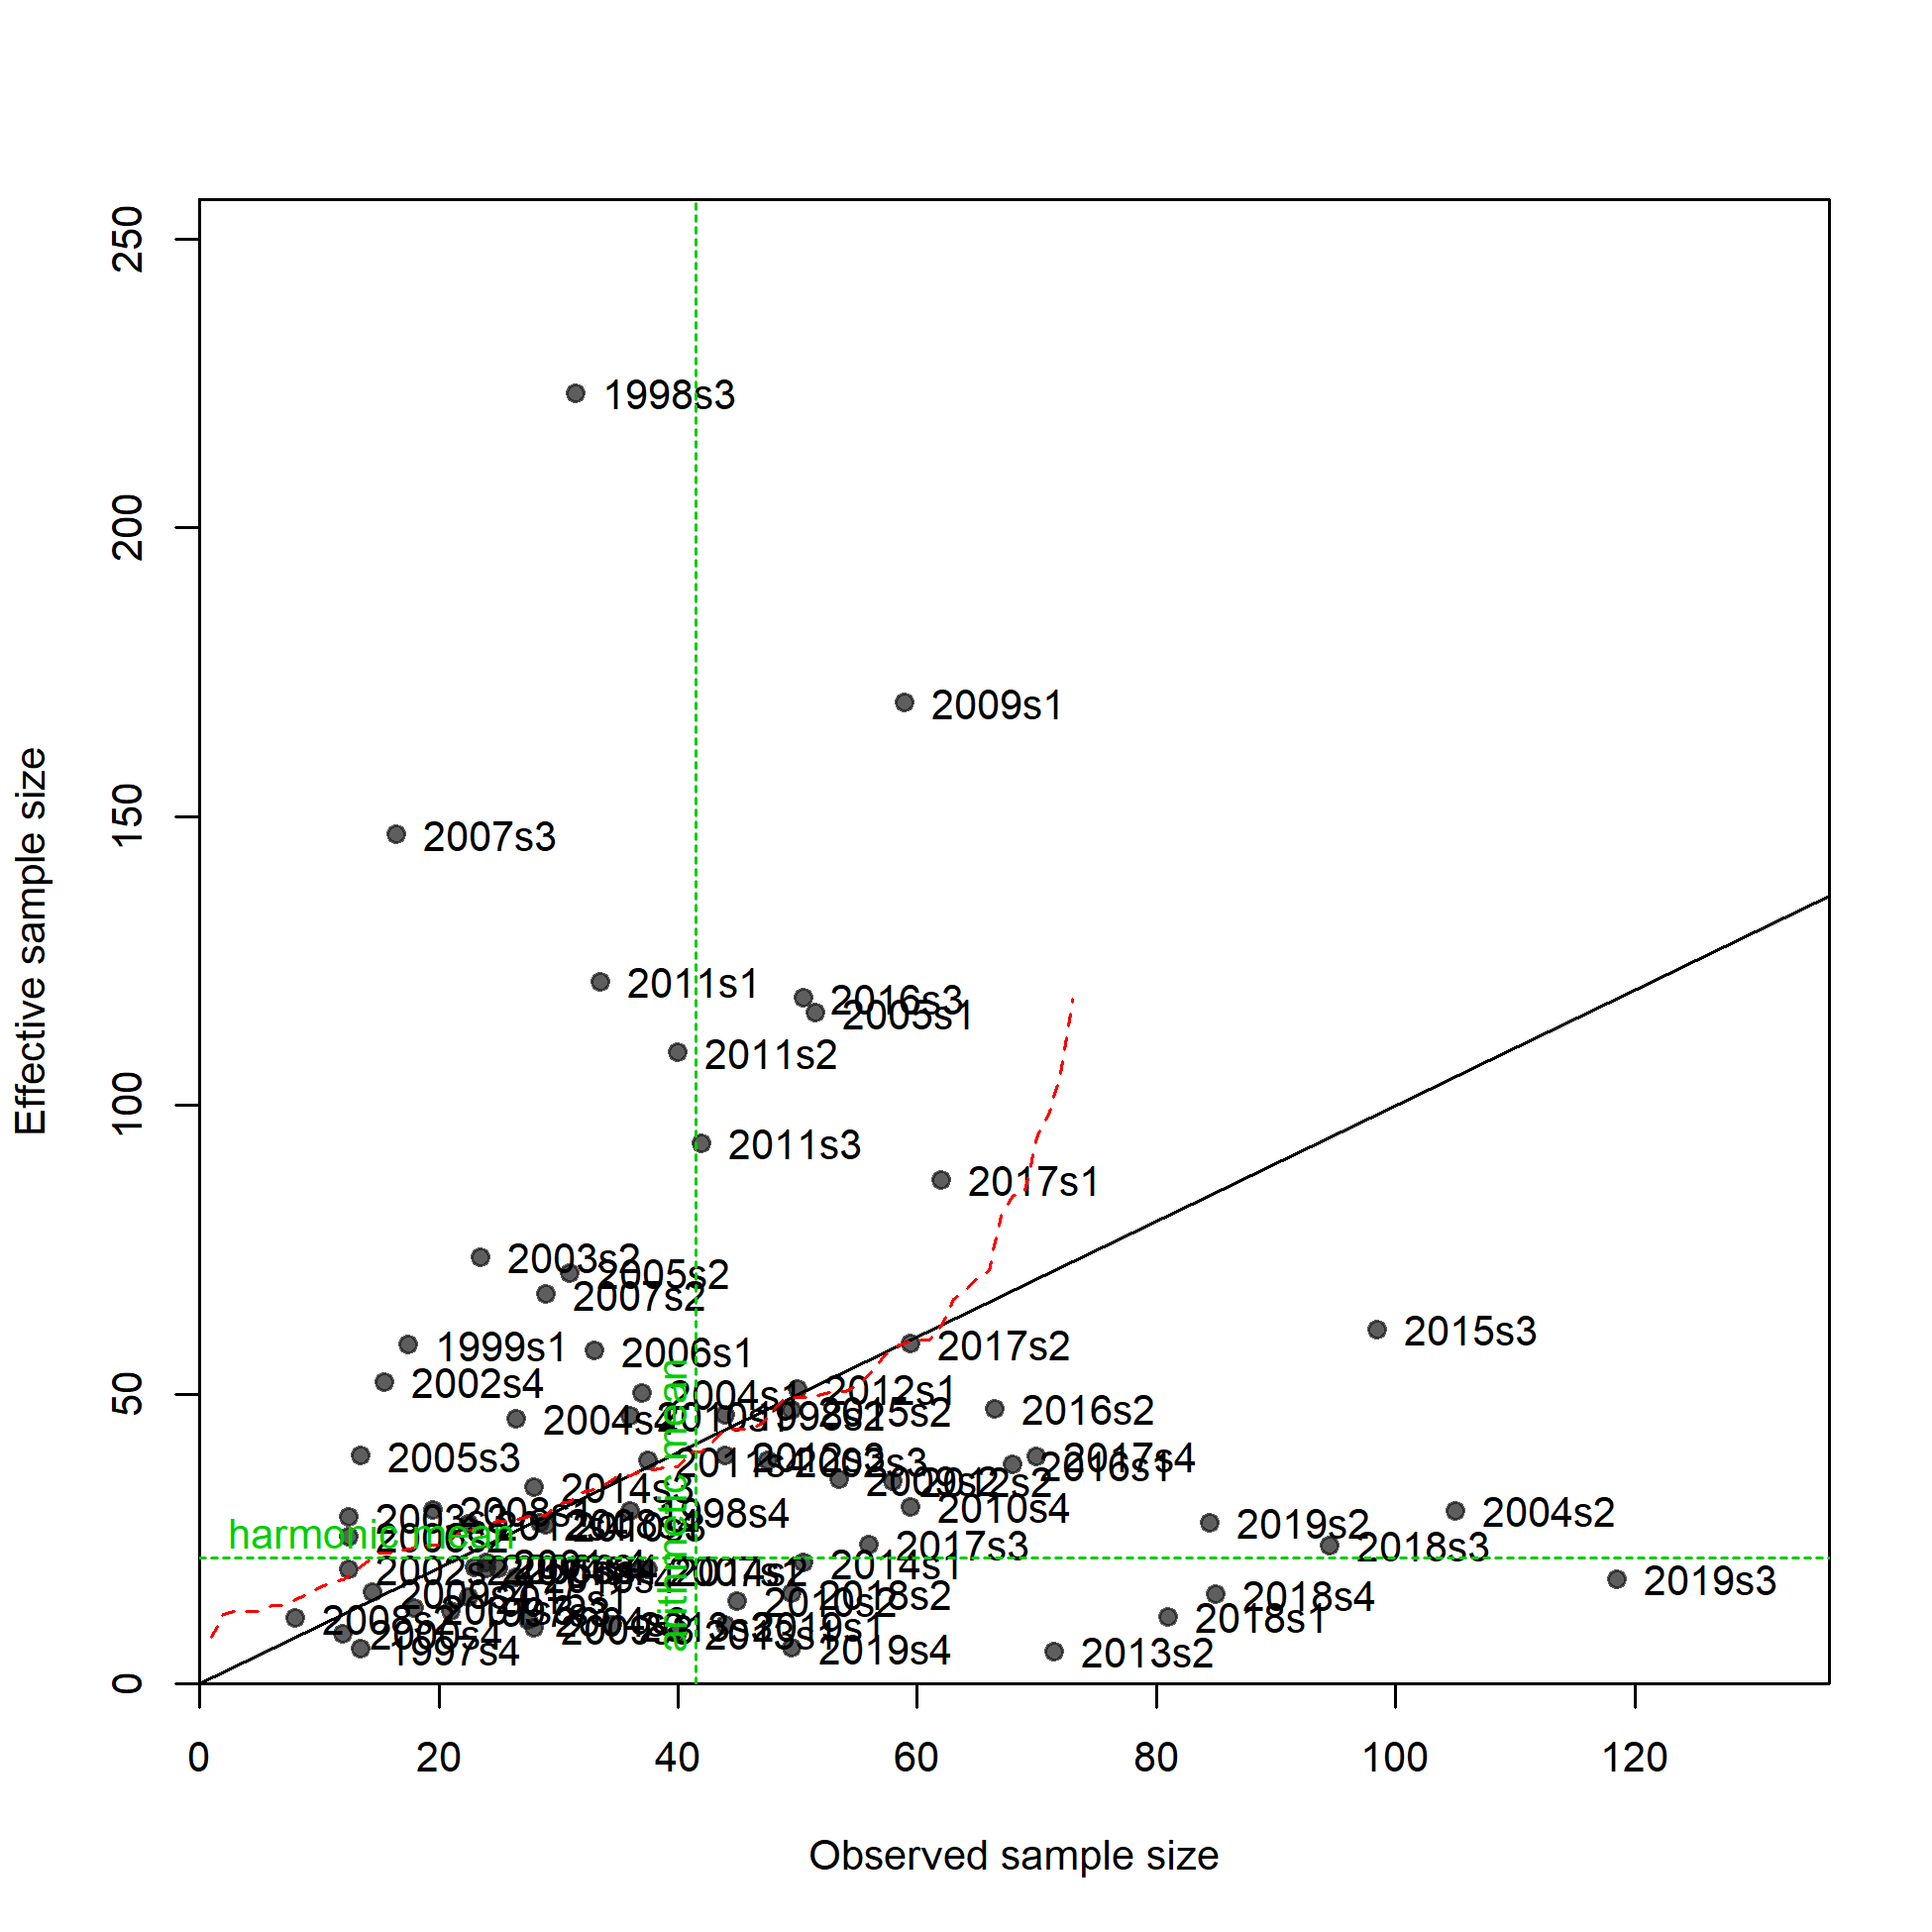
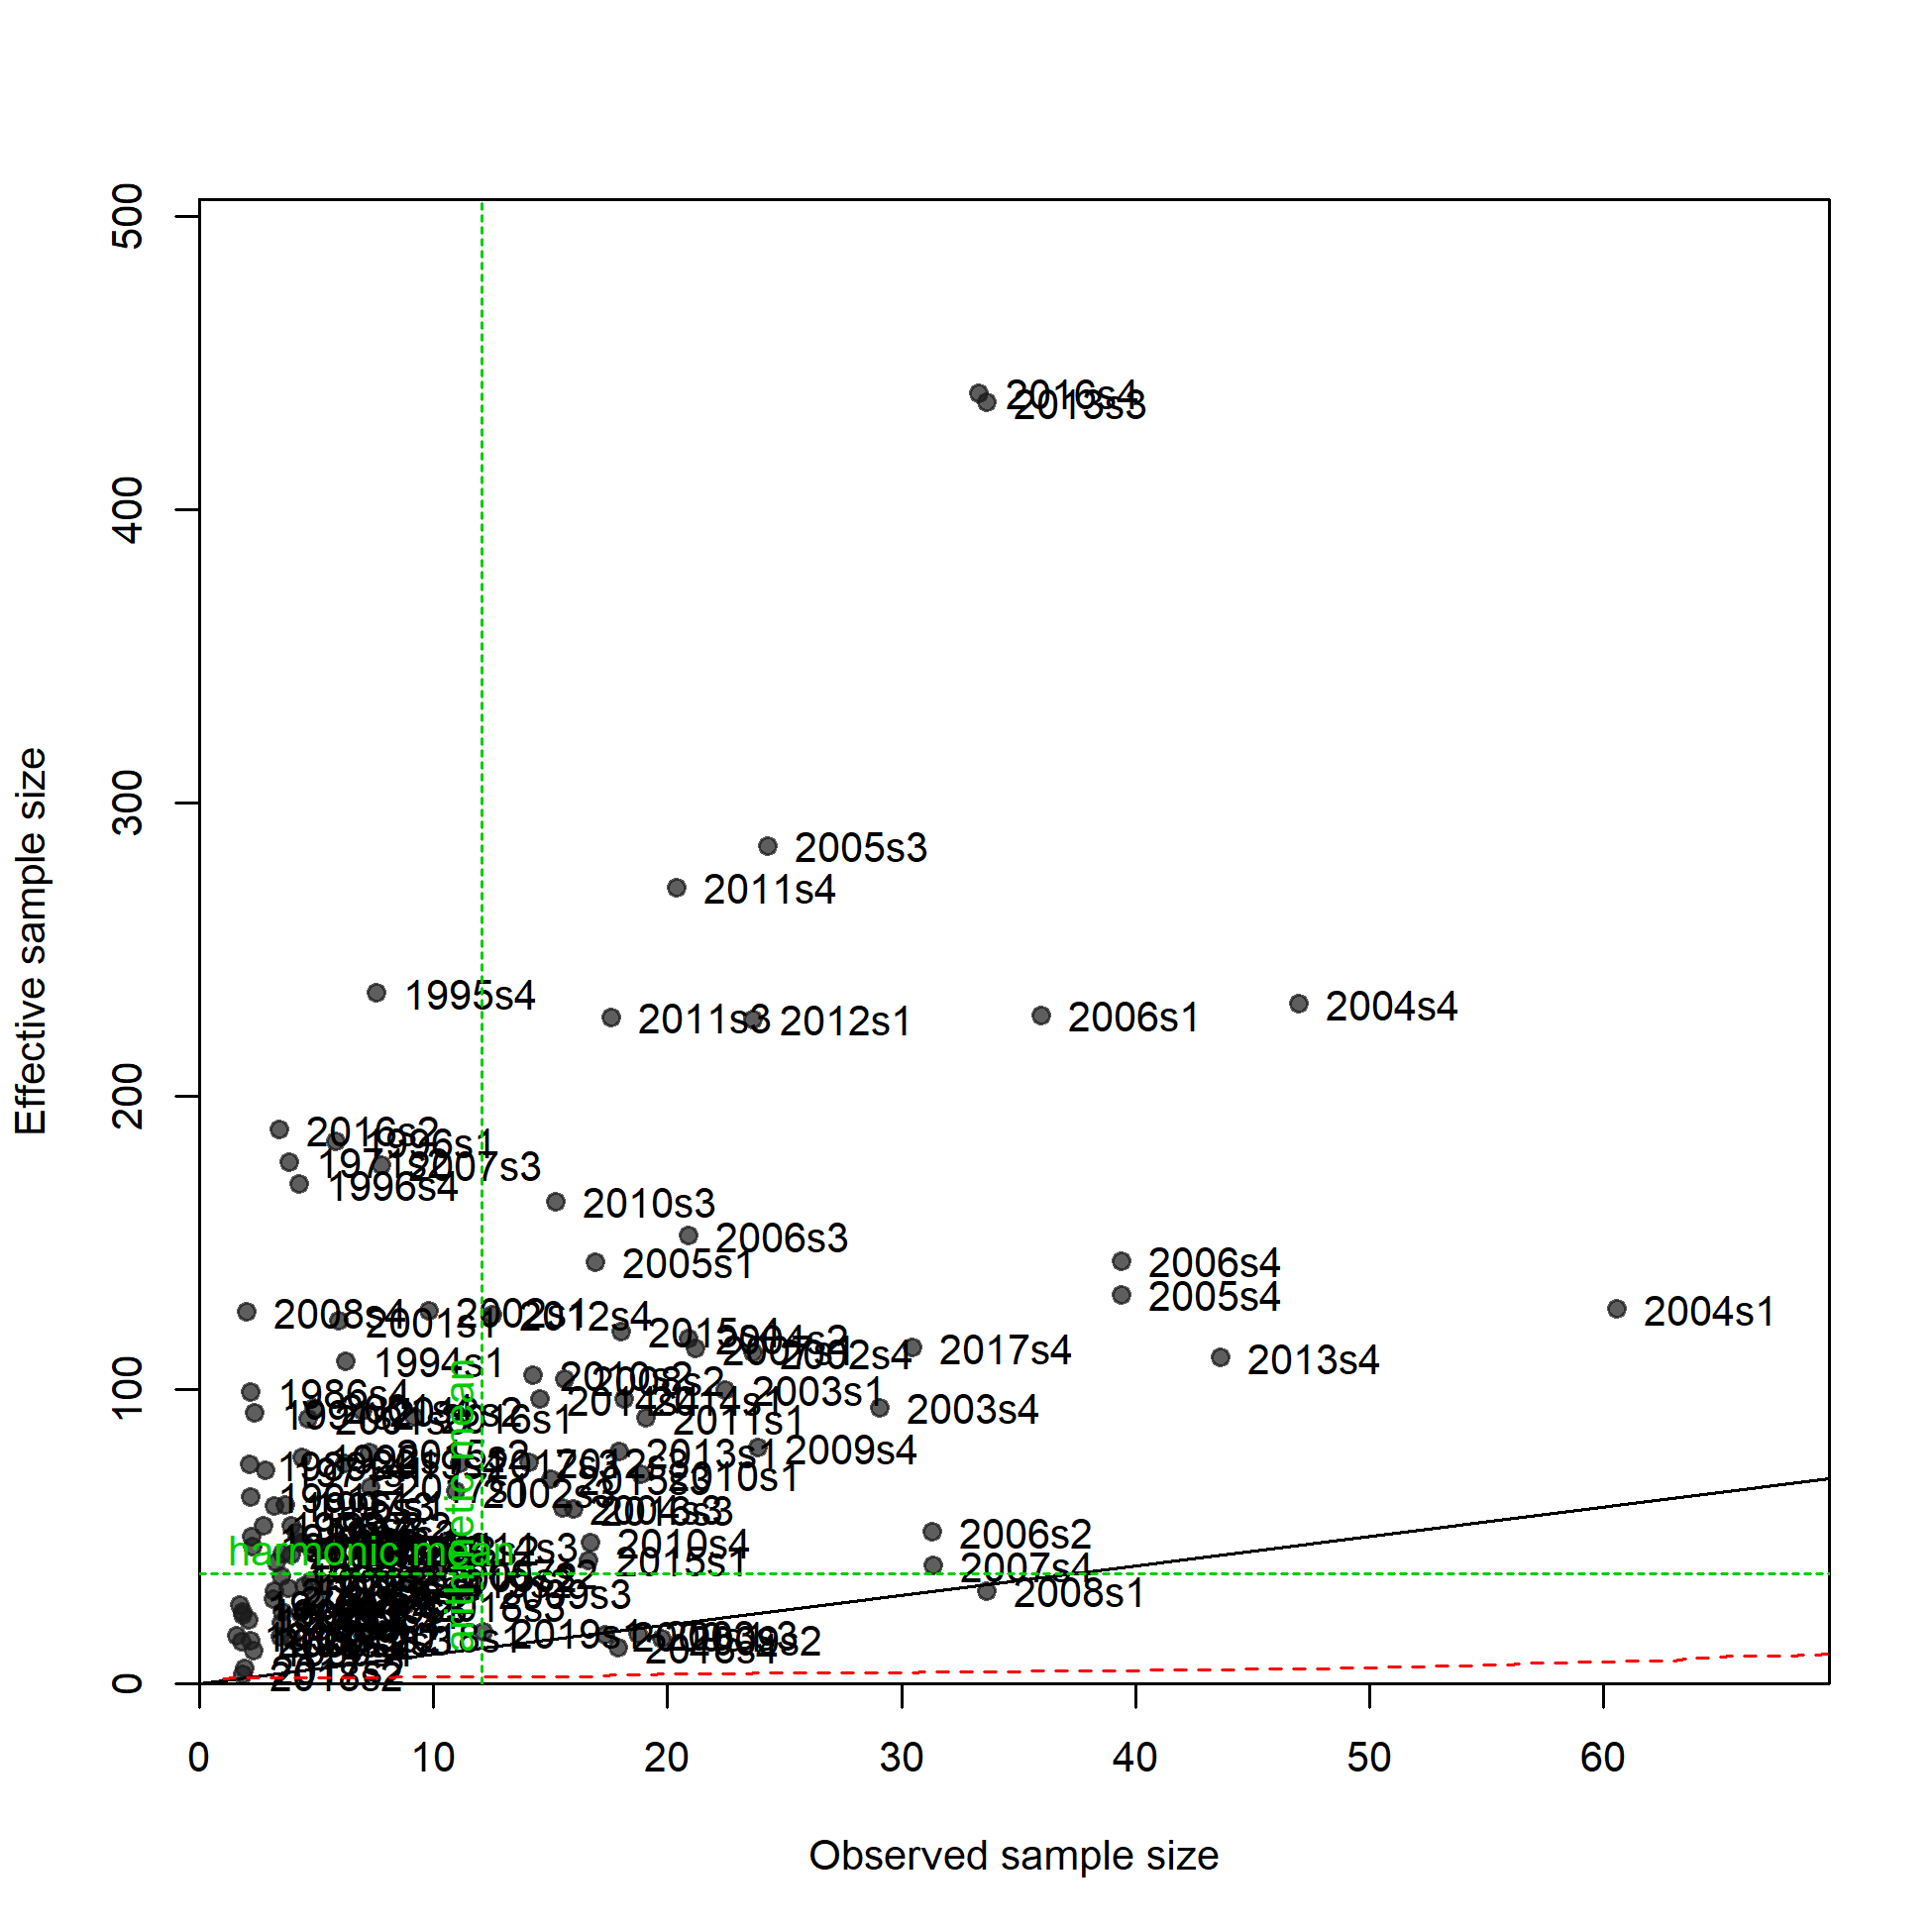
N-EffN comparison, Length comps, whole catch, F8_ESP_A4
file: comp_lenfit_sampsize_flt8mkt0.png
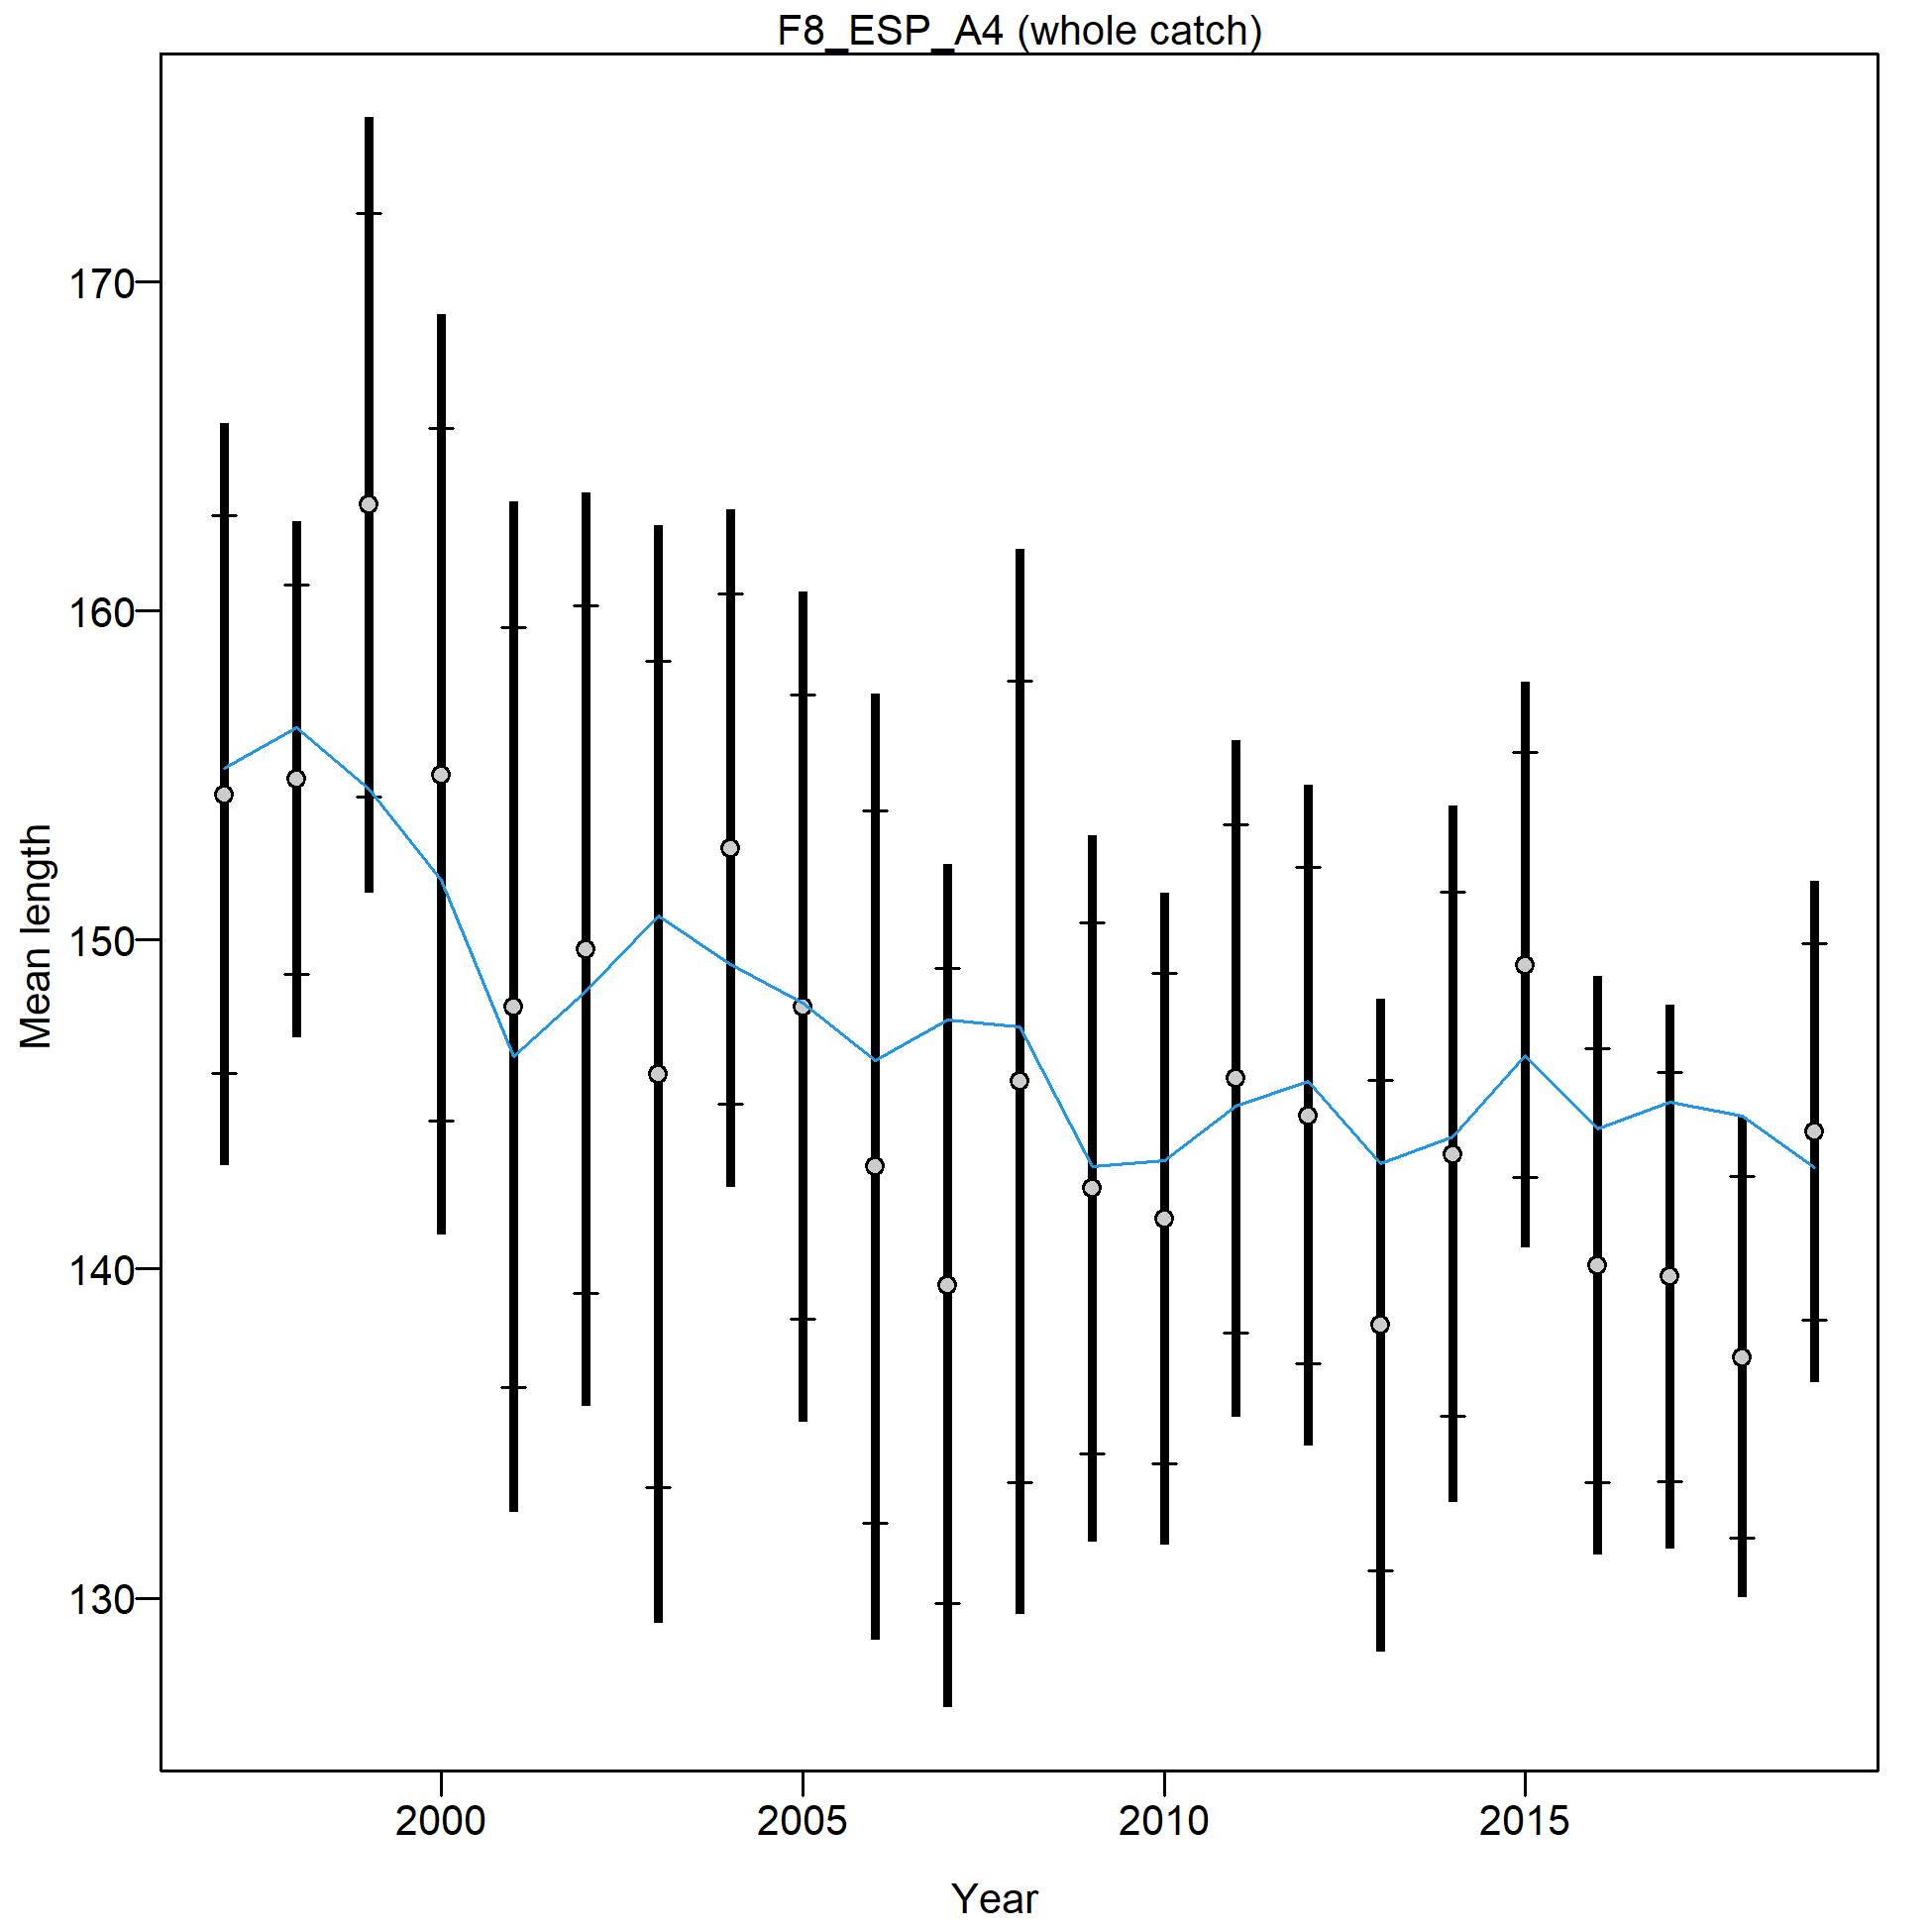
Mean length for F8_ESP_A4 with 95% confidence intervals based on current samples sizes.
Francis data weighting method TA1.8: thinner intervals (with capped ends) show result of further adjusting sample sizes based on suggested multiplier (with 95% interval) for len data from F8_ESP_A4:
1.7664 (1.0754-4.1403)
For more info, see
Francis, R.I.C.C. (2011). Data weighting in statistical fisheries stock assessment models. Can. J. Fish. Aquat. Sci. 68: 1124-1138. https://doi.org/10.1139/f2011-025
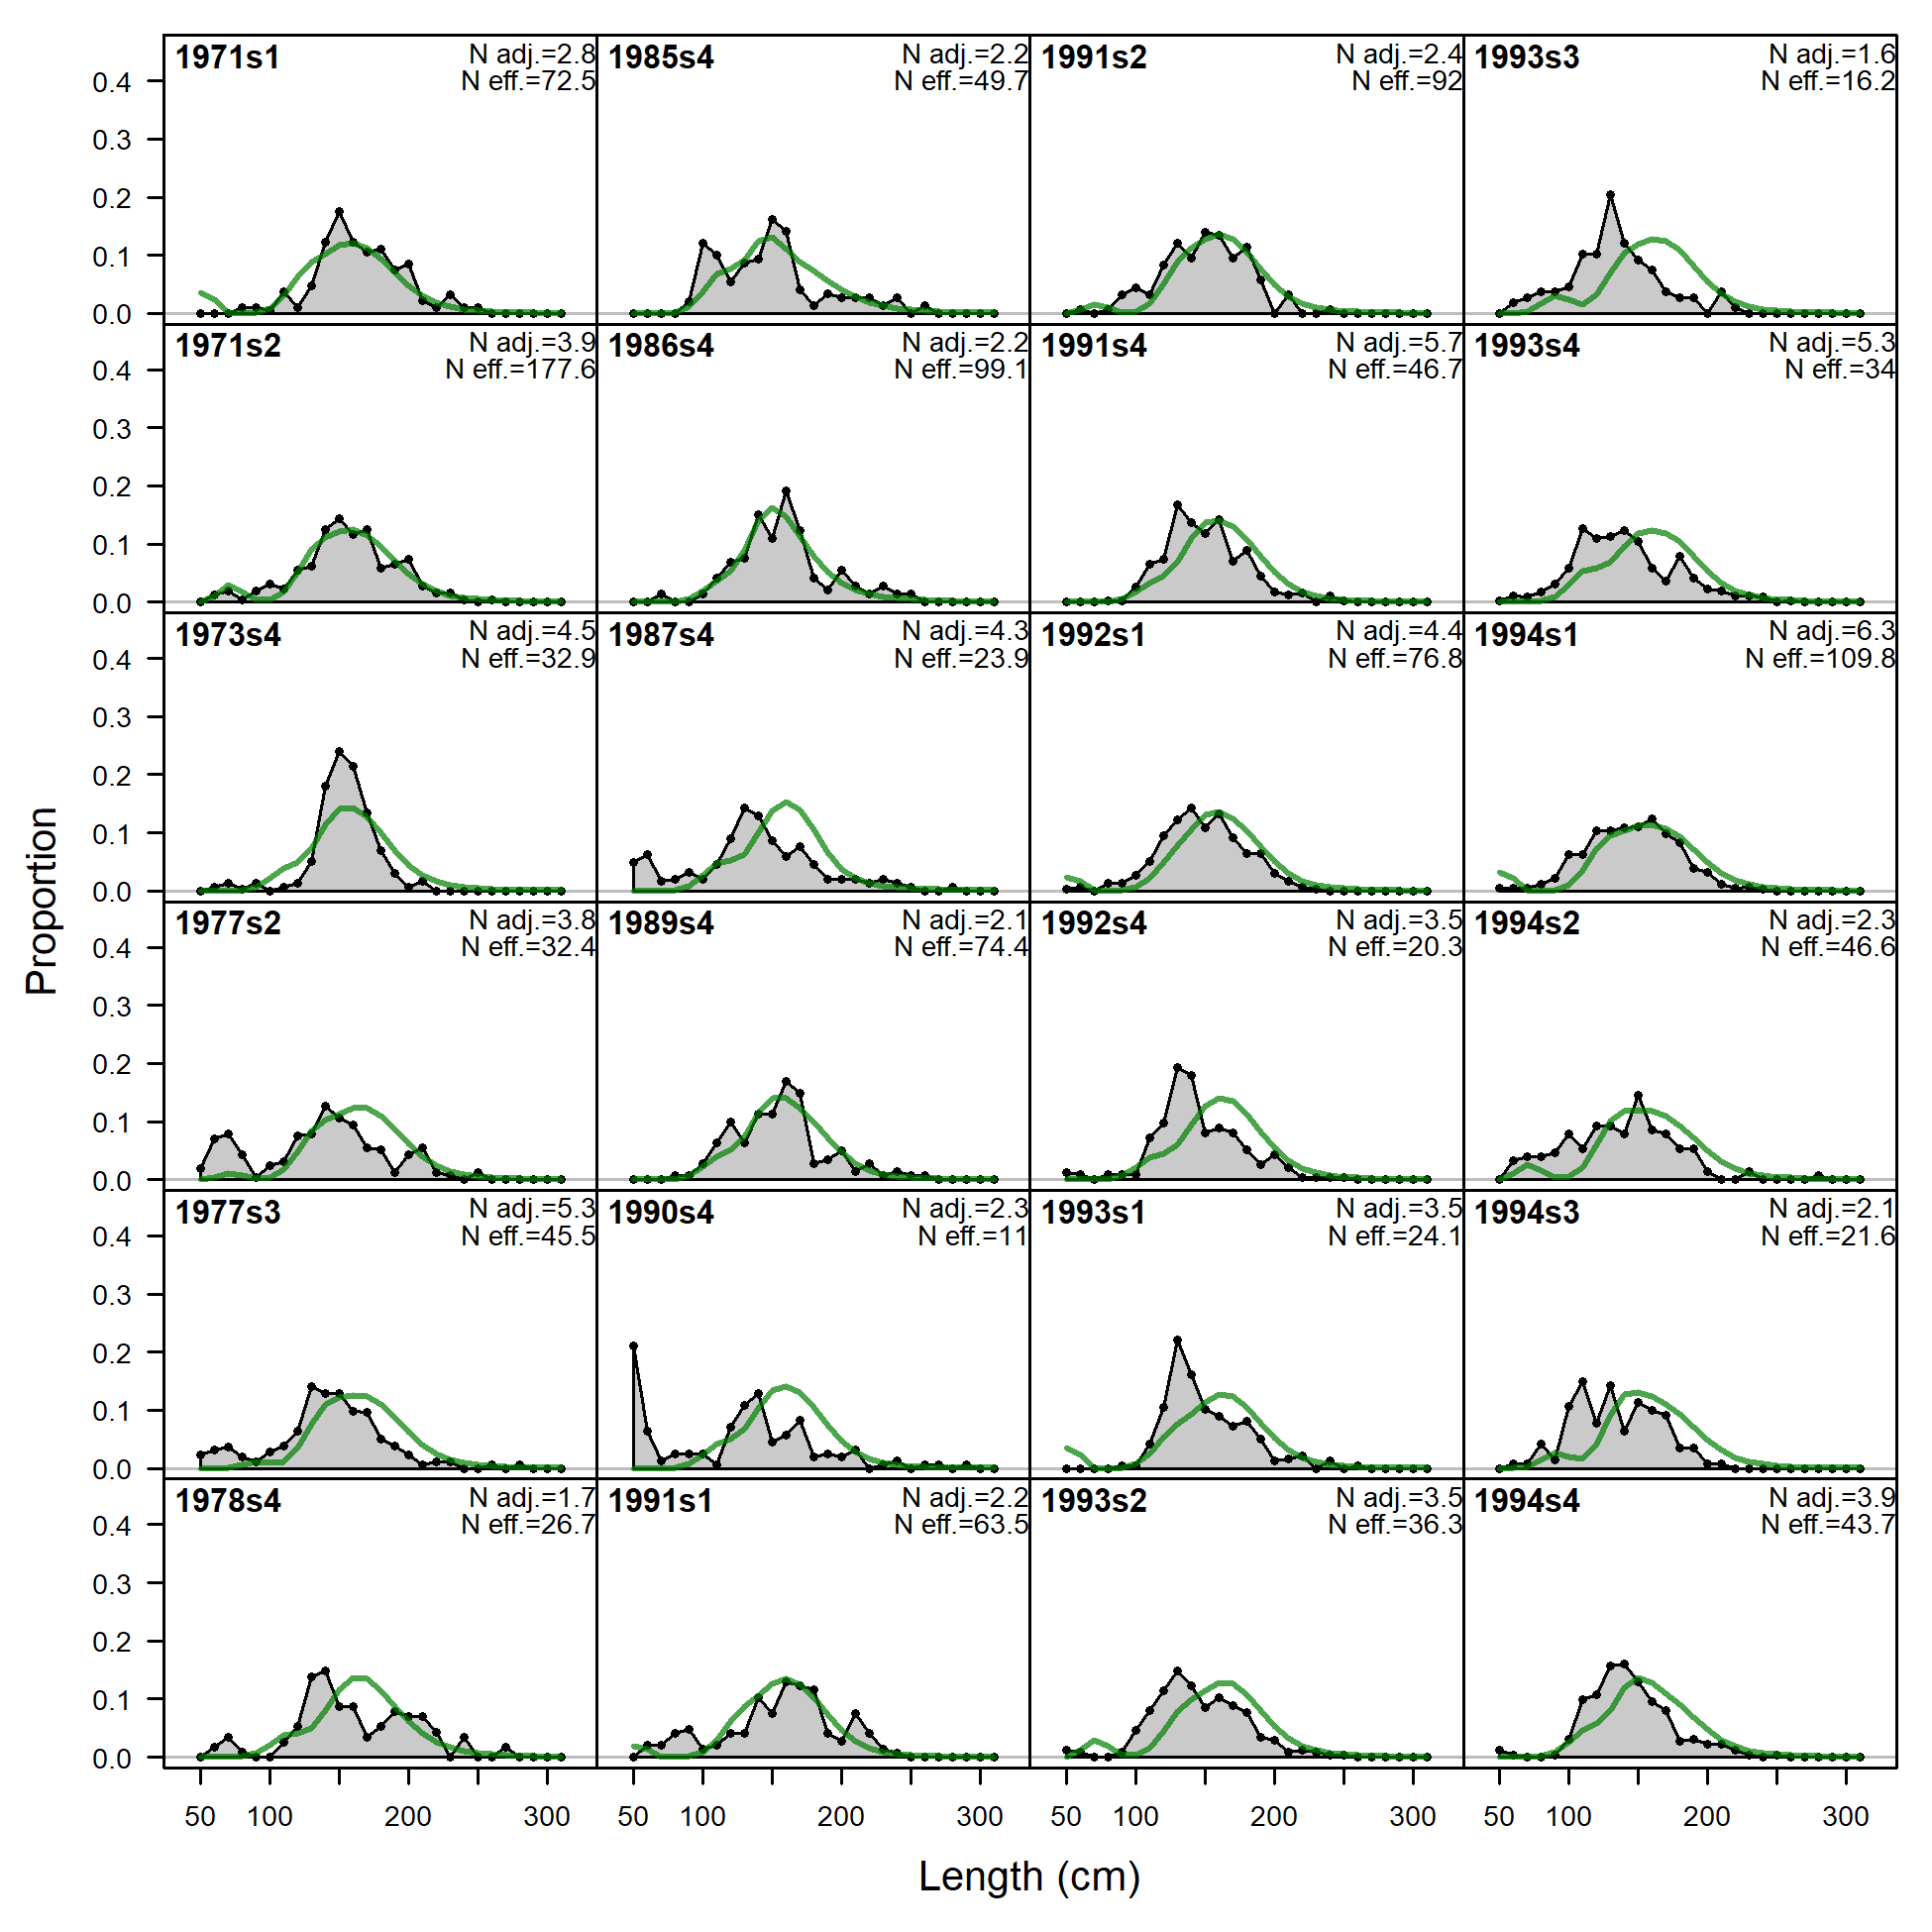
Length comps, whole catch, F9_ESP_A5 (plot 1 of 4).
'N adj.' is the input sample size after data-weighting adjustment. N eff. is the calculated effective sample size used in the McAllister-Ianelli tuning method.
file: comp_lenfit_flt9mkt0_page1.png
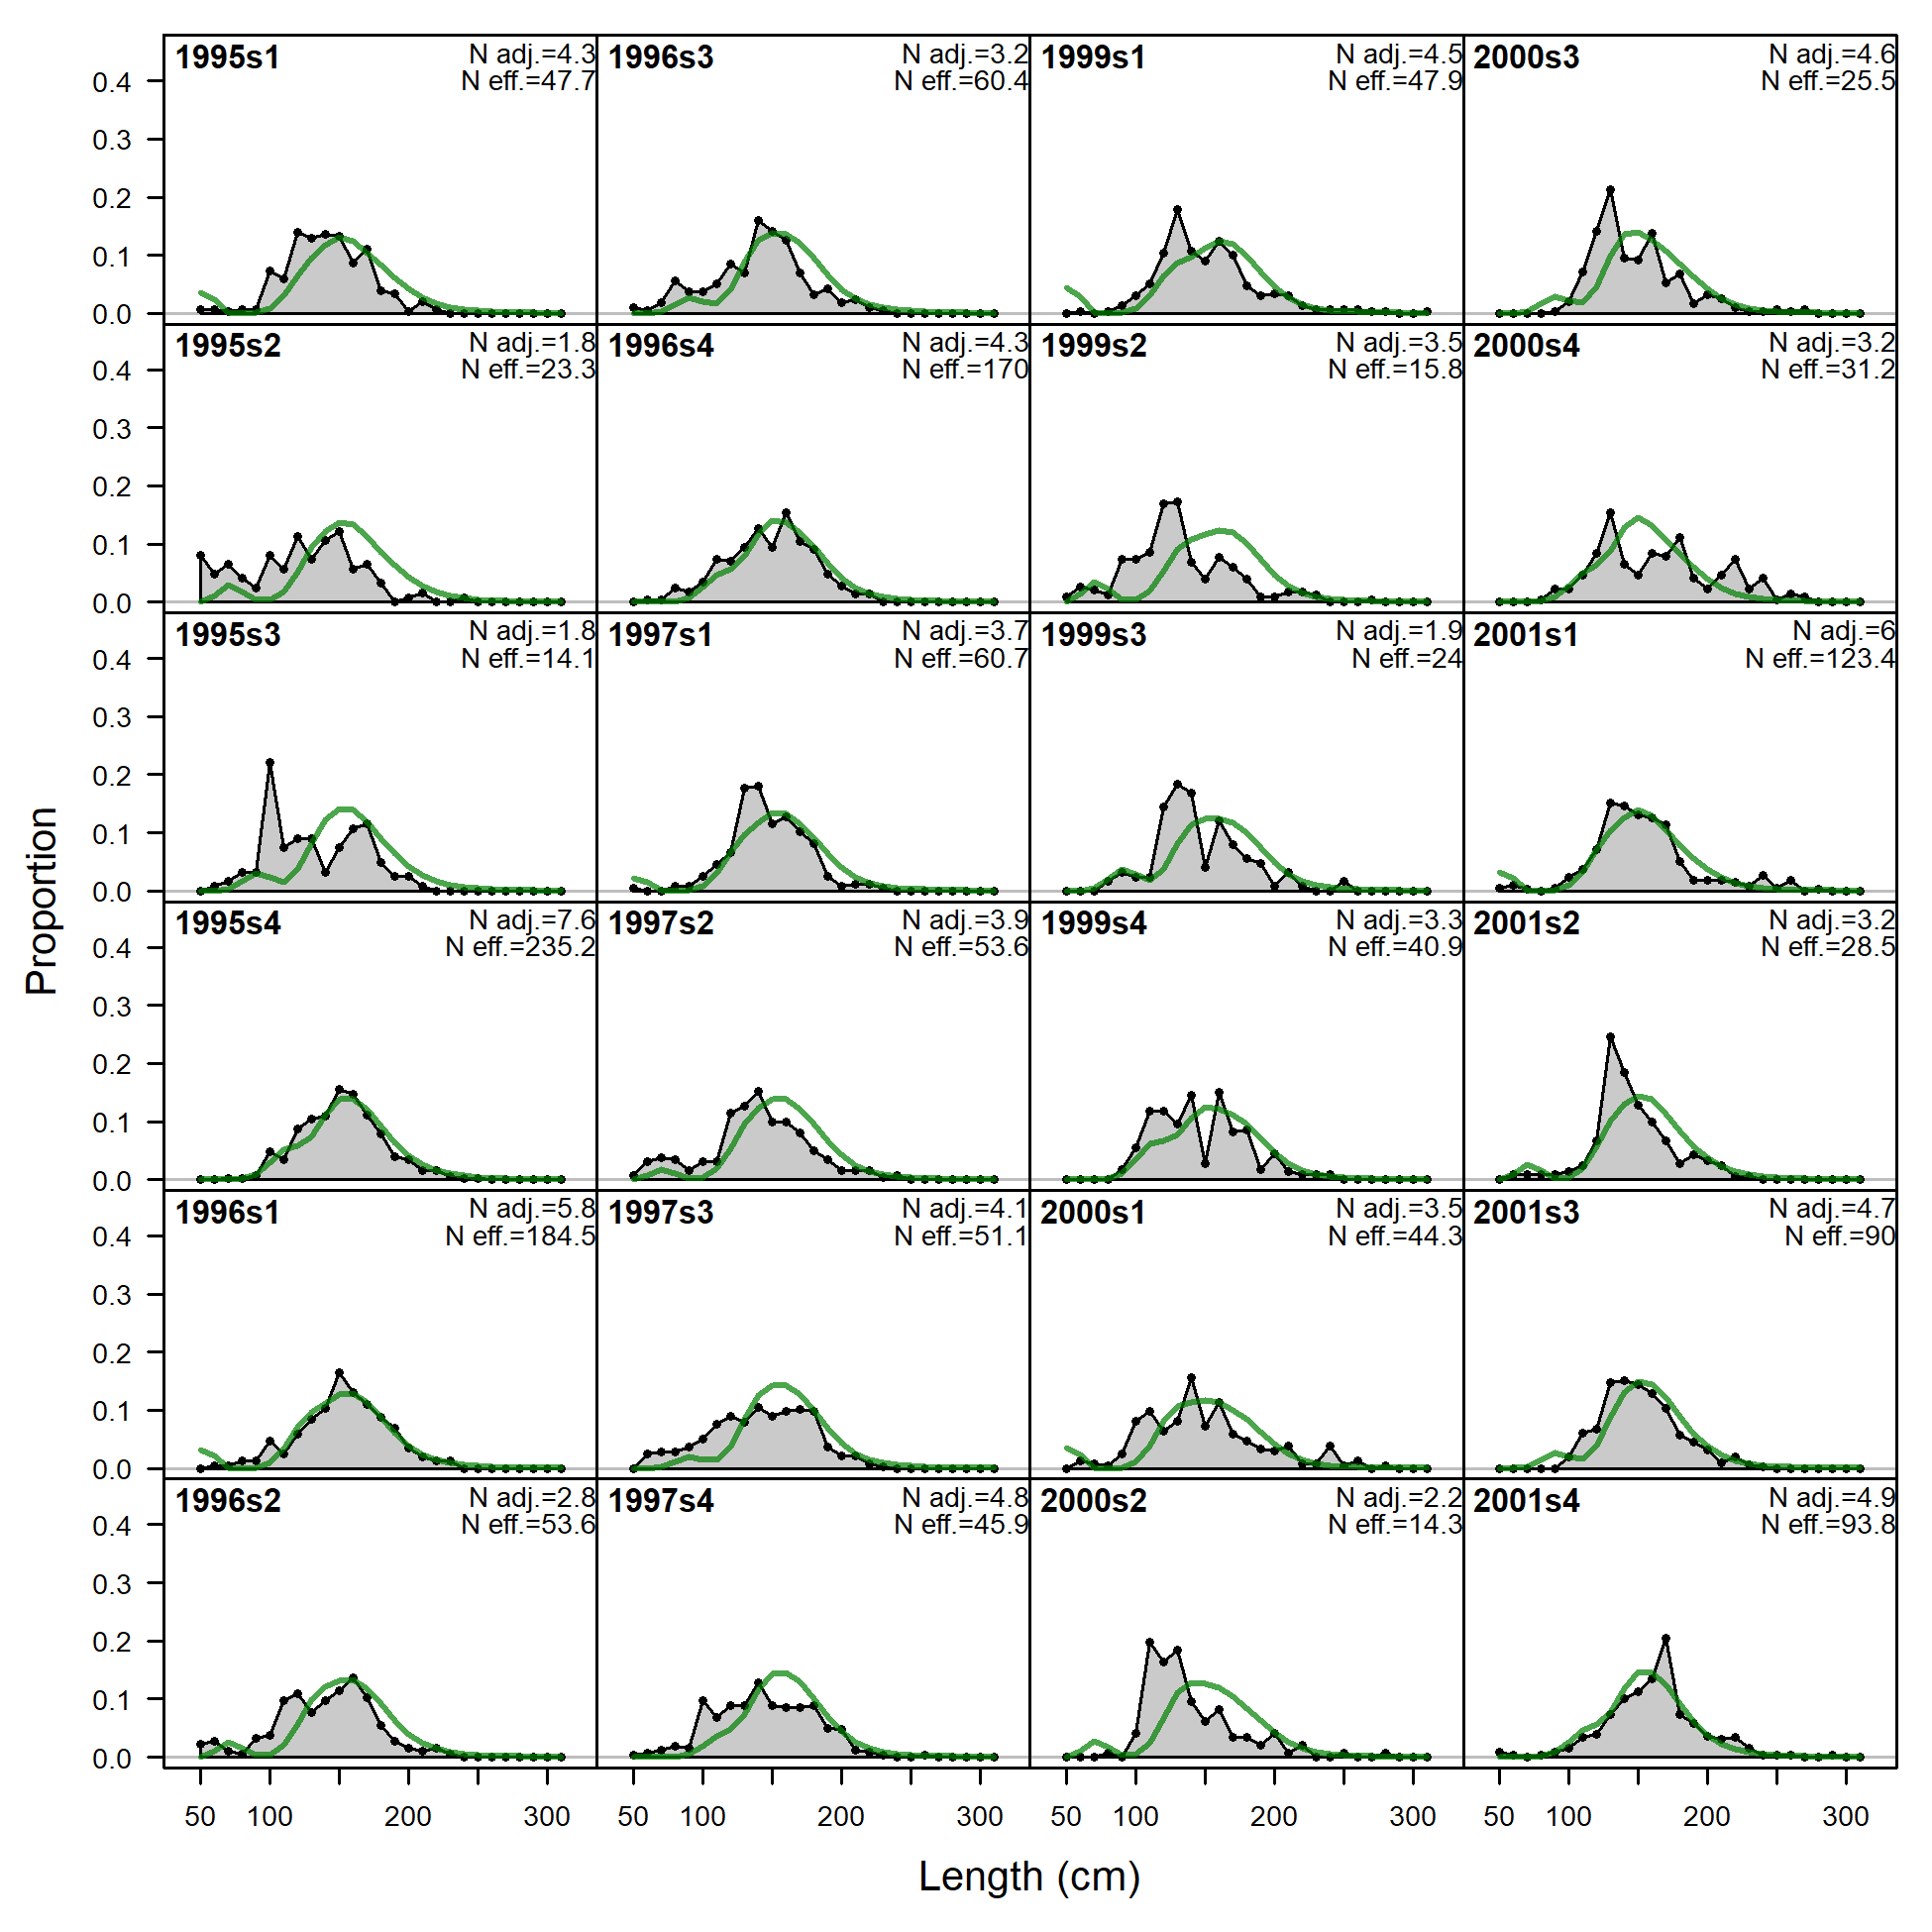
Length comps, whole catch, F9_ESP_A5 (plot 1 of 4).
'N adj.' is the input sample size after data-weighting adjustment. N eff. is the calculated effective sample size used in the McAllister-Ianelli tuning method. (plot 2 of 4)
file: comp_lenfit_flt9mkt0_page2.png
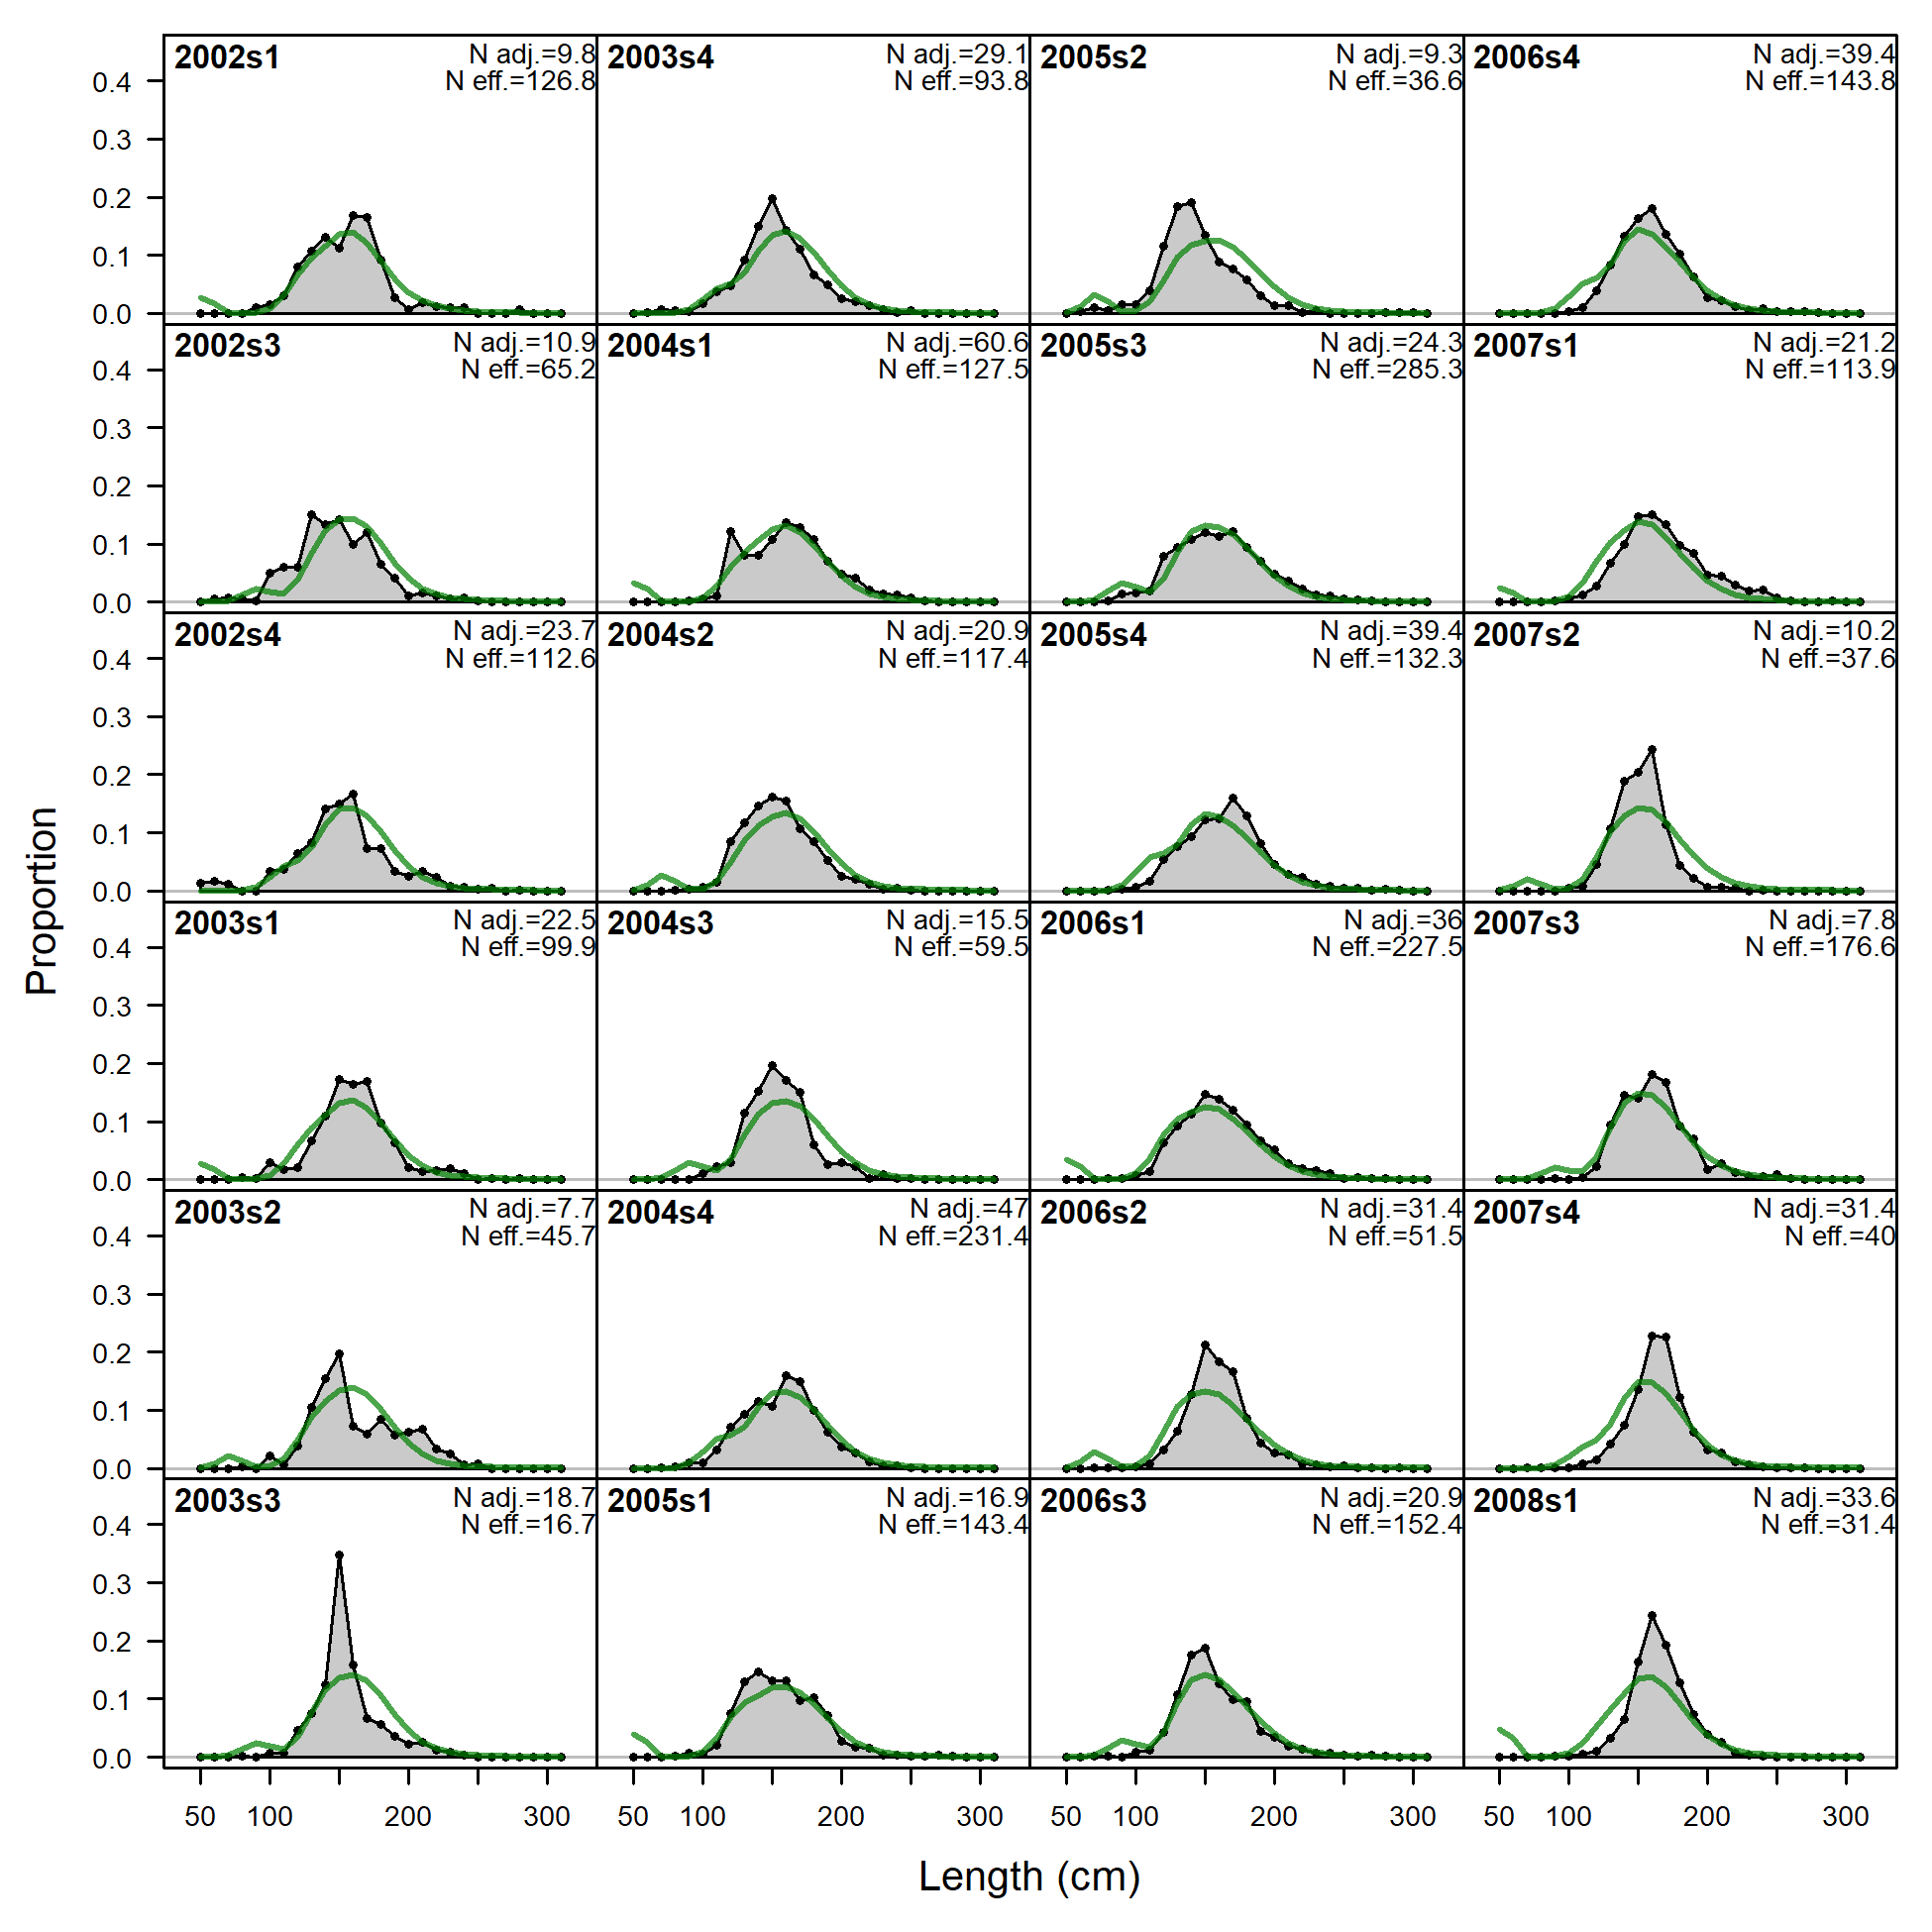
Length comps, whole catch, F9_ESP_A5 (plot 1 of 4).
'N adj.' is the input sample size after data-weighting adjustment. N eff. is the calculated effective sample size used in the McAllister-Ianelli tuning method. (plot 2 of 4) (plot 3 of 4)
file: comp_lenfit_flt9mkt0_page3.png
Length comps, whole catch, F9_ESP_A5 (plot 1 of 4).
'N adj.' is the input sample size after data-weighting adjustment. N eff. is the calculated effective sample size used in the McAllister-Ianelli tuning method. (plot 2 of 4) (plot 3 of 4) (plot 4 of 4)
file: comp_lenfit_flt9mkt0_page4.png
Pearson residuals, whole catch, F9_ESP_A5 (max=55.16) (plot 4 of 4)
Closed bubbles are positive residuals (observed > expected) and open bubbles are negative residuals (observed < expected).
file: comp_lenfit_residsflt9mkt0_page4.png
N-EffN comparison, Length comps, whole catch, F9_ESP_A5
file: comp_lenfit_sampsize_flt9mkt0.png
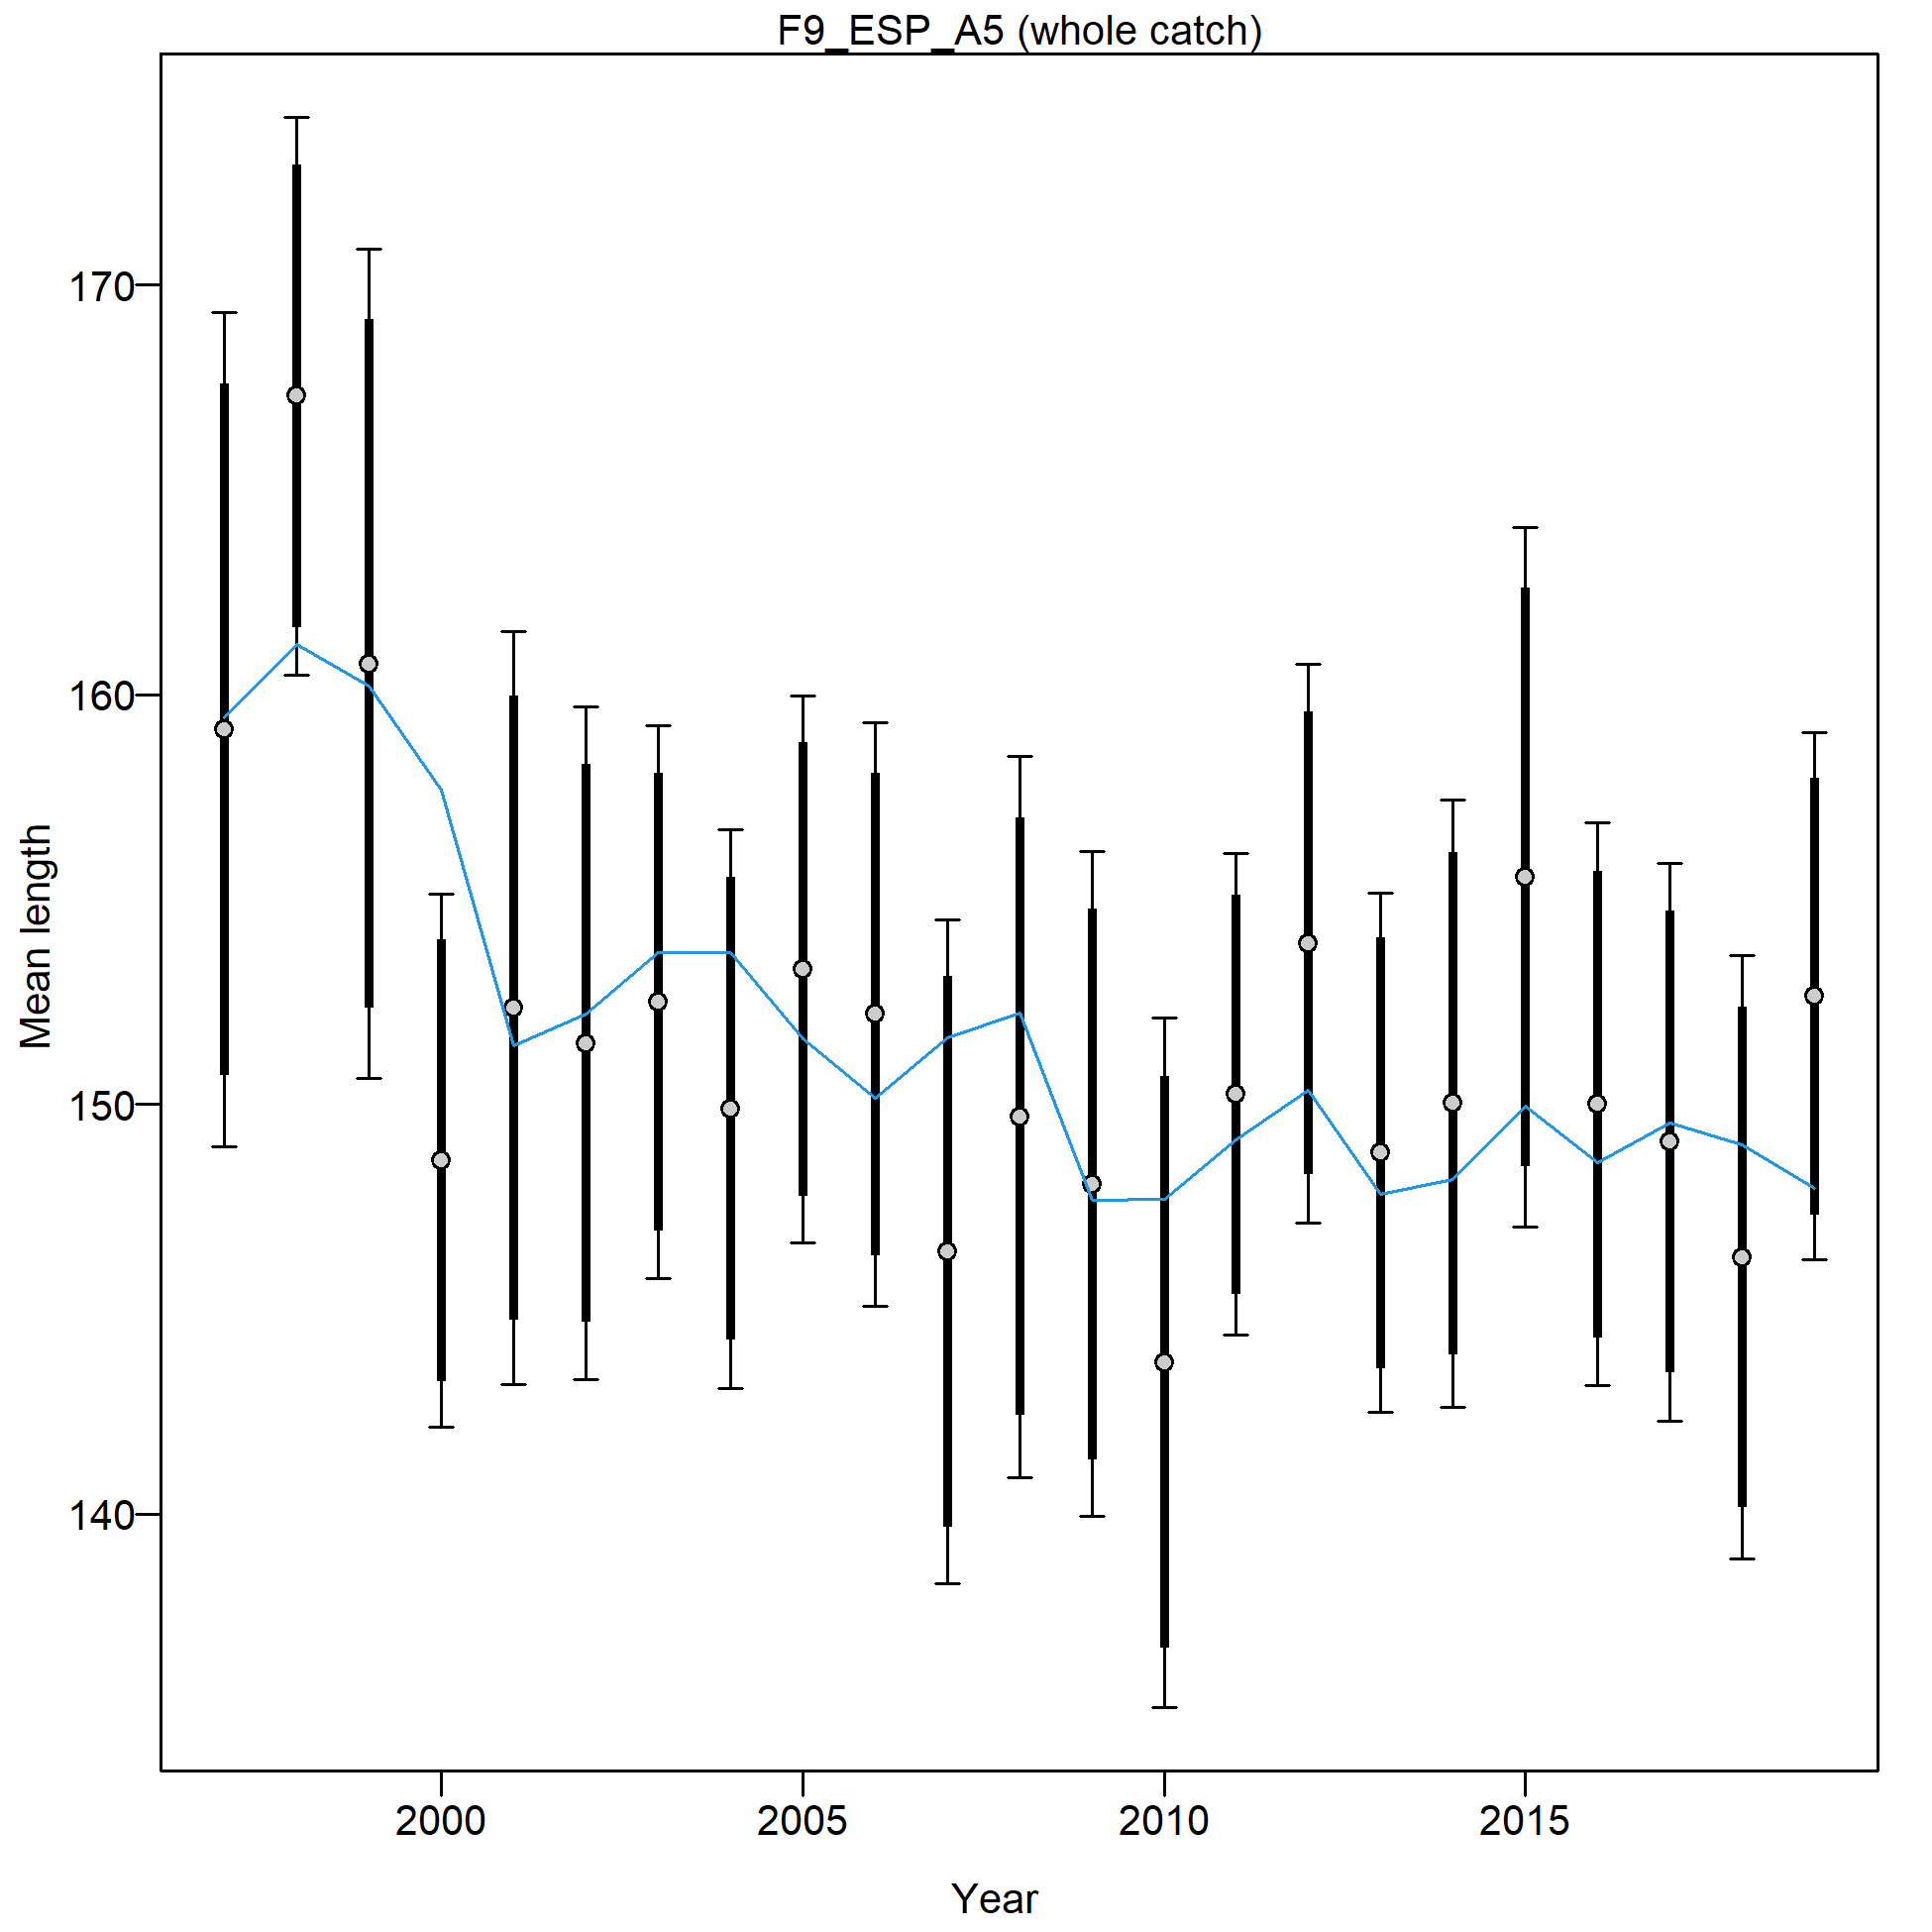
Mean length for F9_ESP_A5 with 95% confidence intervals based on current samples sizes.
Francis data weighting method TA1.8: thinner intervals (with capped ends) show result of further adjusting sample sizes based on suggested multiplier (with 95% interval) for len data from F9_ESP_A5:
0.6873 (0.3968-1.7823)
For more info, see
Francis, R.I.C.C. (2011). Data weighting in statistical fisheries stock assessment models. Can. J. Fish. Aquat. Sci. 68: 1124-1138. https://doi.org/10.1139/f2011-025
Length comps, whole catch, F10_LL_DW_A2 (plot 1 of 5).
'N adj.' is the input sample size after data-weighting adjustment. N eff. is the calculated effective sample size used in the McAllister-Ianelli tuning method.
file: comp_lenfit_flt10mkt0_page1.png
Length comps, whole catch, F10_LL_DW_A2 (plot 1 of 5).
'N adj.' is the input sample size after data-weighting adjustment. N eff. is the calculated effective sample size used in the McAllister-Ianelli tuning method. (plot 2 of 5)
file: comp_lenfit_flt10mkt0_page2.png
Length comps, whole catch, F10_LL_DW_A2 (plot 1 of 5).
'N adj.' is the input sample size after data-weighting adjustment. N eff. is the calculated effective sample size used in the McAllister-Ianelli tuning method. (plot 2 of 5) (plot 3 of 5)
file: comp_lenfit_flt10mkt0_page3.png
Length comps, whole catch, F10_LL_DW_A2 (plot 1 of 5).
'N adj.' is the input sample size after data-weighting adjustment. N eff. is the calculated effective sample size used in the McAllister-Ianelli tuning method. (plot 2 of 5) (plot 3 of 5) (plot 4 of 5)
file: comp_lenfit_flt10mkt0_page4.png
Length comps, whole catch, F10_LL_DW_A2 (plot 1 of 5).
'N adj.' is the input sample size after data-weighting adjustment. N eff. is the calculated effective sample size used in the McAllister-Ianelli tuning method. (plot 2 of 5) (plot 3 of 5) (plot 4 of 5) (plot 5 of 5)
file: comp_lenfit_flt10mkt0_page5.png
Pearson residuals, whole catch, F10_LL_DW_A2 (max=101.89) (plot 5 of 5)
Closed bubbles are positive residuals (observed > expected) and open bubbles are negative residuals (observed < expected).
file: comp_lenfit_residsflt10mkt0_page5.png
N-EffN comparison, Length comps, whole catch, F10_LL_DW_A2
file: comp_lenfit_sampsize_flt10mkt0.png

Mean length for F10_LL_DW_A2 with 95% confidence intervals based on current samples sizes.
Francis data weighting method TA1.8: thinner intervals (with capped ends) show result of further adjusting sample sizes based on suggested multiplier (with 95% interval) for len data from F10_LL_DW_A2:
1.0676 (0.633-2.2833)
For more info, see
Francis, R.I.C.C. (2011). Data weighting in statistical fisheries stock assessment models. Can. J. Fish. Aquat. Sci. 68: 1124-1138. https://doi.org/10.1139/f2011-025
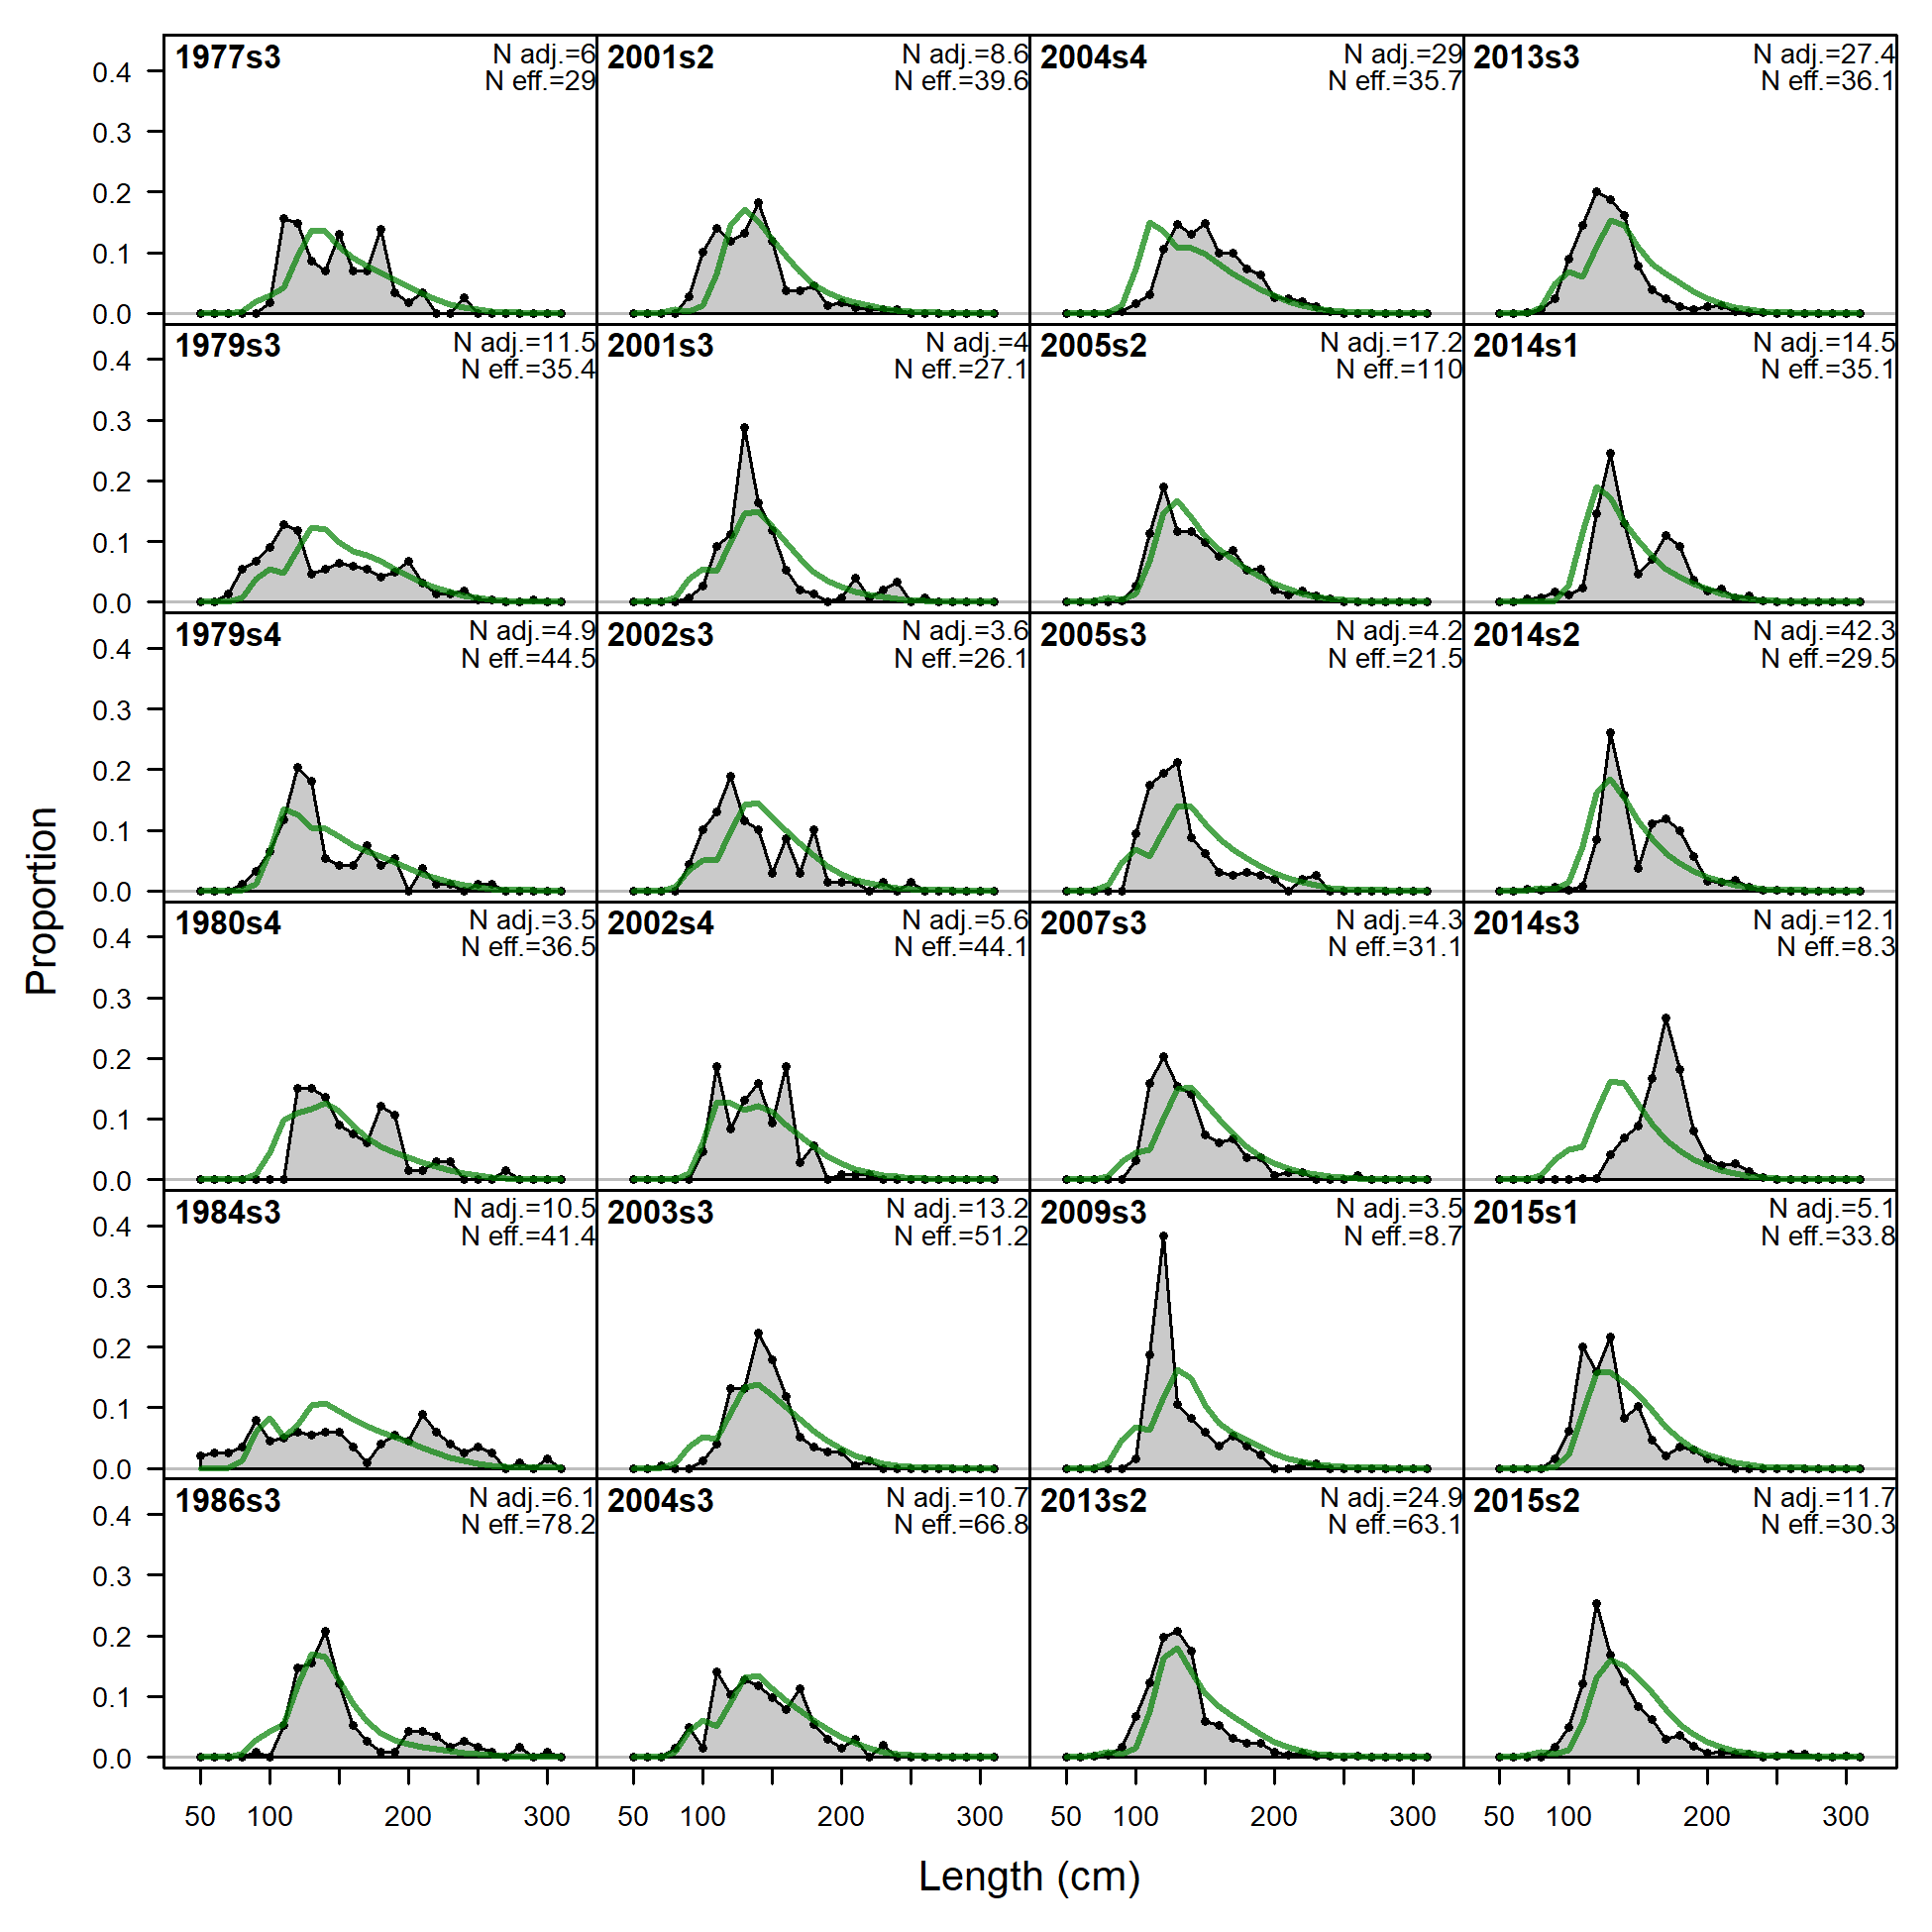
Length comps, whole catch, F12_LL_DW_A4 (plot 1 of 3).
'N adj.' is the input sample size after data-weighting adjustment. N eff. is the calculated effective sample size used in the McAllister-Ianelli tuning method.
file: comp_lenfit_flt12mkt0_page1.png
Length comps, whole catch, F12_LL_DW_A4 (plot 1 of 3).
'N adj.' is the input sample size after data-weighting adjustment. N eff. is the calculated effective sample size used in the McAllister-Ianelli tuning method. (plot 2 of 3)
file: comp_lenfit_flt12mkt0_page2.png
Length comps, whole catch, F12_LL_DW_A4 (plot 1 of 3).
'N adj.' is the input sample size after data-weighting adjustment. N eff. is the calculated effective sample size used in the McAllister-Ianelli tuning method. (plot 2 of 3) (plot 3 of 3)
file: comp_lenfit_flt12mkt0_page3.png
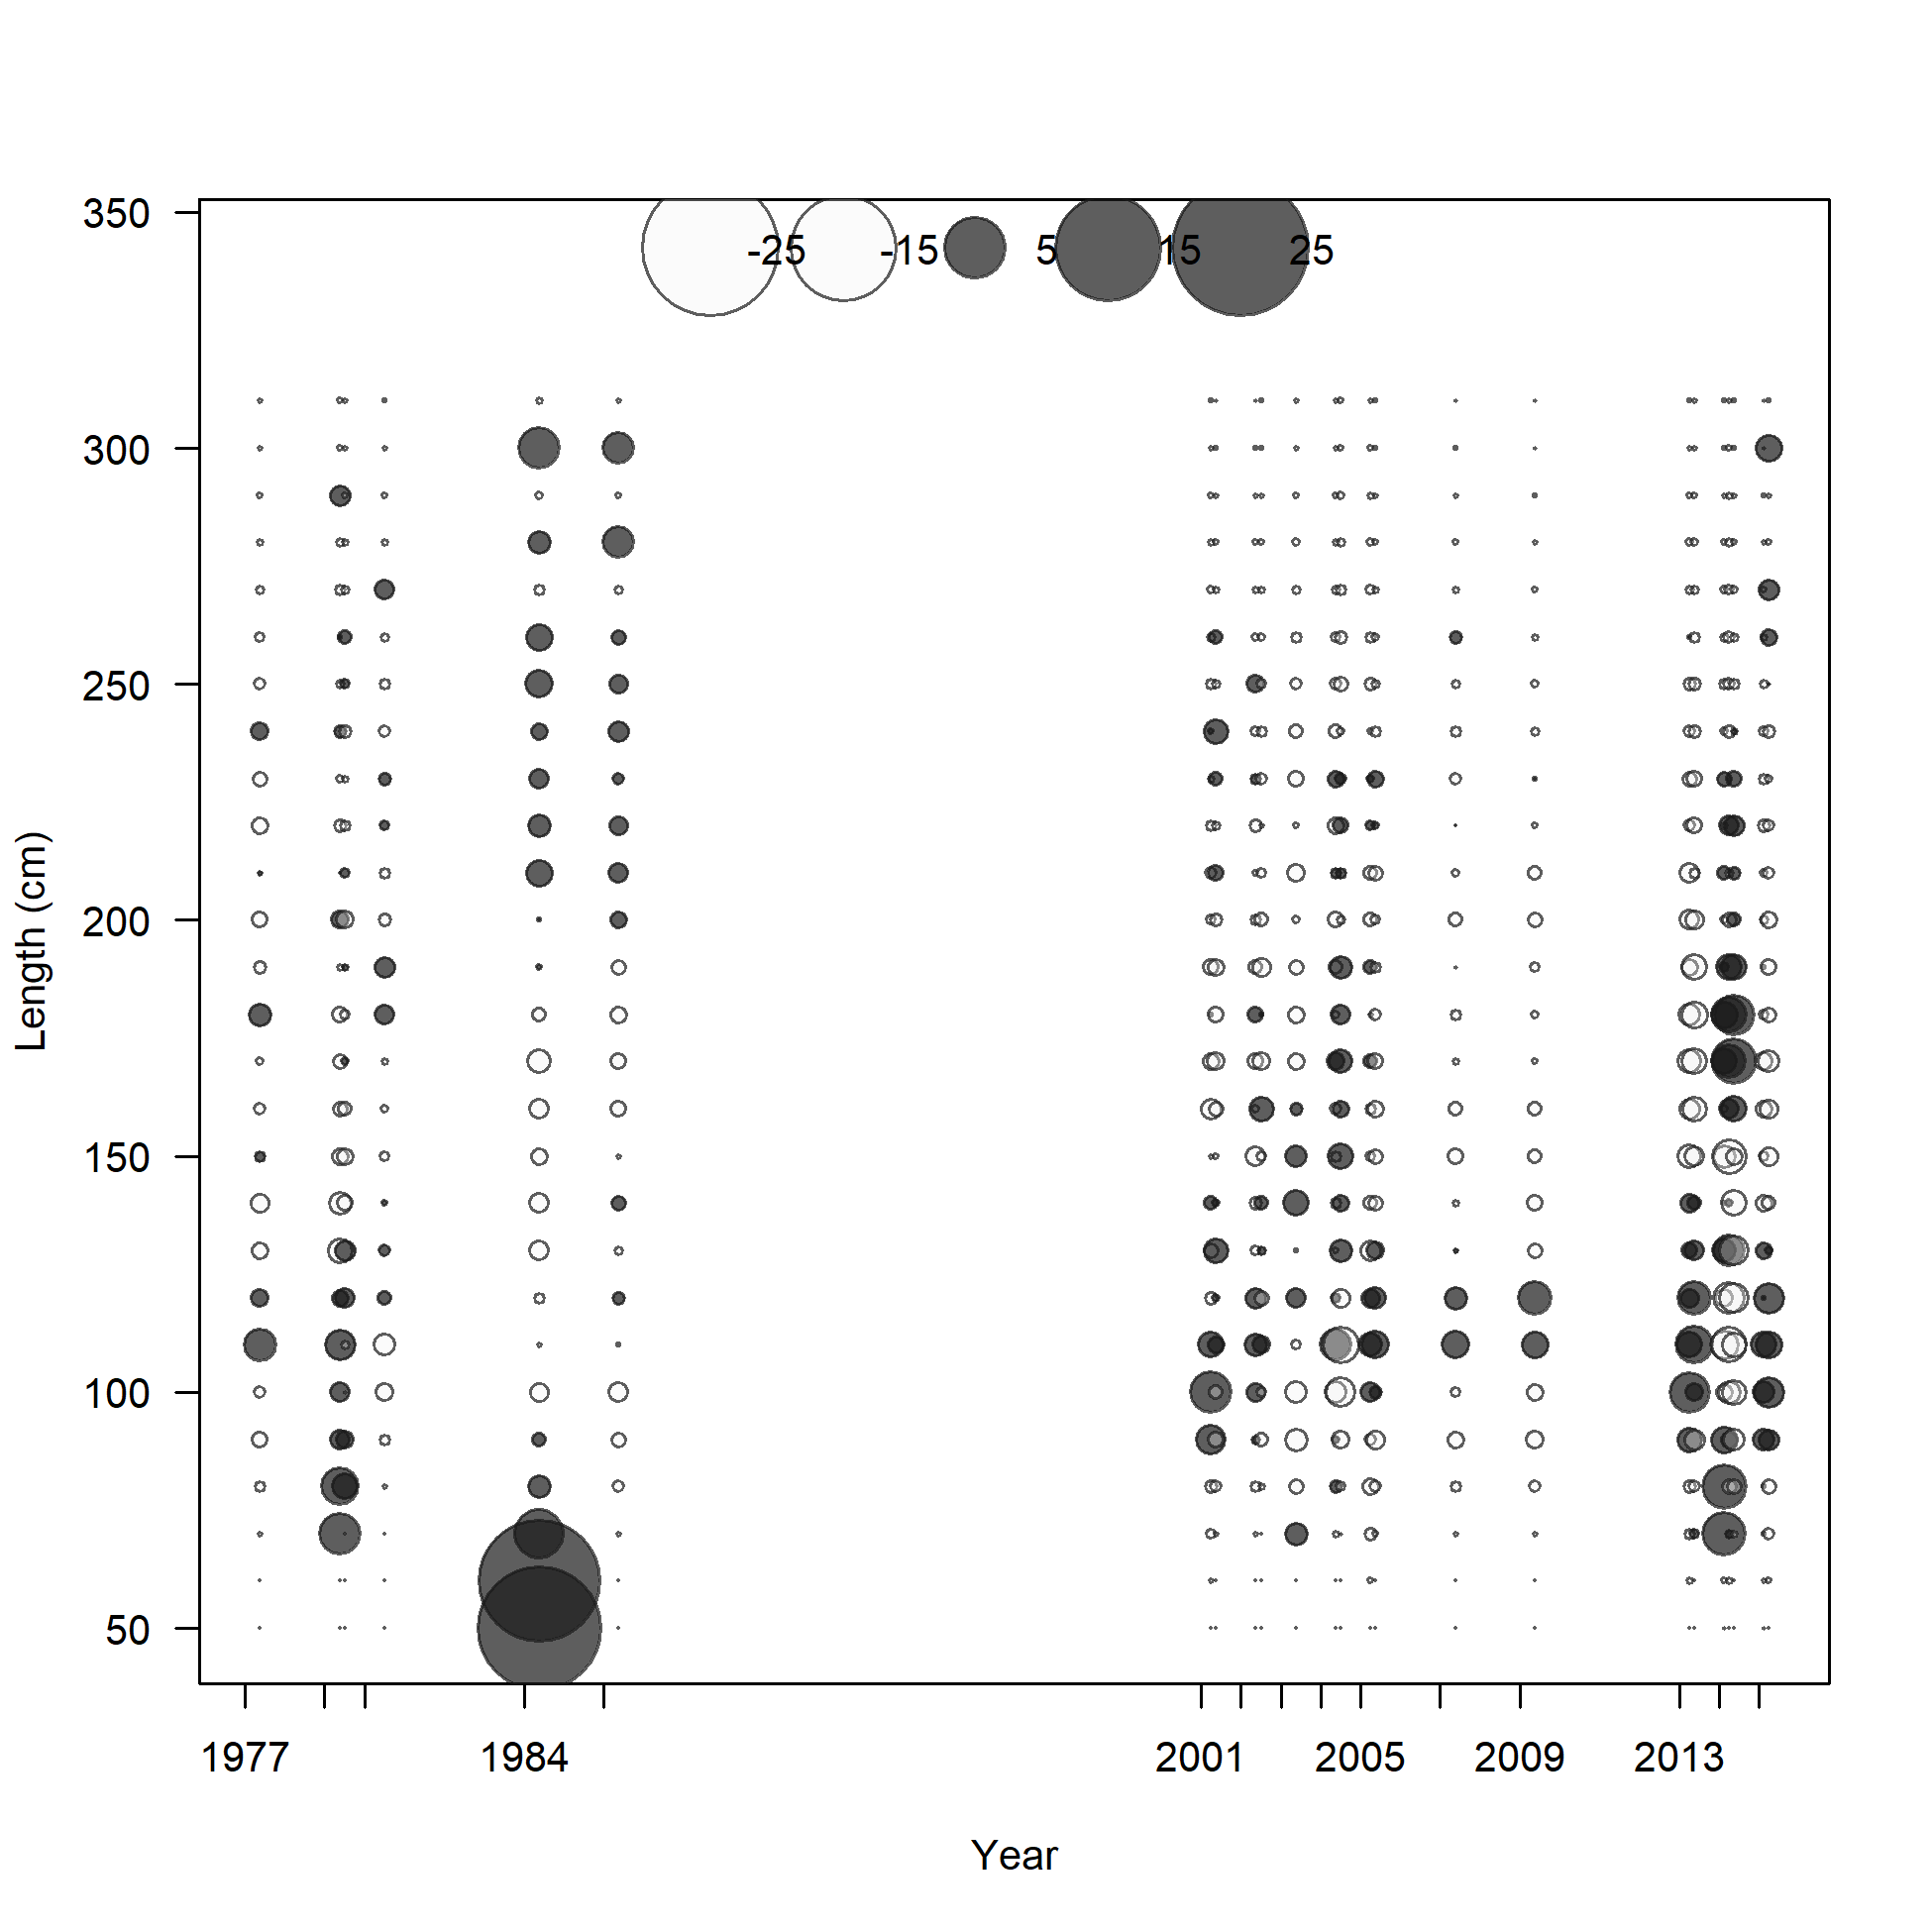
Pearson residuals, whole catch, F12_LL_DW_A4 (max=5.26) (plot 3 of 3)
Closed bubbles are positive residuals (observed > expected) and open bubbles are negative residuals (observed < expected).
file: comp_lenfit_residsflt12mkt0_page3.png
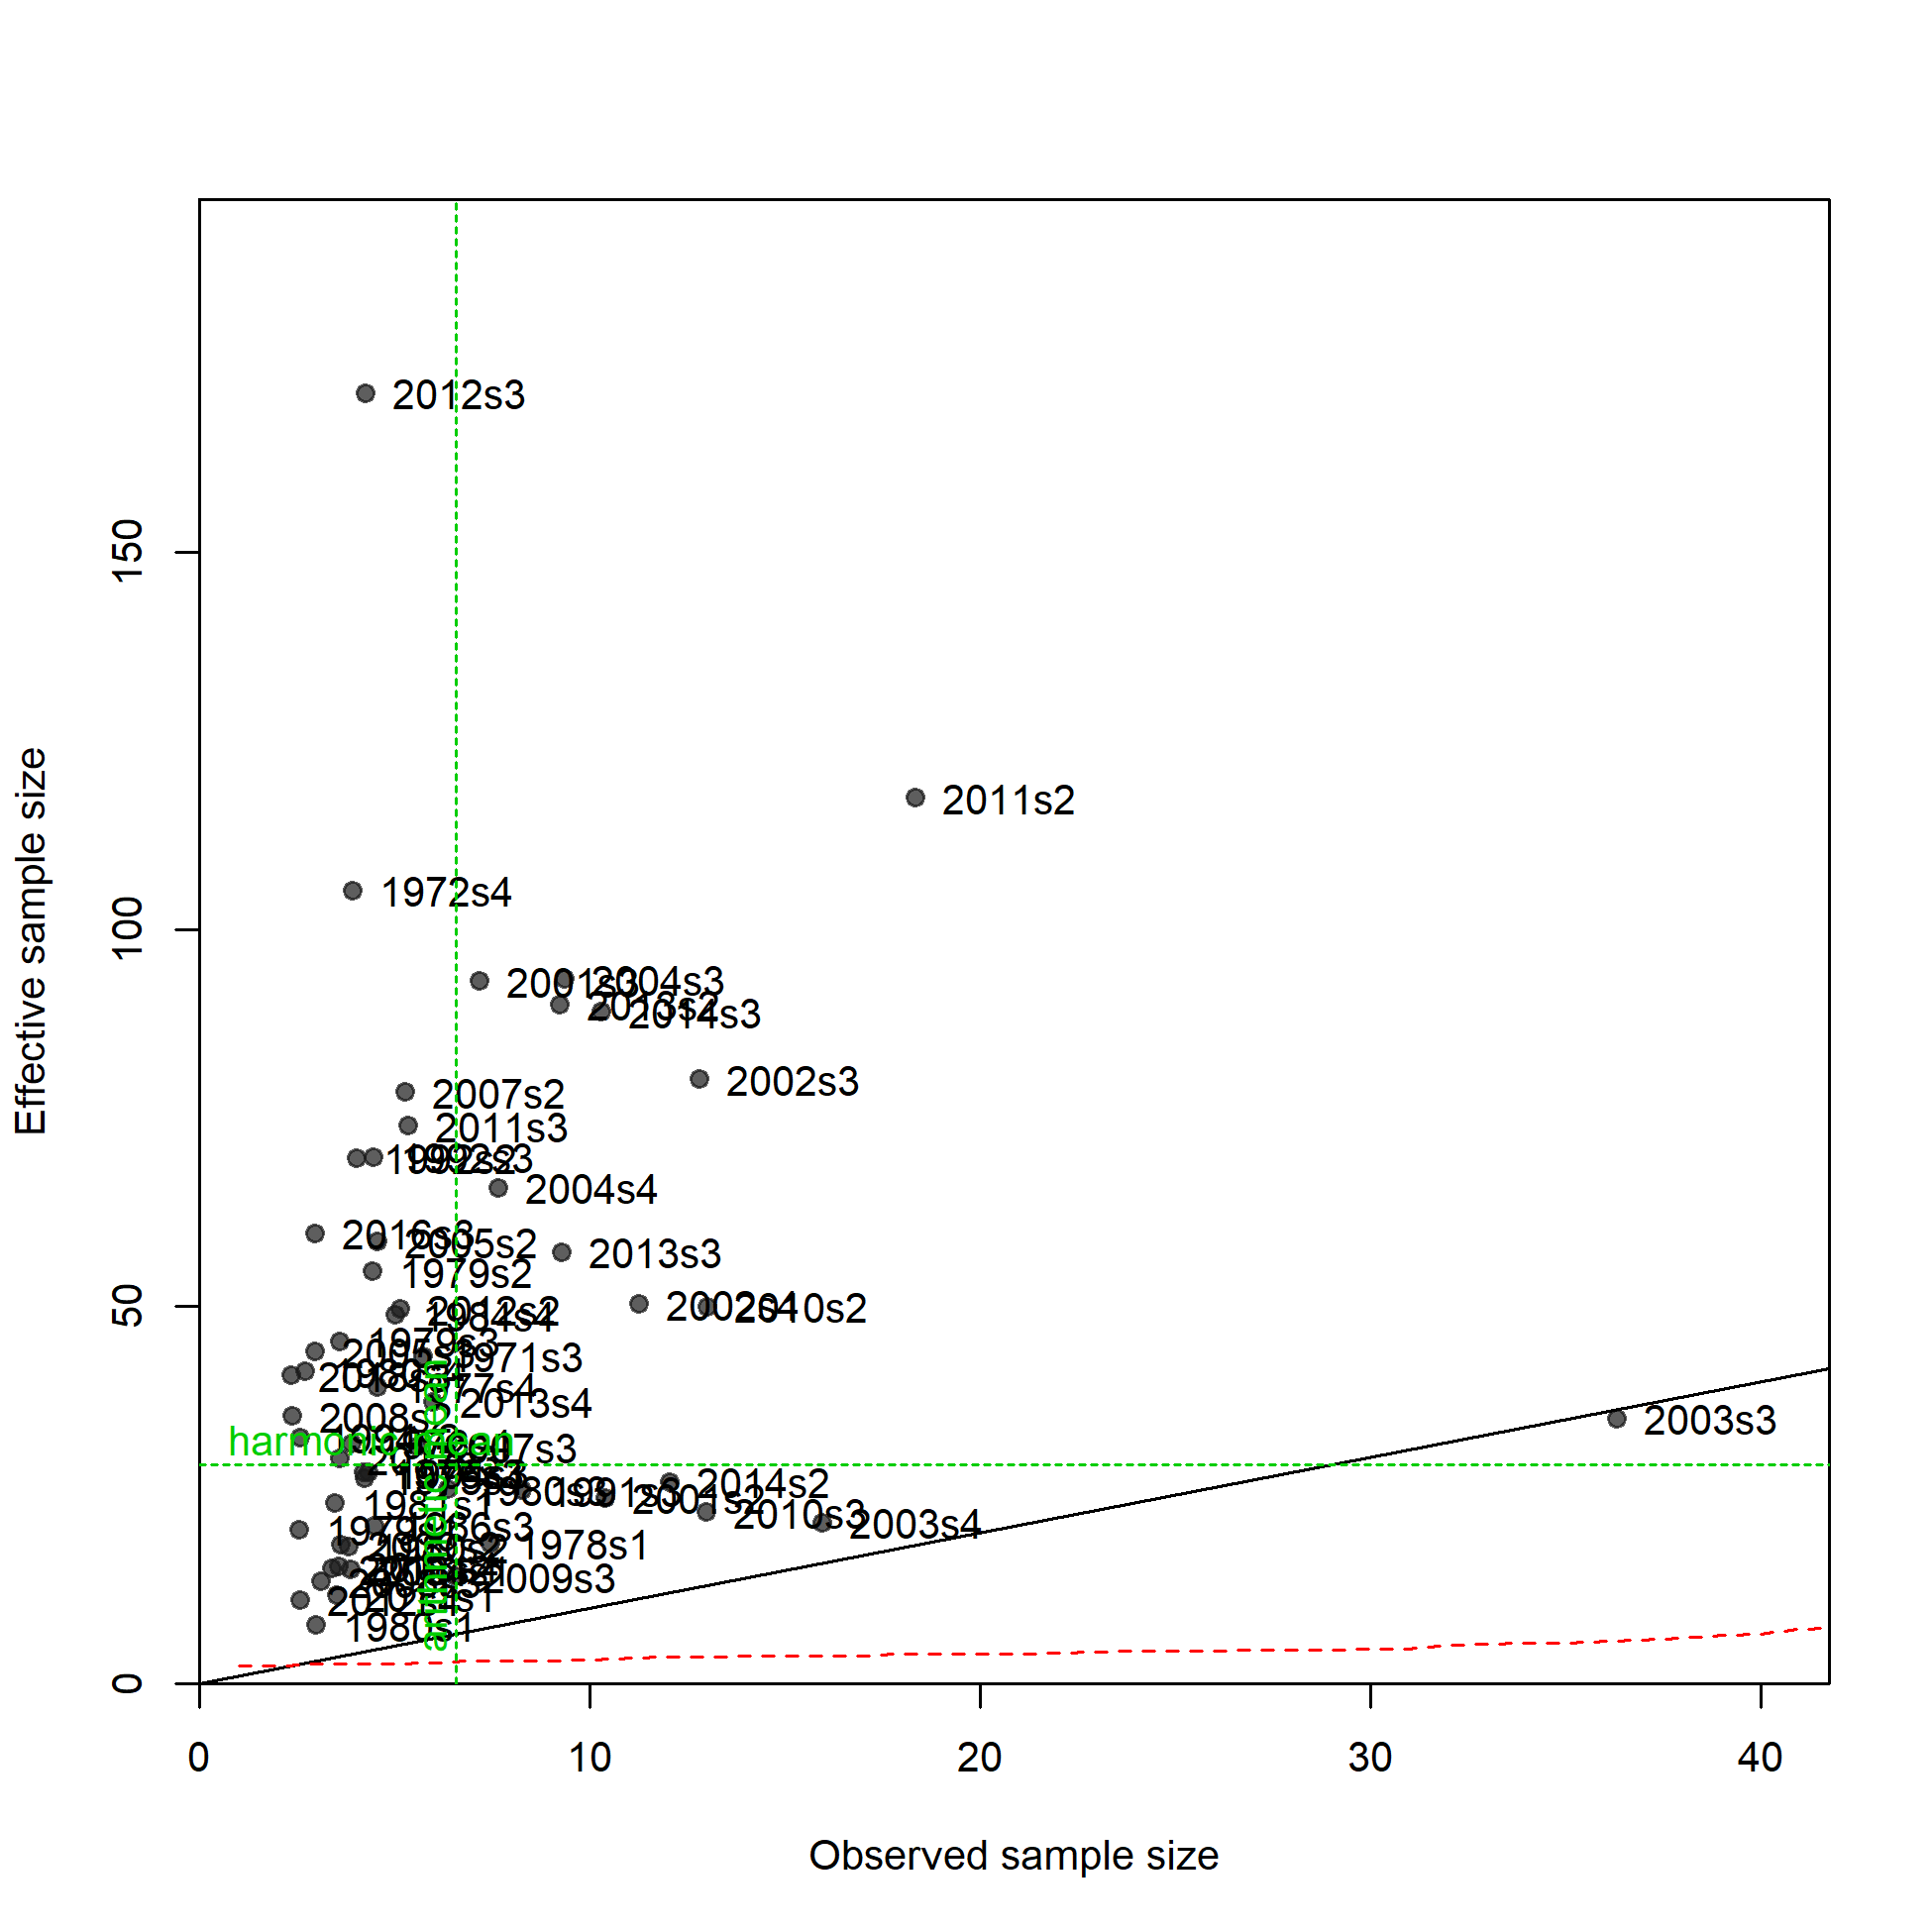
N-EffN comparison, Length comps, whole catch, F12_LL_DW_A4
file: comp_lenfit_sampsize_flt12mkt0.png
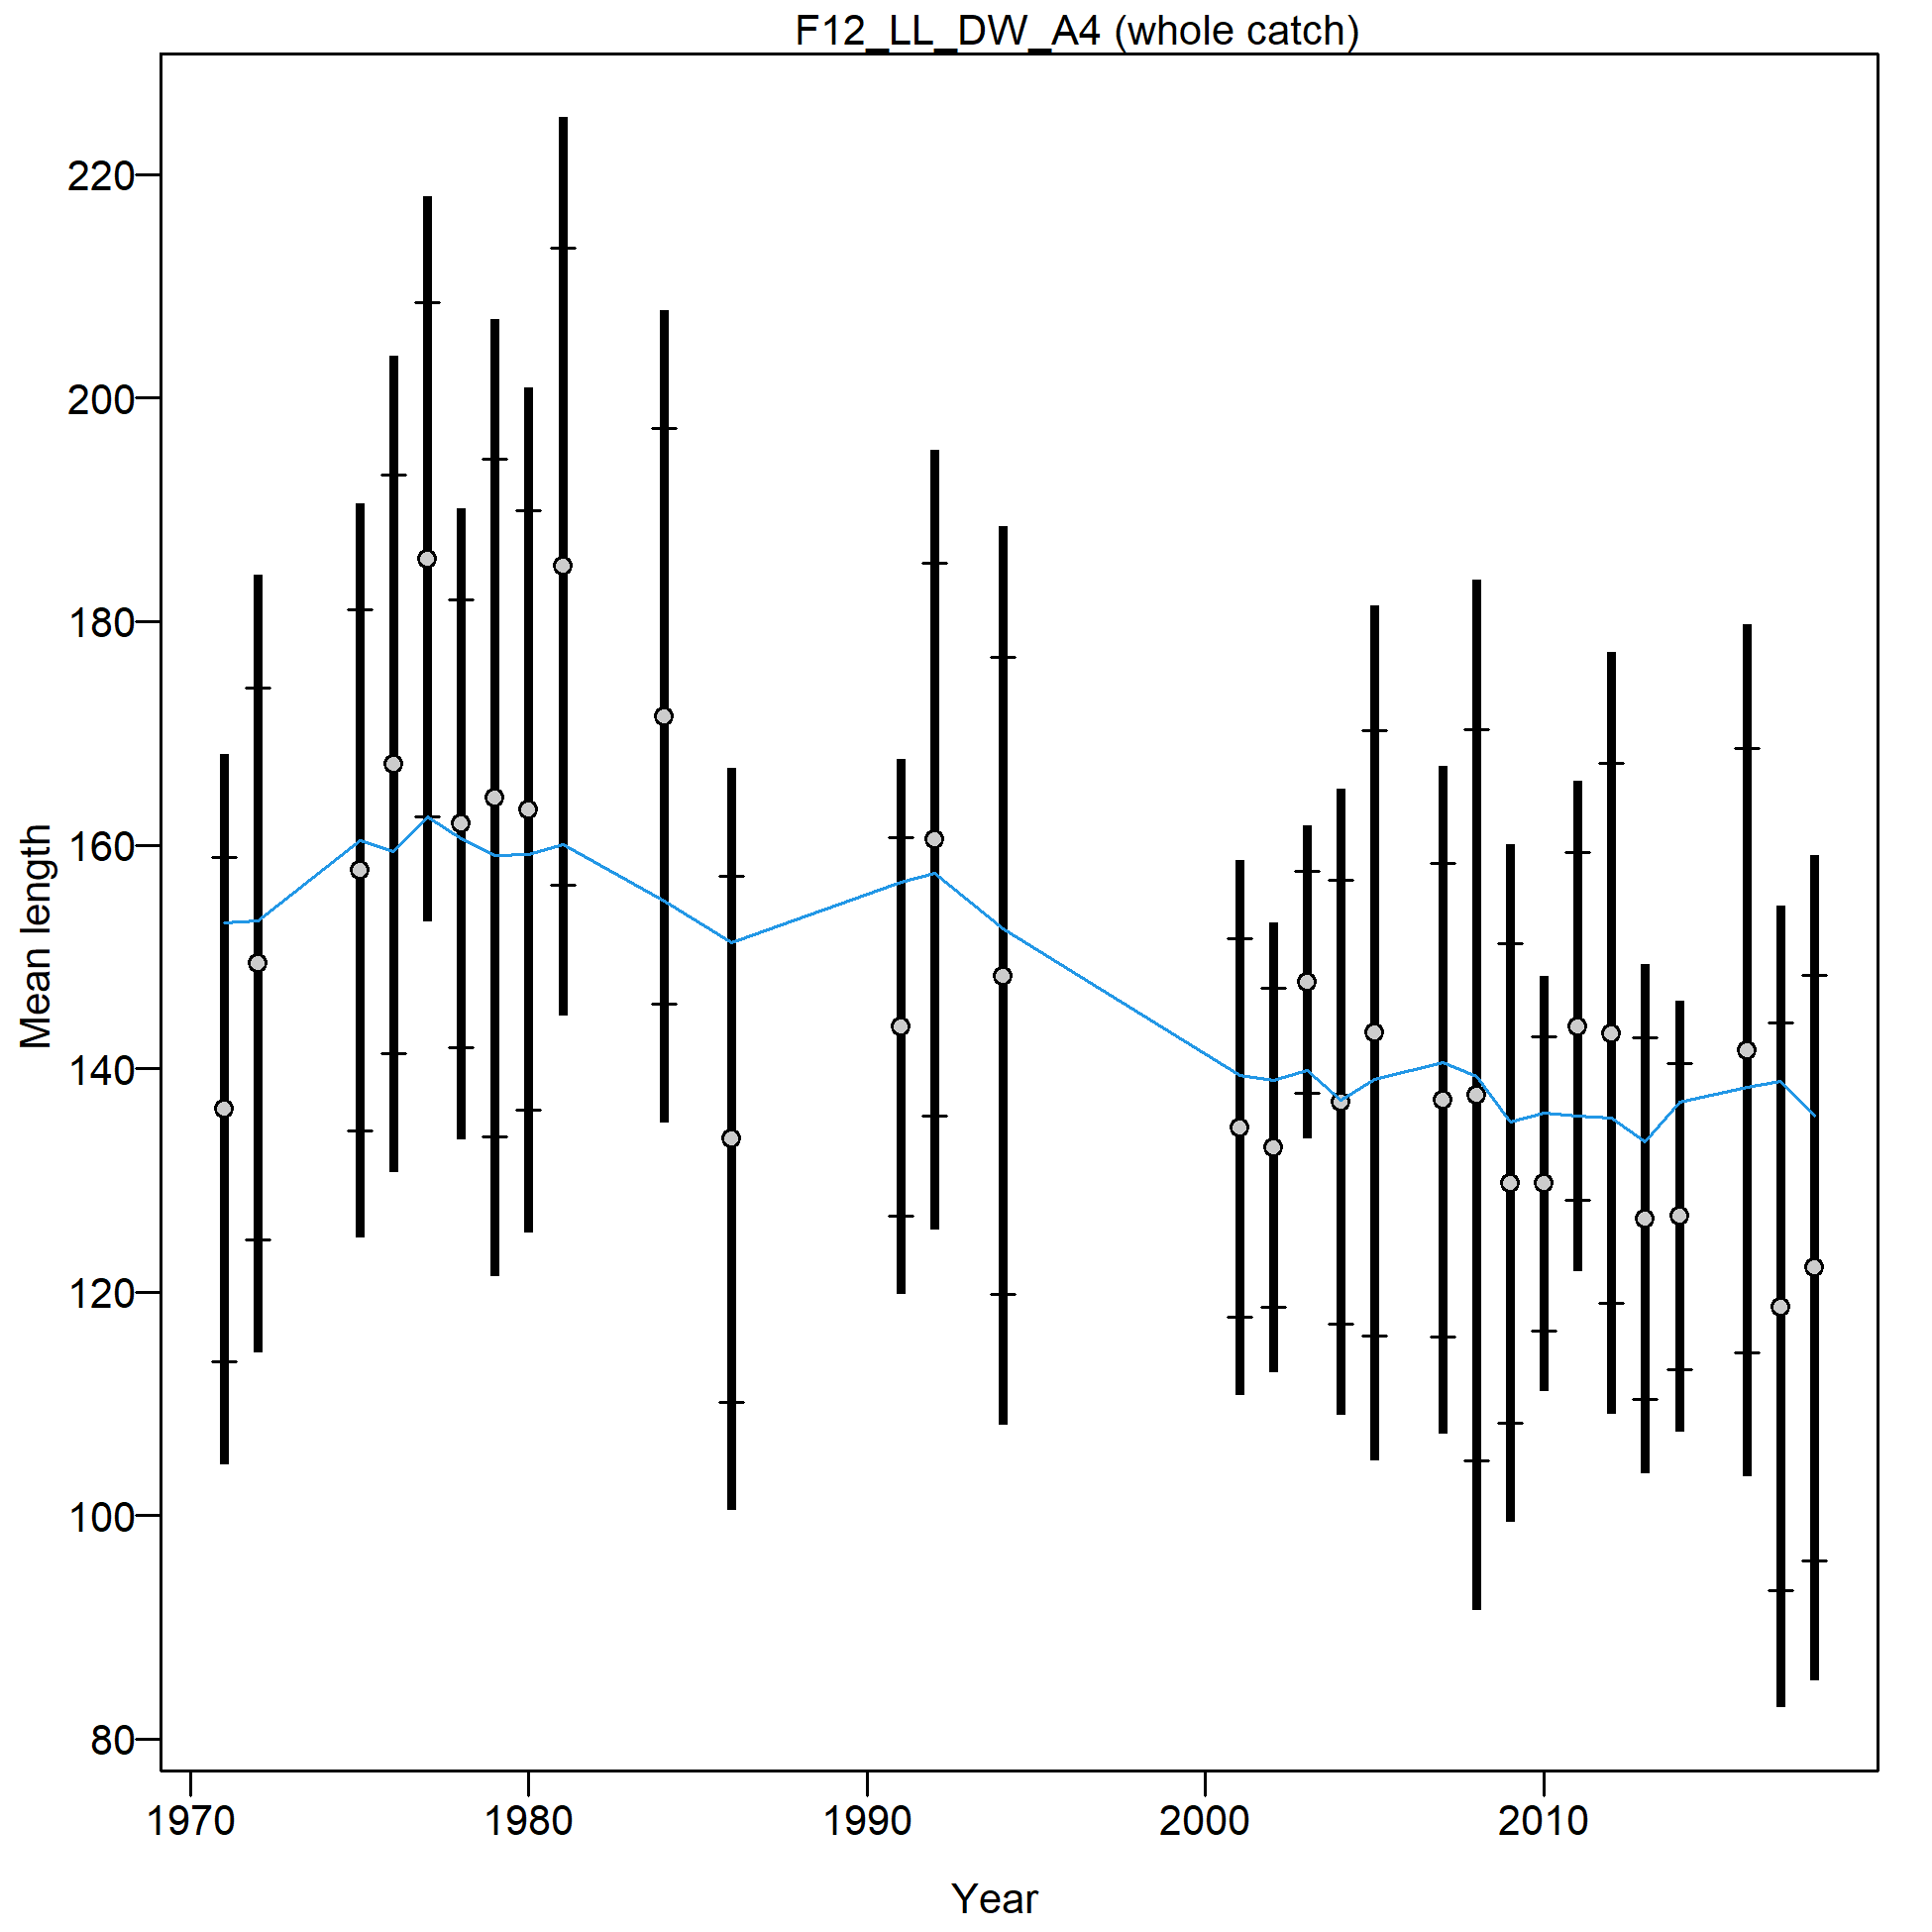
Mean length for F12_LL_DW_A4 with 95% confidence intervals based on current samples sizes.
Francis data weighting method TA1.8: thinner intervals (with capped ends) show result of further adjusting sample sizes based on suggested multiplier (with 95% interval) for len data from F12_LL_DW_A4:
1.9892 (1.4098-3.3902)
For more info, see
Francis, R.I.C.C. (2011). Data weighting in statistical fisheries stock assessment models. Can. J. Fish. Aquat. Sci. 68: 1124-1138. https://doi.org/10.1139/f2011-025
Length comps, whole catch, F13_LL_DW_A5.
'N adj.' is the input sample size after data-weighting adjustment. N eff. is the calculated effective sample size used in the McAllister-Ianelli tuning method.
file: comp_lenfit_flt13mkt0.png
Pearson residuals, whole catch, F13_LL_DW_A5 (max=20.46)
Closed bubbles are positive residuals (observed > expected) and open bubbles are negative residuals (observed < expected).
file: comp_lenfit_residsflt13mkt0.png
N-EffN comparison, Length comps, whole catch, F13_LL_DW_A5
file: comp_lenfit_sampsize_flt13mkt0.png

Mean length for F13_LL_DW_A5 with 95% confidence intervals based on current samples sizes.
Francis data weighting method TA1.8: thinner intervals (with capped ends) show result of further adjusting sample sizes based on suggested multiplier (with 95% interval) for len data from F13_LL_DW_A5:
1.0216 (0.5572-3.5169)
For more info, see
Francis, R.I.C.C. (2011). Data weighting in statistical fisheries stock assessment models. Can. J. Fish. Aquat. Sci. 68: 1124-1138. https://doi.org/10.1139/f2011-025
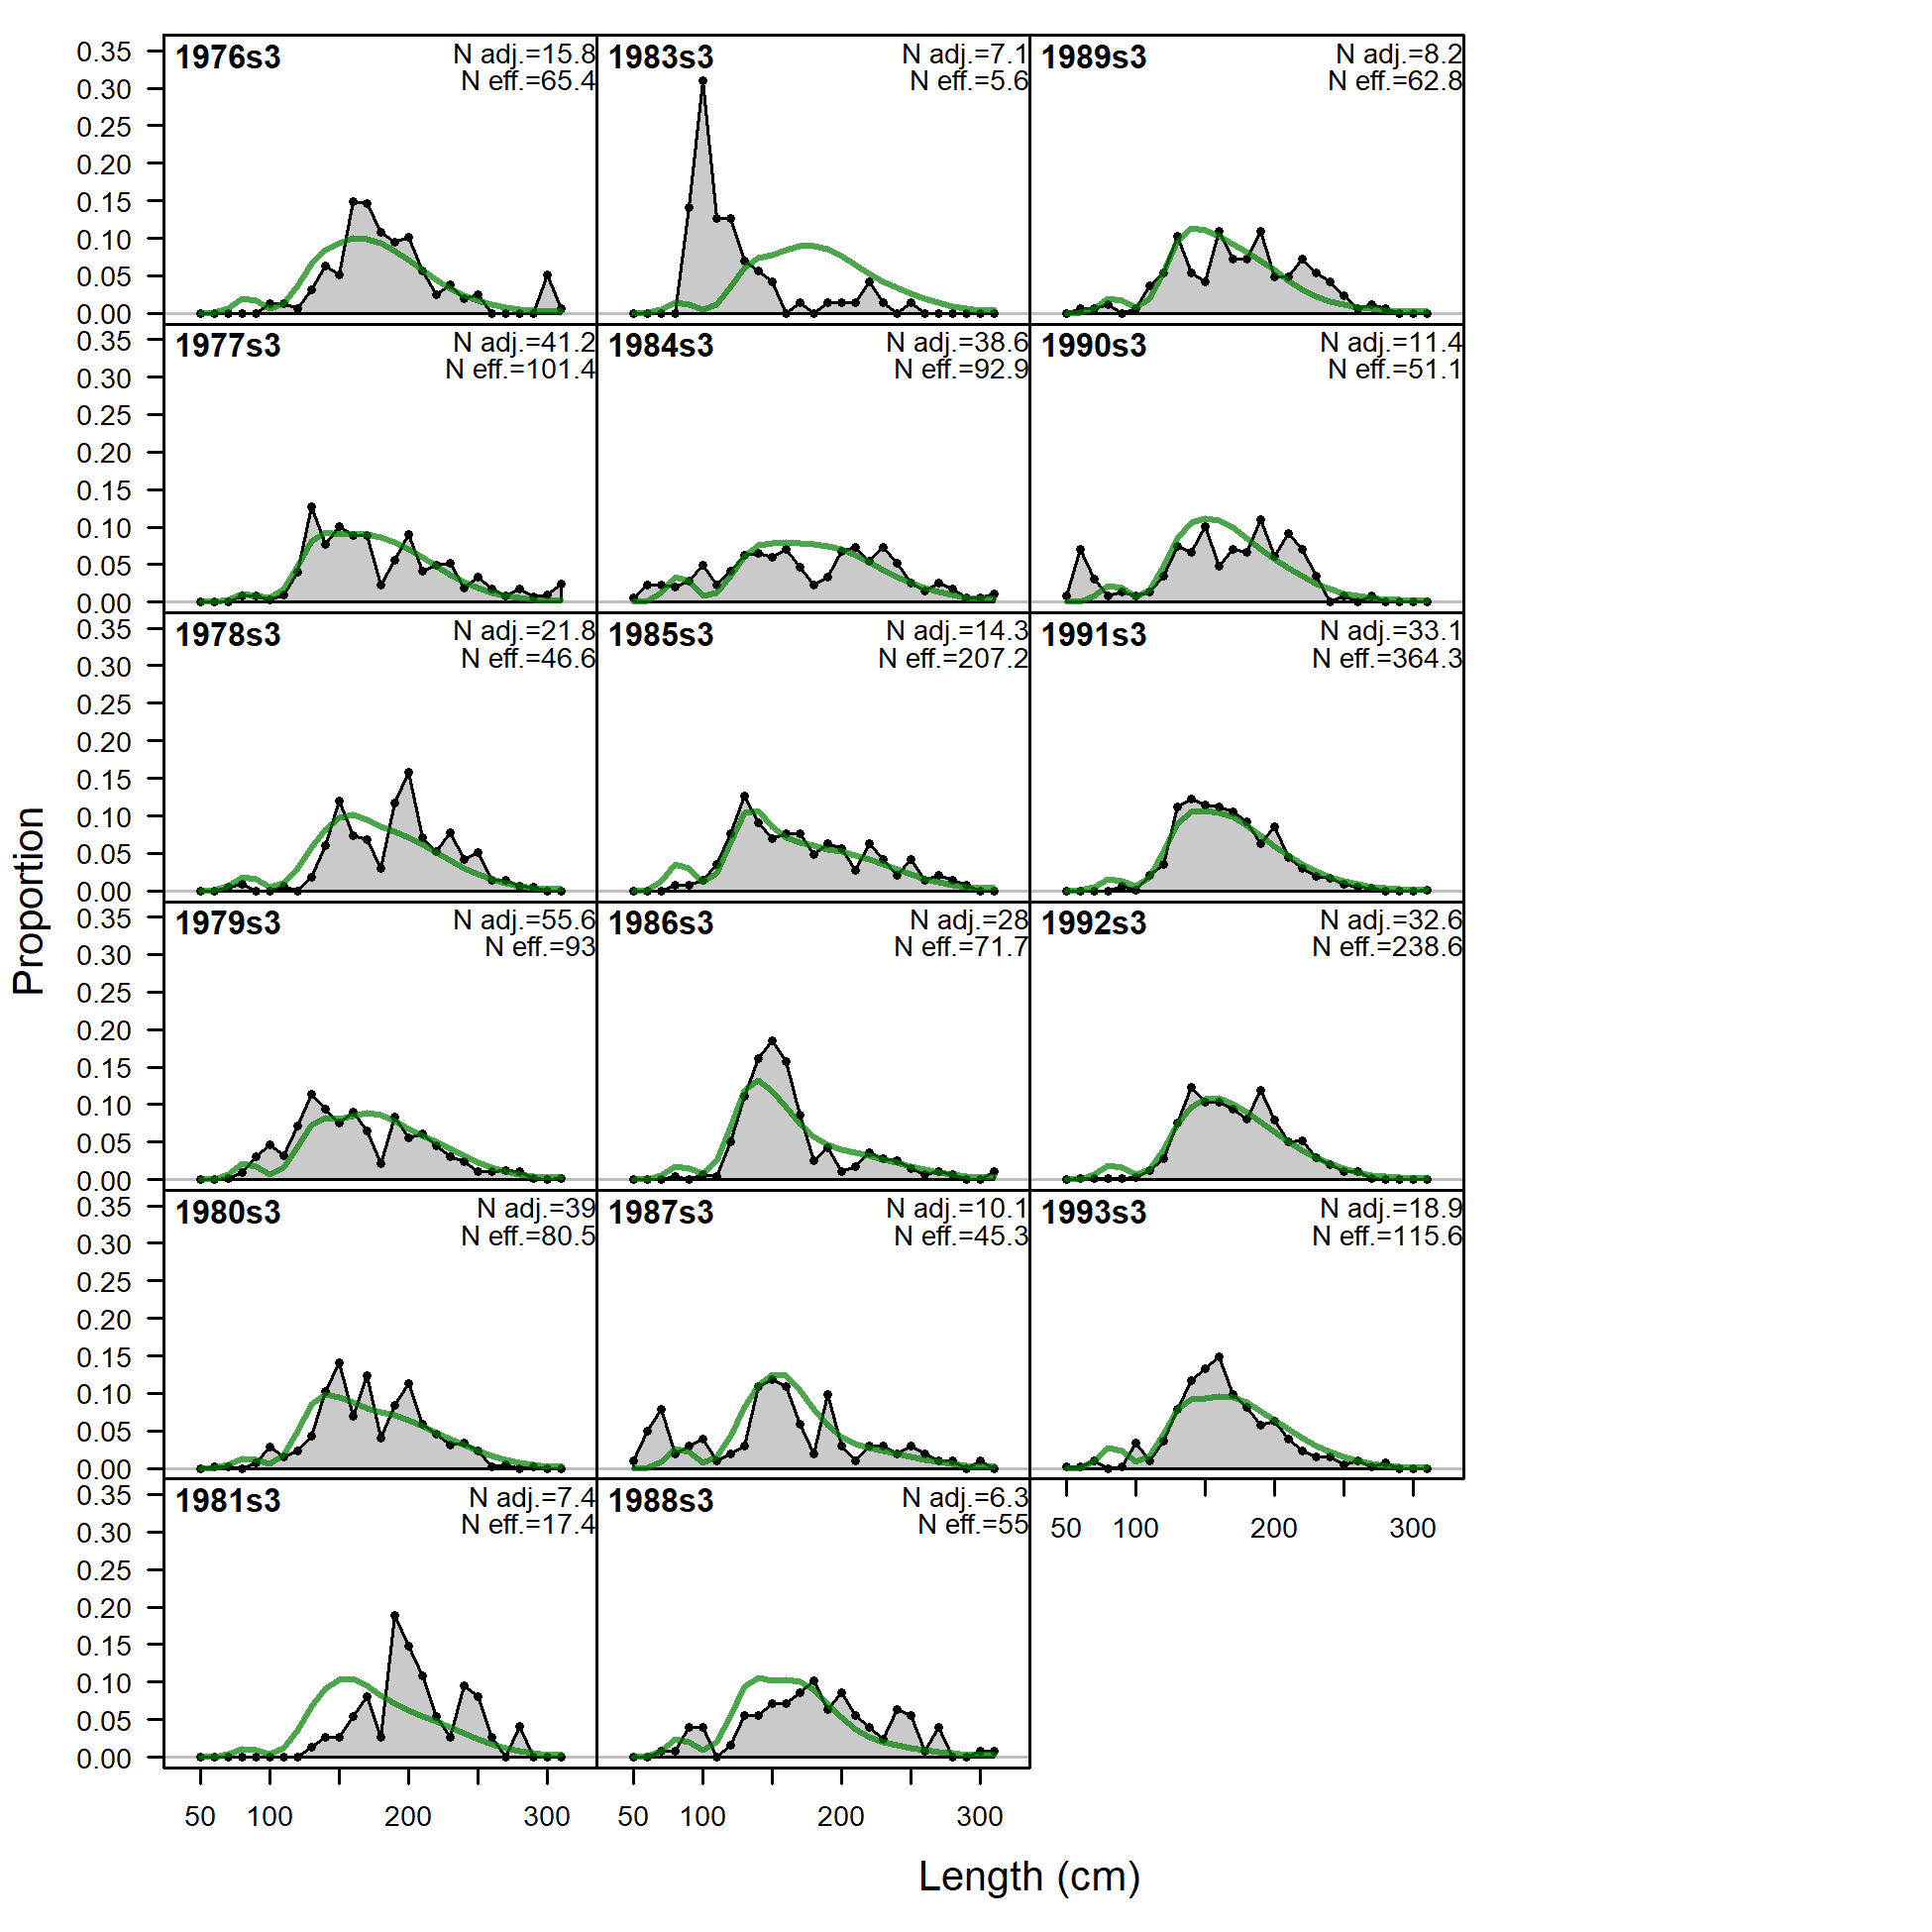
Length comps, whole catch, I3_JPN_early.
'N adj.' is the input sample size after data-weighting adjustment. N eff. is the calculated effective sample size used in the McAllister-Ianelli tuning method.
file: comp_lenfit_flt24mkt0.png

Pearson residuals, whole catch, I3_JPN_early (max=11.31)
Closed bubbles are positive residuals (observed > expected) and open bubbles are negative residuals (observed < expected).
file: comp_lenfit_residsflt24mkt0.png
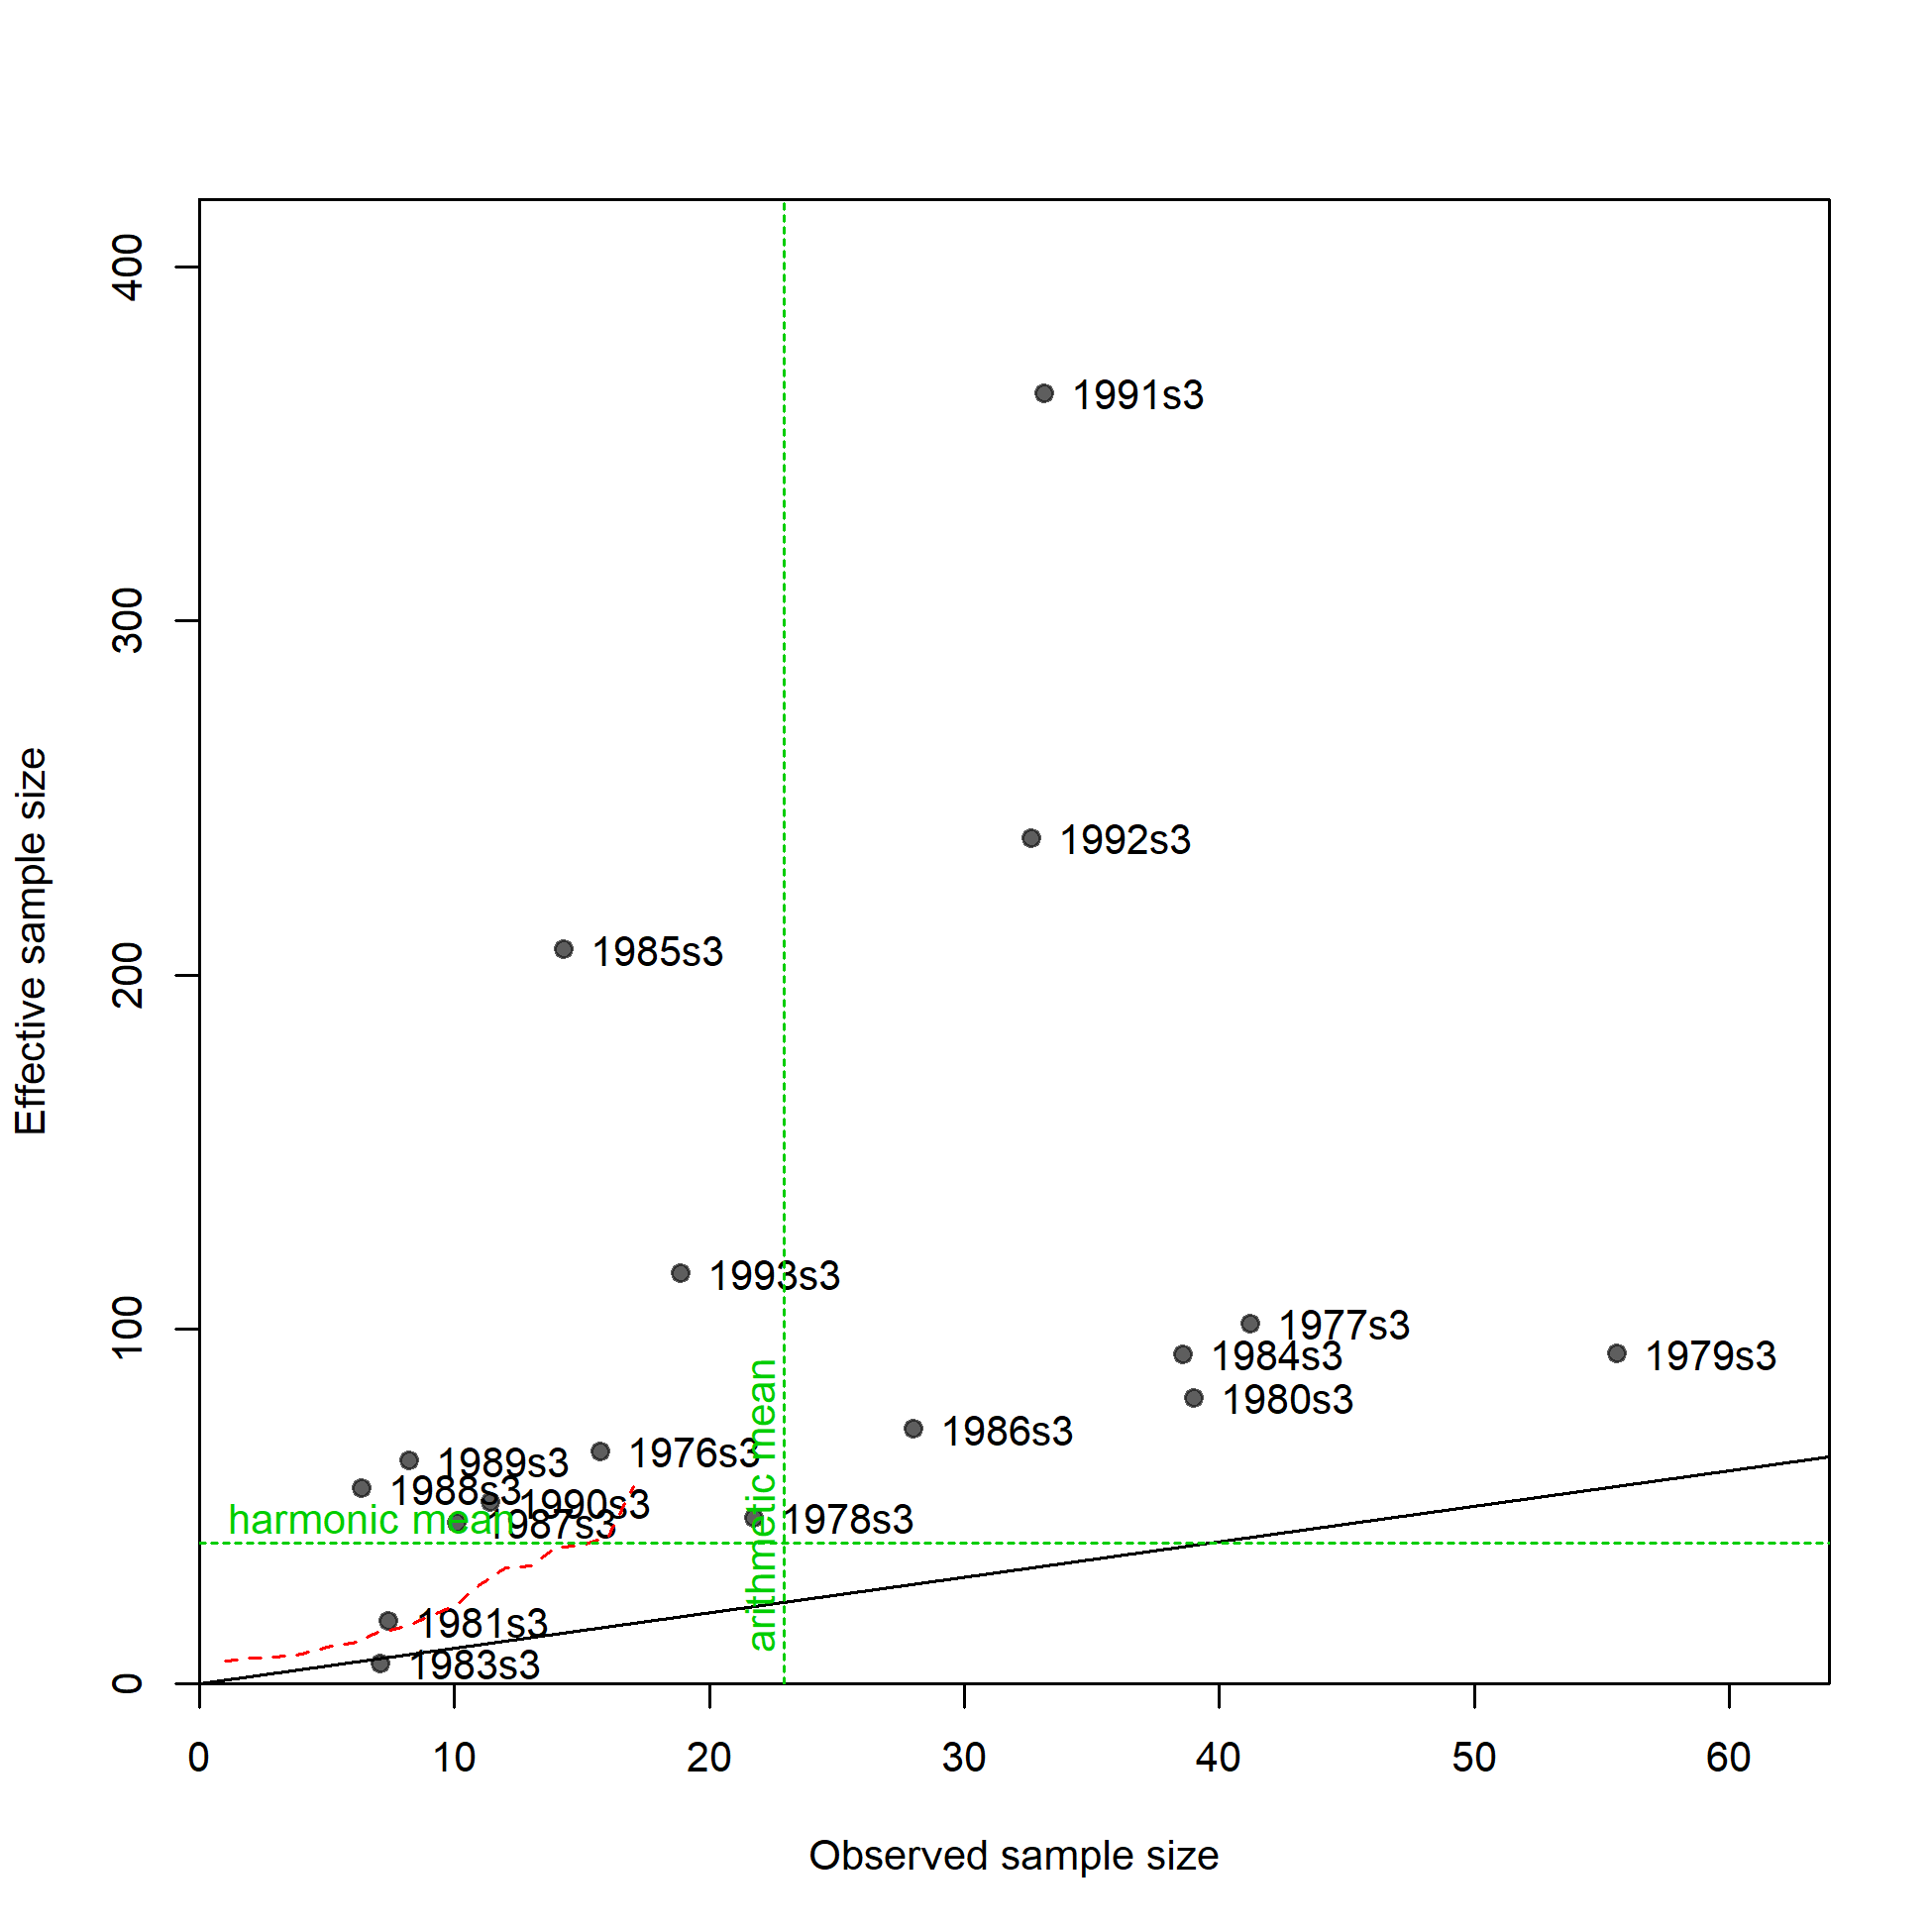
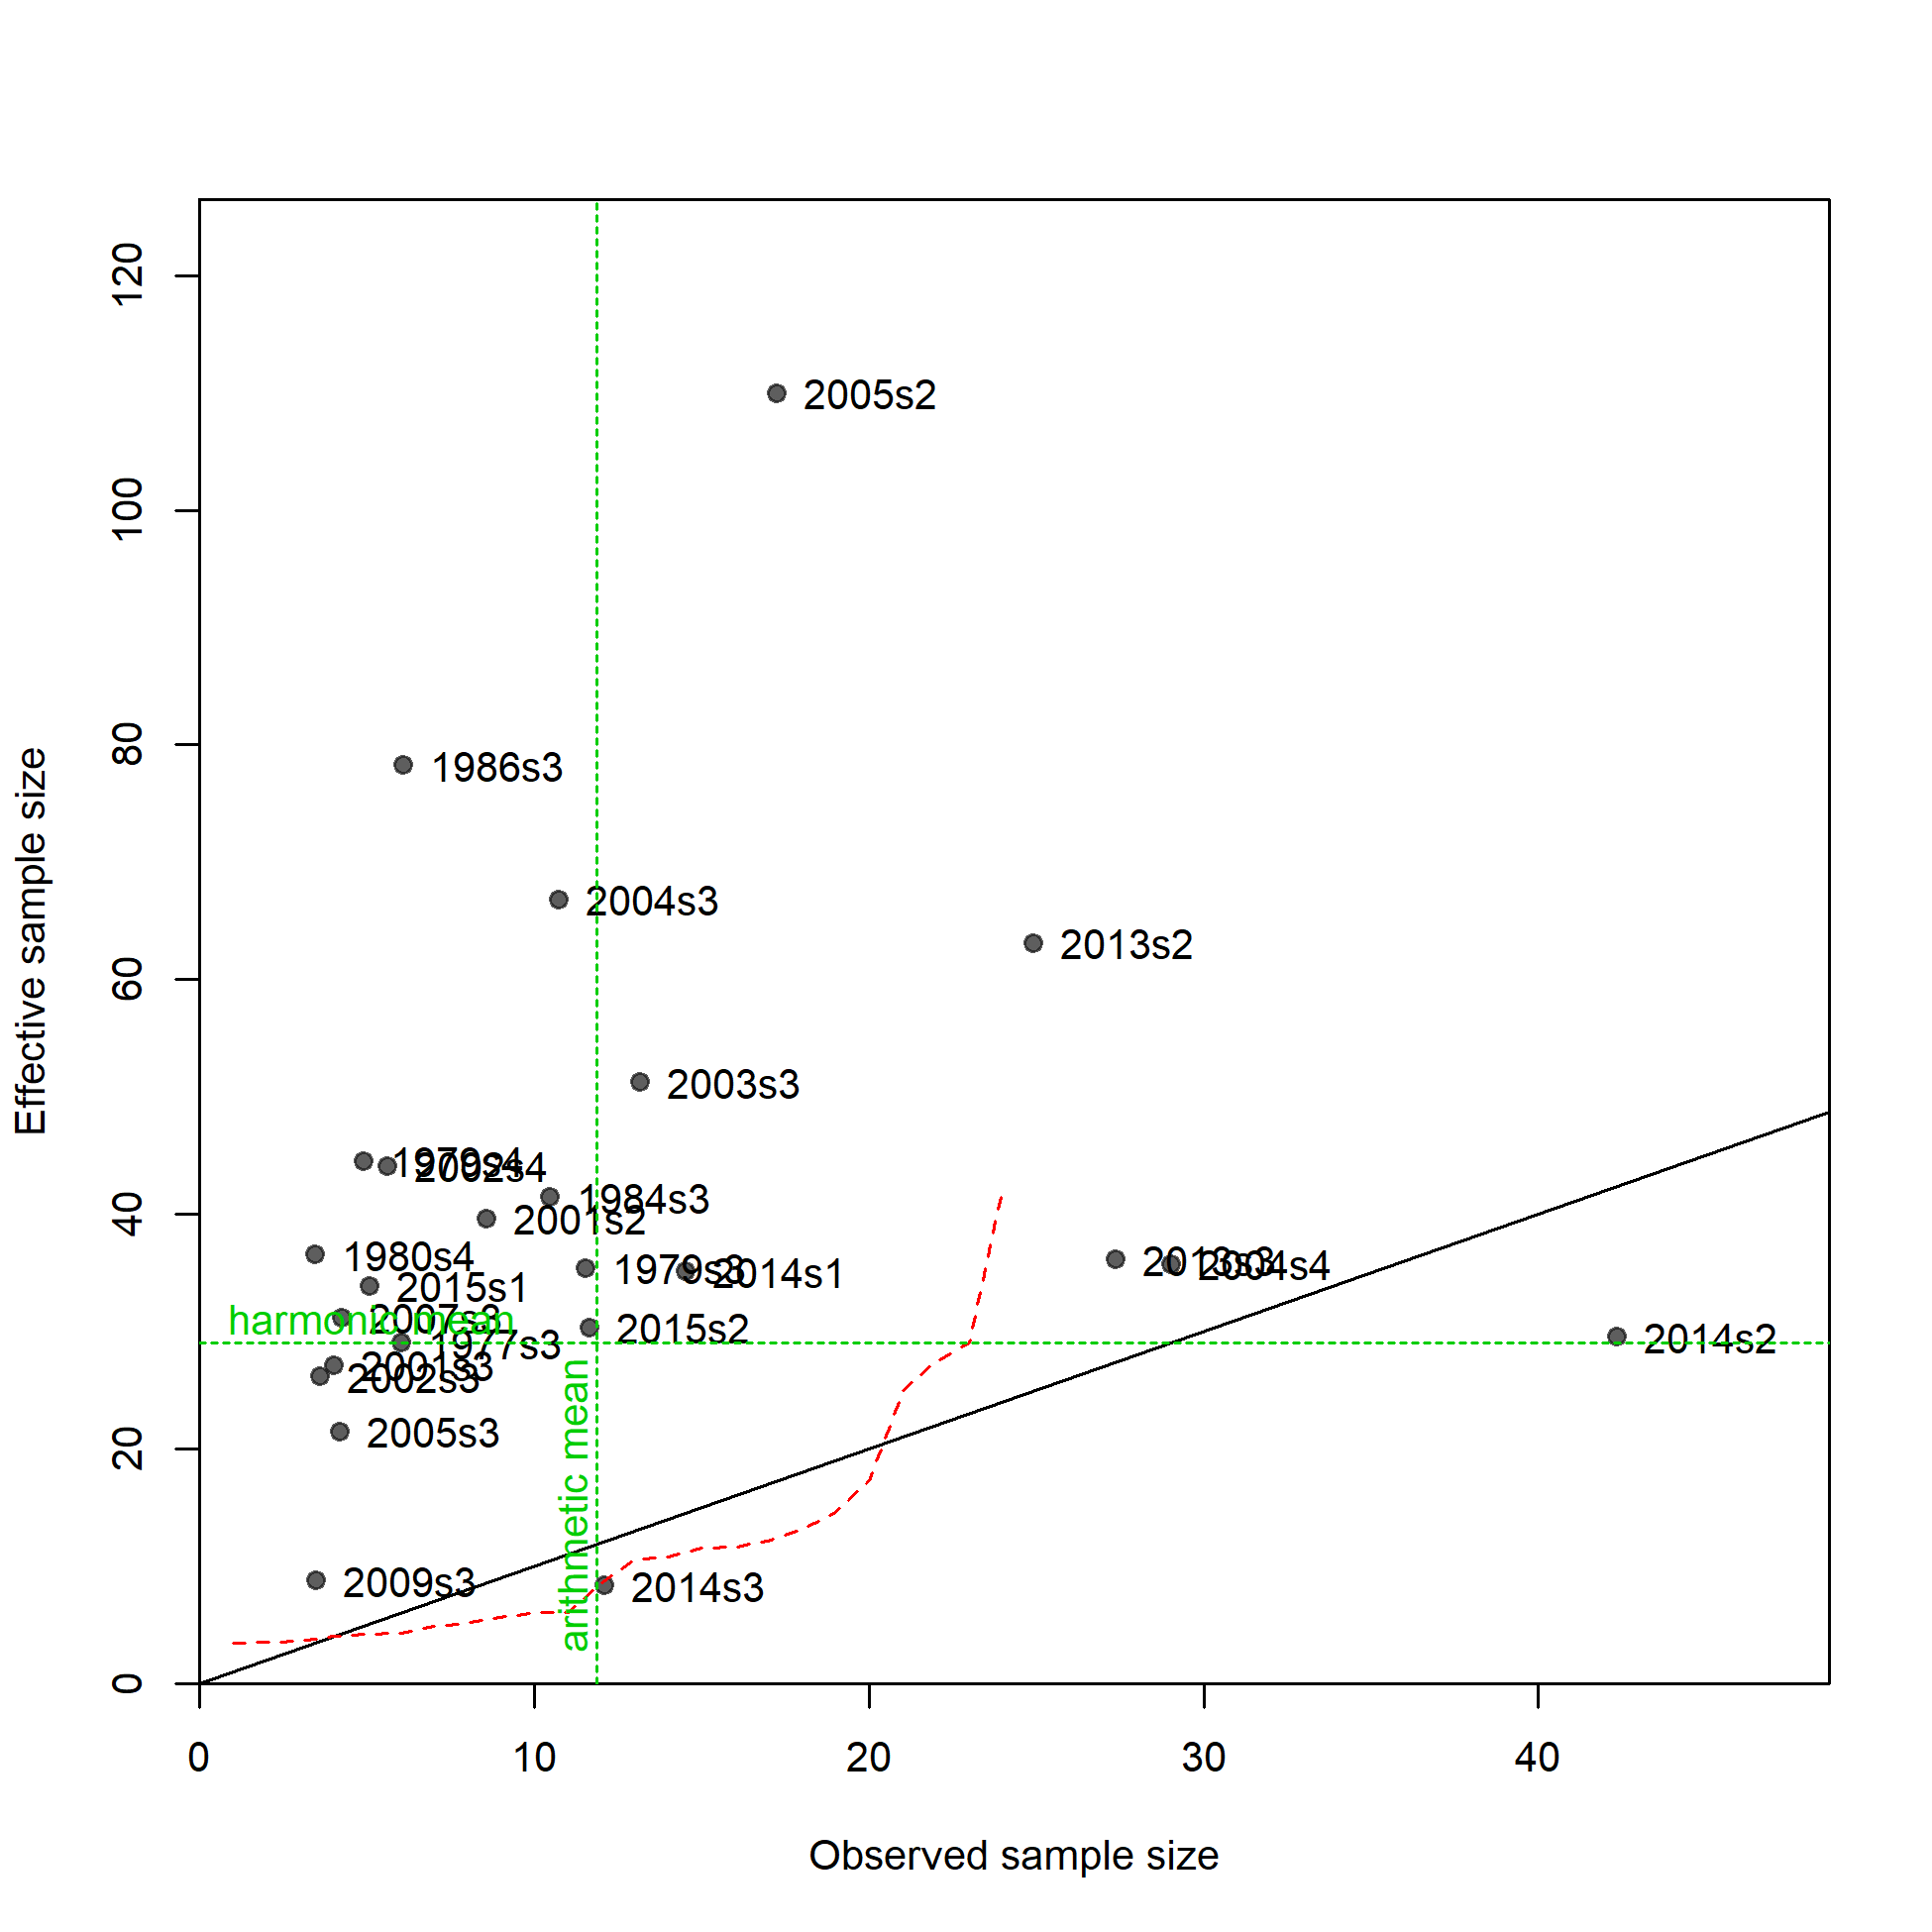
N-EffN comparison, Length comps, whole catch, I3_JPN_early
file: comp_lenfit_sampsize_flt24mkt0.png
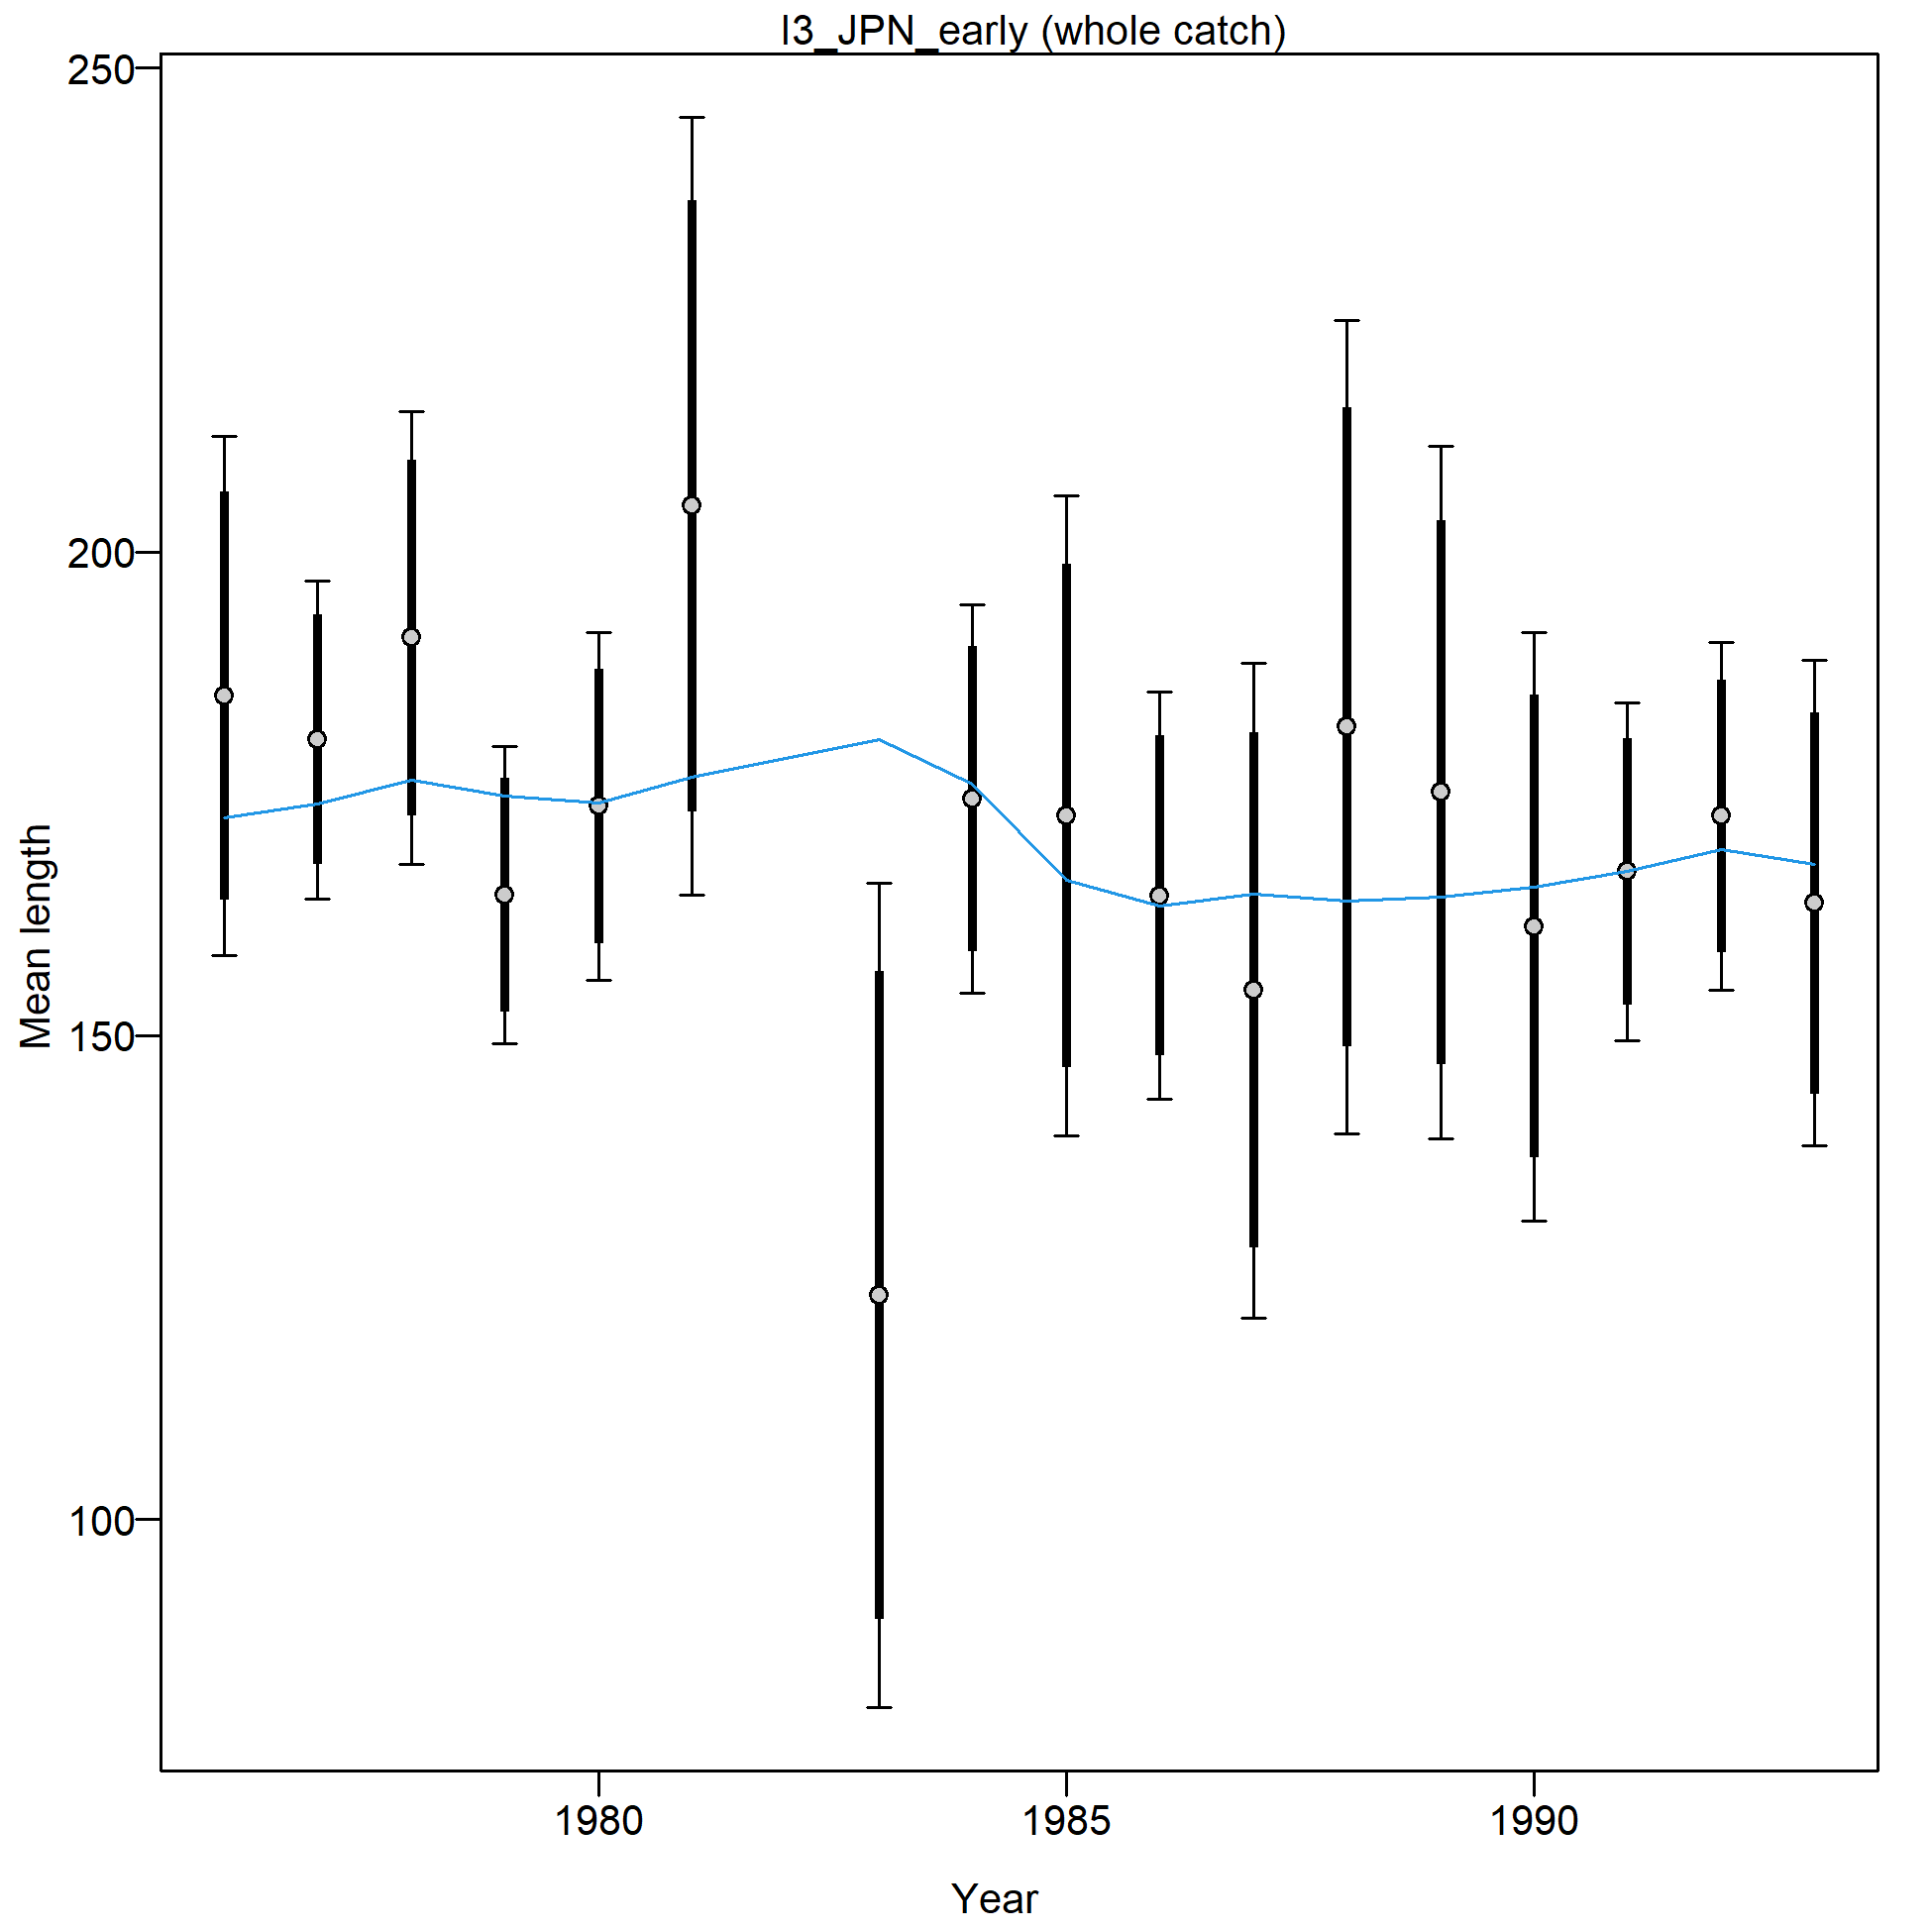
Mean length for I3_JPN_early with 95% confidence intervals based on current samples sizes.
Francis data weighting method TA1.8: thinner intervals (with capped ends) show result of further adjusting sample sizes based on suggested multiplier (with 95% interval) for len data from I3_JPN_early:
0.6179 (0.3324-2.1173)
For more info, see
Francis, R.I.C.C. (2011). Data weighting in statistical fisheries stock assessment models. Can. J. Fish. Aquat. Sci. 68: 1124-1138. https://doi.org/10.1139/f2011-025
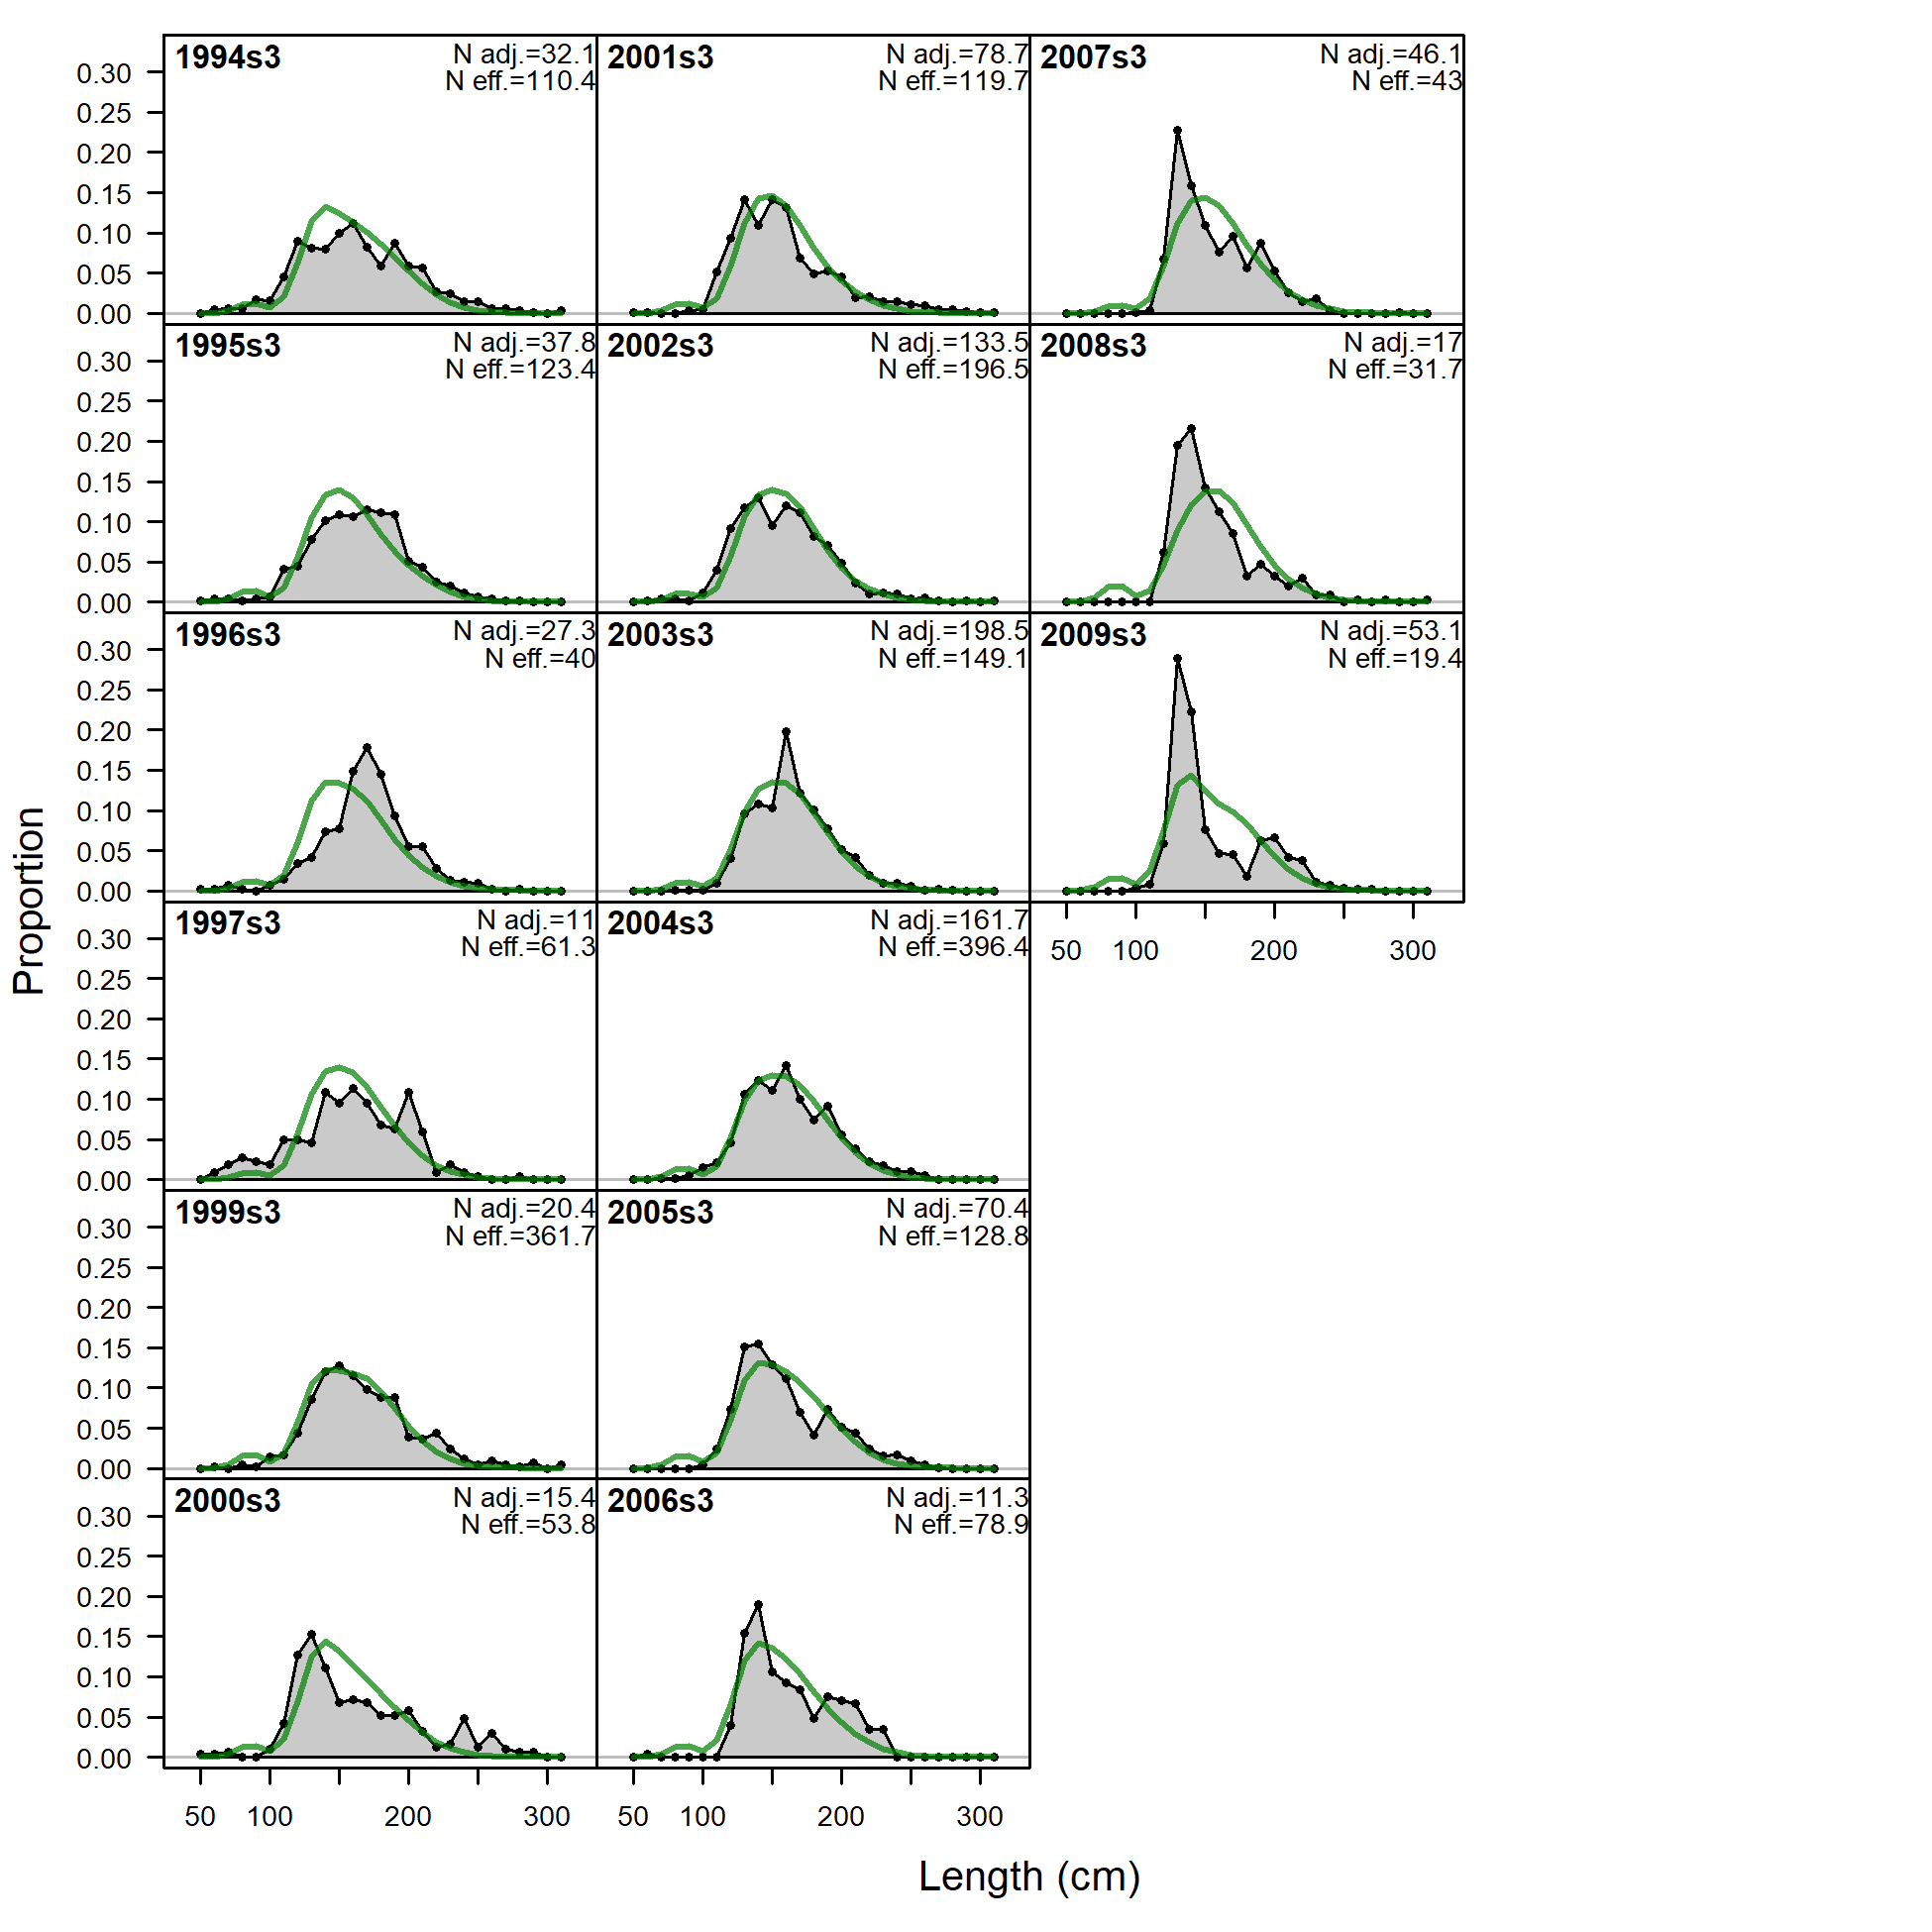
Length comps, whole catch, I4_JPN_mid.
'N adj.' is the input sample size after data-weighting adjustment. N eff. is the calculated effective sample size used in the McAllister-Ianelli tuning method.
file: comp_lenfit_flt25mkt0.png
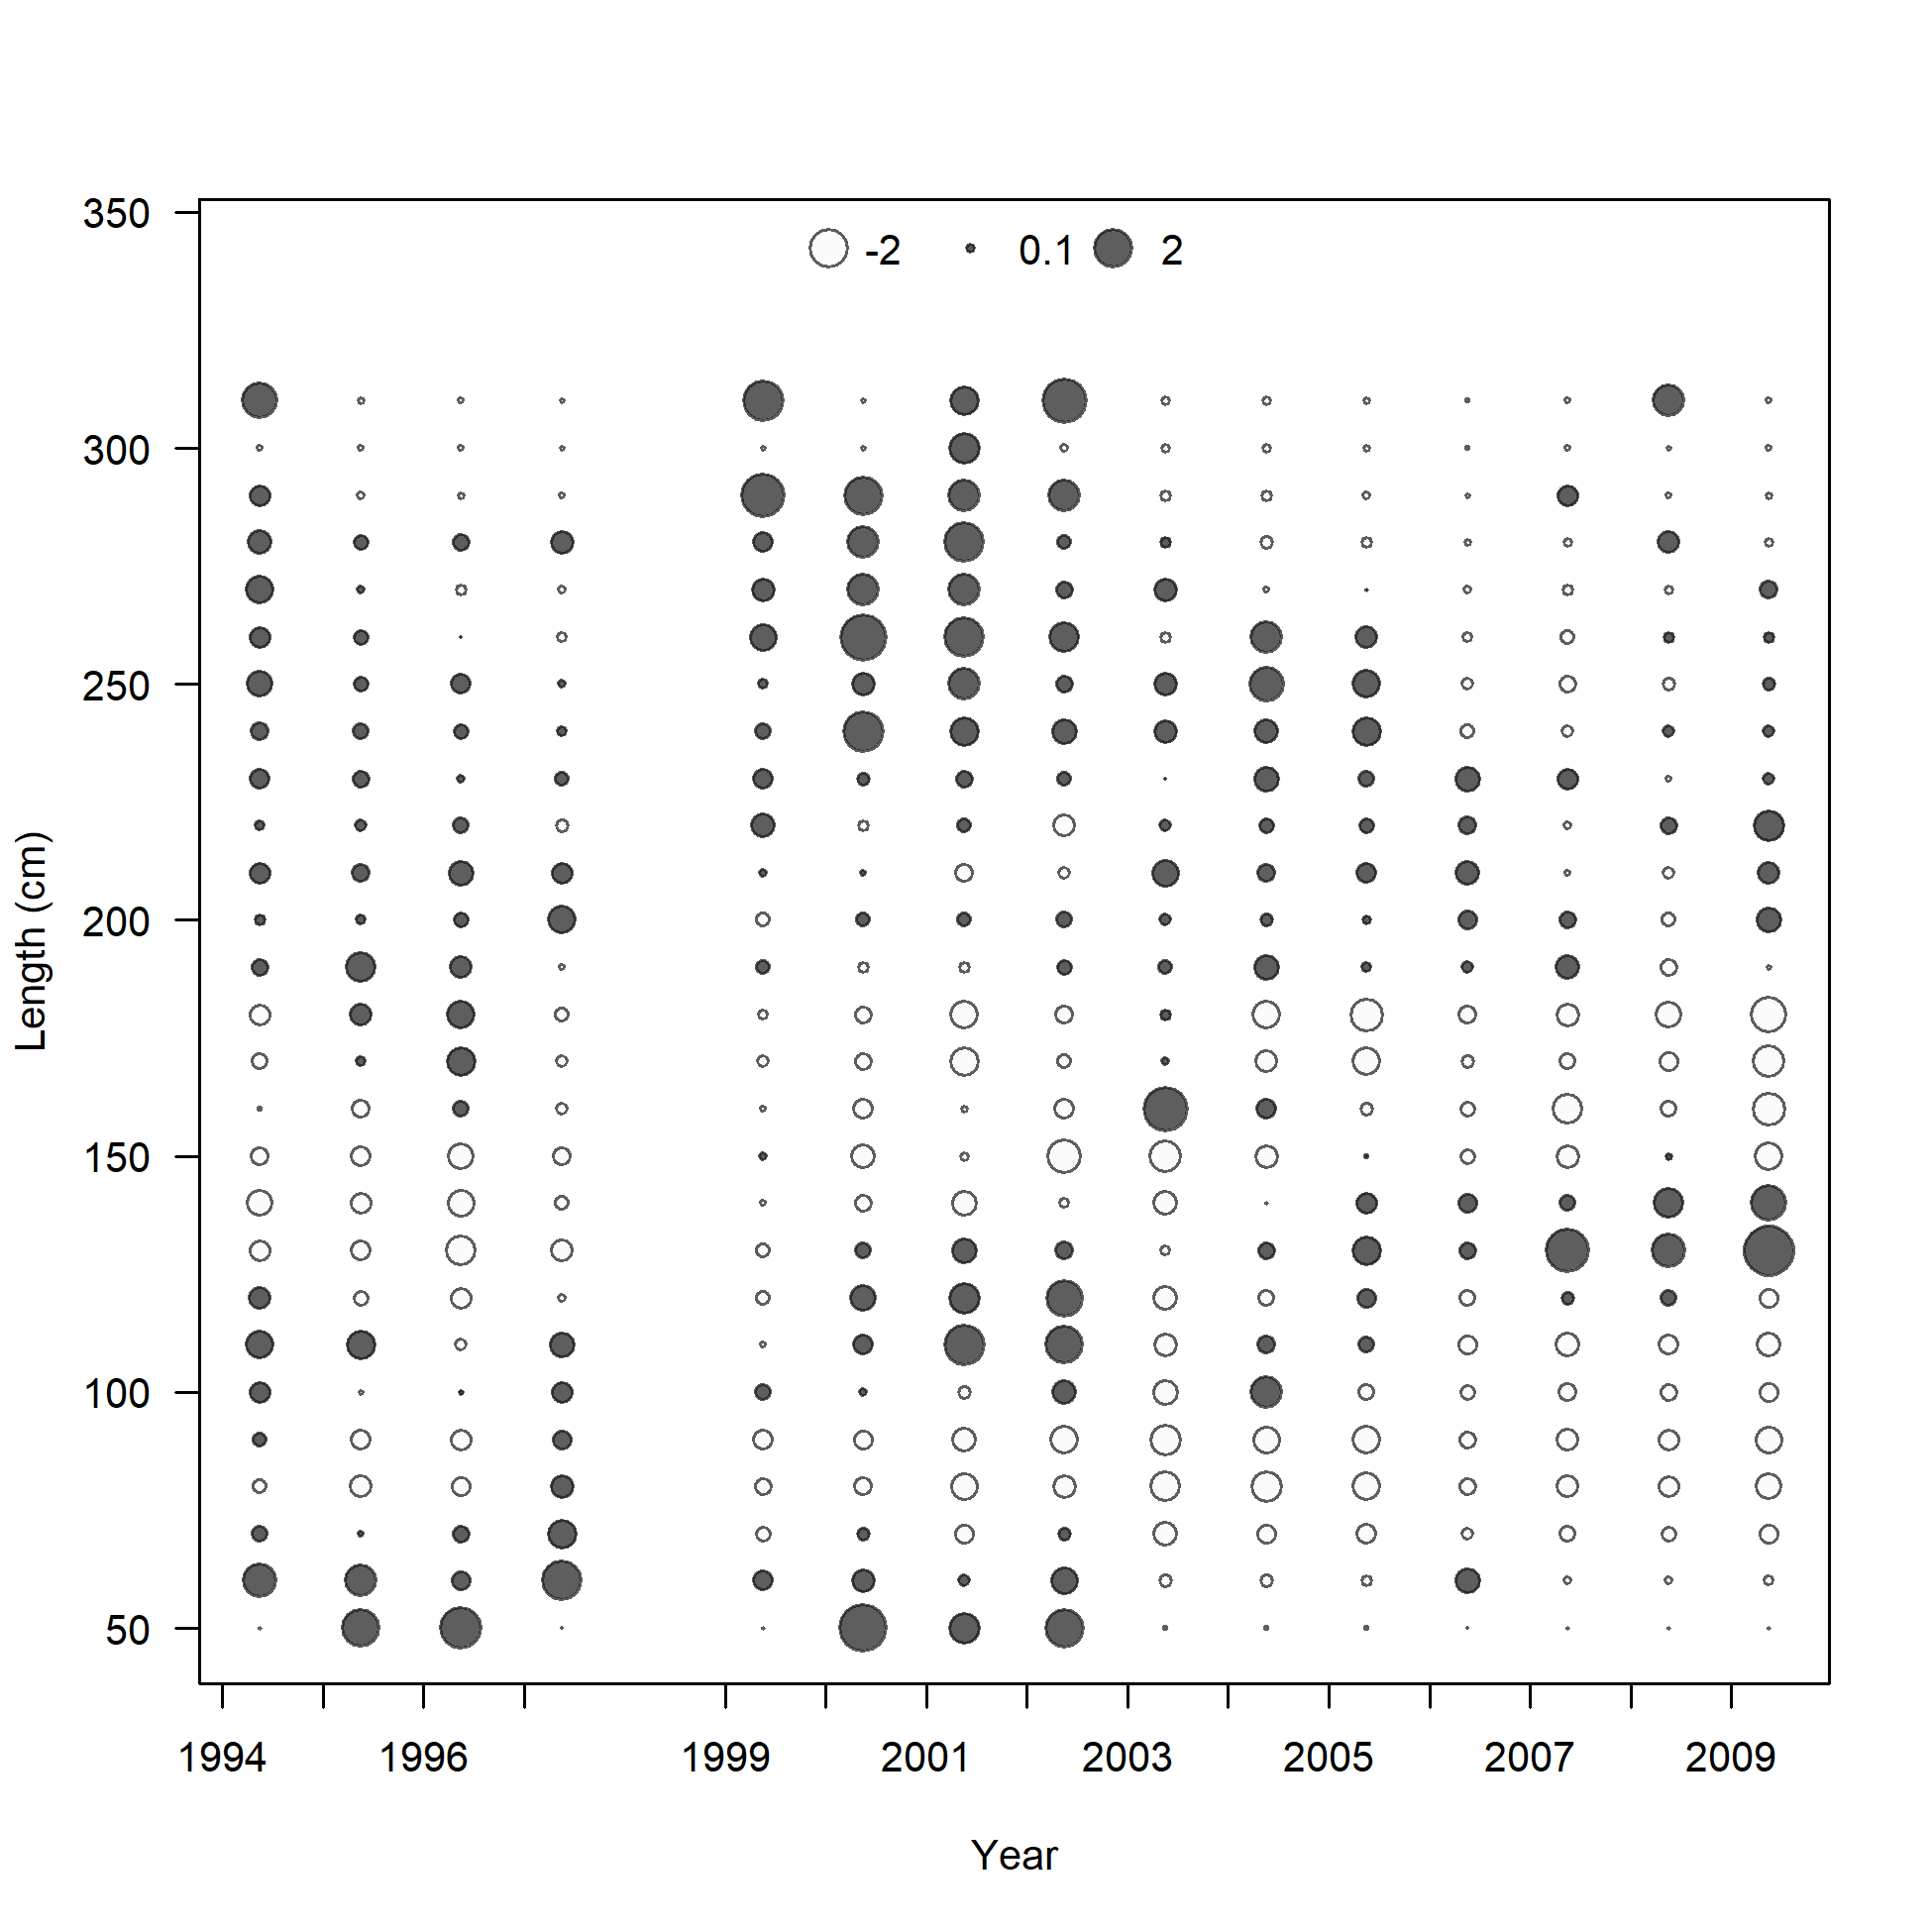
Pearson residuals, whole catch, I4_JPN_mid (max=3.39)
Closed bubbles are positive residuals (observed > expected) and open bubbles are negative residuals (observed < expected).
file: comp_lenfit_residsflt25mkt0.png
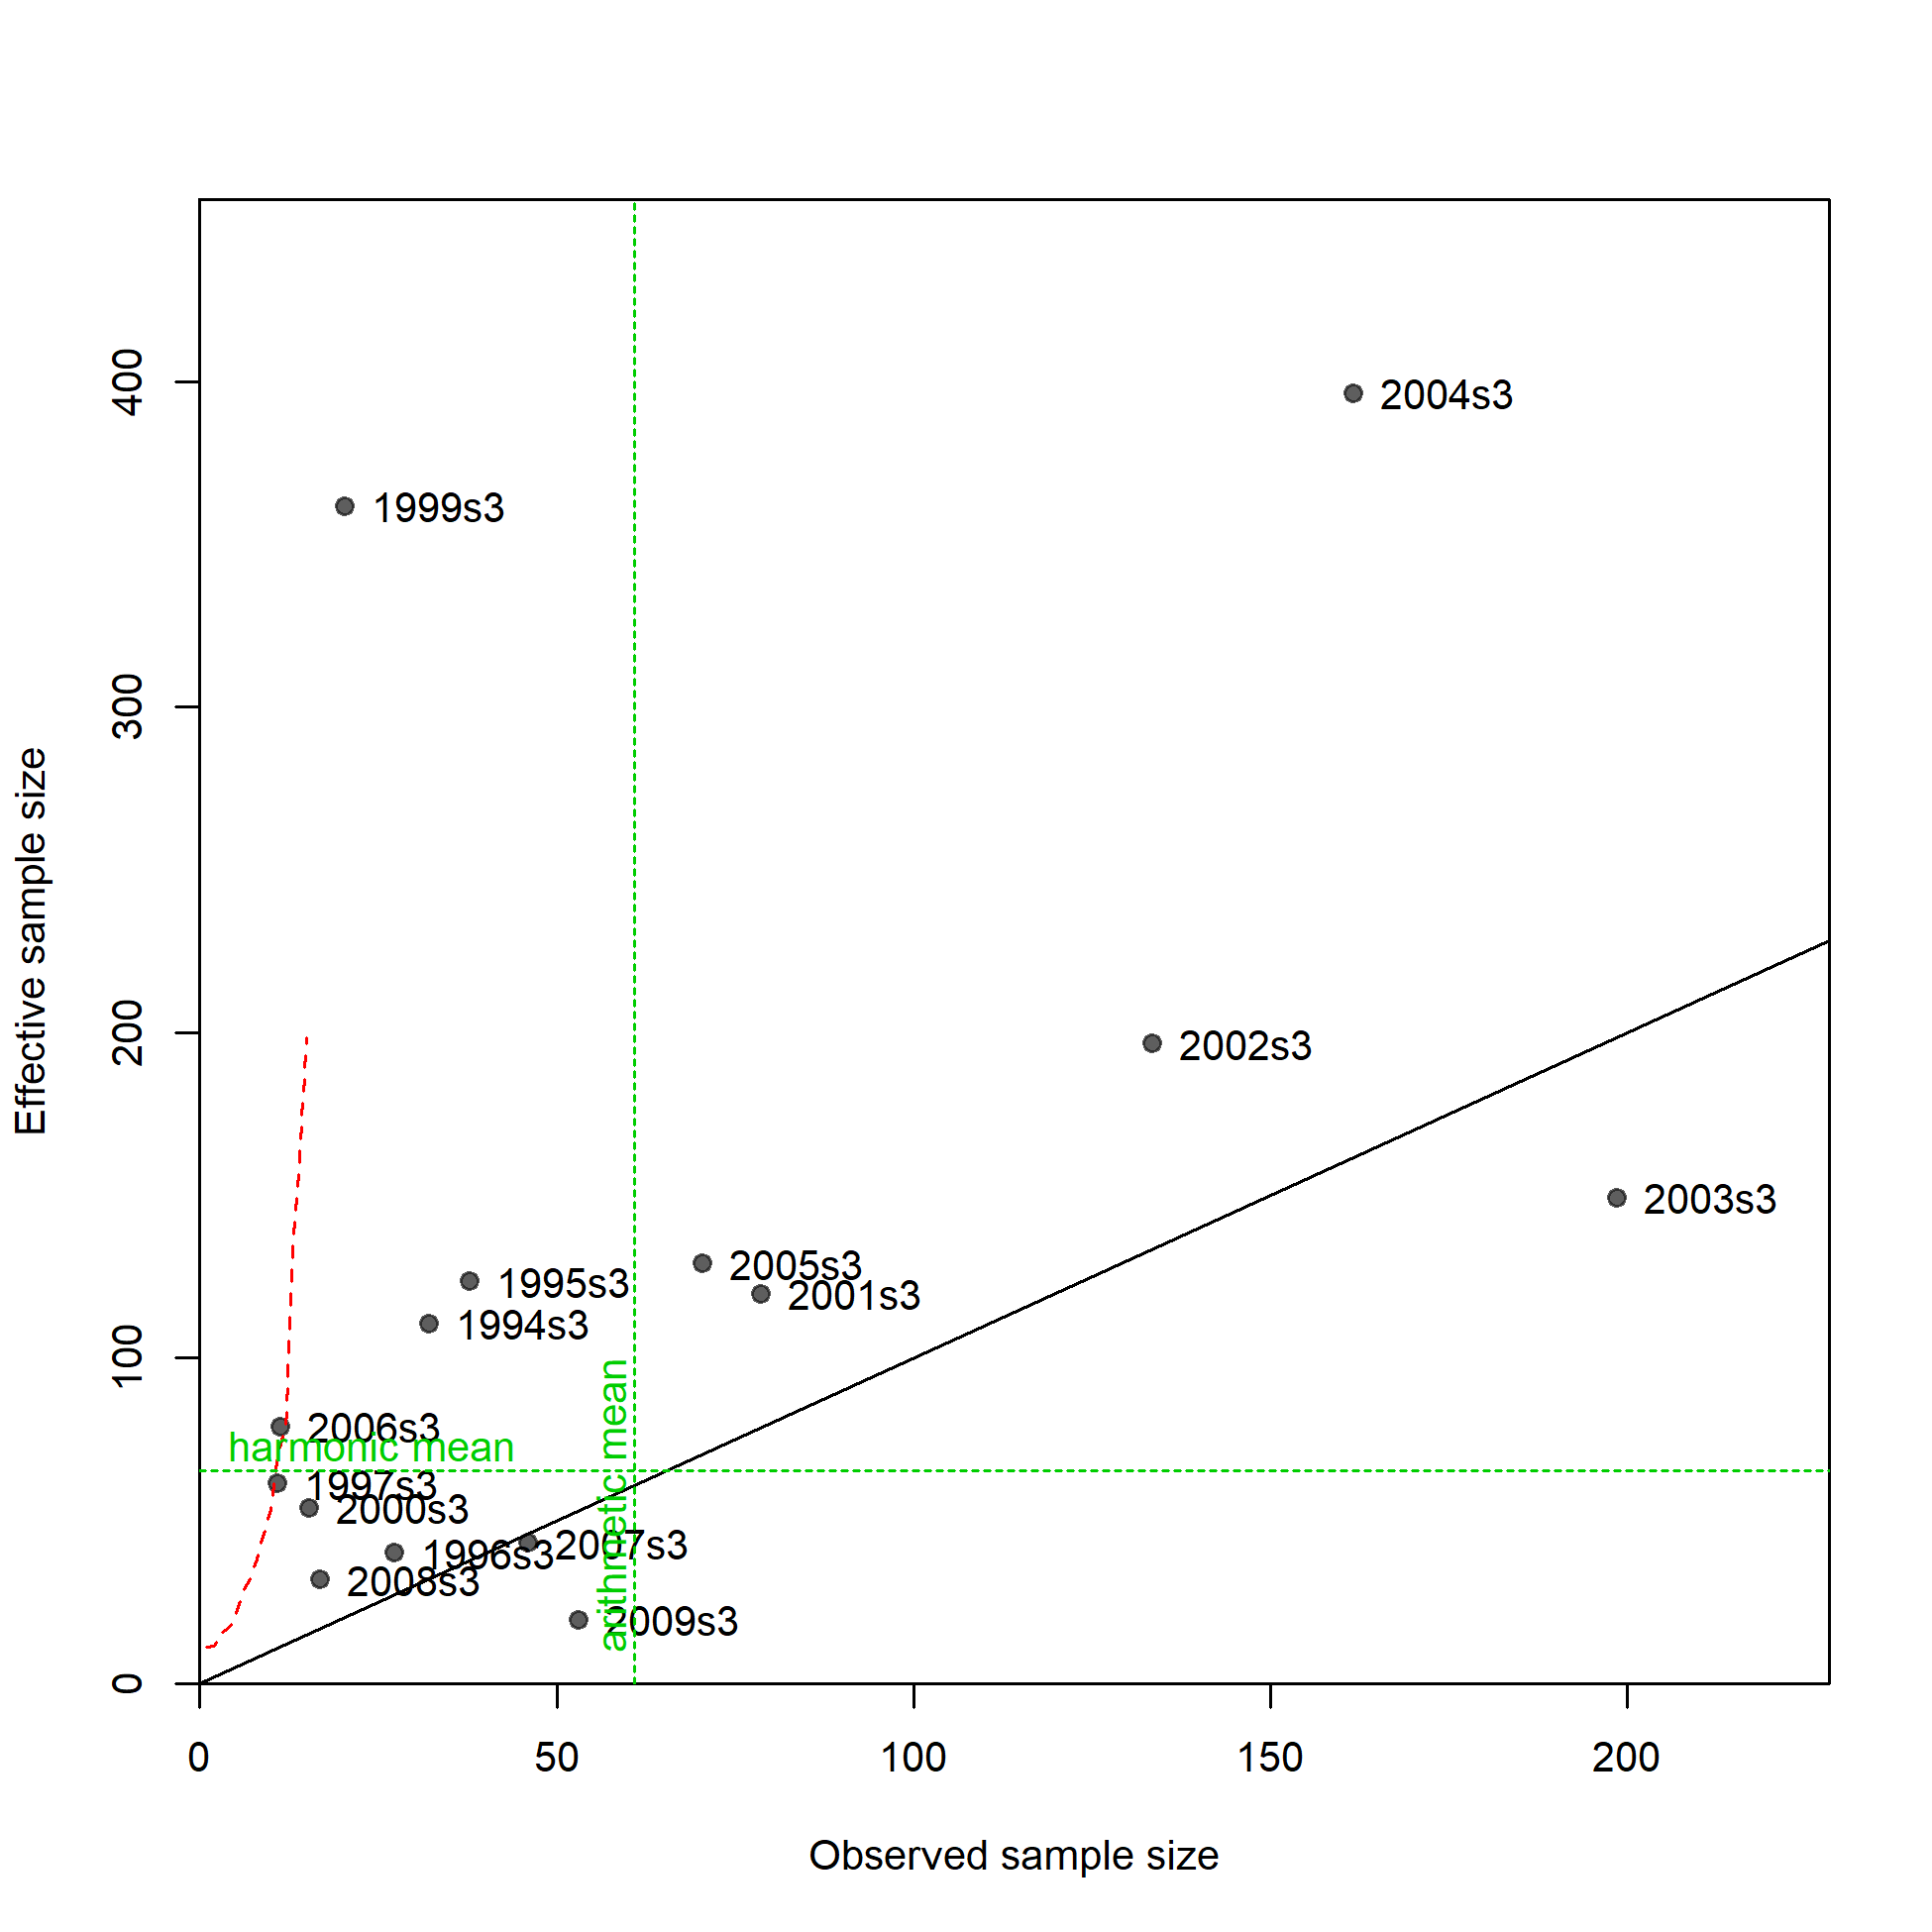
N-EffN comparison, Length comps, whole catch, I4_JPN_mid
file: comp_lenfit_sampsize_flt25mkt0.png
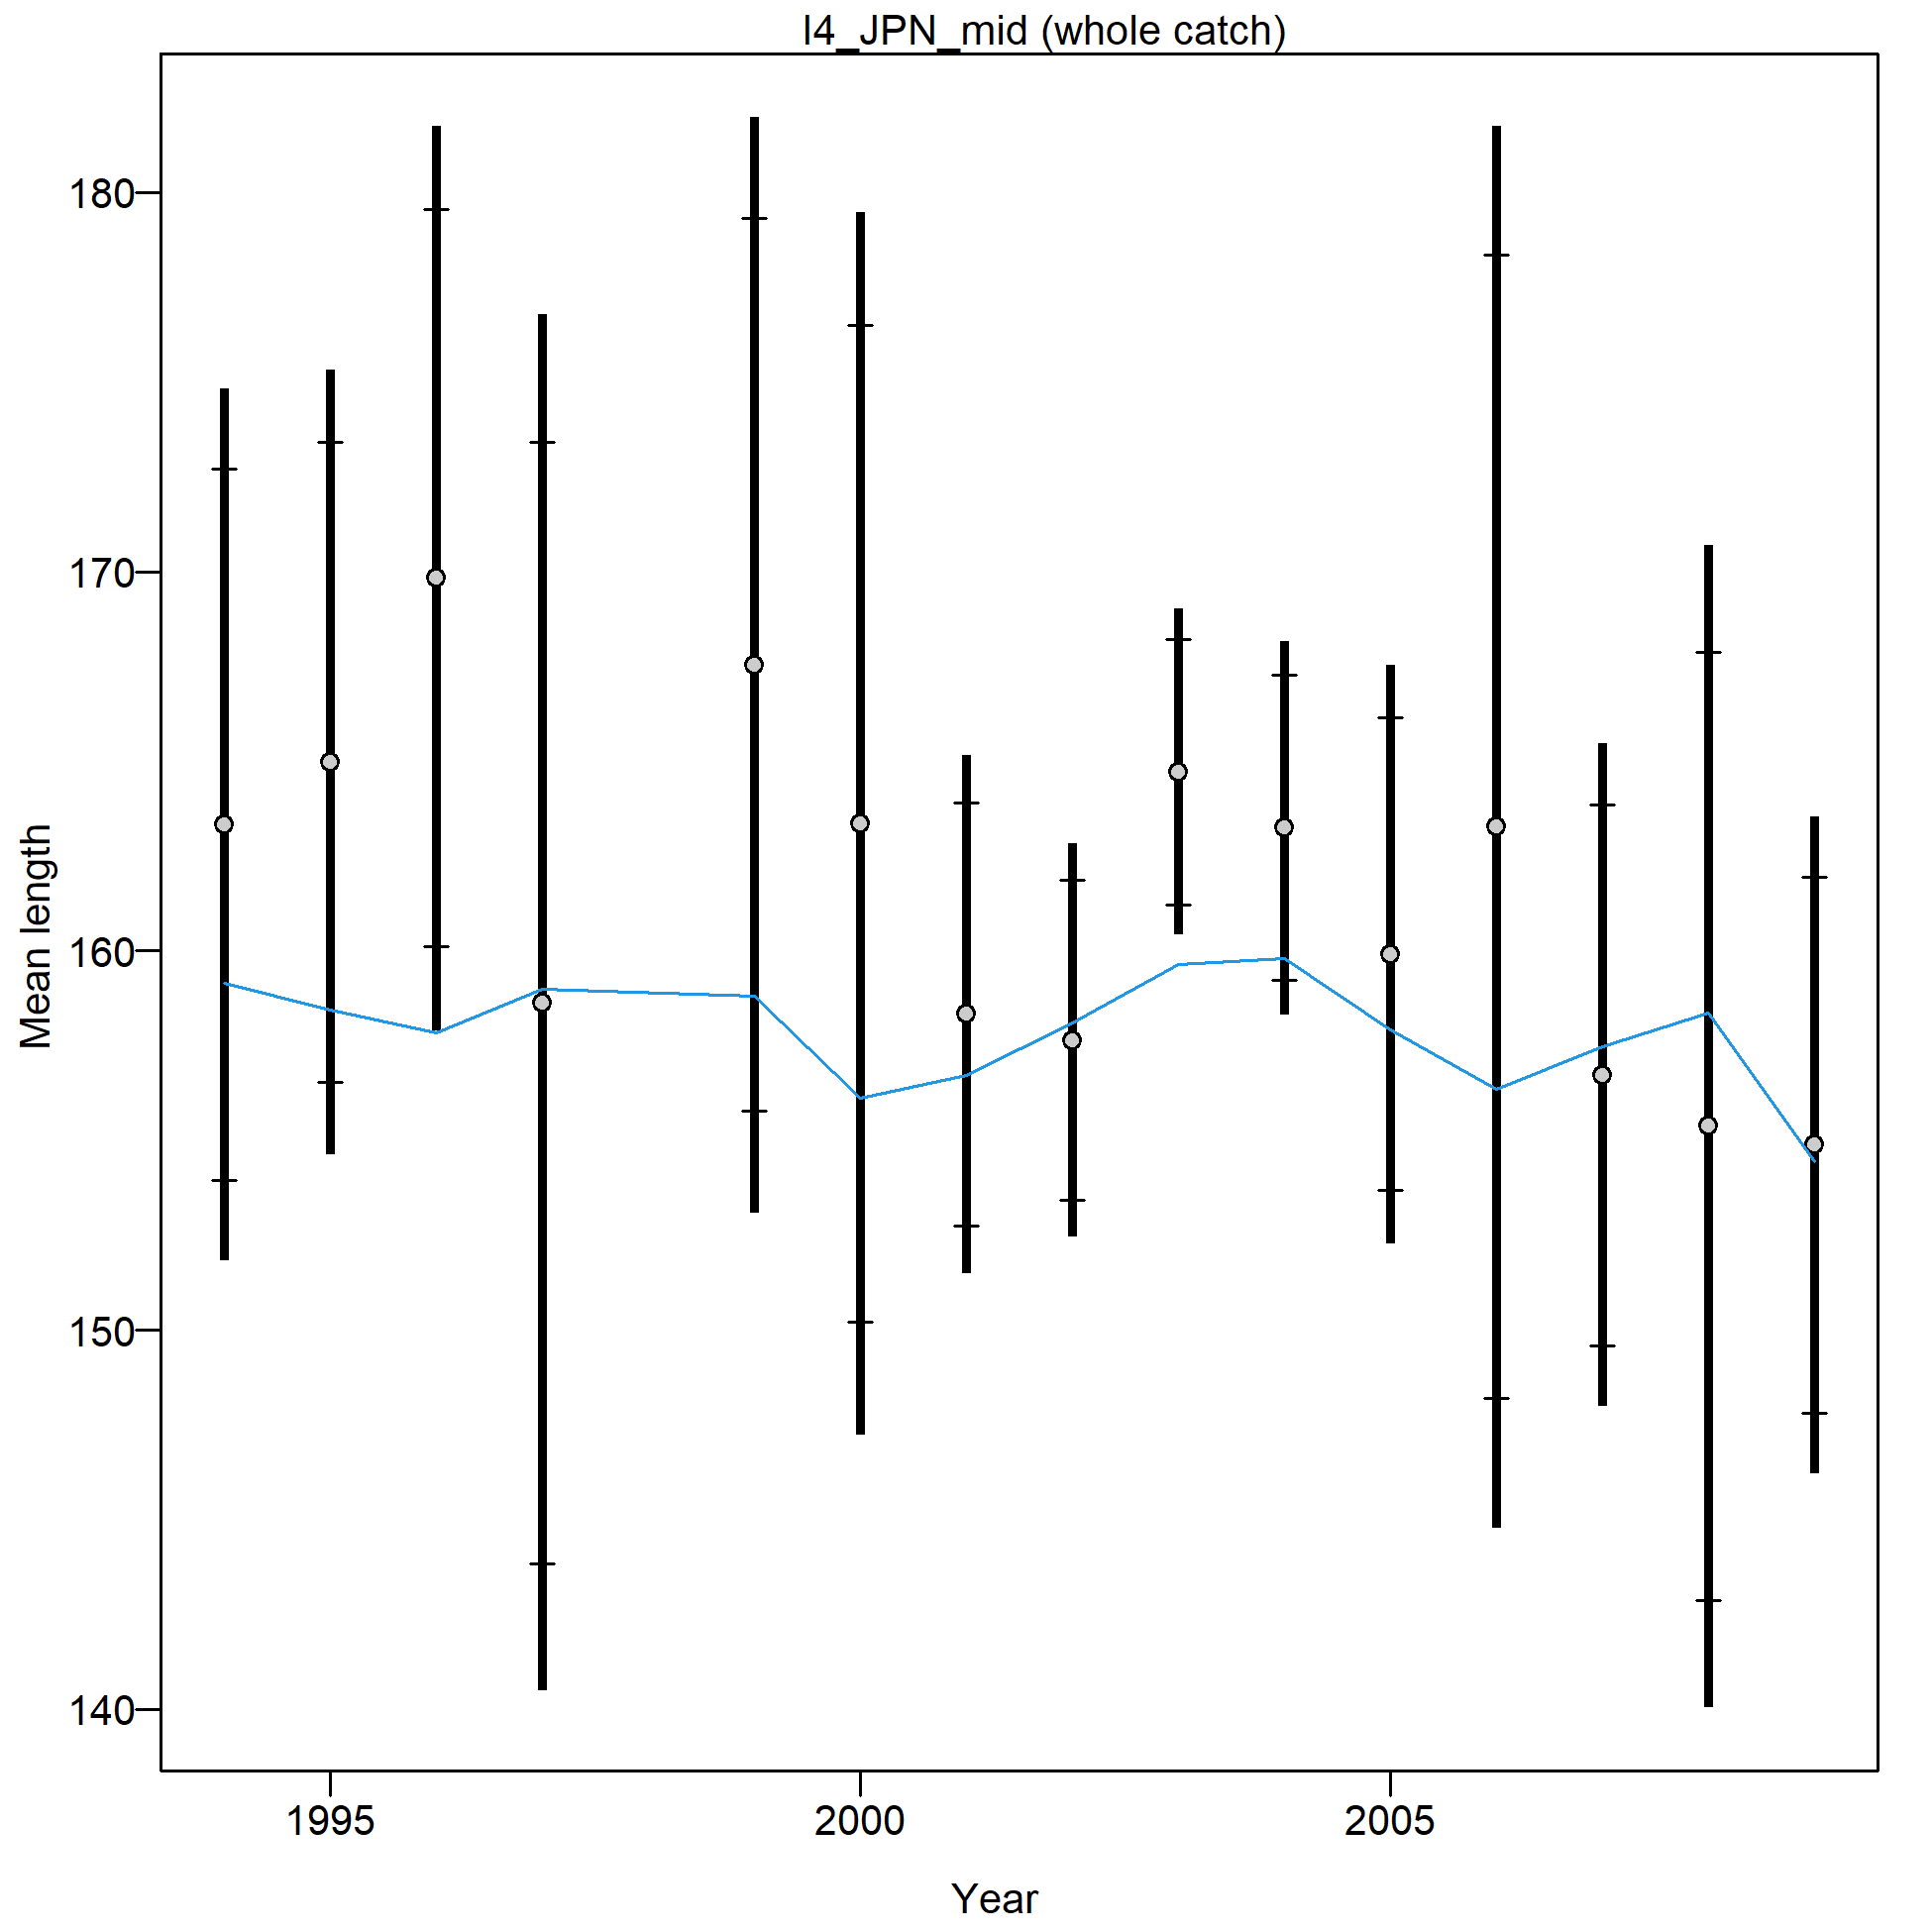
Mean length for I4_JPN_mid with 95% confidence intervals based on current samples sizes.
Francis data weighting method TA1.8: thinner intervals (with capped ends) show result of further adjusting sample sizes based on suggested multiplier (with 95% interval) for len data from I4_JPN_mid:
1.5039 (0.971-3.6005)
For more info, see
Francis, R.I.C.C. (2011). Data weighting in statistical fisheries stock assessment models. Can. J. Fish. Aquat. Sci. 68: 1124-1138. https://doi.org/10.1139/f2011-025
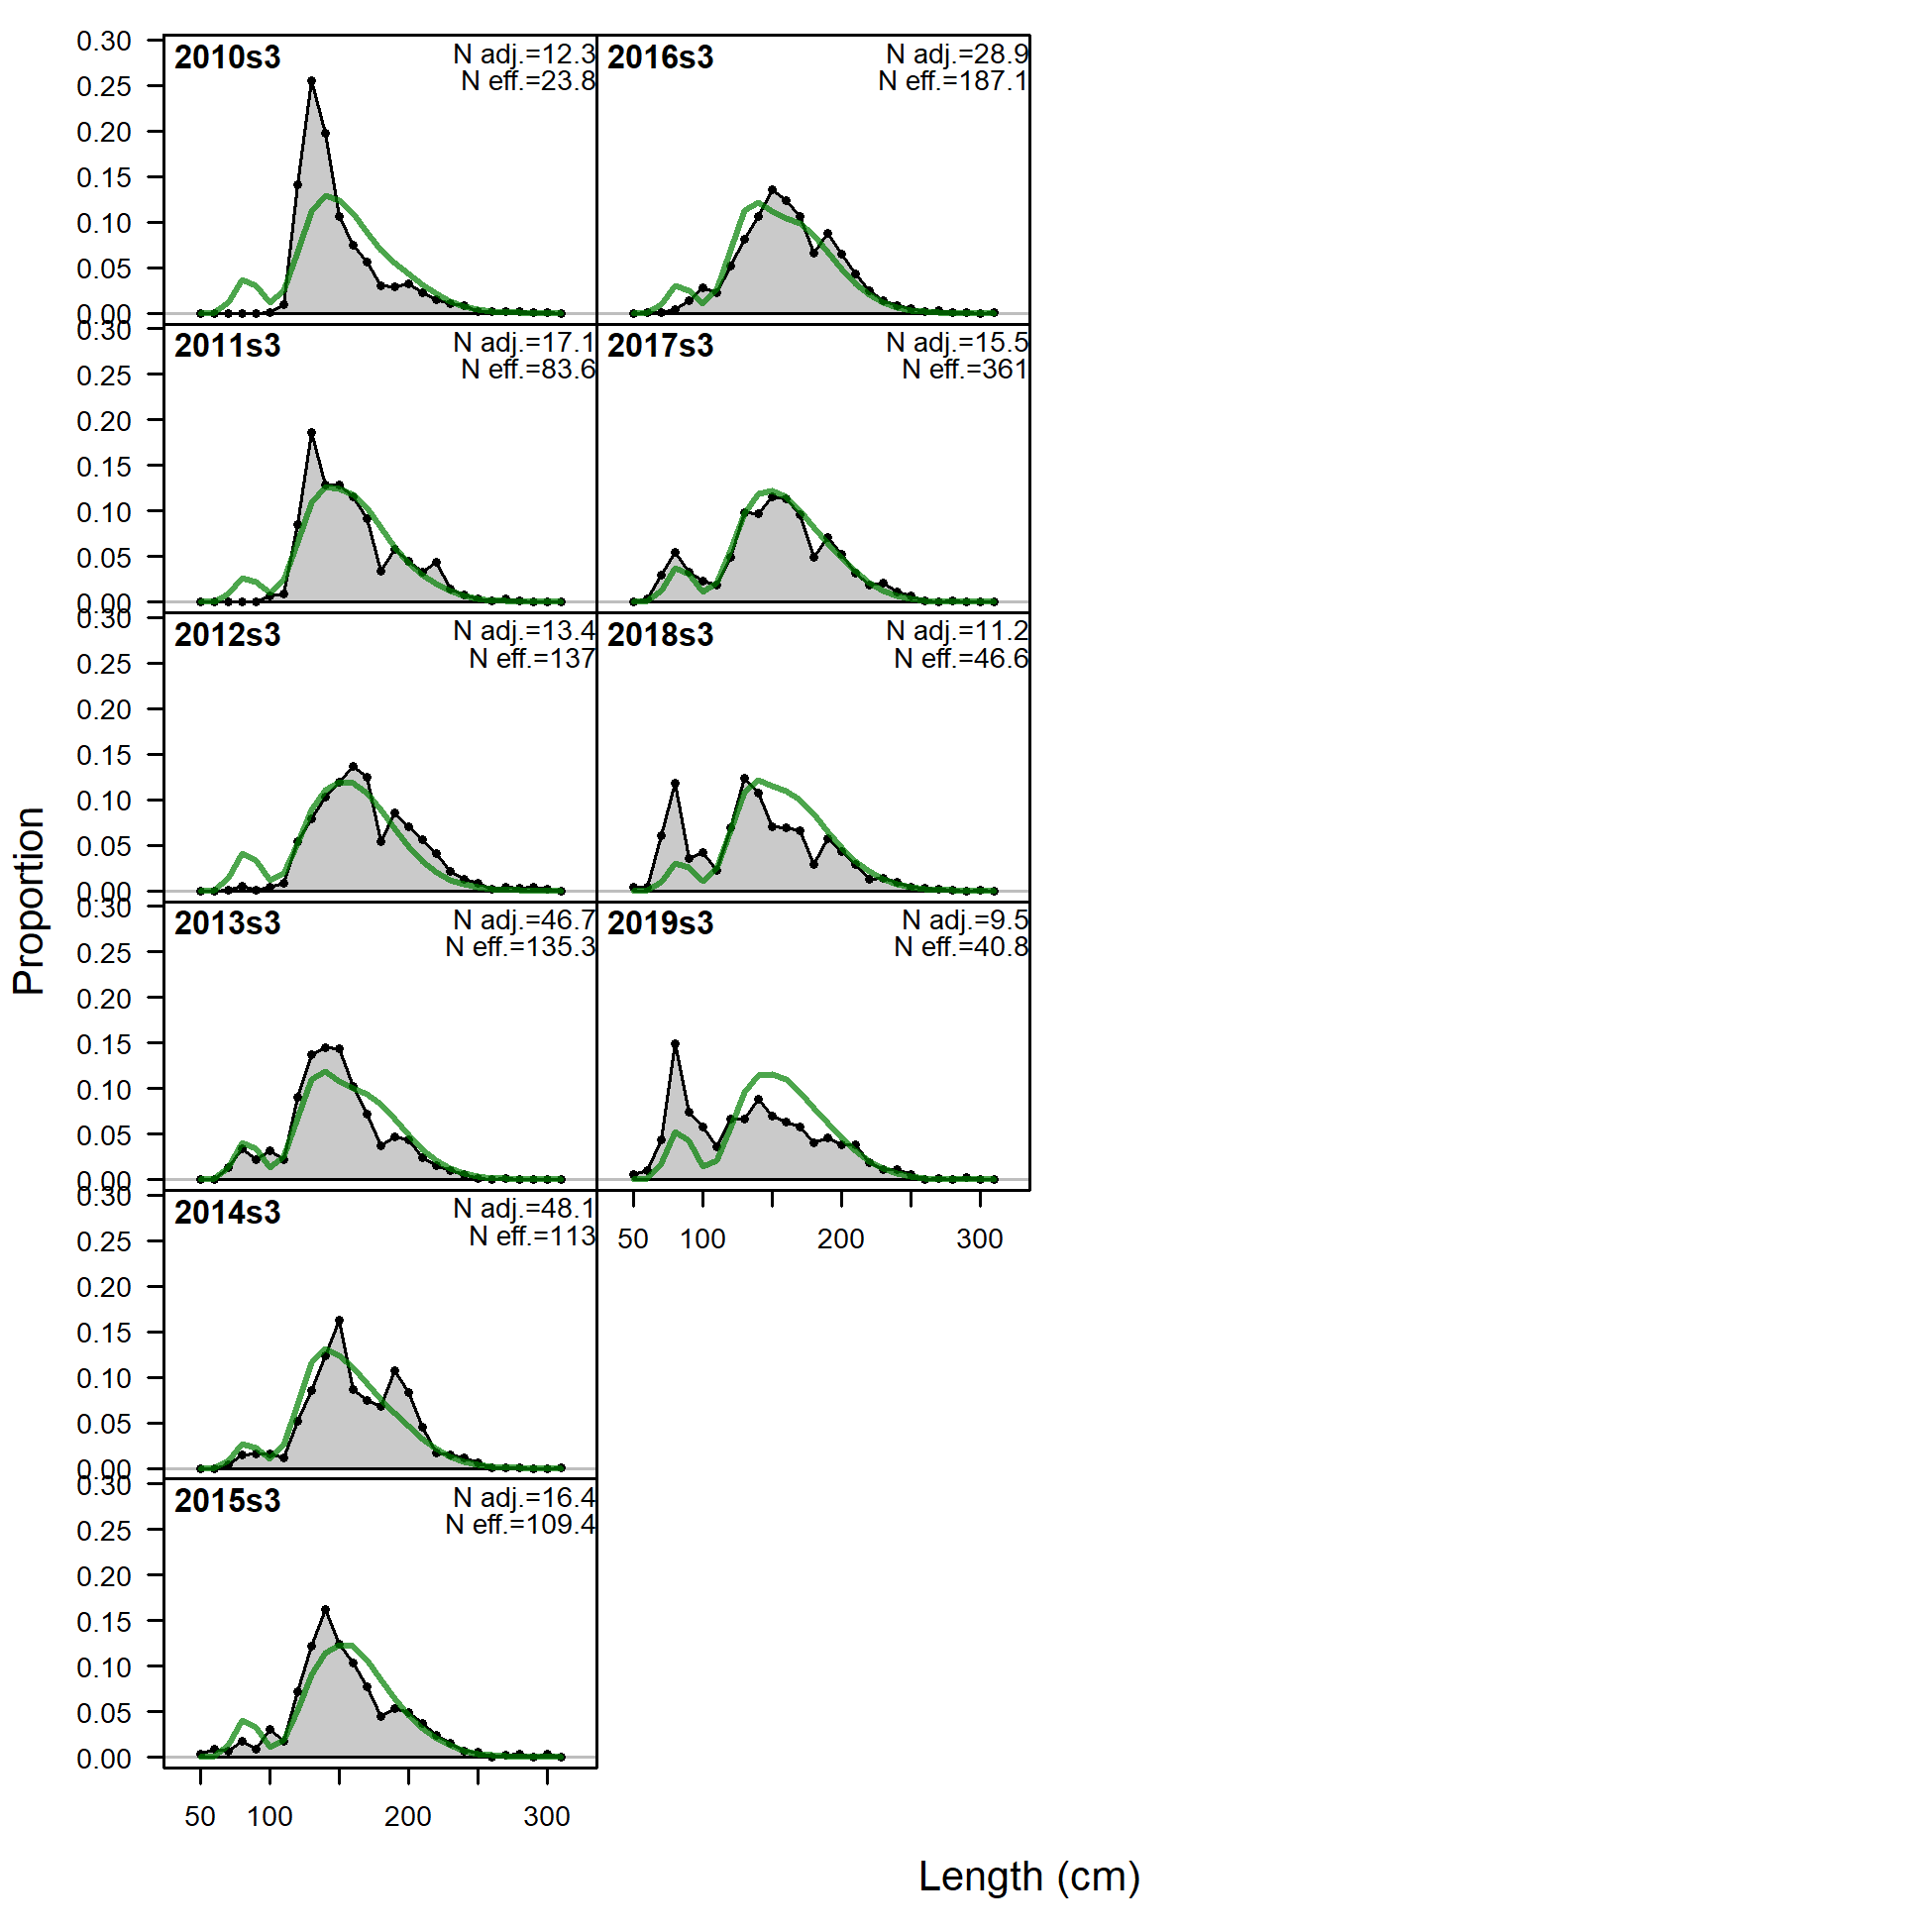
Length comps, whole catch, I5_JPN_late.
'N adj.' is the input sample size after data-weighting adjustment. N eff. is the calculated effective sample size used in the McAllister-Ianelli tuning method.
file: comp_lenfit_flt26mkt0.png
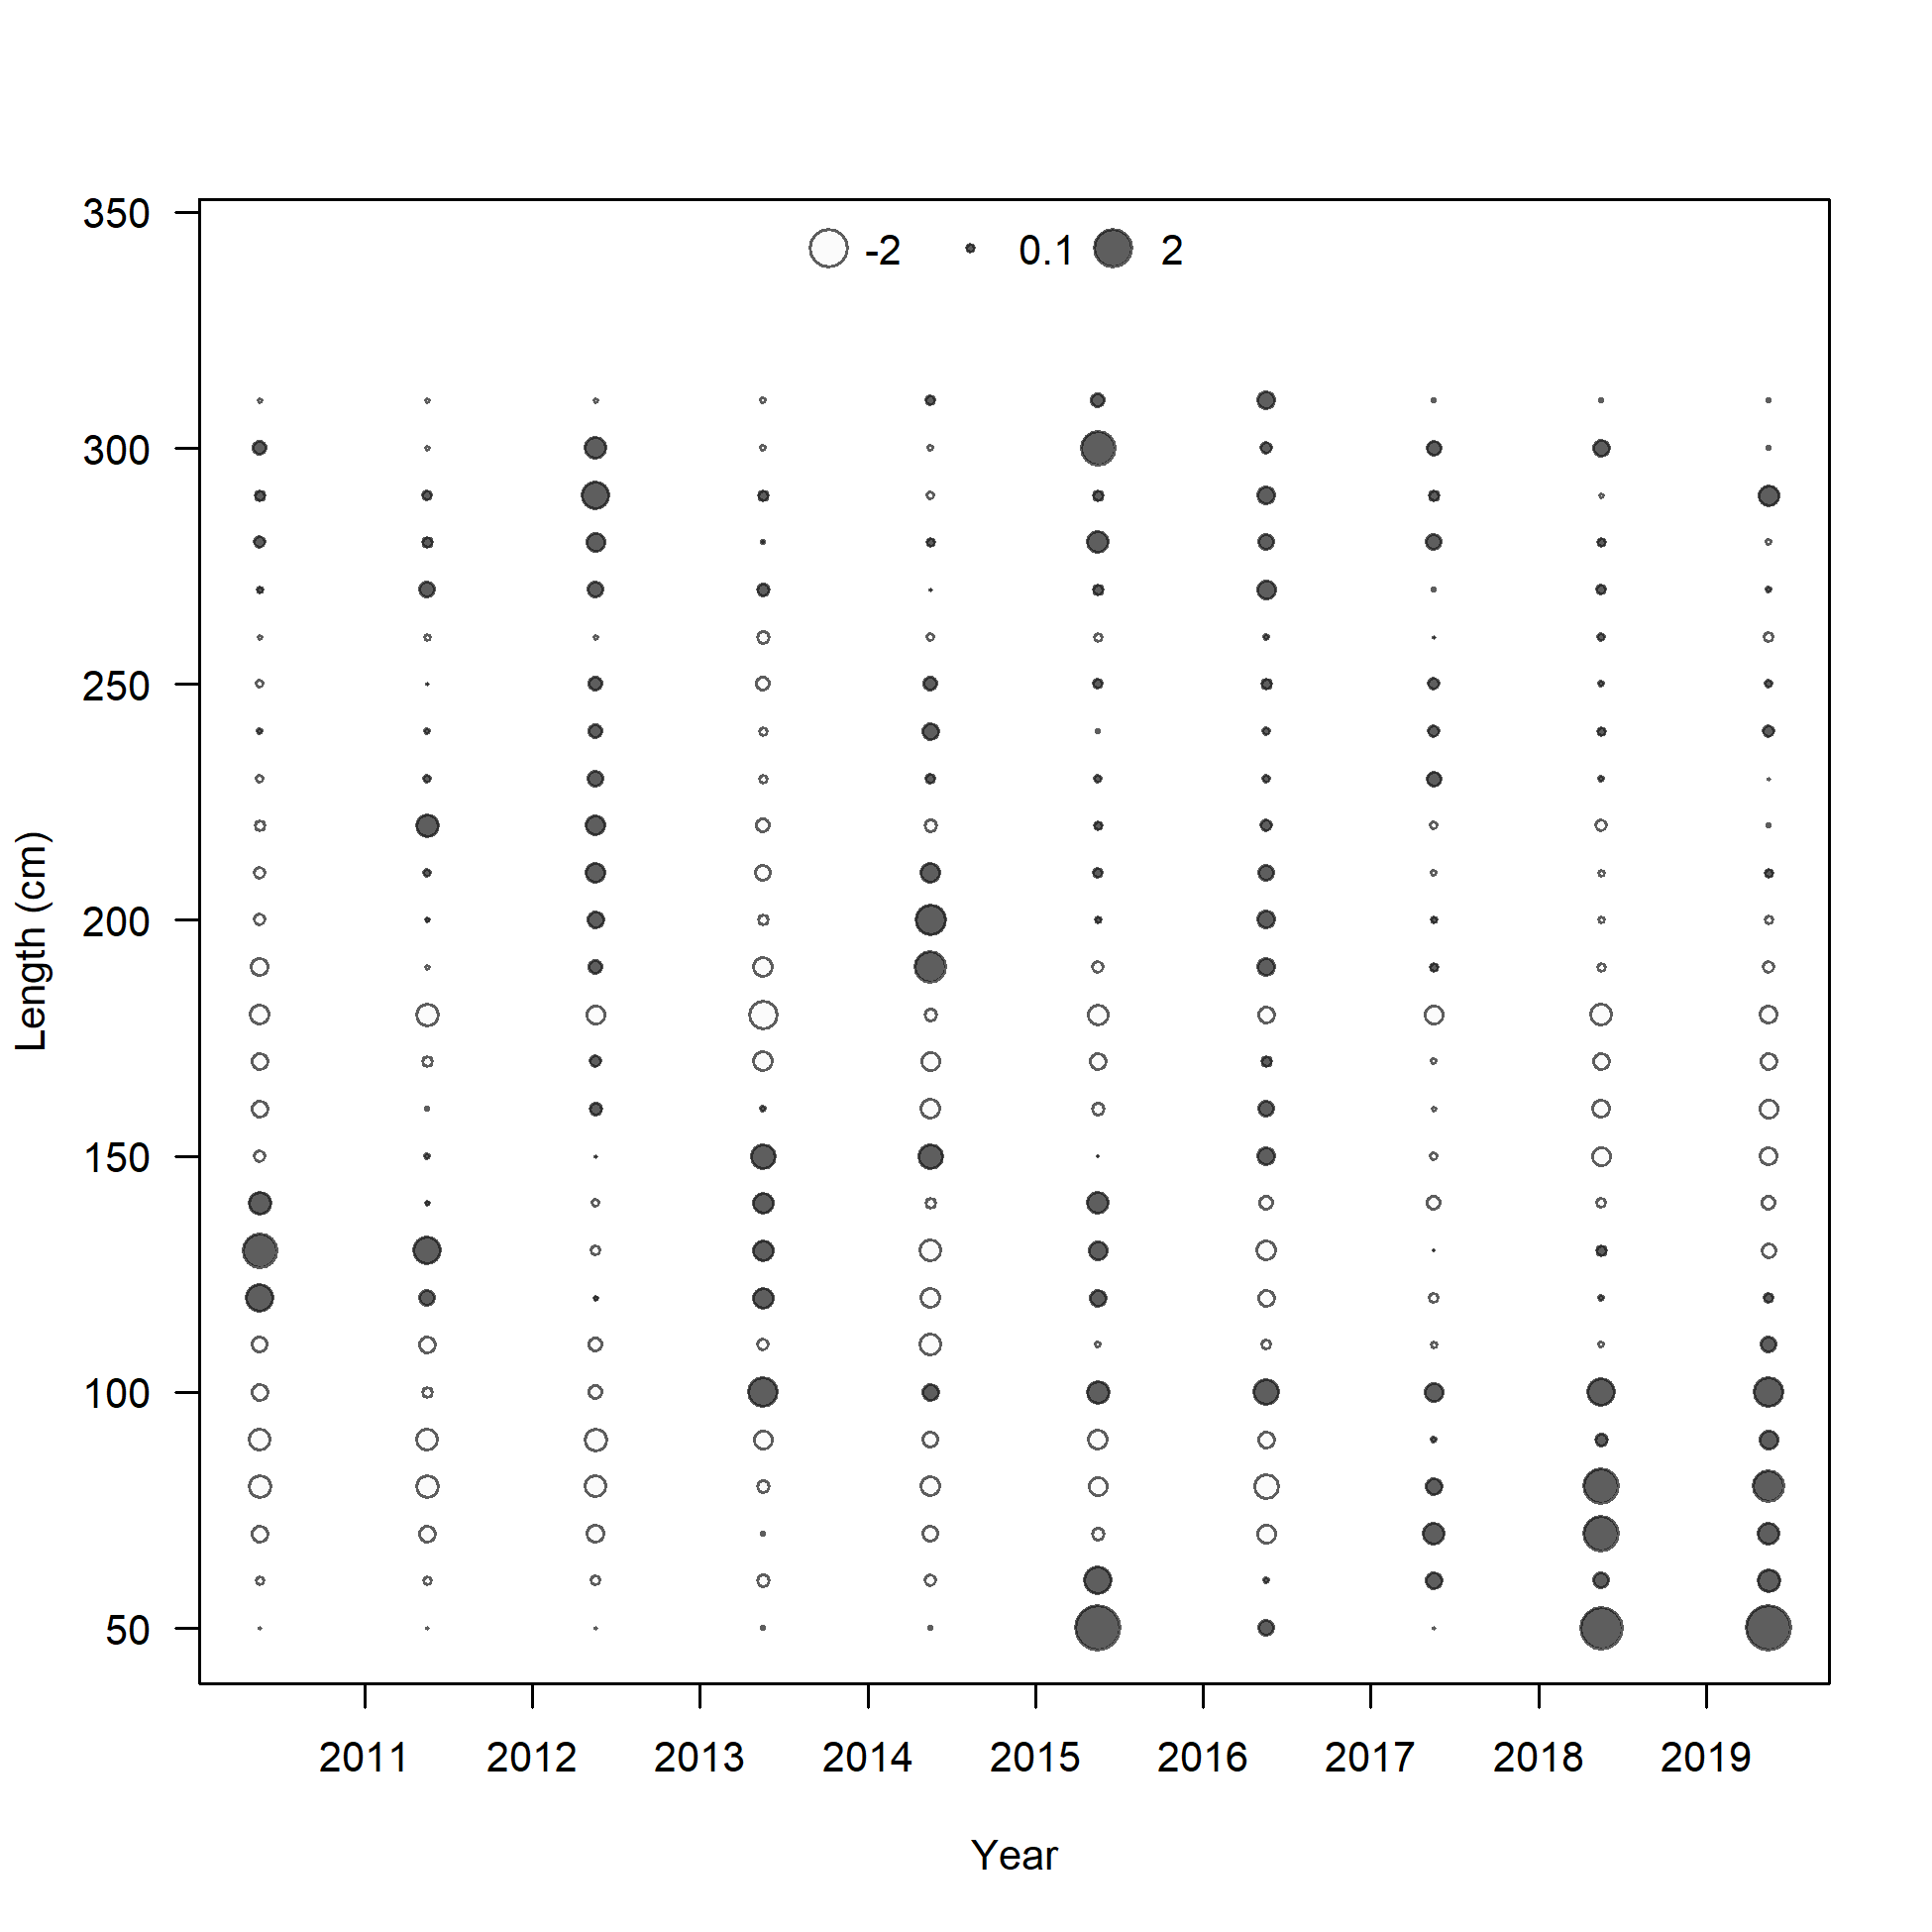
Pearson residuals, whole catch, I5_JPN_late (max=2.79)
Closed bubbles are positive residuals (observed > expected) and open bubbles are negative residuals (observed < expected).
file: comp_lenfit_residsflt26mkt0.png
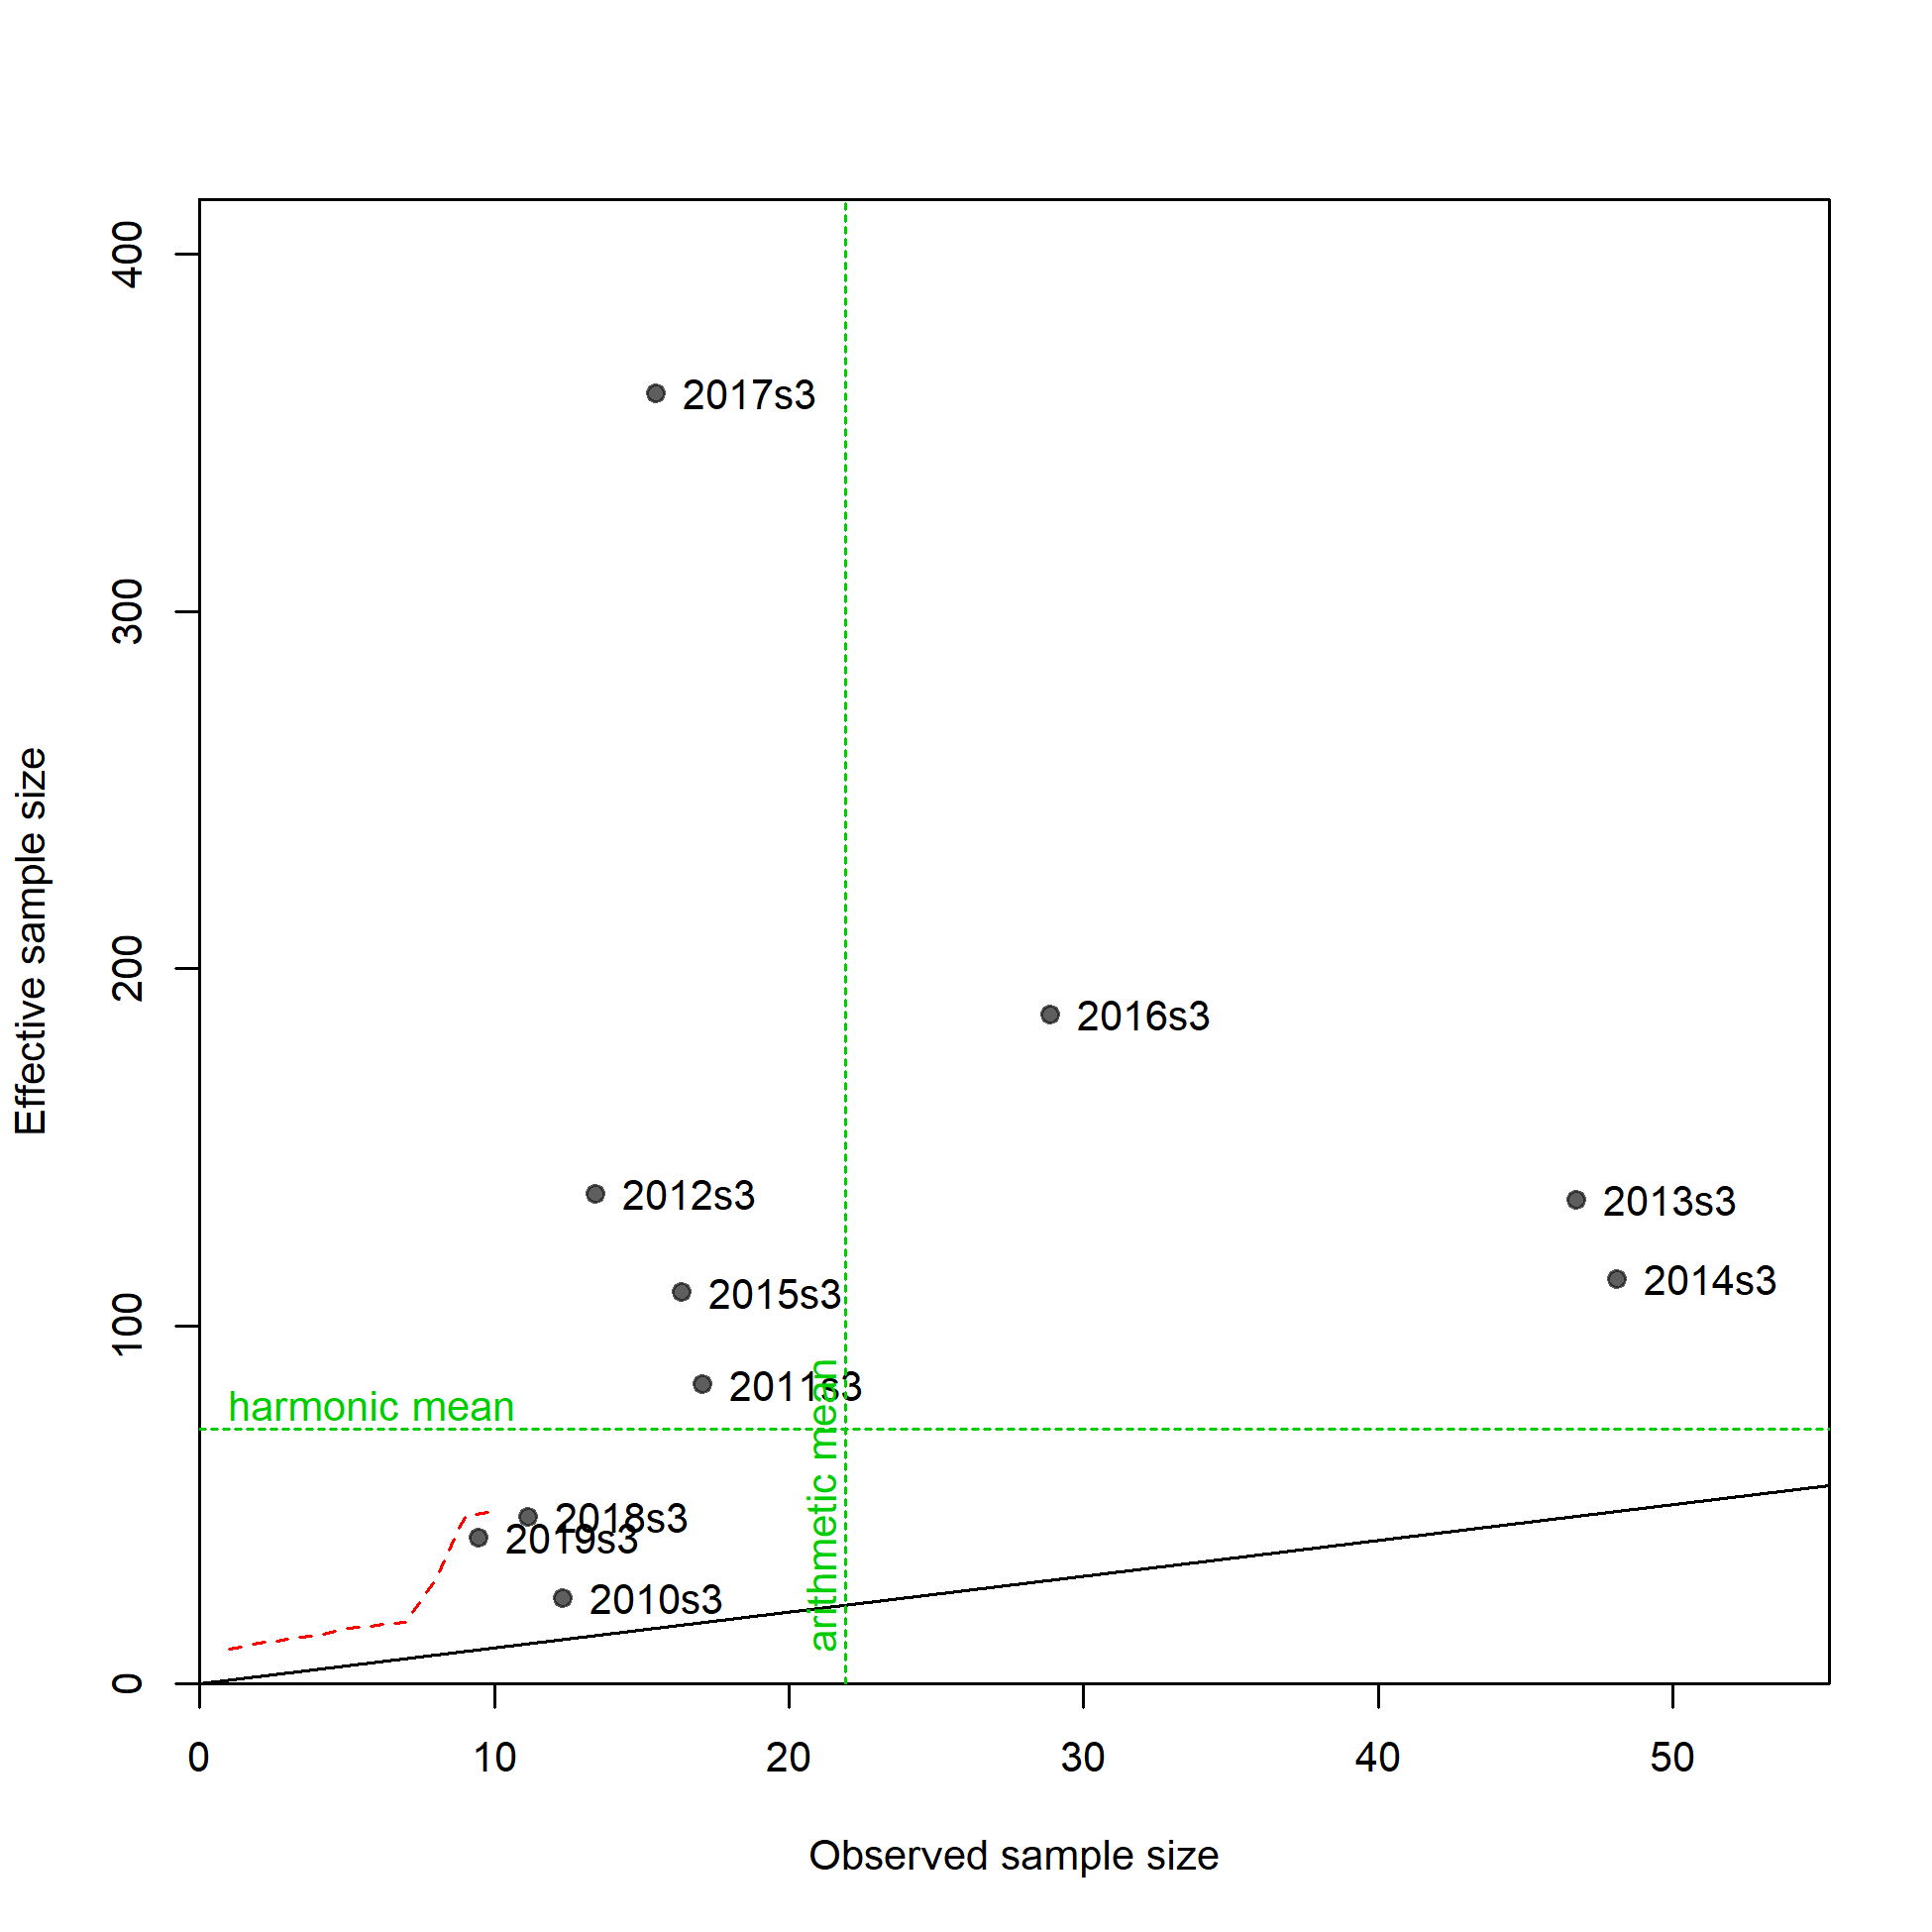
N-EffN comparison, Length comps, whole catch, I5_JPN_late
file: comp_lenfit_sampsize_flt26mkt0.png
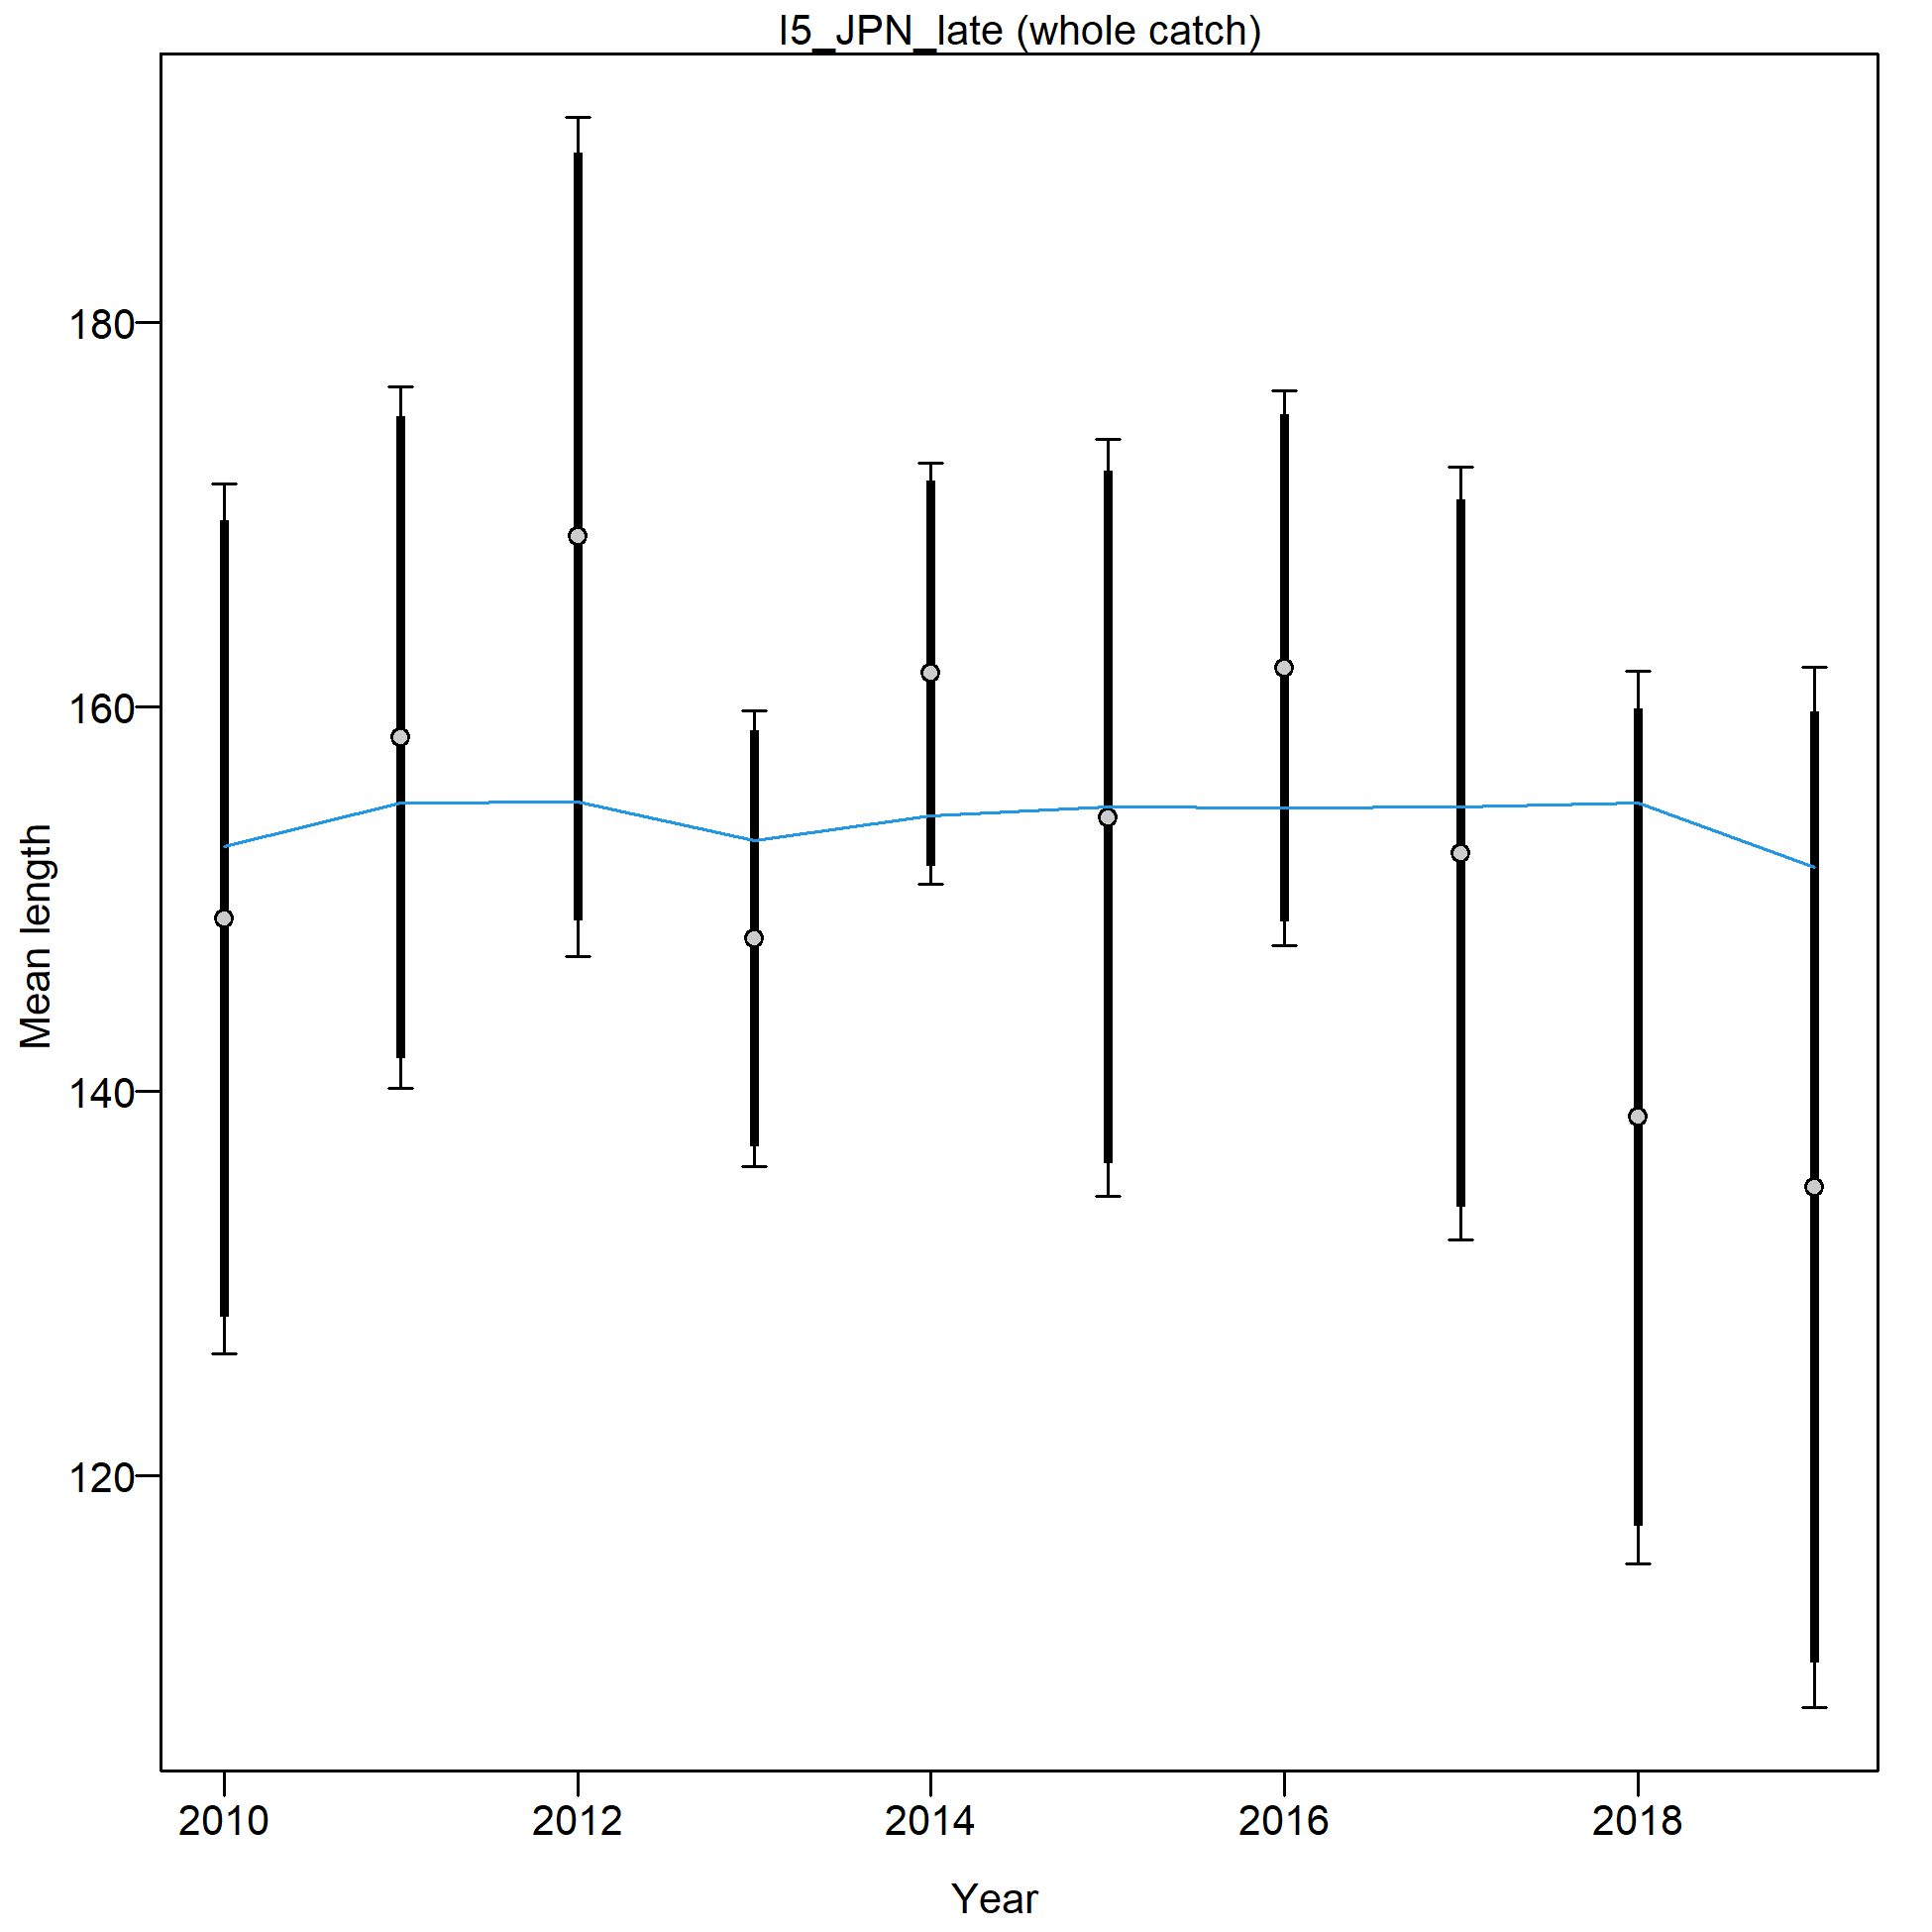
Mean length for I5_JPN_late with 95% confidence intervals based on current samples sizes.
Francis data weighting method TA1.8: thinner intervals (with capped ends) show result of further adjusting sample sizes based on suggested multiplier (with 95% interval) for len data from I5_JPN_late:
0.8367 (0.5877-2.3412)
For more info, see
Francis, R.I.C.C. (2011). Data weighting in statistical fisheries stock assessment models. Can. J. Fish. Aquat. Sci. 68: 1124-1138. https://doi.org/10.1139/f2011-025

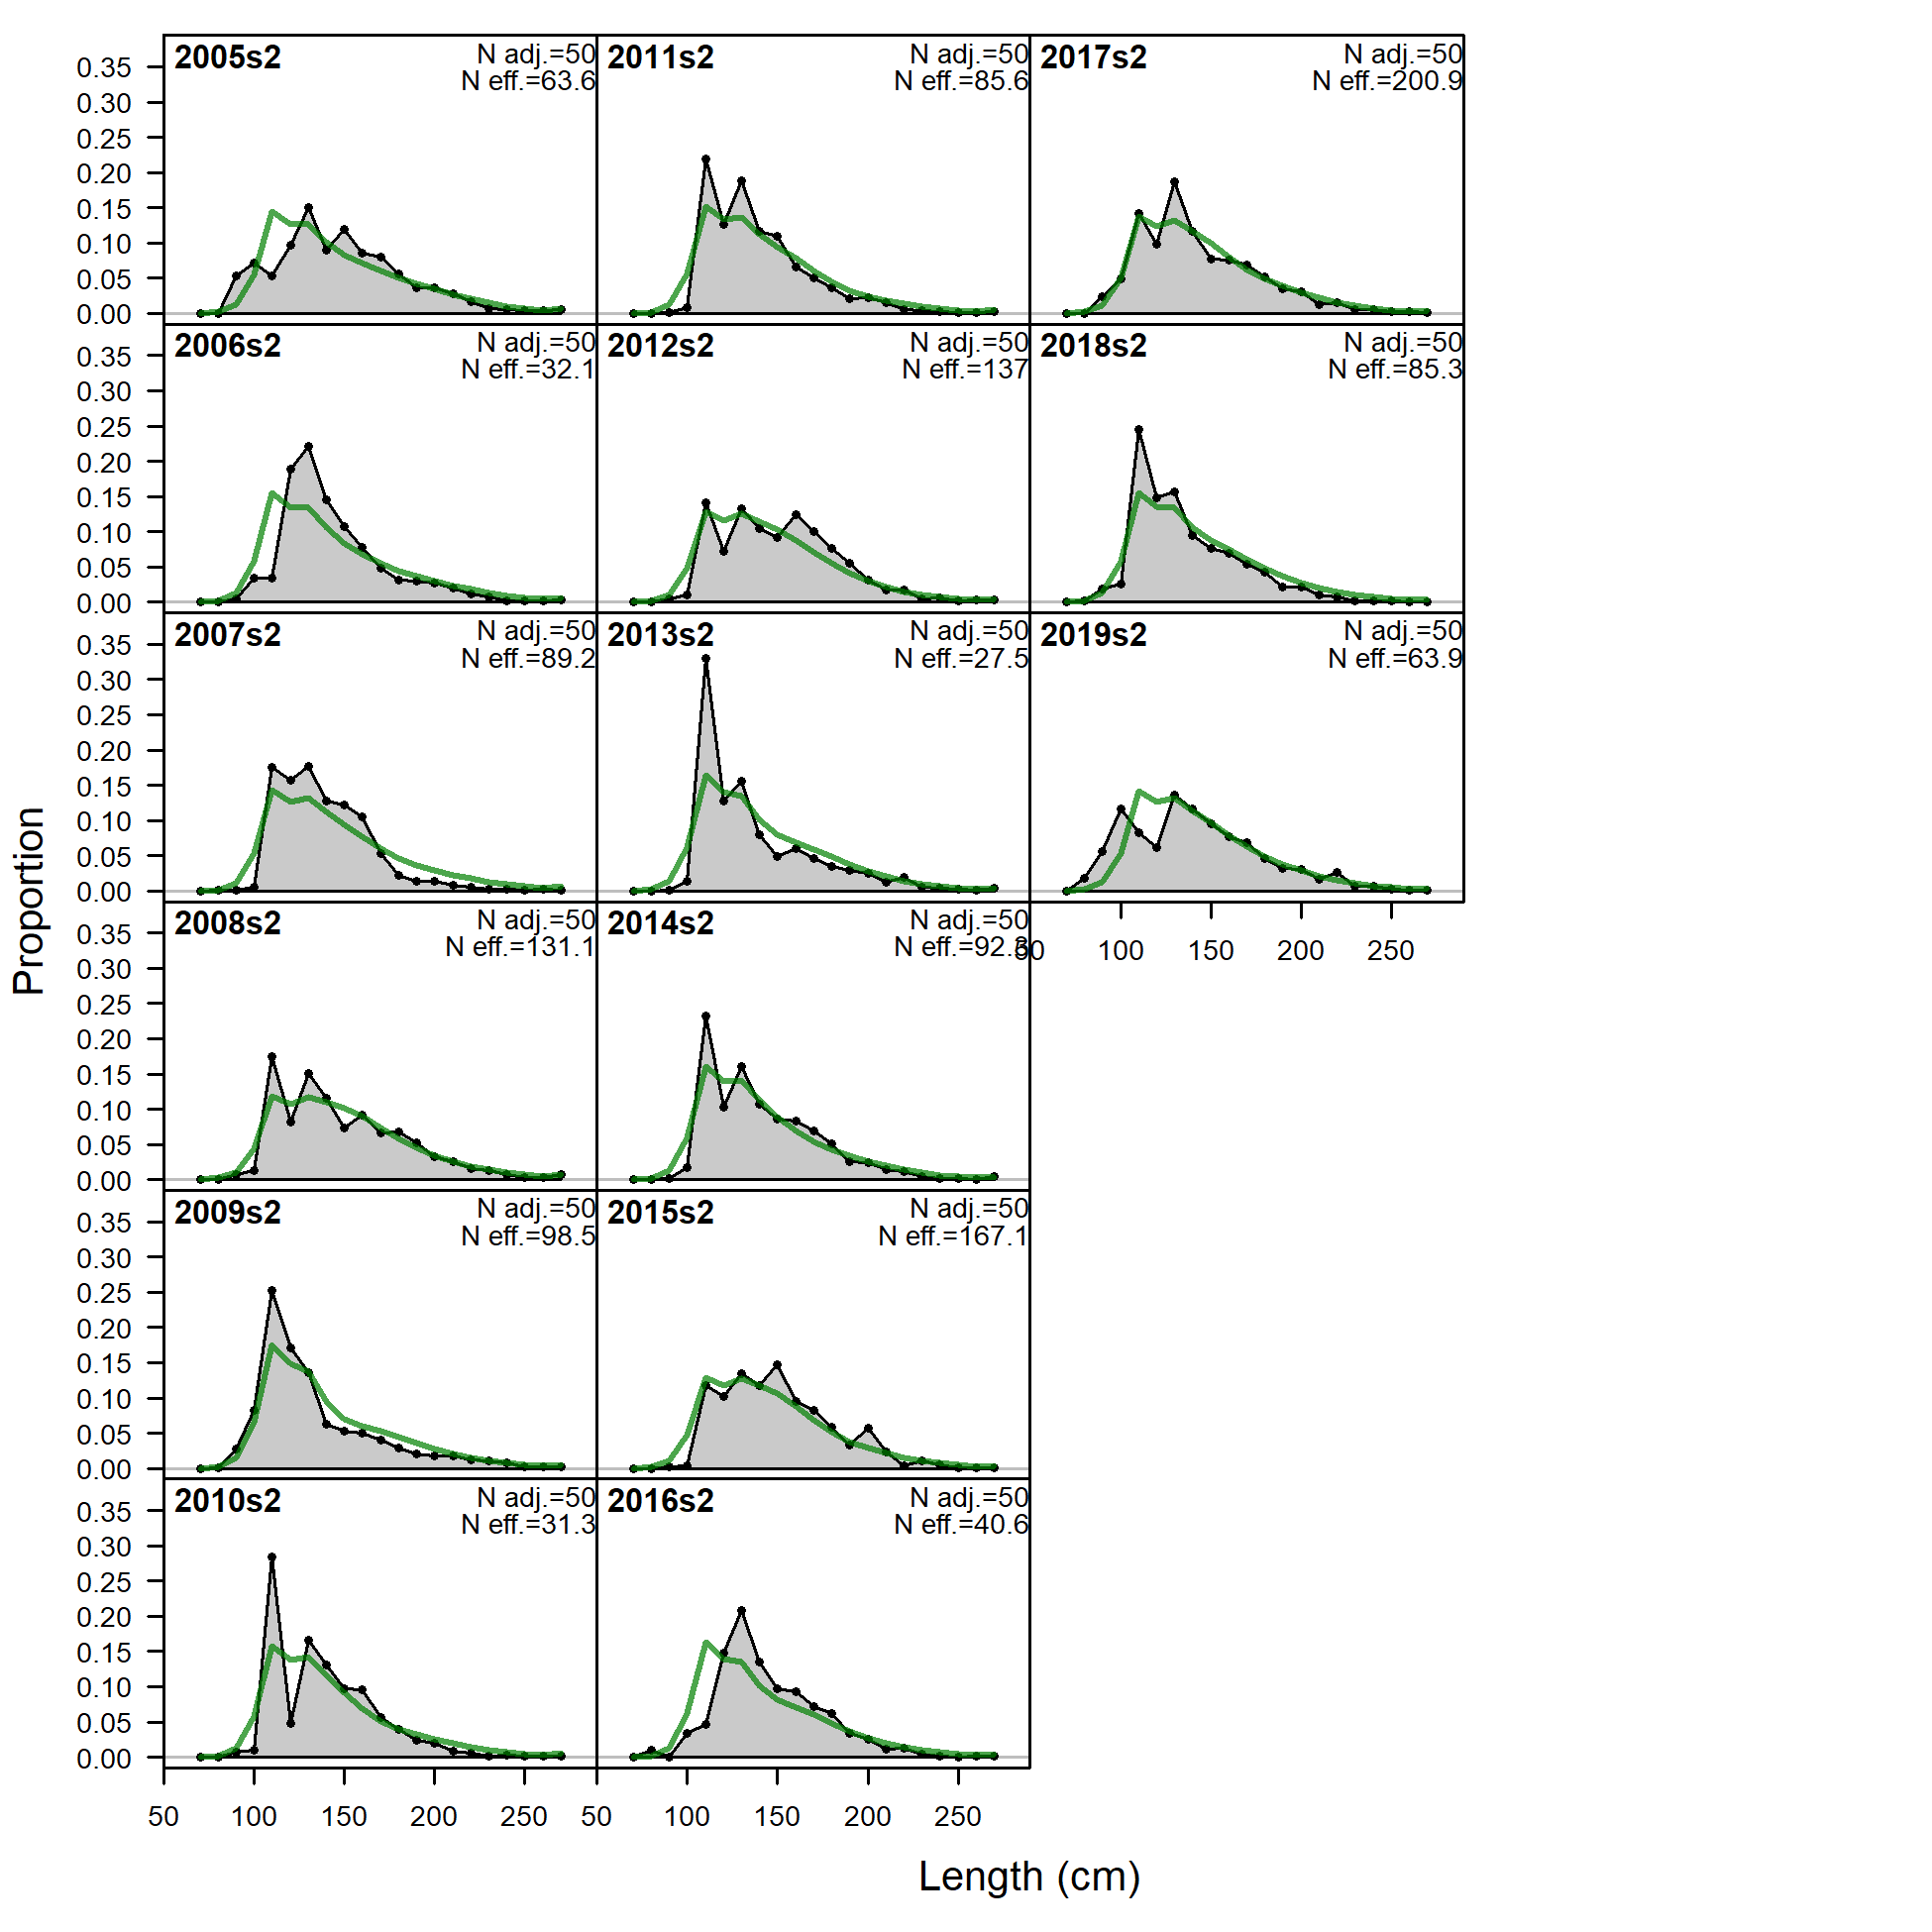
Length comps, whole catch, I6_ESP_Q1.
'N adj.' is the input sample size after data-weighting adjustment. N eff. is the calculated effective sample size used in the McAllister-Ianelli tuning method.
file: comp_lenfit_flt27mkt0.png
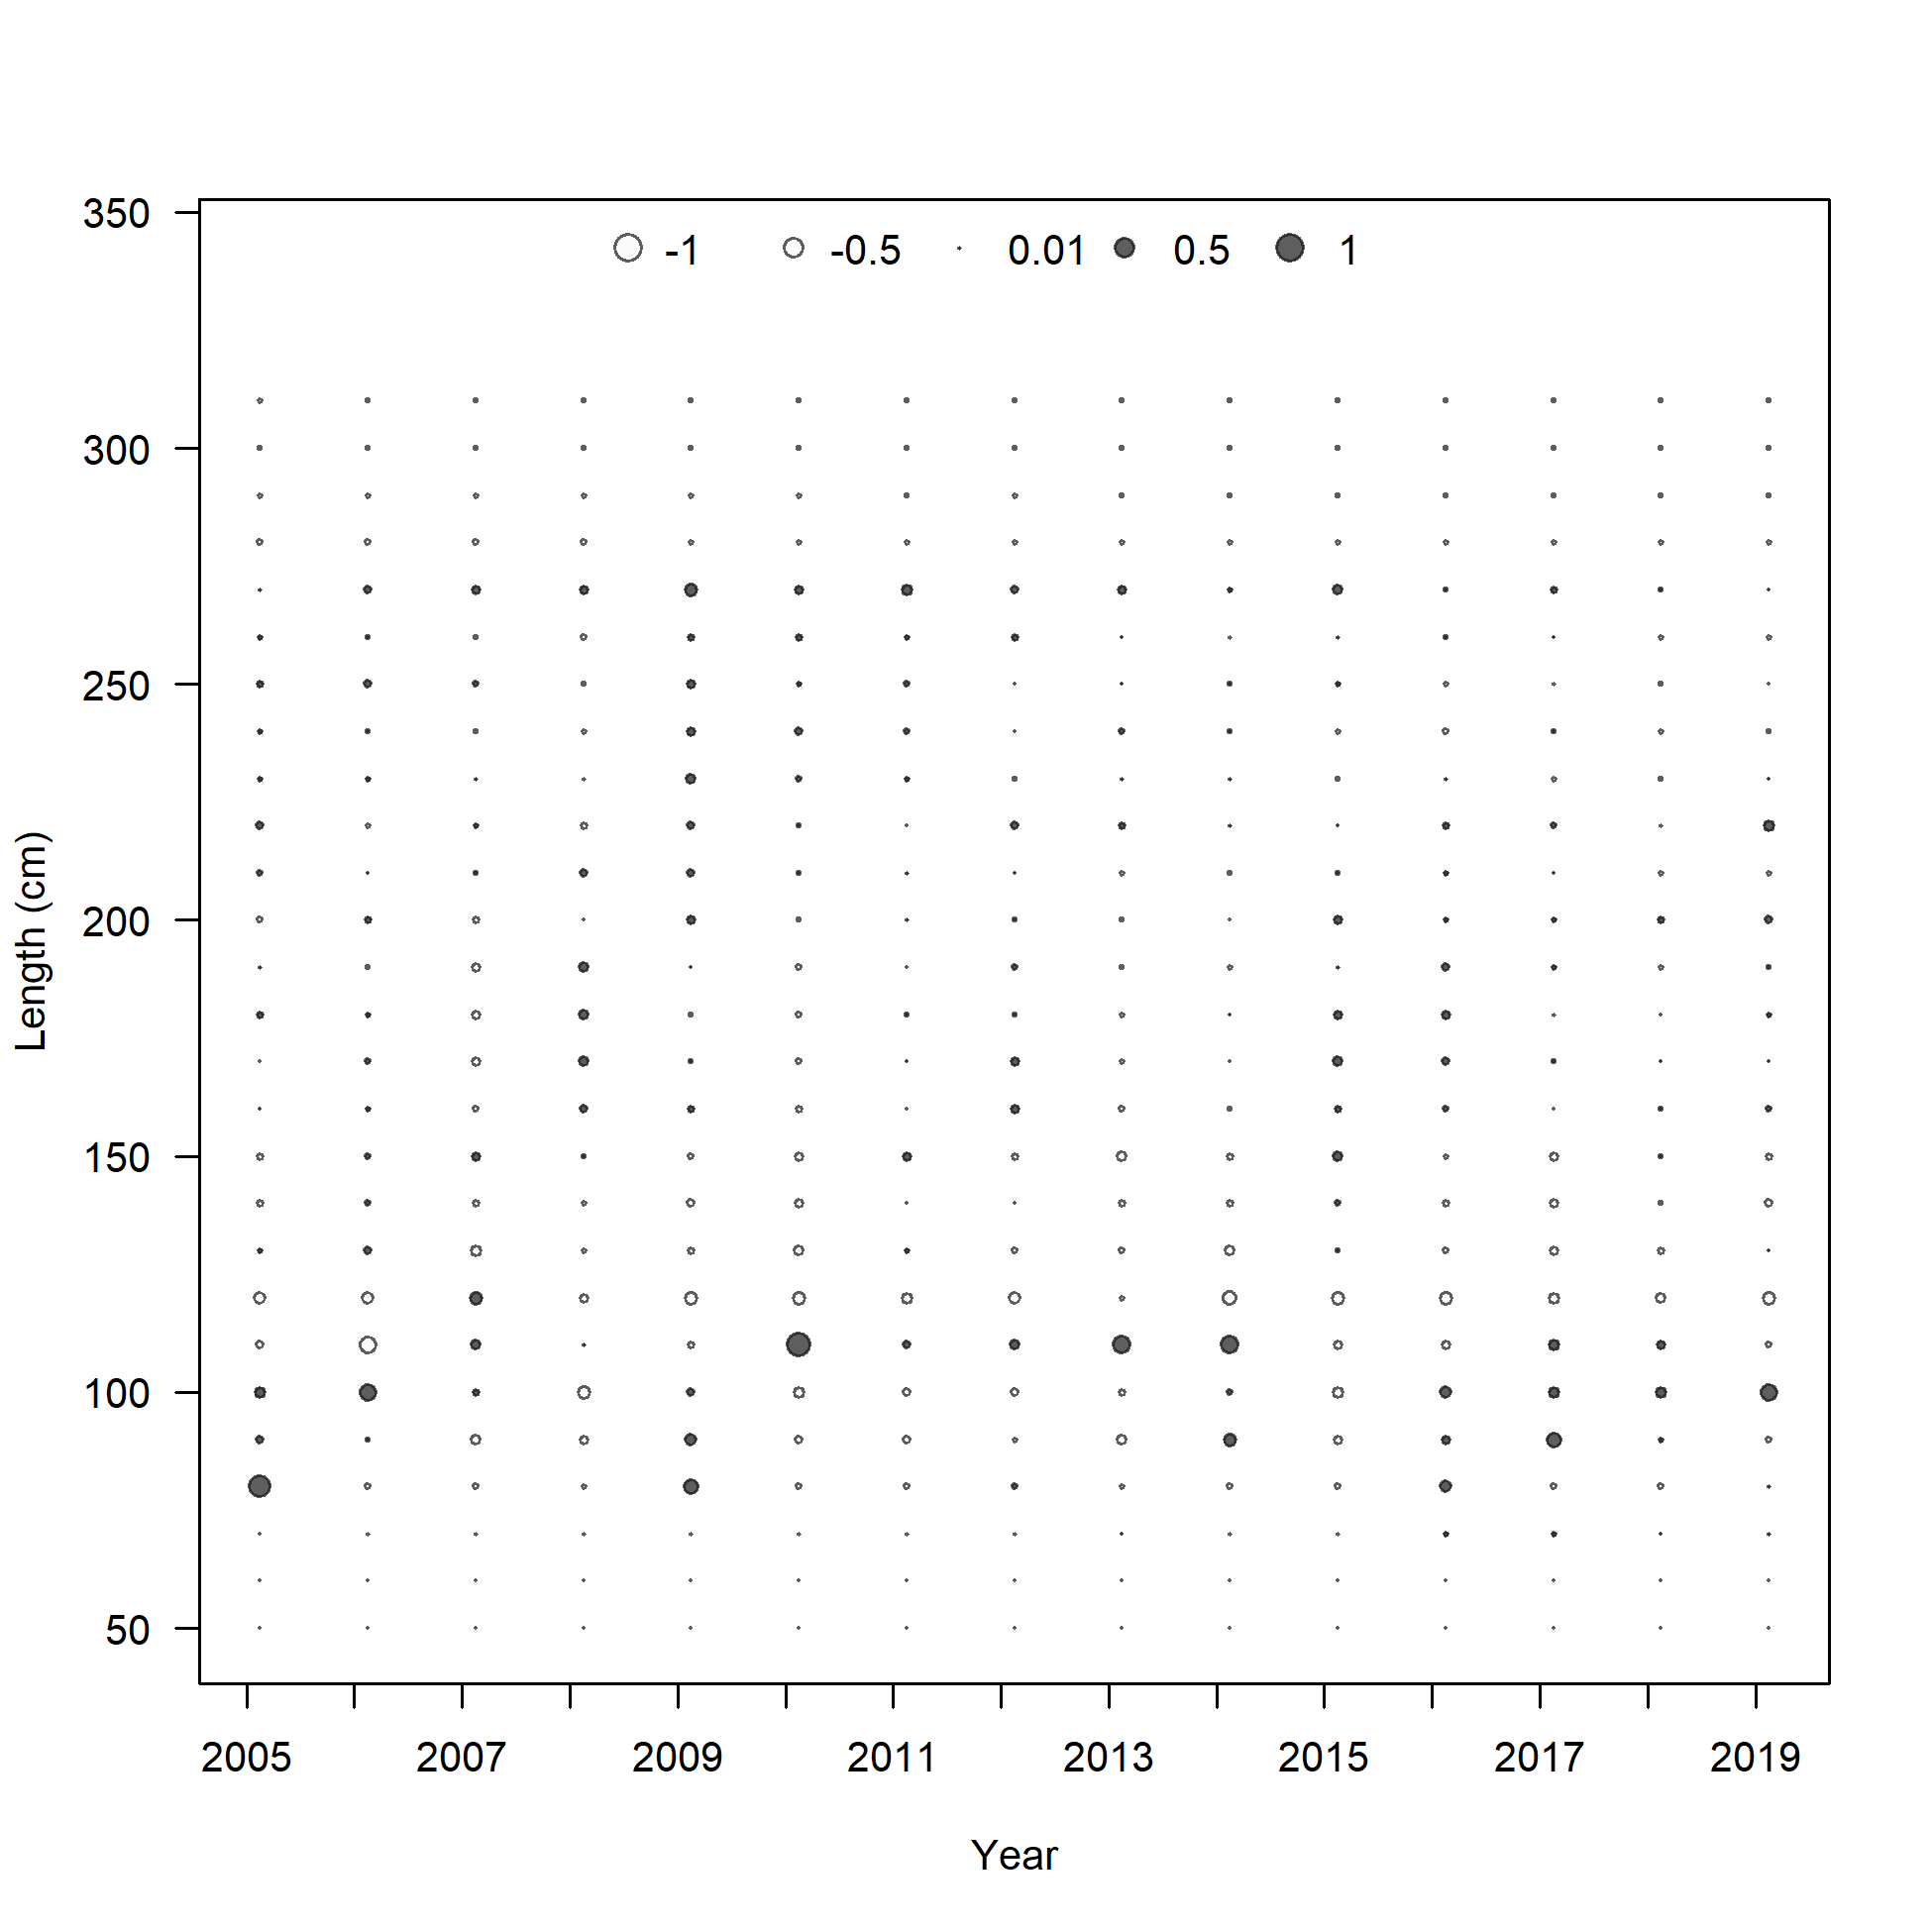
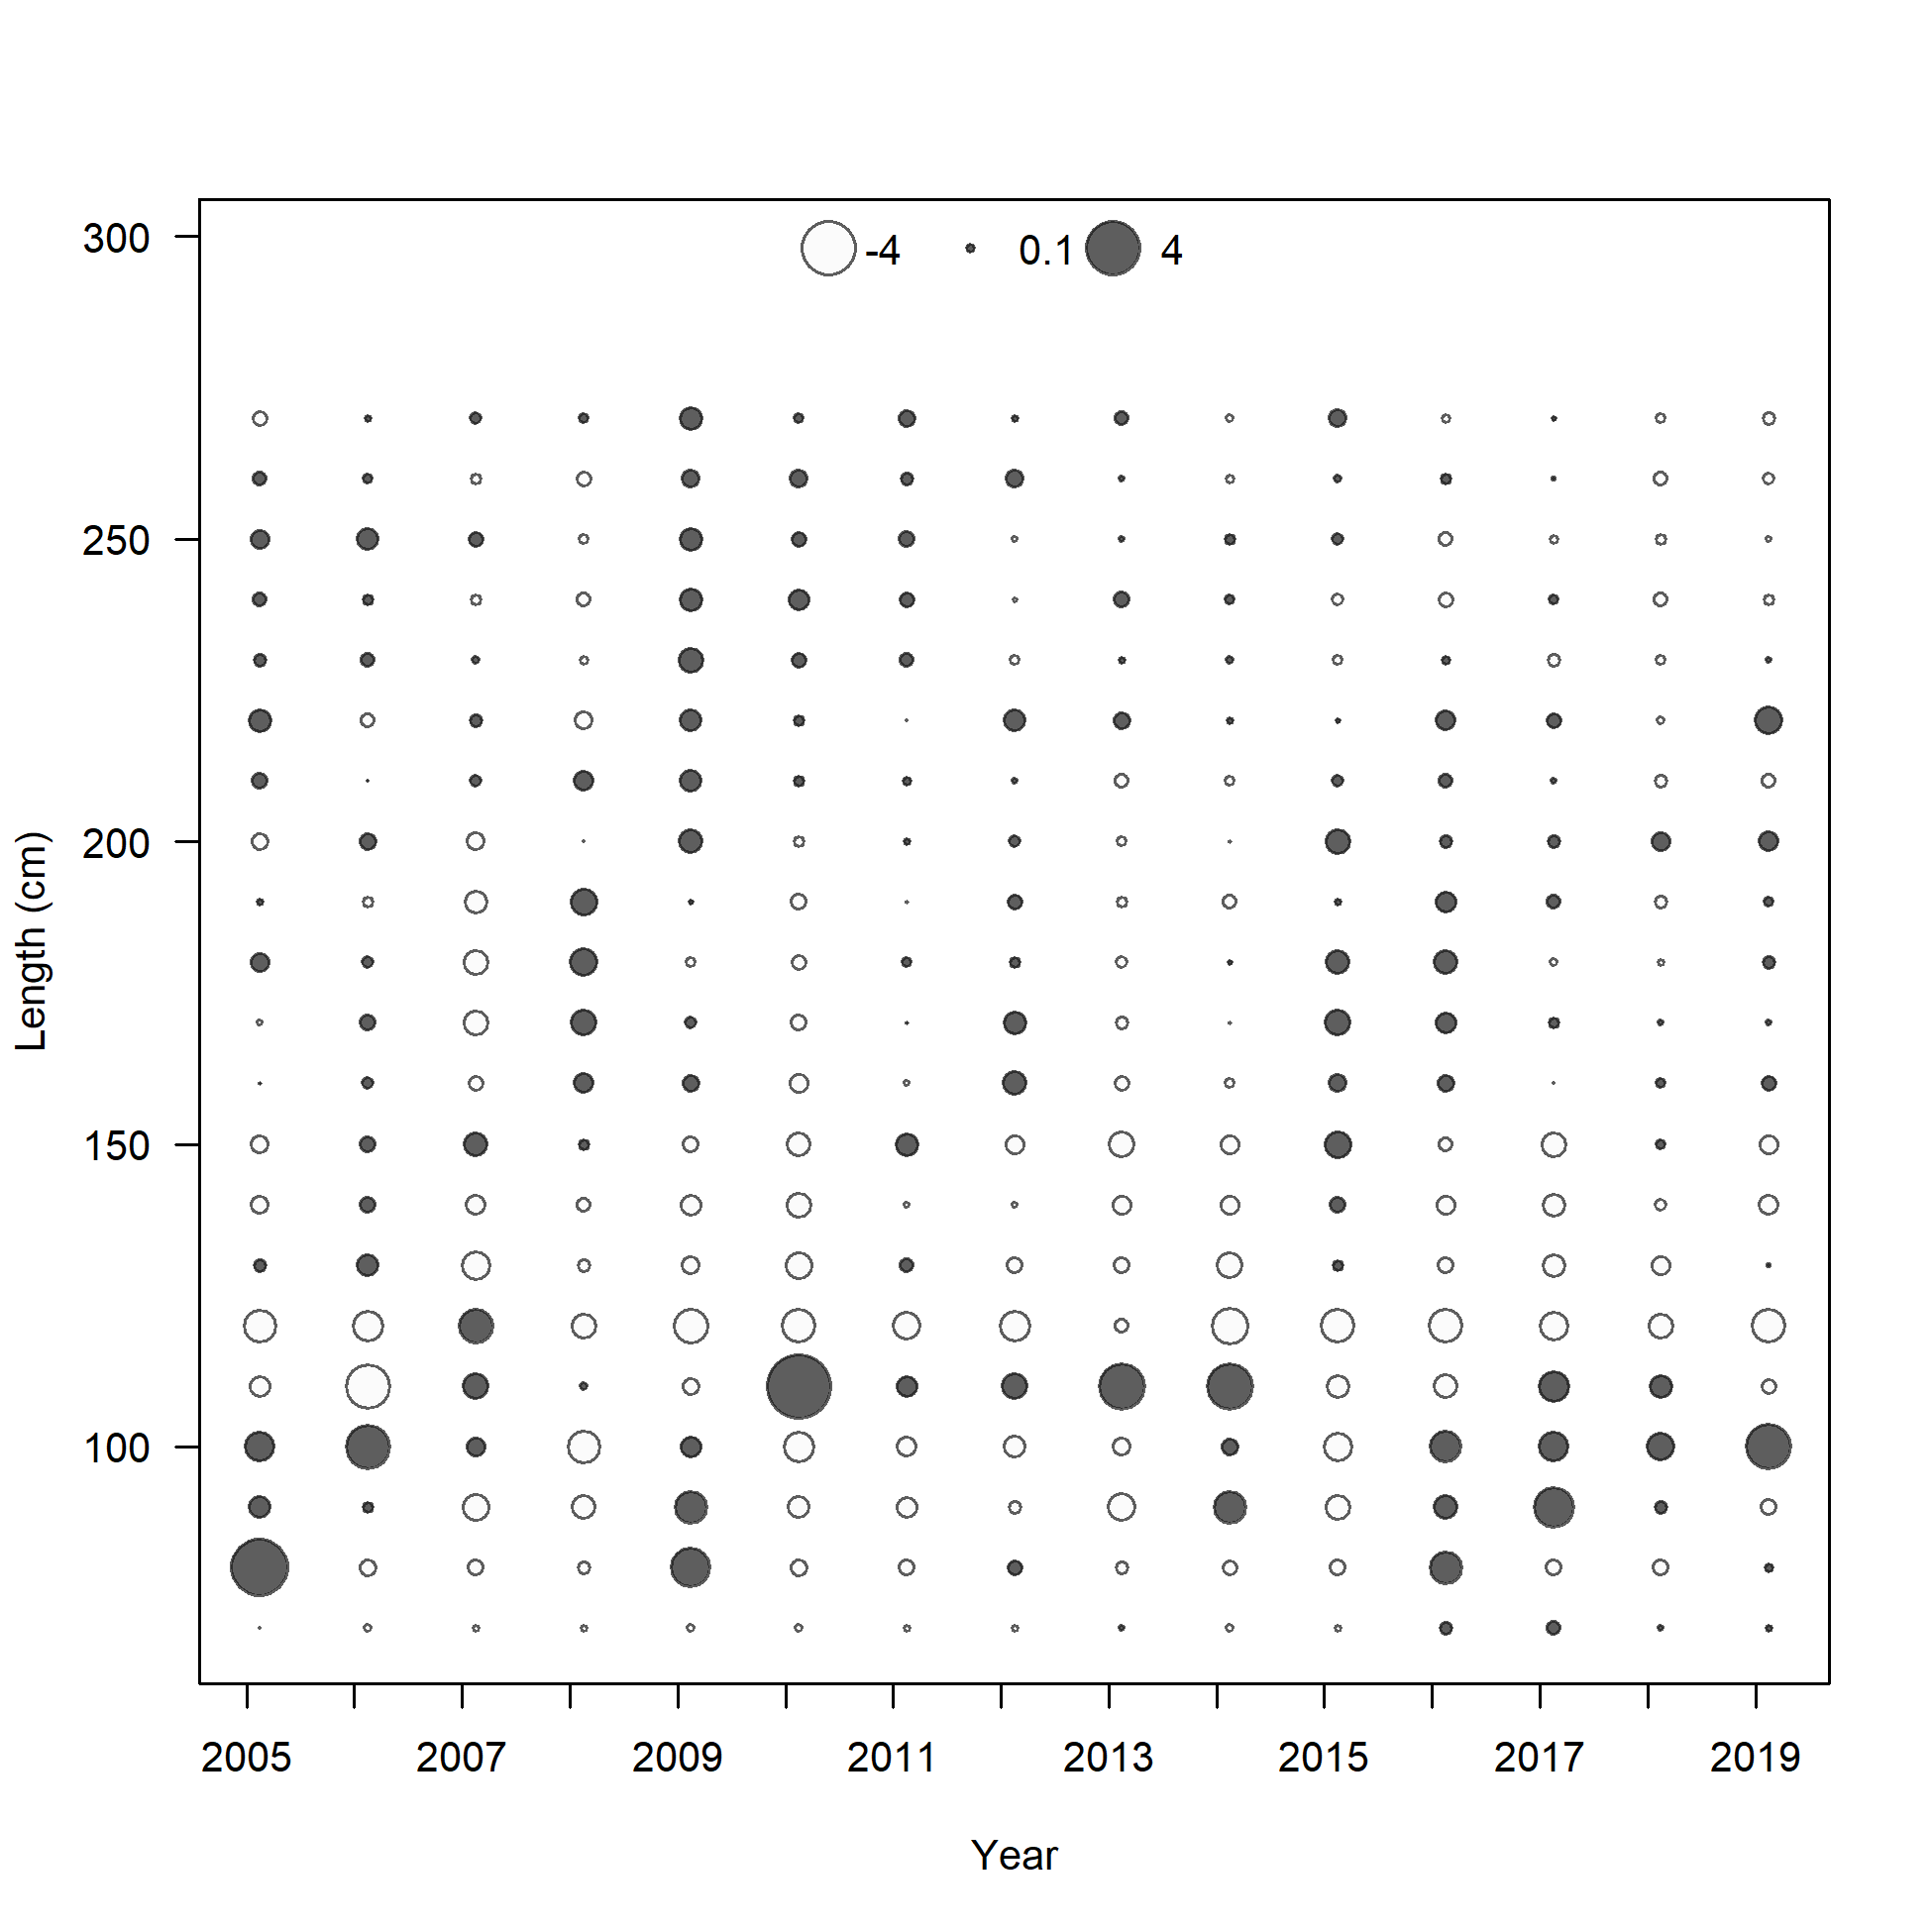
Pearson residuals, whole catch, I6_ESP_Q1 (max=0.78)
Closed bubbles are positive residuals (observed > expected) and open bubbles are negative residuals (observed < expected).
file: comp_lenfit_residsflt27mkt0.png
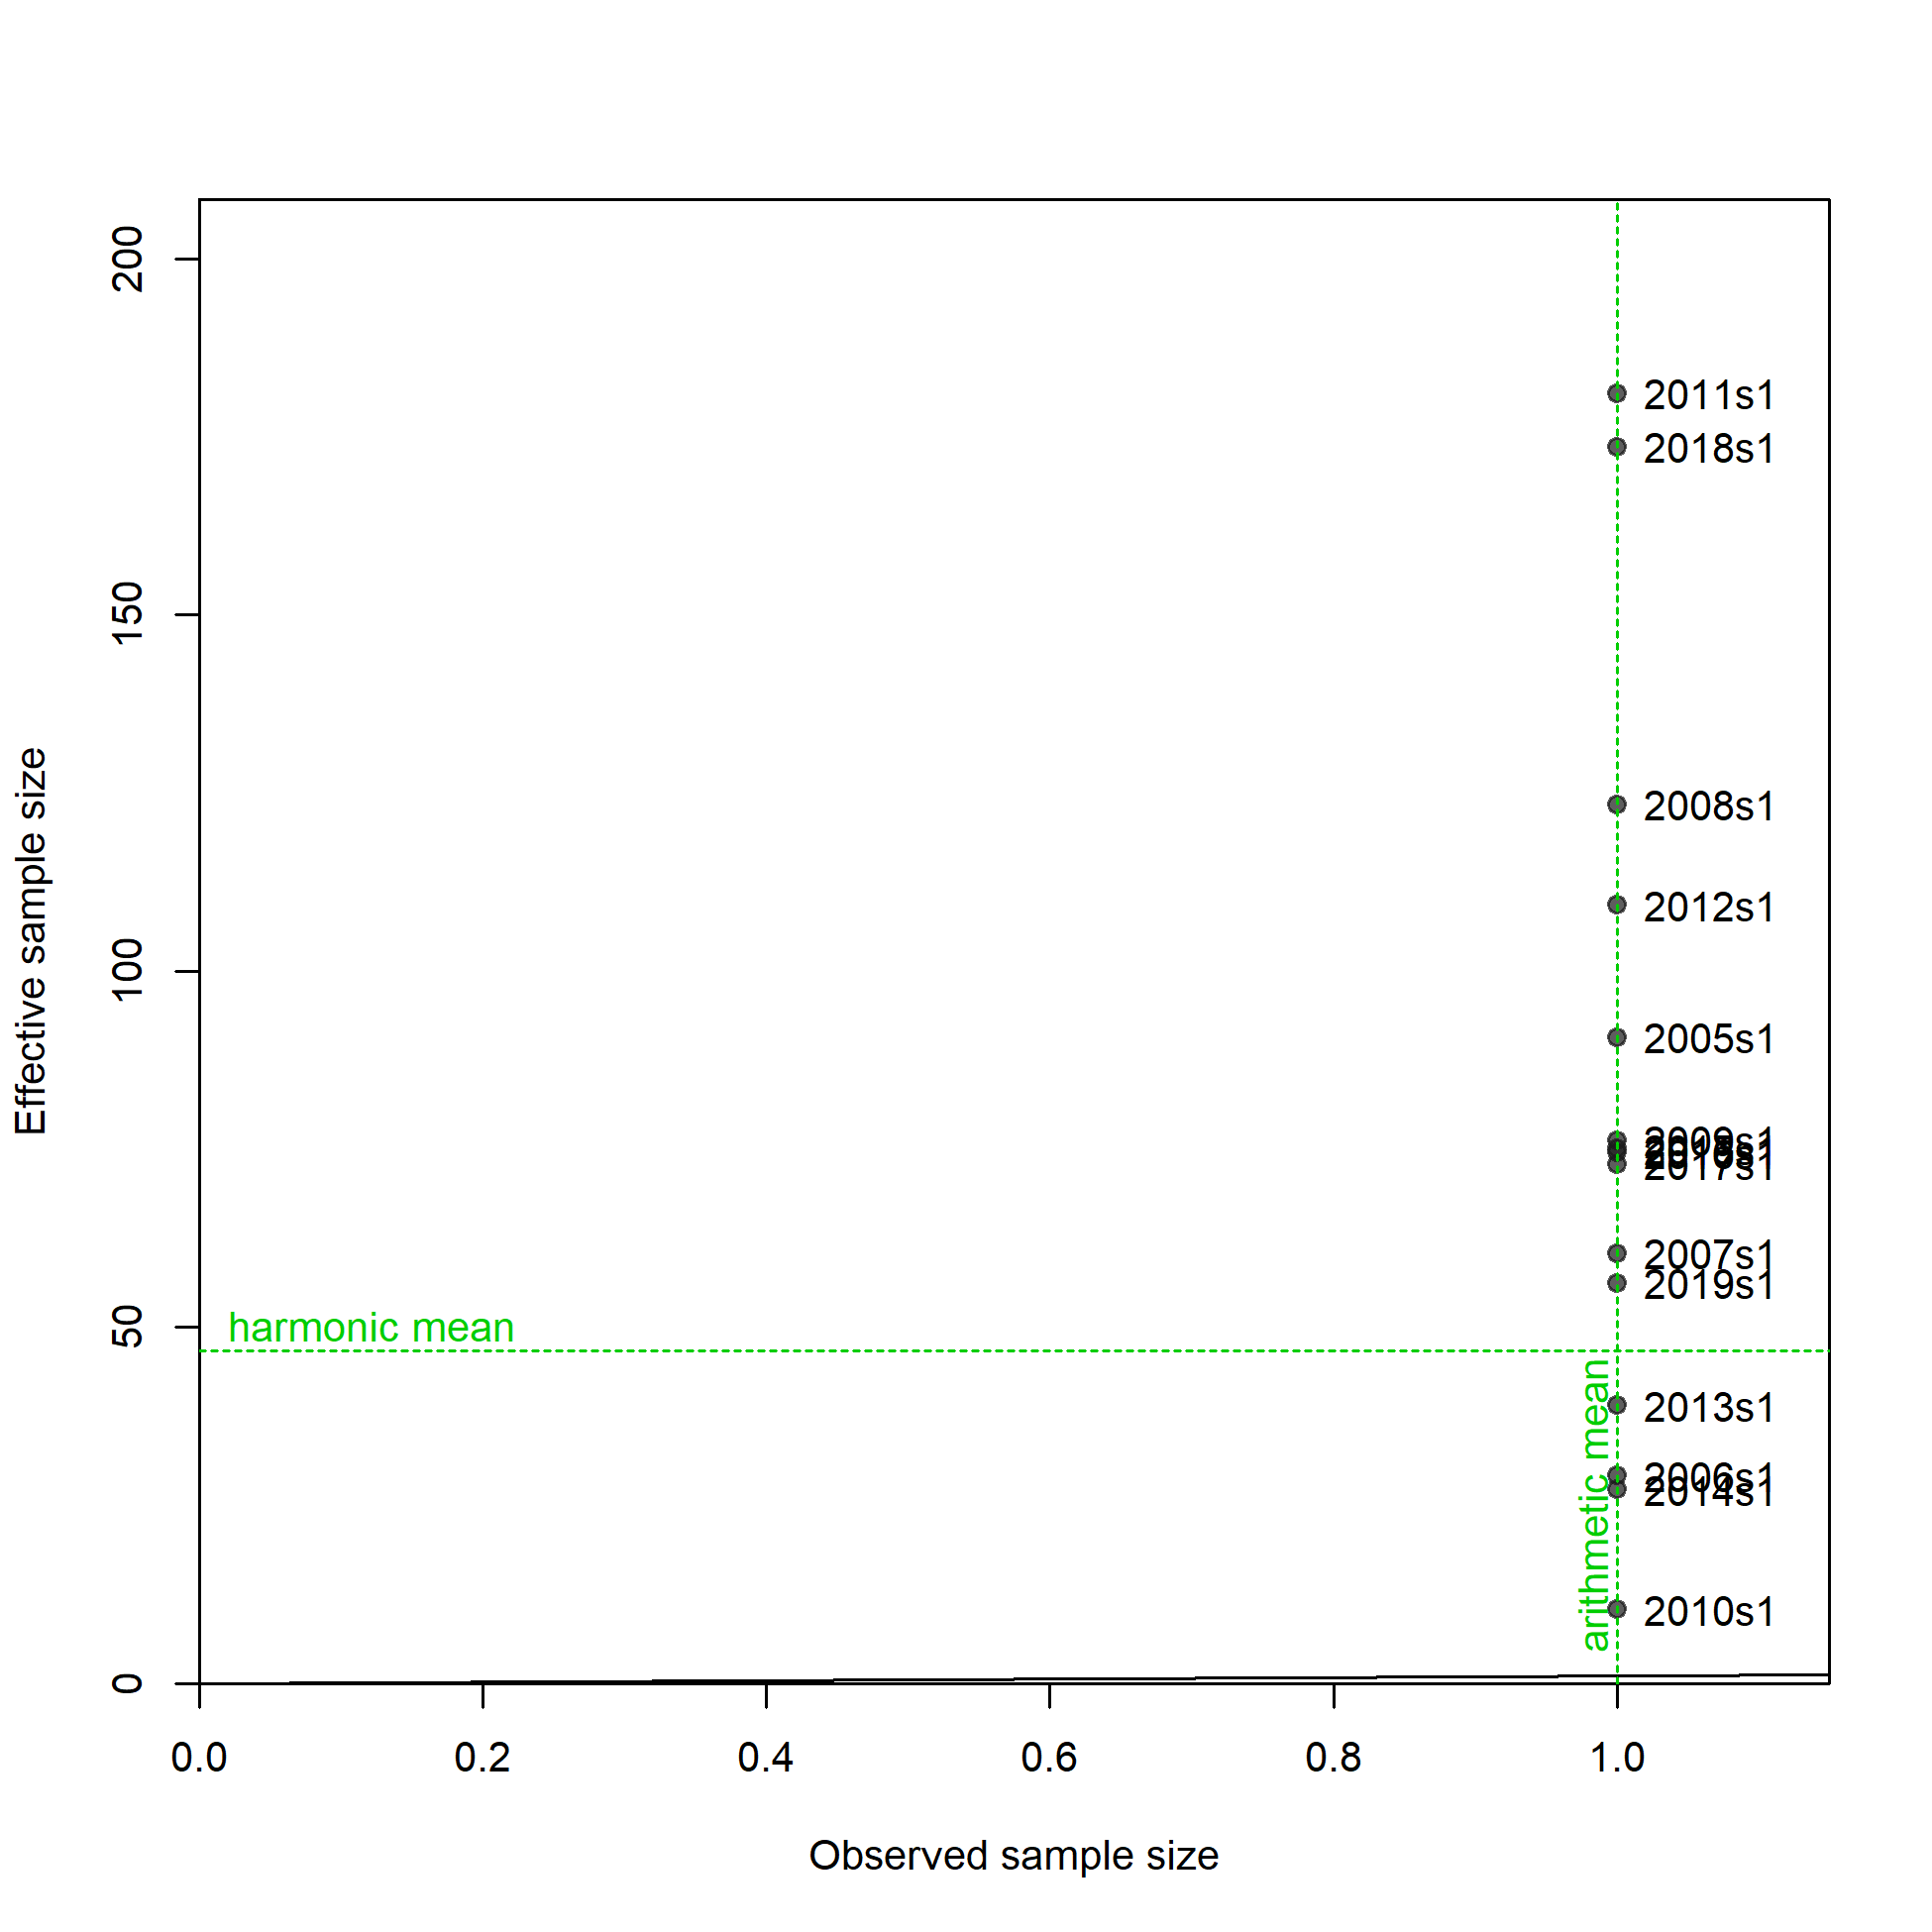
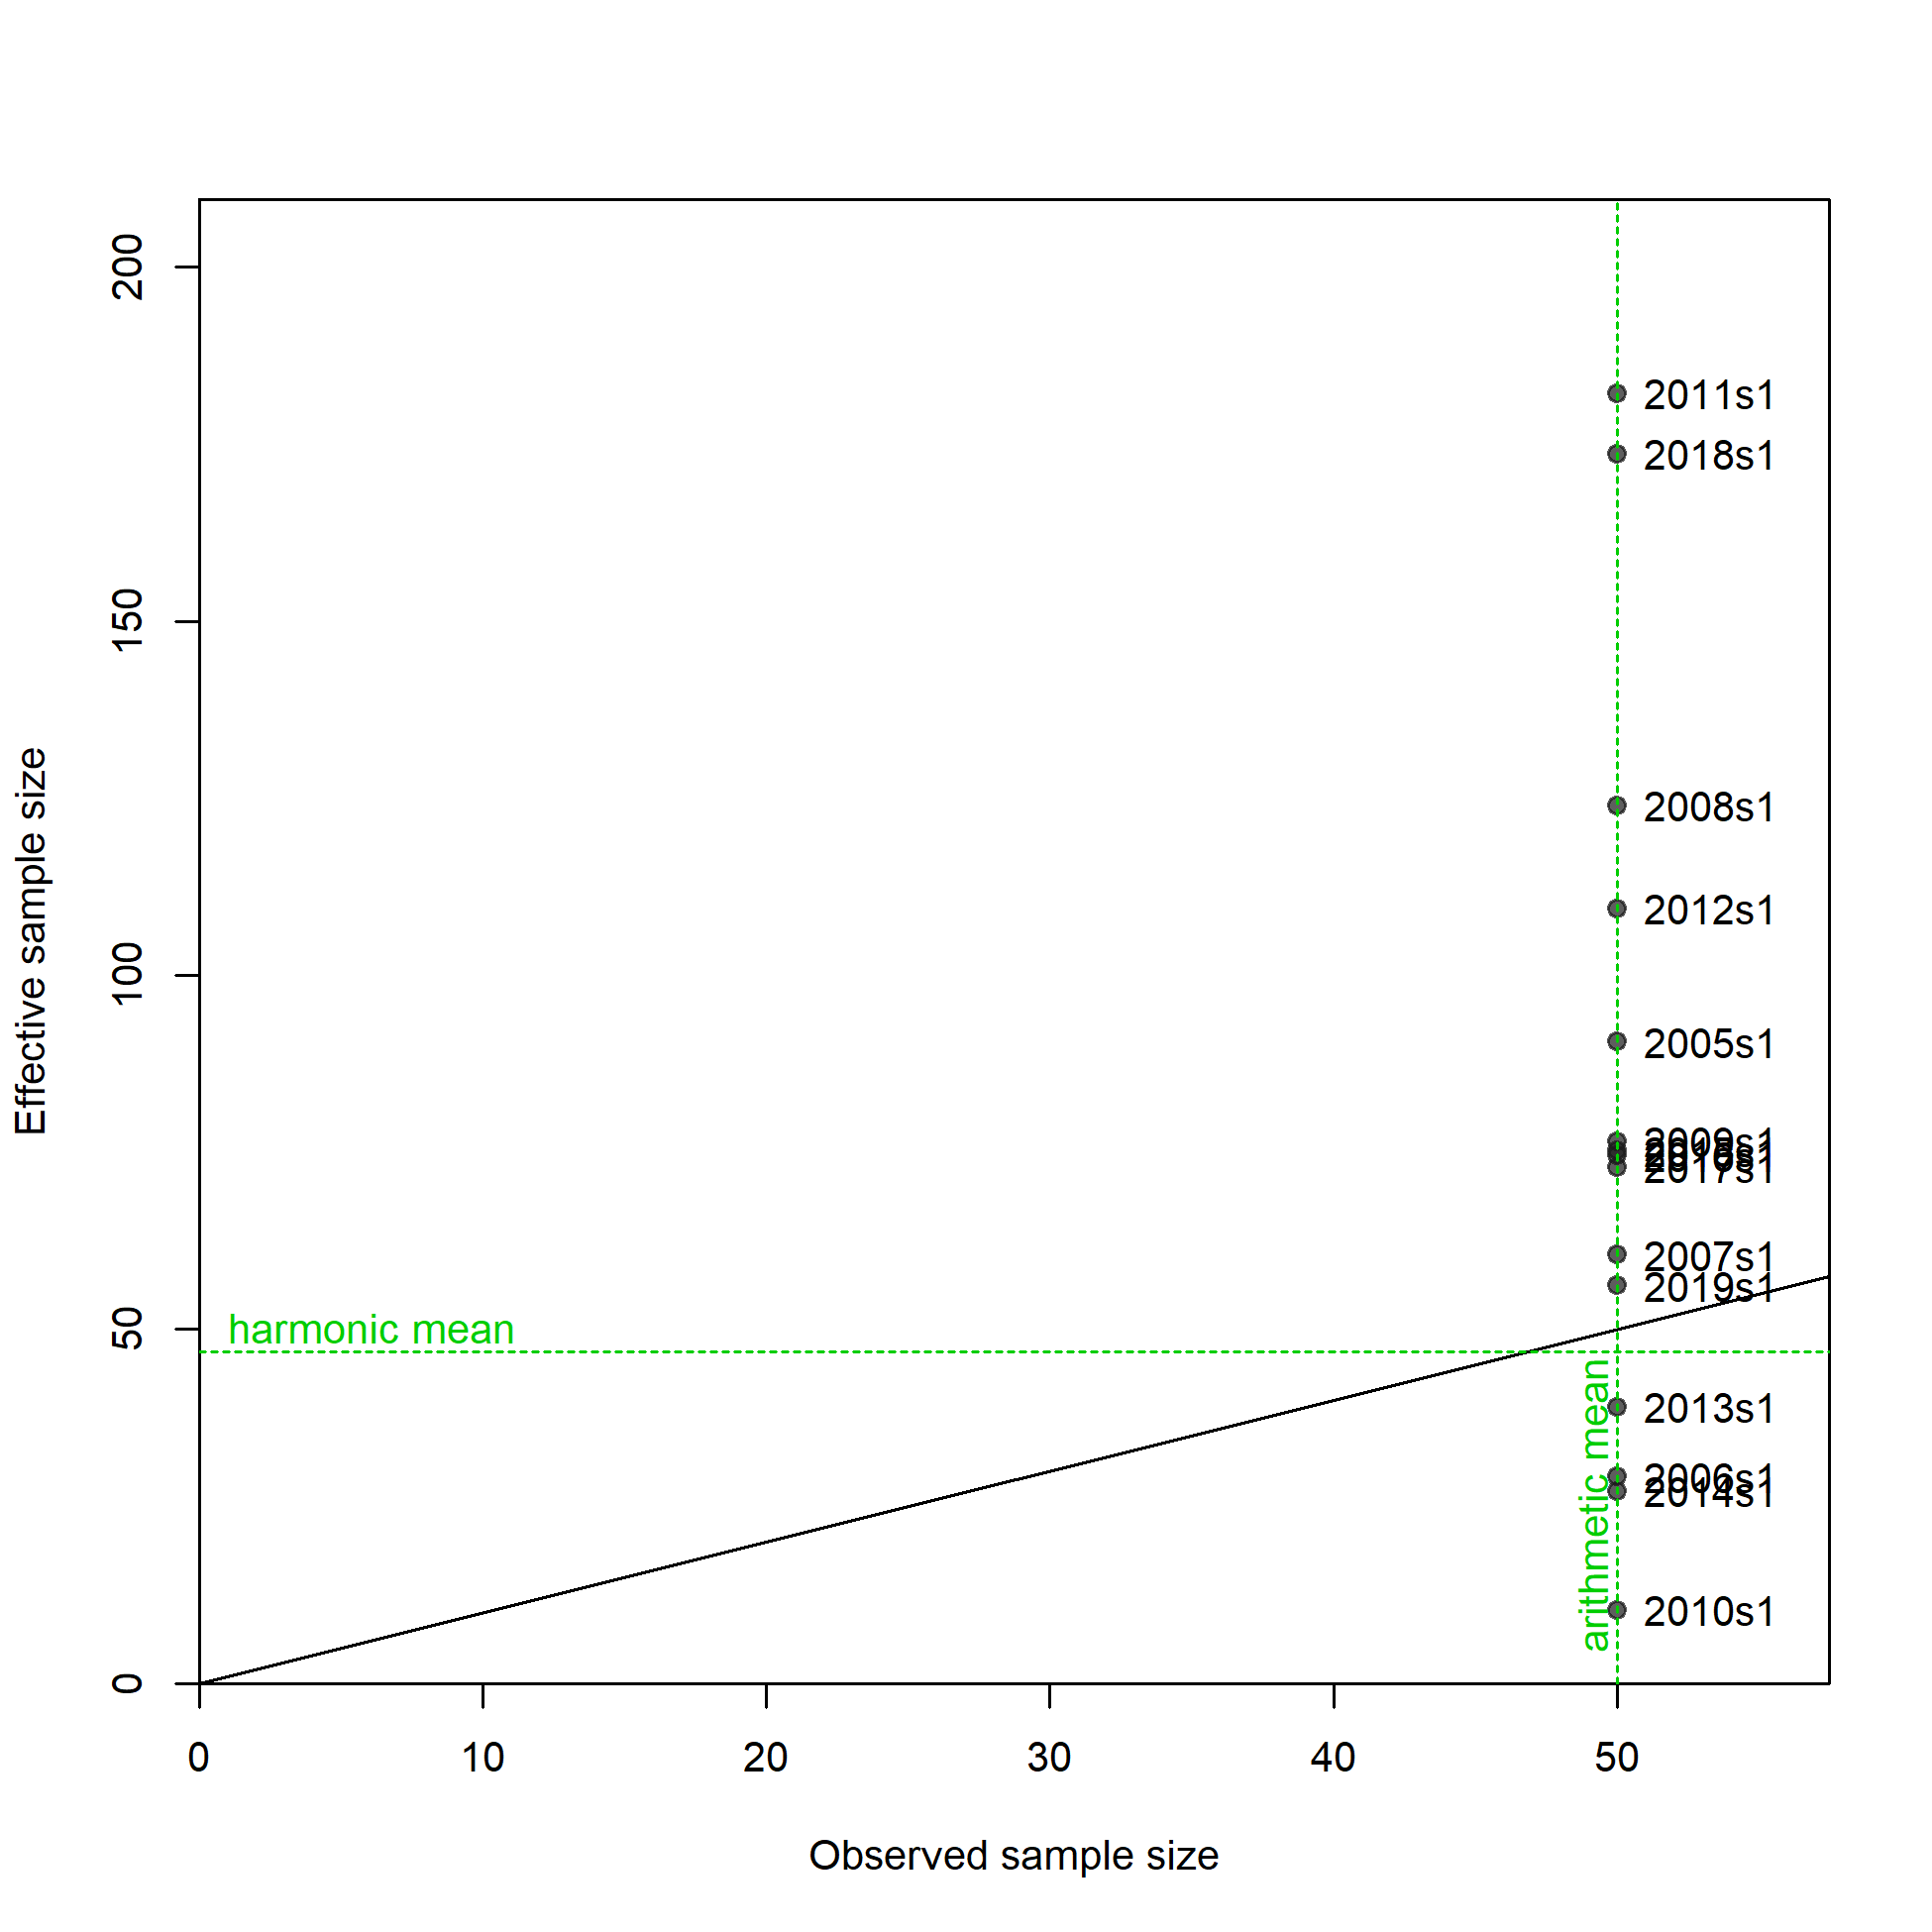
N-EffN comparison, Length comps, whole catch, I6_ESP_Q1
file: comp_lenfit_sampsize_flt27mkt0.png
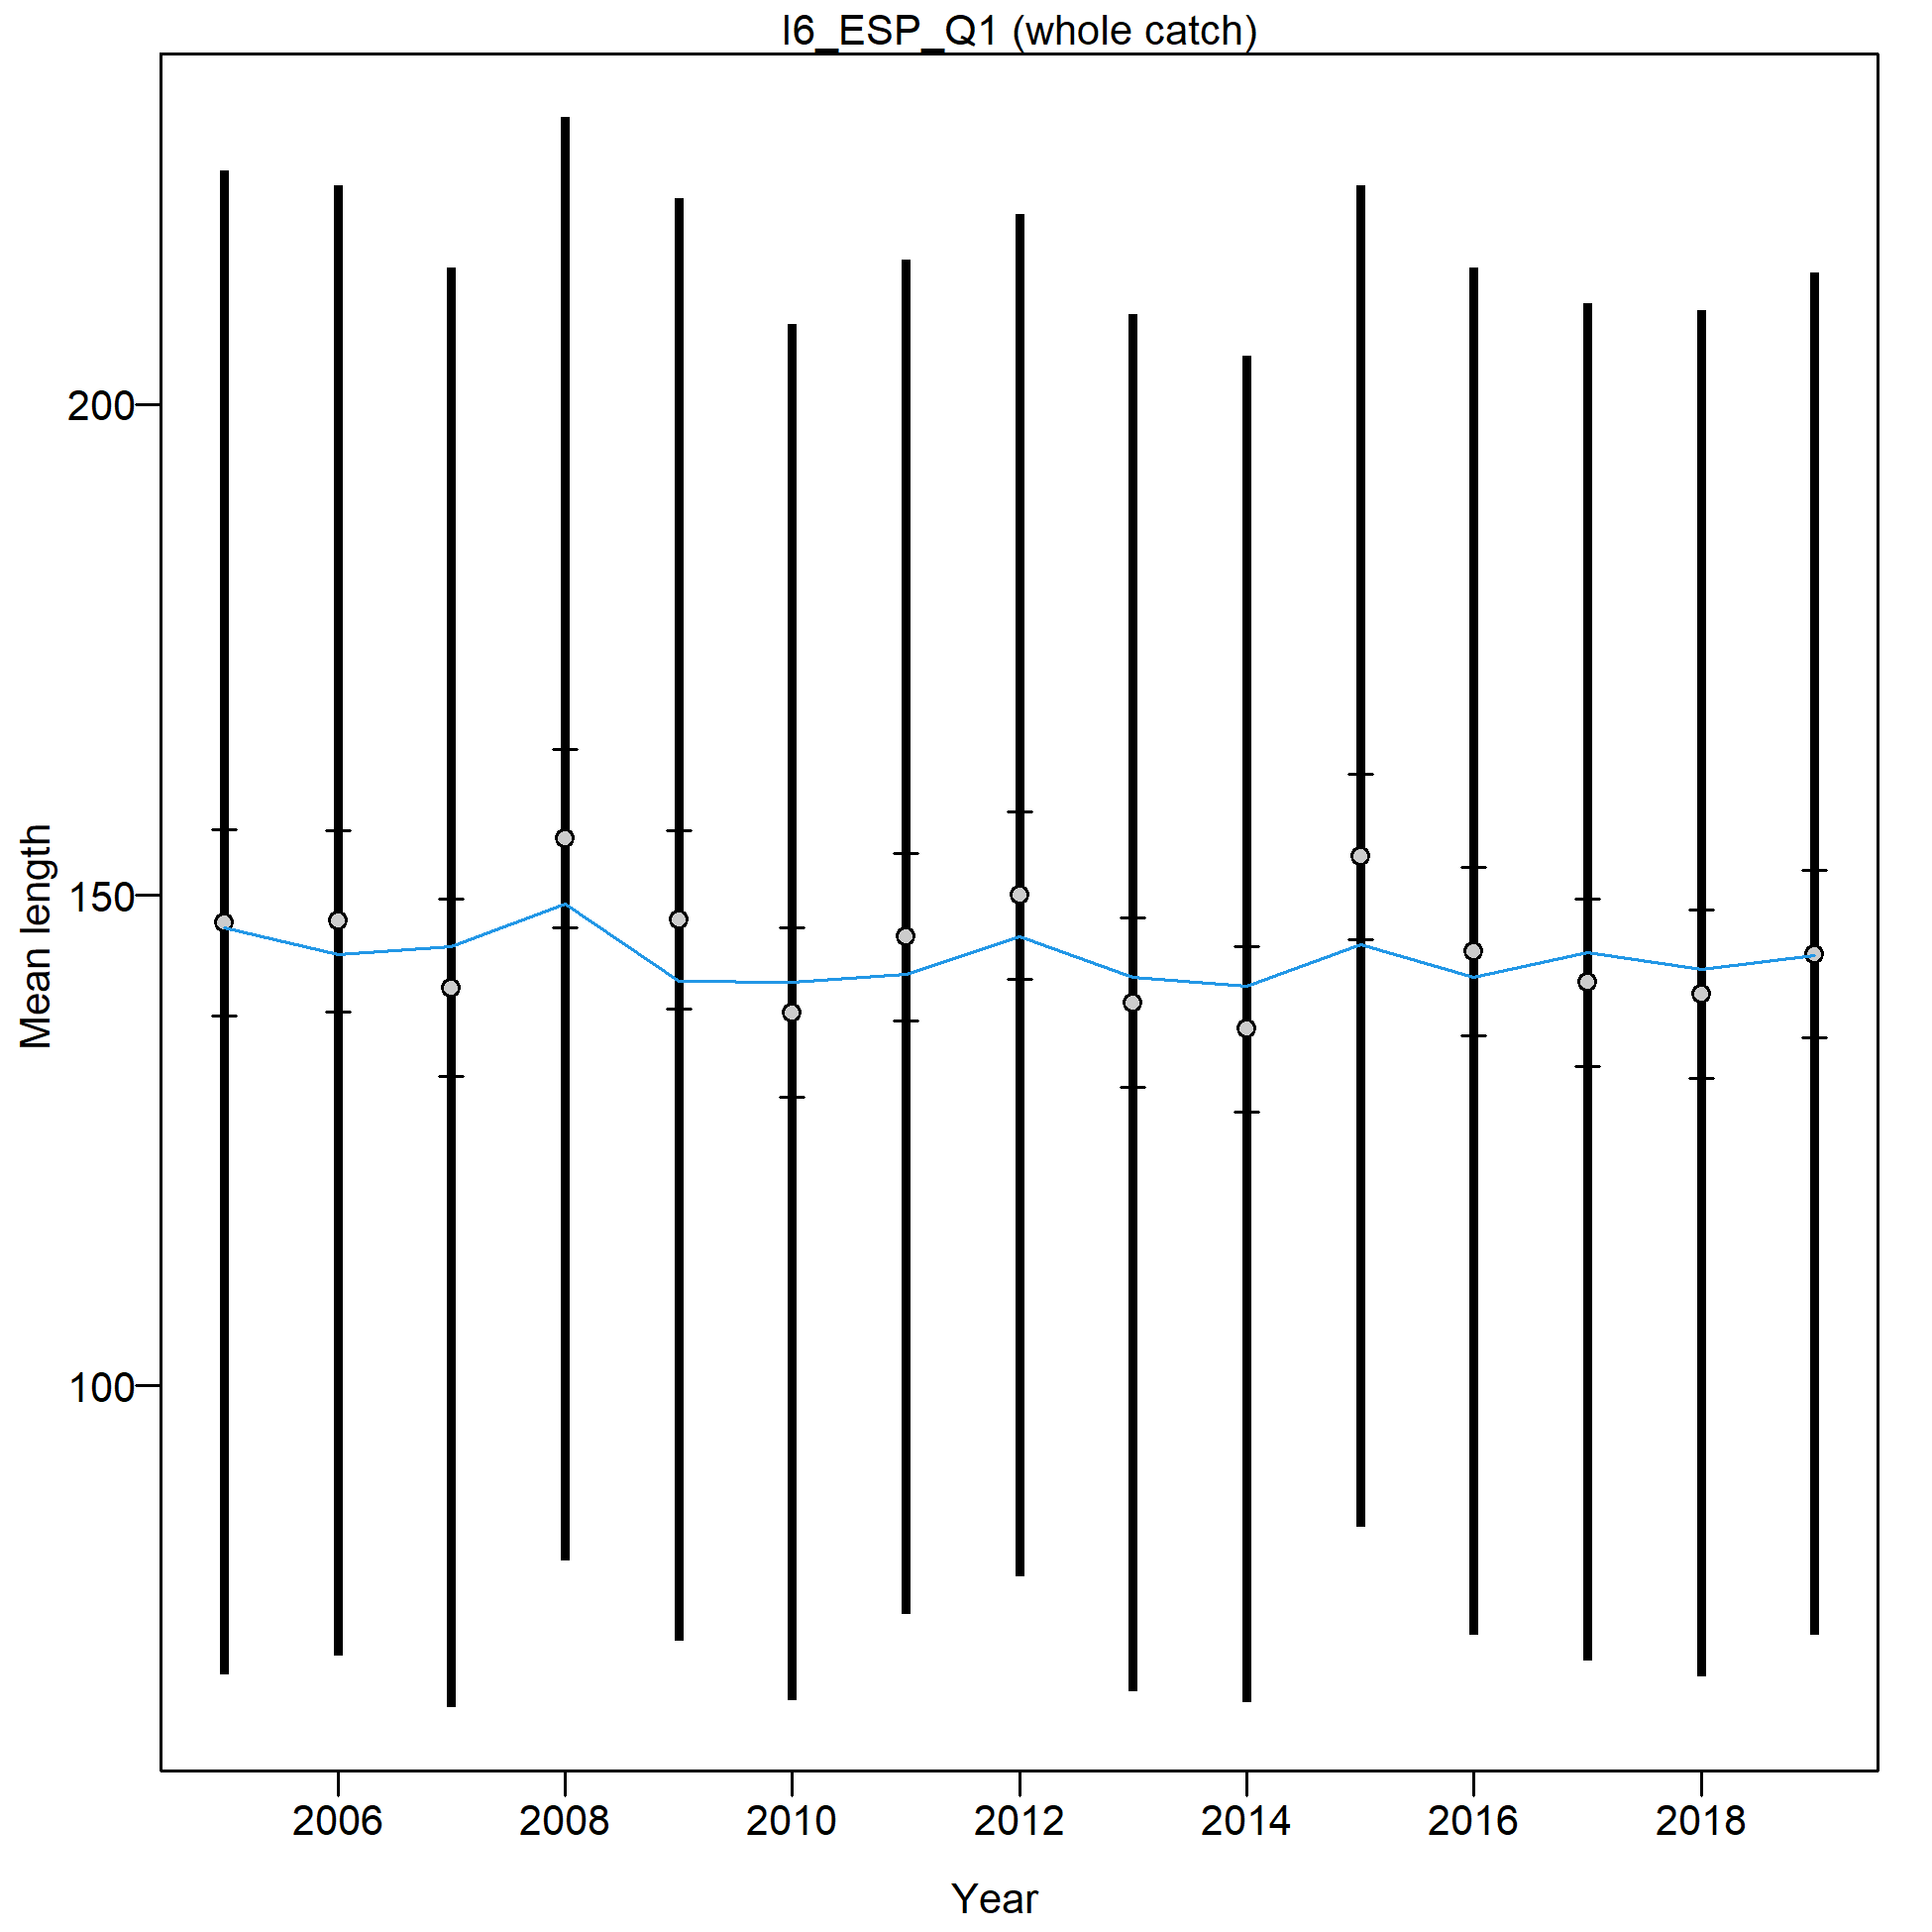
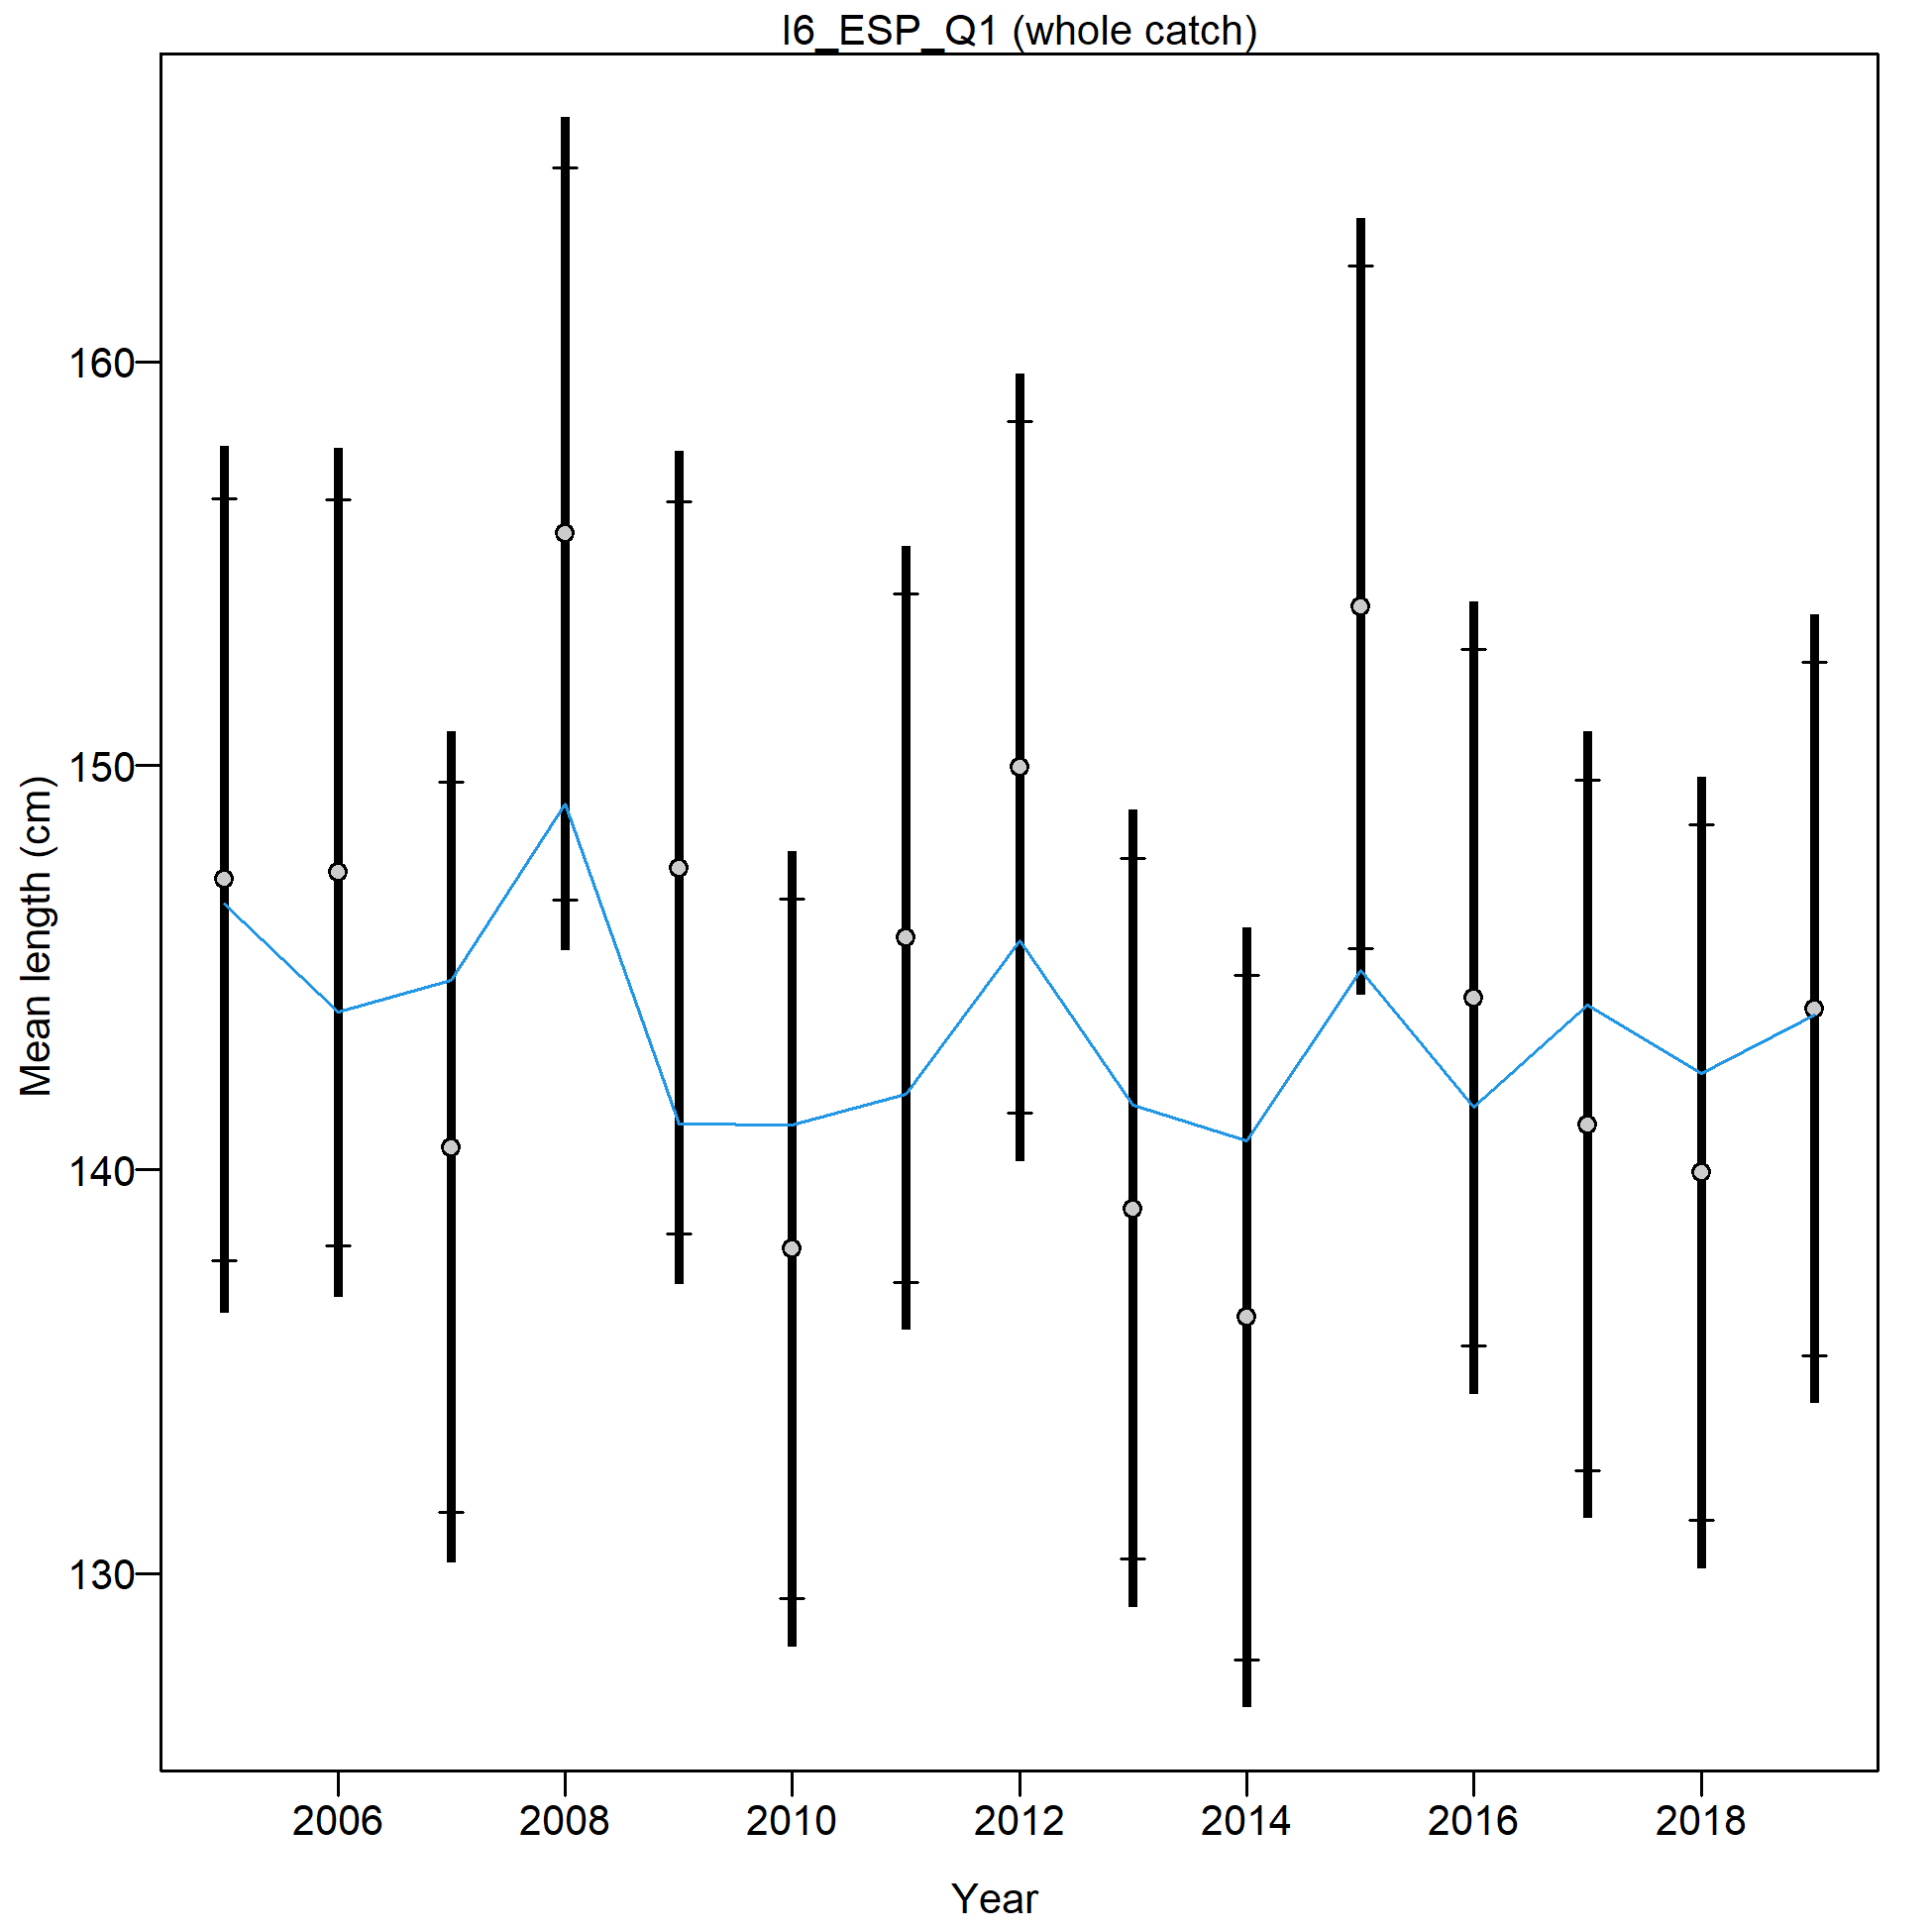
Mean length for I6_ESP_Q1 with 95% confidence intervals based on current samples sizes.
Francis data weighting method TA1.8: thinner intervals (with capped ends) show result of further adjusting sample sizes based on suggested multiplier (with 95% interval) for len data from I6_ESP_Q1:
65.7777 (46.9691-136.8857)
For more info, see
Francis, R.I.C.C. (2011). Data weighting in statistical fisheries stock assessment models. Can. J. Fish. Aquat. Sci. 68: 1124-1138. https://doi.org/10.1139/f2011-025

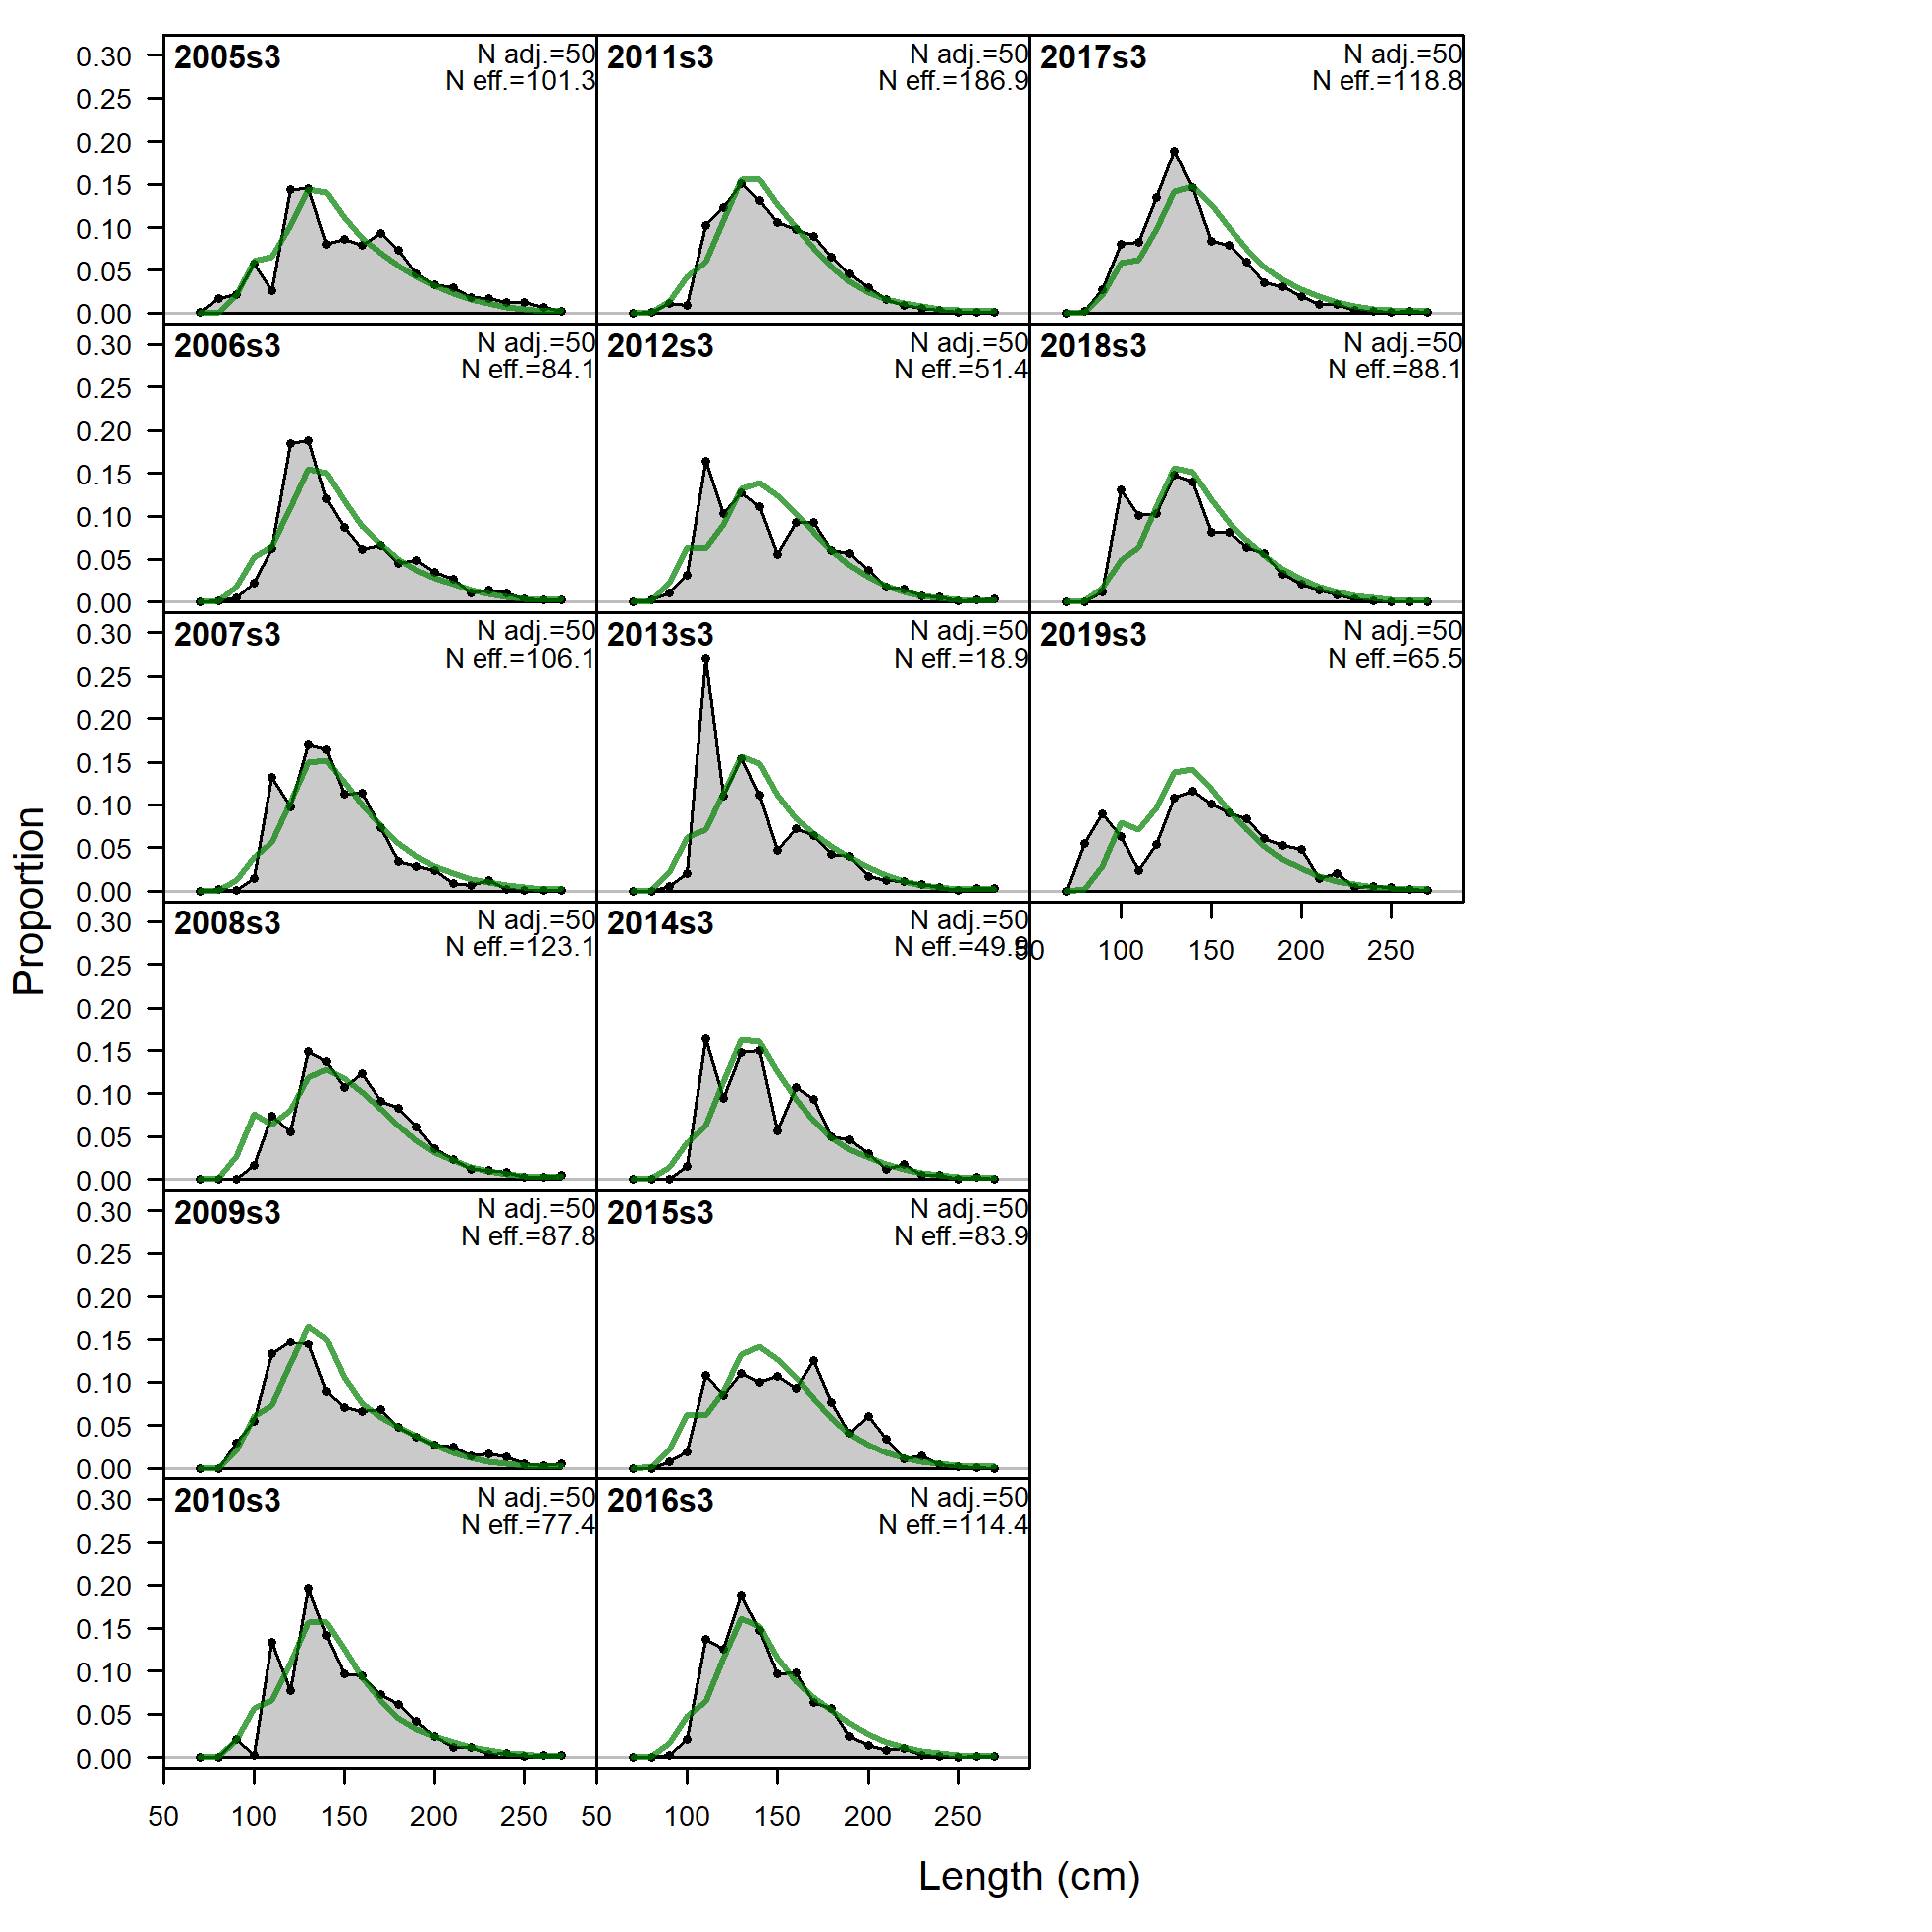
Length comps, whole catch, I7_ESP_Q2.
'N adj.' is the input sample size after data-weighting adjustment. N eff. is the calculated effective sample size used in the McAllister-Ianelli tuning method.
file: comp_lenfit_flt28mkt0.png
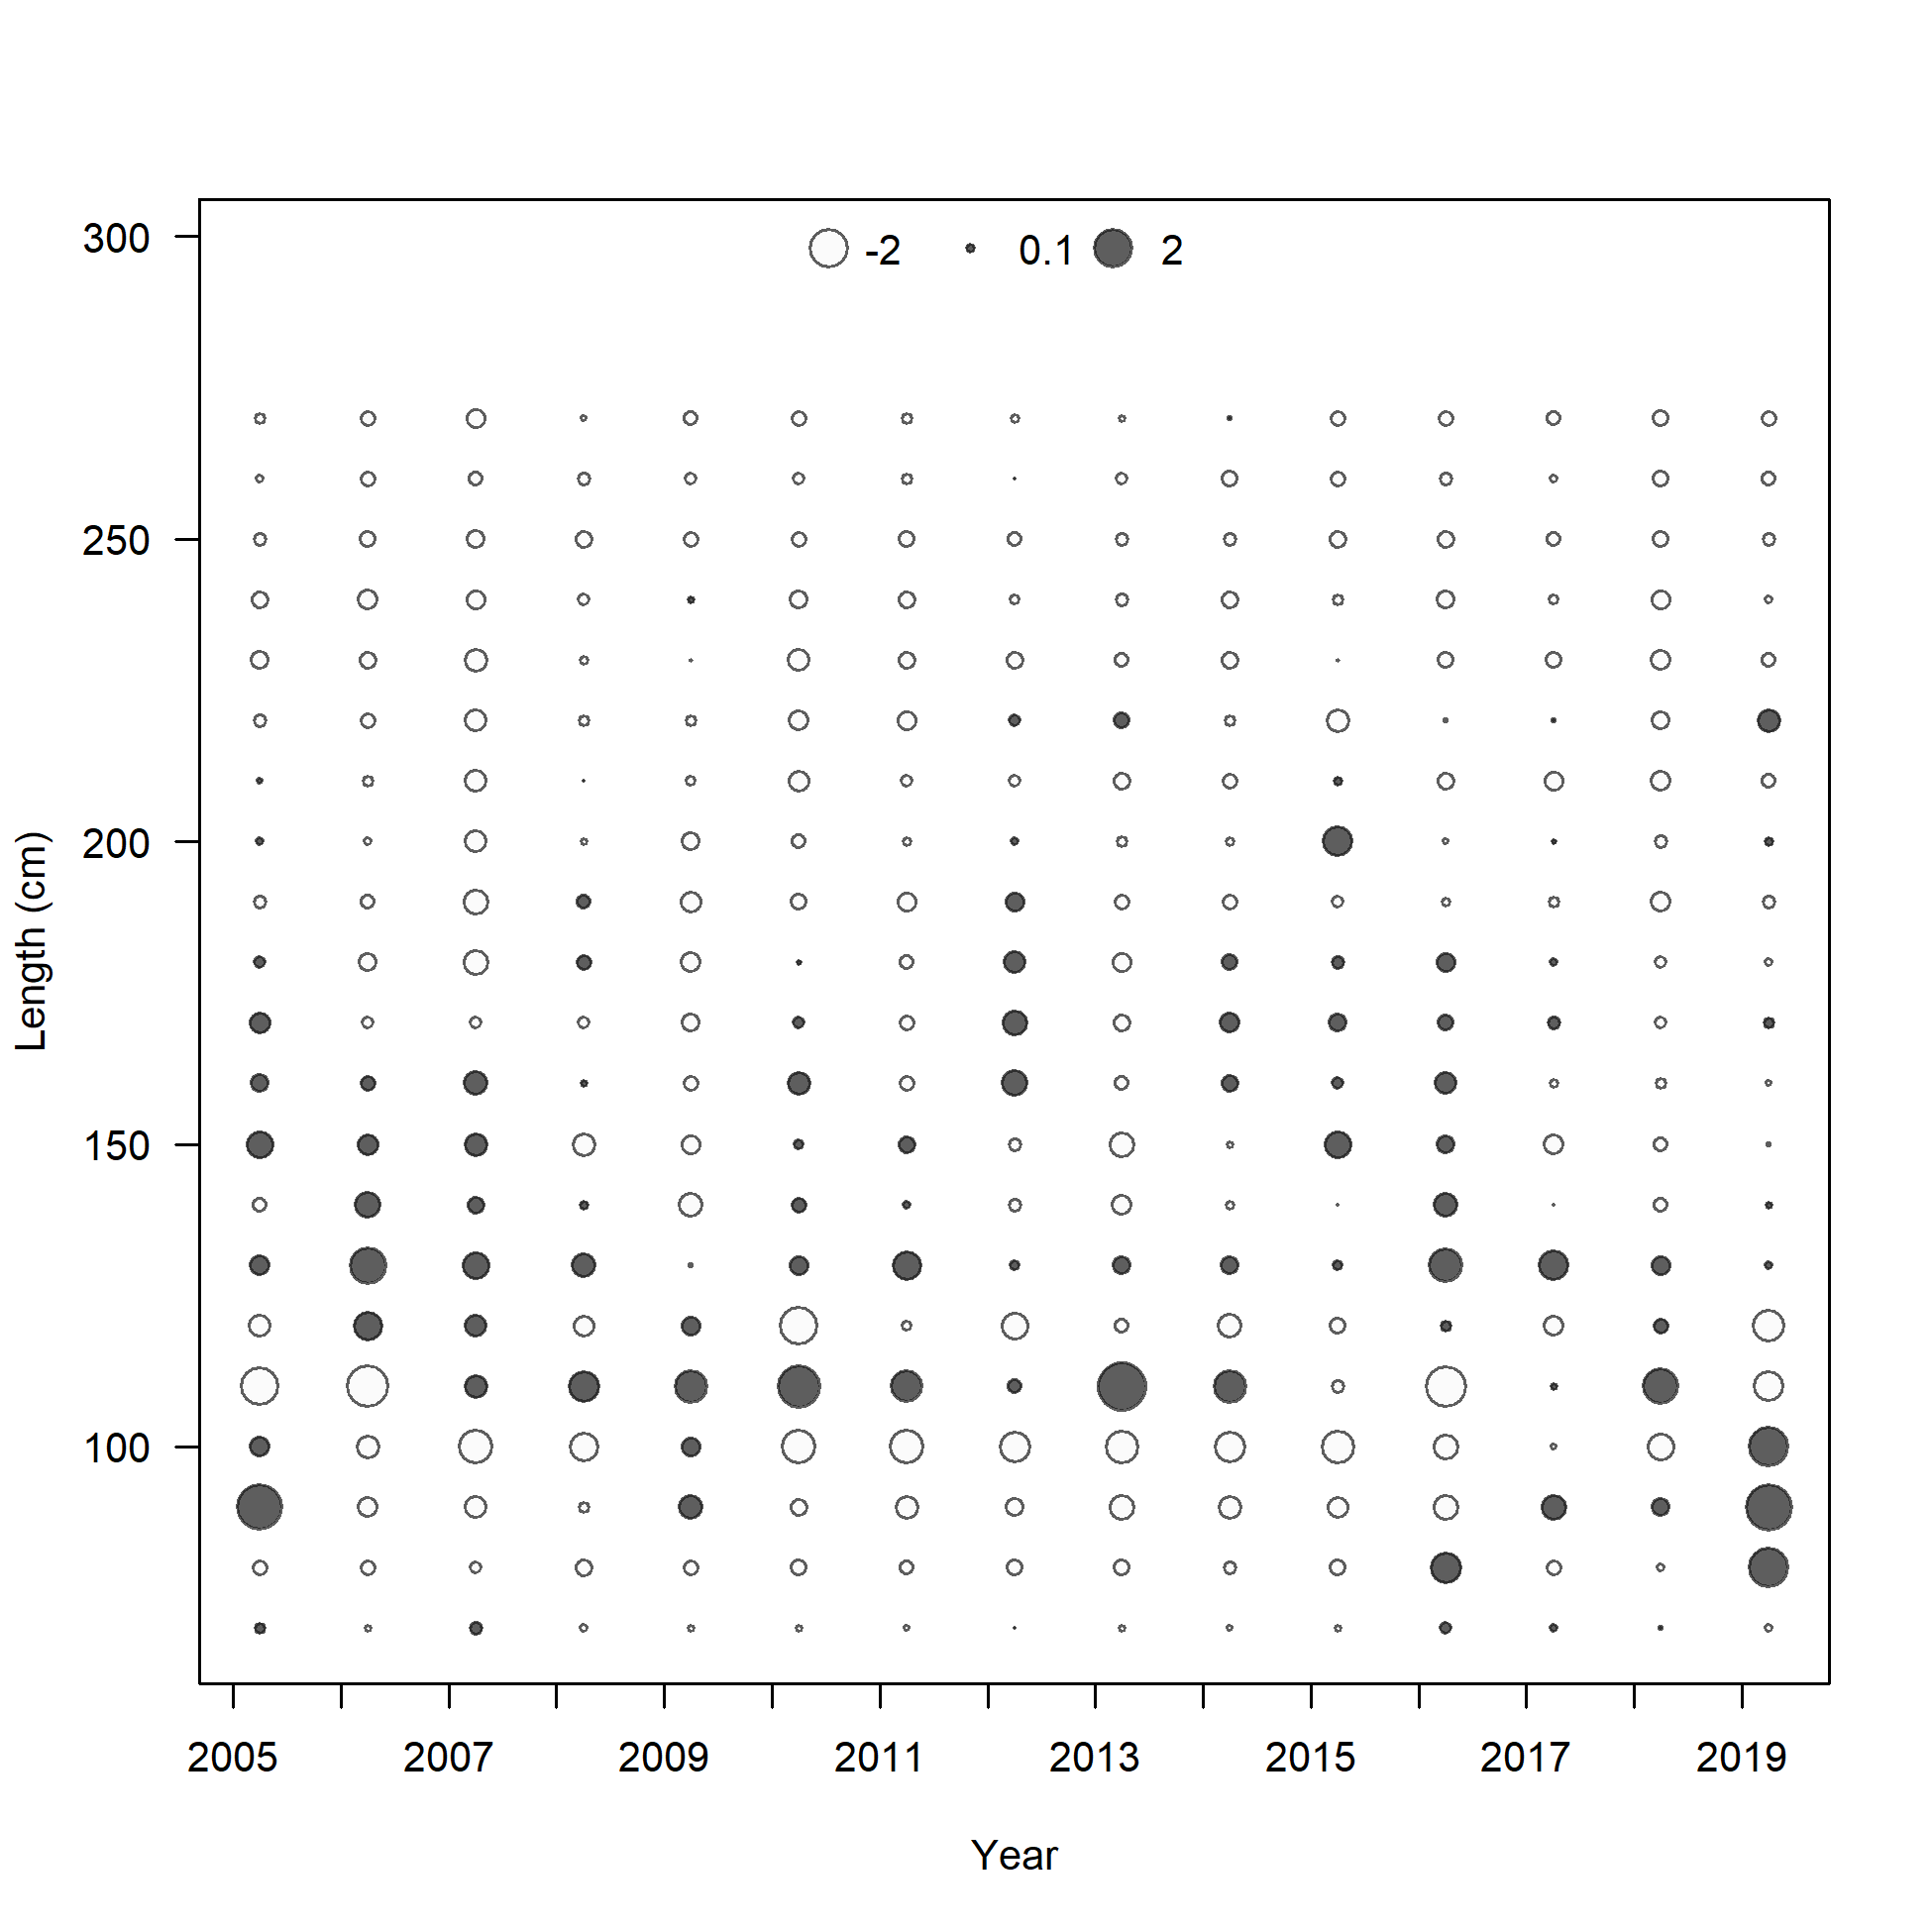
Pearson residuals, whole catch, I7_ESP_Q2 (max=0.45)
Closed bubbles are positive residuals (observed > expected) and open bubbles are negative residuals (observed < expected).
file: comp_lenfit_residsflt28mkt0.png
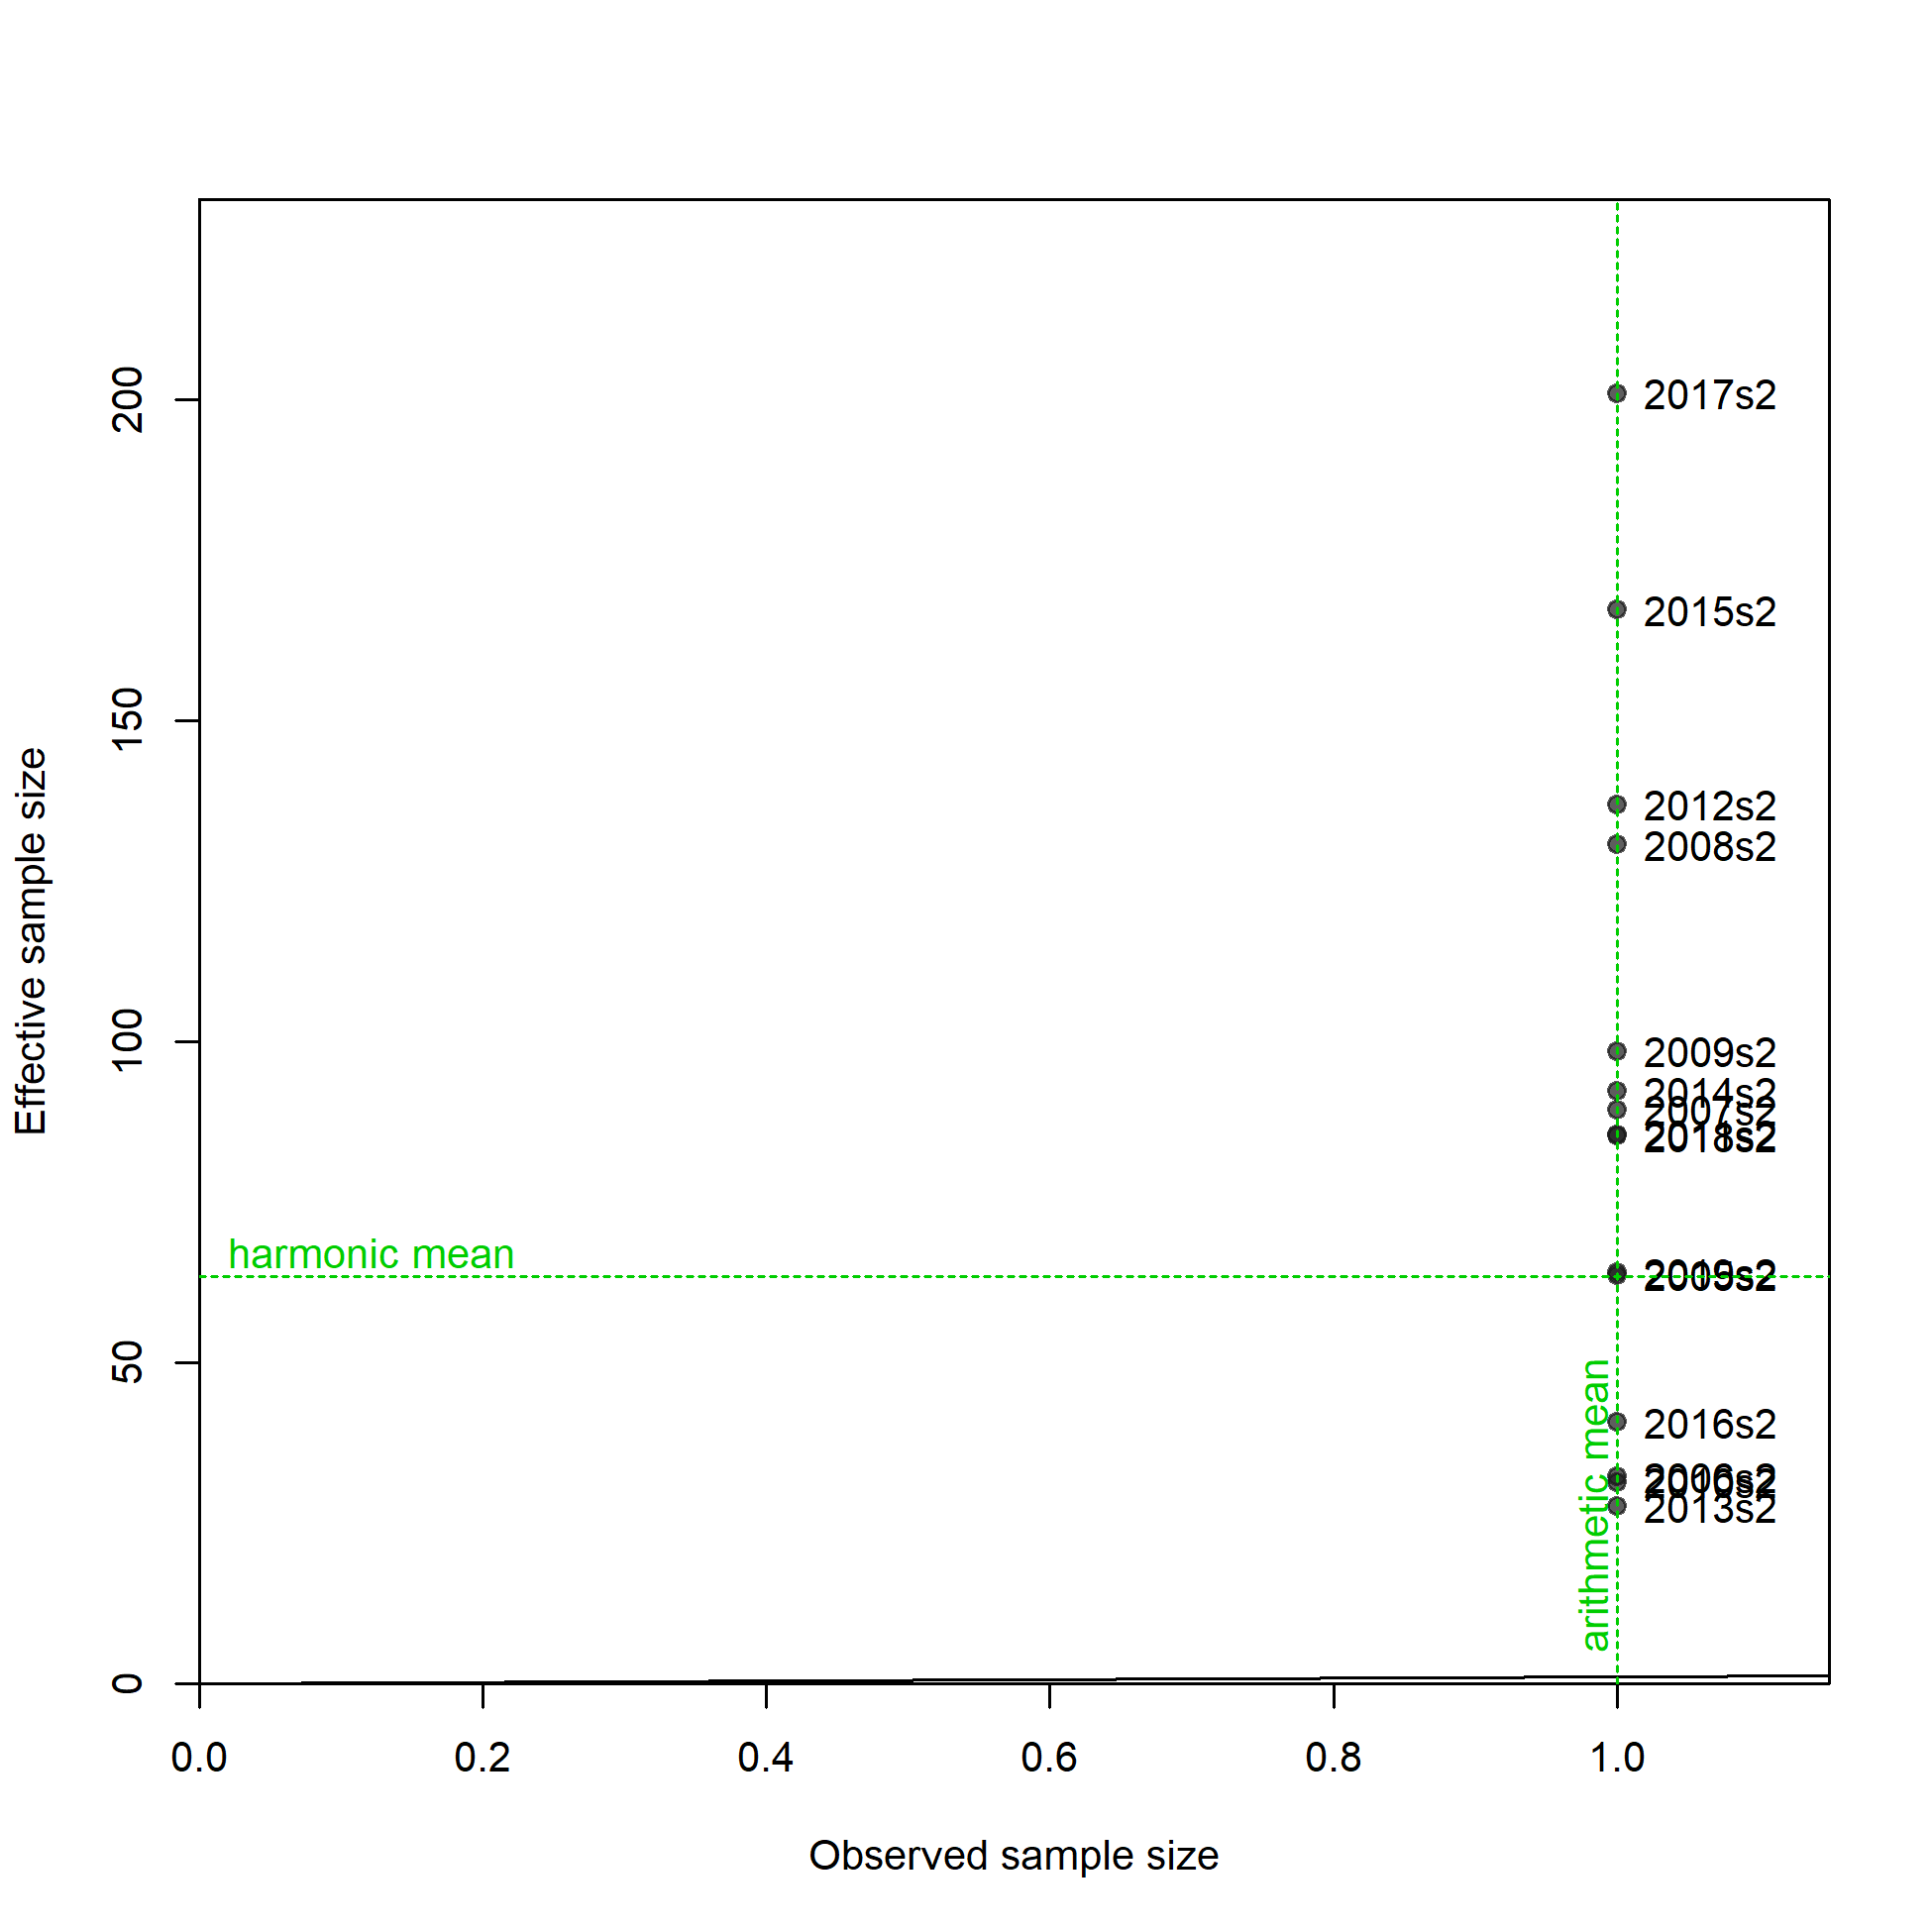
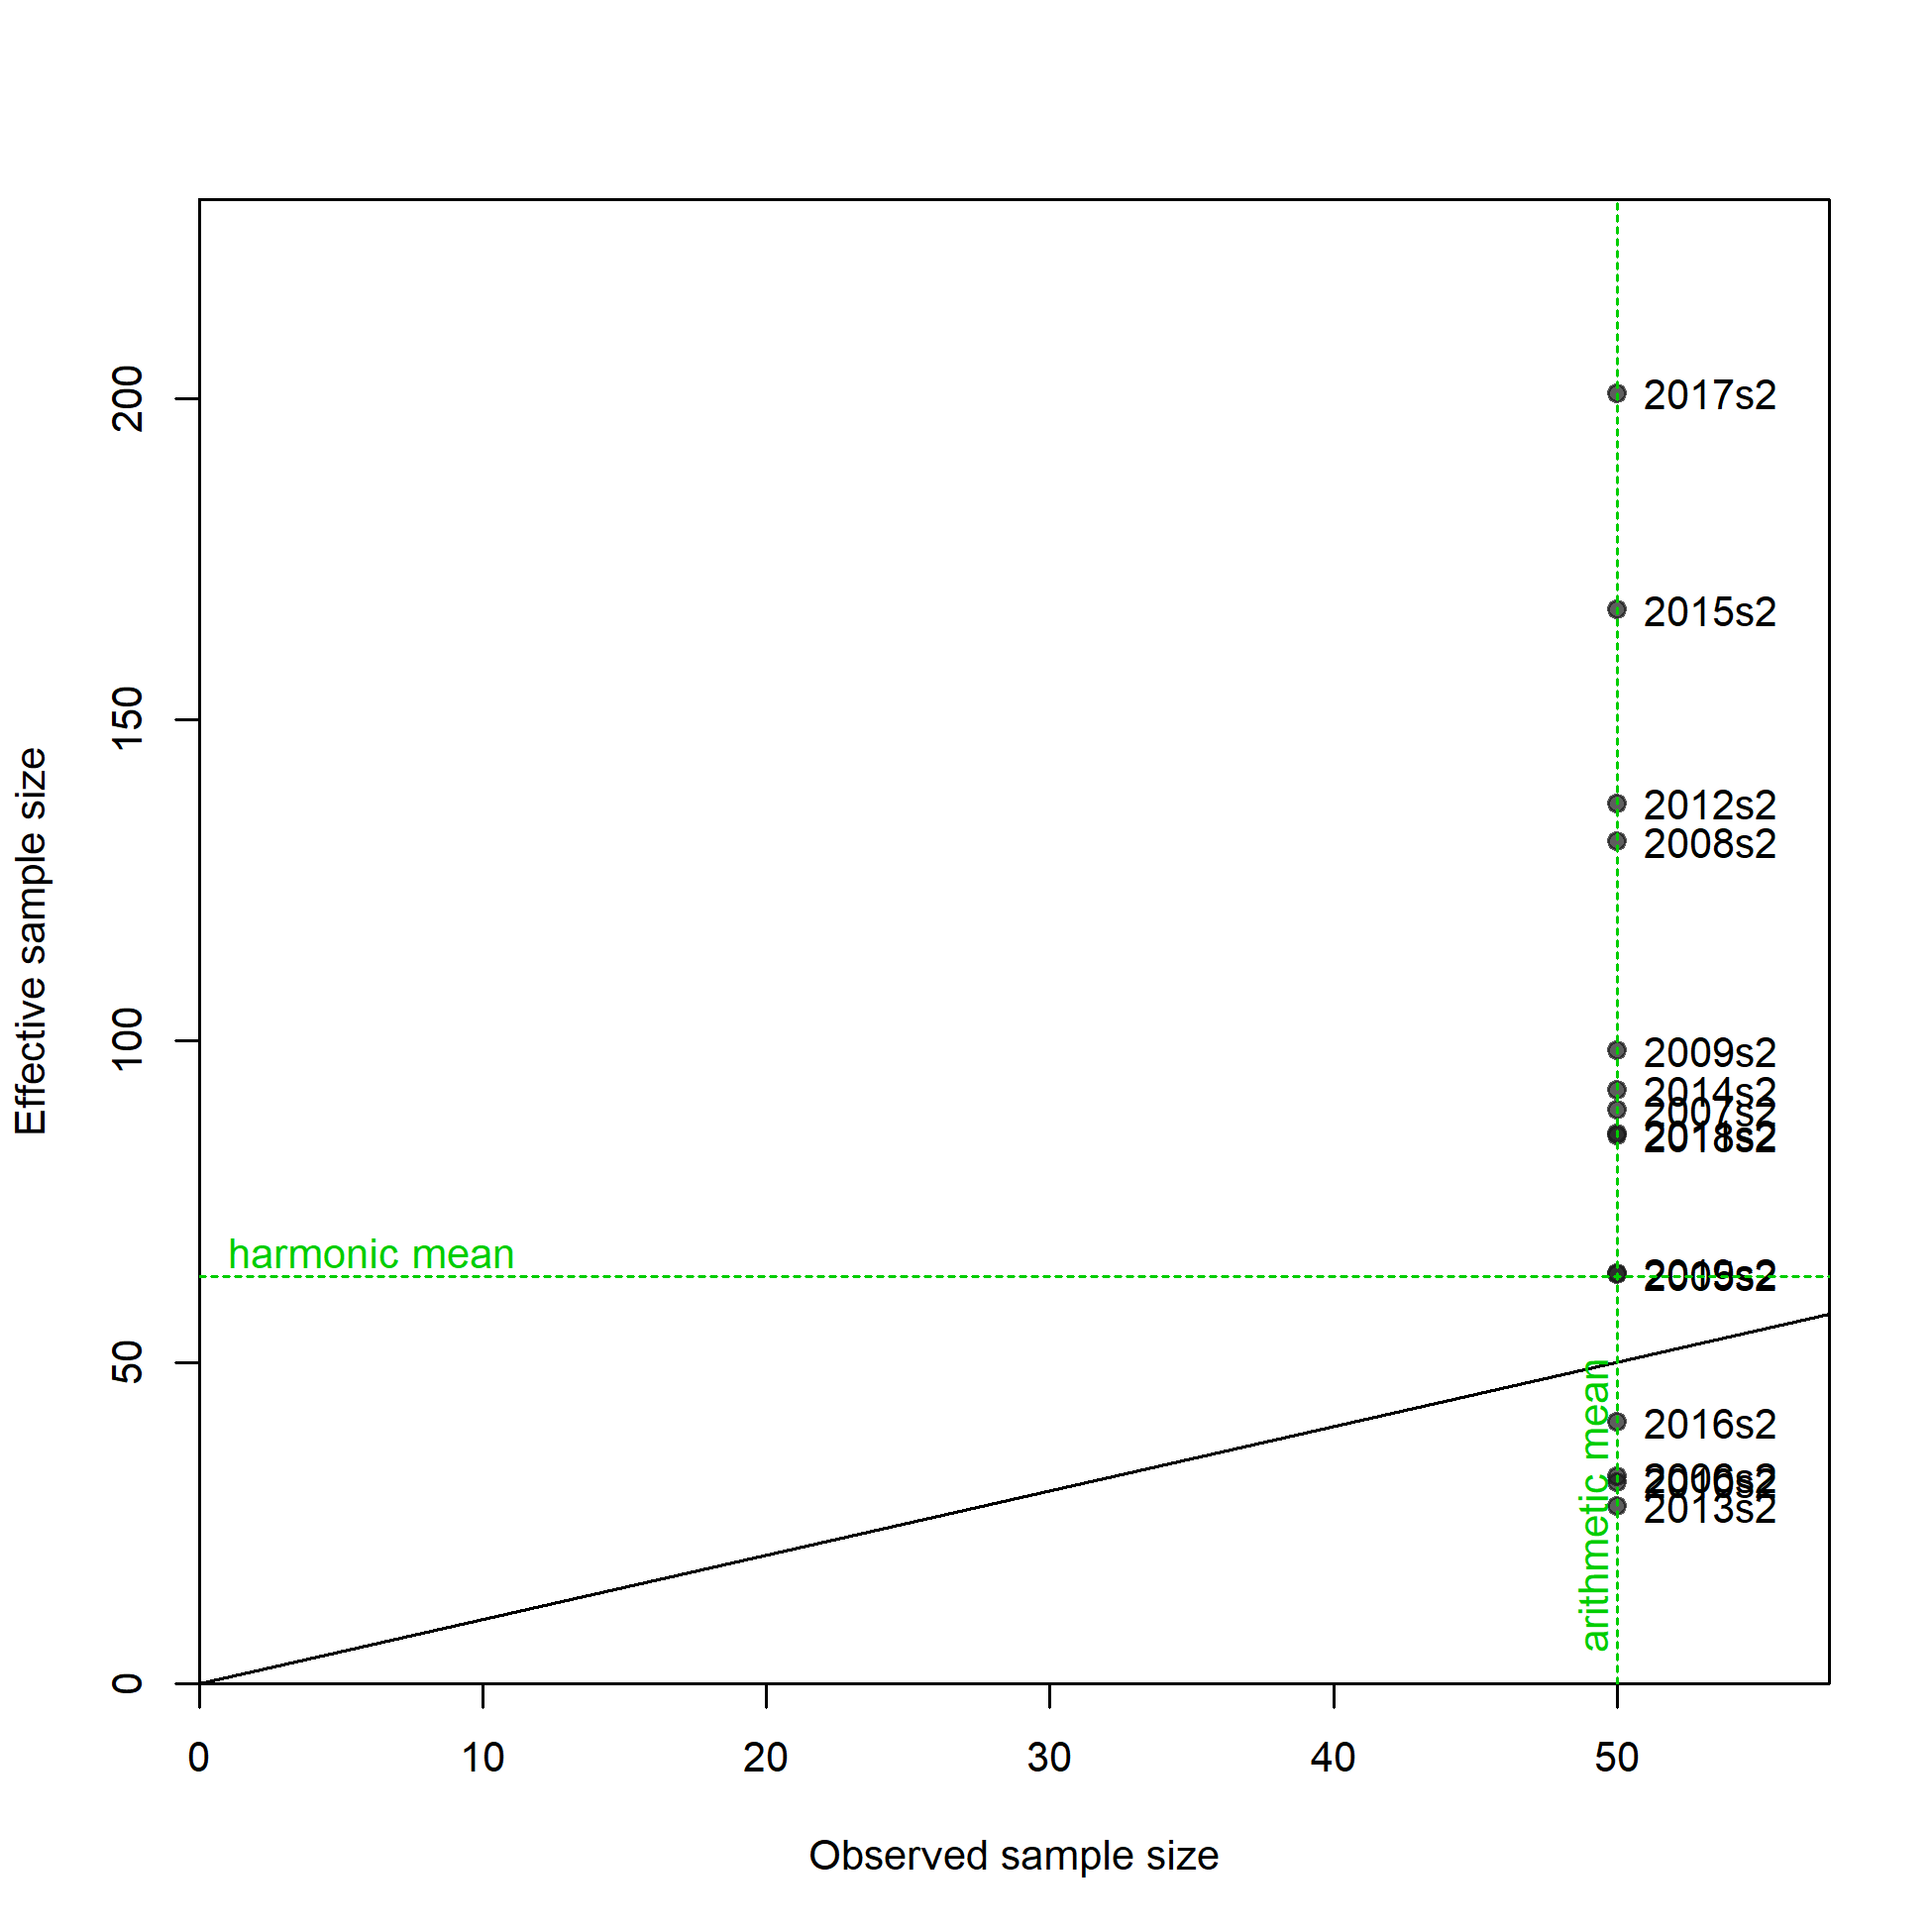
N-EffN comparison, Length comps, whole catch, I7_ESP_Q2
file: comp_lenfit_sampsize_flt28mkt0.png
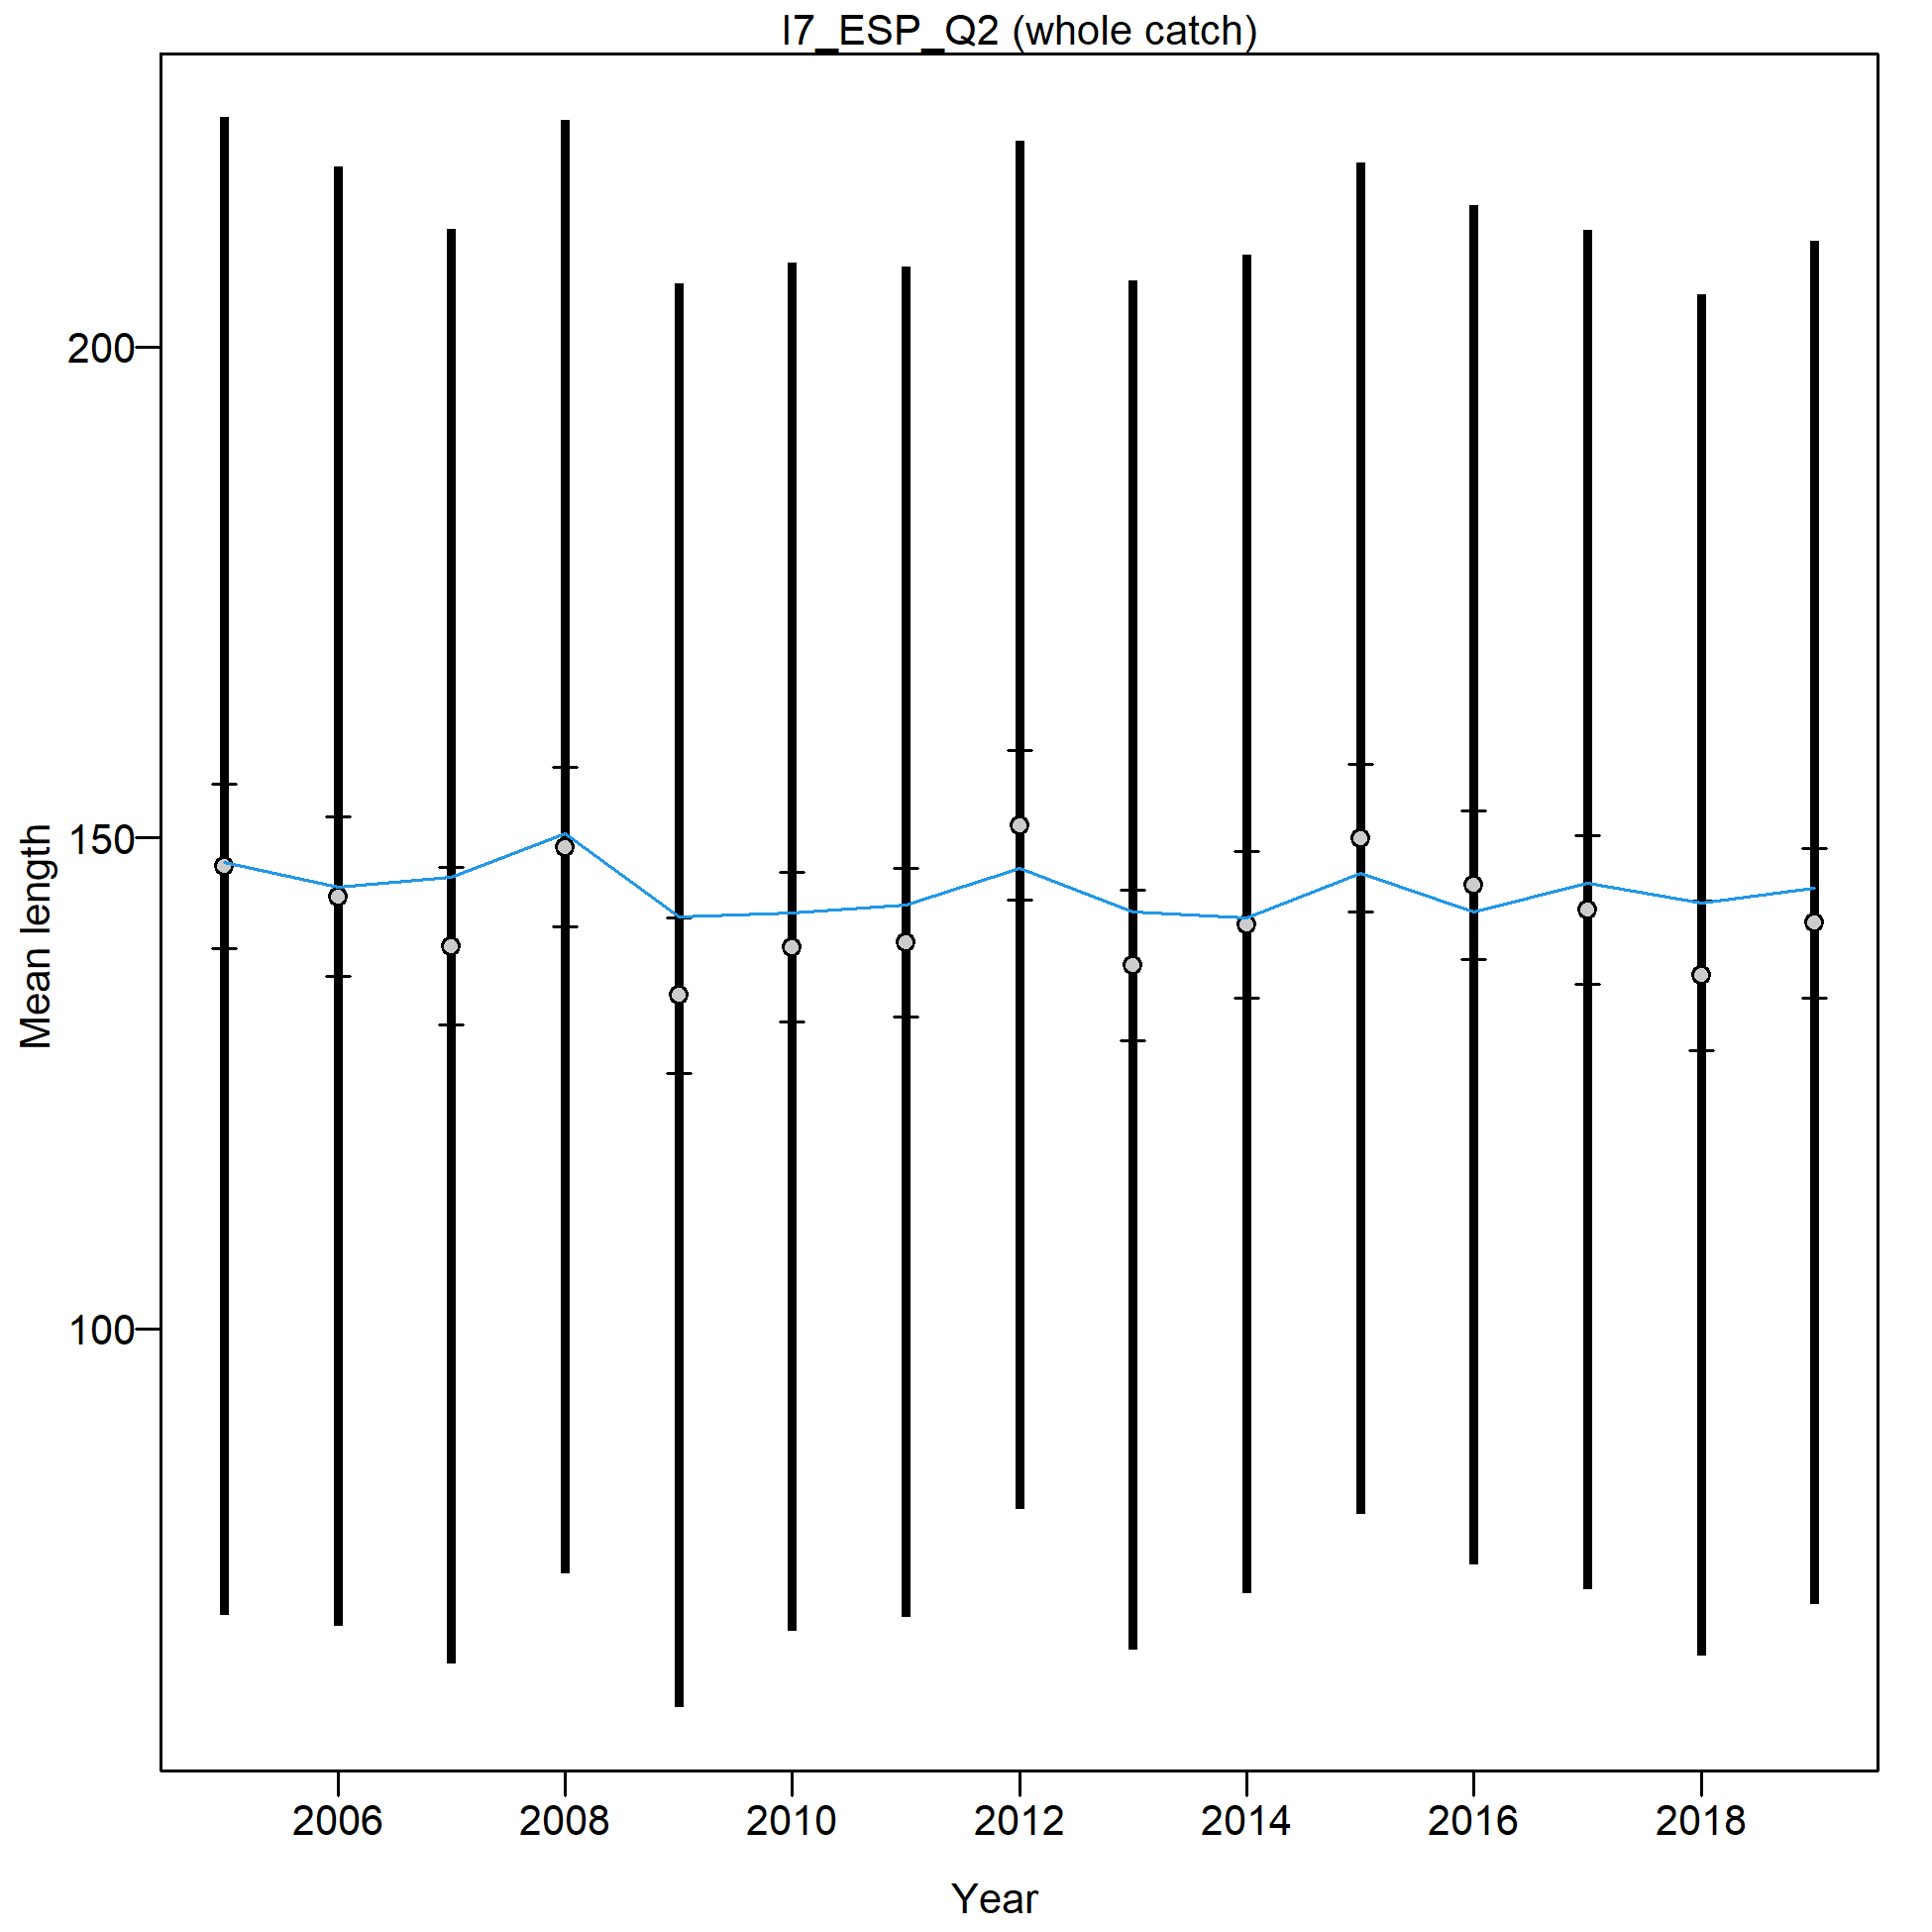
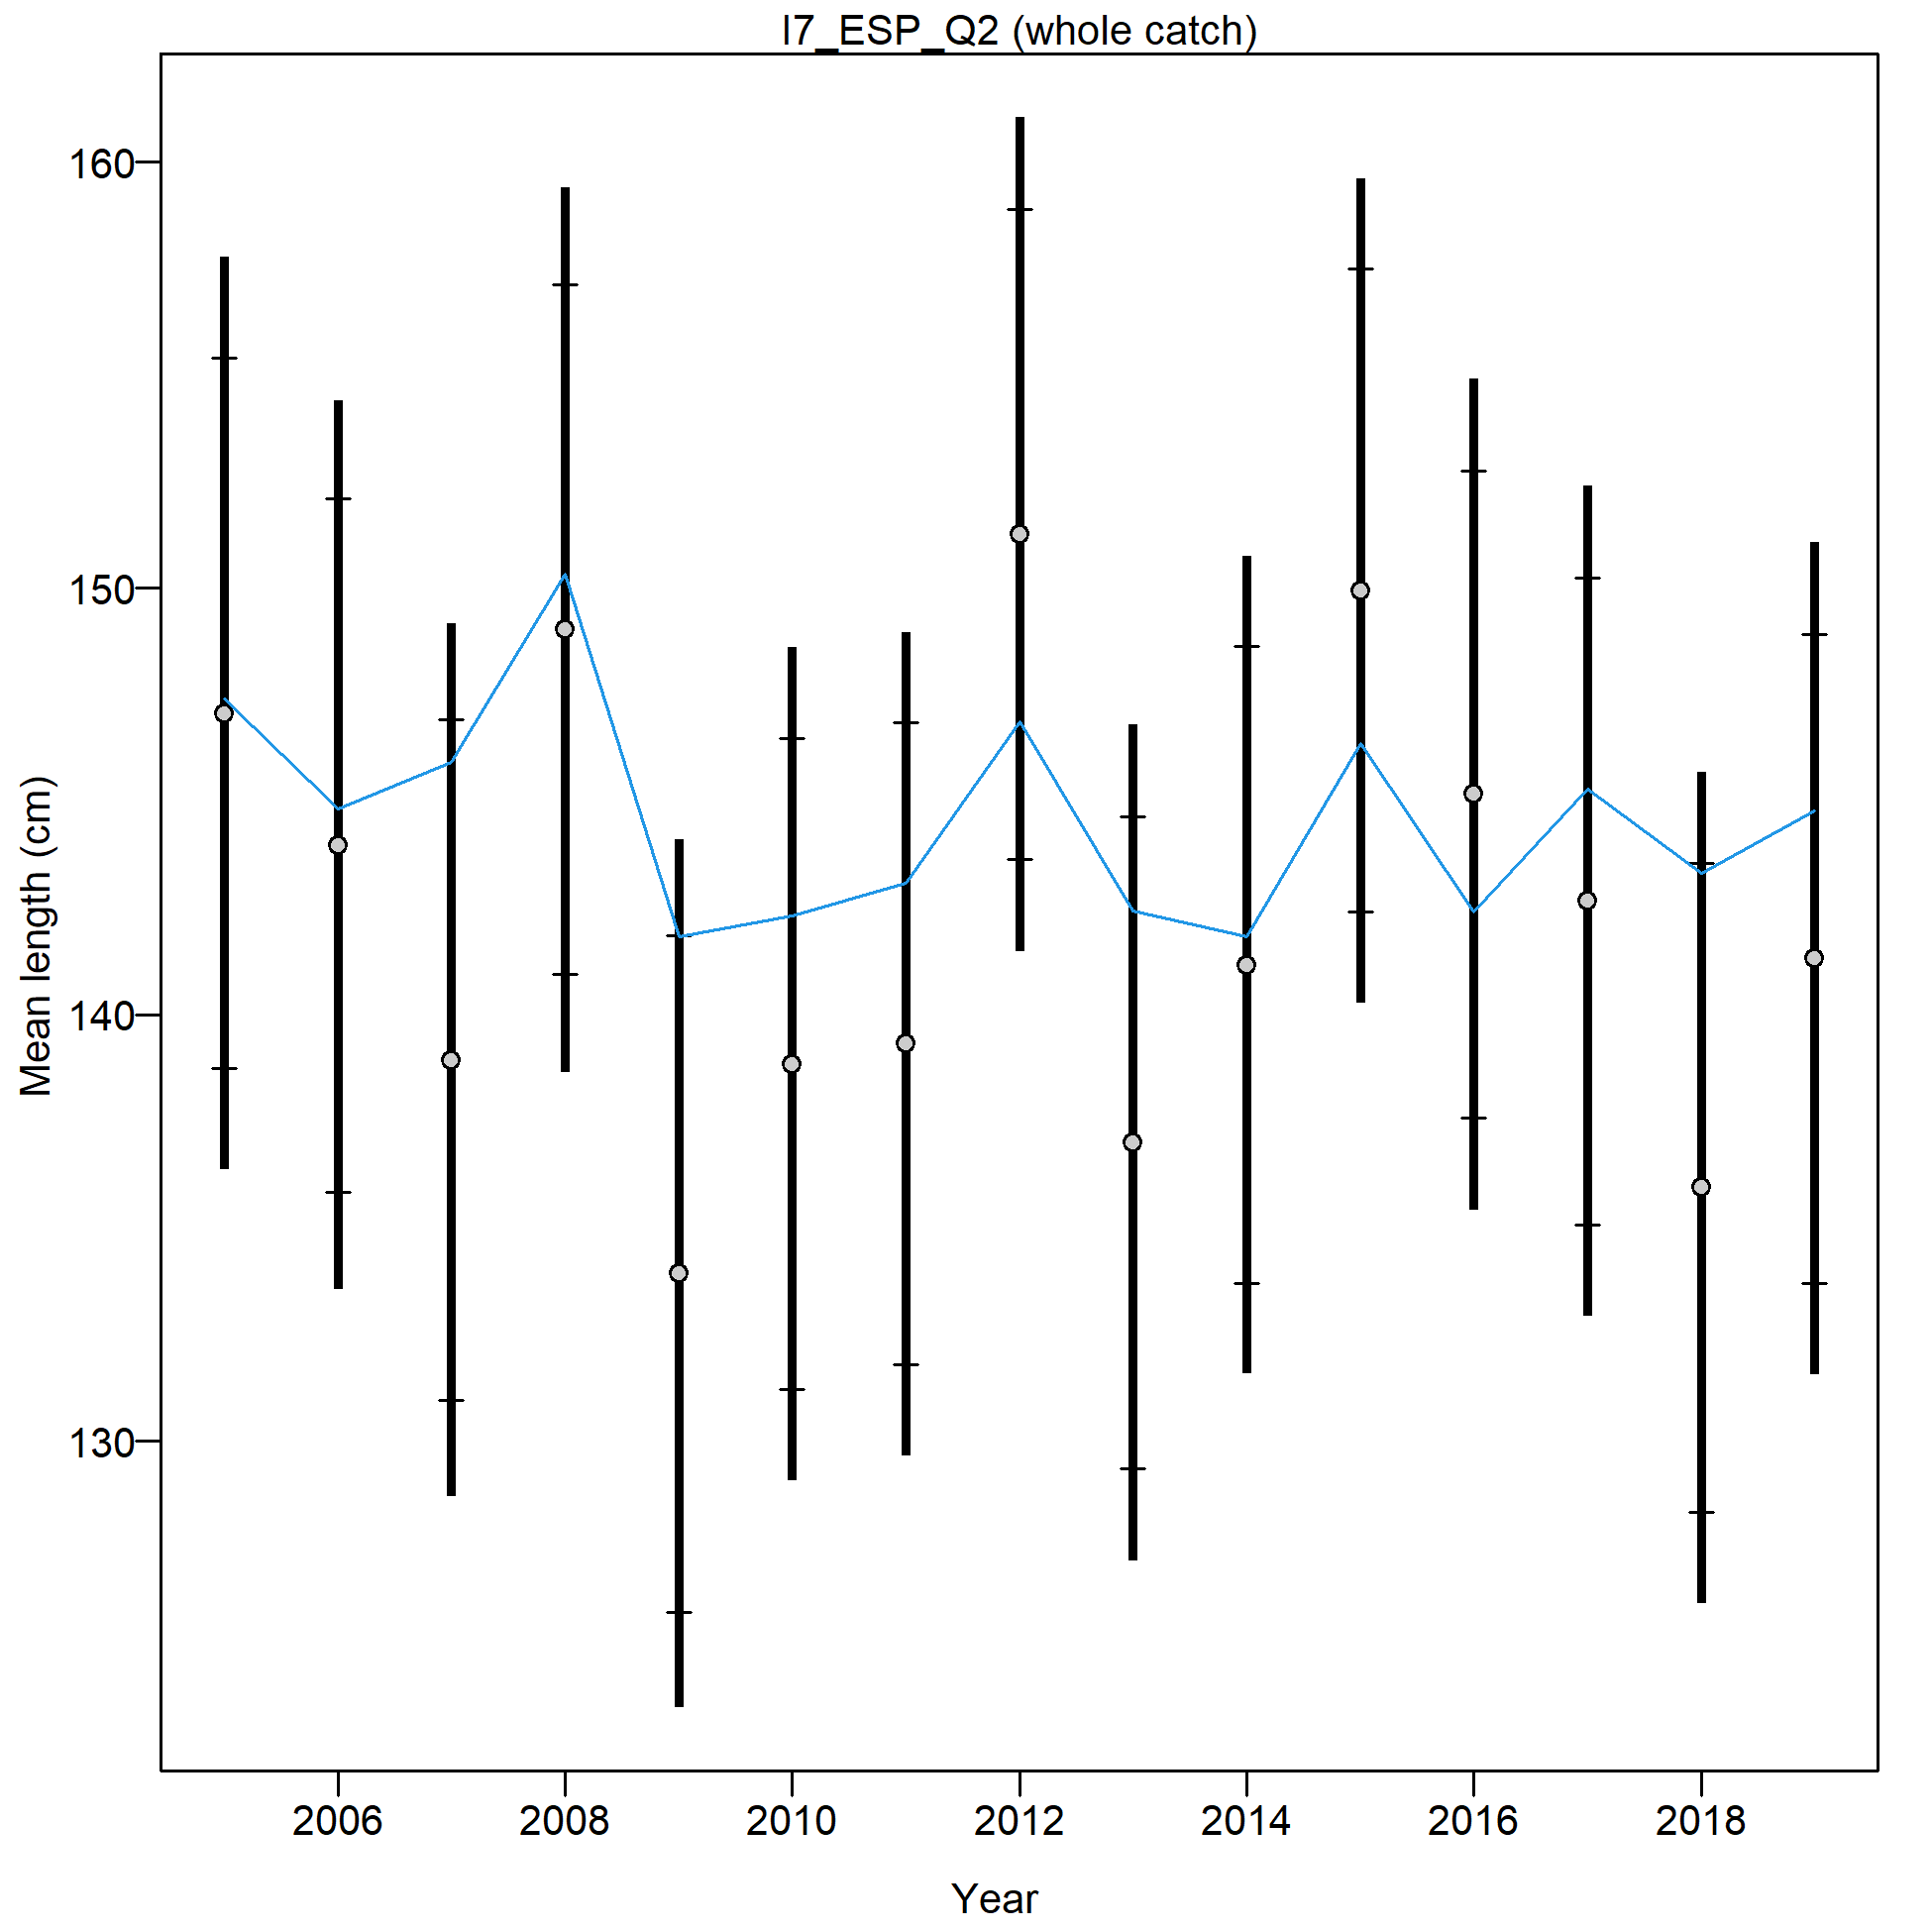
Mean length for I7_ESP_Q2 with 95% confidence intervals based on current samples sizes.
Francis data weighting method TA1.8: thinner intervals (with capped ends) show result of further adjusting sample sizes based on suggested multiplier (with 95% interval) for len data from I7_ESP_Q2:
83.3222 (56.7579-213.9394)
For more info, see
Francis, R.I.C.C. (2011). Data weighting in statistical fisheries stock assessment models. Can. J. Fish. Aquat. Sci. 68: 1124-1138. https://doi.org/10.1139/f2011-025
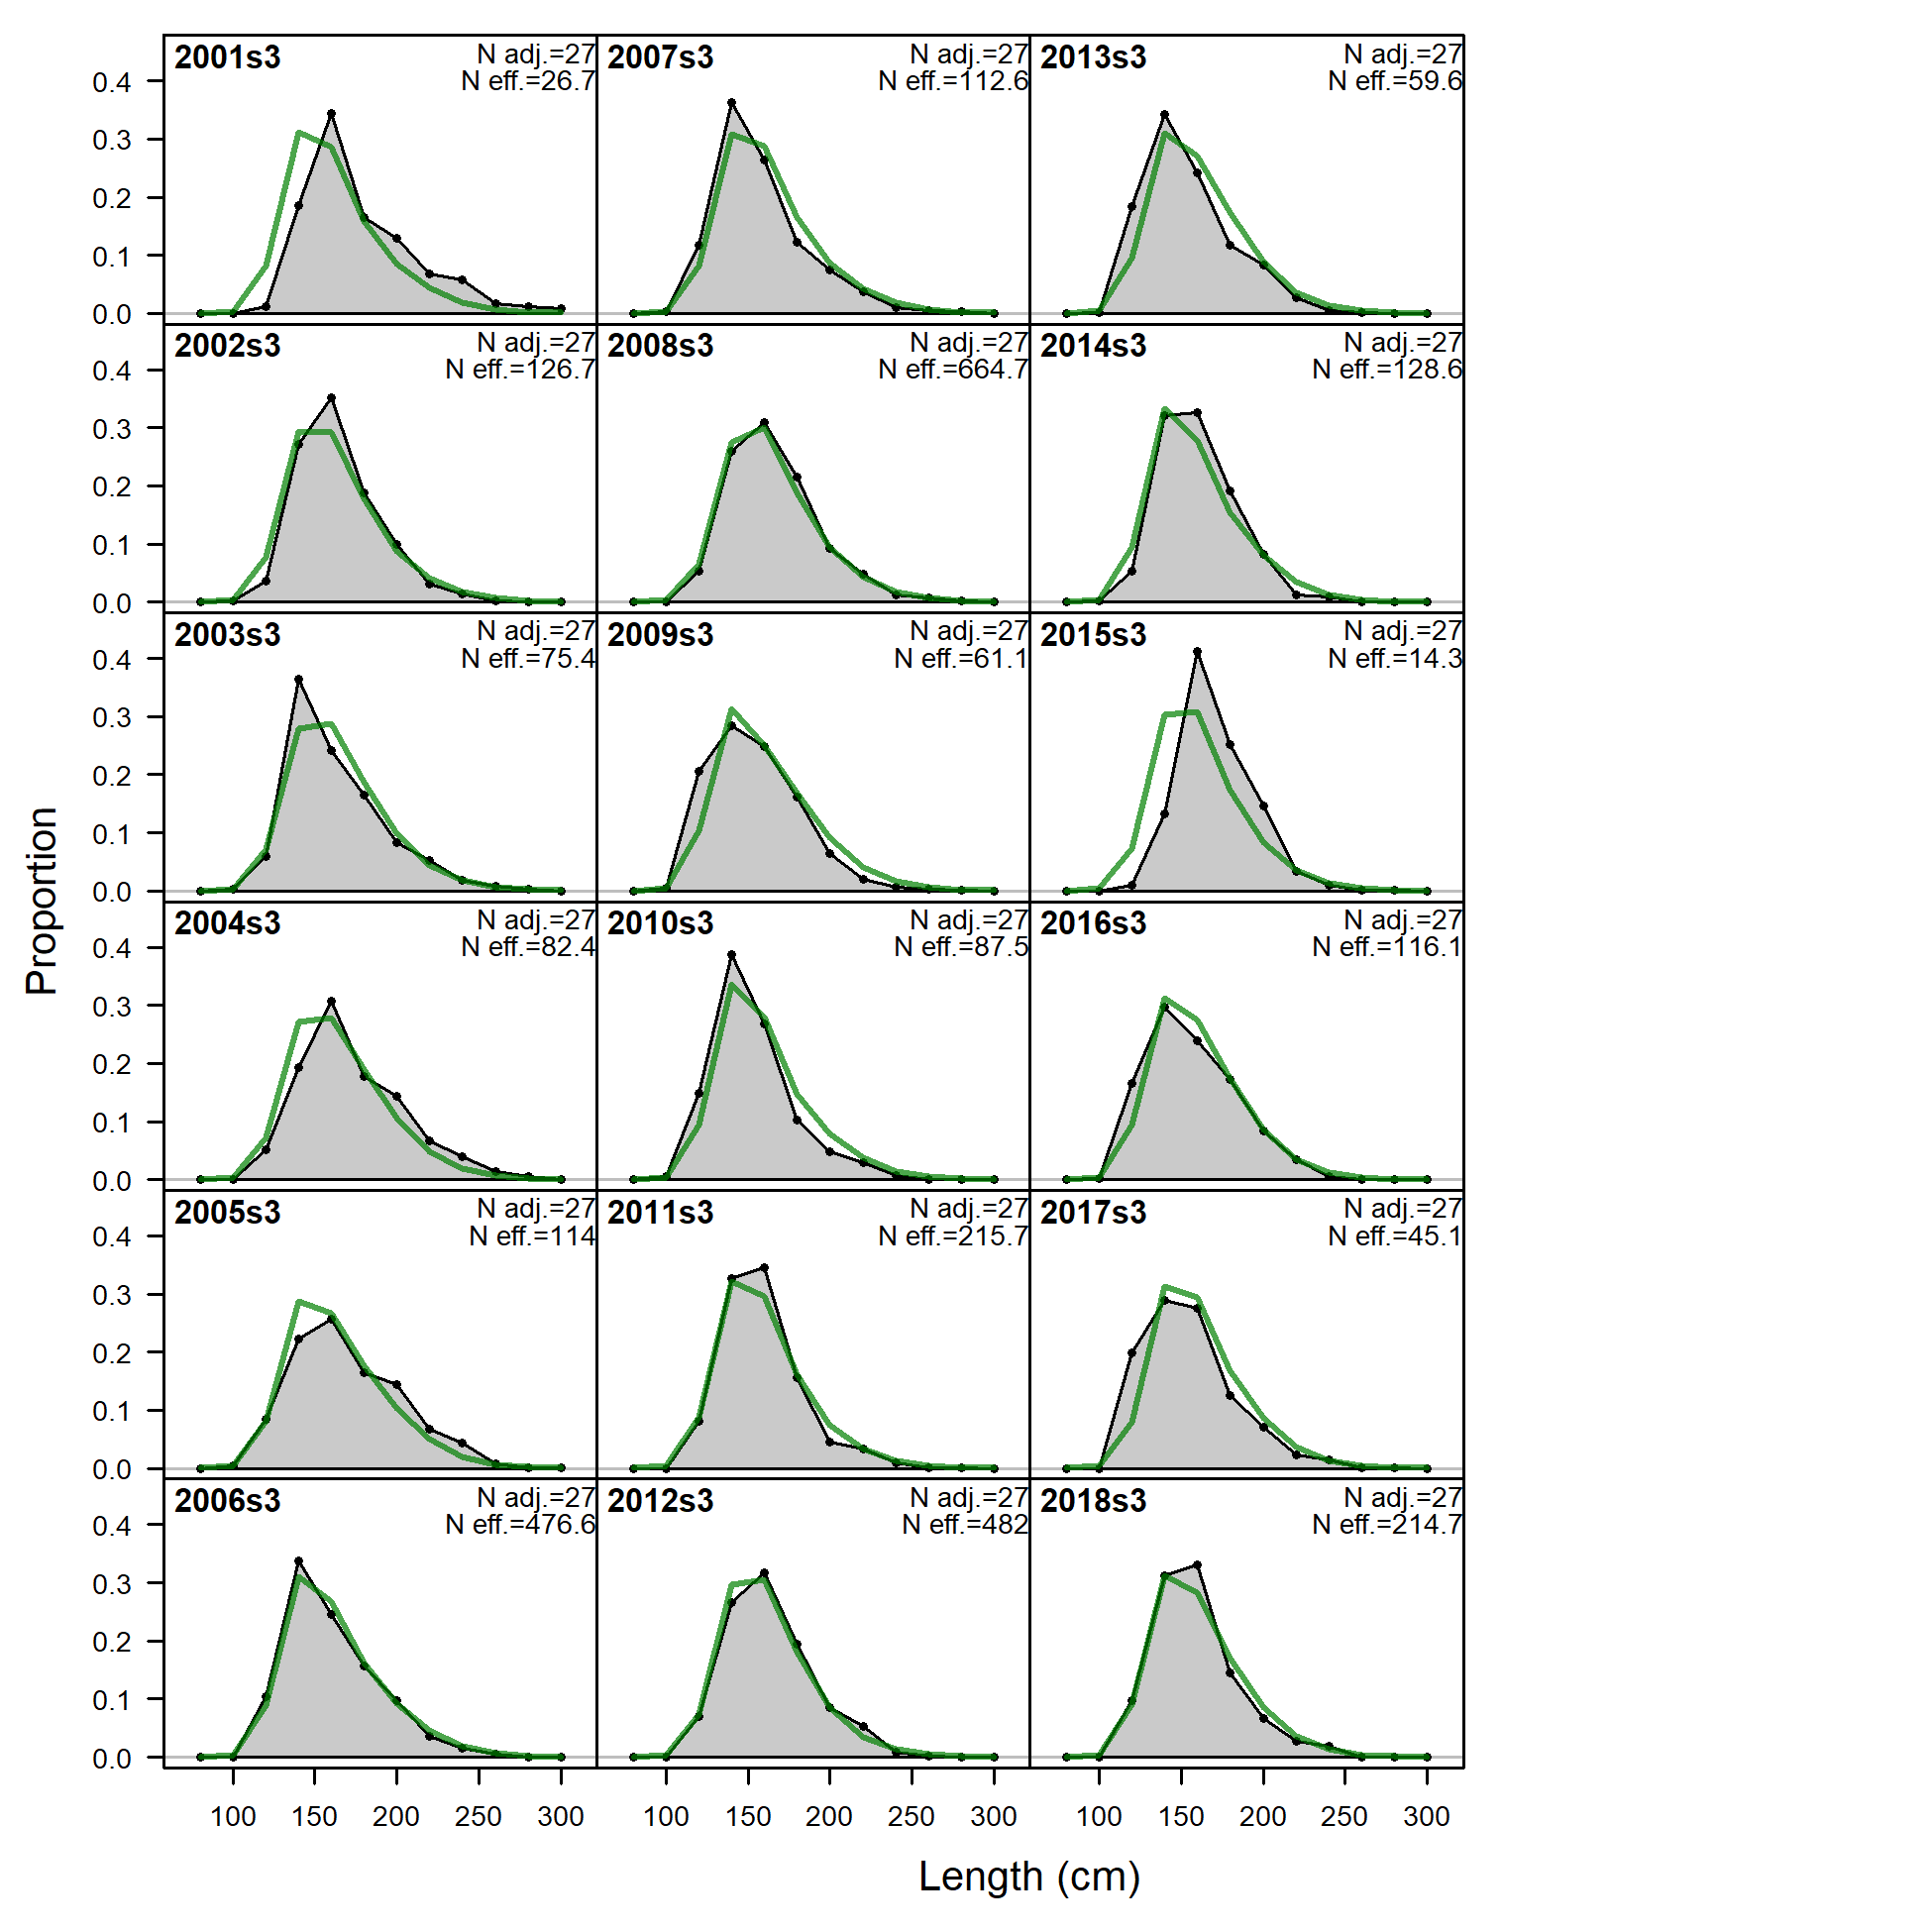
Length comps, whole catch, I8_ESP_Q3.
'N adj.' is the input sample size after data-weighting adjustment. N eff. is the calculated effective sample size used in the McAllister-Ianelli tuning method.
file: comp_lenfit_flt29mkt0.png

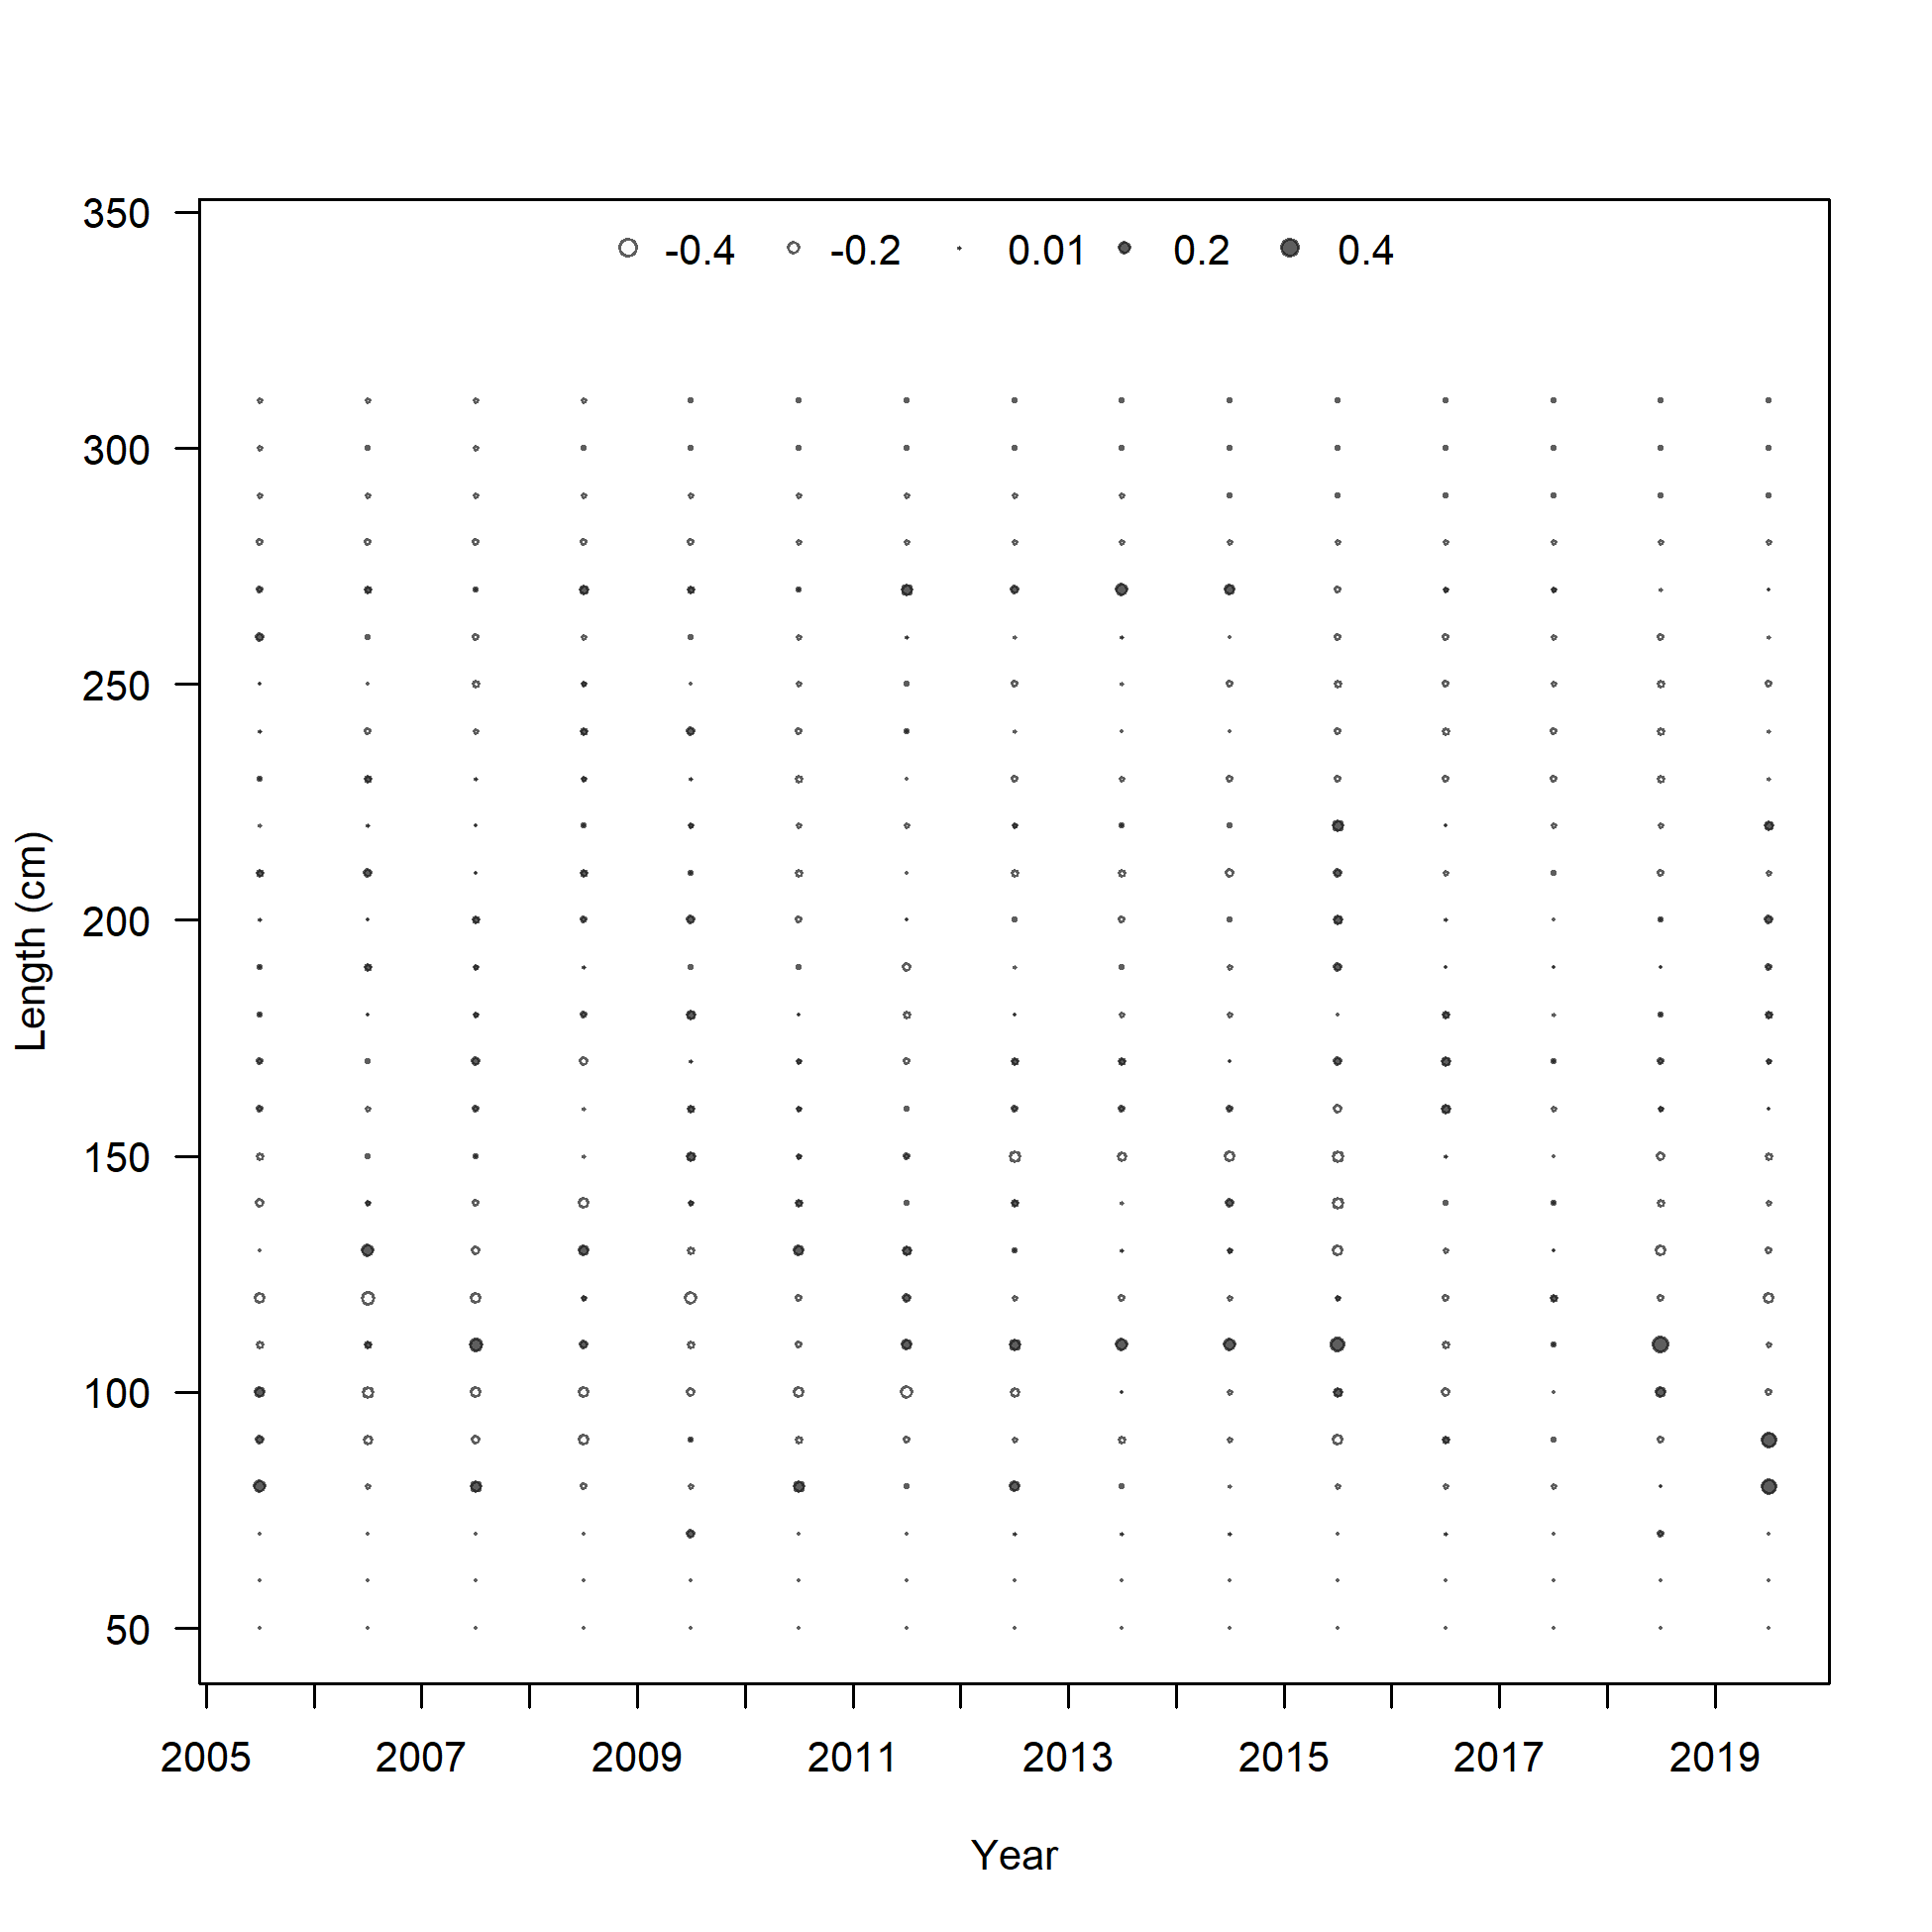
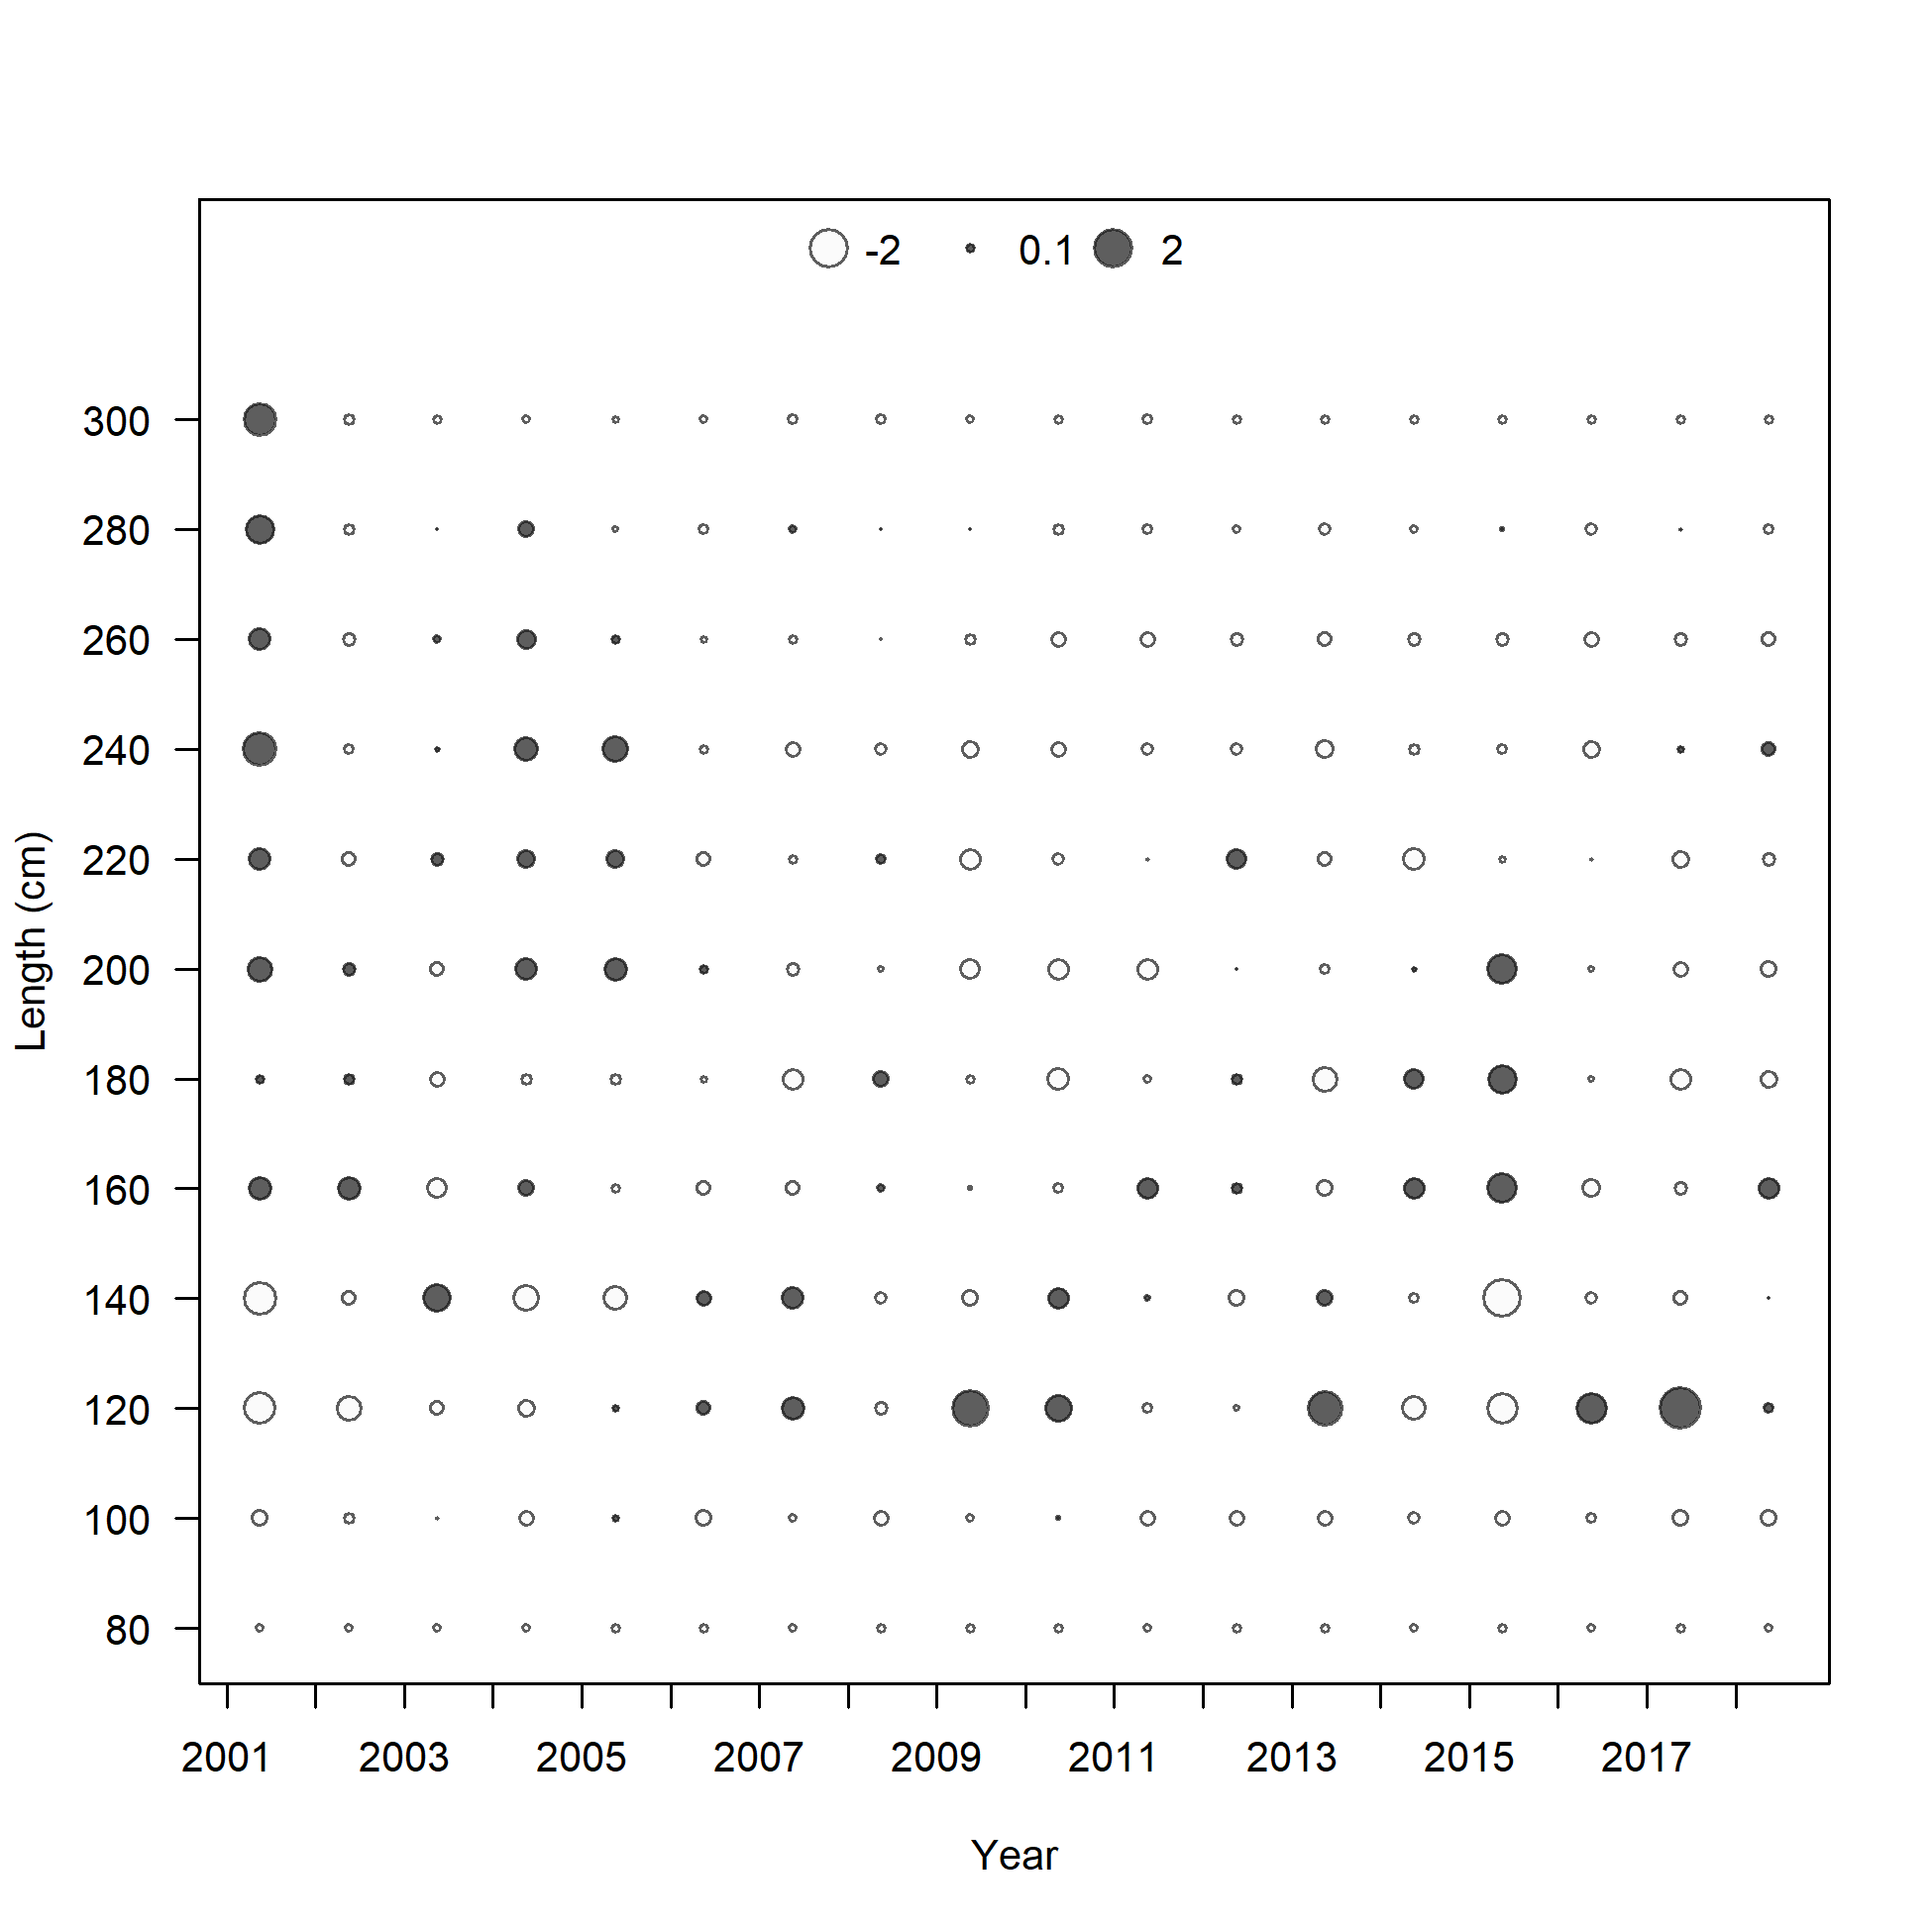
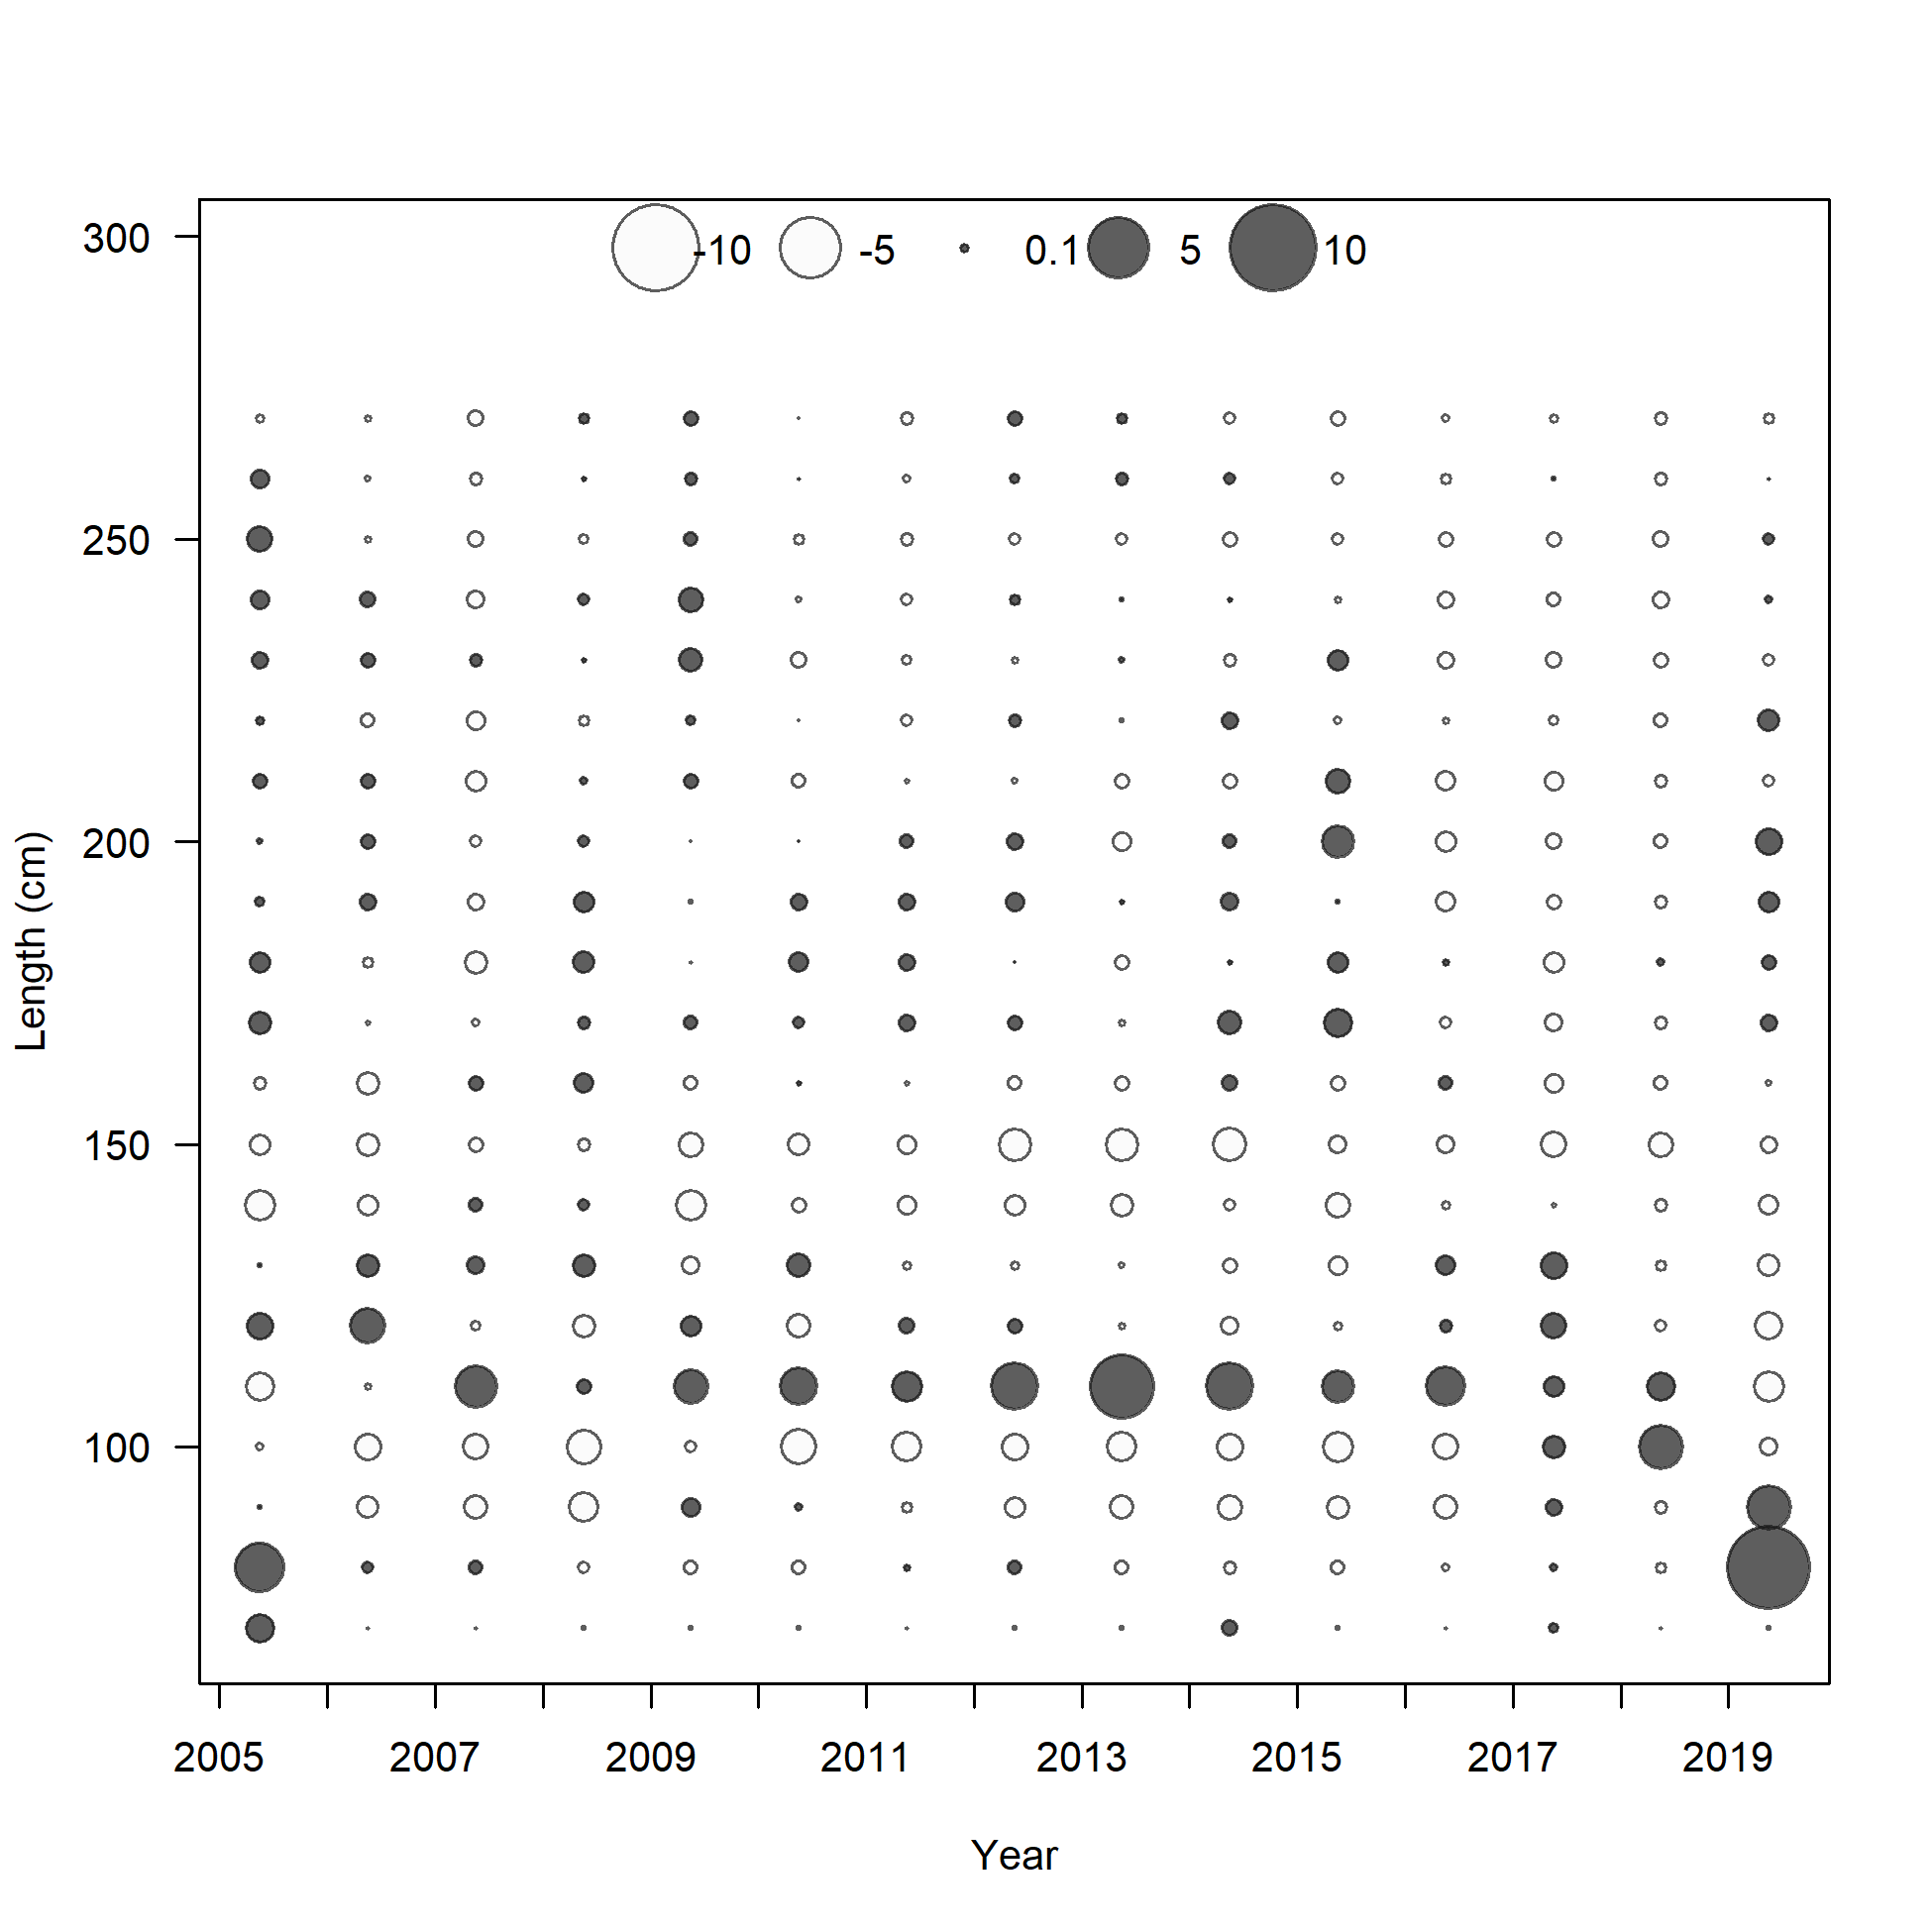
Pearson residuals, whole catch, I8_ESP_Q3 (max=1.3)
Closed bubbles are positive residuals (observed > expected) and open bubbles are negative residuals (observed < expected).
file: comp_lenfit_residsflt29mkt0.png
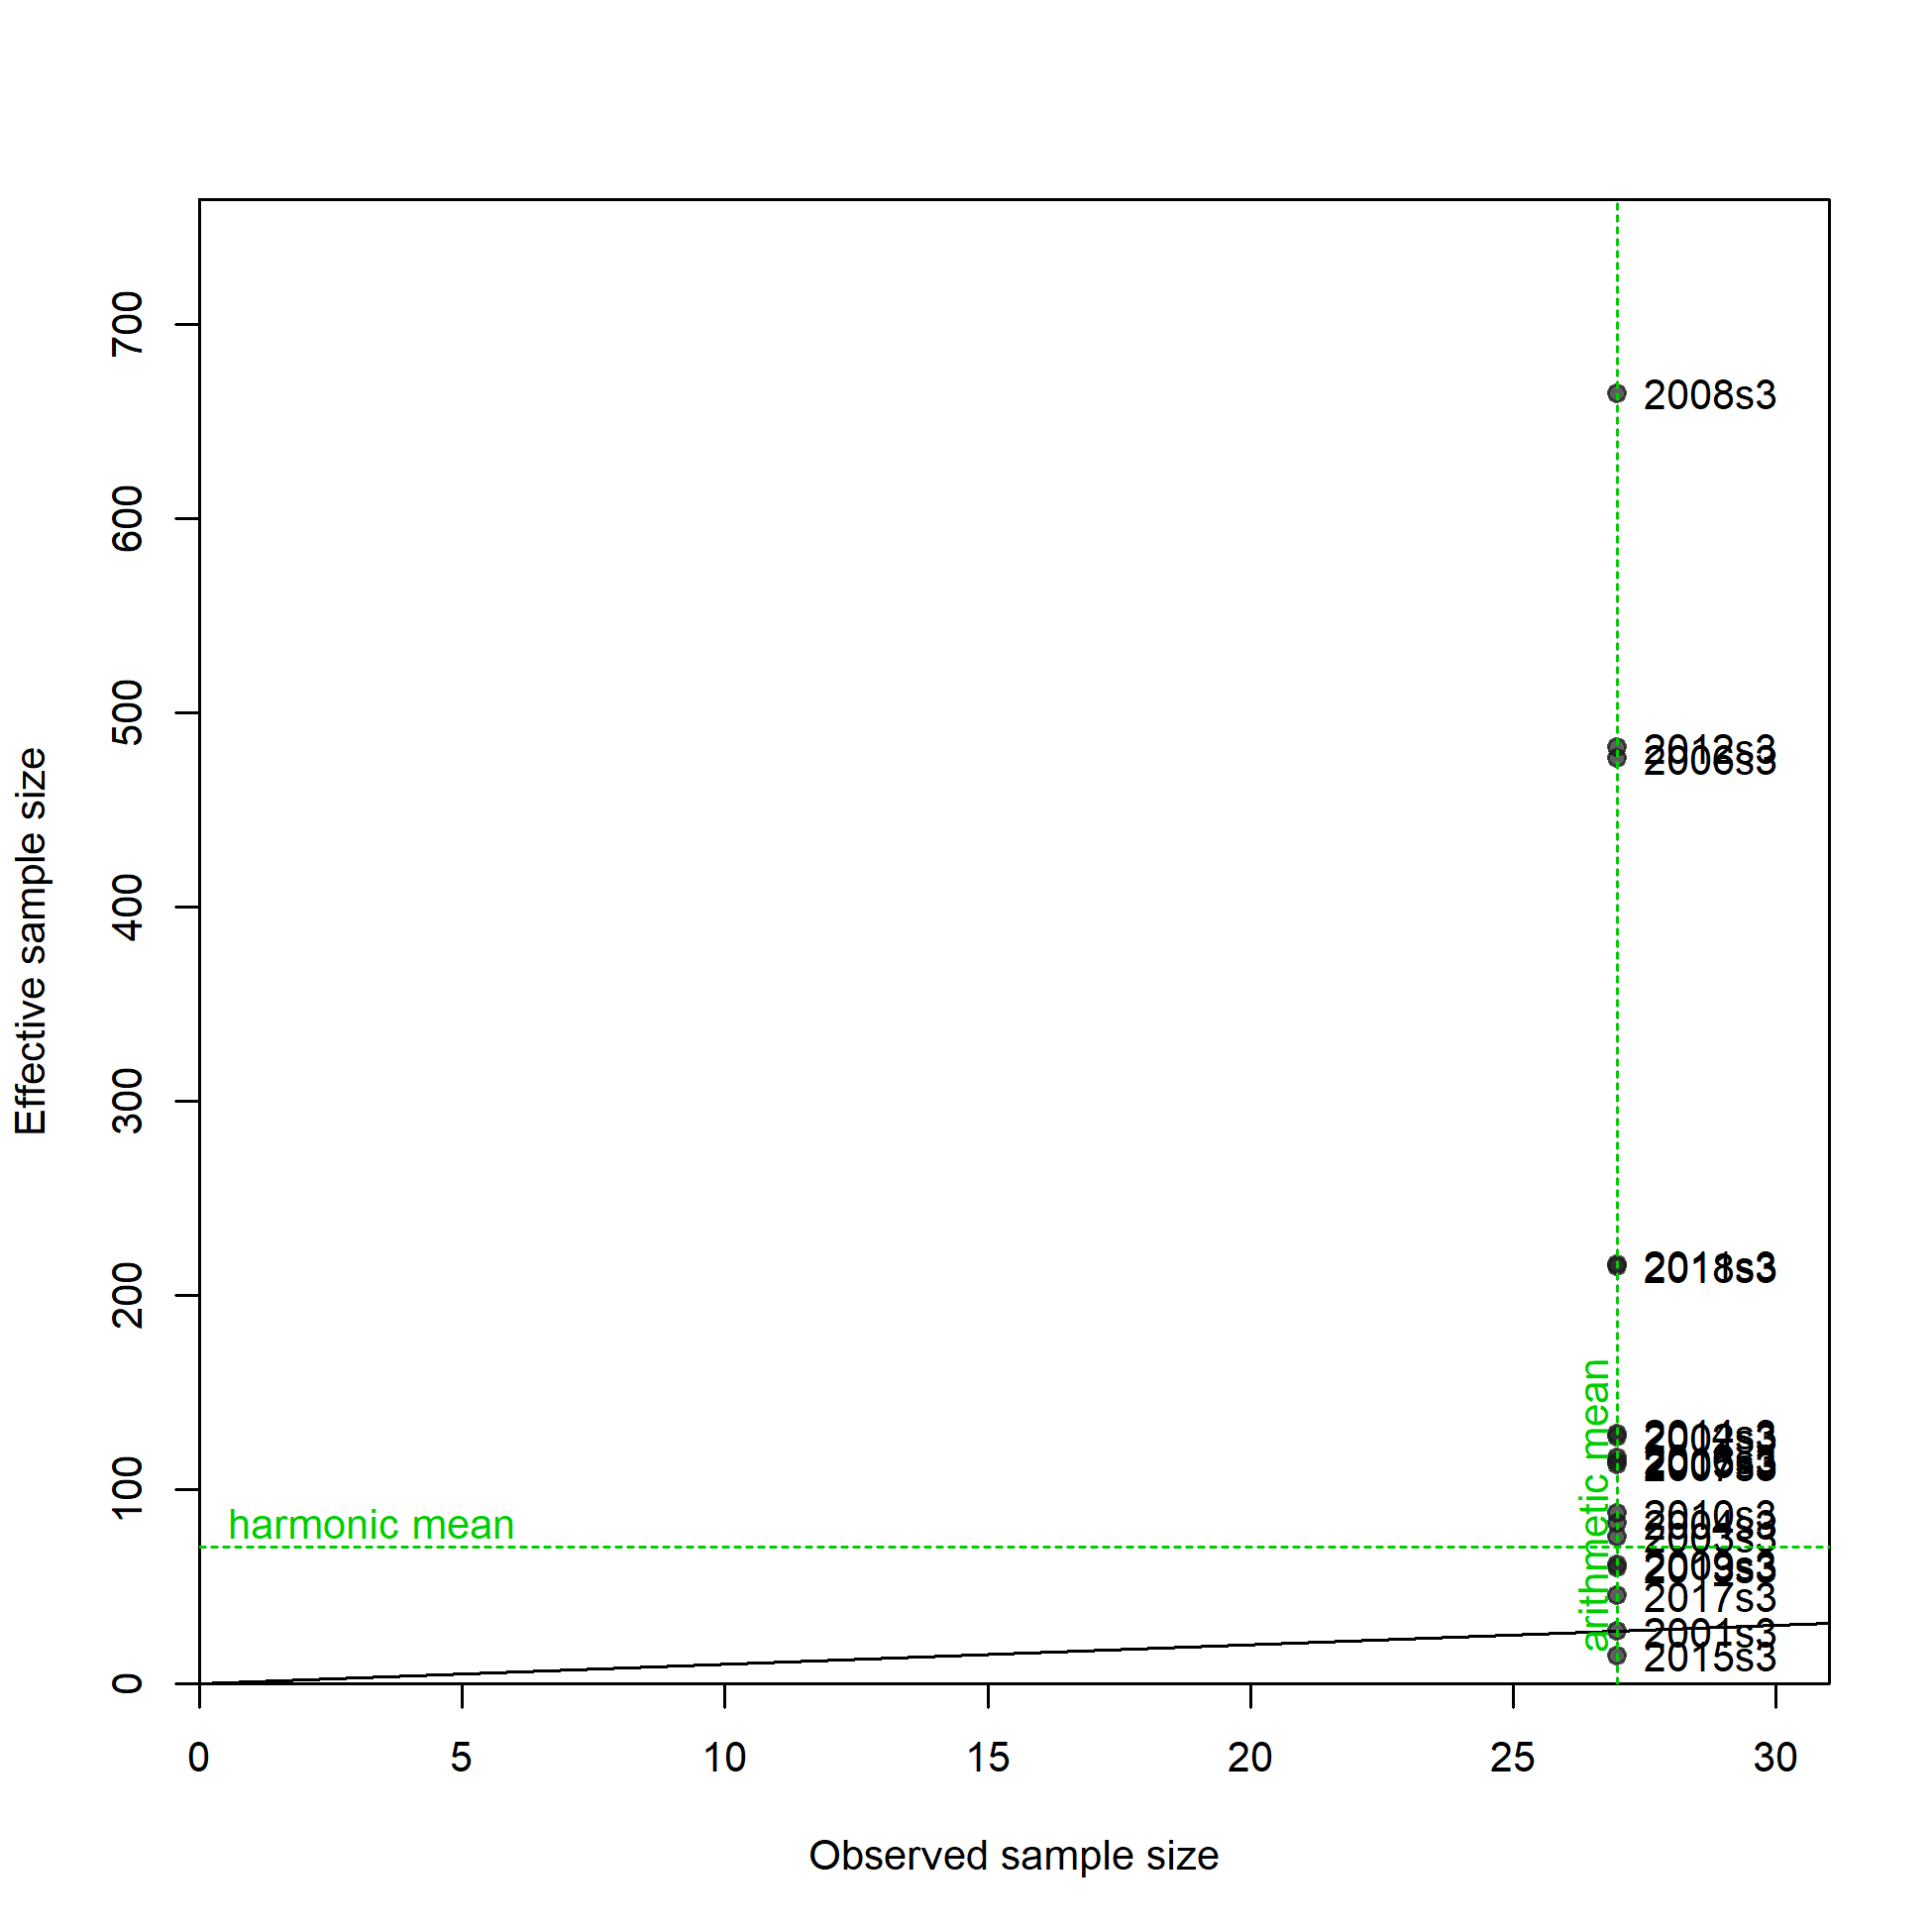
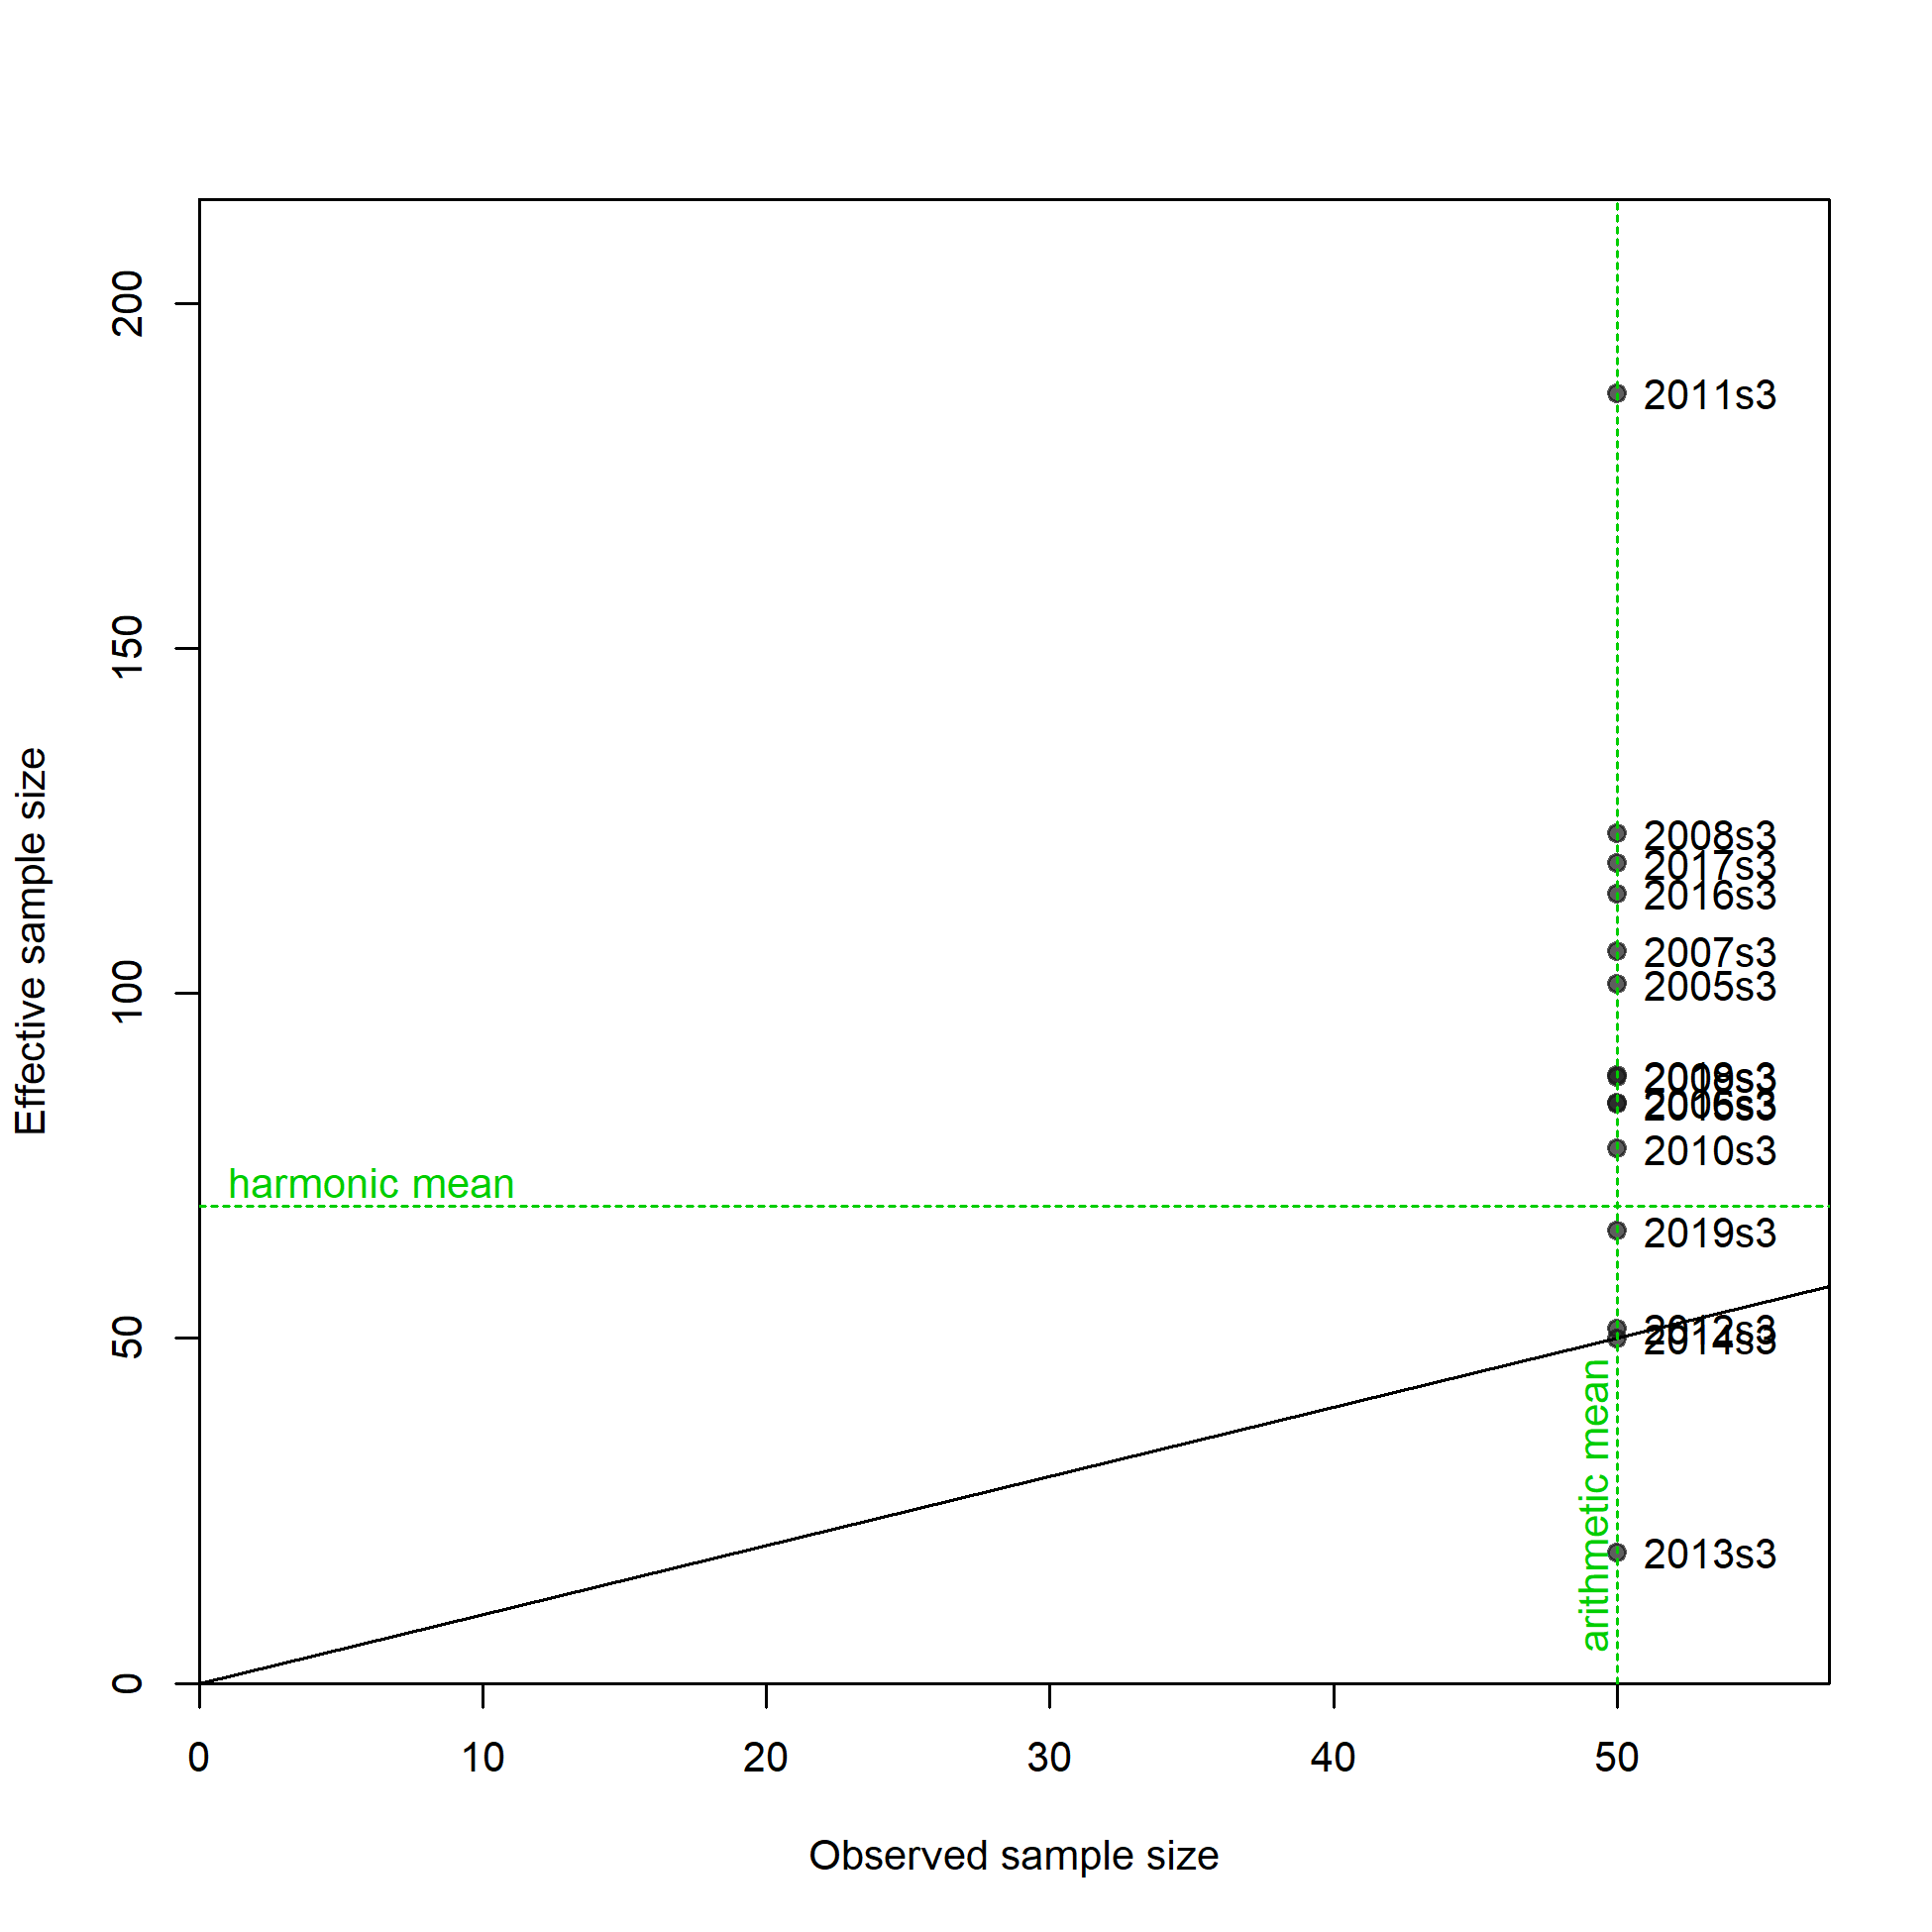
N-EffN comparison, Length comps, whole catch, I8_ESP_Q3
file: comp_lenfit_sampsize_flt29mkt0.png
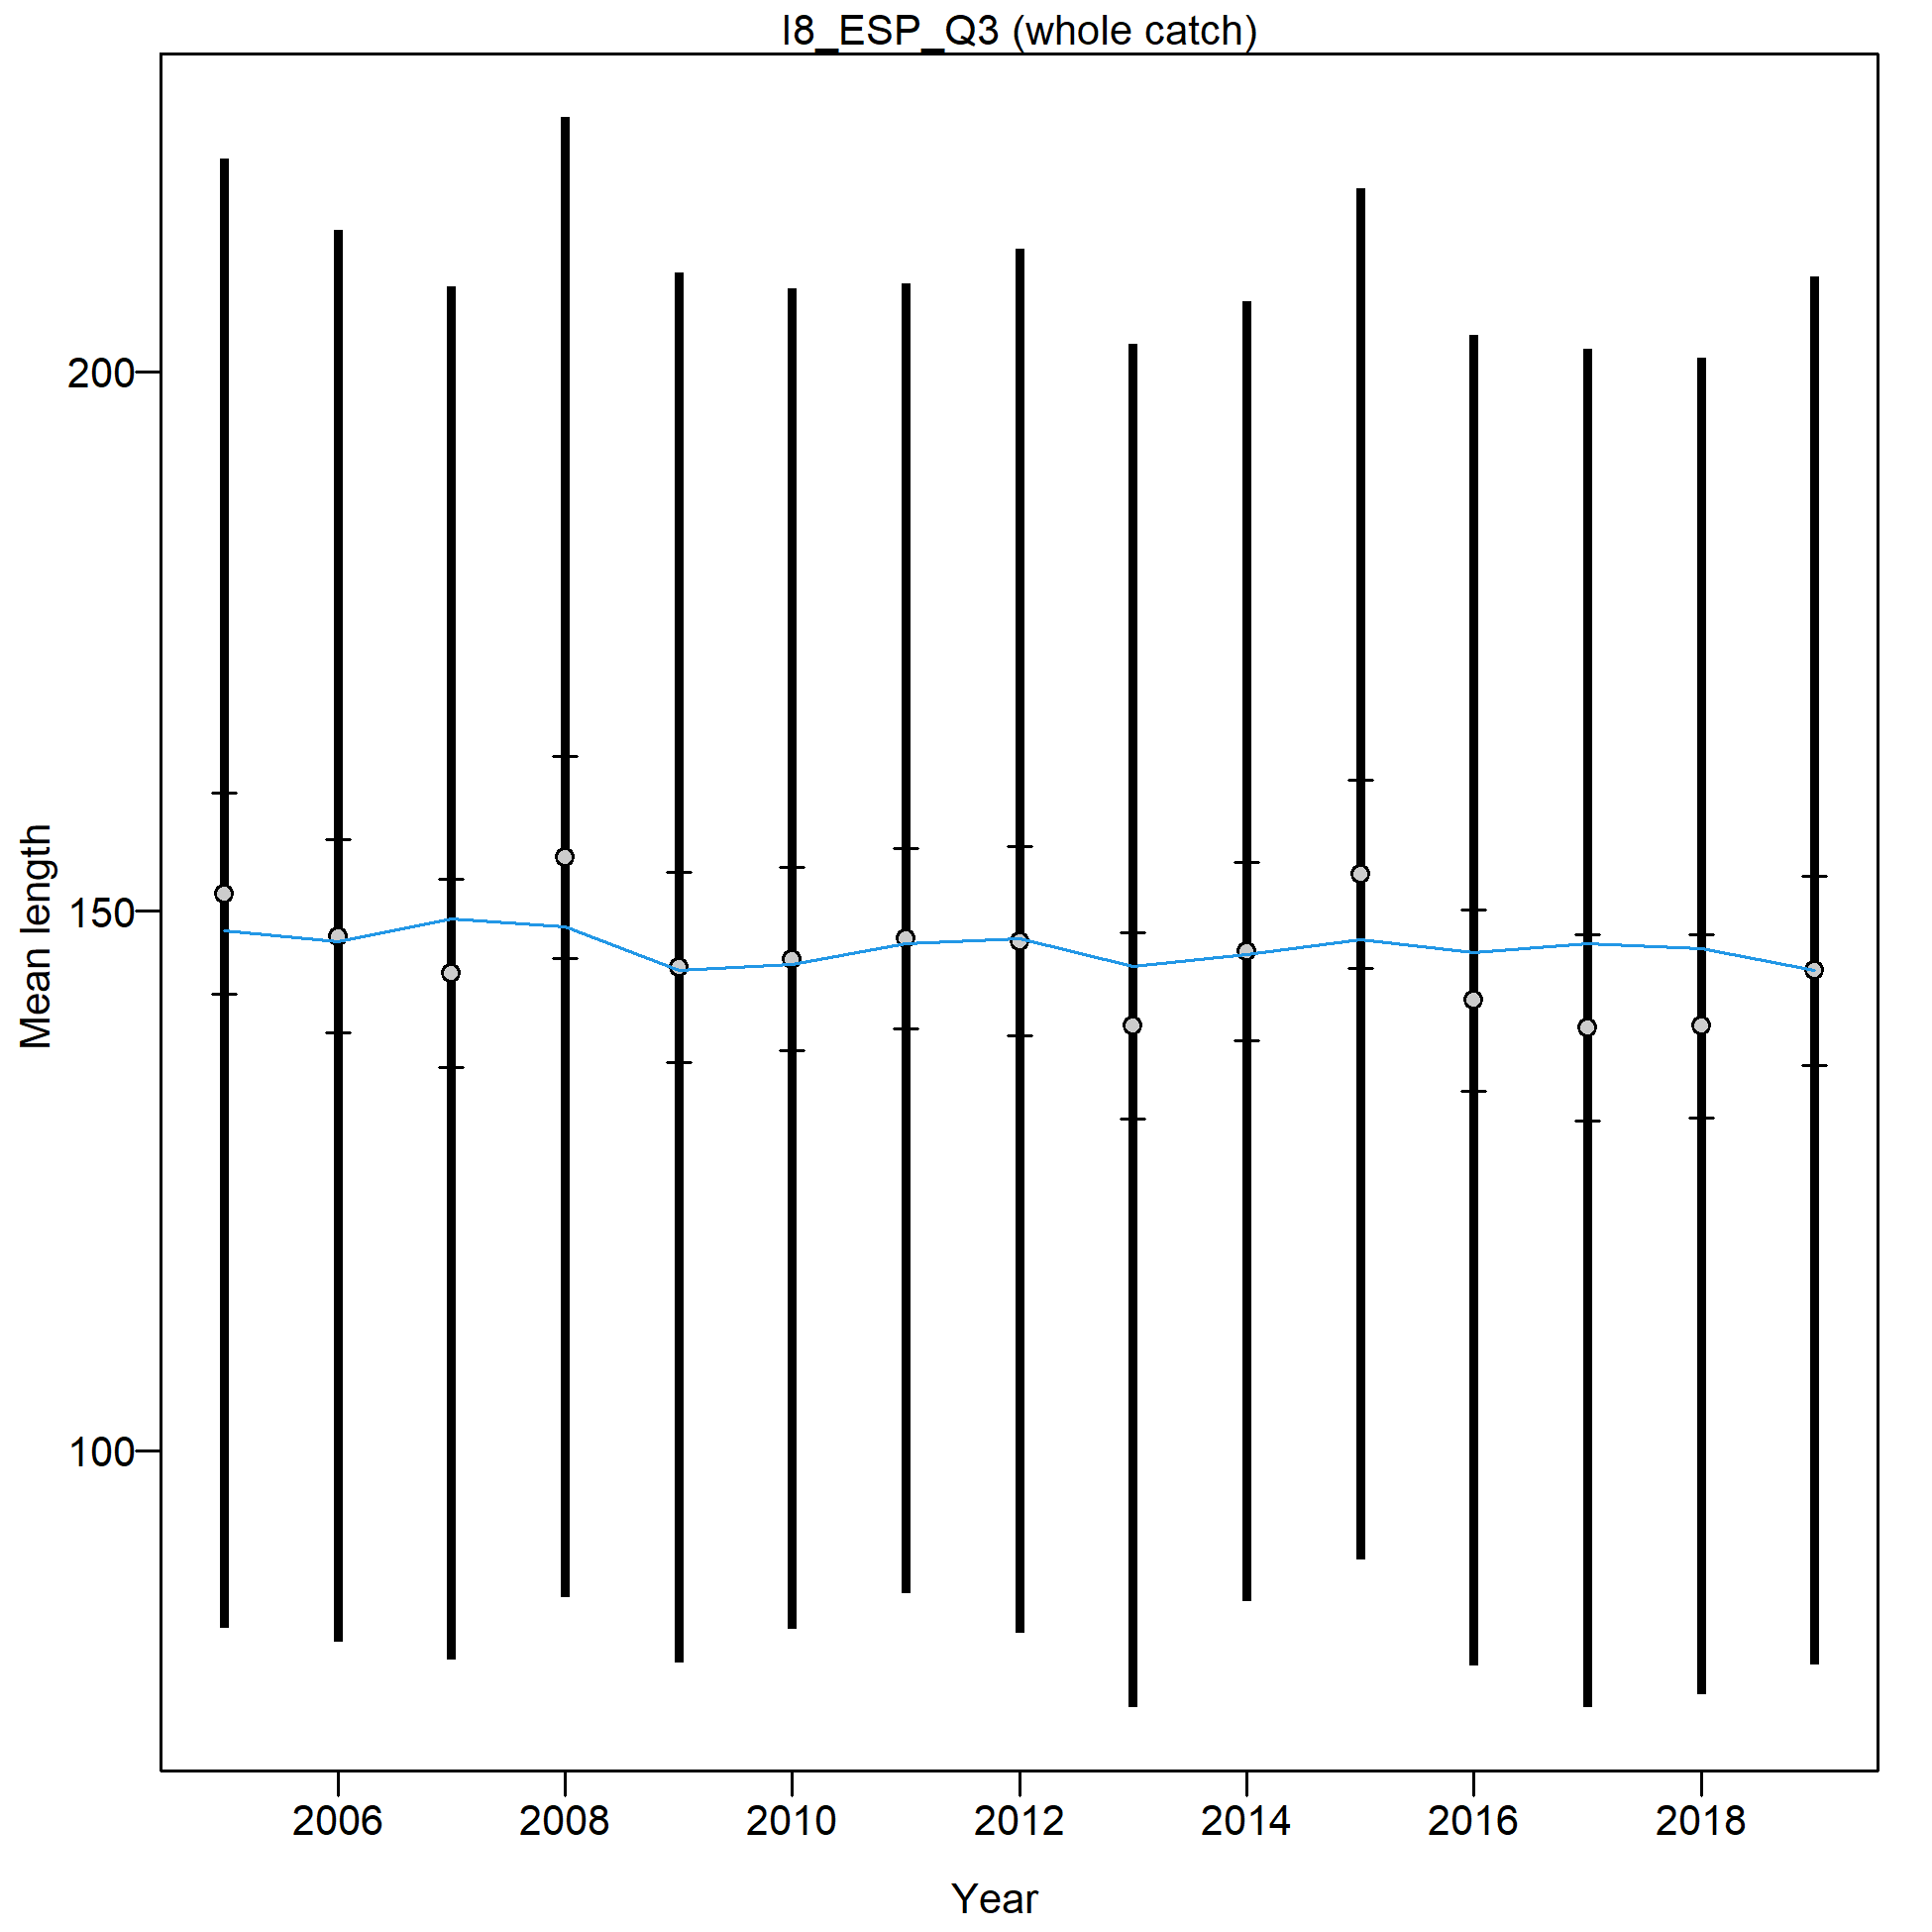
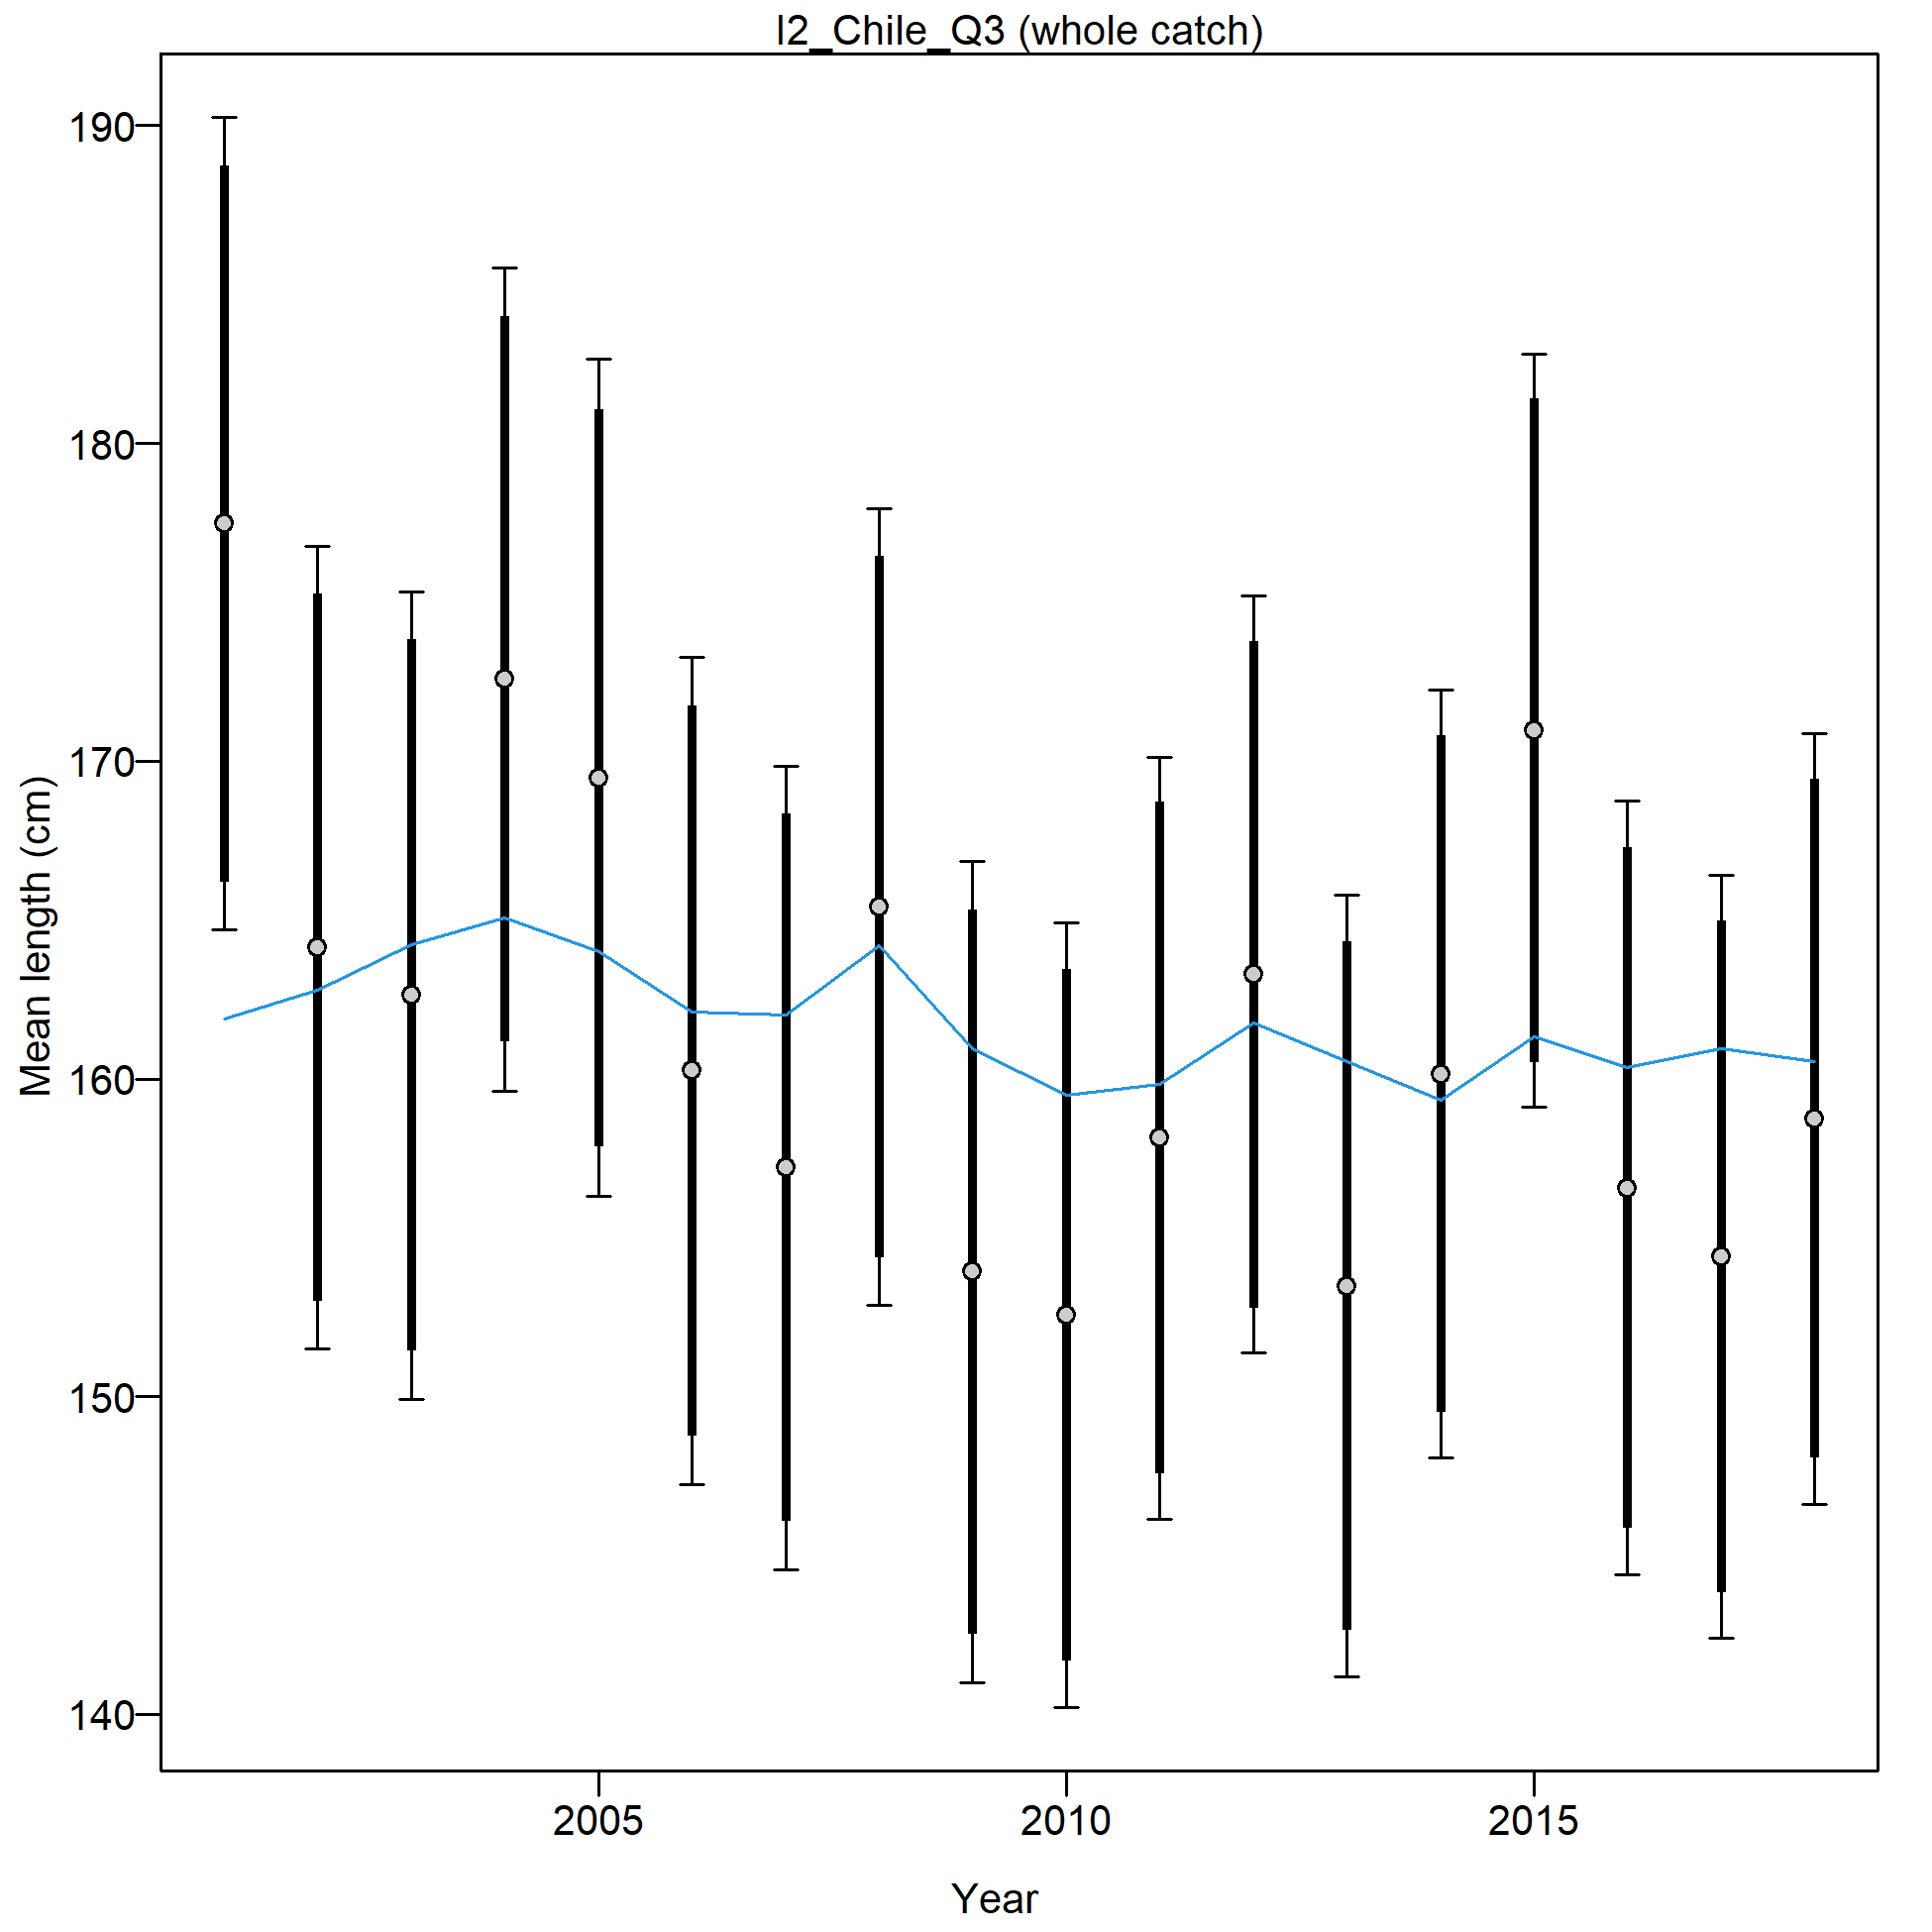
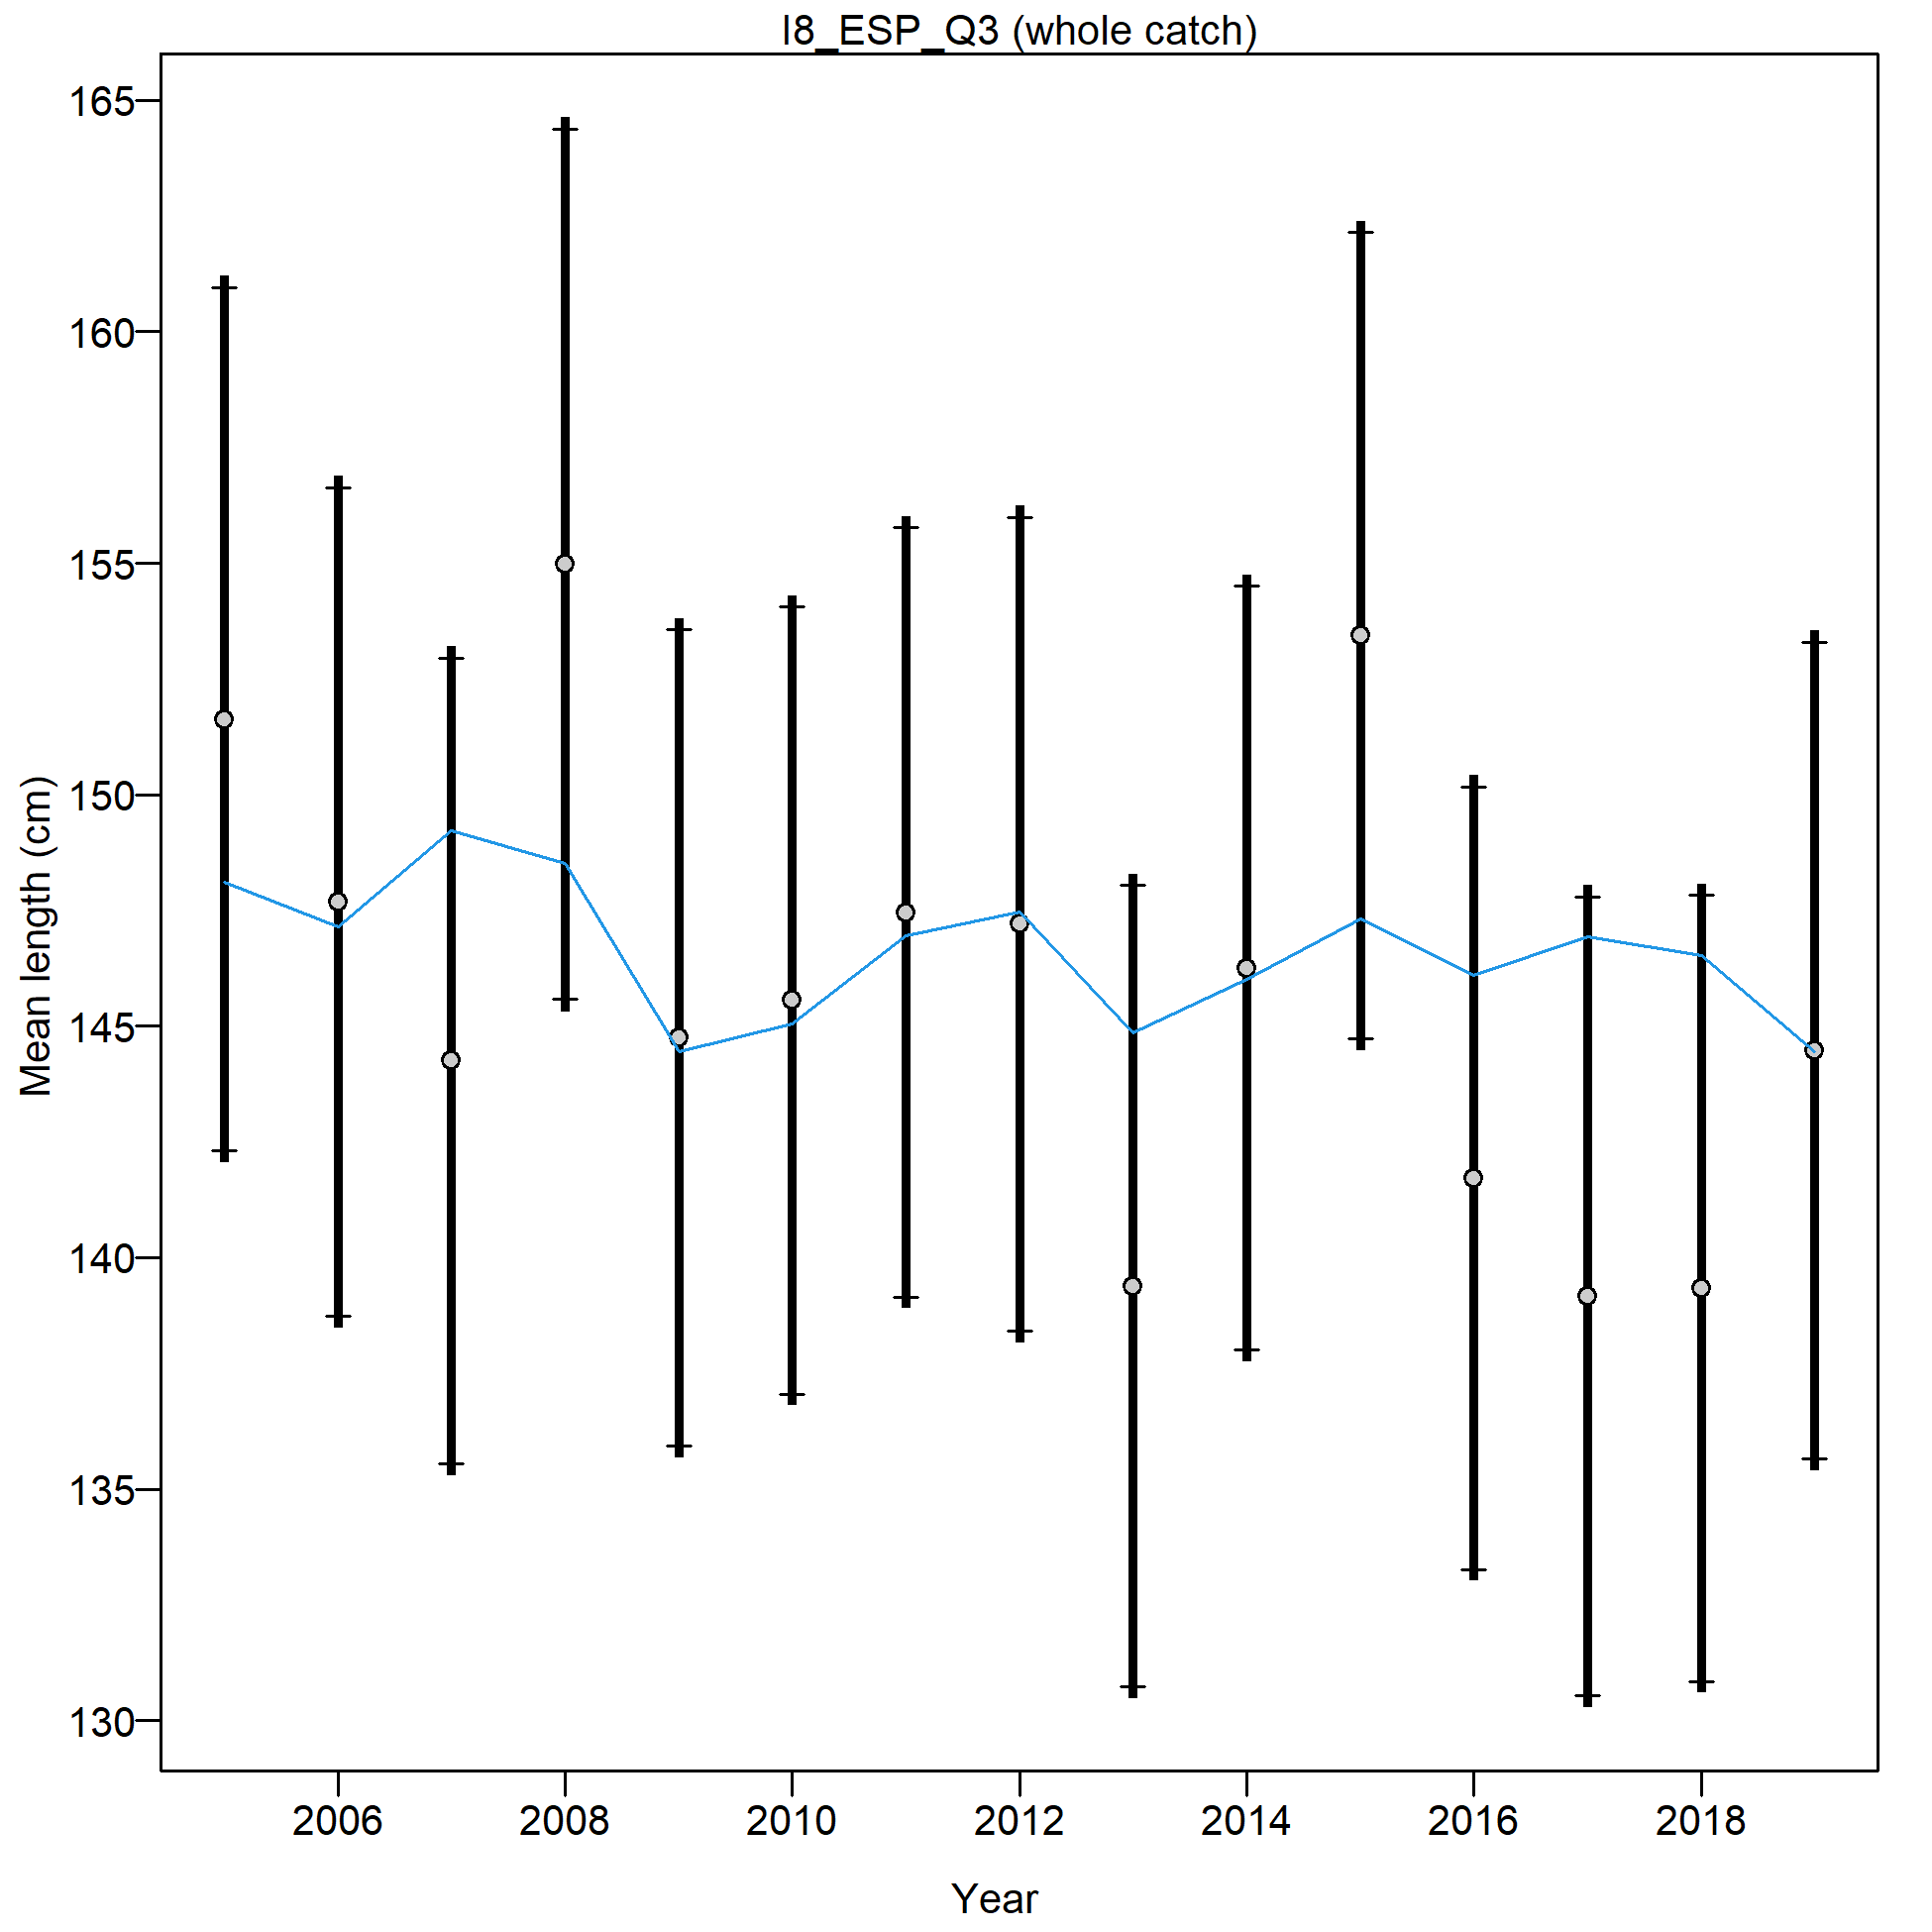
Mean length for I8_ESP_Q3 with 95% confidence intervals based on current samples sizes.
Francis data weighting method TA1.8: thinner intervals (with capped ends) show result of further adjusting sample sizes based on suggested multiplier (with 95% interval) for len data from I8_ESP_Q3:
53.3689 (36.1286-123.9729)
For more info, see
Francis, R.I.C.C. (2011). Data weighting in statistical fisheries stock assessment models. Can. J. Fish. Aquat. Sci. 68: 1124-1138. https://doi.org/10.1139/f2011-025

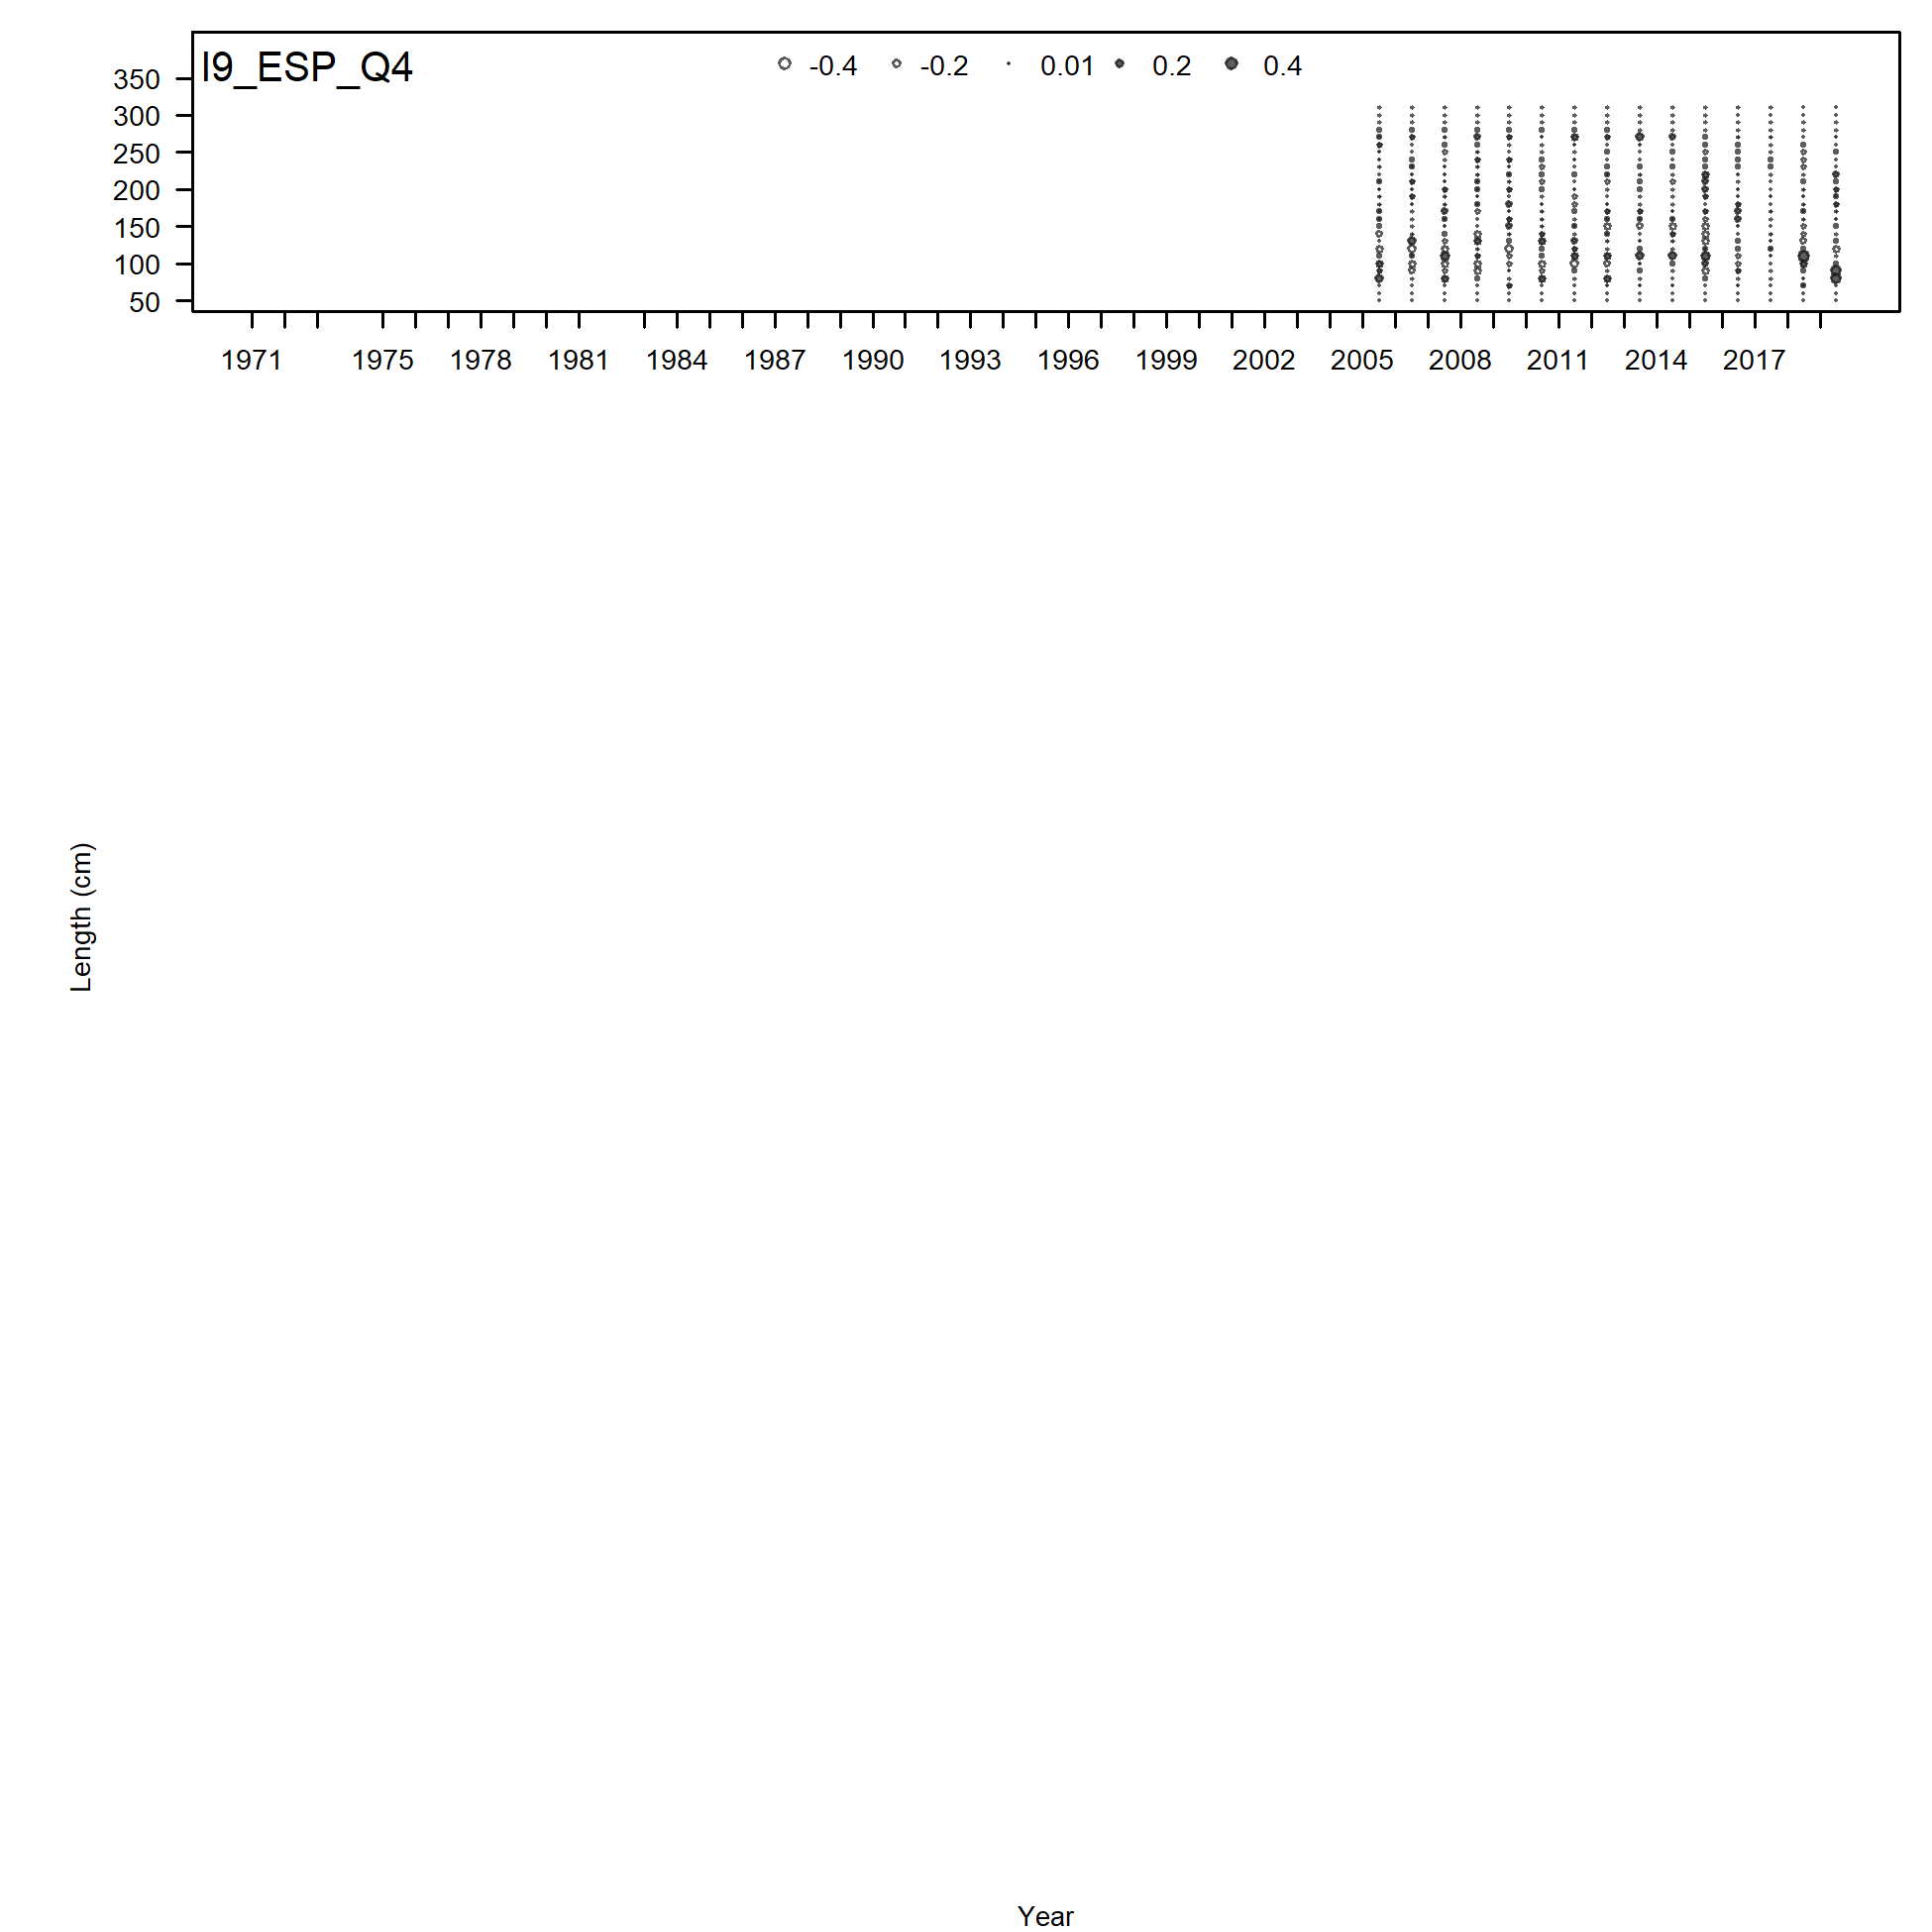
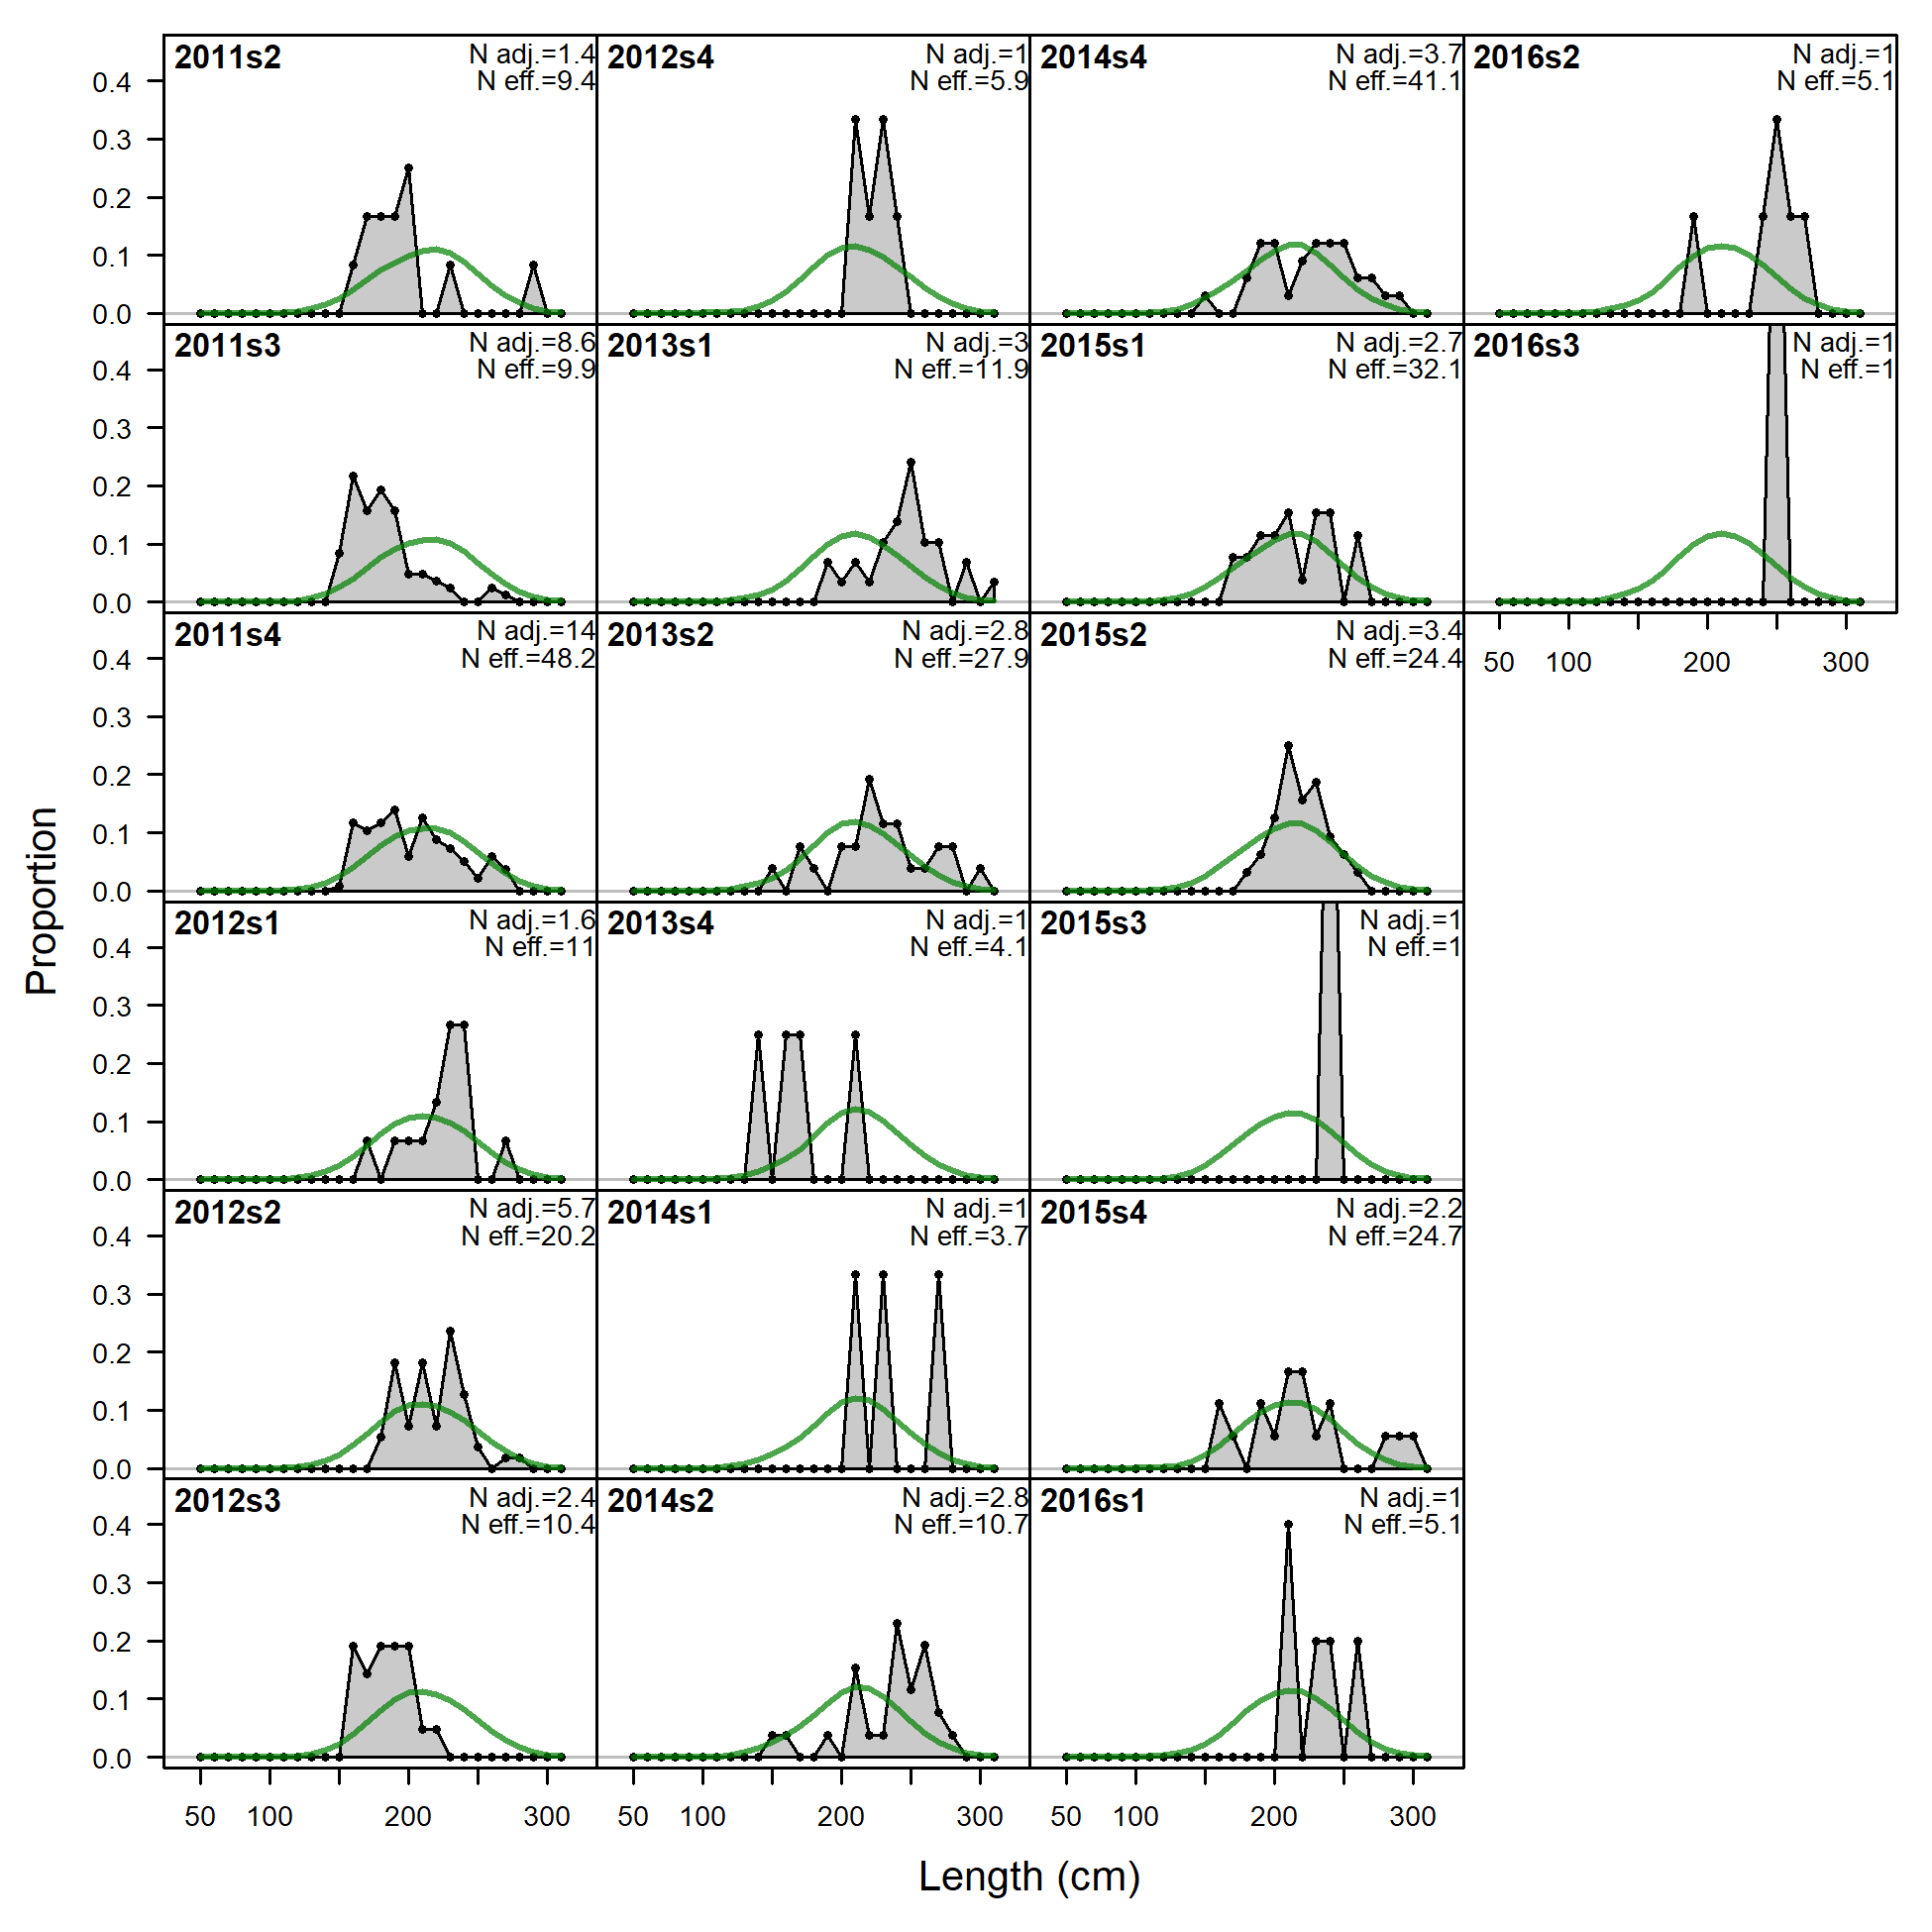
Length comps, whole catch, I9_ESP_Q4.
'N adj.' is the input sample size after data-weighting adjustment. N eff. is the calculated effective sample size used in the McAllister-Ianelli tuning method.
file: comp_lenfit_flt30mkt0.png
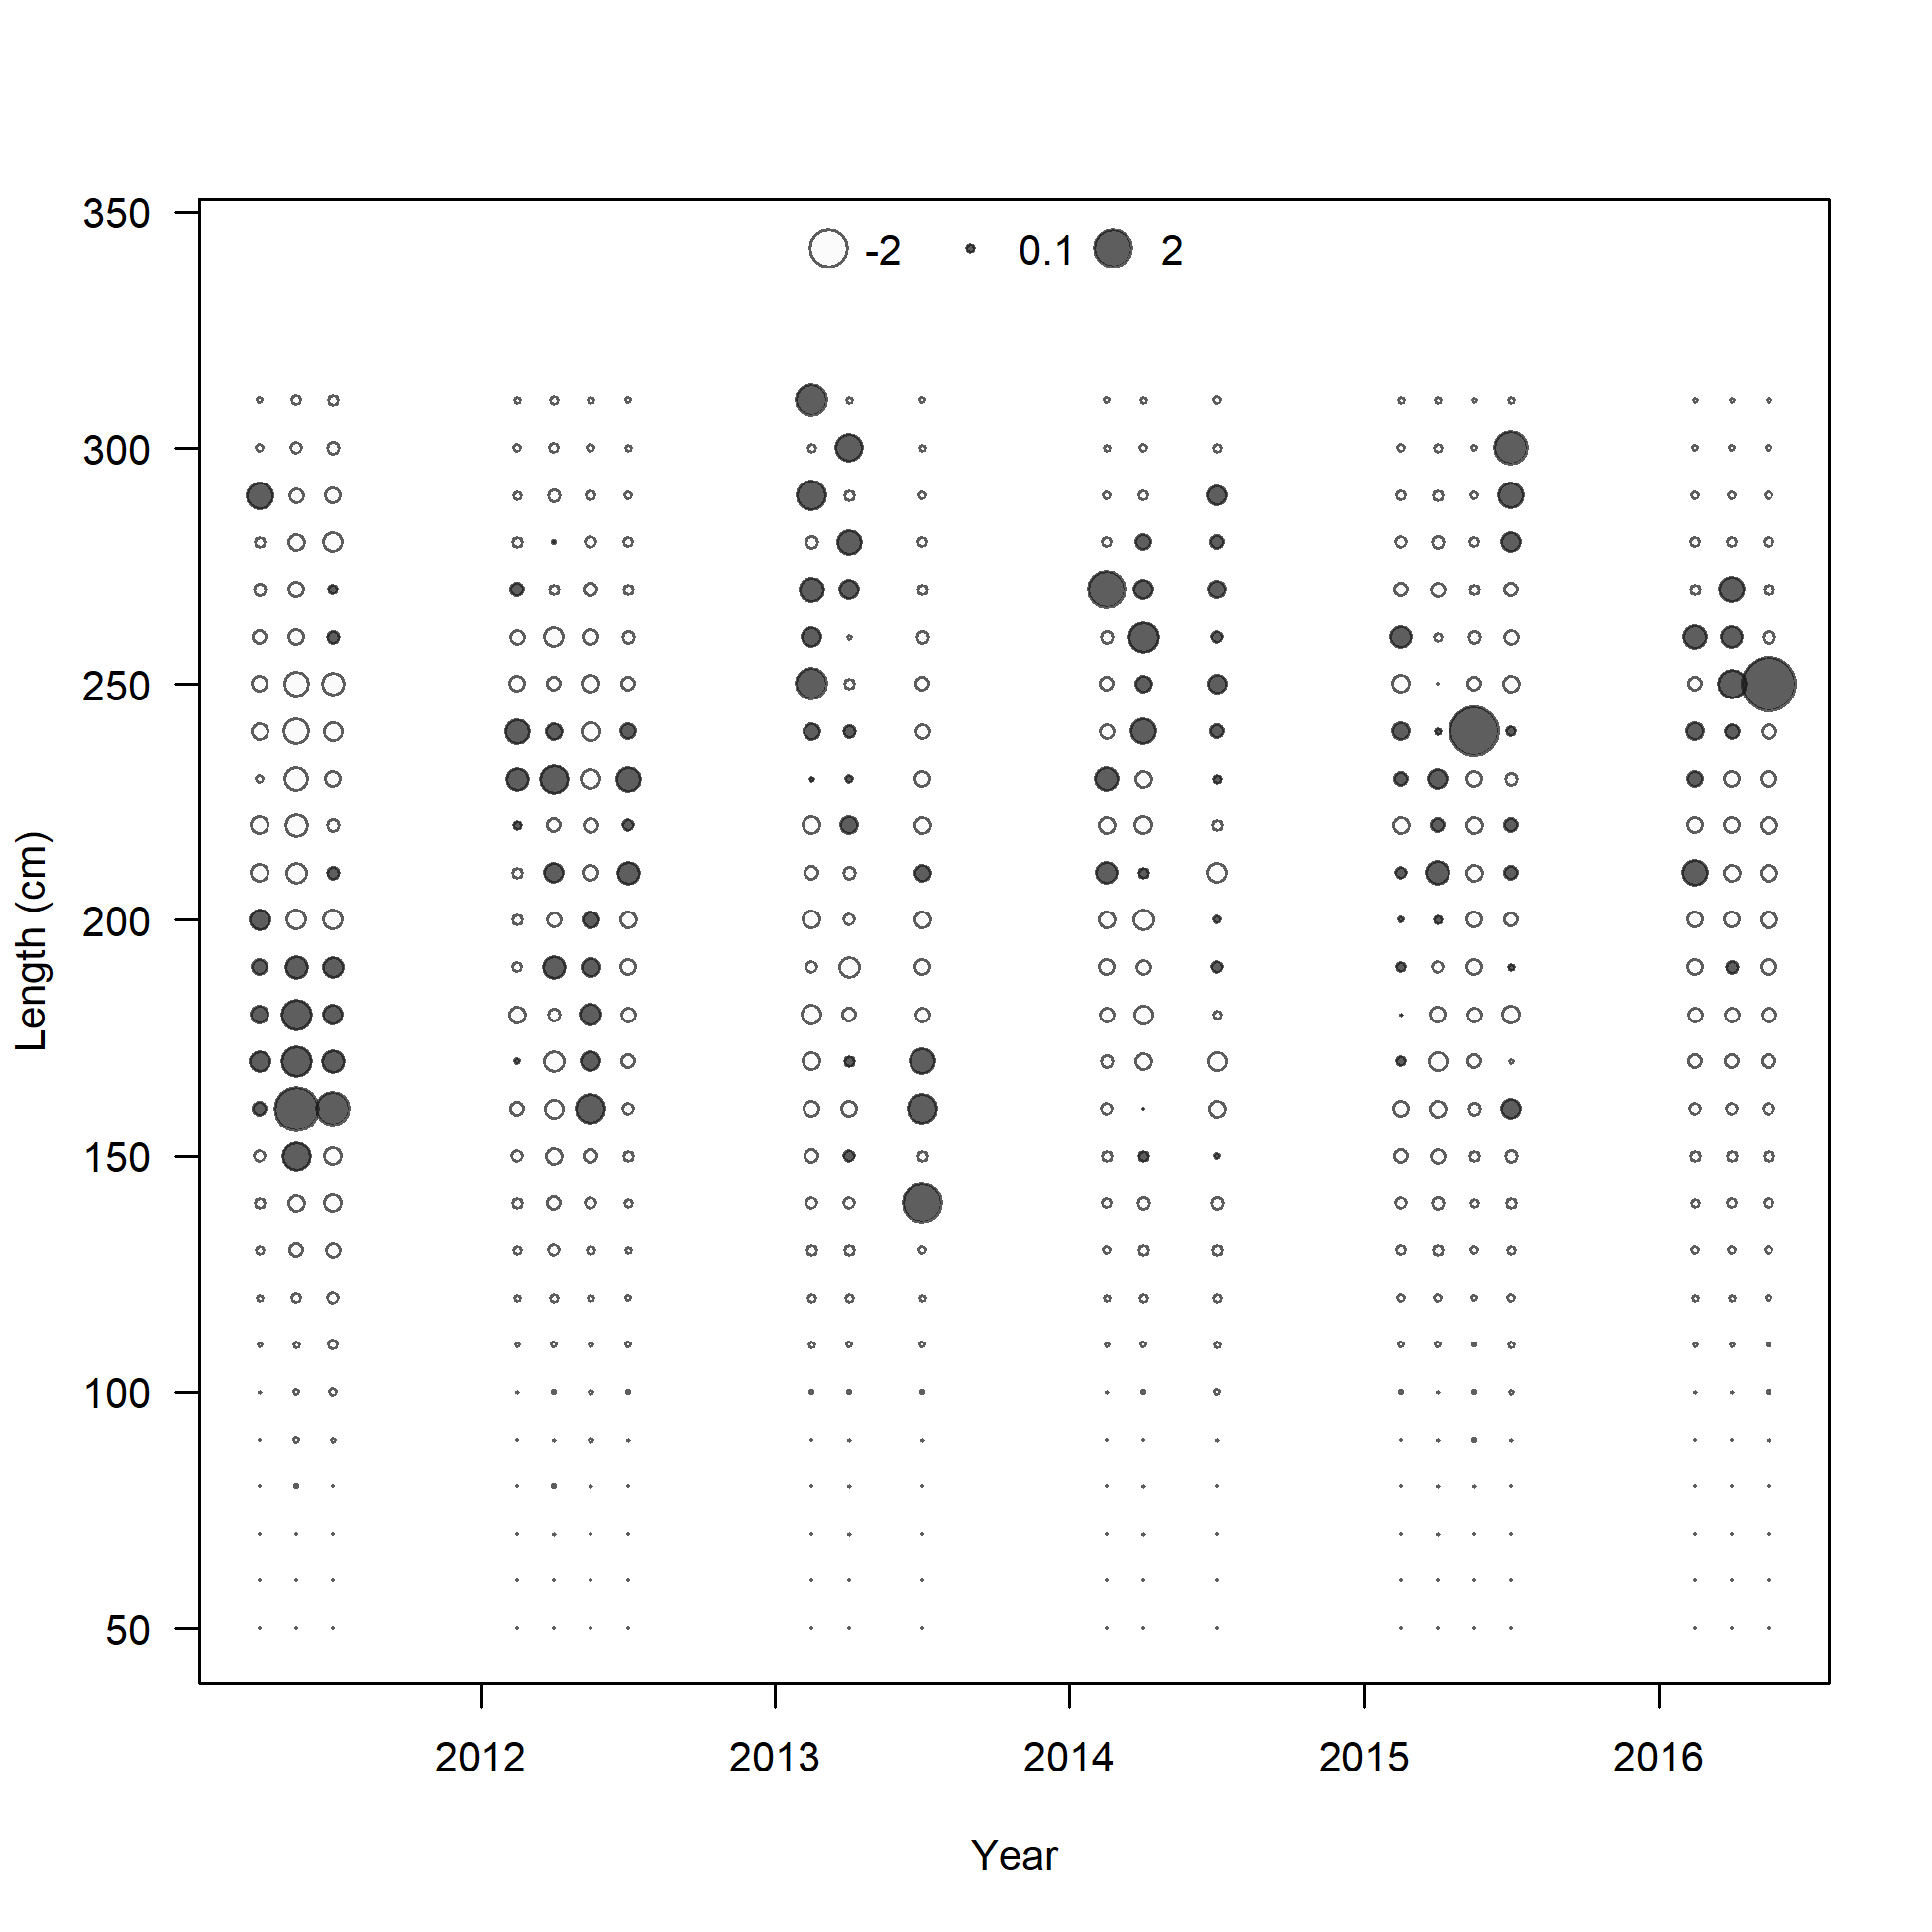
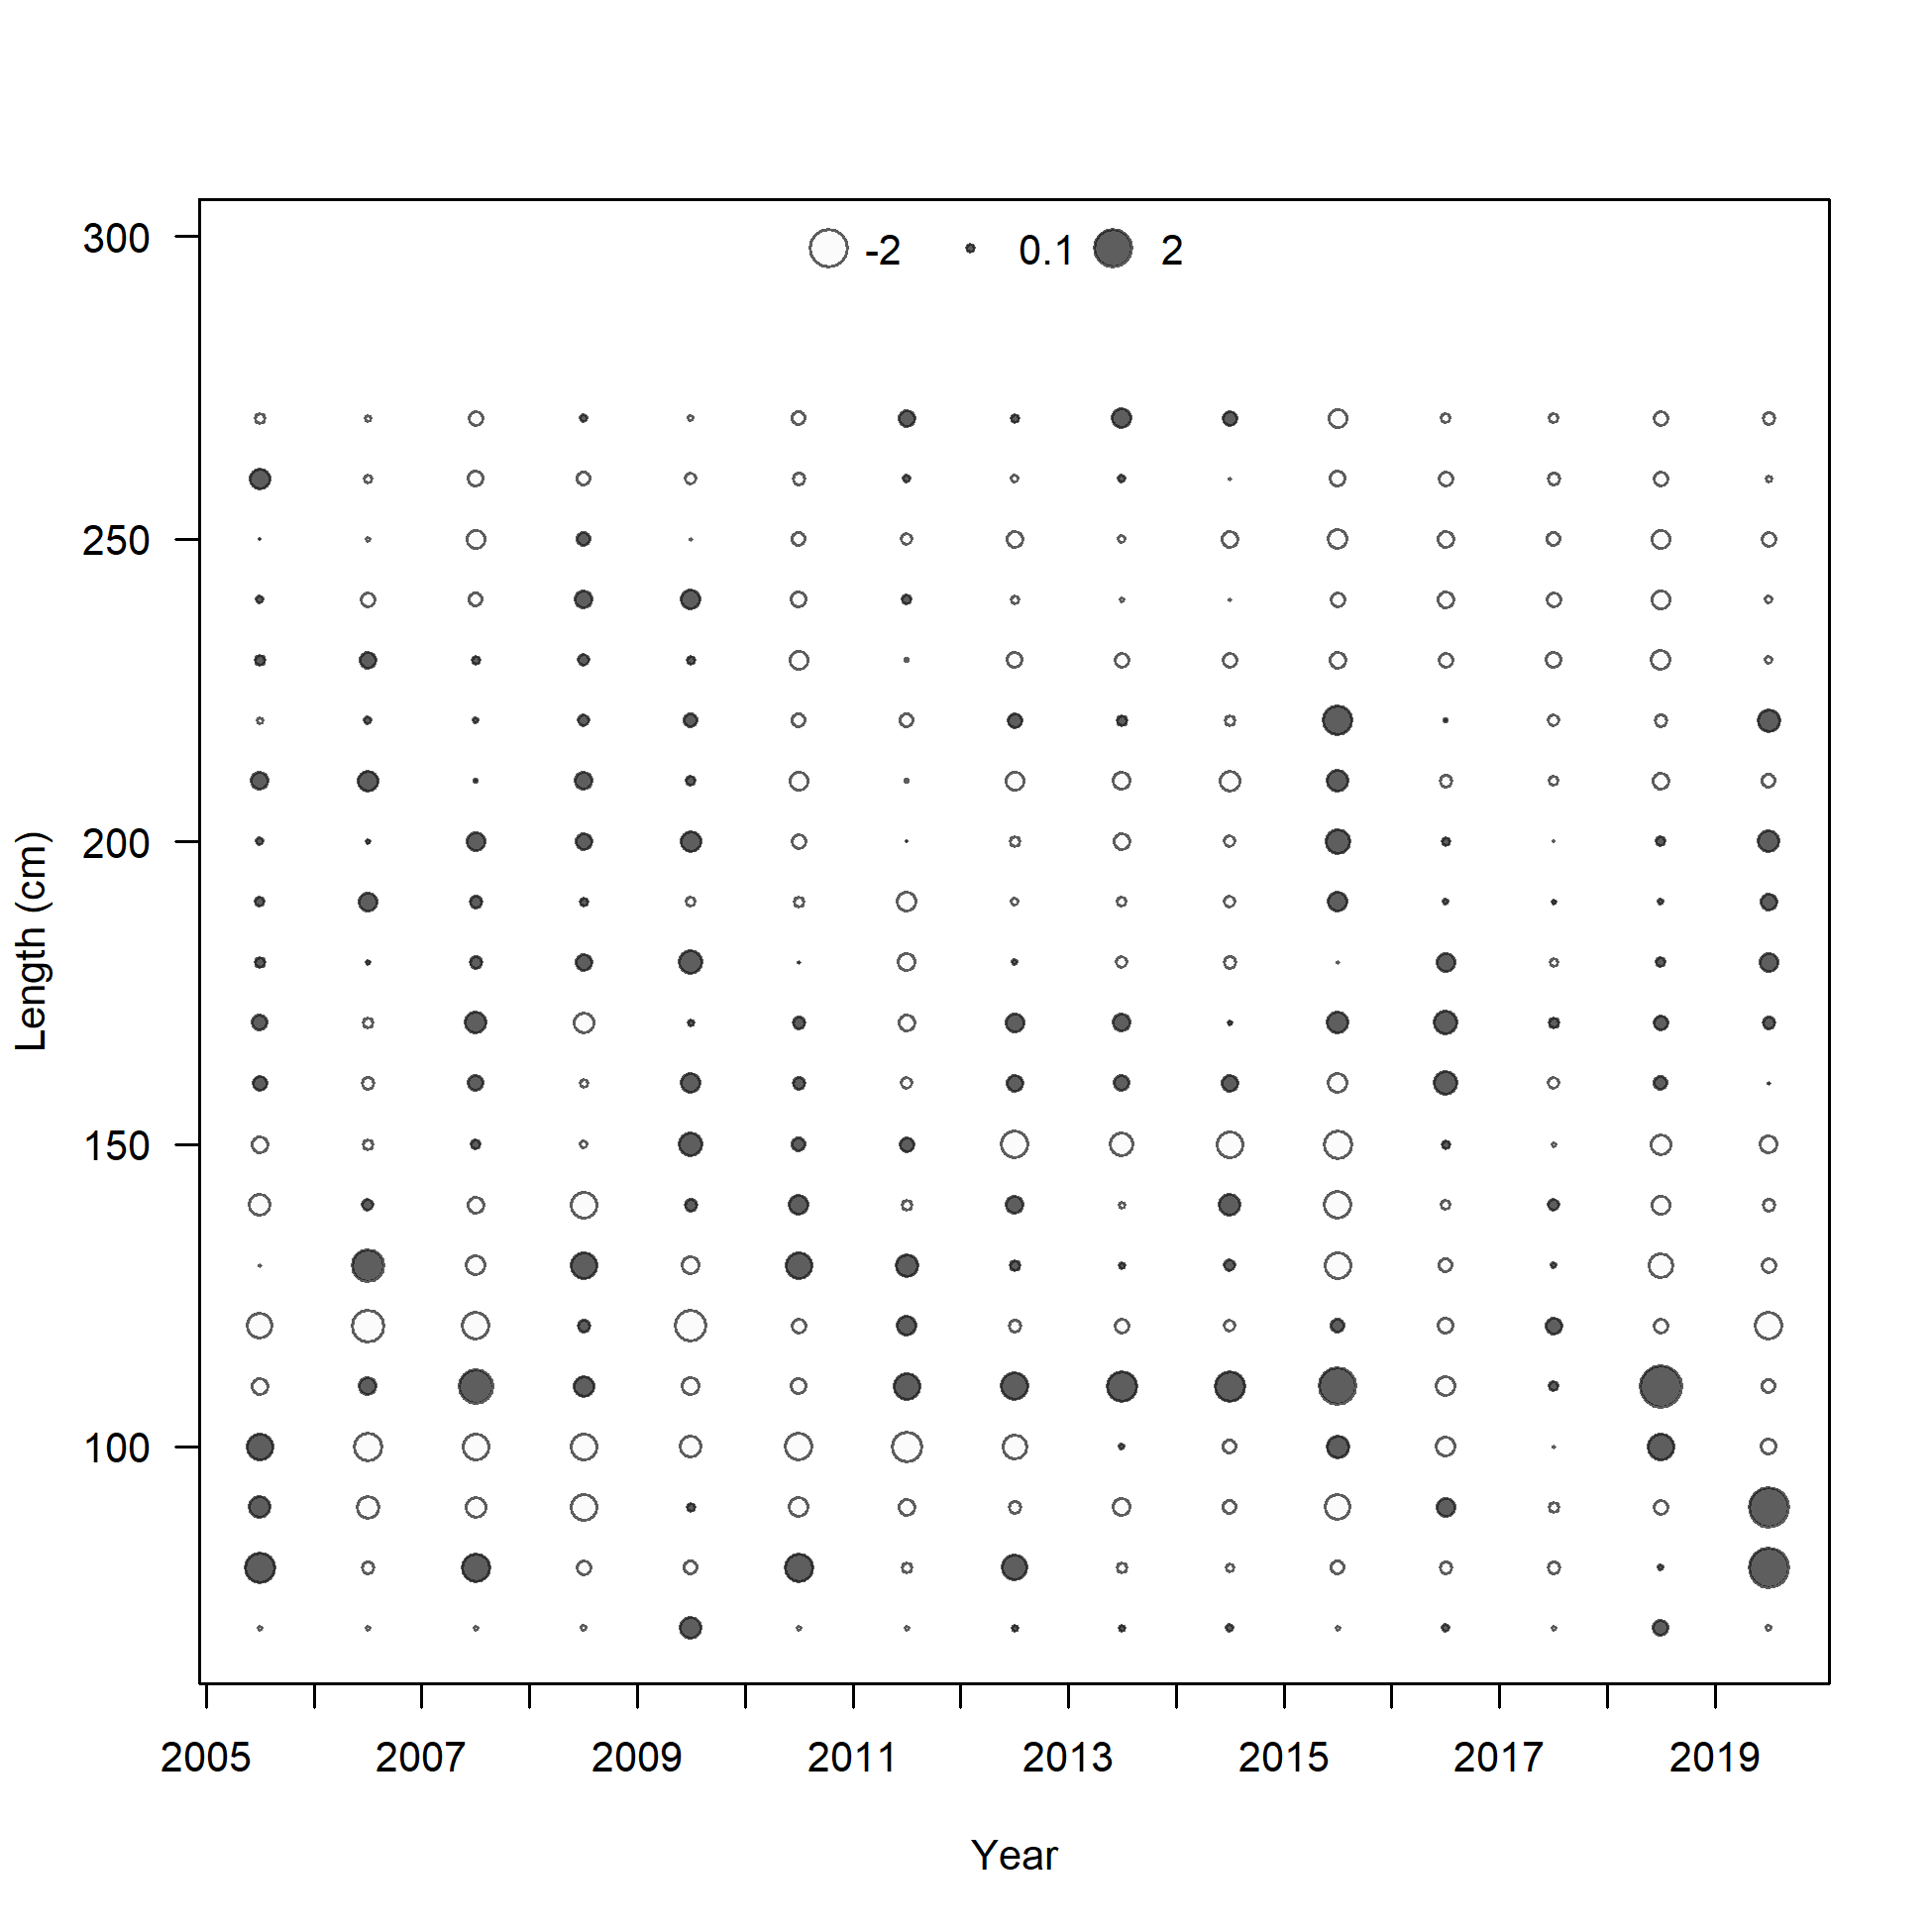
Pearson residuals, whole catch, I9_ESP_Q4 (max=0.34)
Closed bubbles are positive residuals (observed > expected) and open bubbles are negative residuals (observed < expected).
file: comp_lenfit_residsflt30mkt0.png

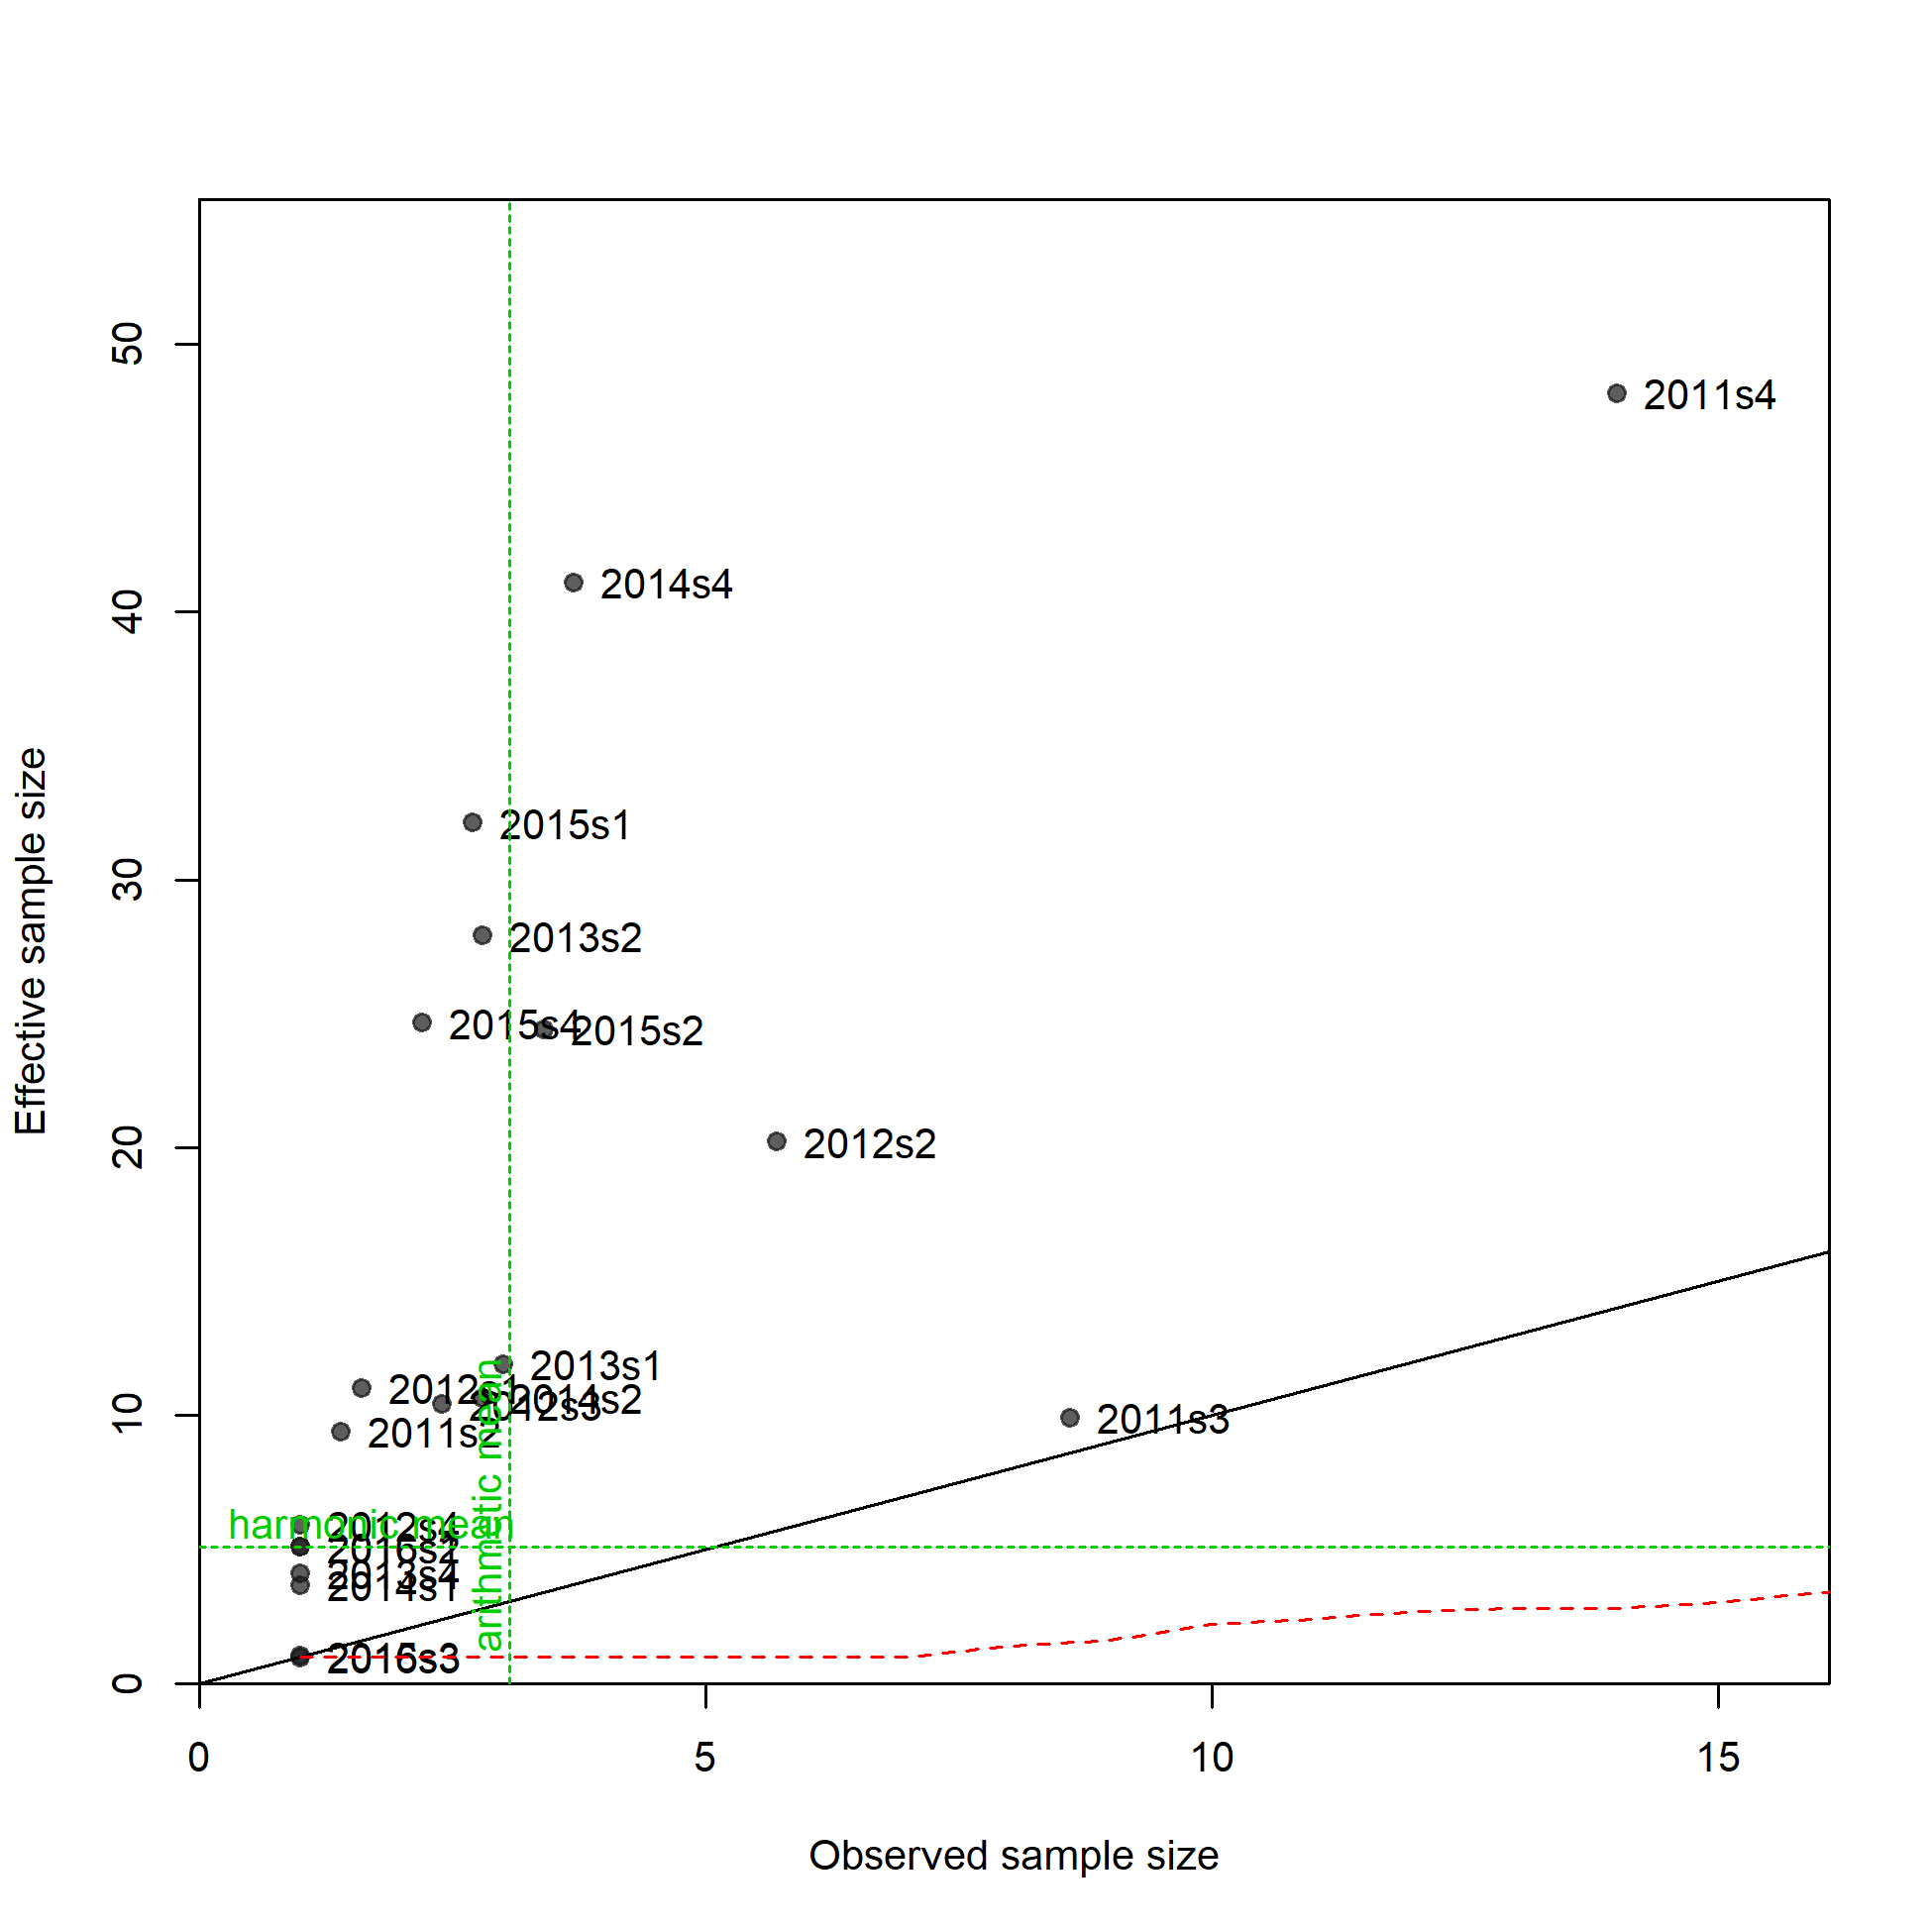
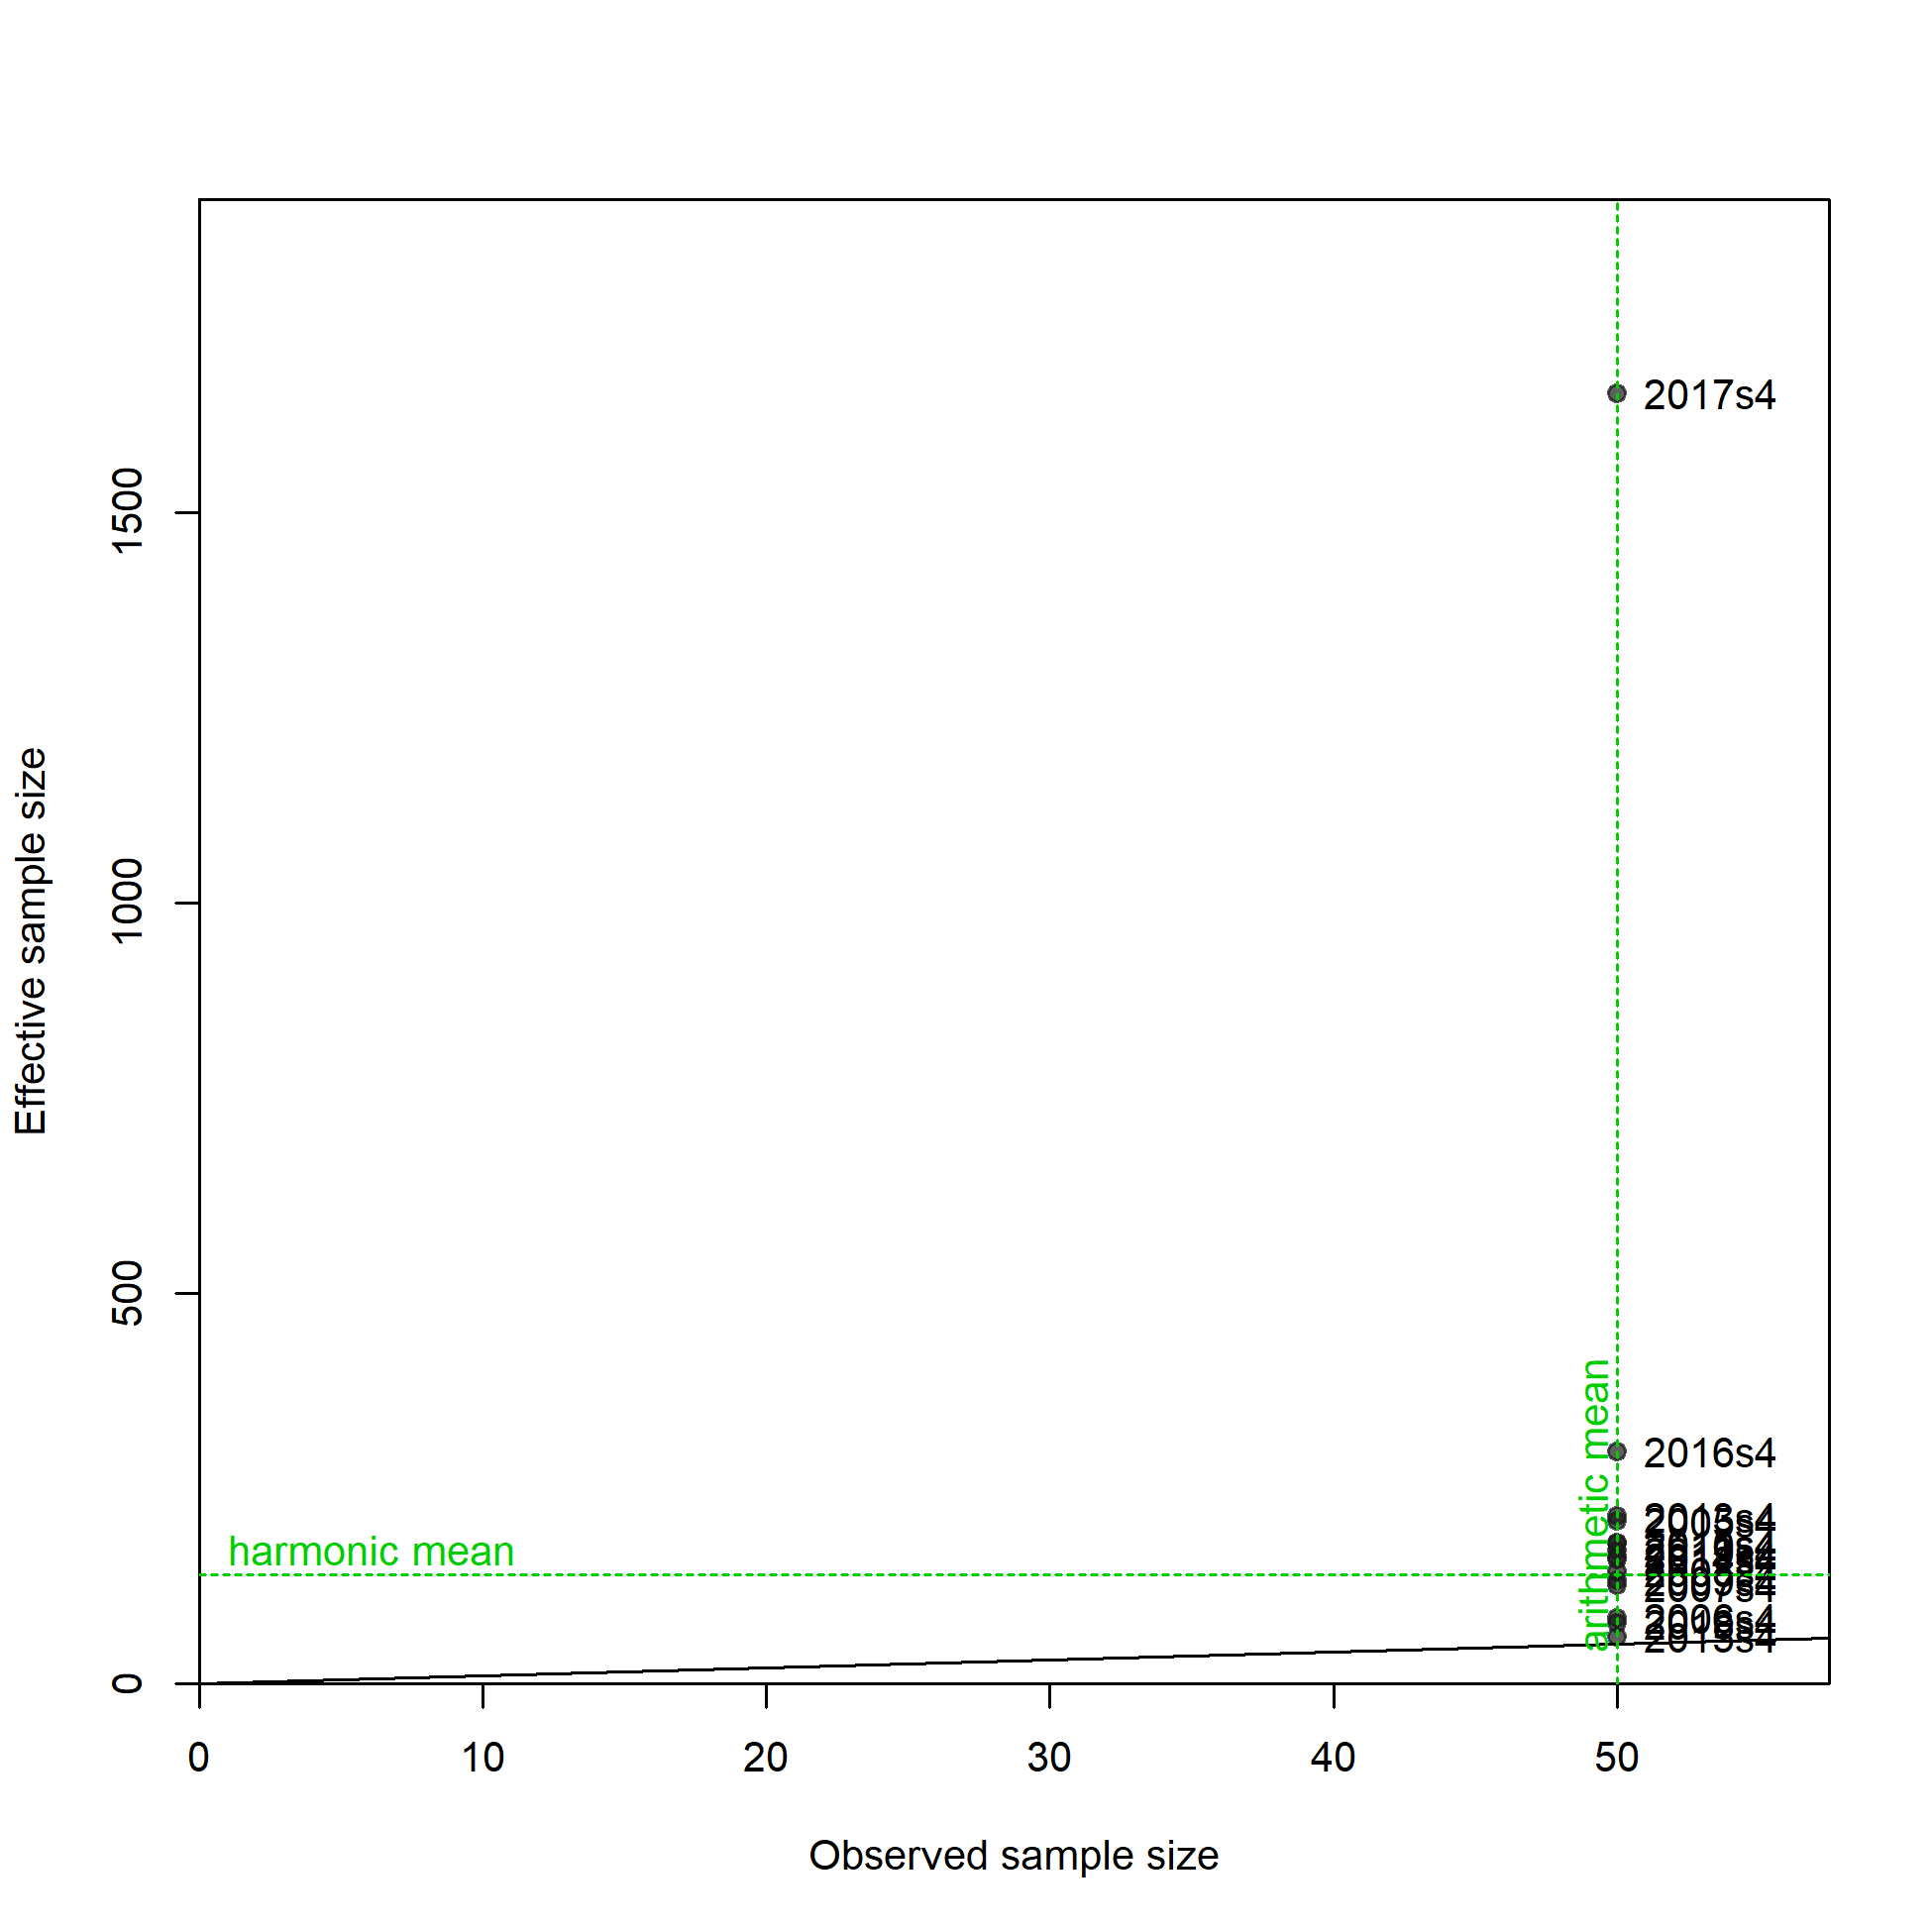
N-EffN comparison, Length comps, whole catch, I9_ESP_Q4
file: comp_lenfit_sampsize_flt30mkt0.png
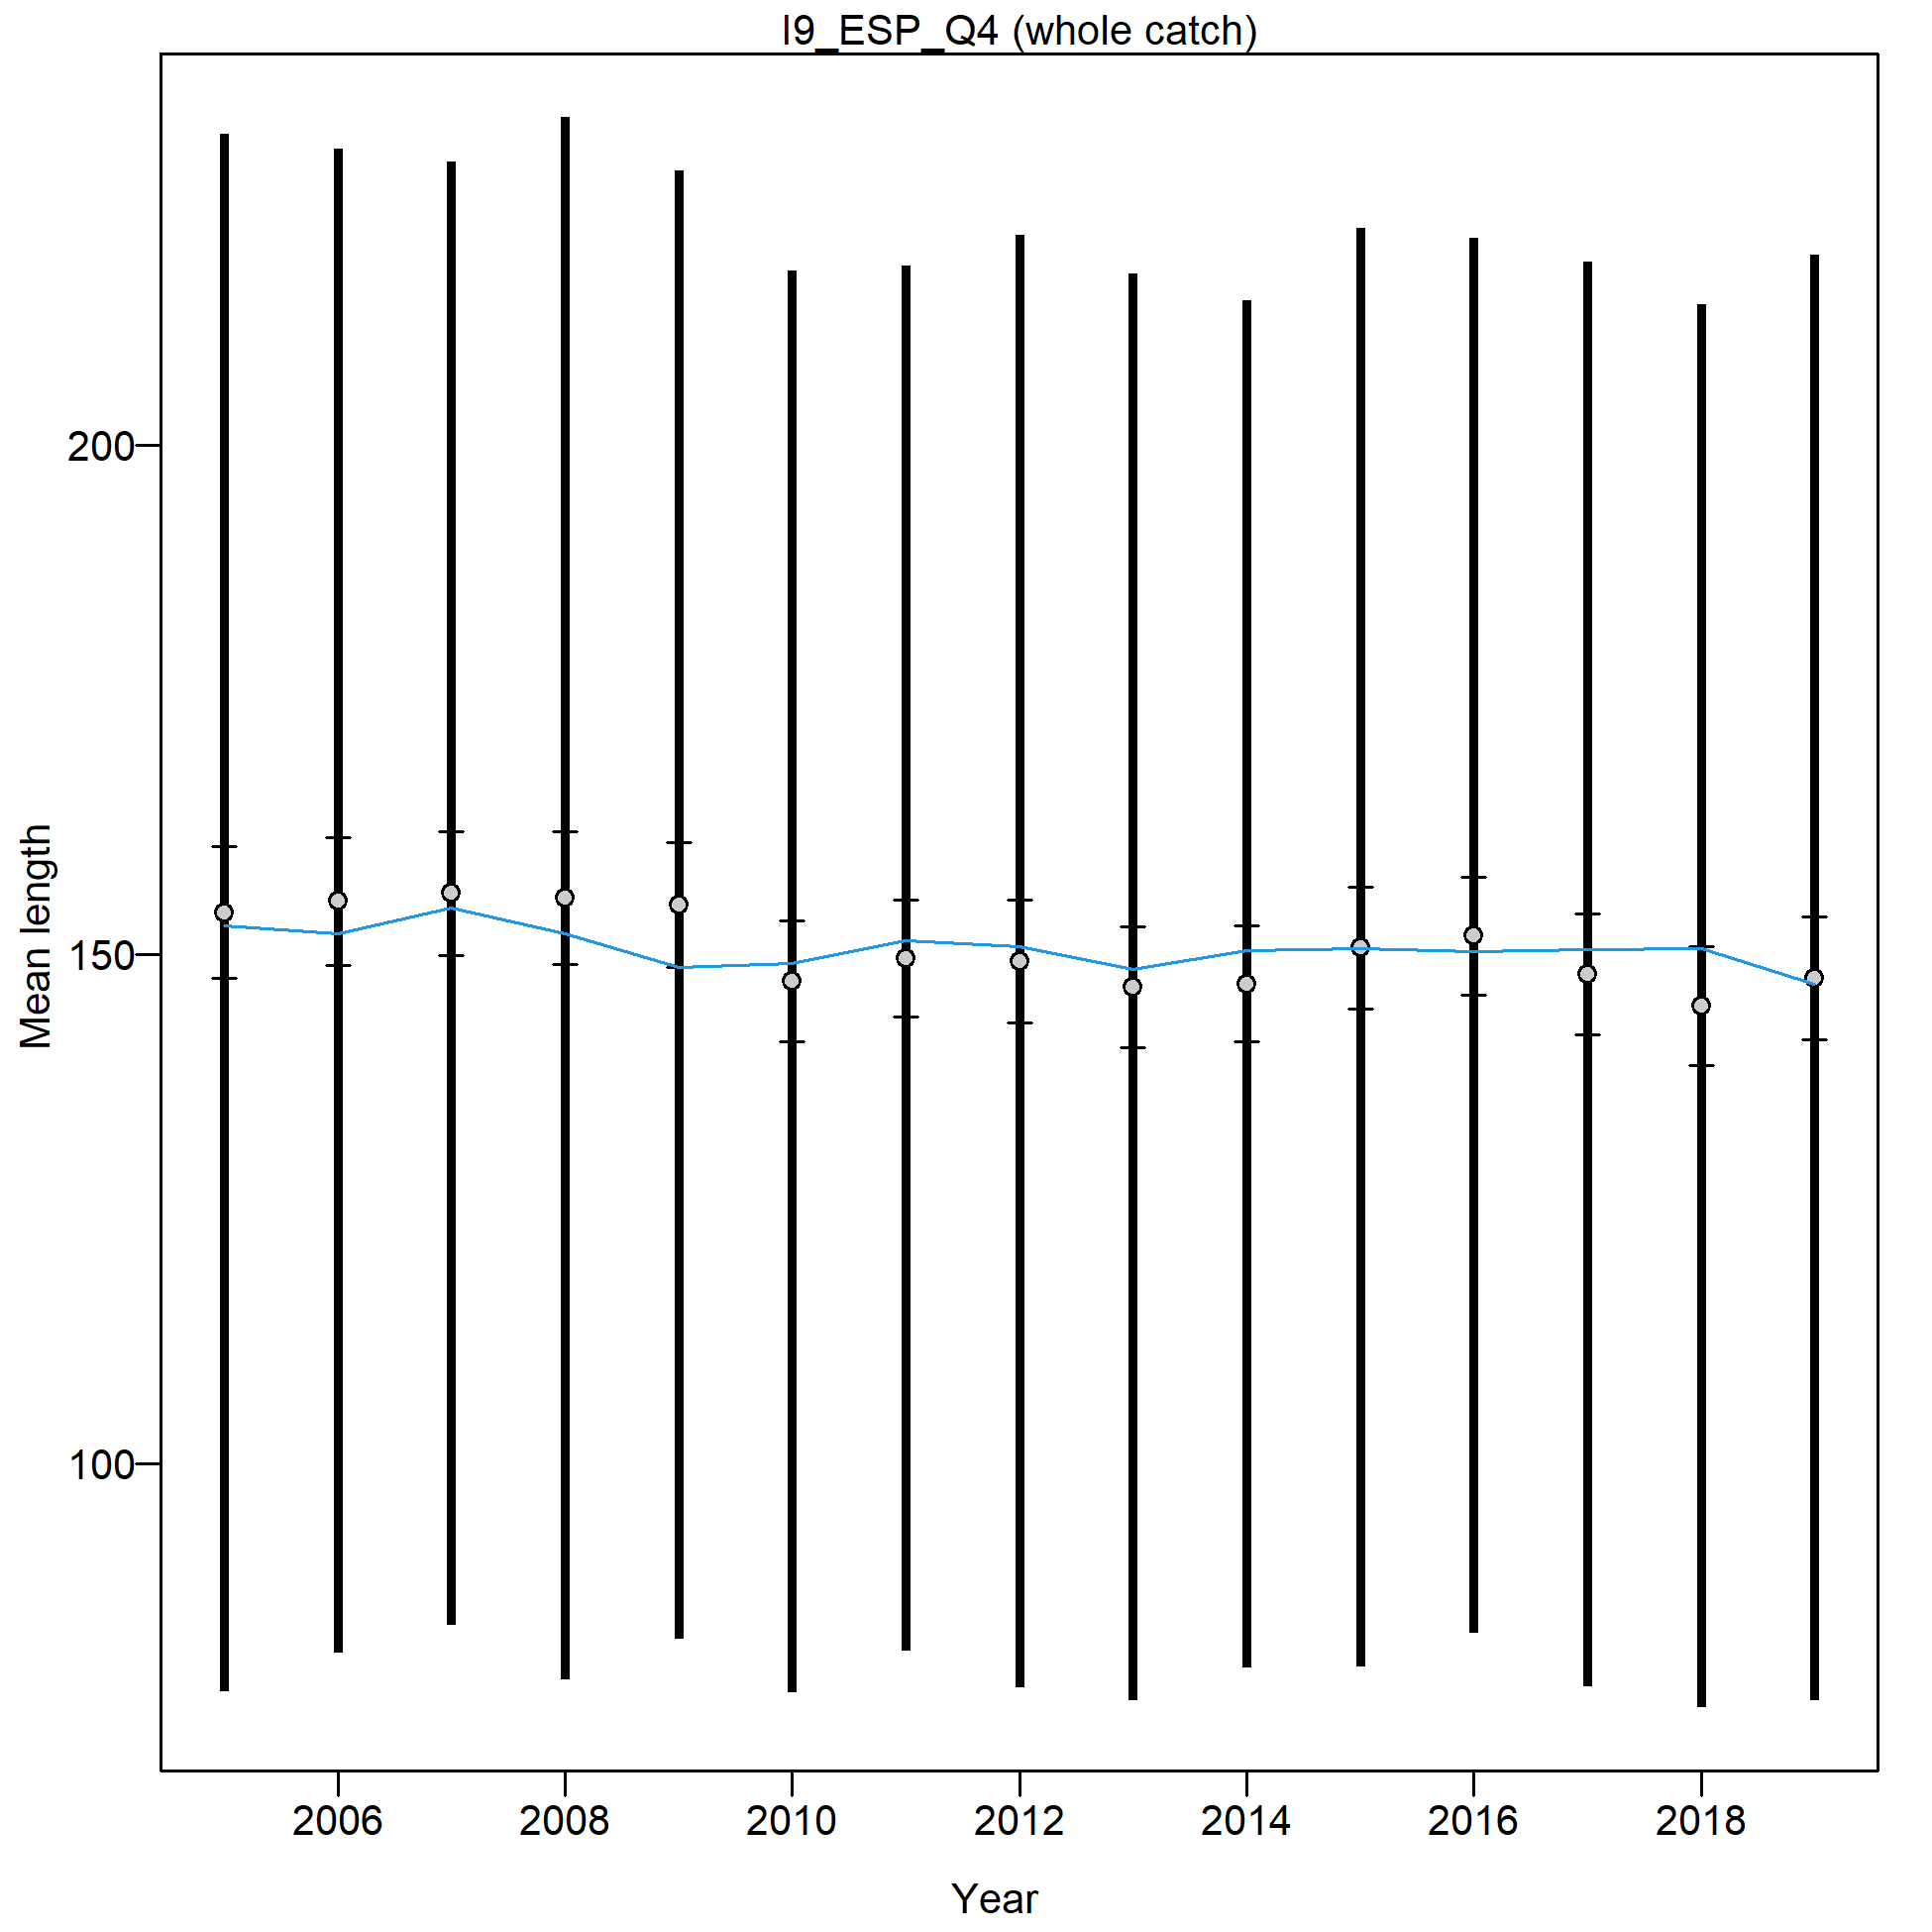
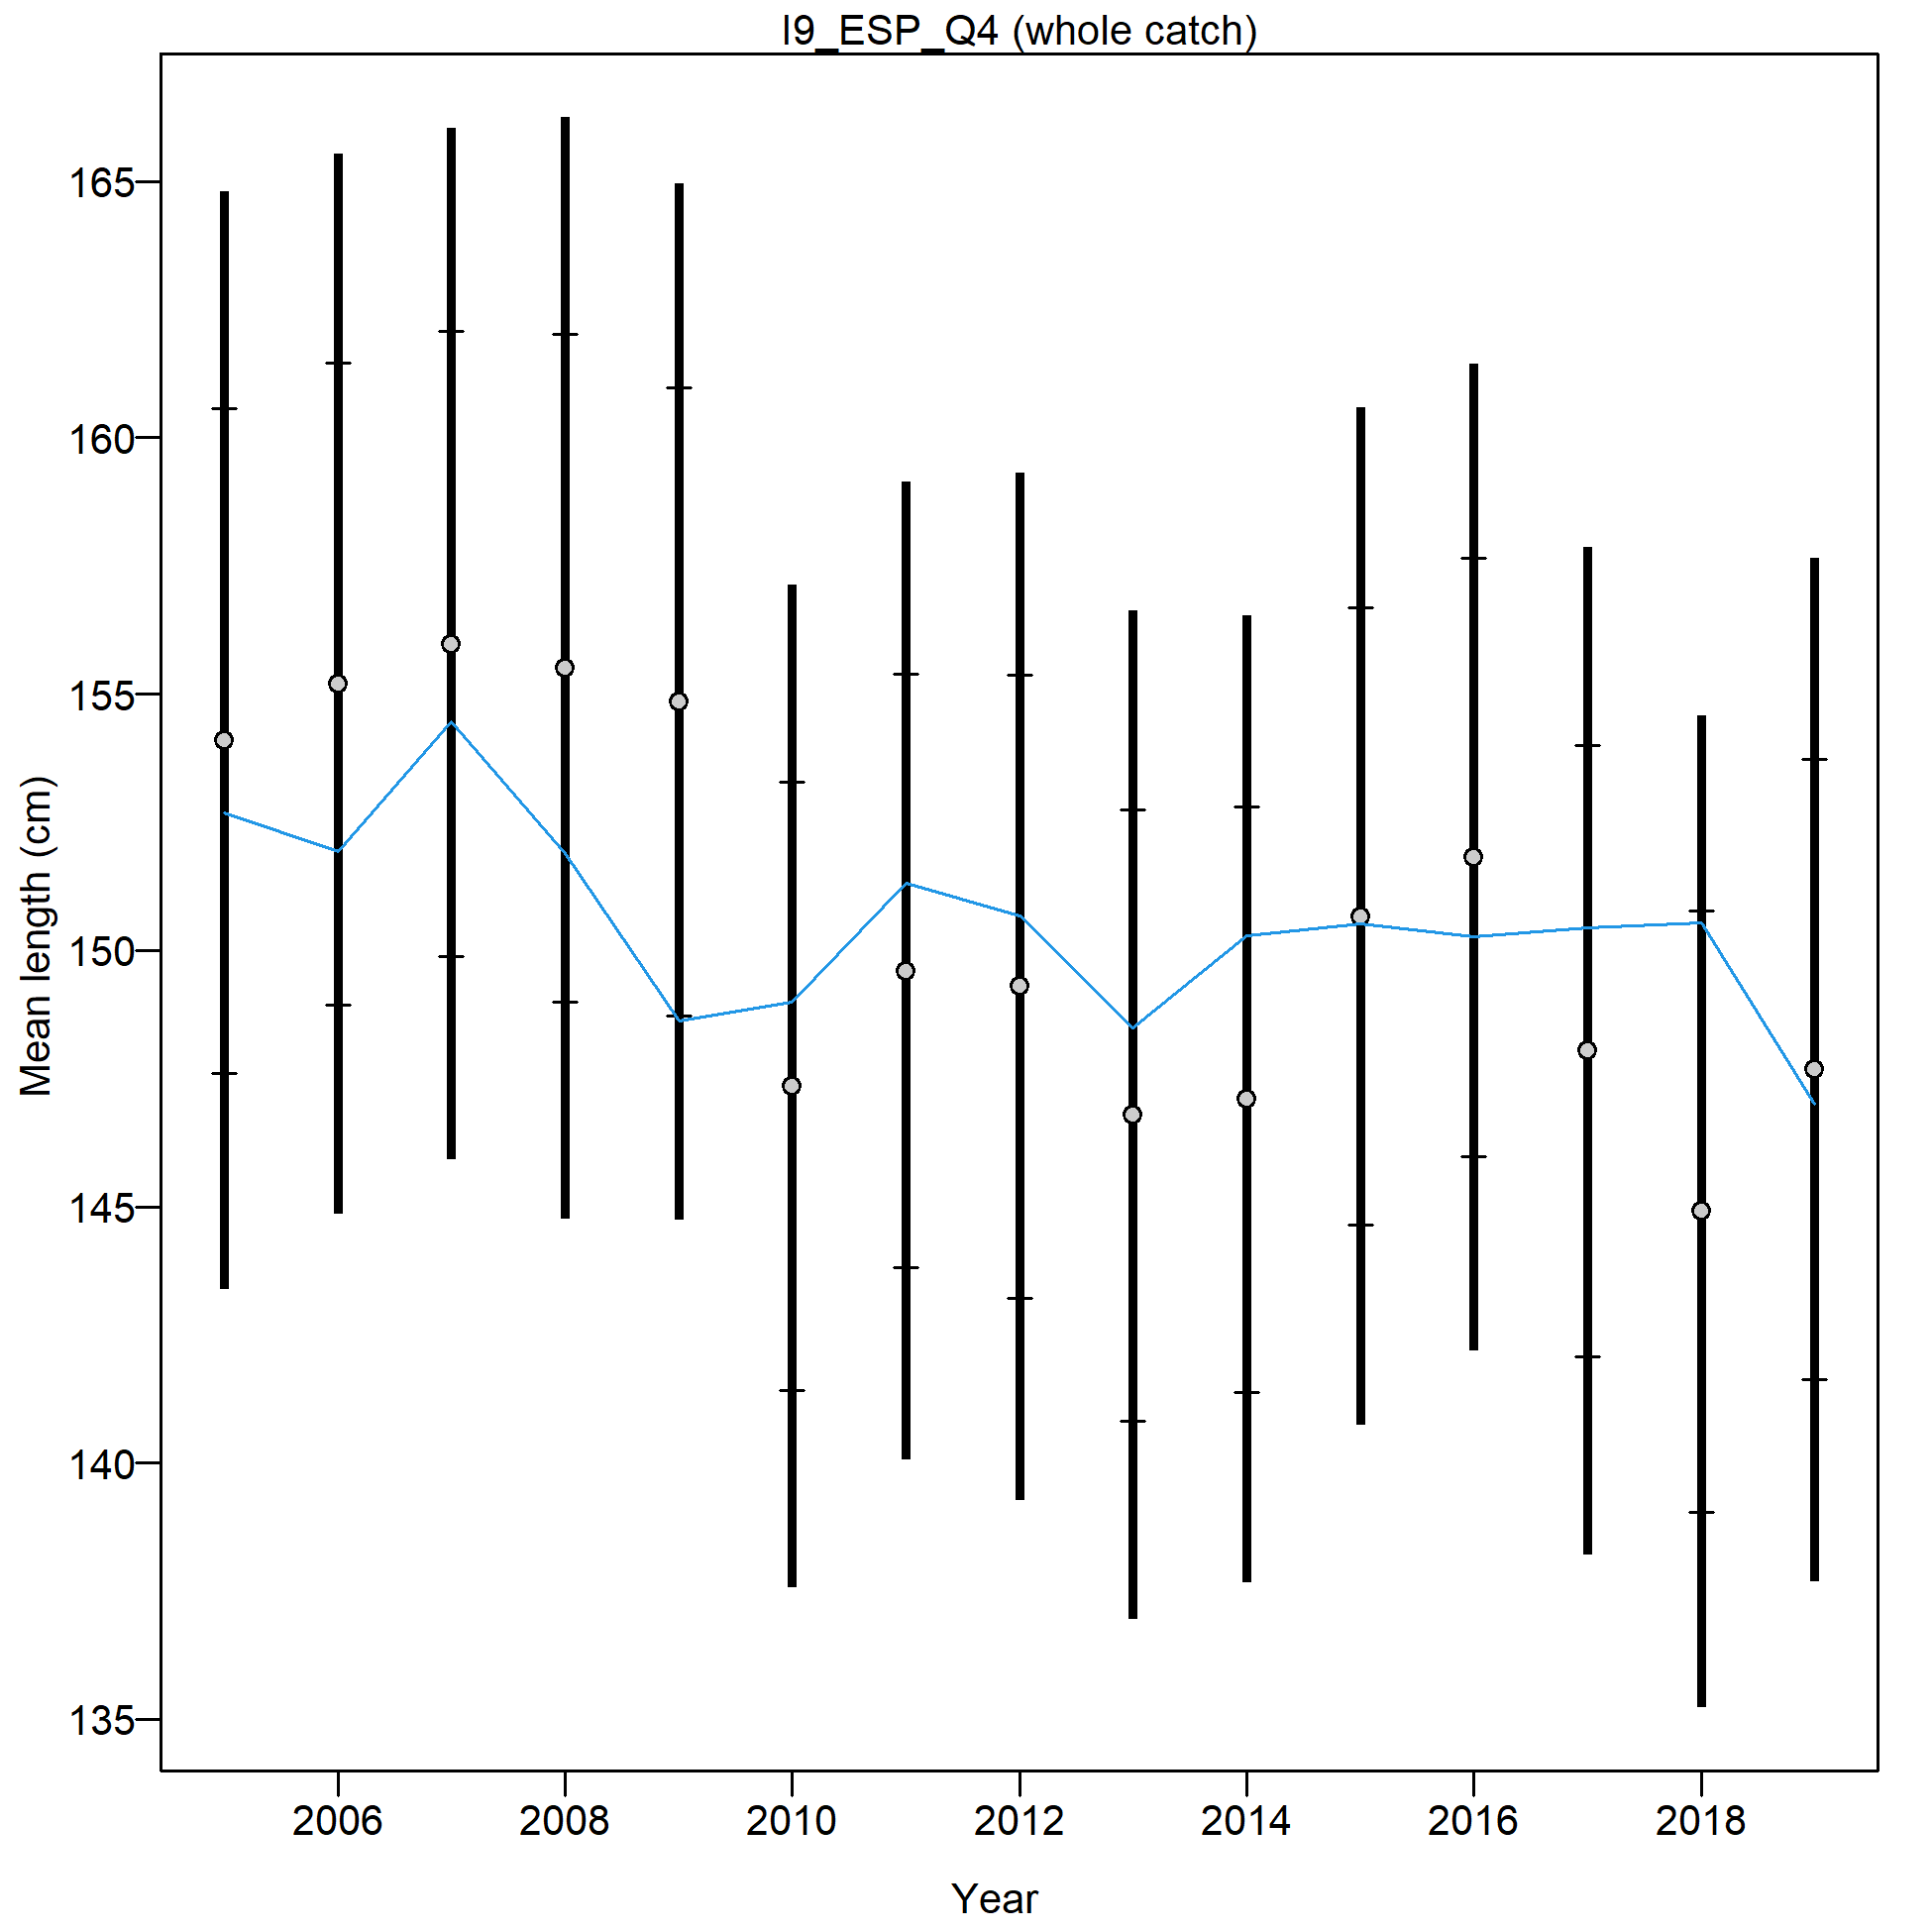
Mean length for I9_ESP_Q4 with 95% confidence intervals based on current samples sizes.
Francis data weighting method TA1.8: thinner intervals (with capped ends) show result of further adjusting sample sizes based on suggested multiplier (with 95% interval) for len data from I9_ESP_Q4:
139.1251 (85.6434-371.4313)
For more info, see
Francis, R.I.C.C. (2011). Data weighting in statistical fisheries stock assessment models. Can. J. Fish. Aquat. Sci. 68: 1124-1138. https://doi.org/10.1139/f2011-025
Ghost length comps, whole catch, F10_LL_DW_A2.
'N adj.' is the input sample size after data-weighting adjustment. N eff. is the calculated effective sample size used in the McAllister-Ianelli tuning method.
file: comp_gstlenfit_flt10mkt0.png

Pearson residuals, whole catch, F10_LL_DW_A2 (max=NA)
Closed bubbles are positive residuals (observed > expected) and open bubbles are negative residuals (observed < expected).
file: comp_gstlenfit_residsflt10mkt0.png
Ghost length comps, whole catch, I5_JPN_late.
'N adj.' is the input sample size after data-weighting adjustment. N eff. is the calculated effective sample size used in the McAllister-Ianelli tuning method.
file: comp_gstlenfit_flt26mkt0.png

Pearson residuals, whole catch, I5_JPN_late (max=NA)
Closed bubbles are positive residuals (observed > expected) and open bubbles are negative residuals (observed < expected).
file: comp_gstlenfit_residsflt26mkt0.png
Ghost length comps, whole catch, I6_ESP_Q1.
'N adj.' is the input sample size after data-weighting adjustment. N eff. is the calculated effective sample size used in the McAllister-Ianelli tuning method.
file: comp_gstlenfit_flt27mkt0.png

Pearson residuals, whole catch, I6_ESP_Q1 (max=NA)
Closed bubbles are positive residuals (observed > expected) and open bubbles are negative residuals (observed < expected).
file: comp_gstlenfit_residsflt27mkt0.png
Ghost length comps, whole catch, I7_ESP_Q2.
'N adj.' is the input sample size after data-weighting adjustment. N eff. is the calculated effective sample size used in the McAllister-Ianelli tuning method.
file: comp_gstlenfit_flt28mkt0.png

Pearson residuals, whole catch, I7_ESP_Q2 (max=NA)
Closed bubbles are positive residuals (observed > expected) and open bubbles are negative residuals (observed < expected).
file: comp_gstlenfit_residsflt28mkt0.png

Ghost length comps, whole catch, I8_ESP_Q3.
'N adj.' is the input sample size after data-weighting adjustment. N eff. is the calculated effective sample size used in the McAllister-Ianelli tuning method.
file: comp_gstlenfit_flt29mkt0.png

Pearson residuals, whole catch, I8_ESP_Q3 (max=NA)
Closed bubbles are positive residuals (observed > expected) and open bubbles are negative residuals (observed < expected).
file: comp_gstlenfit_residsflt29mkt0.png
Ghost length comps, whole catch, I9_ESP_Q4.
'N adj.' is the input sample size after data-weighting adjustment. N eff. is the calculated effective sample size used in the McAllister-Ianelli tuning method.
file: comp_gstlenfit_flt30mkt0.png

Pearson residuals, whole catch, I9_ESP_Q4 (max=NA)
Closed bubbles are positive residuals (observed > expected) and open bubbles are negative residuals (observed < expected).
file: comp_gstlenfit_residsflt30mkt0.png
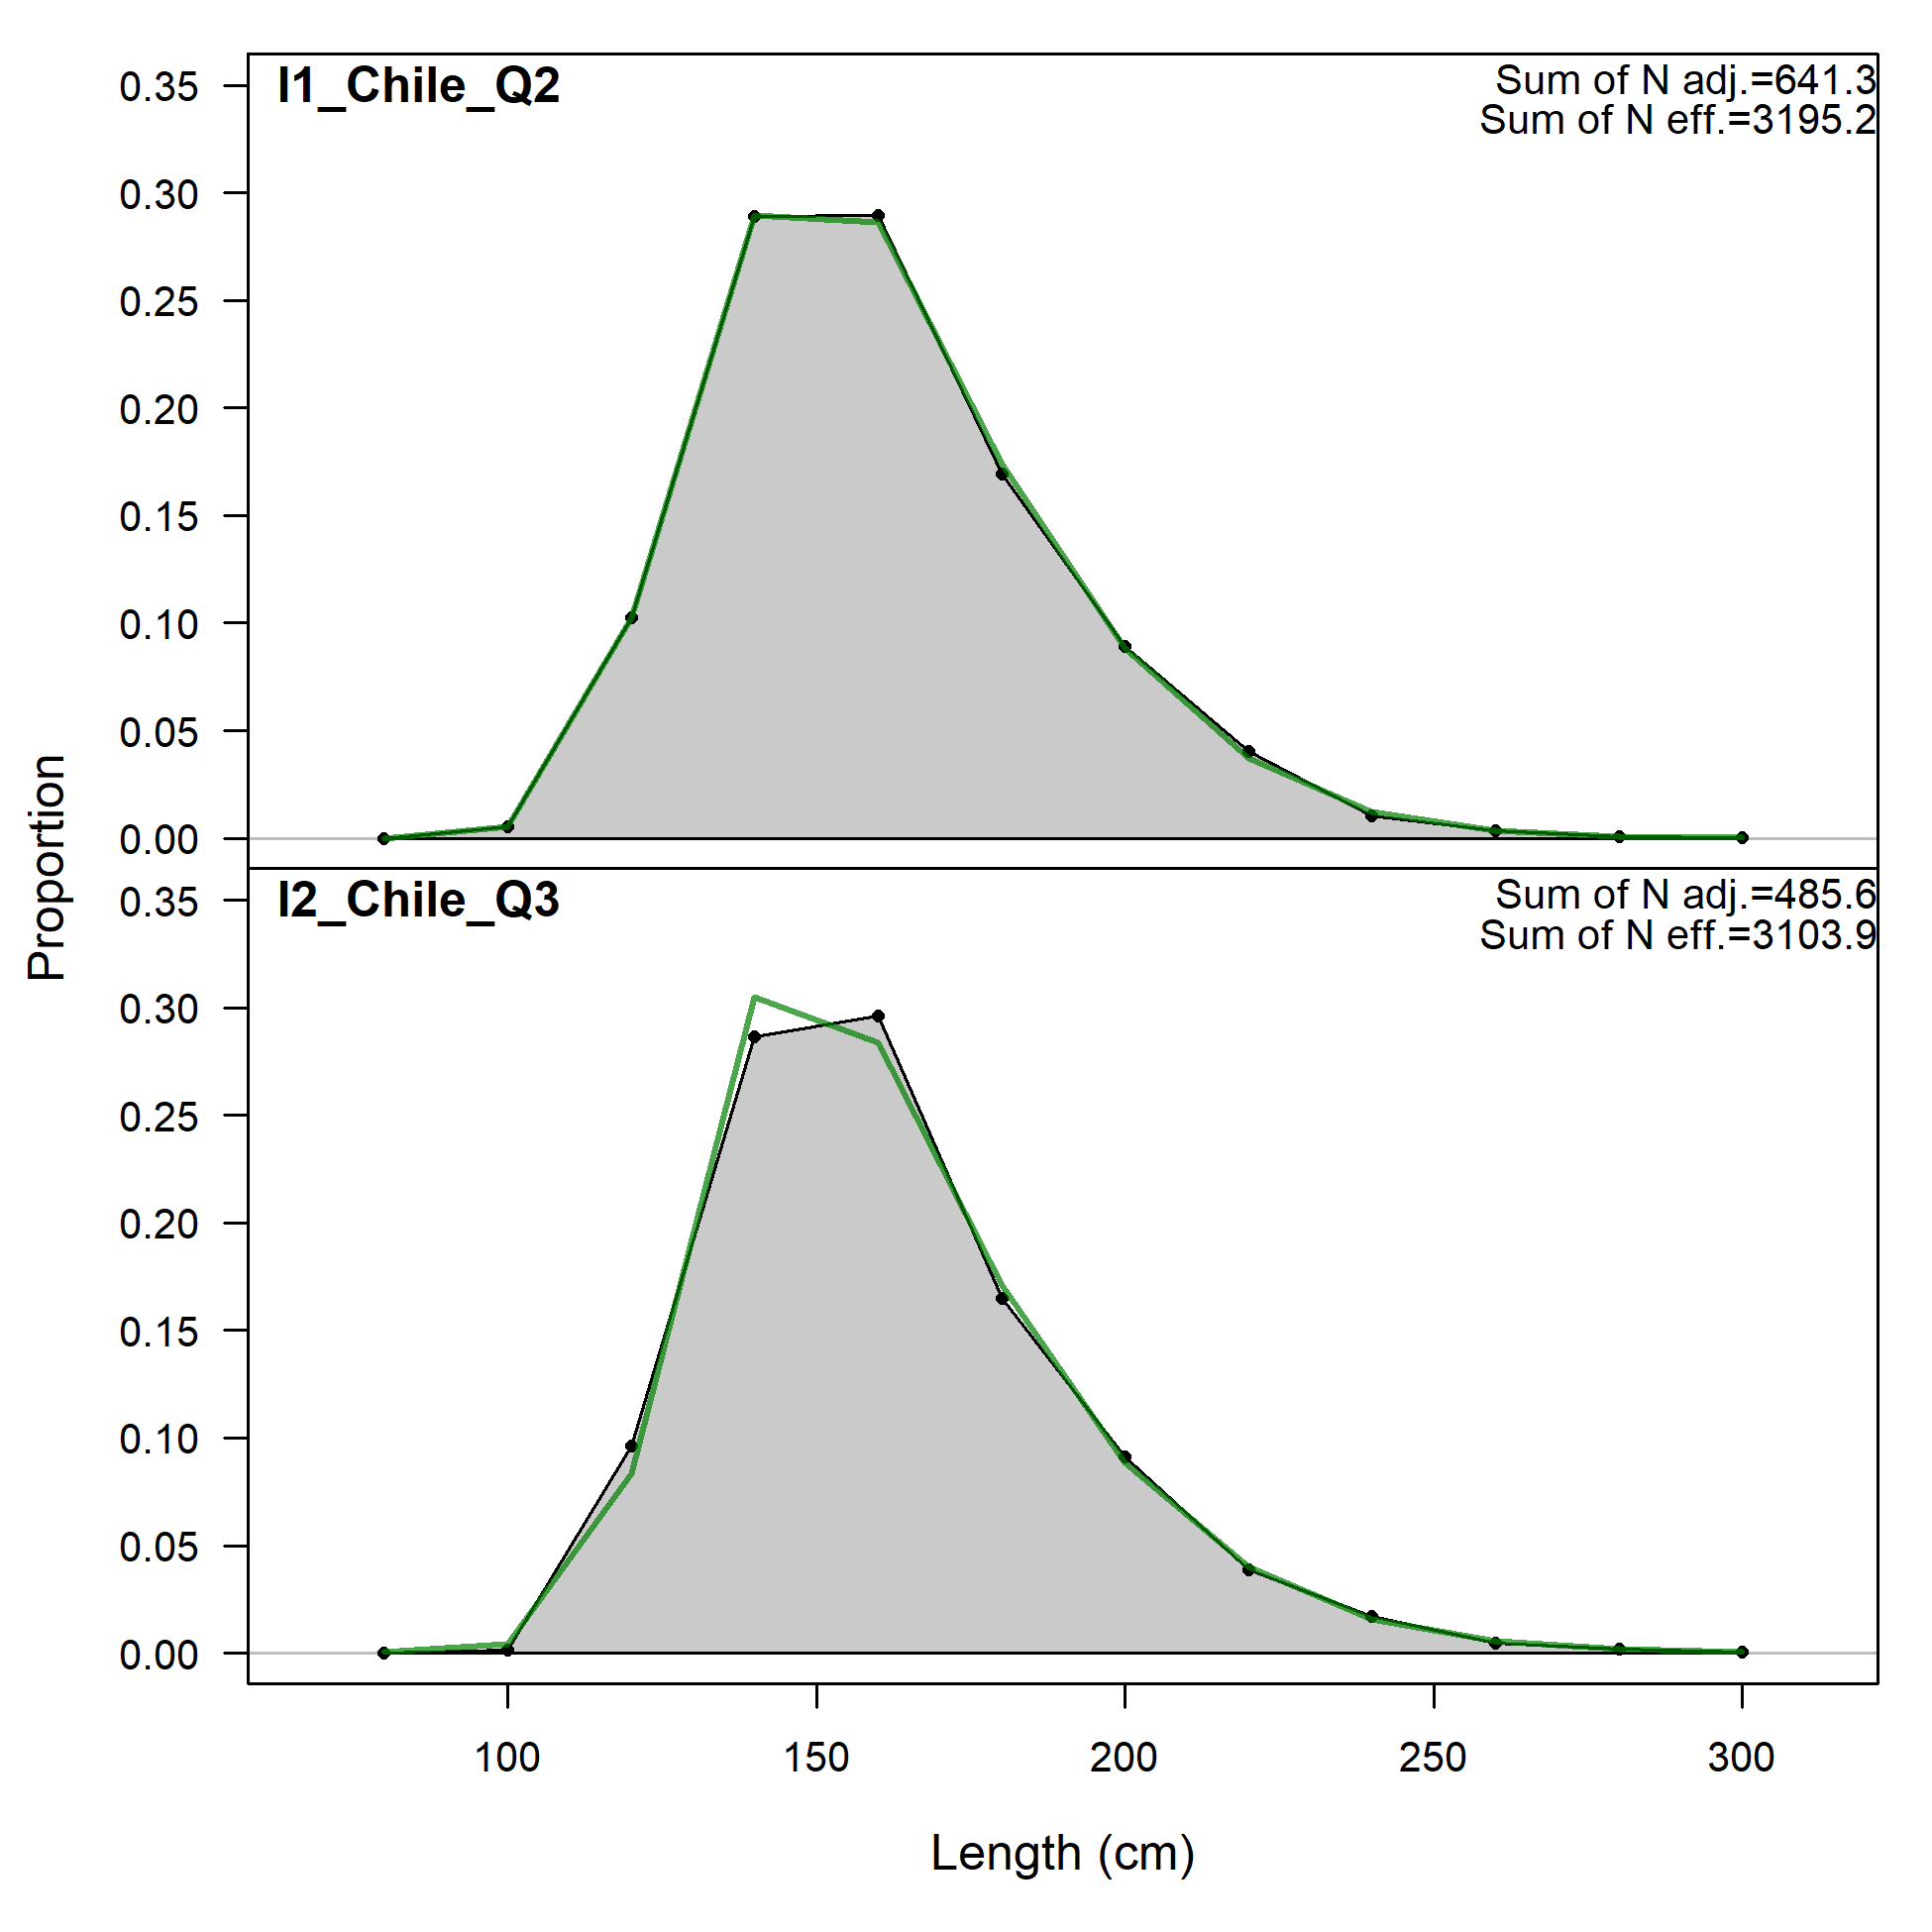
Size comps, size method 1, aggregated across time by fleet.
Labels 'retained' and 'discard' indicate discarded or retained sampled for each fleet. Panels without this designation represent the whole catch.
file: comp_sizefit_method1__aggregated_across_time.png
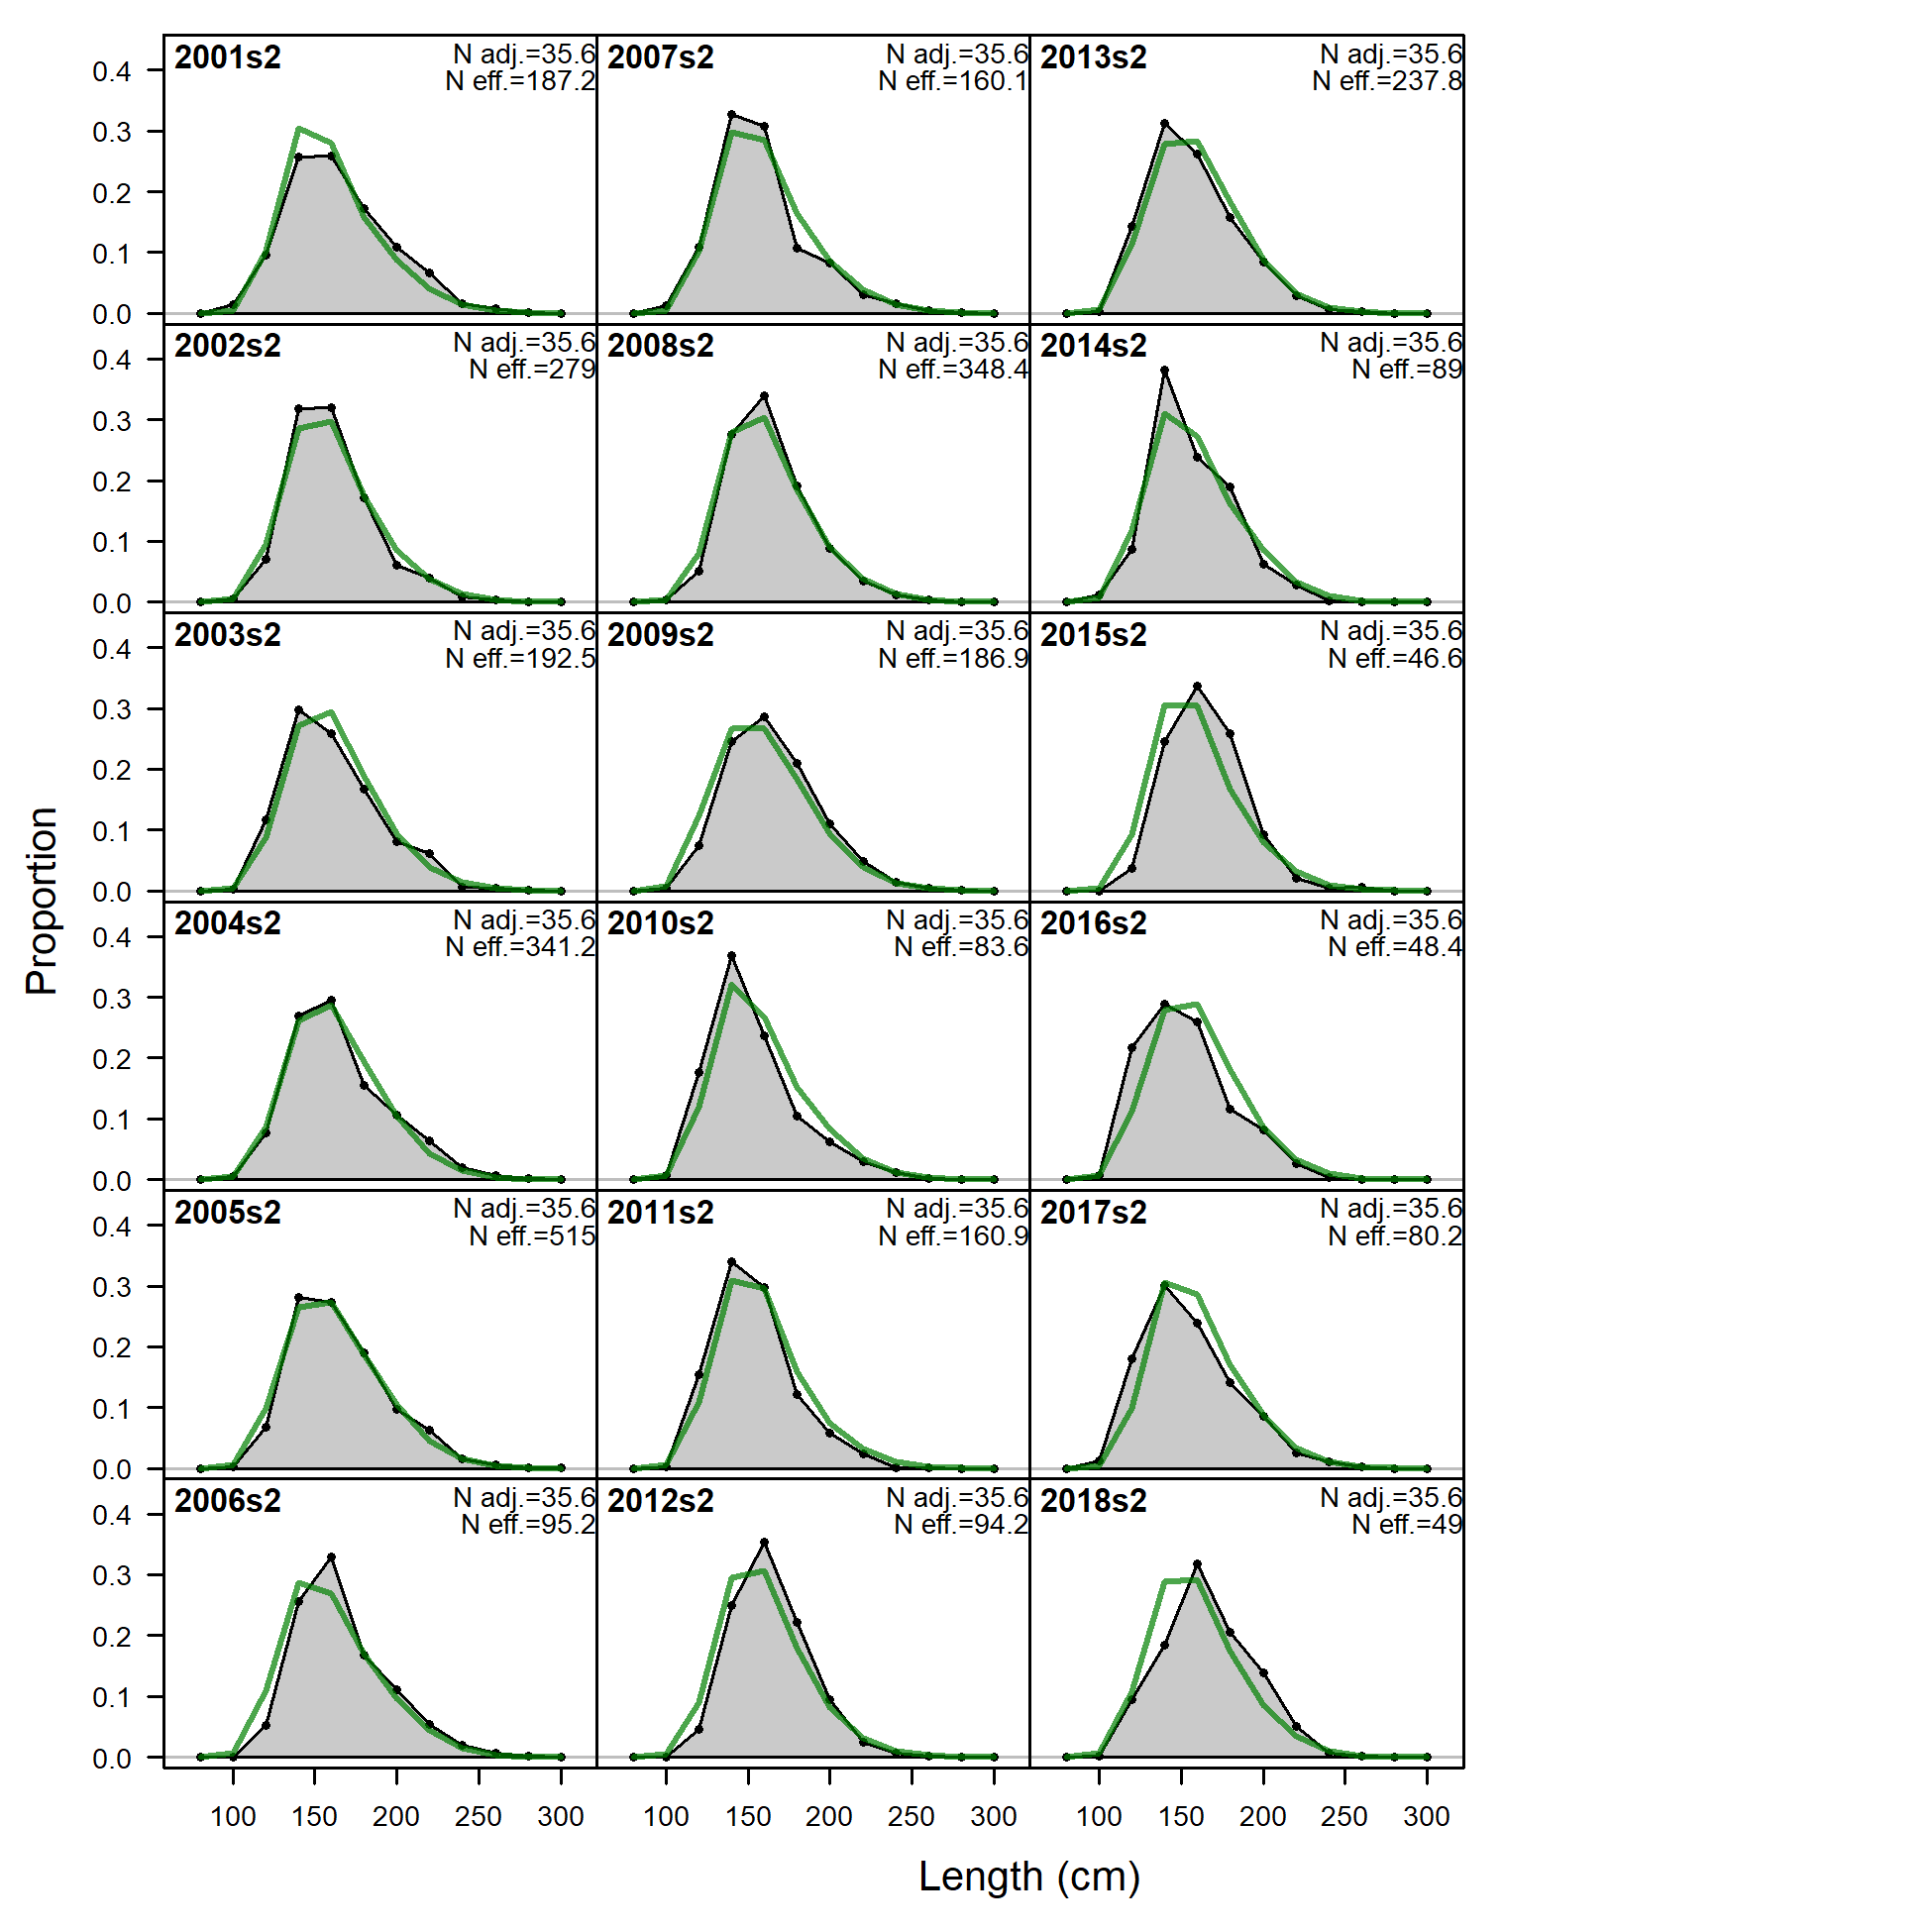
Size comps, size method 1, whole catch, I1_Chile_Q2.
'N adj.' is the input sample size after data-weighting adjustment. N eff. is the calculated effective sample size used in the McAllister-Ianelli tuning method.
file: comp_sizefit_method1_flt22mkt0.png
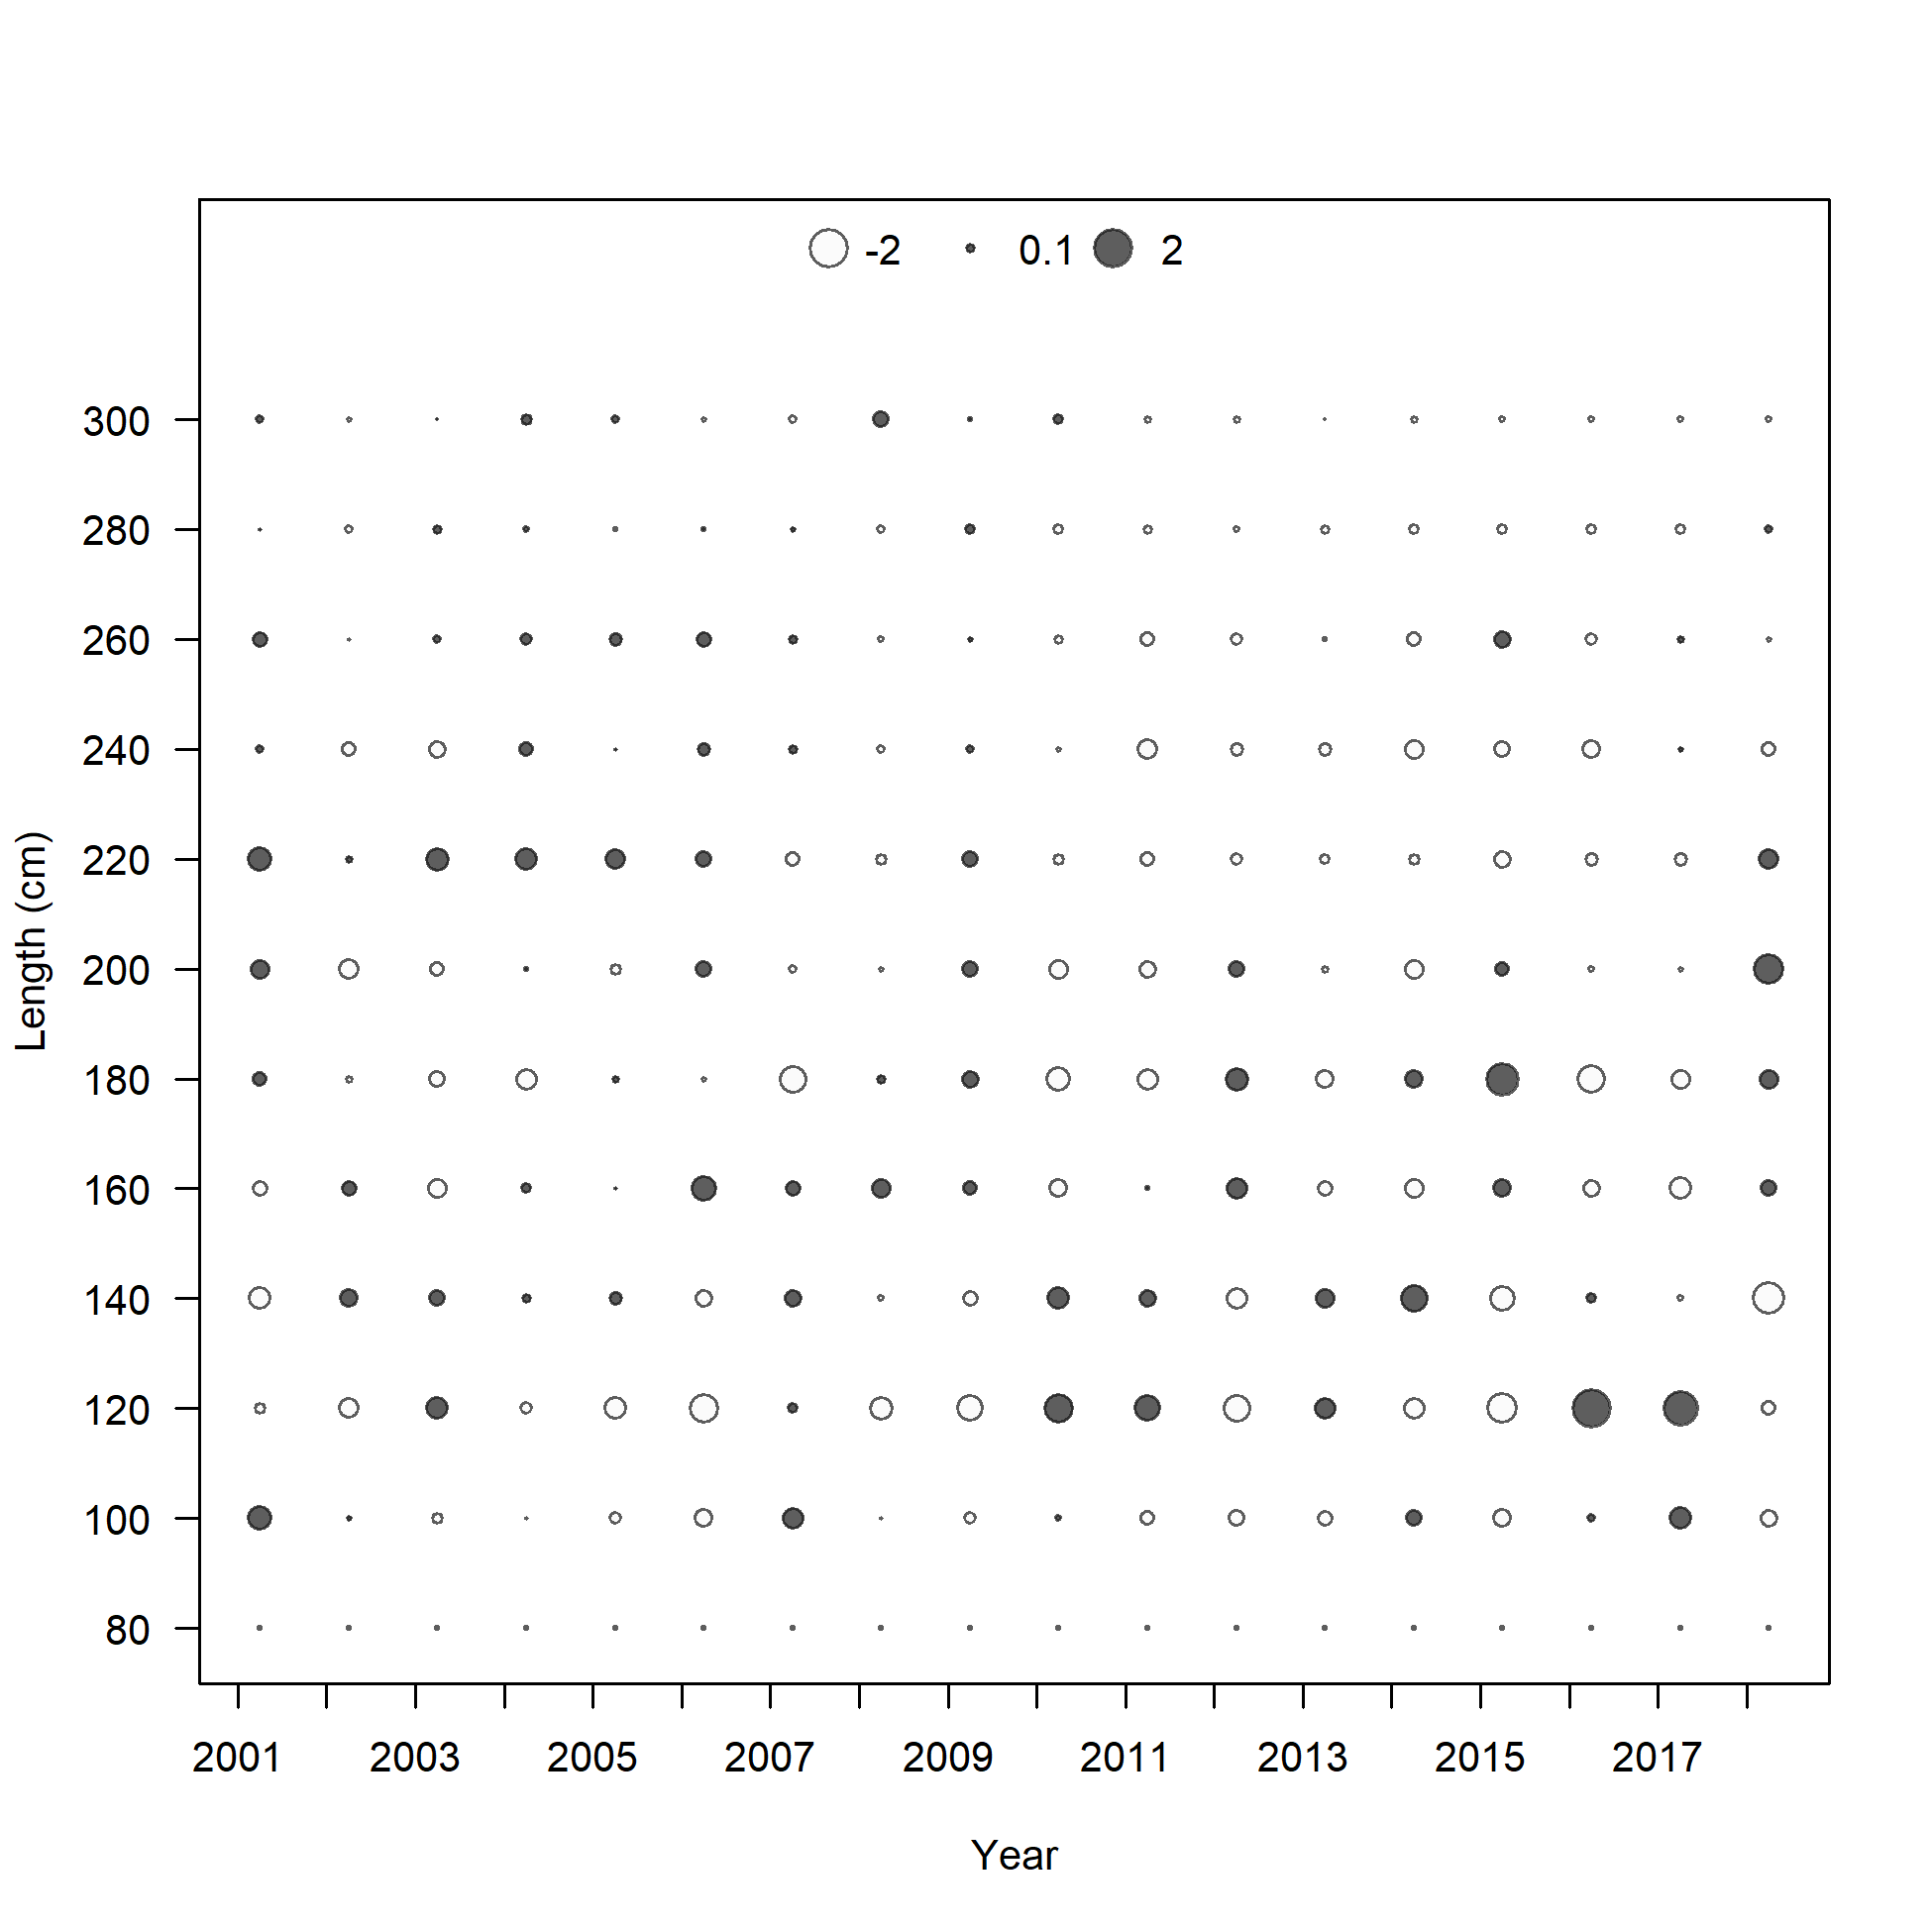
Pearson residuals, whole catch, I1_Chile_Q2 (max=1.96)
Closed bubbles are positive residuals (observed > expected) and open bubbles are negative residuals (observed < expected).
file: comp_sizefit_method1_residsflt22mkt0.png

N-EffN comparison, Size comps, size method 1, whole catch, I1_Chile_Q2
file: comp_sizefit_method1_sampsize_flt22mkt0.png
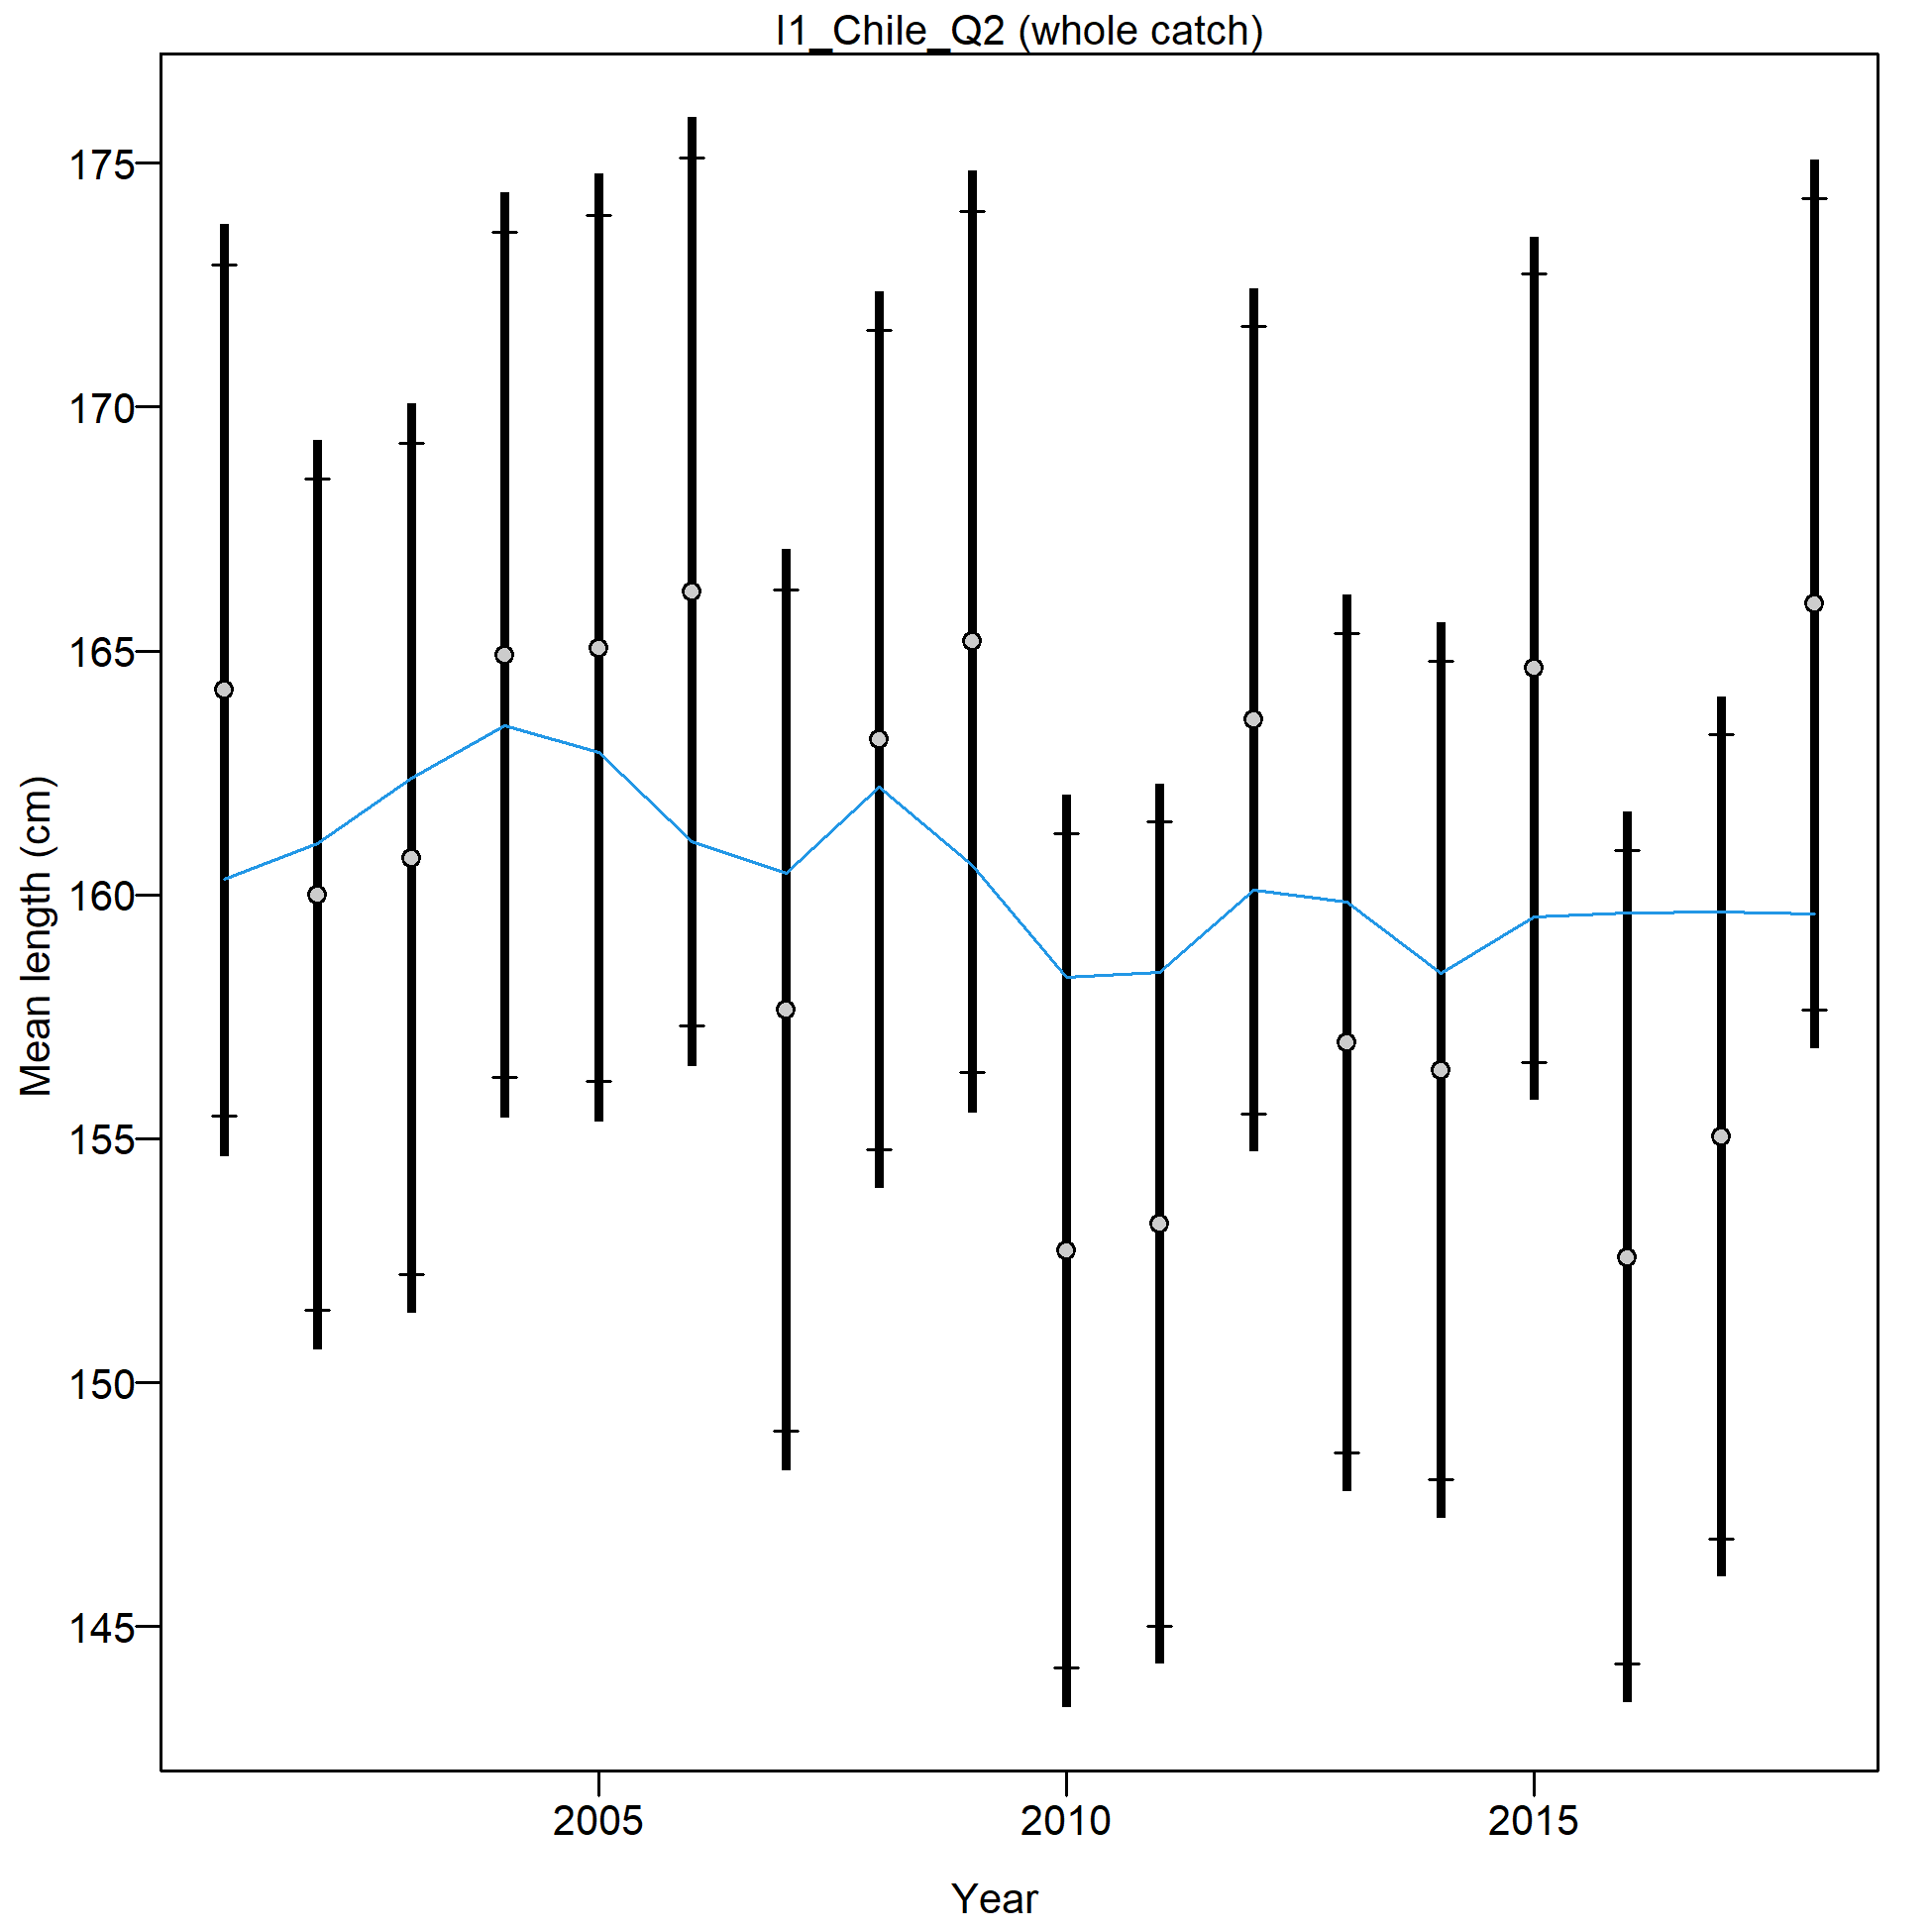
Mean size for I1_Chile_Q2 with 95% confidence intervals based on current samples sizes.
Francis data weighting method TA1.8: thinner intervals (with capped ends) show result of further adjusting sample sizes based on suggested multiplier (with 95% interval) for size data from I1_Chile_Q2:
1.1977 (0.899-2.1756)
For more info, see
Francis, R.I.C.C. (2011). Data weighting in statistical fisheries stock assessment models. Can. J. Fish. Aquat. Sci. 68: 1124-1138. https://doi.org/10.1139/f2011-025
Size comps, size method 1, whole catch, I2_Chile_Q3.
'N adj.' is the input sample size after data-weighting adjustment. N eff. is the calculated effective sample size used in the McAllister-Ianelli tuning method.
file: comp_sizefit_method1_flt23mkt0.png
Pearson residuals, whole catch, I2_Chile_Q3 (max=2.28)
Closed bubbles are positive residuals (observed > expected) and open bubbles are negative residuals (observed < expected).
file: comp_sizefit_method1_residsflt23mkt0.png
N-EffN comparison, Size comps, size method 1, whole catch, I2_Chile_Q3
file: comp_sizefit_method1_sampsize_flt23mkt0.png
Mean size for I2_Chile_Q3 with 95% confidence intervals based on current samples sizes.
Francis data weighting method TA1.8: thinner intervals (with capped ends) show result of further adjusting sample sizes based on suggested multiplier (with 95% interval) for size data from I2_Chile_Q3:
0.7763 (0.4744-2.2085)
For more info, see
Francis, R.I.C.C. (2011). Data weighting in statistical fisheries stock assessment models. Can. J. Fish. Aquat. Sci. 68: 1124-1138. https://doi.org/10.1139/f2011-025
Size comps, size method 2, aggregated across time by fleet.
Labels 'retained' and 'discard' indicate discarded or retained sampled for each fleet. Panels without this designation represent the whole catch.
file: comp_sizefit_method2__aggregated_across_time.png
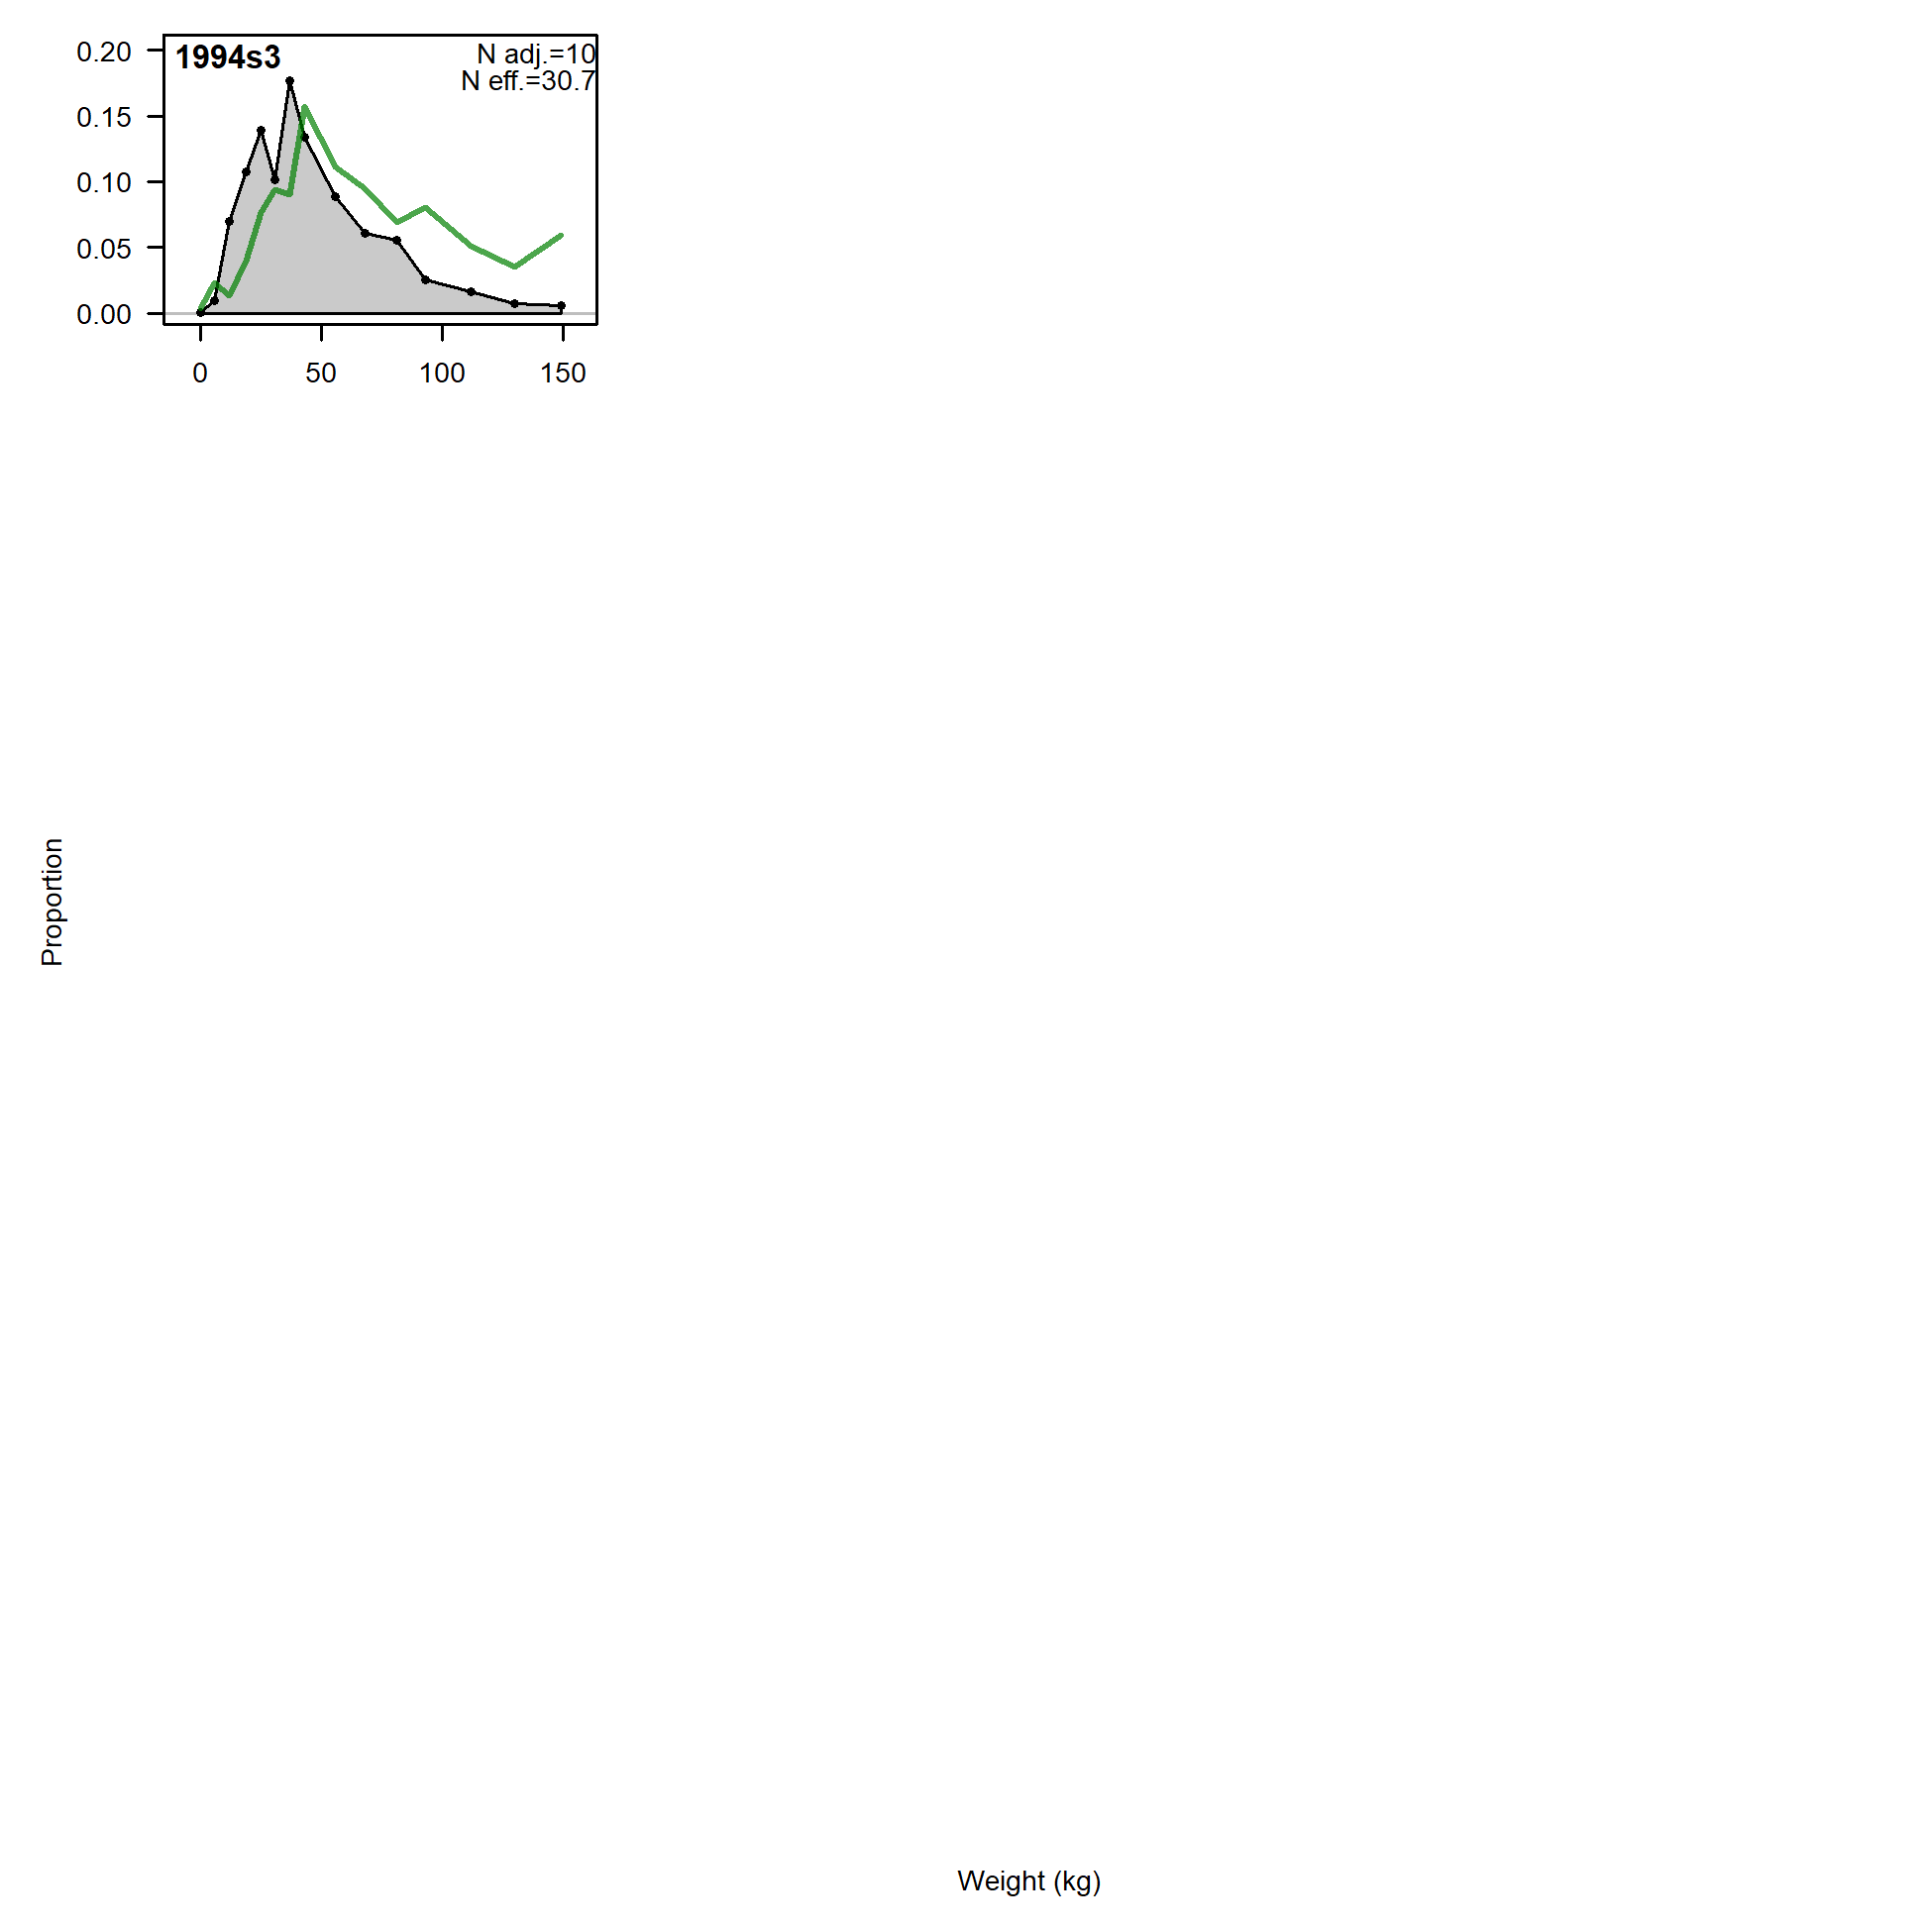
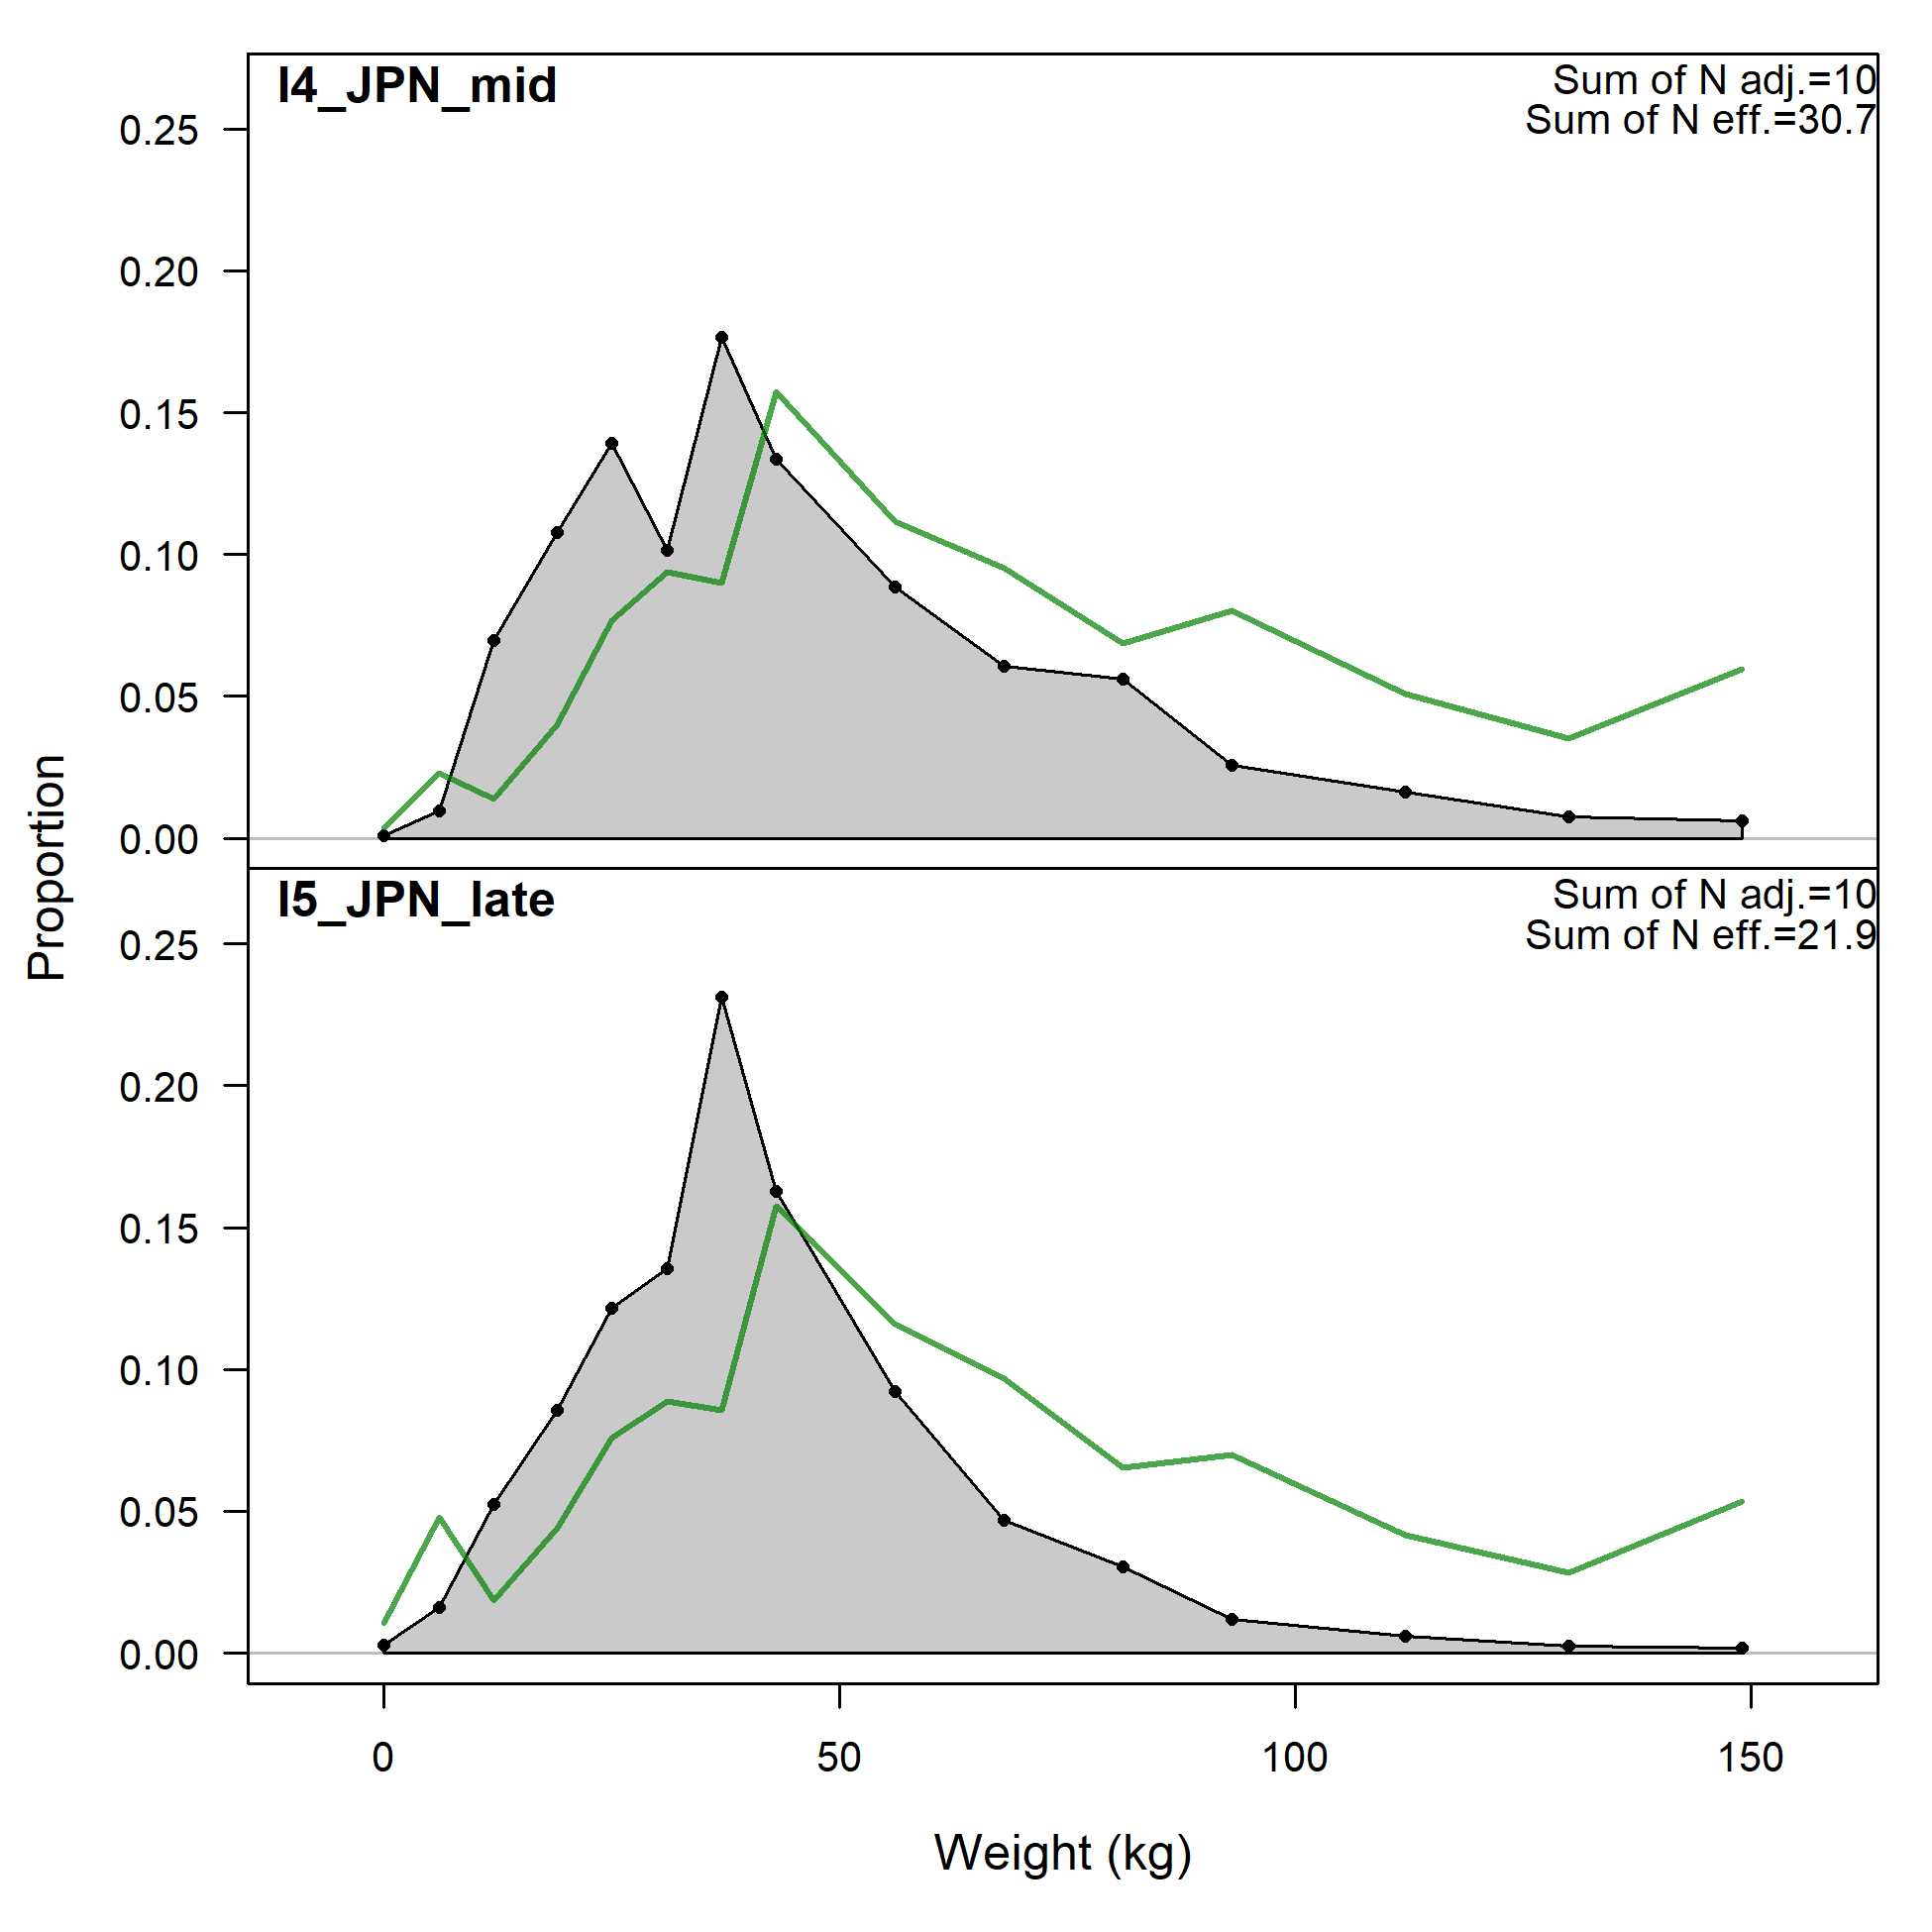
Size comps, size method 2, whole catch, I4_JPN_mid.
'N adj.' is the input sample size after data-weighting adjustment. N eff. is the calculated effective sample size used in the McAllister-Ianelli tuning method.
file: comp_sizefit_method2_flt25mkt0.png
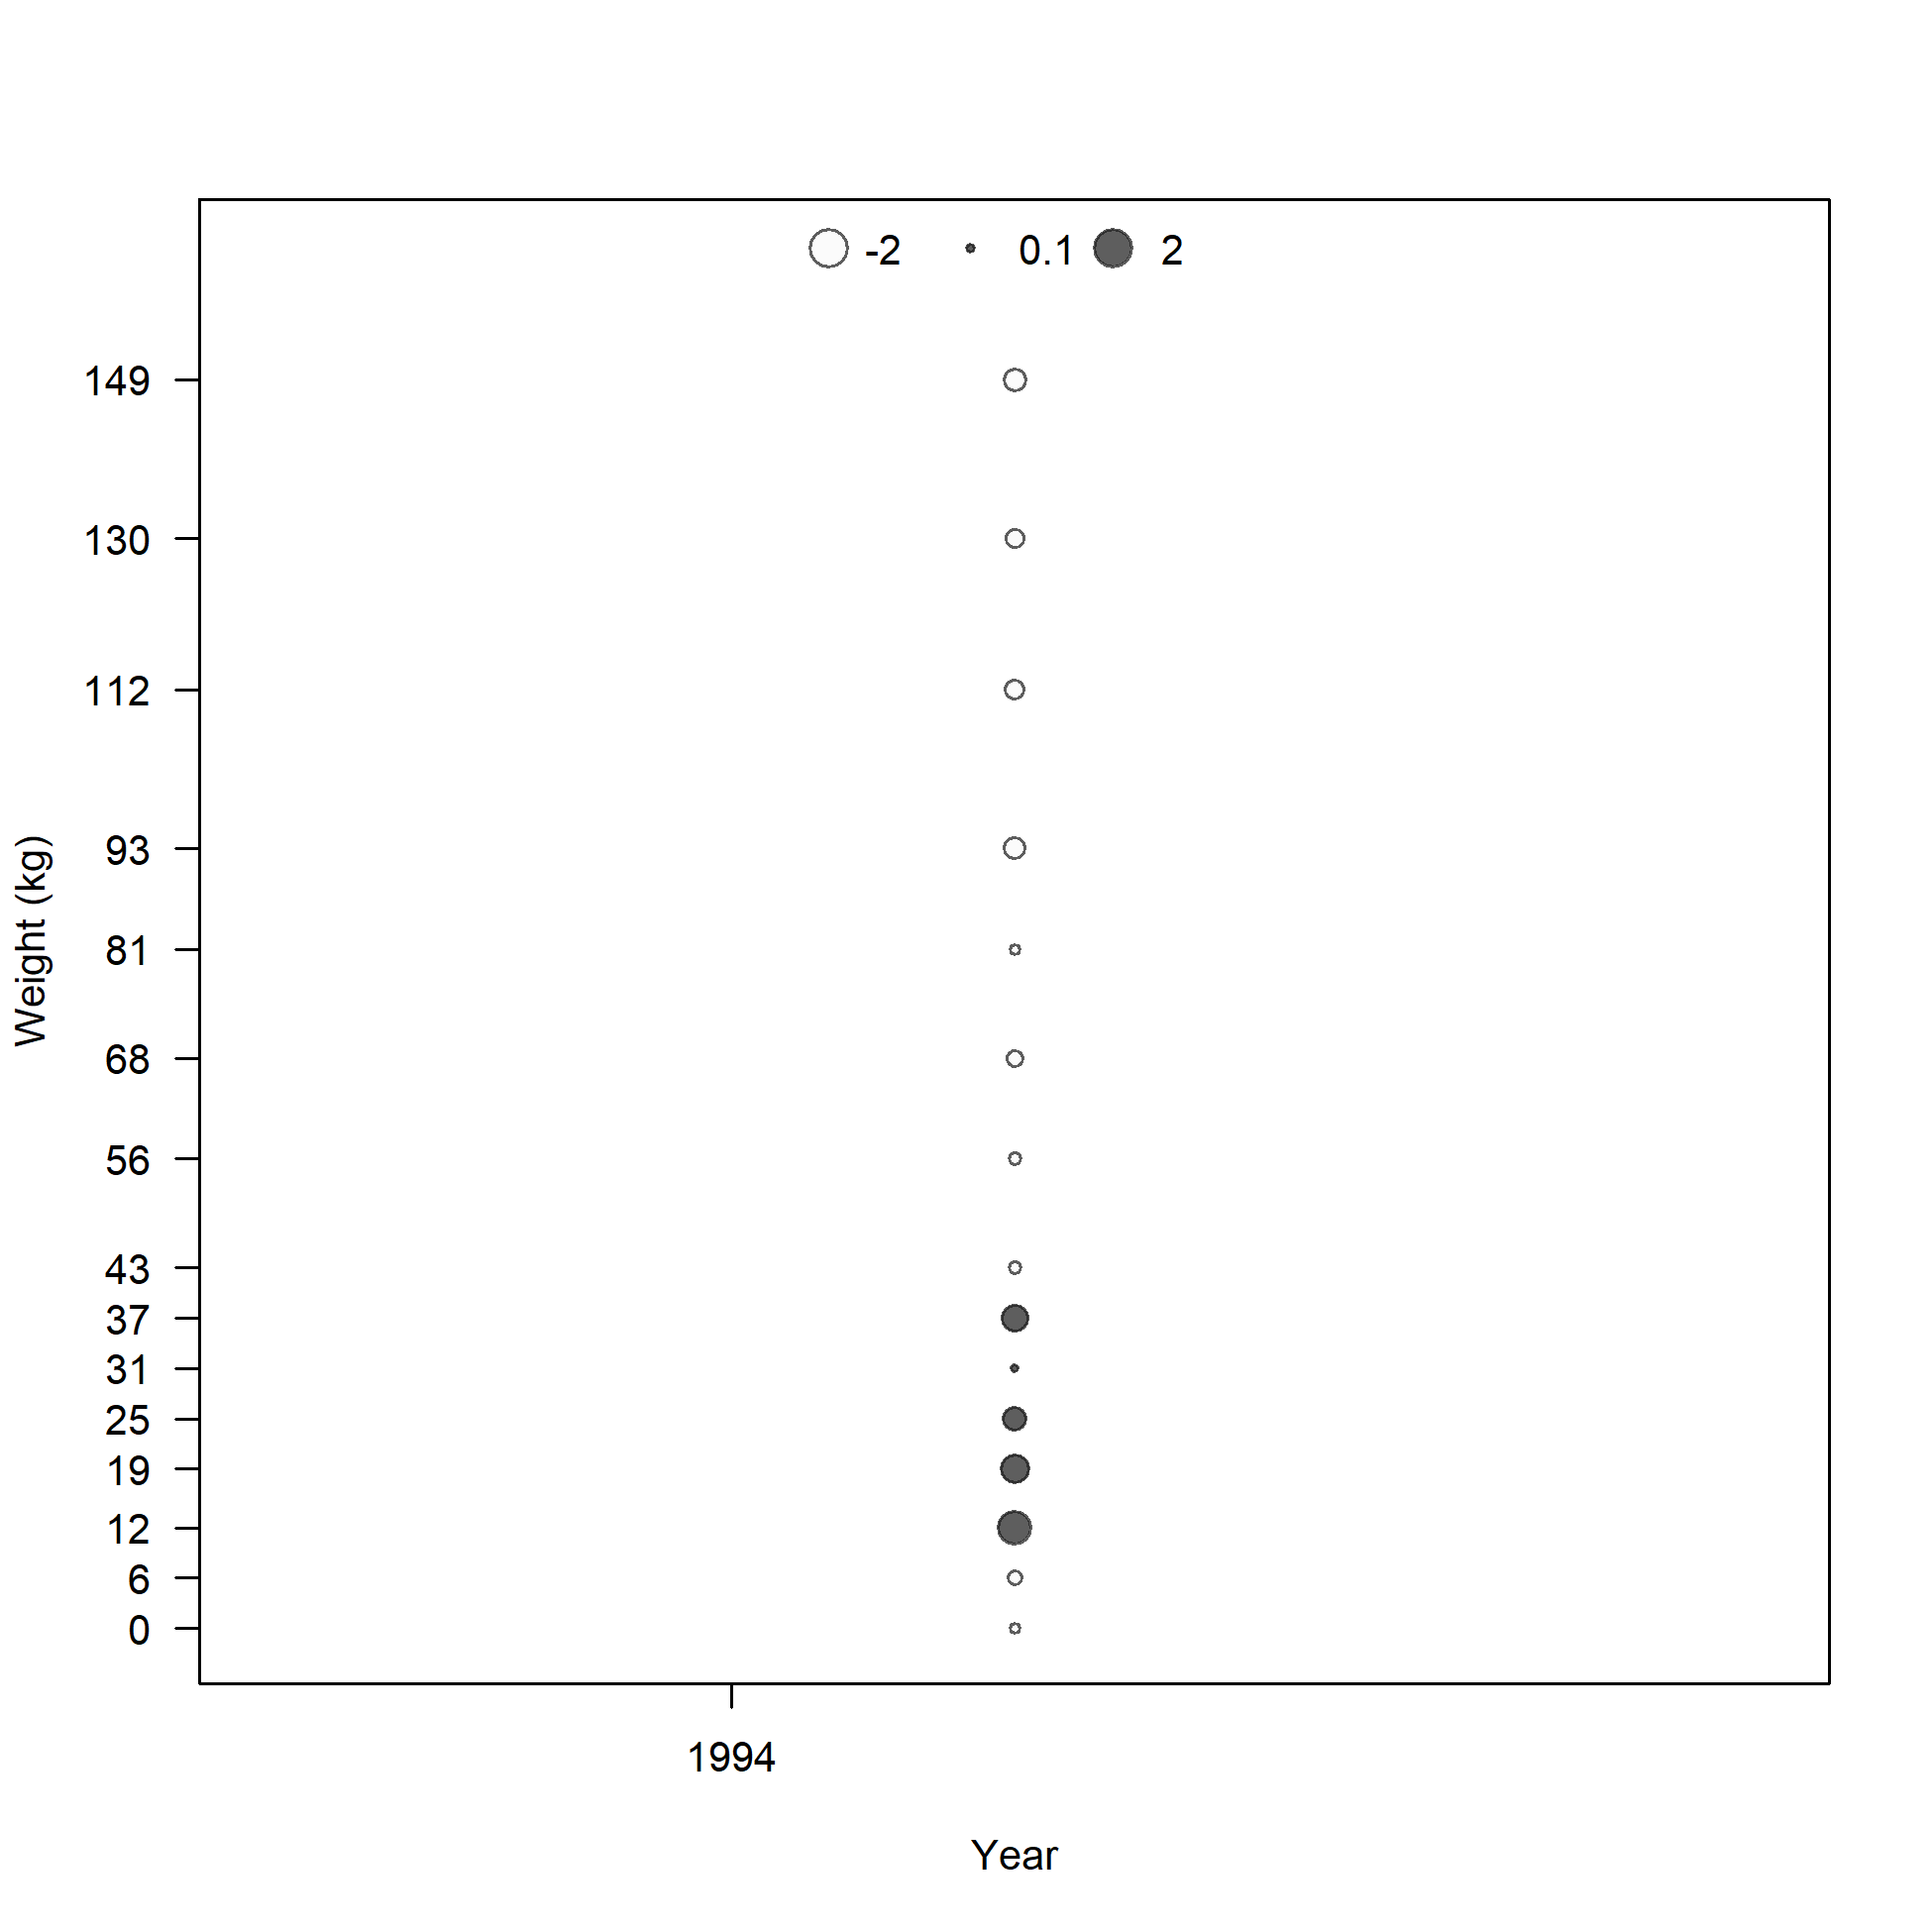
Pearson residuals, whole catch, I4_JPN_mid (max=1.52)
Closed bubbles are positive residuals (observed > expected) and open bubbles are negative residuals (observed < expected).
file: comp_sizefit_method2_residsflt25mkt0.png
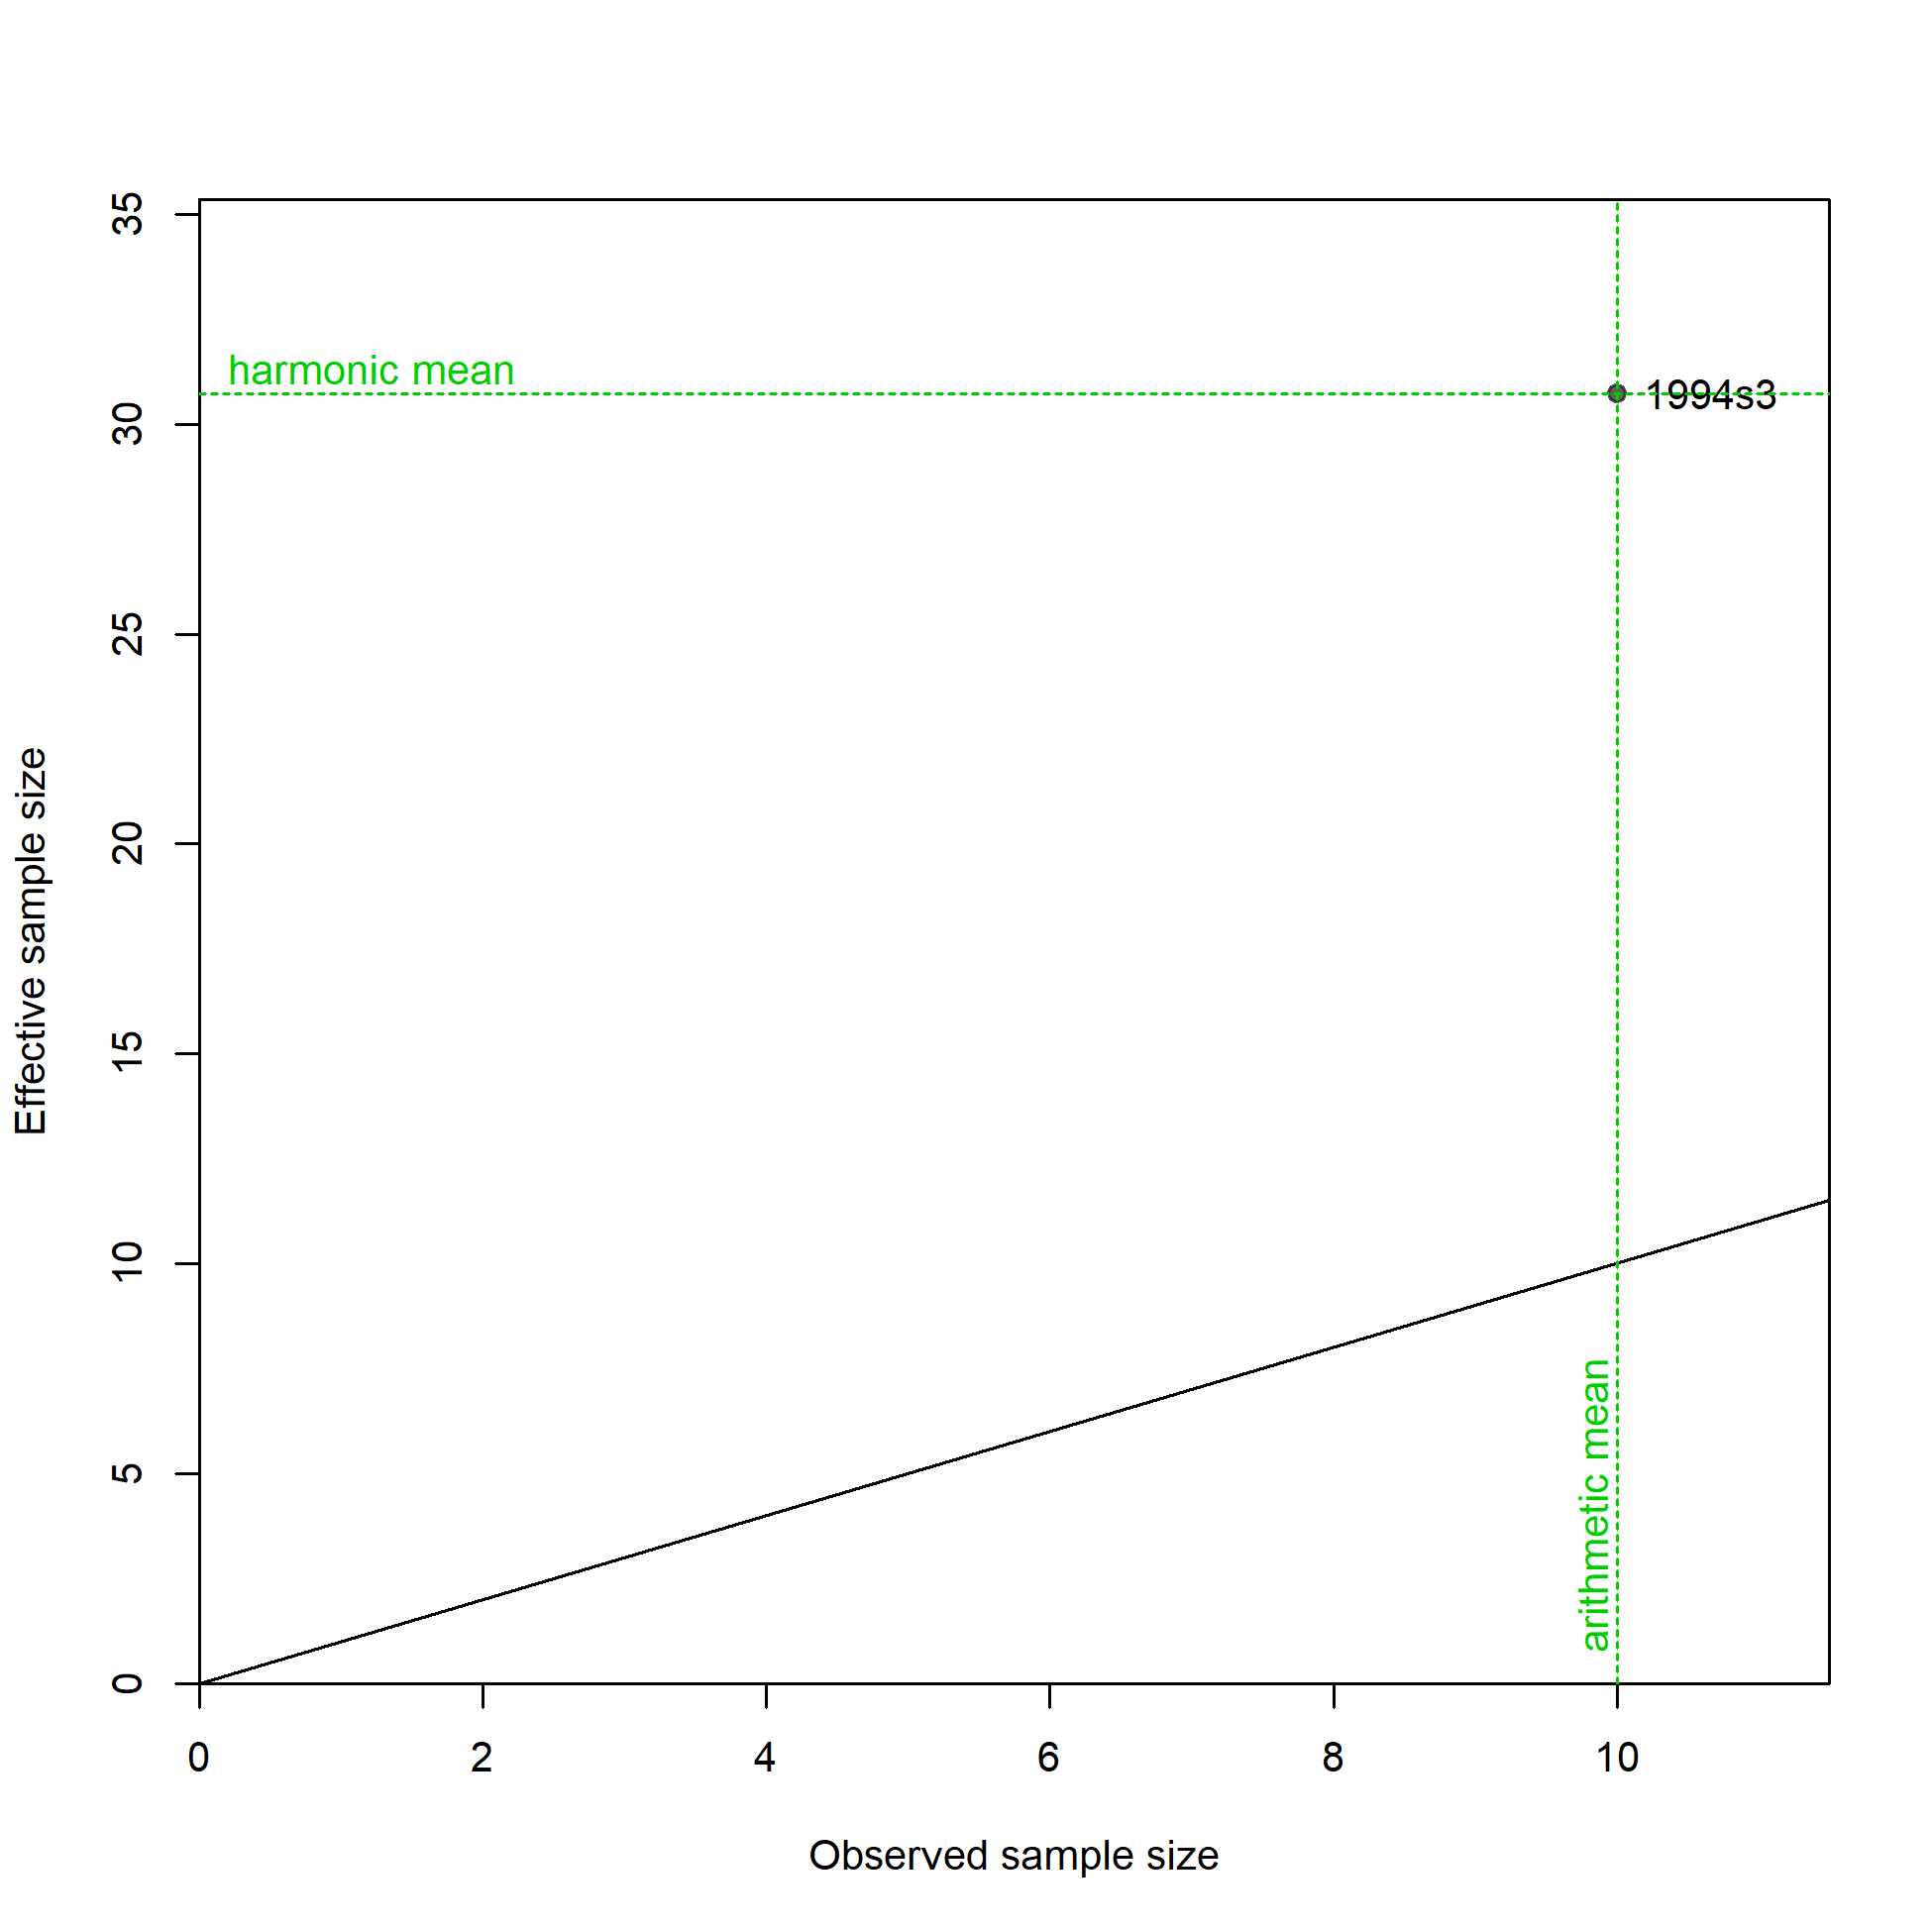
N-EffN comparison, Size comps, size method 2, whole catch, I4_JPN_mid
file: comp_sizefit_method2_sampsize_flt25mkt0.png

Mean size for I4_JPN_mid with 95% confidence intervals based on current samples sizes.
Francis data weighting method TA1.8: too few points to calculate adjustments.
For more info, see
Francis, R.I.C.C. (2011). Data weighting in statistical fisheries stock assessment models. Can. J. Fish. Aquat. Sci. 68: 1124-1138. https://doi.org/10.1139/f2011-025
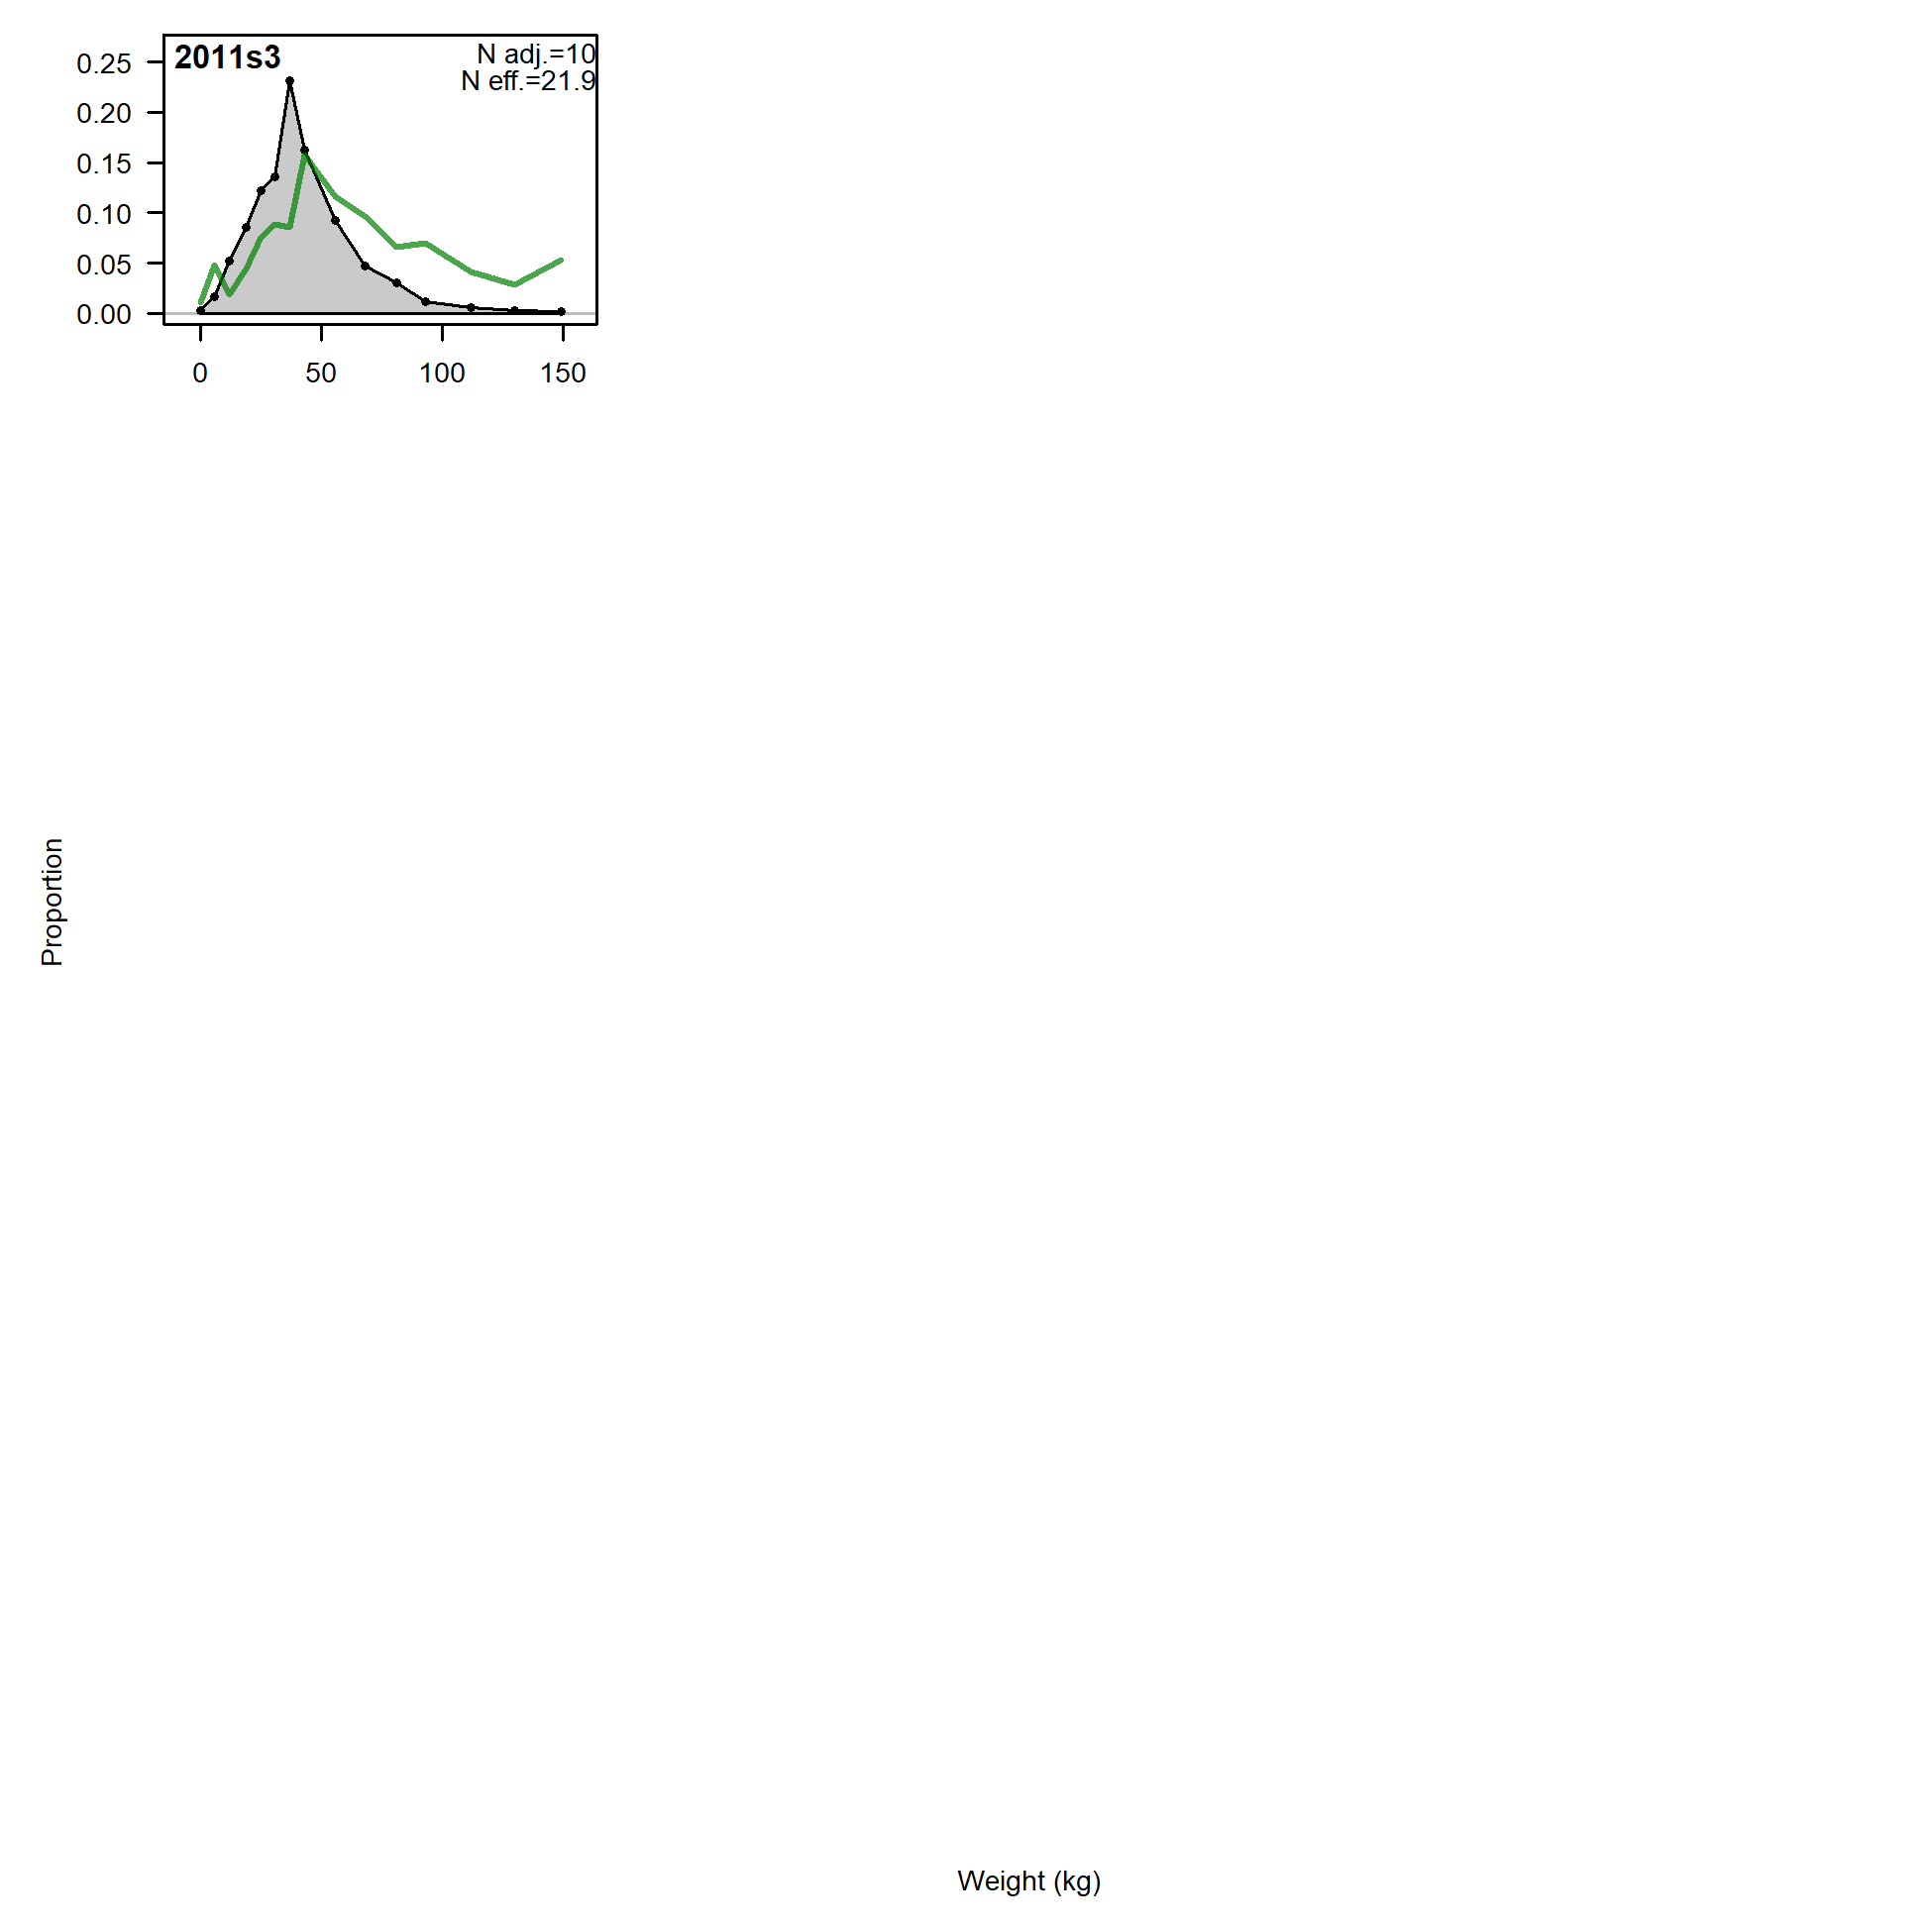
Size comps, size method 2, whole catch, I5_JPN_late.
'N adj.' is the input sample size after data-weighting adjustment. N eff. is the calculated effective sample size used in the McAllister-Ianelli tuning method.
file: comp_sizefit_method2_flt26mkt0.png
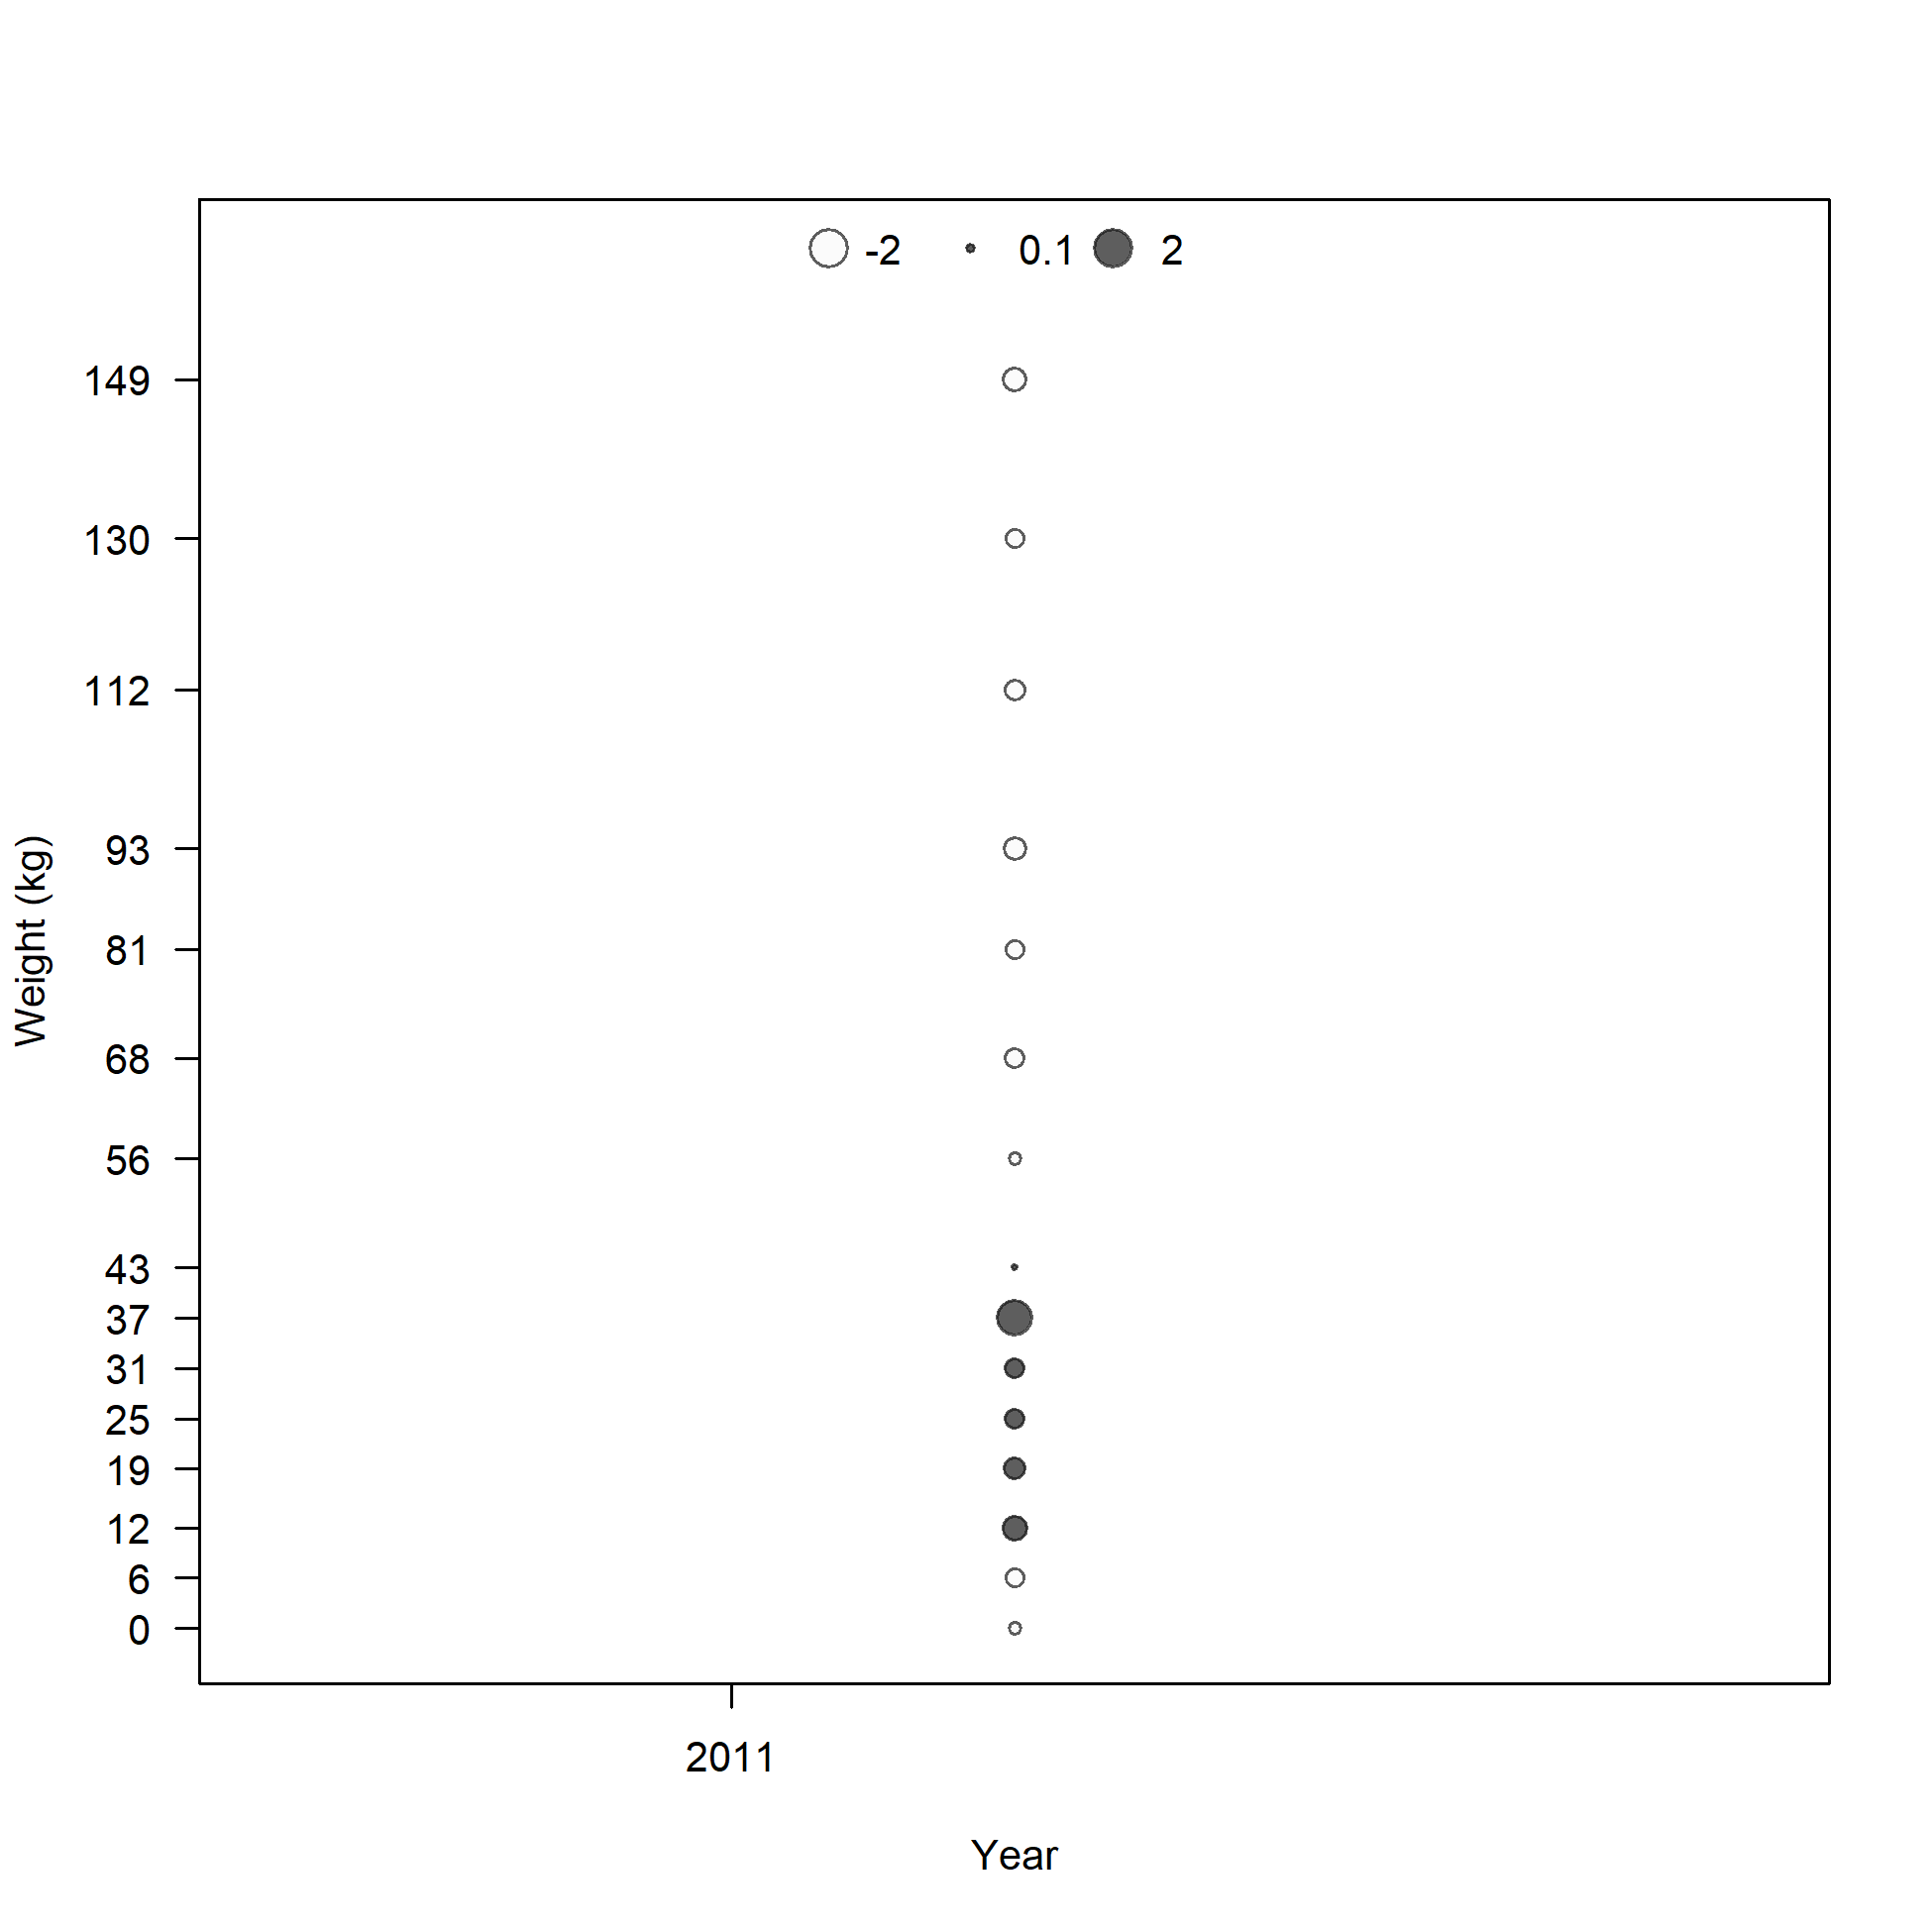
Pearson residuals, whole catch, I5_JPN_late (max=1.65)
Closed bubbles are positive residuals (observed > expected) and open bubbles are negative residuals (observed < expected).
file: comp_sizefit_method2_residsflt26mkt0.png
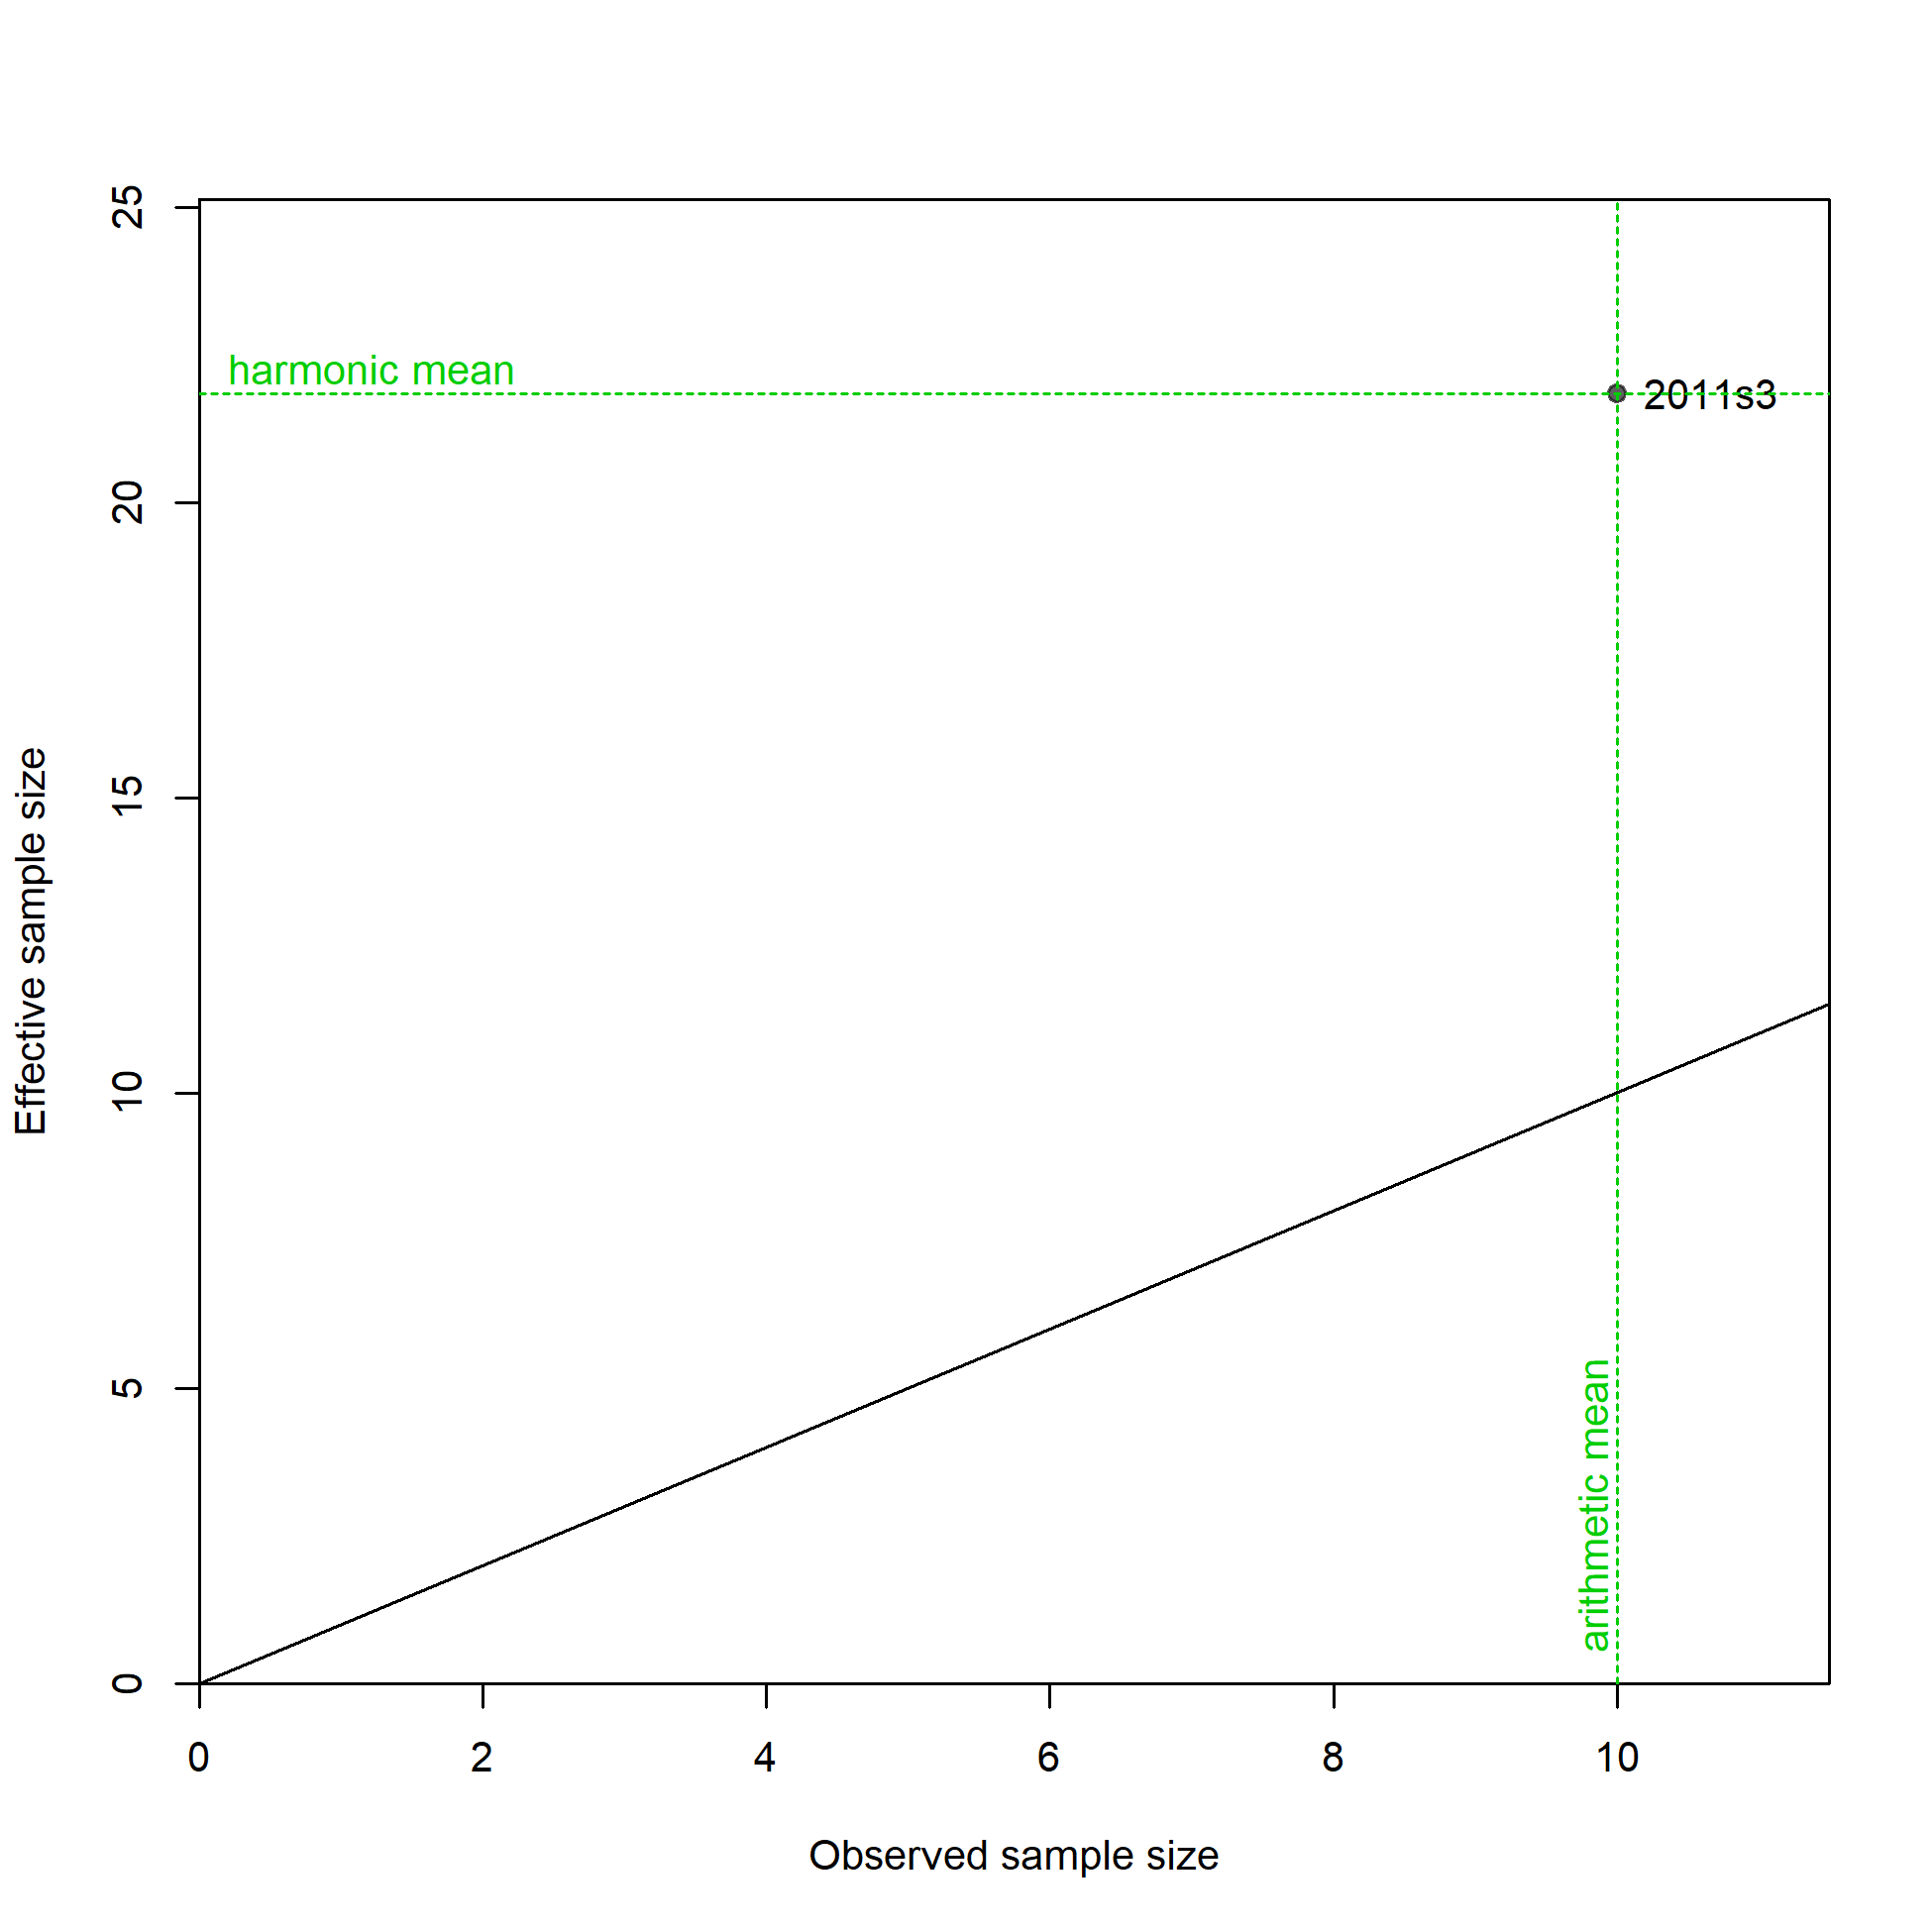
N-EffN comparison, Size comps, size method 2, whole catch, I5_JPN_late
file: comp_sizefit_method2_sampsize_flt26mkt0.png

Mean size for I5_JPN_late with 95% confidence intervals based on current samples sizes.
Francis data weighting method TA1.8: too few points to calculate adjustments.
For more info, see
Francis, R.I.C.C. (2011). Data weighting in statistical fisheries stock assessment models. Can. J. Fish. Aquat. Sci. 68: 1124-1138. https://doi.org/10.1139/f2011-025
Size comps, size method 3, aggregated across time by fleet.
Labels 'retained' and 'discard' indicate discarded or retained sampled for each fleet. Panels without this designation represent the whole catch.
file: comp_sizefit_method3__aggregated_across_time.png

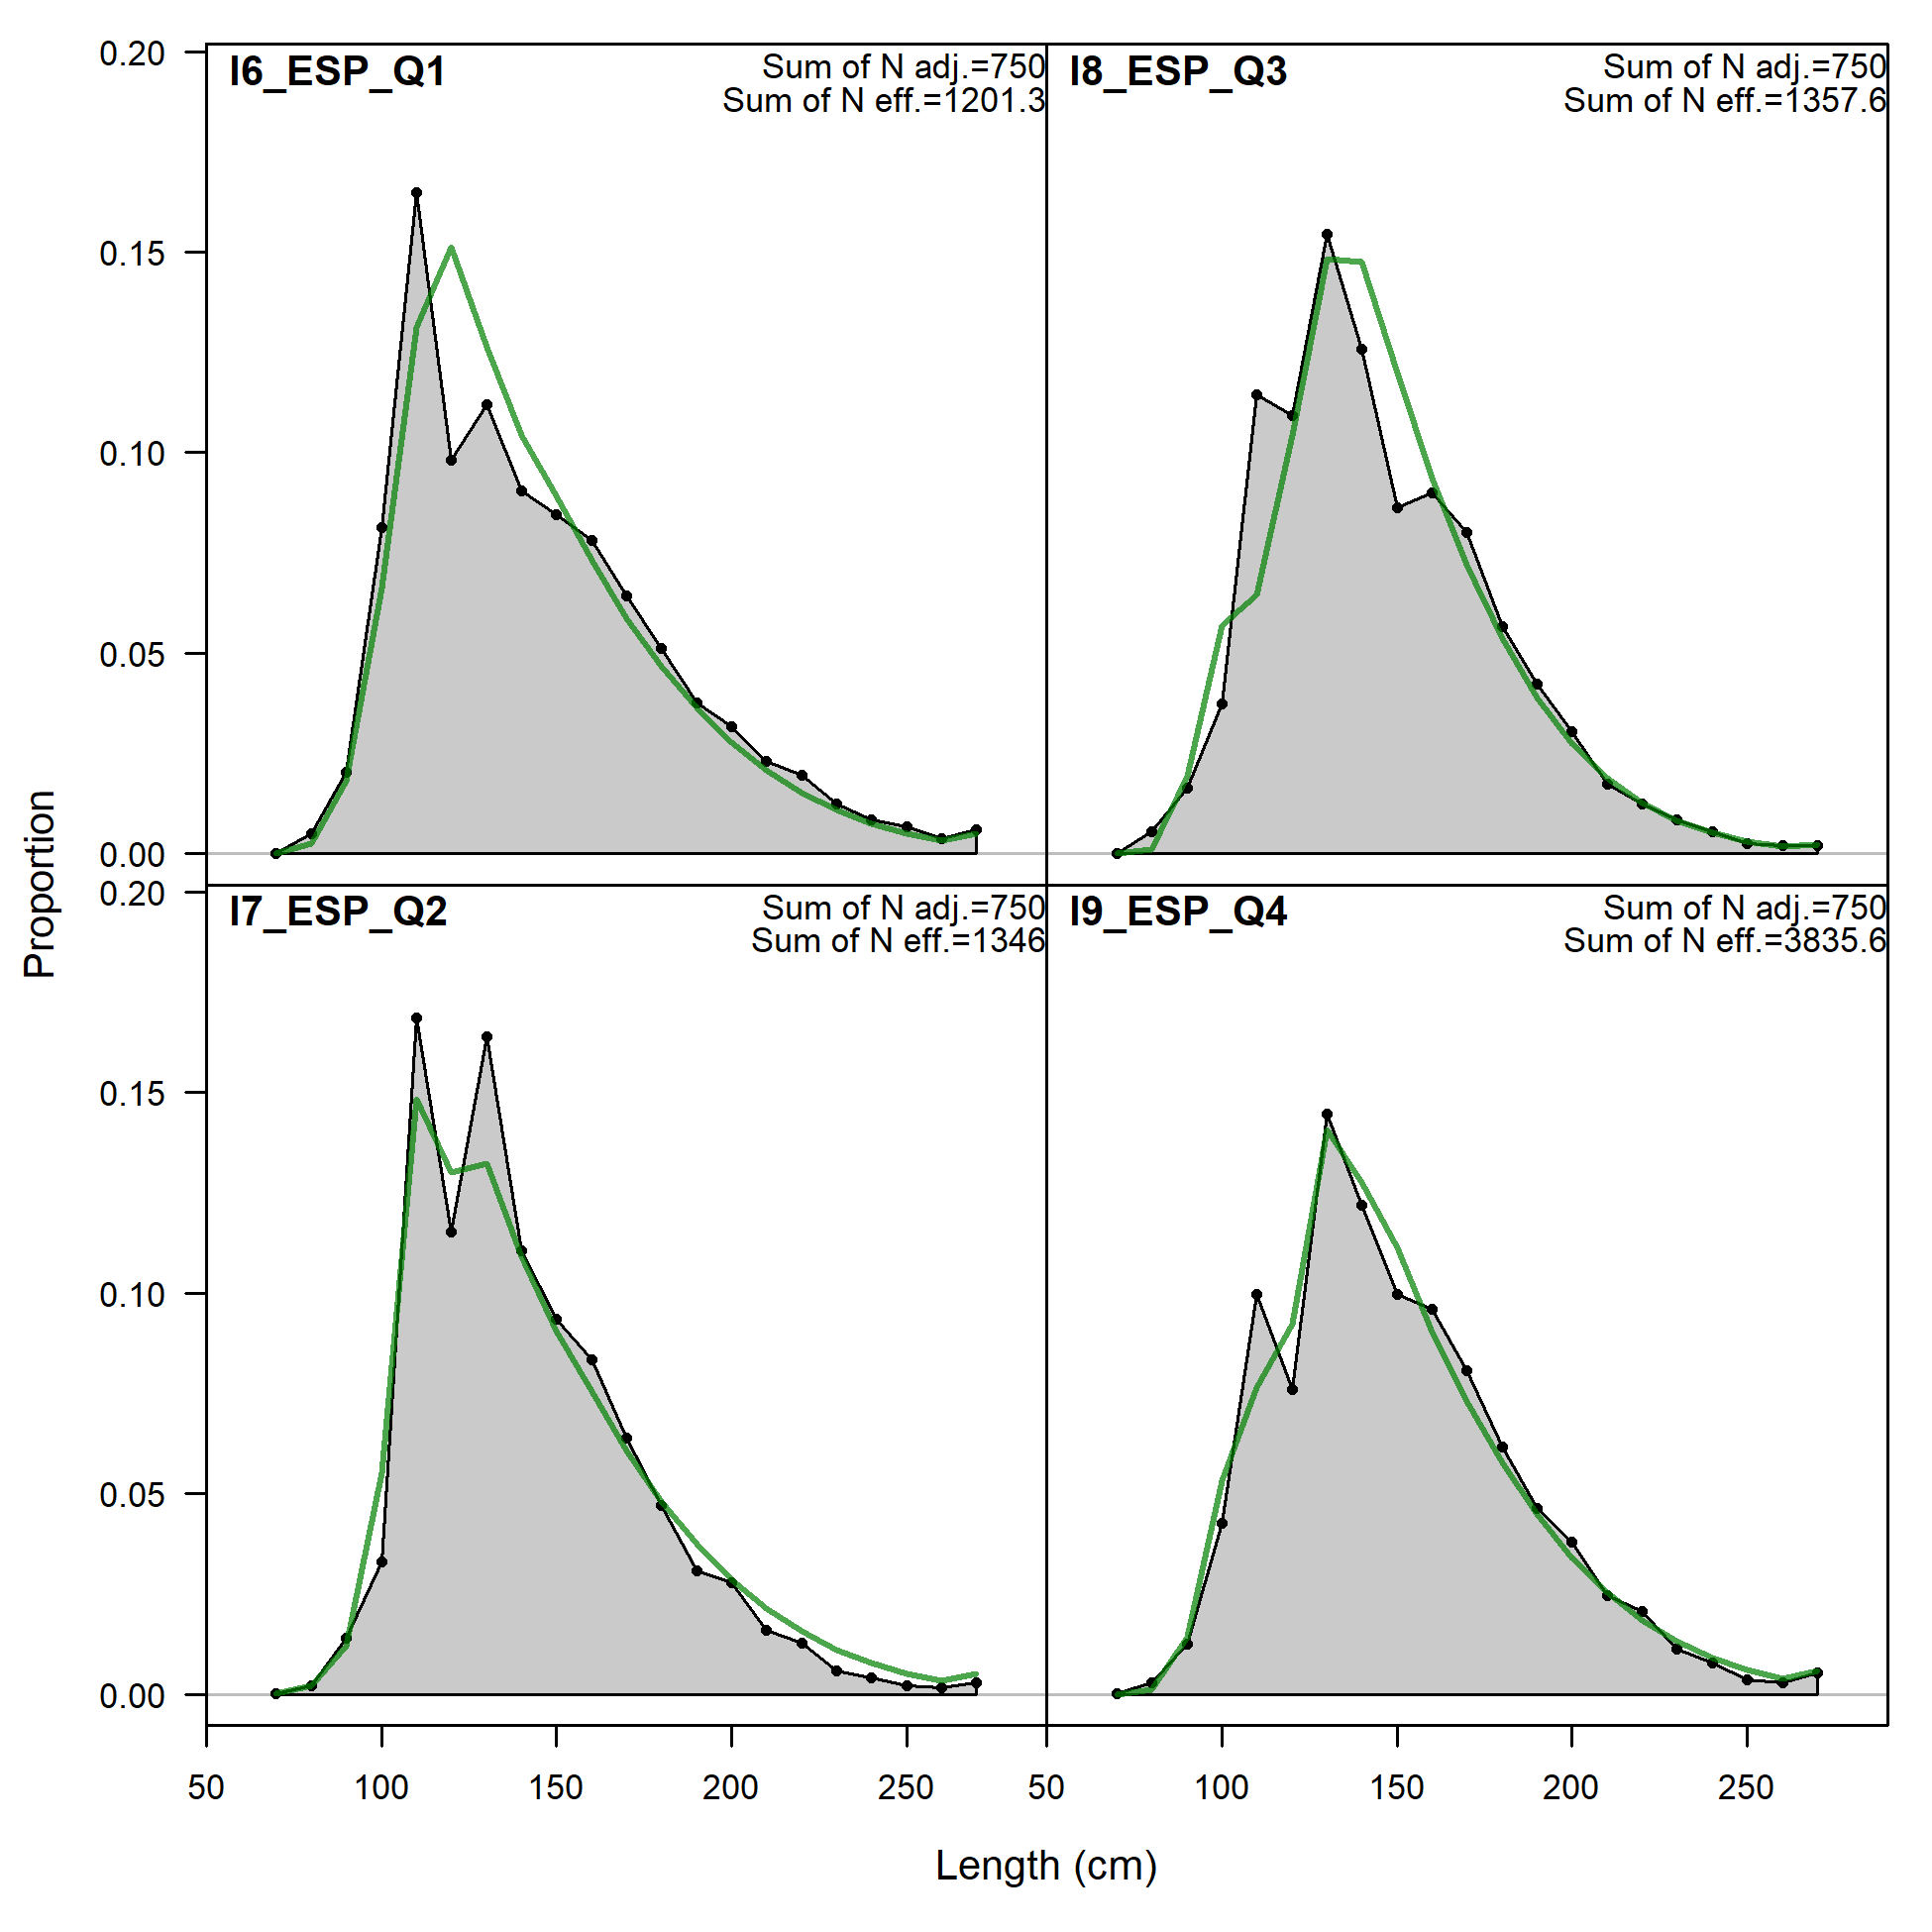
Size comps, size method 3, whole catch, I6_ESP_Q1.
'N adj.' is the input sample size after data-weighting adjustment. N eff. is the calculated effective sample size used in the McAllister-Ianelli tuning method.
file: comp_sizefit_method3_flt27mkt0.png
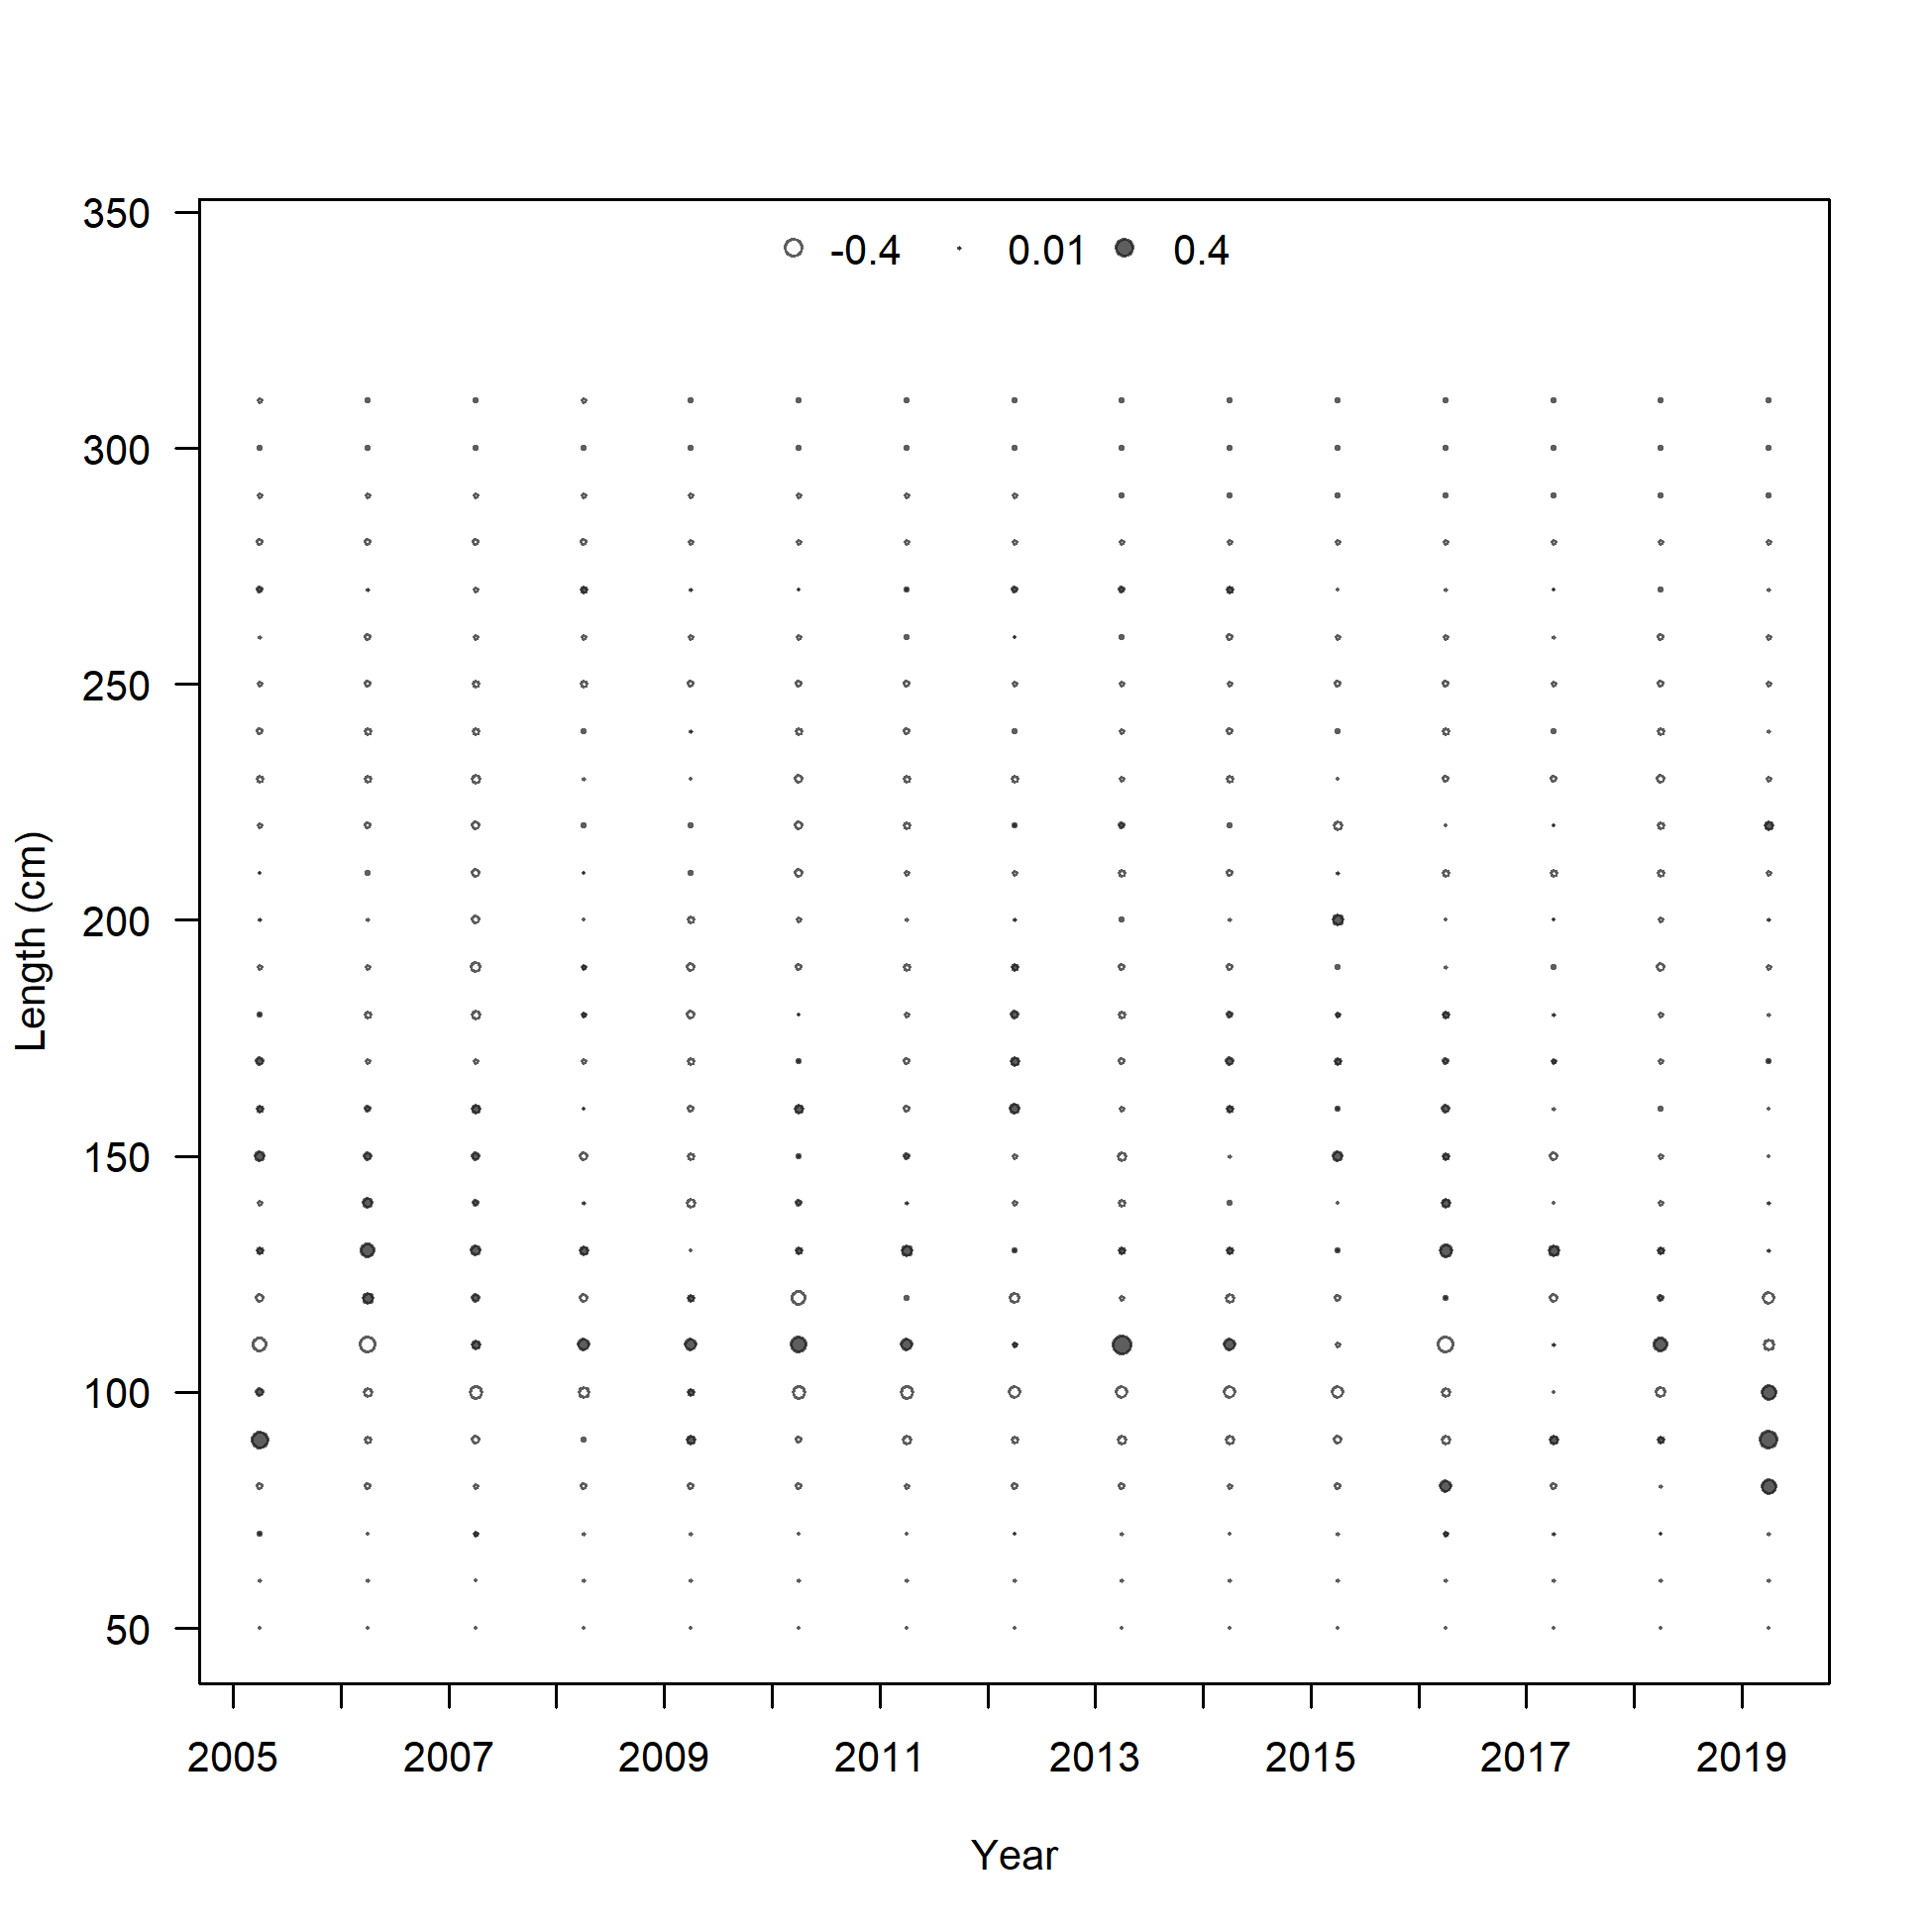
Pearson residuals, whole catch, I6_ESP_Q1 (max=5.53)
Closed bubbles are positive residuals (observed > expected) and open bubbles are negative residuals (observed < expected).
file: comp_sizefit_method3_residsflt27mkt0.png
N-EffN comparison, Size comps, size method 3, whole catch, I6_ESP_Q1
file: comp_sizefit_method3_sampsize_flt27mkt0.png
Mean size for I6_ESP_Q1 with 95% confidence intervals based on current samples sizes.
Francis data weighting method TA1.8: thinner intervals (with capped ends) show result of further adjusting sample sizes based on suggested multiplier (with 95% interval) for size data from I6_ESP_Q1:
1.2956 (0.8982-2.5416)
For more info, see
Francis, R.I.C.C. (2011). Data weighting in statistical fisheries stock assessment models. Can. J. Fish. Aquat. Sci. 68: 1124-1138. https://doi.org/10.1139/f2011-025
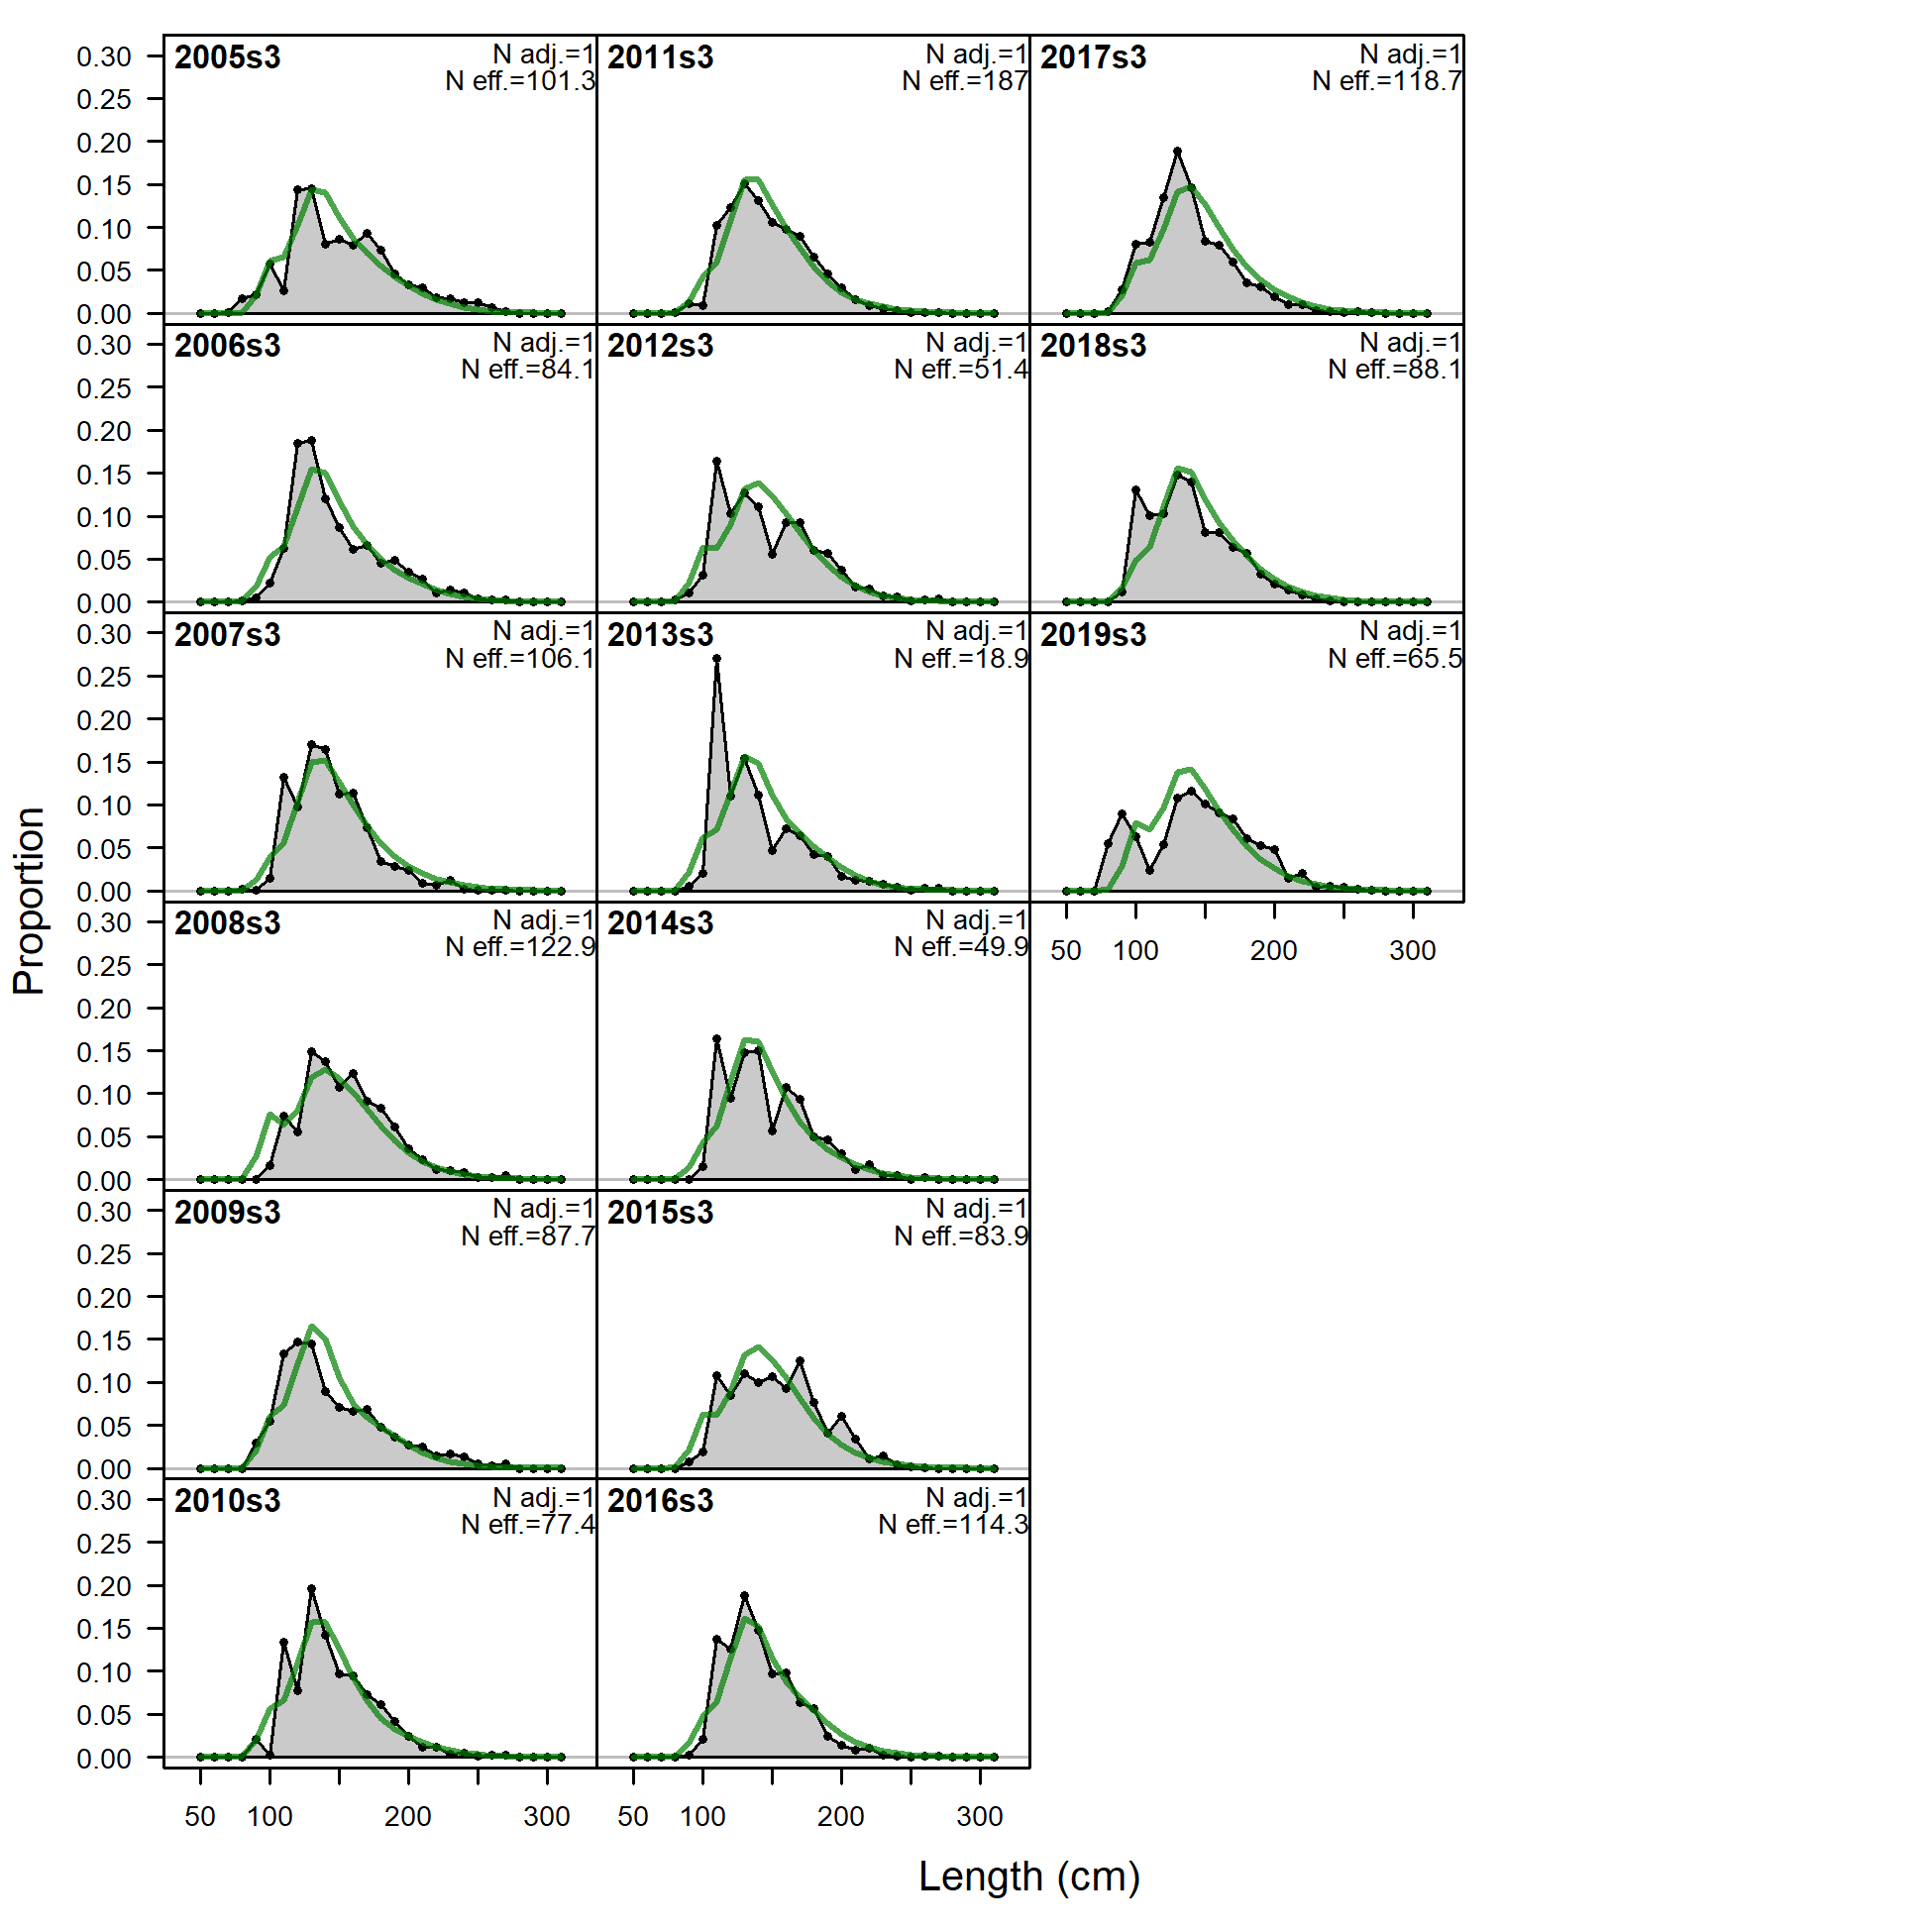
Size comps, size method 3, whole catch, I7_ESP_Q2.
'N adj.' is the input sample size after data-weighting adjustment. N eff. is the calculated effective sample size used in the McAllister-Ianelli tuning method.
file: comp_sizefit_method3_flt28mkt0.png
Pearson residuals, whole catch, I7_ESP_Q2 (max=3.18)
Closed bubbles are positive residuals (observed > expected) and open bubbles are negative residuals (observed < expected).
file: comp_sizefit_method3_residsflt28mkt0.png
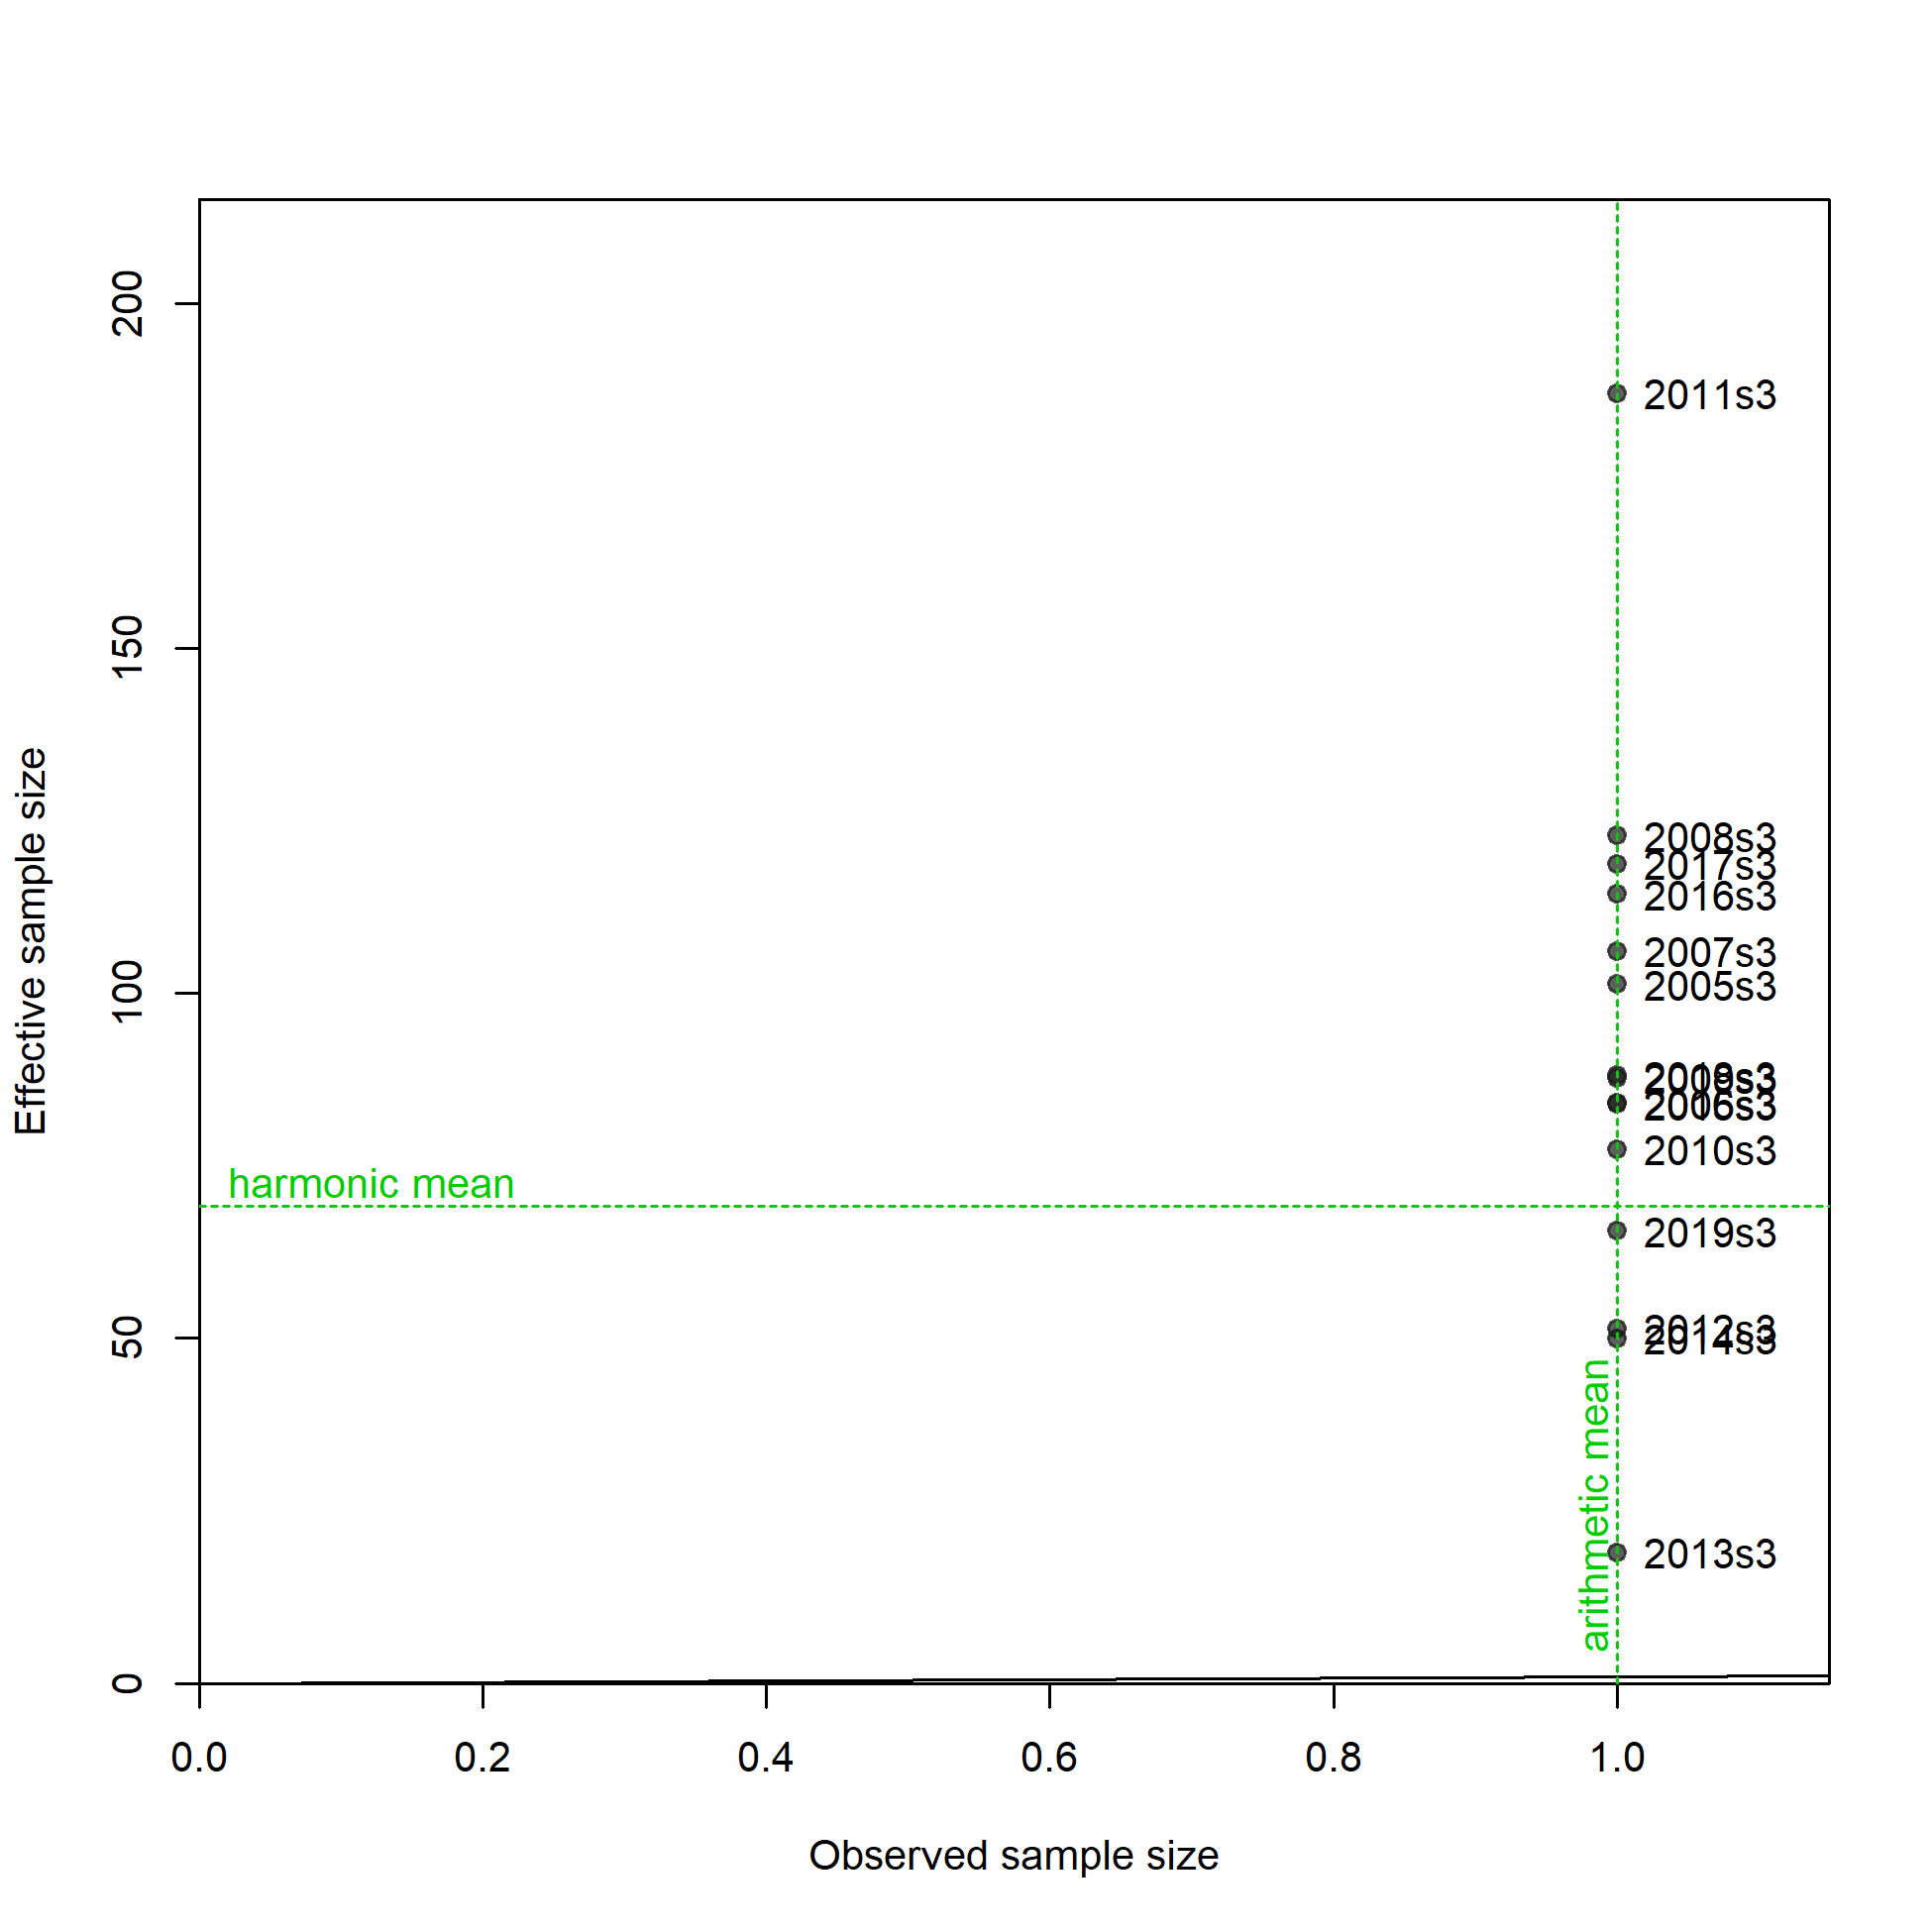
N-EffN comparison, Size comps, size method 3, whole catch, I7_ESP_Q2
file: comp_sizefit_method3_sampsize_flt28mkt0.png
Mean size for I7_ESP_Q2 with 95% confidence intervals based on current samples sizes.
Francis data weighting method TA1.8: thinner intervals (with capped ends) show result of further adjusting sample sizes based on suggested multiplier (with 95% interval) for size data from I7_ESP_Q2:
1.6443 (1.1125-3.6589)
For more info, see
Francis, R.I.C.C. (2011). Data weighting in statistical fisheries stock assessment models. Can. J. Fish. Aquat. Sci. 68: 1124-1138. https://doi.org/10.1139/f2011-025
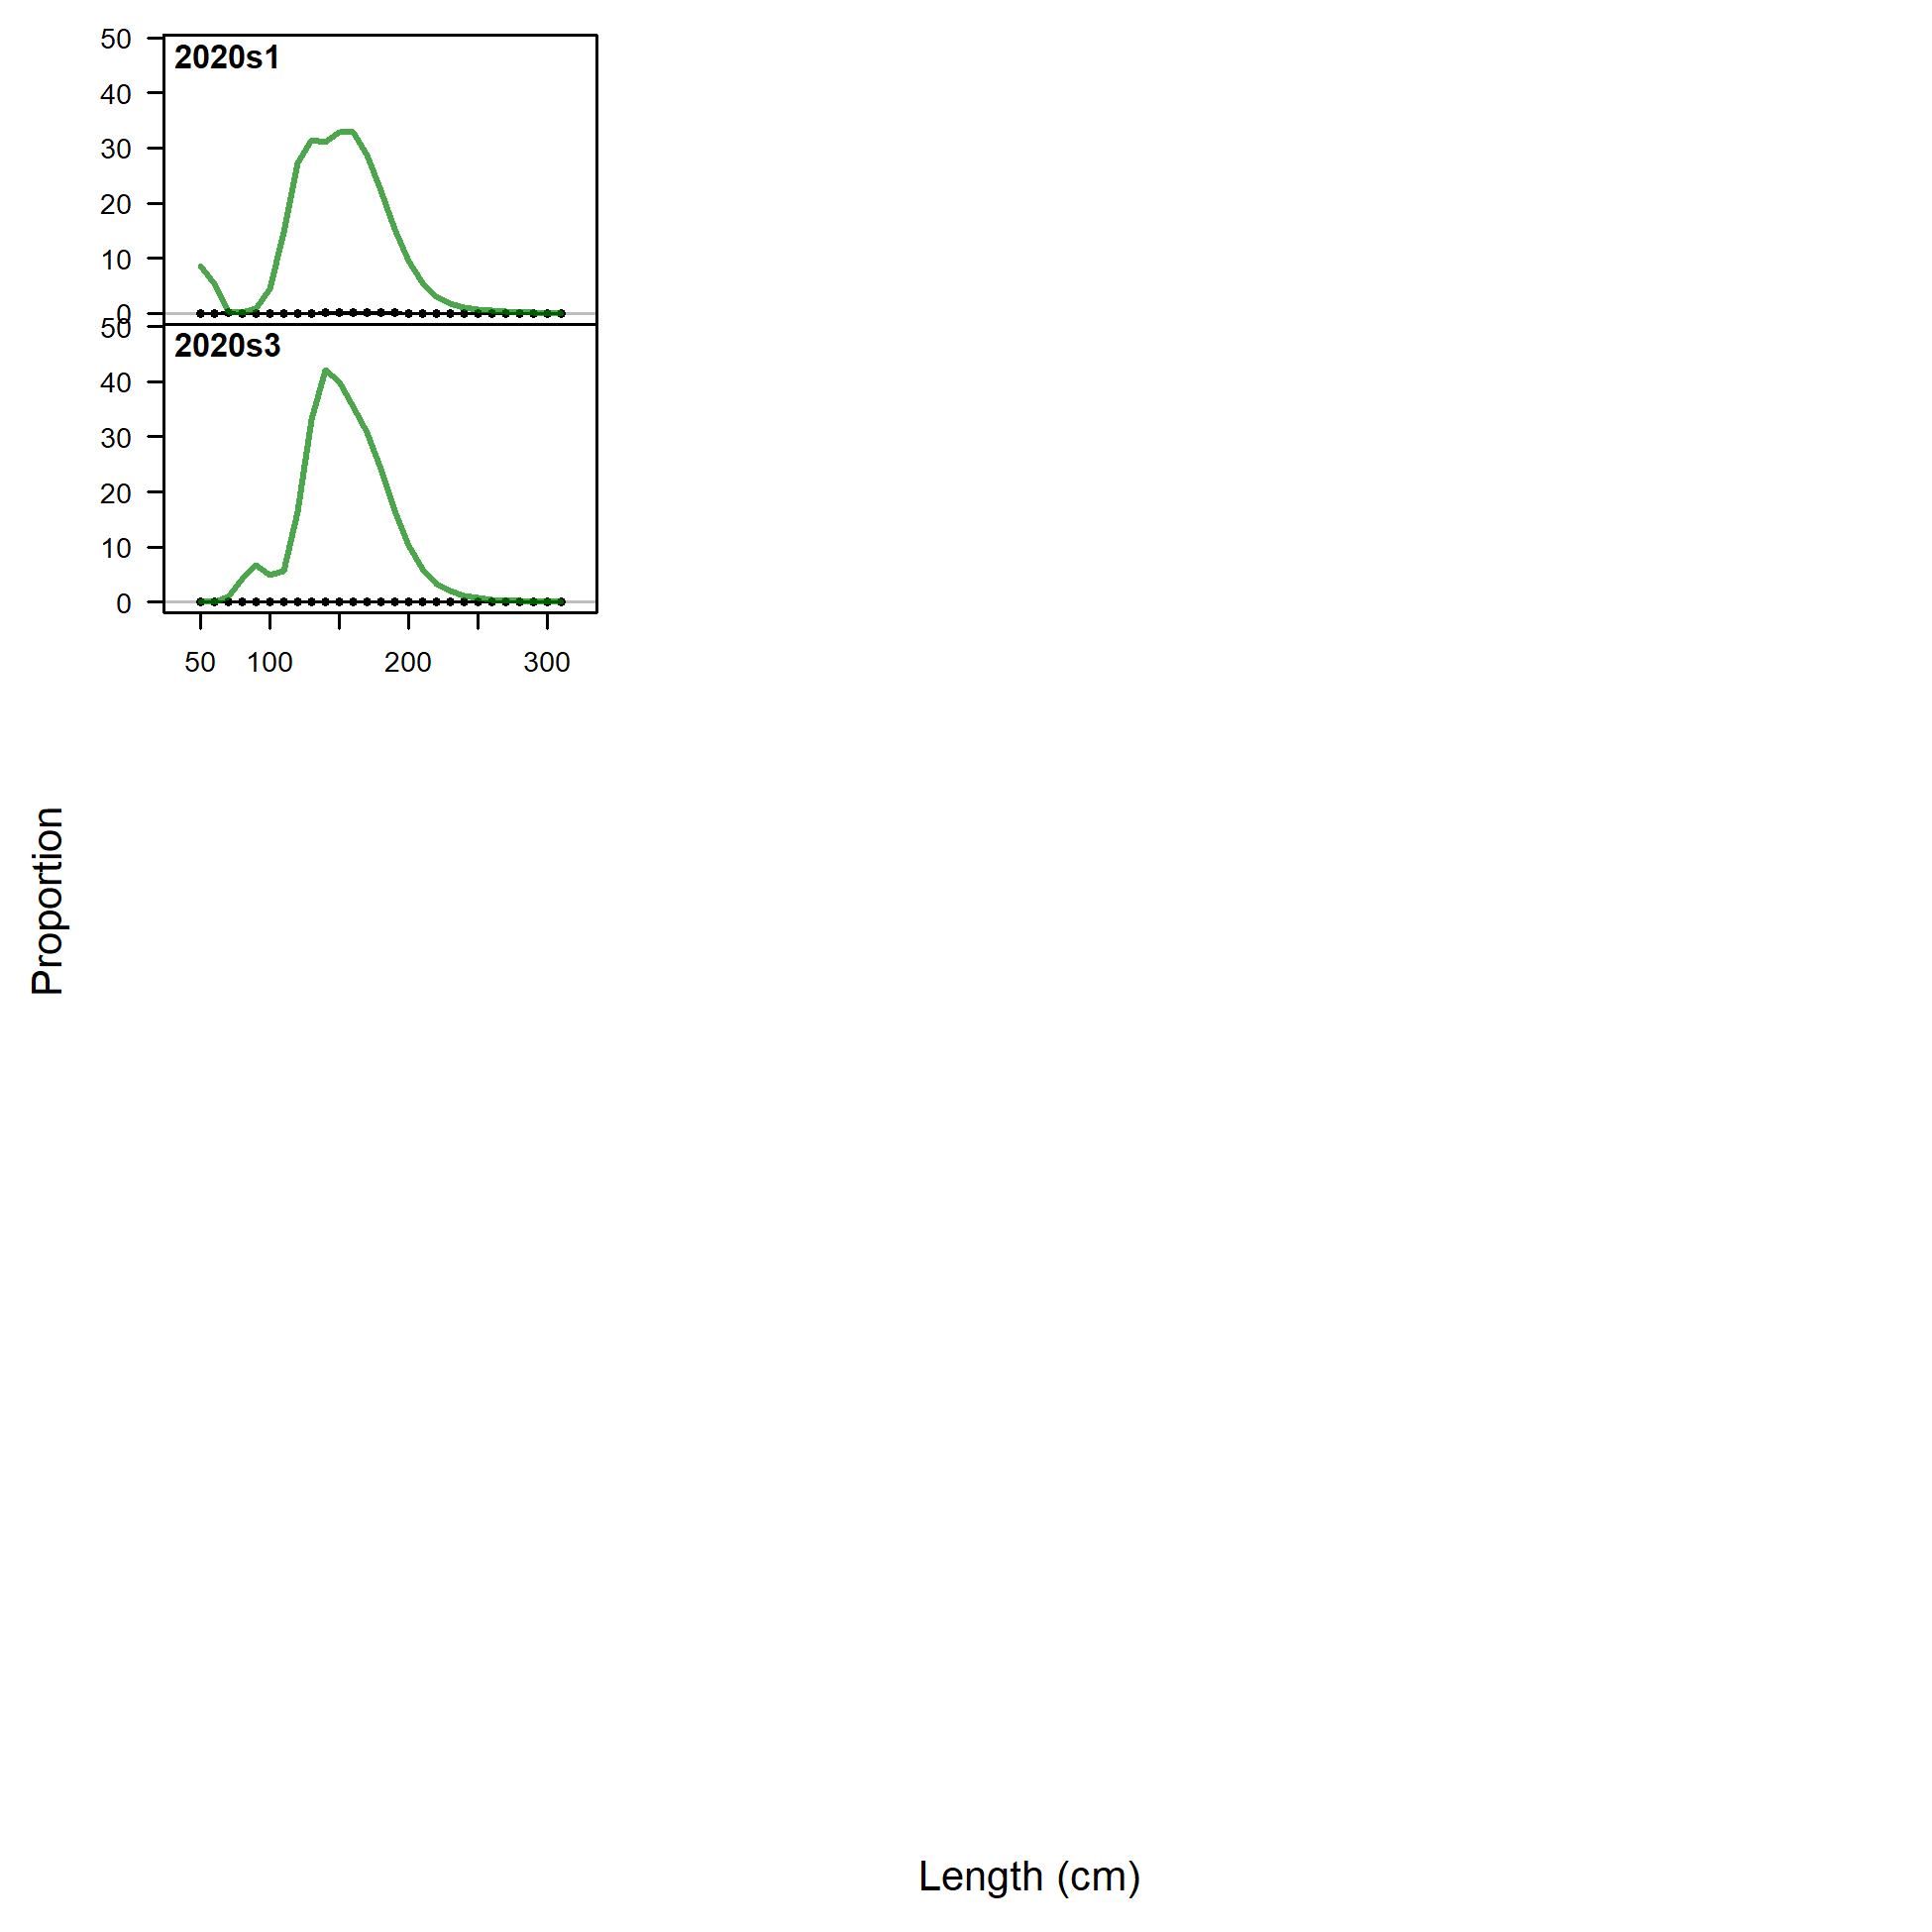
Size comps, size method 3, whole catch, I8_ESP_Q3.
'N adj.' is the input sample size after data-weighting adjustment. N eff. is the calculated effective sample size used in the McAllister-Ianelli tuning method.
file: comp_sizefit_method3_flt29mkt0.png
Pearson residuals, whole catch, I8_ESP_Q3 (max=9.18)
Closed bubbles are positive residuals (observed > expected) and open bubbles are negative residuals (observed < expected).
file: comp_sizefit_method3_residsflt29mkt0.png
N-EffN comparison, Size comps, size method 3, whole catch, I8_ESP_Q3
file: comp_sizefit_method3_sampsize_flt29mkt0.png
Mean size for I8_ESP_Q3 with 95% confidence intervals based on current samples sizes.
Francis data weighting method TA1.8: thinner intervals (with capped ends) show result of further adjusting sample sizes based on suggested multiplier (with 95% interval) for size data from I8_ESP_Q3:
1.0581 (0.7111-2.4203)
For more info, see
Francis, R.I.C.C. (2011). Data weighting in statistical fisheries stock assessment models. Can. J. Fish. Aquat. Sci. 68: 1124-1138. https://doi.org/10.1139/f2011-025
Size comps, size method 3, whole catch, I9_ESP_Q4.
'N adj.' is the input sample size after data-weighting adjustment. N eff. is the calculated effective sample size used in the McAllister-Ianelli tuning method.
file: comp_sizefit_method3_flt30mkt0.png
Pearson residuals, whole catch, I9_ESP_Q4 (max=2.4)
Closed bubbles are positive residuals (observed > expected) and open bubbles are negative residuals (observed < expected).
file: comp_sizefit_method3_residsflt30mkt0.png
N-EffN comparison, Size comps, size method 3, whole catch, I9_ESP_Q4
file: comp_sizefit_method3_sampsize_flt30mkt0.png
Mean size for I9_ESP_Q4 with 95% confidence intervals based on current samples sizes.
Francis data weighting method TA1.8: thinner intervals (with capped ends) show result of further adjusting sample sizes based on suggested multiplier (with 95% interval) for size data from I9_ESP_Q4:
2.7202 (1.6966-7.136)
For more info, see
Francis, R.I.C.C. (2011). Data weighting in statistical fisheries stock assessment models. Can. J. Fish. Aquat. Sci. 68: 1124-1138. https://doi.org/10.1139/f2011-025
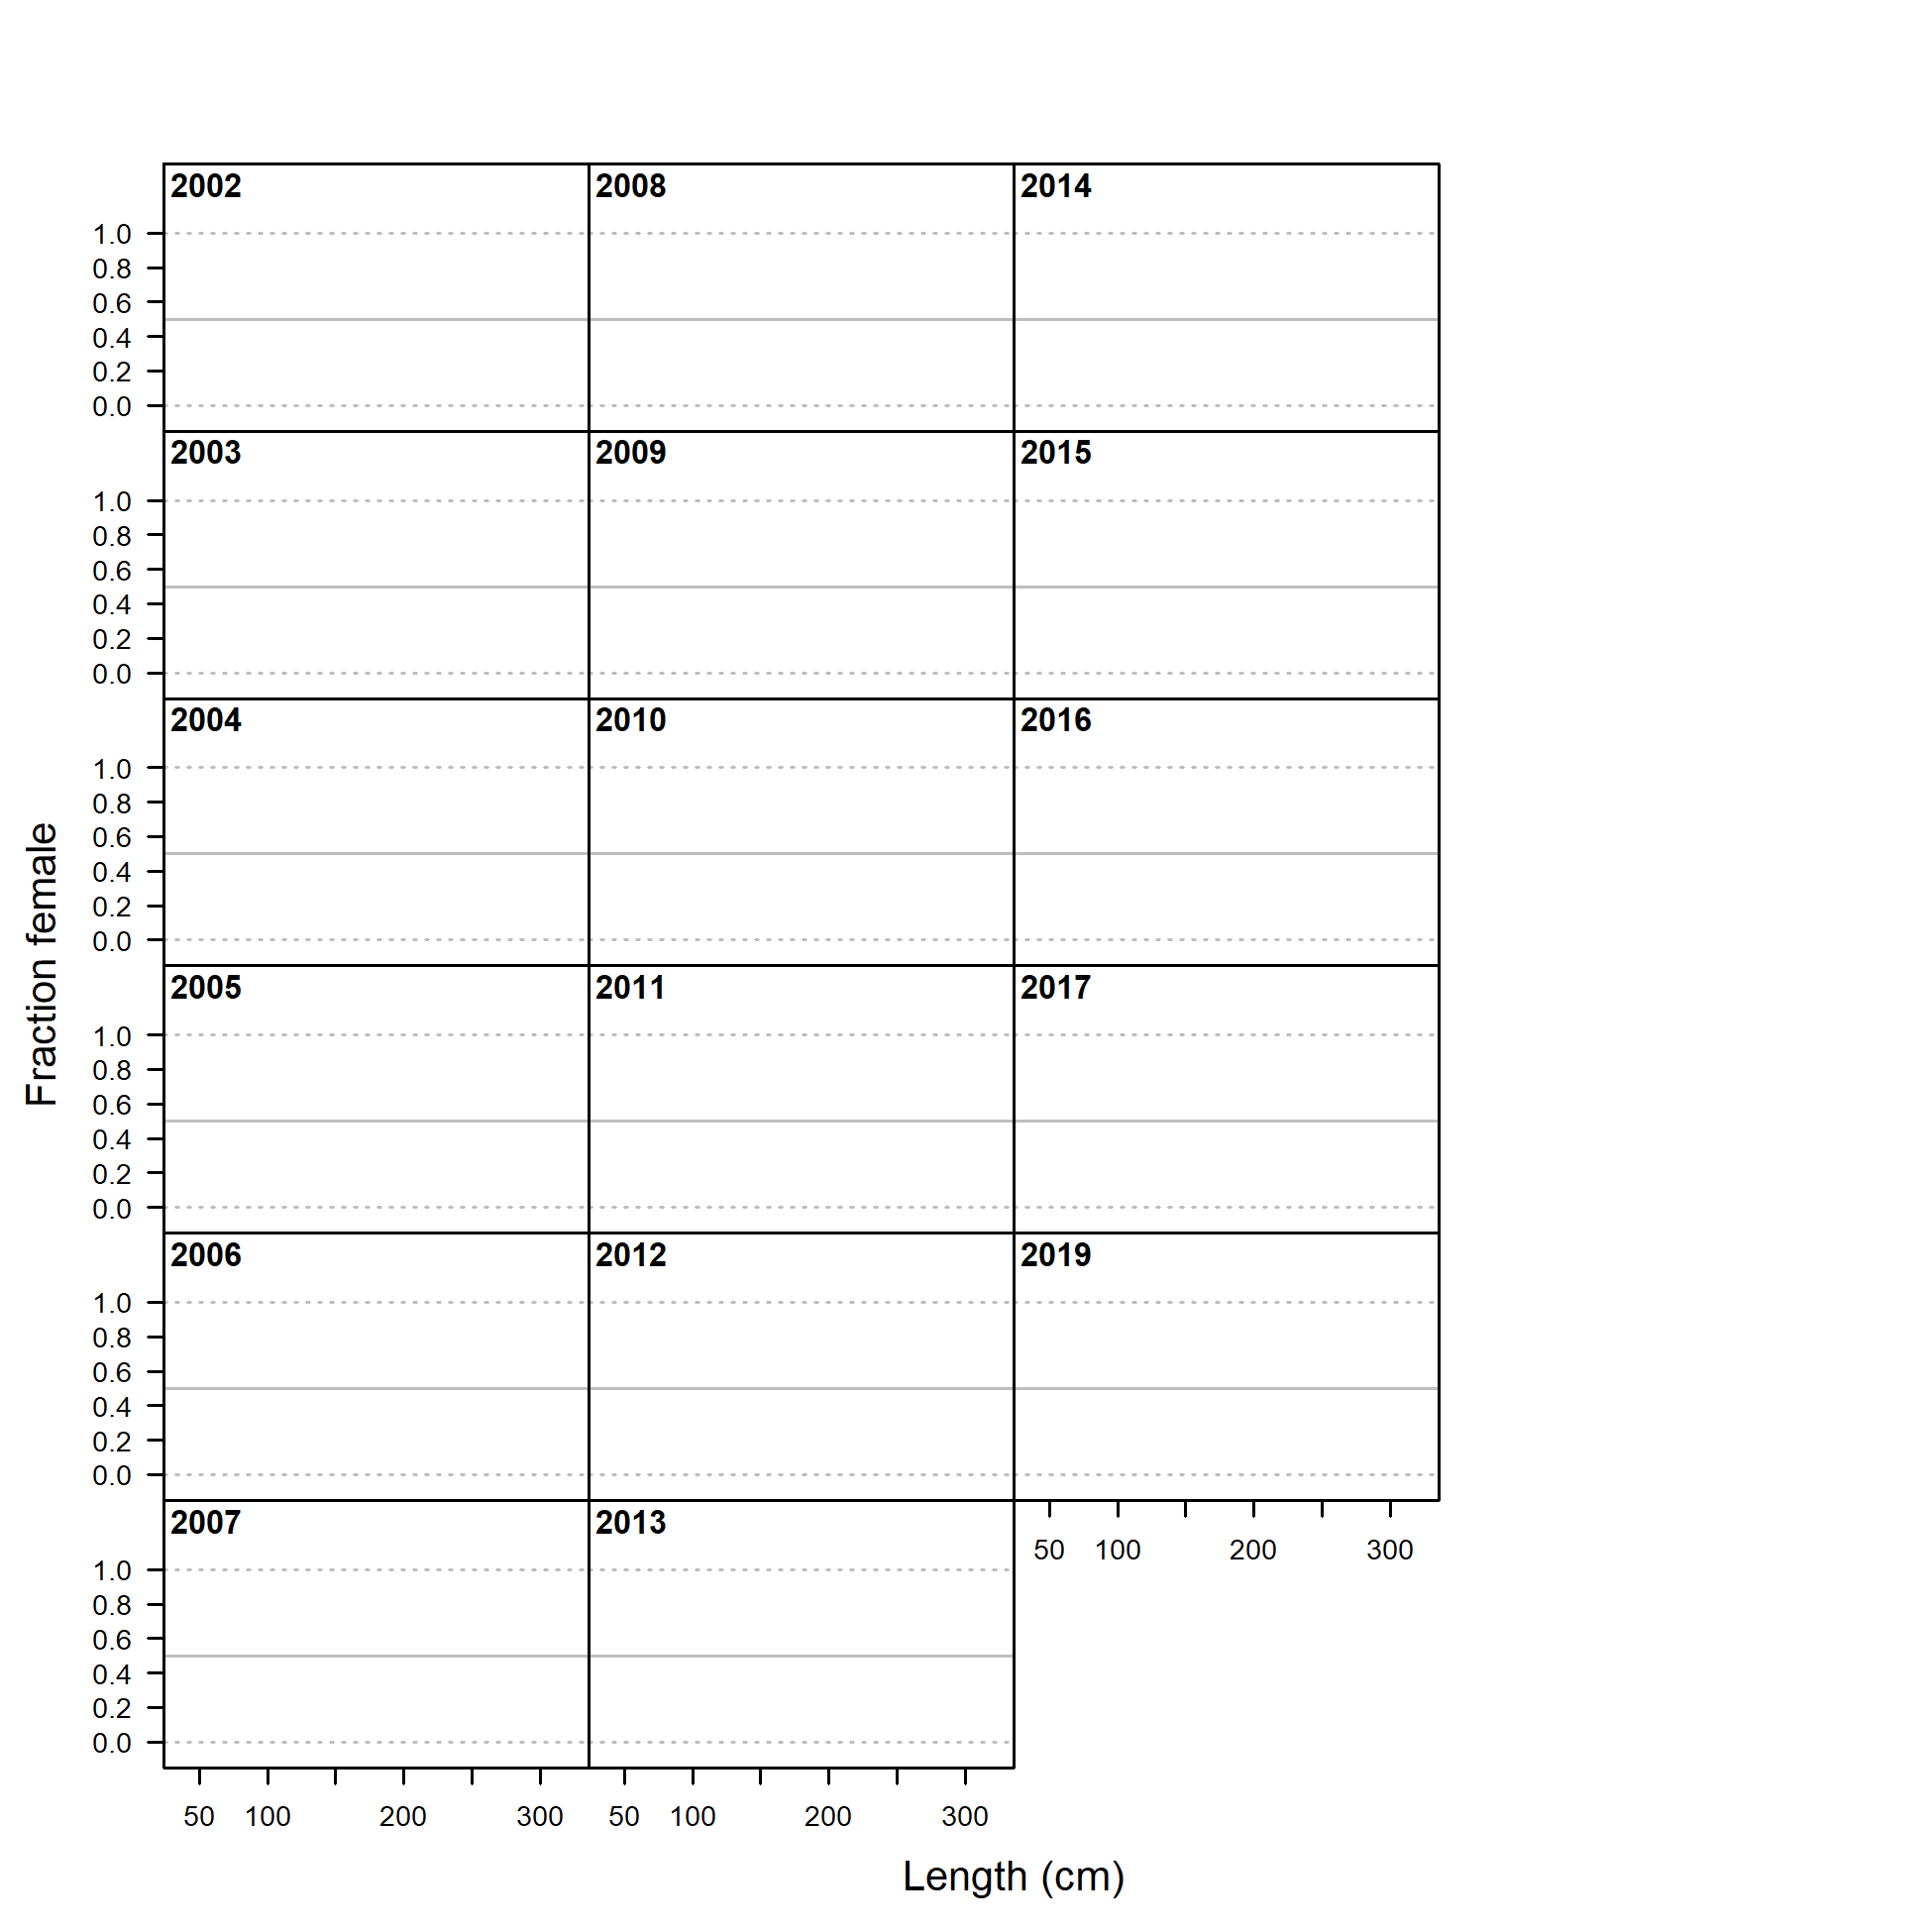
Sex ratios for length comps, whole catch, F3_GN_A5.
Observed sex ratios (points) with 75% intervals (vertical lines) calculated as a Jeffreys interval based on the adjusted input sample size. The model expectation is shown in the purple line.
file: sexratio_len_flt3mkt0.png
Sex ratios for length comps, whole catch, F5_LL_Coast_A5.
Observed sex ratios (points) with 75% intervals (vertical lines) calculated as a Jeffreys interval based on the adjusted input sample size. The model expectation is shown in the purple line.
file: sexratio_len_flt5mkt0.png