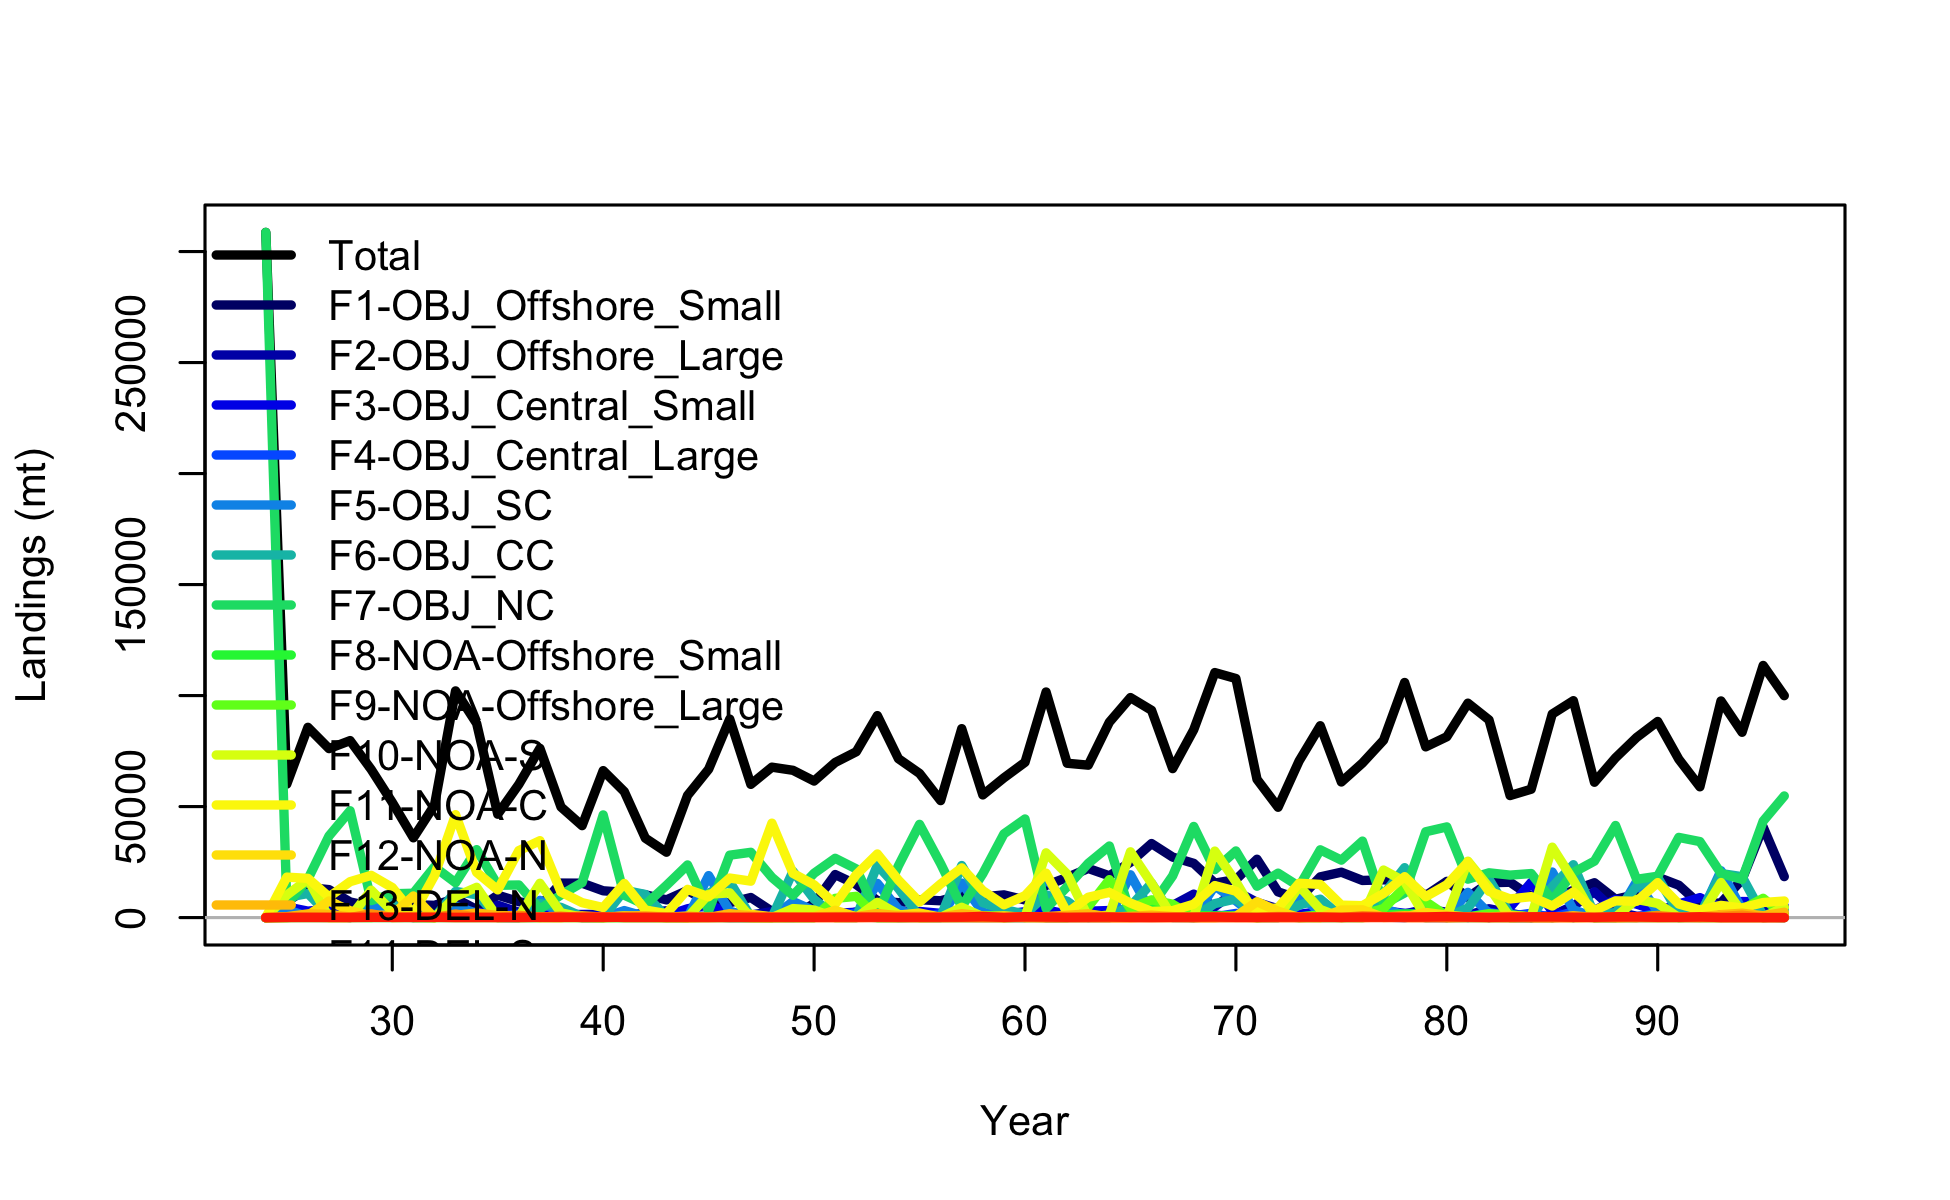
landings
file: catch1 landings.png
landings
file: catch1 landings.png
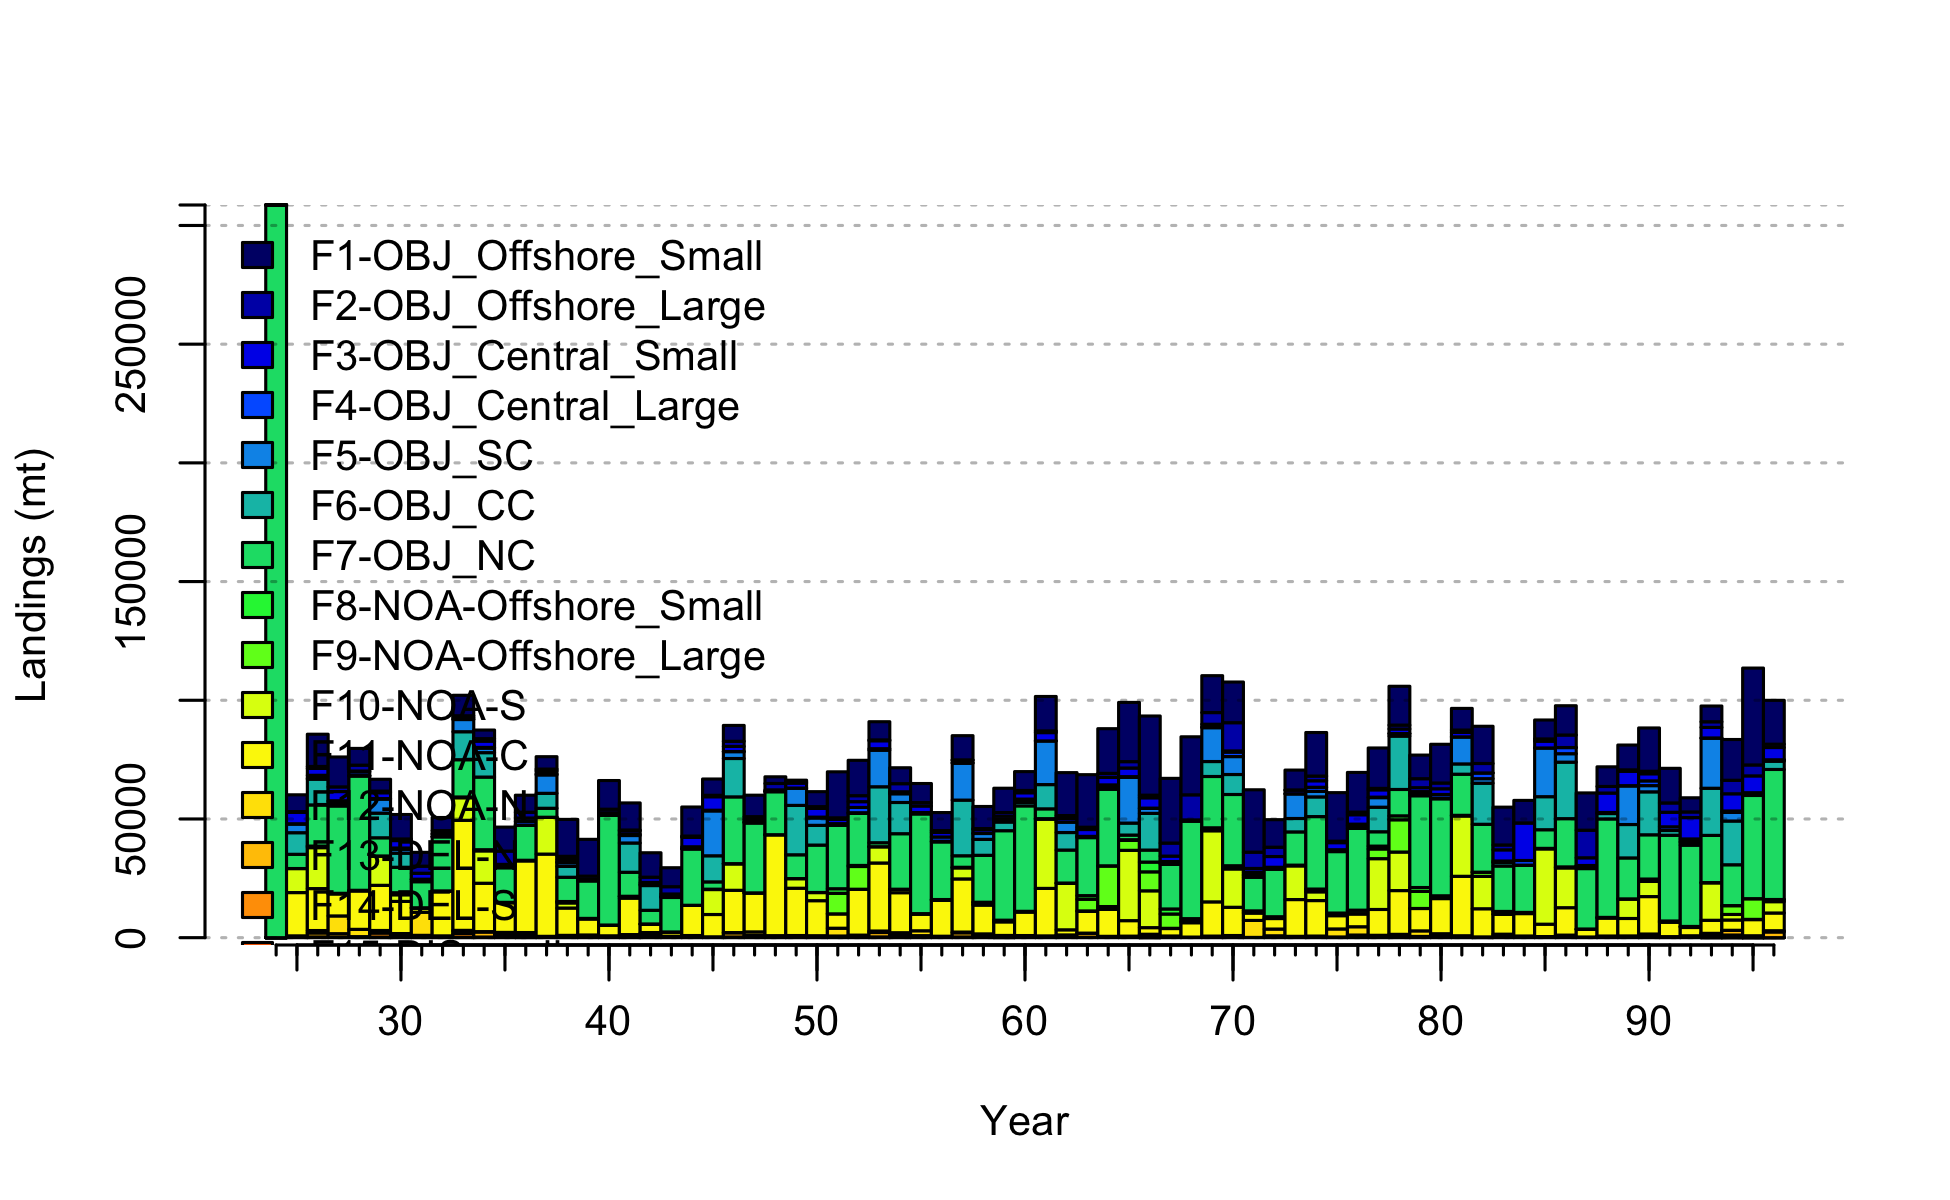
landings stacked
file: catch2 landings stacked.png
.png)
observed and expected landings (if different). Catch input in numbers is compared here to catch in biomass, making this figure less useful for models like this with catch in numbers. Future versions of this plot will be improve to compare catch in the same units.
file: catch3 observed and expected landings (if different).png
.png)
total catch (including discards)
file: catch4 total catch (including discards).png
 stacked.png)
total catch (including discards) stacked
file: catch5 total catch (including discards) stacked.png
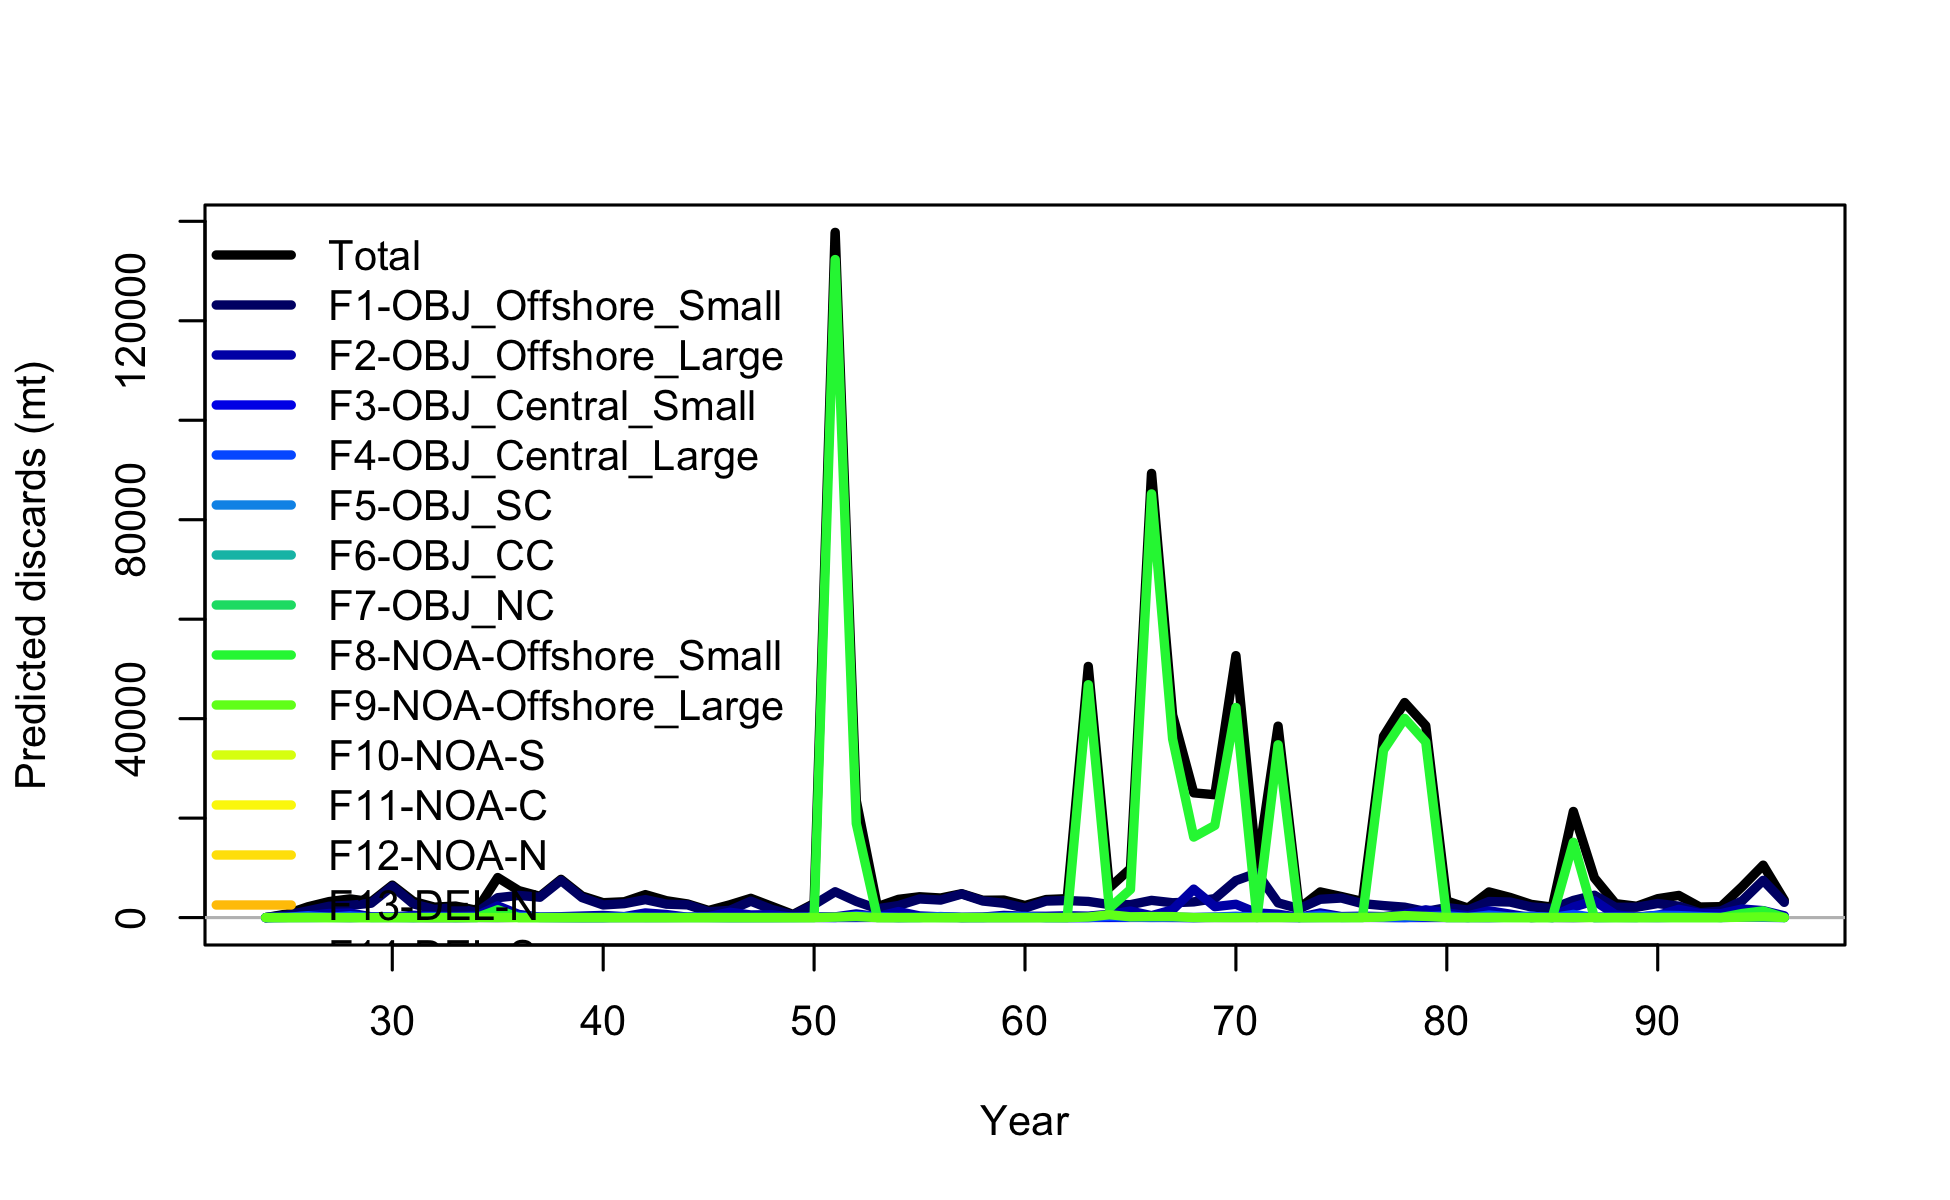
discards
file: catch6 discards.png
.png)
discards stacked plot (depends on multiple fleets)
file: catch7 discards stacked plot (depends on multiple fleets).png
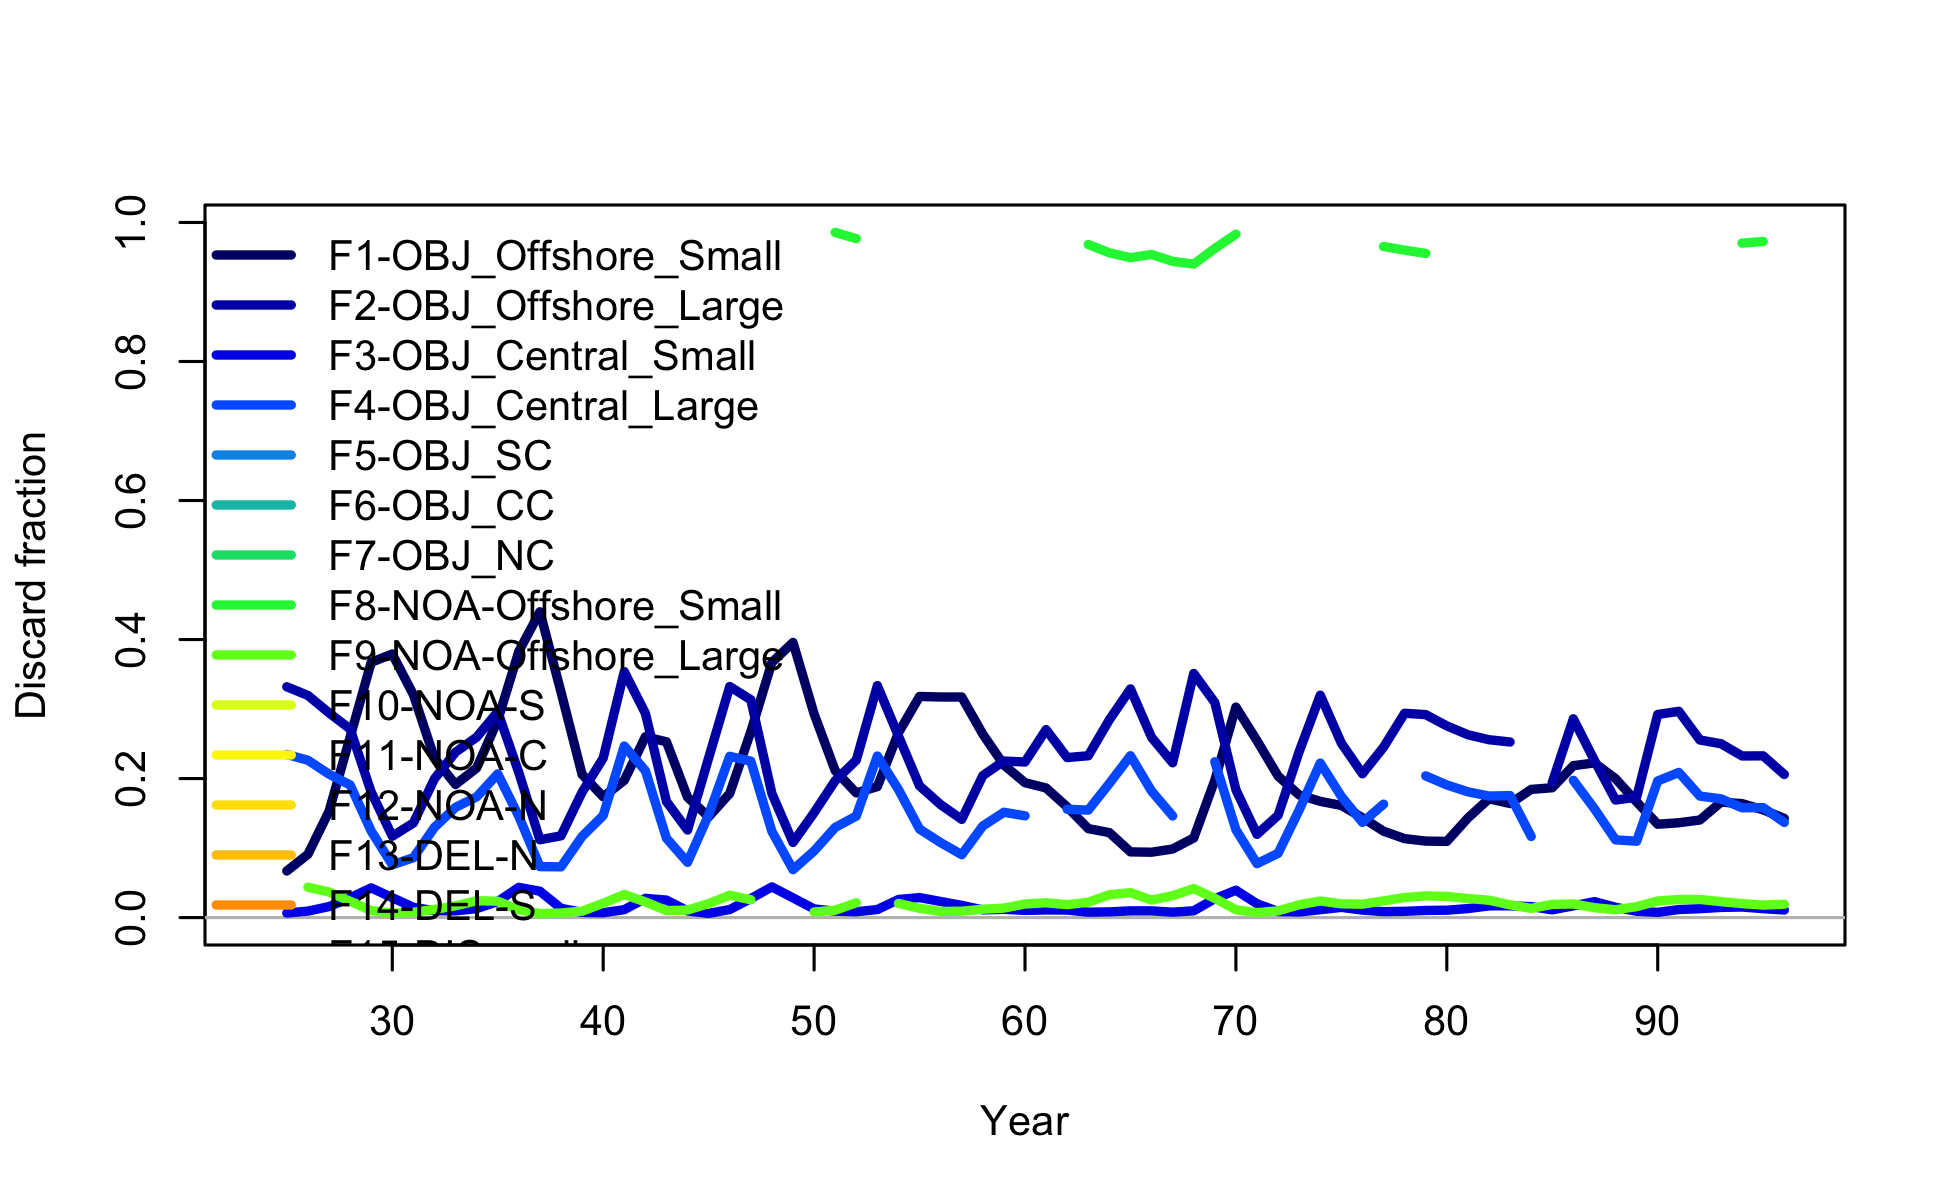
discard fraction
file: catch8 discard fraction.png
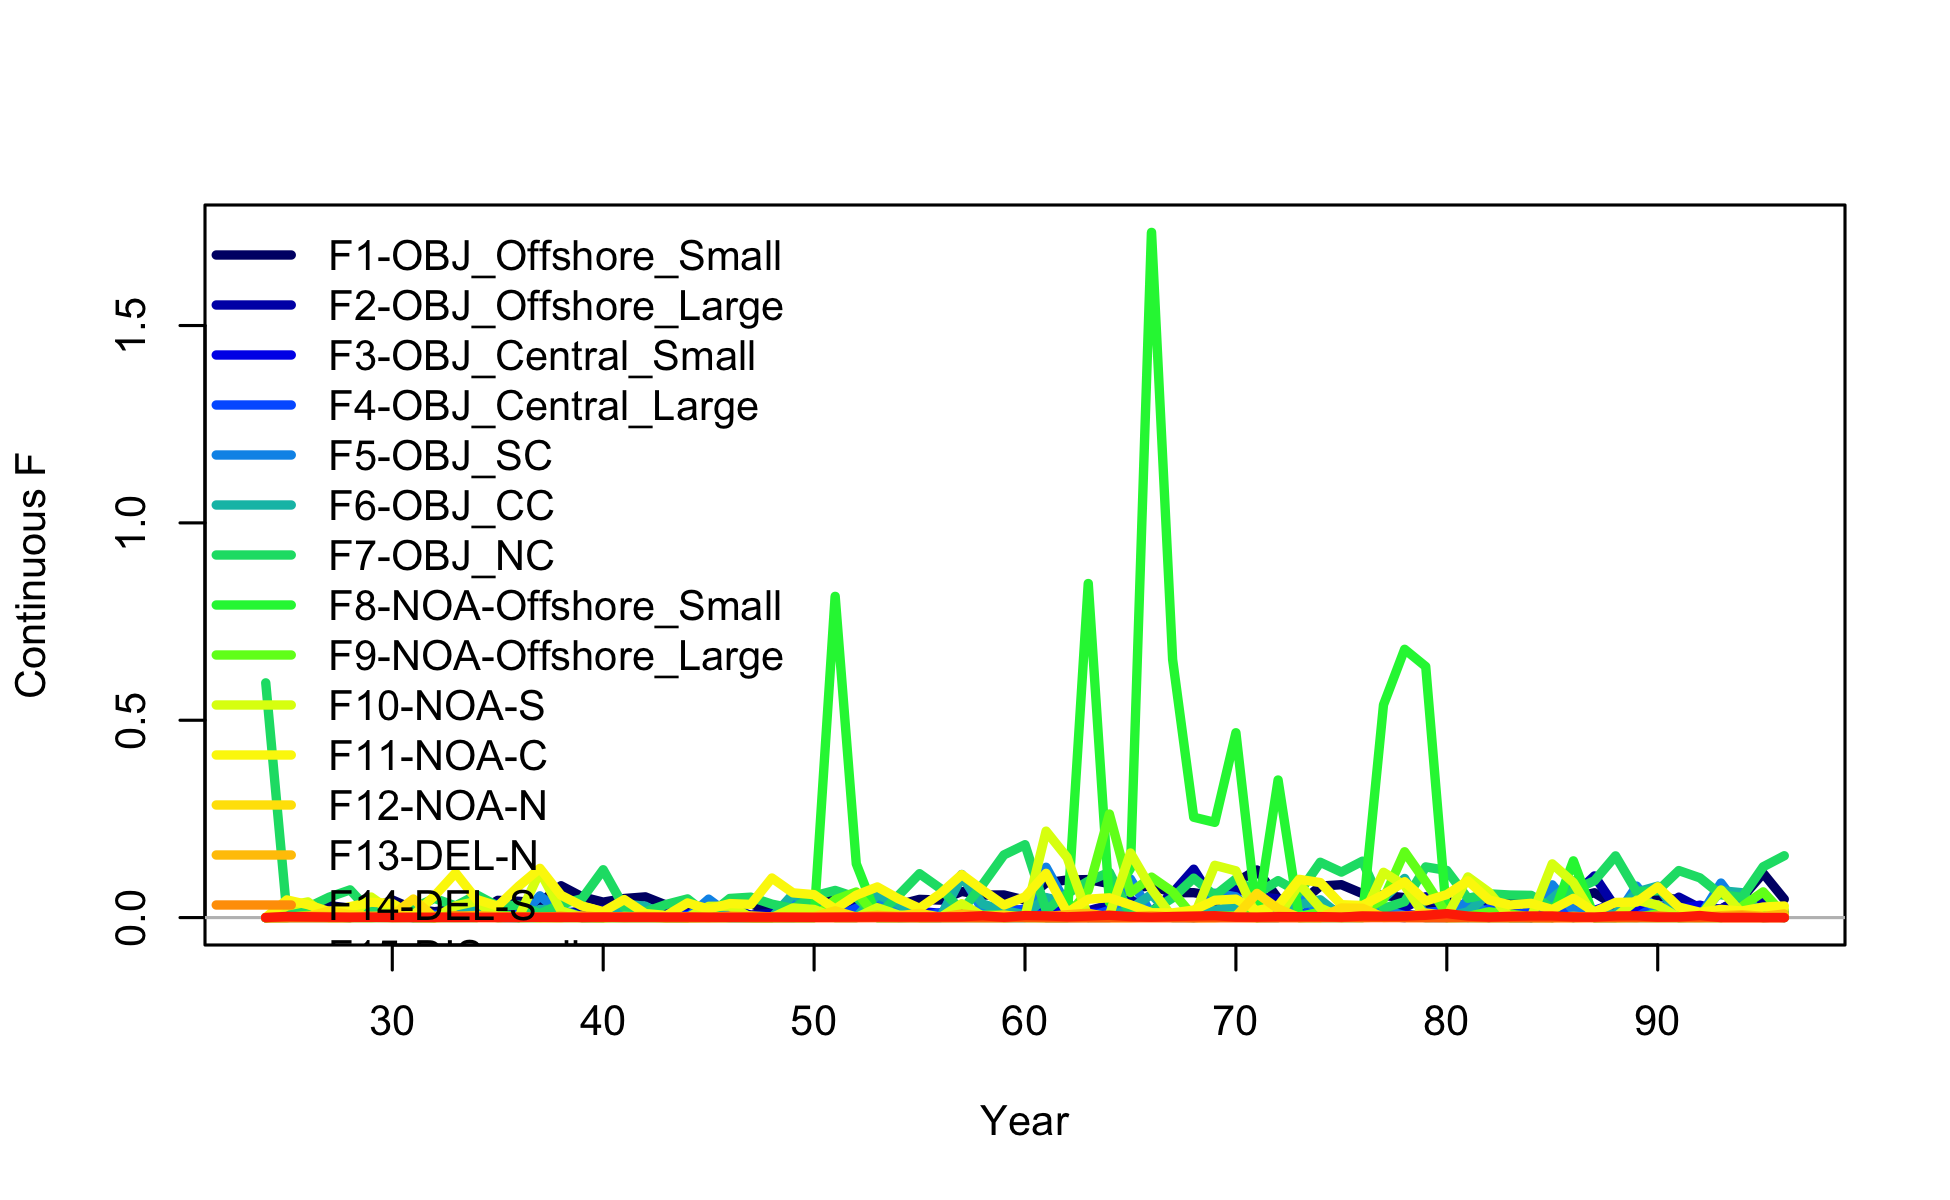
harvest rate
file: catch9 harvest rate.png

landings + dead discards
file: catch16 landings + dead discards.png