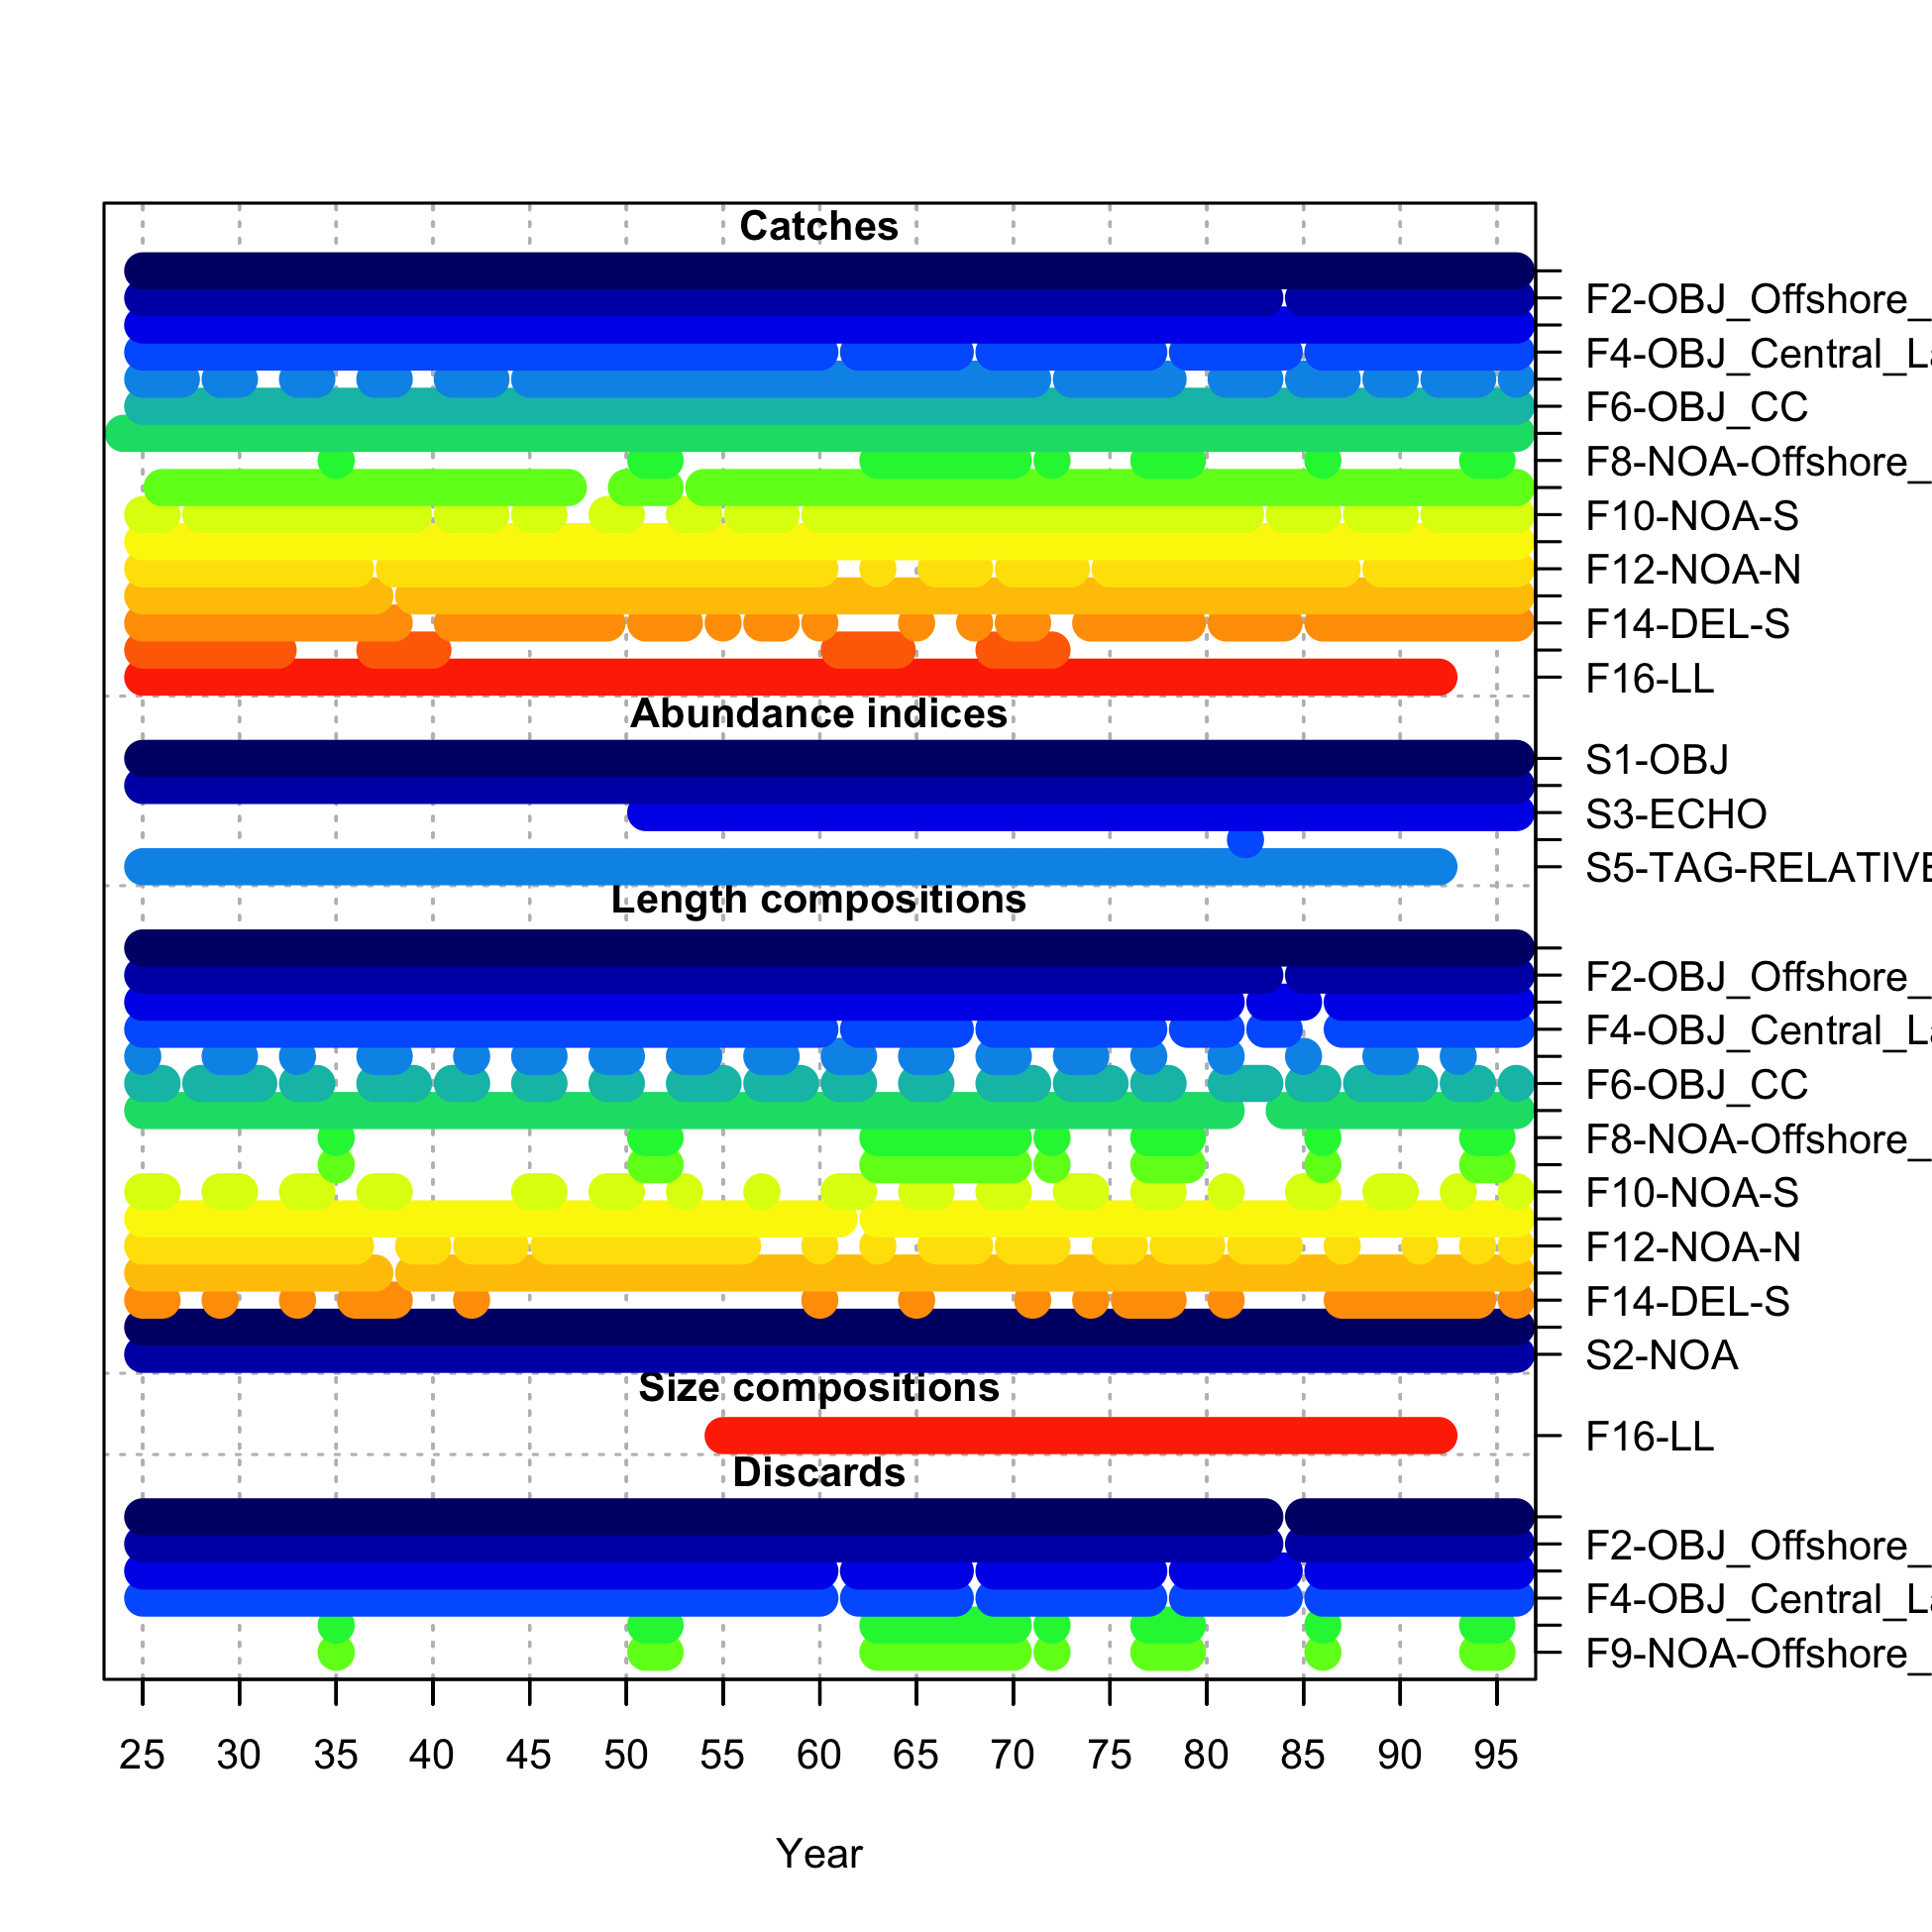
Data presence by year for each fleet and data type.
file: data_plot.png
Data presence by year for each fleet and data type.
file: data_plot.png
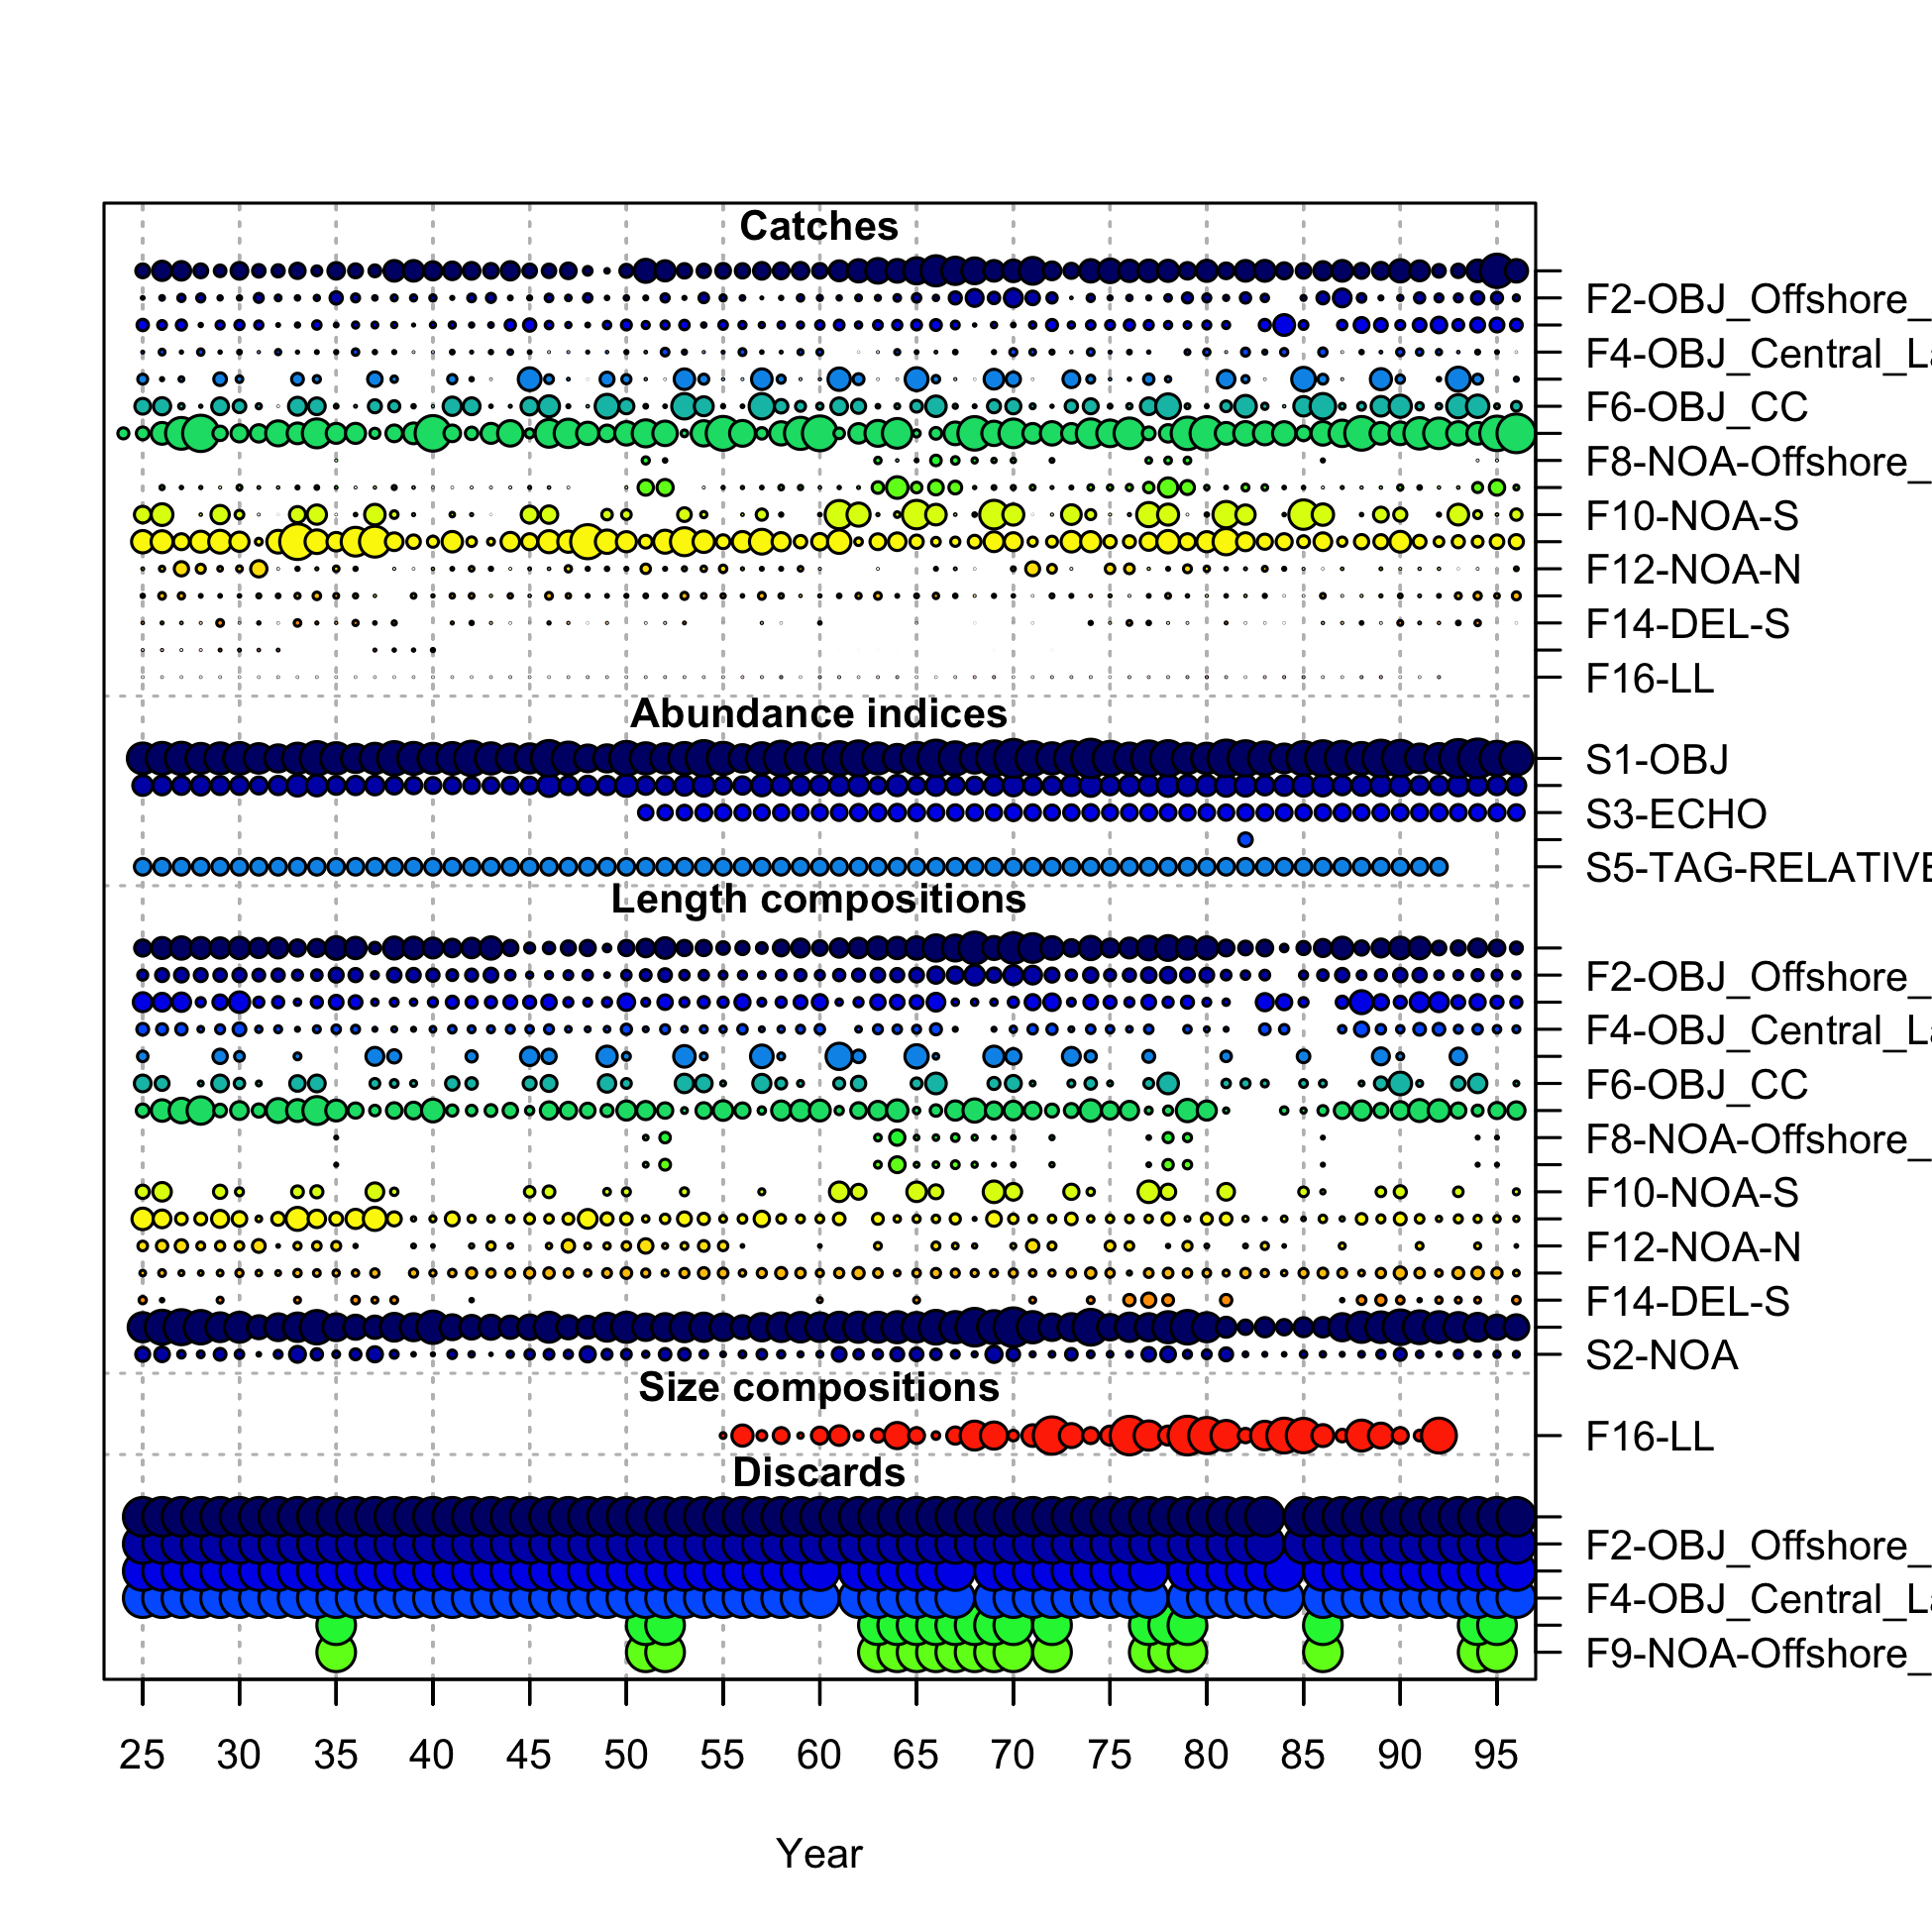
Data presence by year for each fleet, where circle area is
relative within a data type. Circles are proportional to
total catch for catches; to precision for indices, discards, and
mean body weight observations; and to total sample size for
compositions and mean weight- or length-at-age observations.
Observations excluded from the likelihood have
equal size for all years.
Note that since the circles are are scaled relative
to maximum within each type, the scaling within separate plots
should not be compared.
file: data_plot2.png