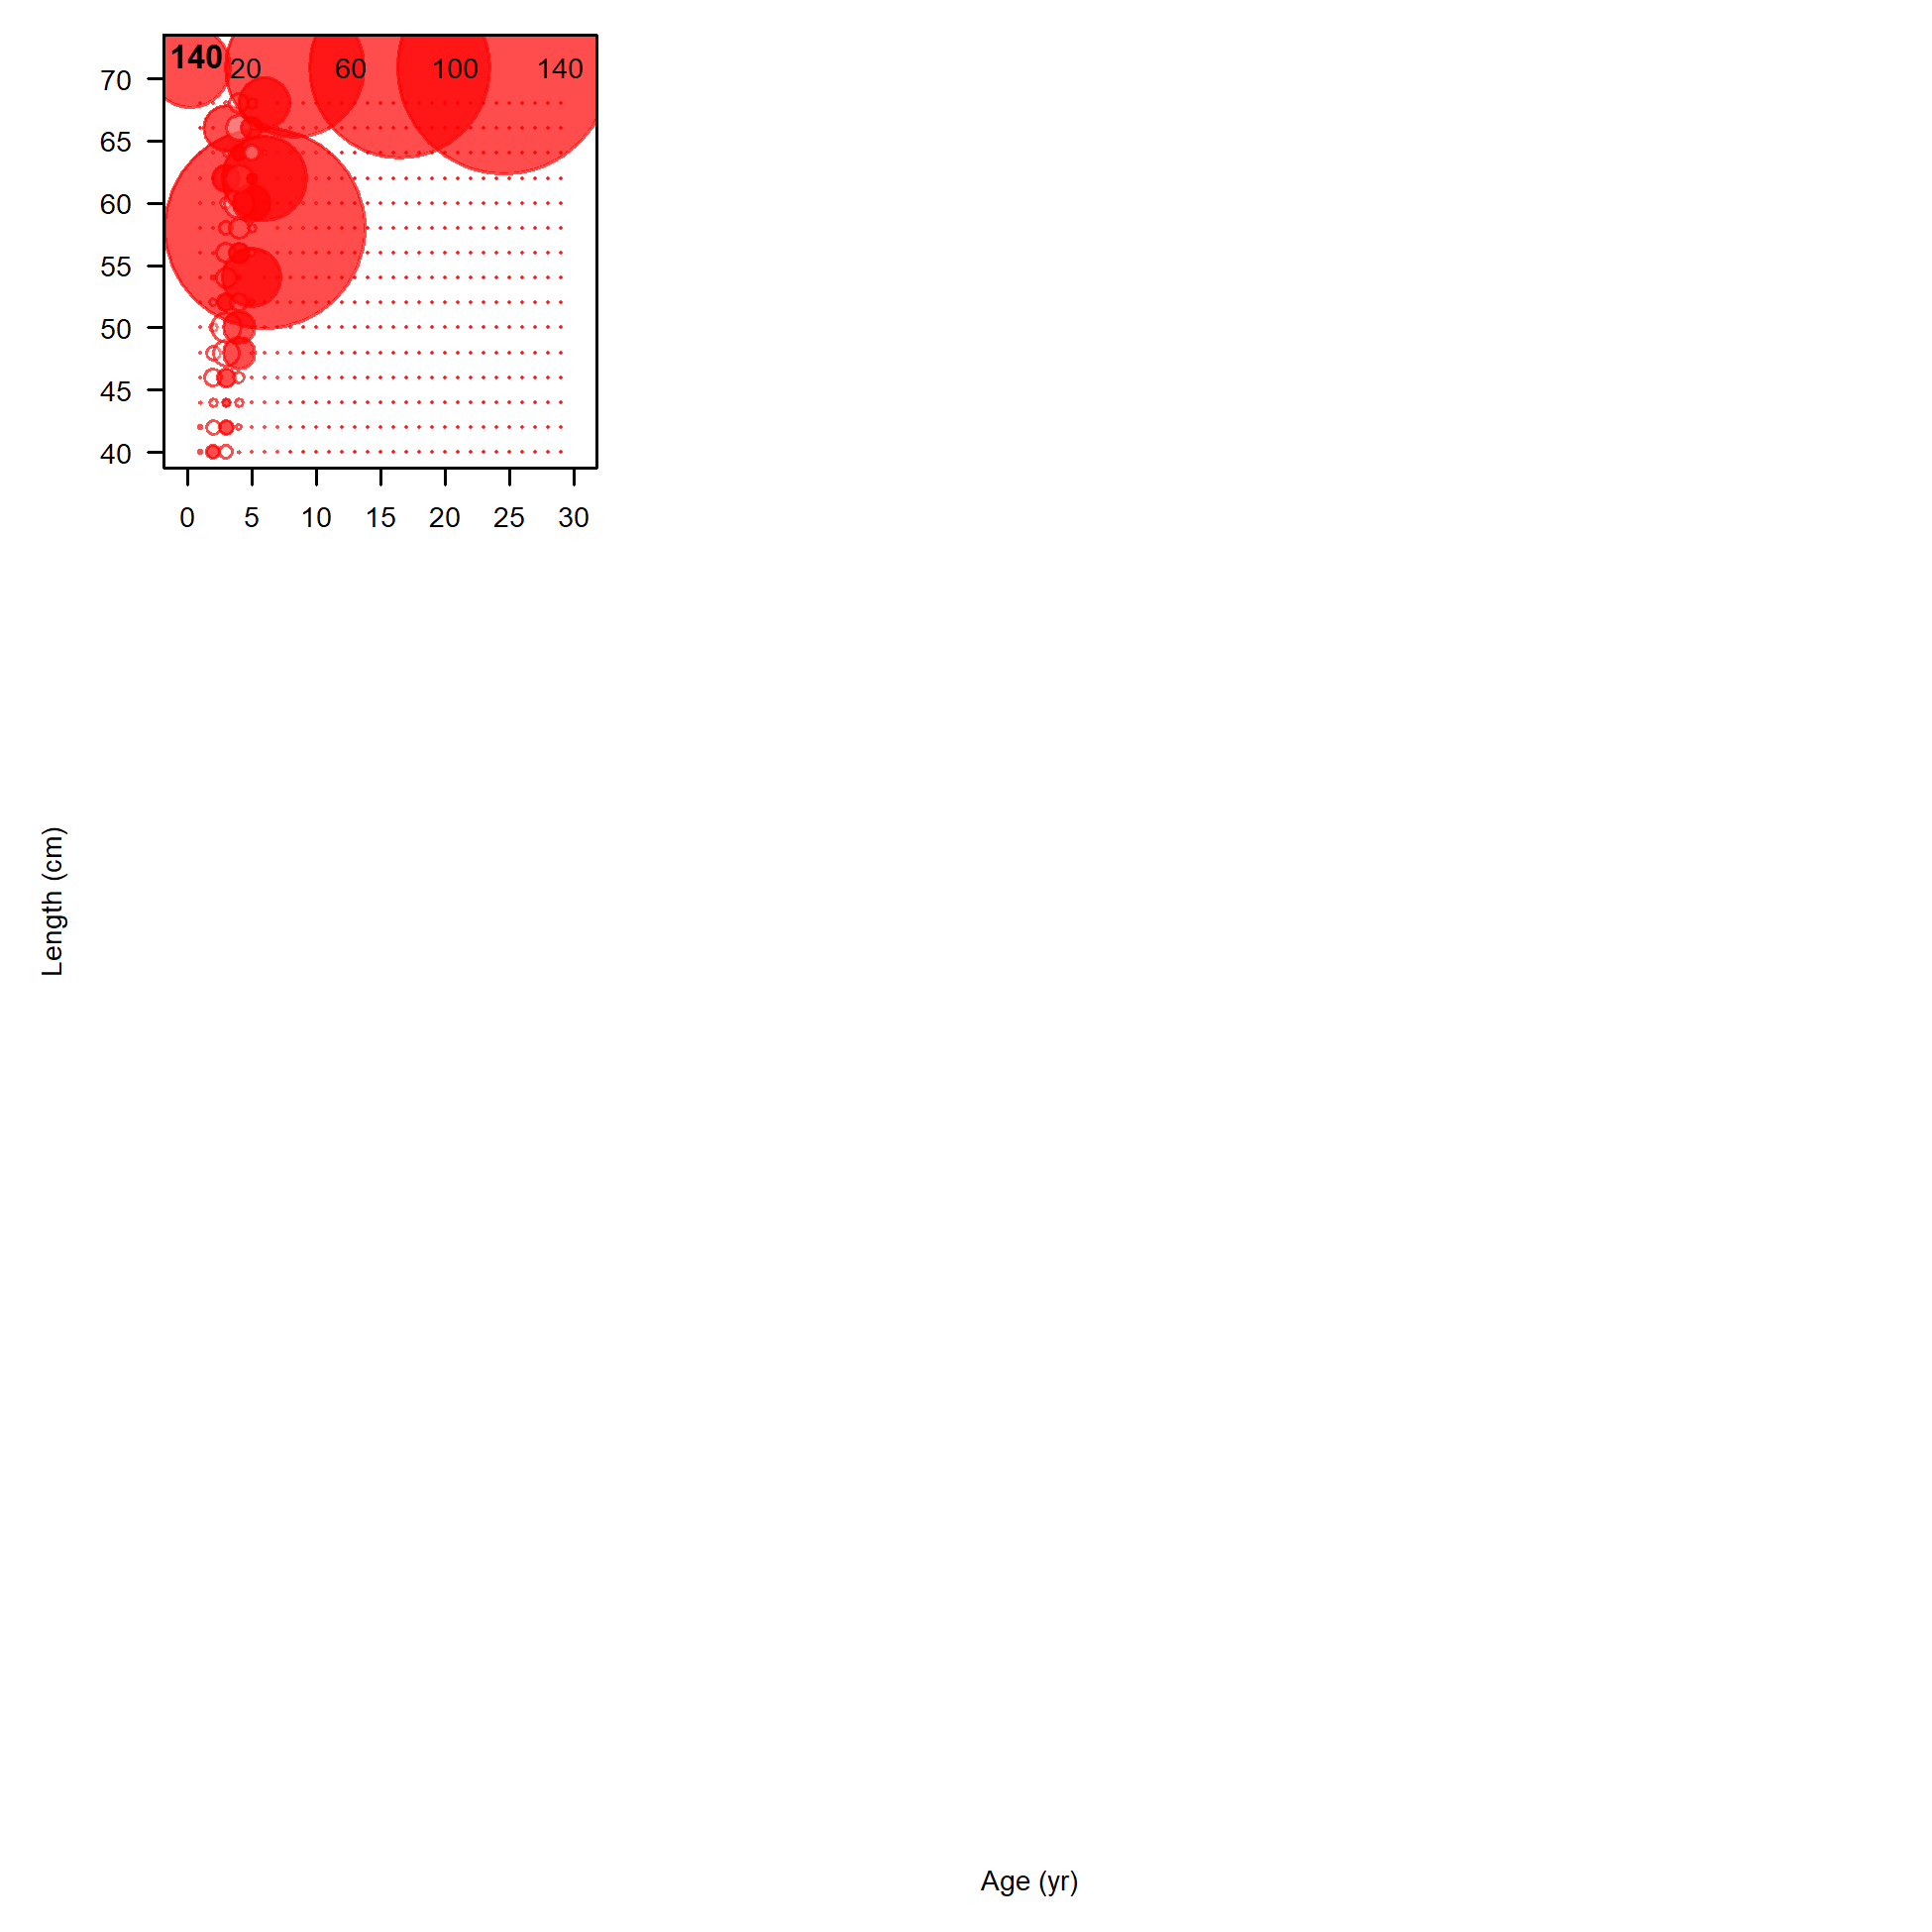
Pearson residuals, whole catch, F2_PS_OBJ_Core (max=123.21)
file: comp_condAALfit_residsflt2mkt0.png
Pearson residuals, whole catch, F2_PS_OBJ_Core (max=123.21)
file: comp_condAALfit_residsflt2mkt0.png
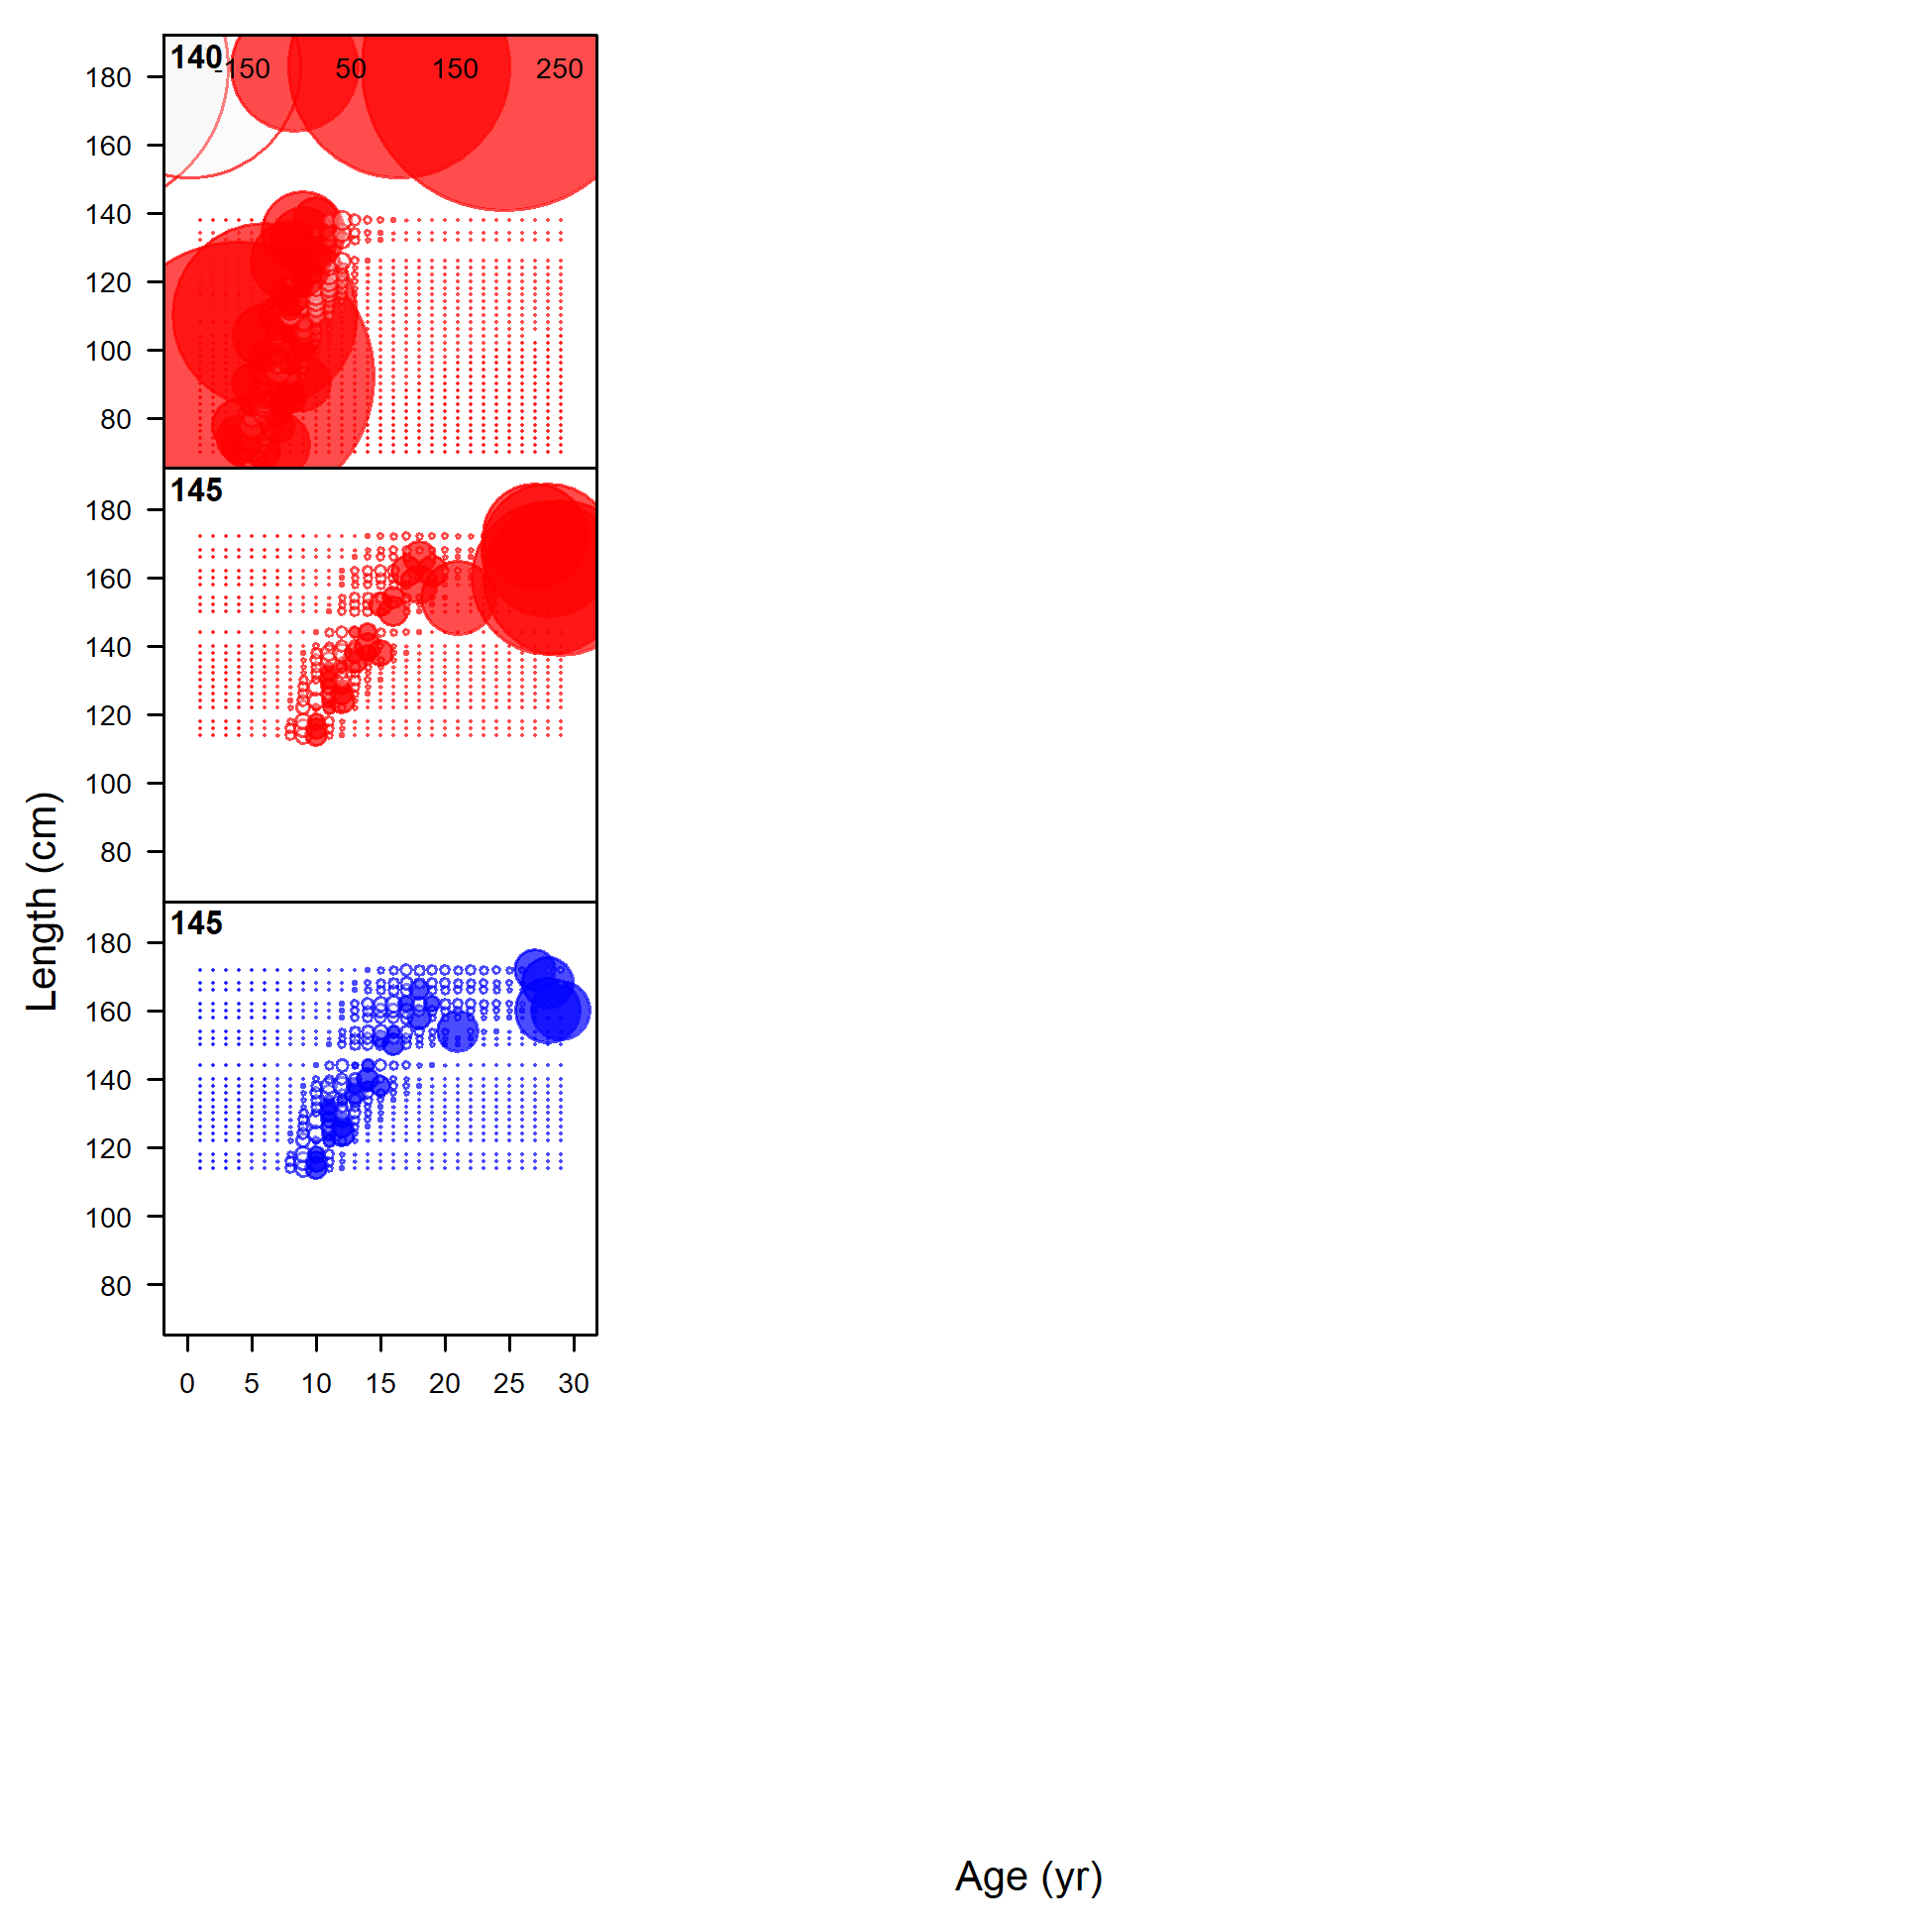
Pearson residuals, whole catch, F15_PS_DEL_Core (max=223.19)
file: comp_condAALfit_residsflt15mkt0.png

Mean age from conditional data (aggregated across length bins) for F2_PS_OBJ_Core with 95% confidence intervals based on current samples sizes.
Francis data weighting method TA1.8: too few points to calculate adjustments.
For more info, see Francis (2011) and Punt (2017).
file: comp_condAALfit_data_weighting_TA1-8_condAgeF2_PS_OBJ_Core.png
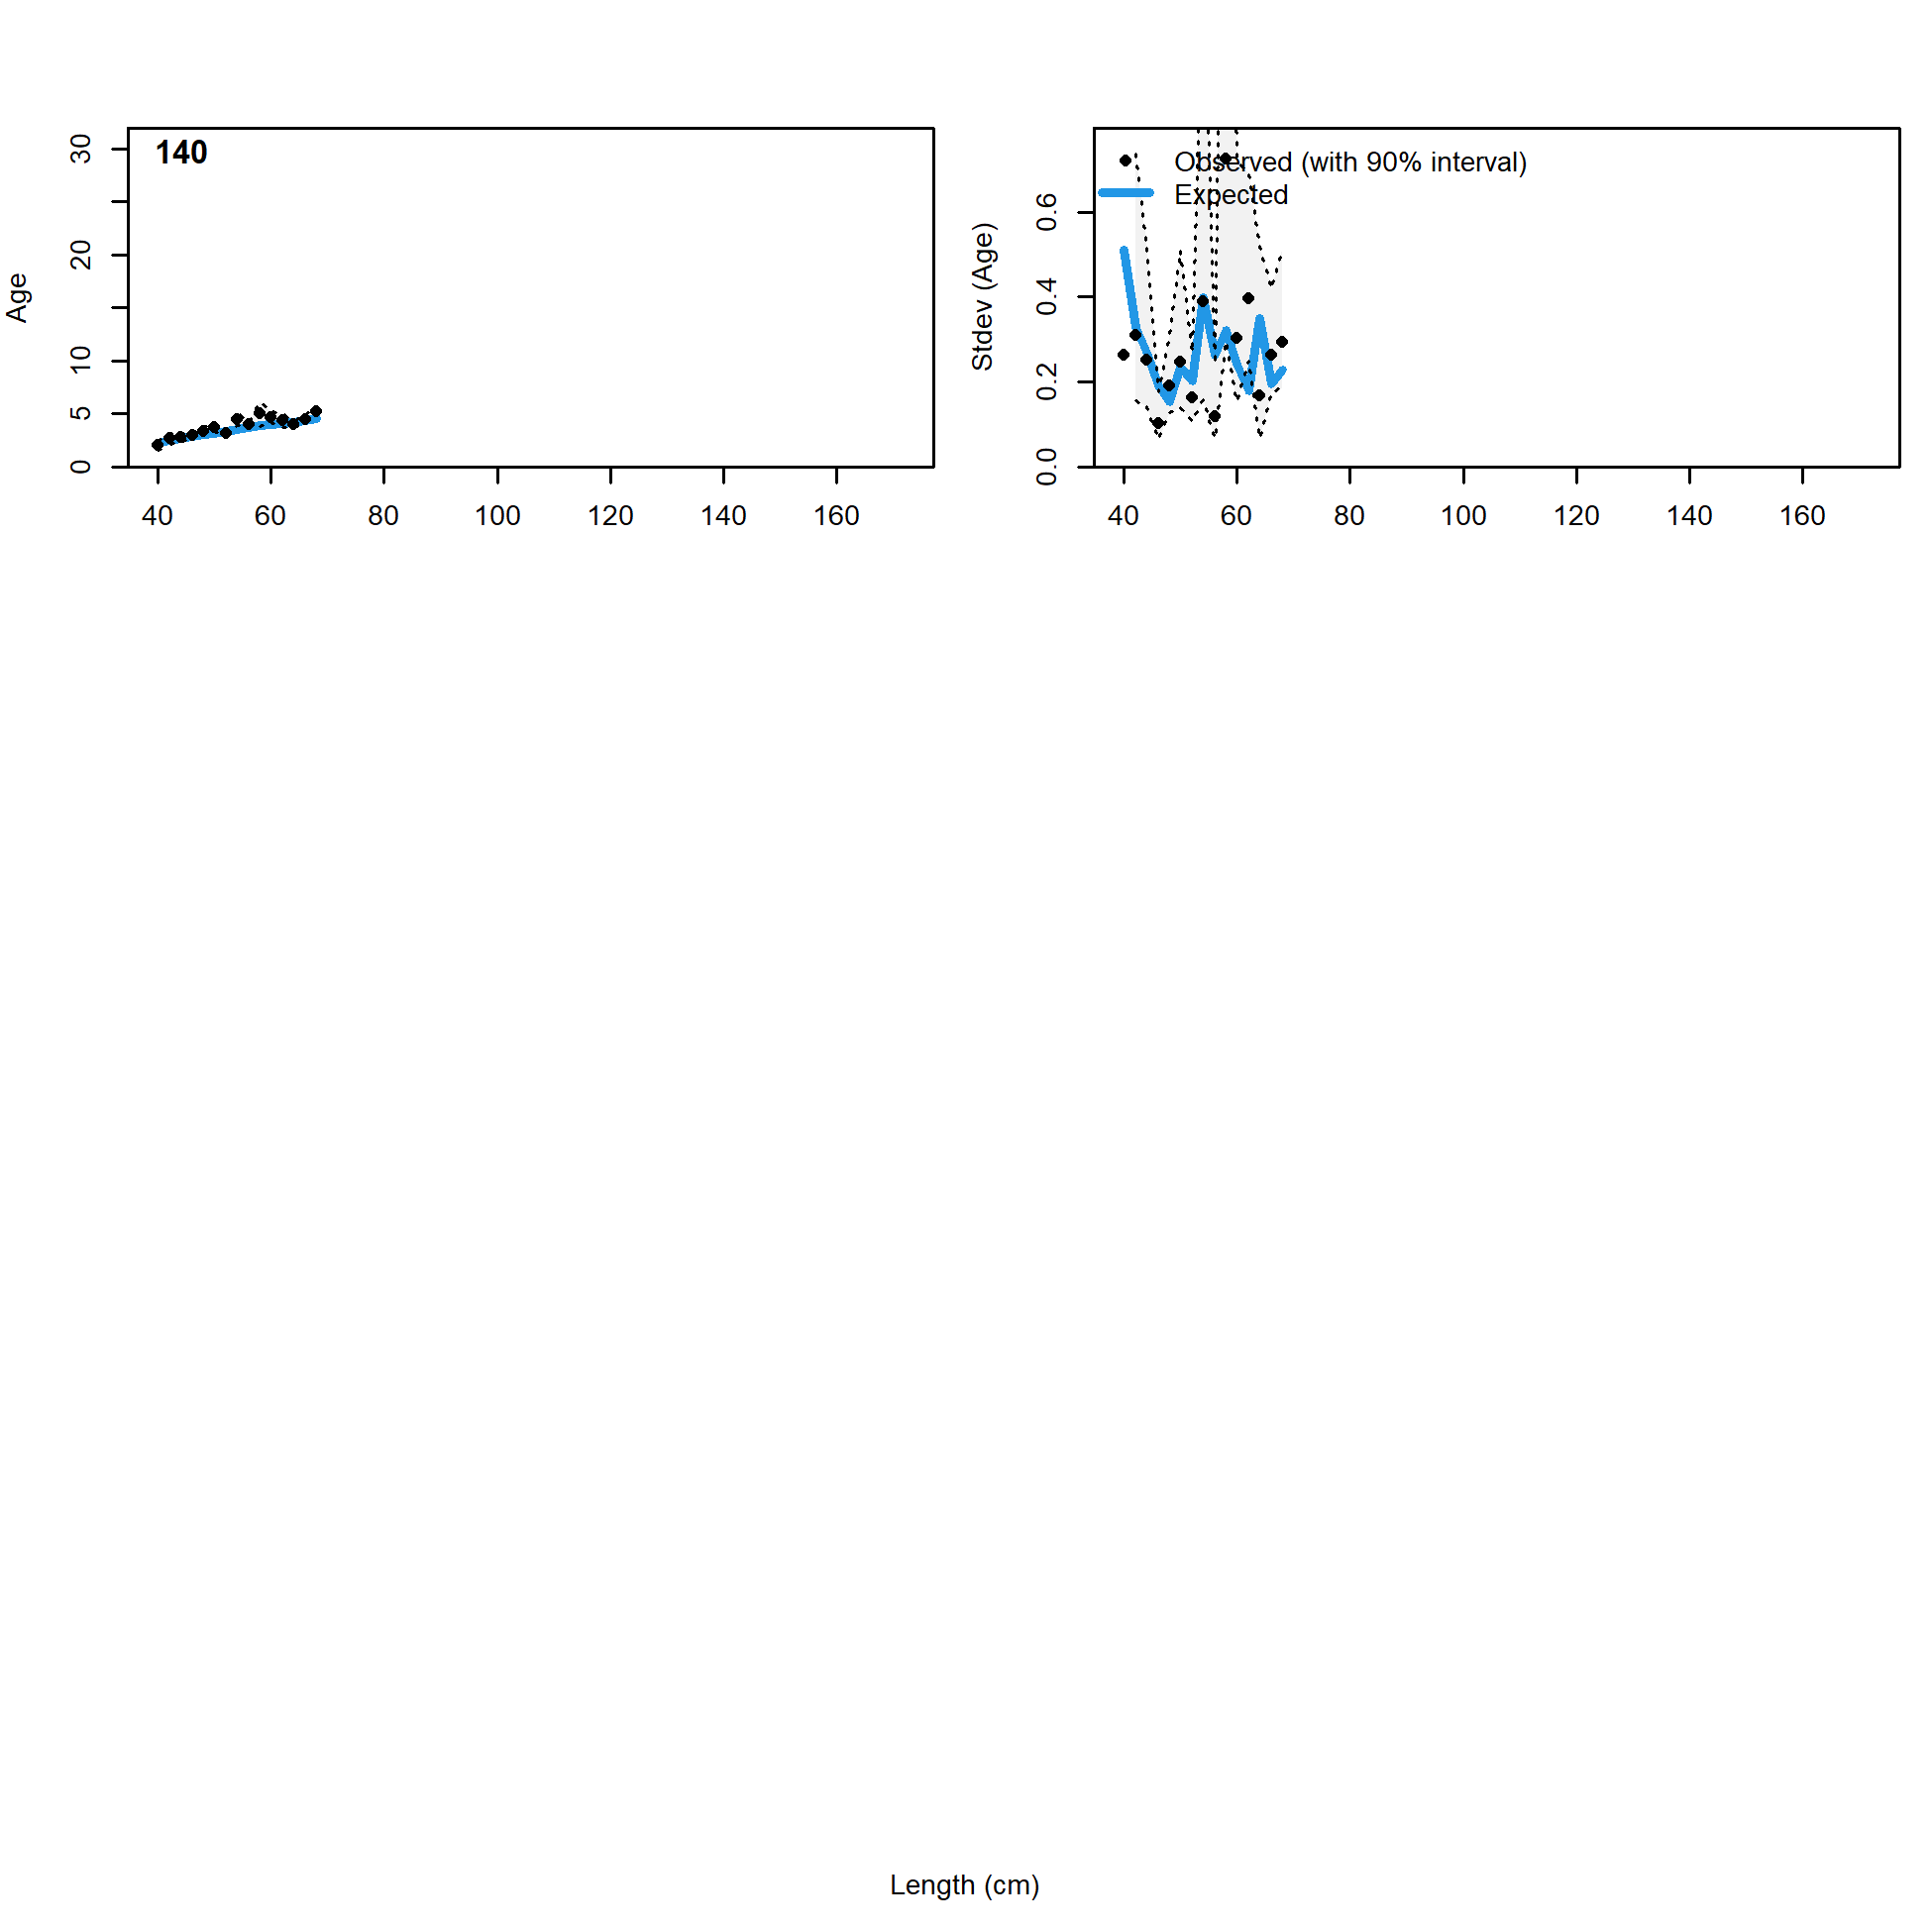
Conditional AAL plot, whole catch, F2_PS_OBJ_Core
These plots show mean age and std. dev. in conditional A@L.
Left plots are mean A@L by size-class (obs. and exp.) with 90% CIs based on adding 1.64 SE of mean to the data.
Right plots in each pair are SE of mean A@L (obs. and exp.) with 90% CIs based on the chi-square distribution.
file: comp_condAALfit_Andre_plotsflt2mkt0.png
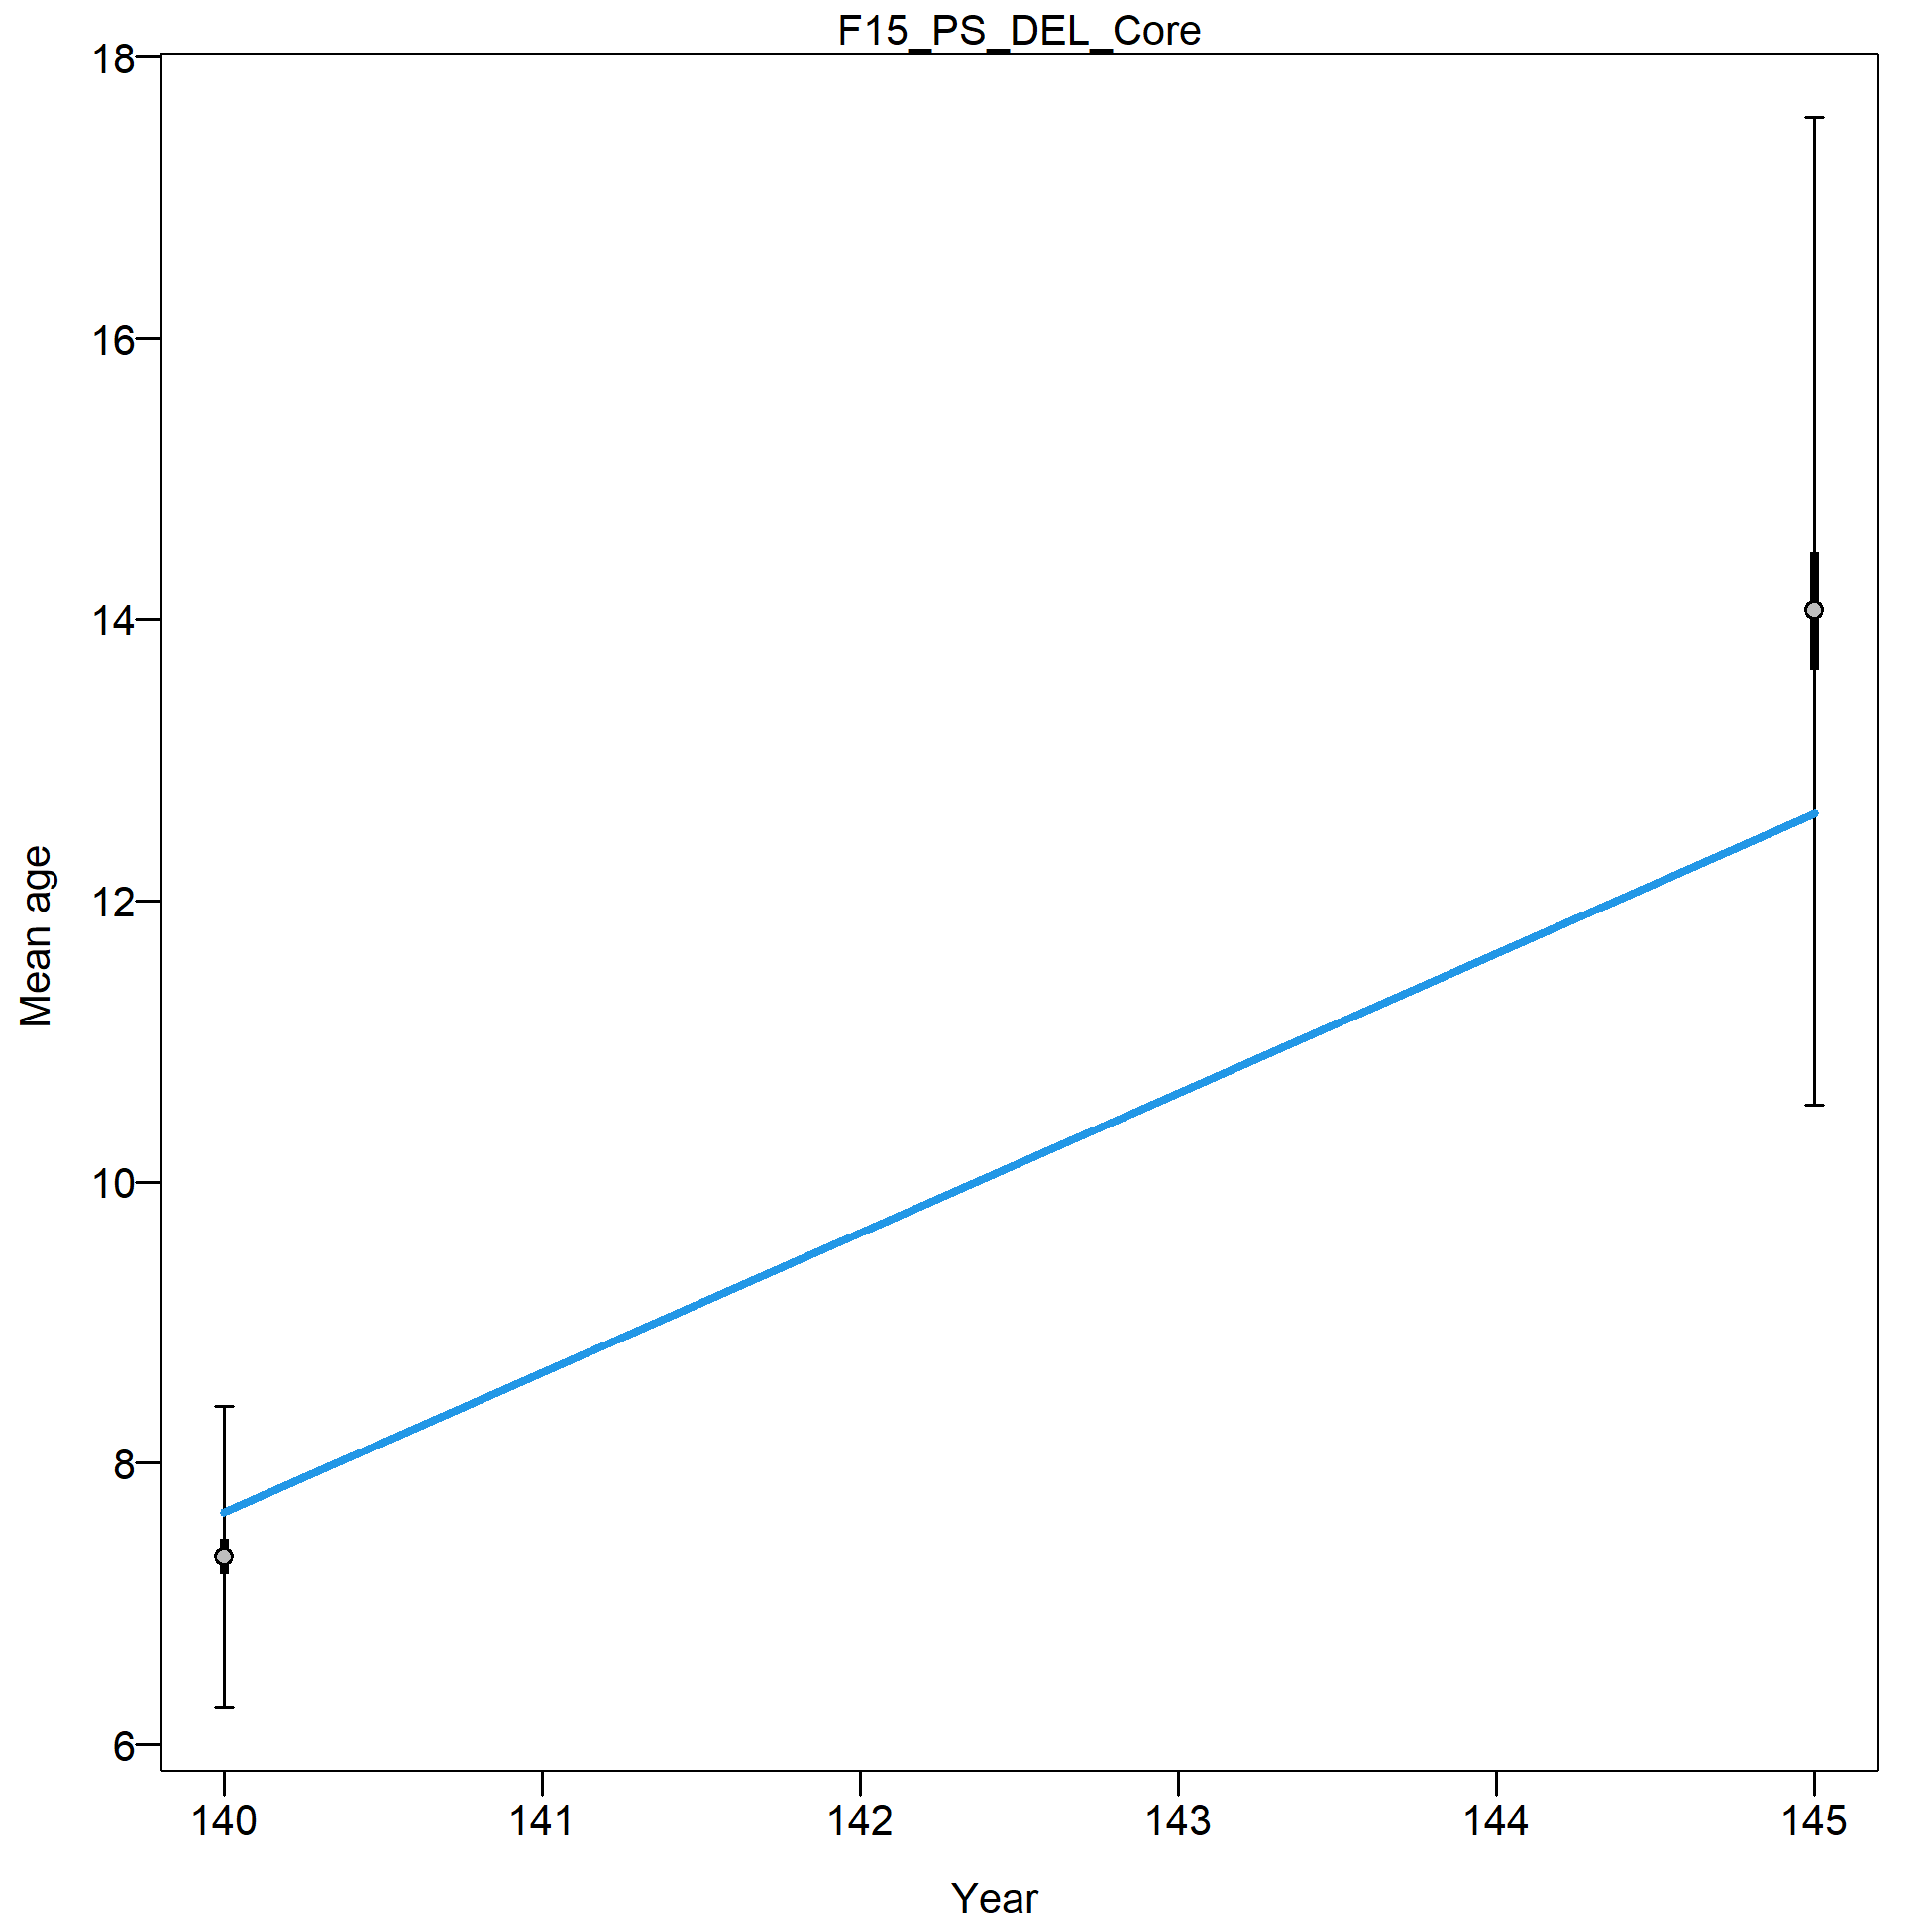
Mean age from conditional data (aggregated across length bins) for F15_PS_DEL_Core with 95% confidence intervals based on current samples sizes.
Francis data weighting method TA1.8: thinner intervals (with capped ends) show result of further adjusting sample sizes based on suggested multiplier (with 95% interval) for conditional age-at-length data from F15_PS_DEL_Core:
0.0143 (0.0143-Inf)
For more info, see Francis (2011) and Punt (2017).
file: comp_condAALfit_data_weighting_TA1-8_condAgeF15_PS_DEL_Core.png
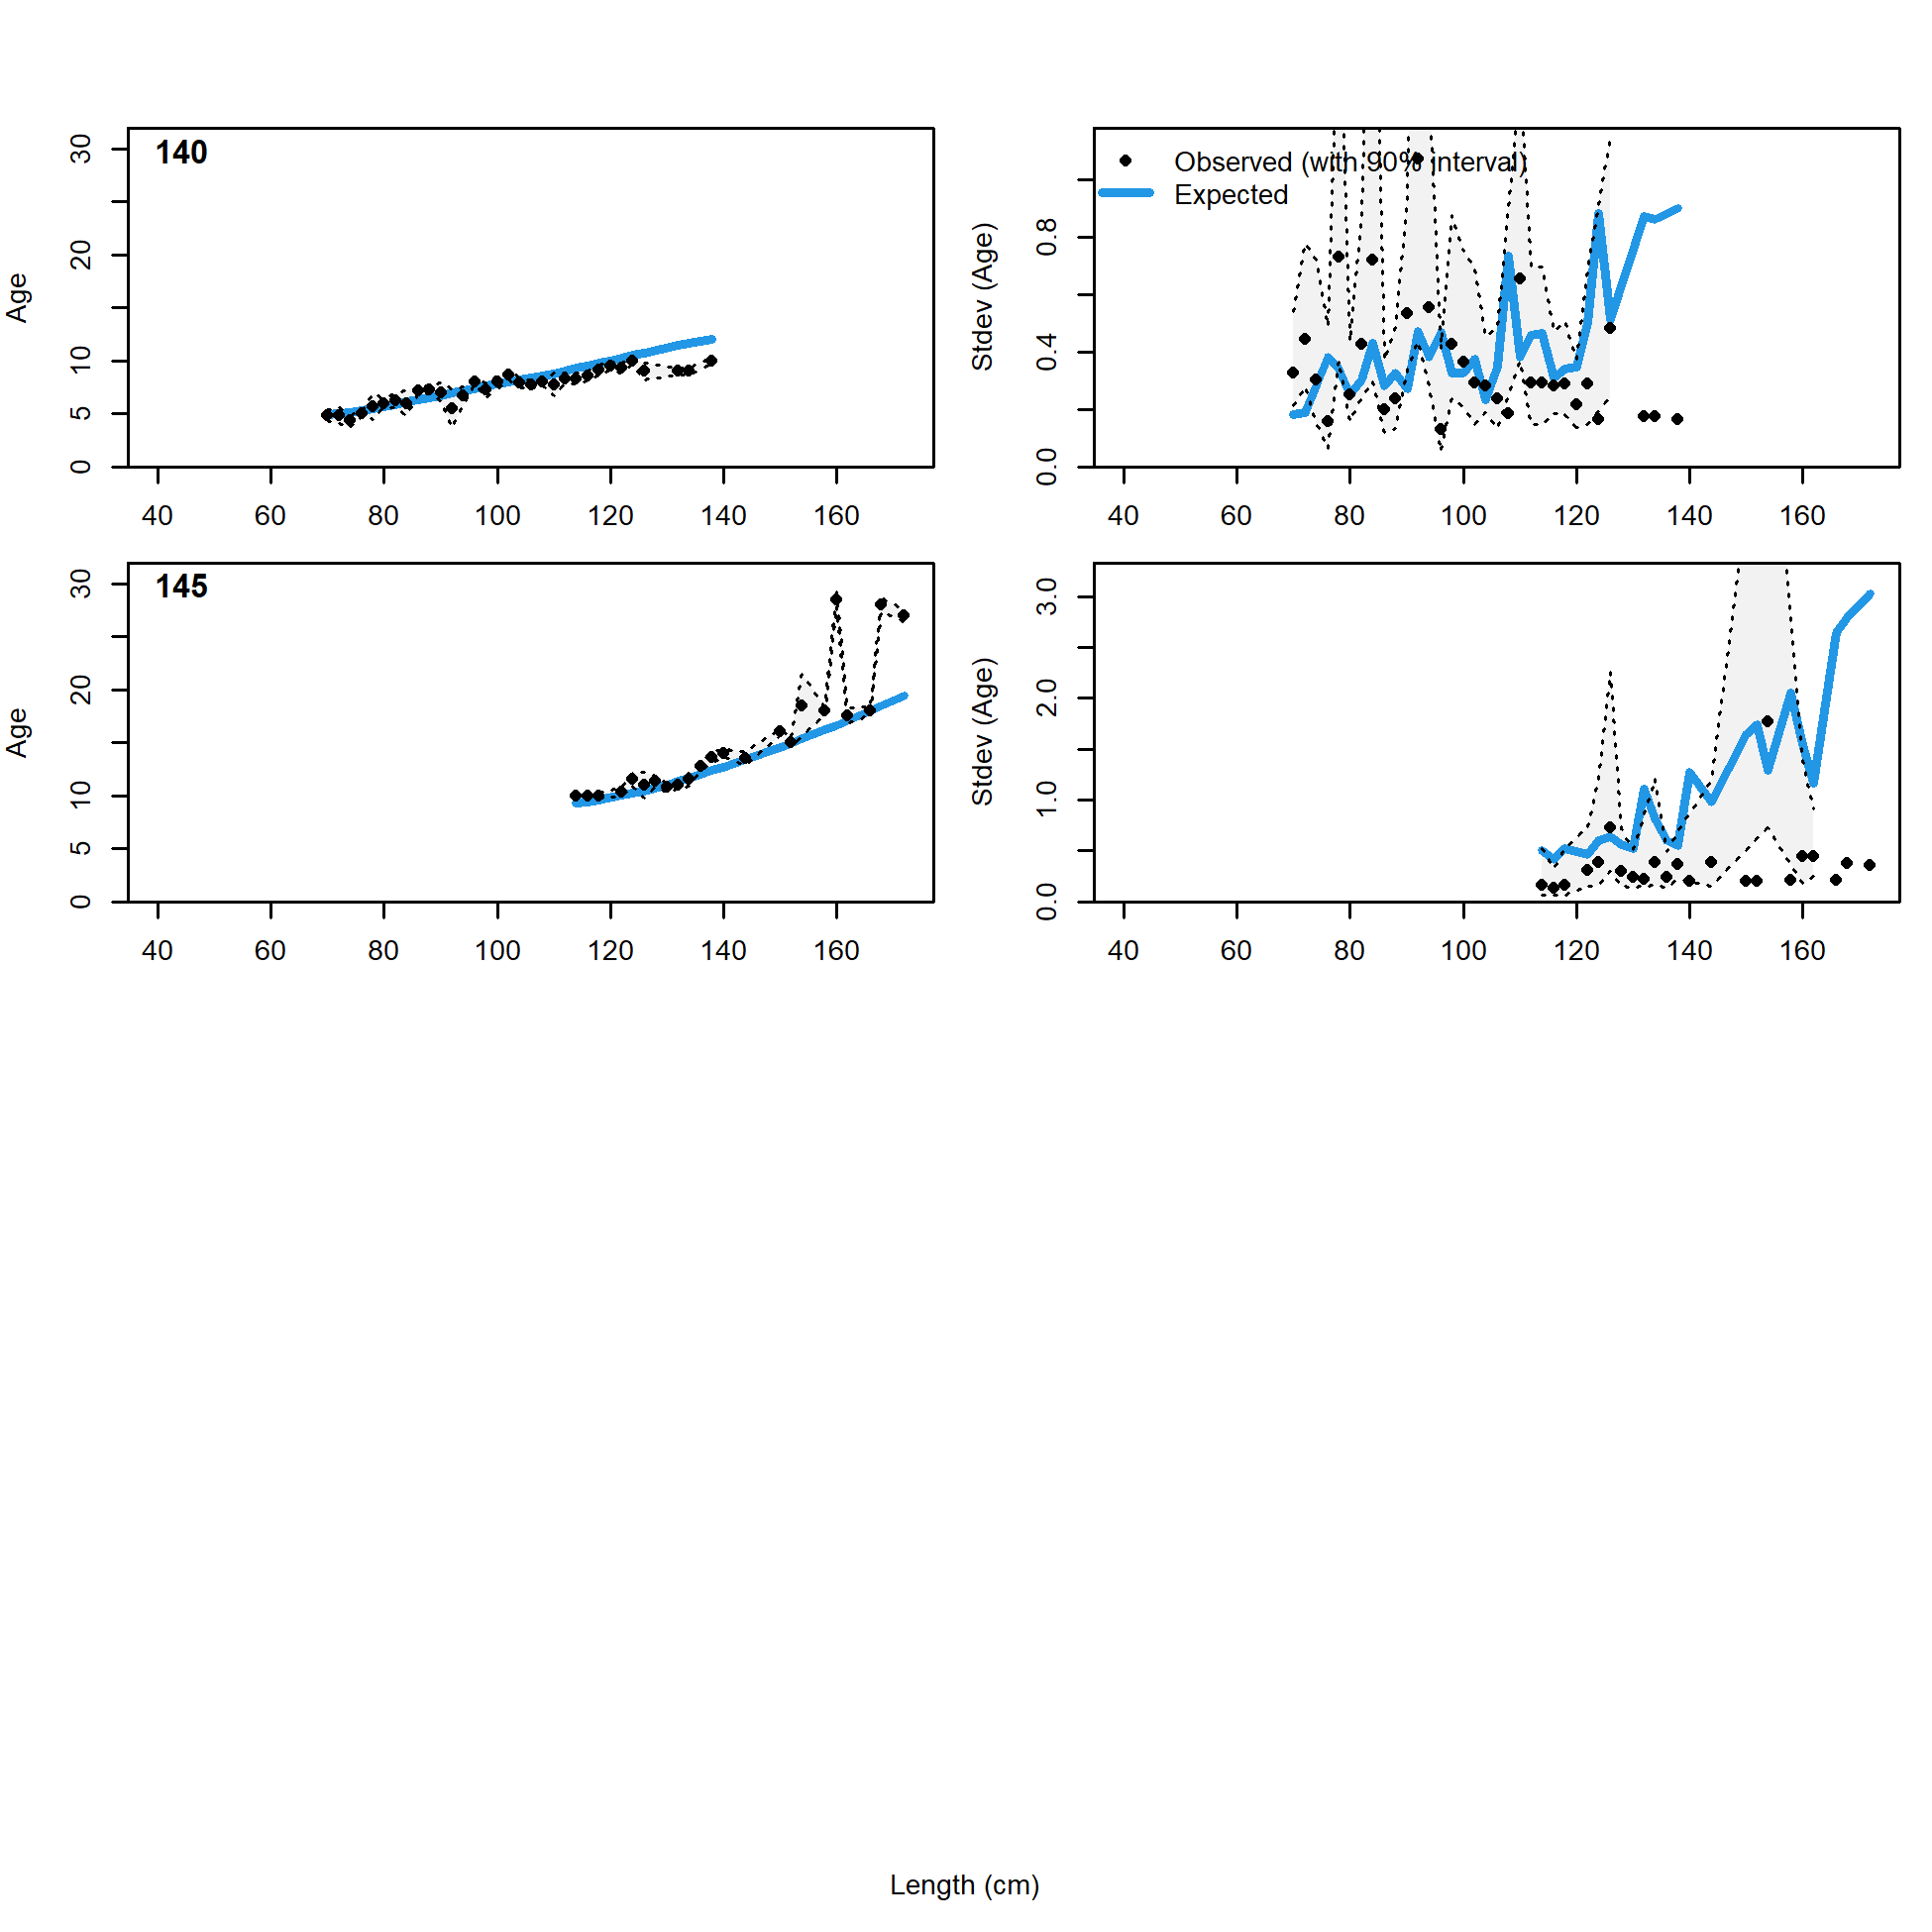
Conditional AAL plot, whole catch, F15_PS_DEL_Core
These plots show mean age and std. dev. in conditional A@L.
Left plots are mean A@L by size-class (obs. and exp.) with 90% CIs based on adding 1.64 SE of mean to the data.
Right plots in each pair are SE of mean A@L (obs. and exp.) with 90% CIs based on the chi-square distribution.
file: comp_condAALfit_Andre_plotsflt15mkt0.png