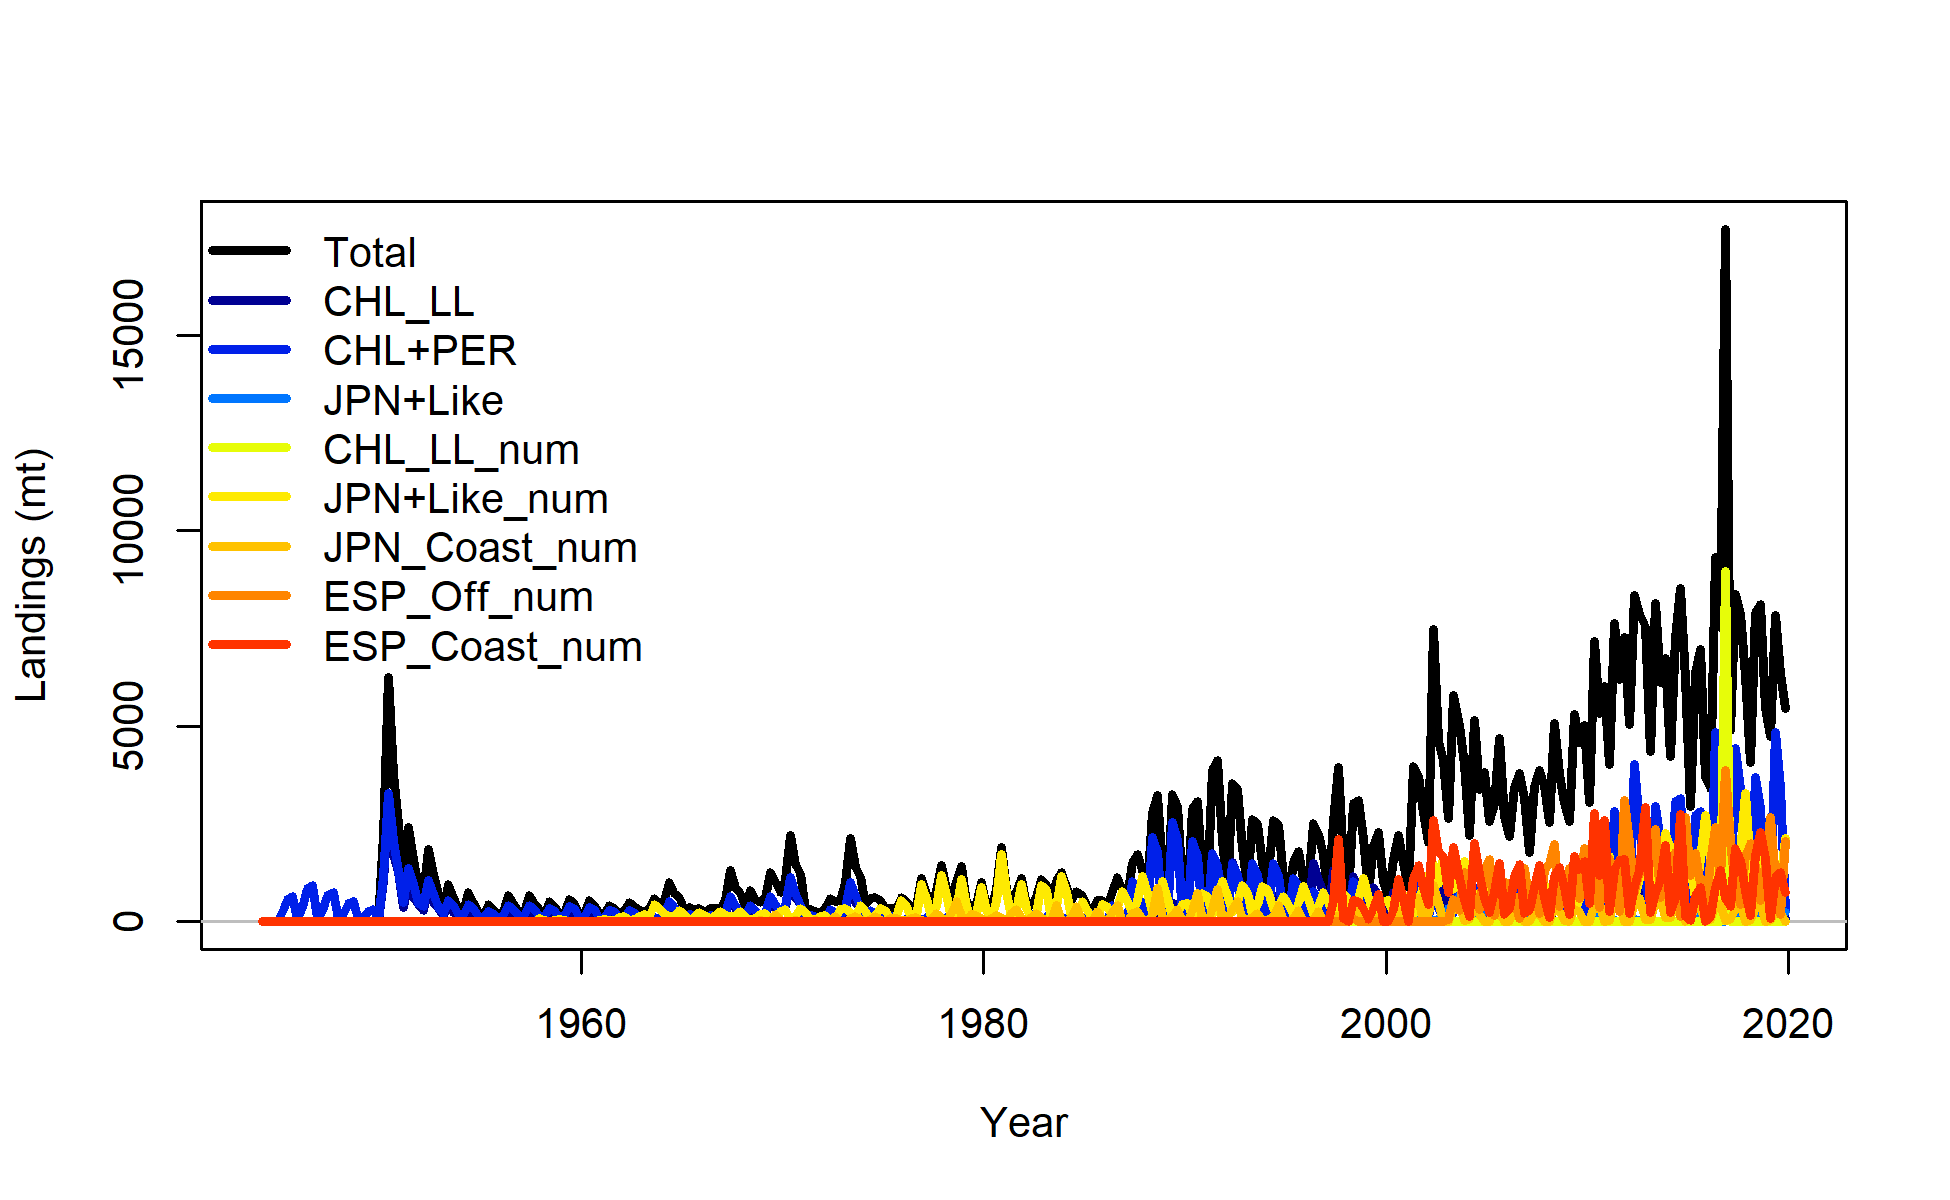
landings
file: catch1 landings.png
landings
file: catch1 landings.png
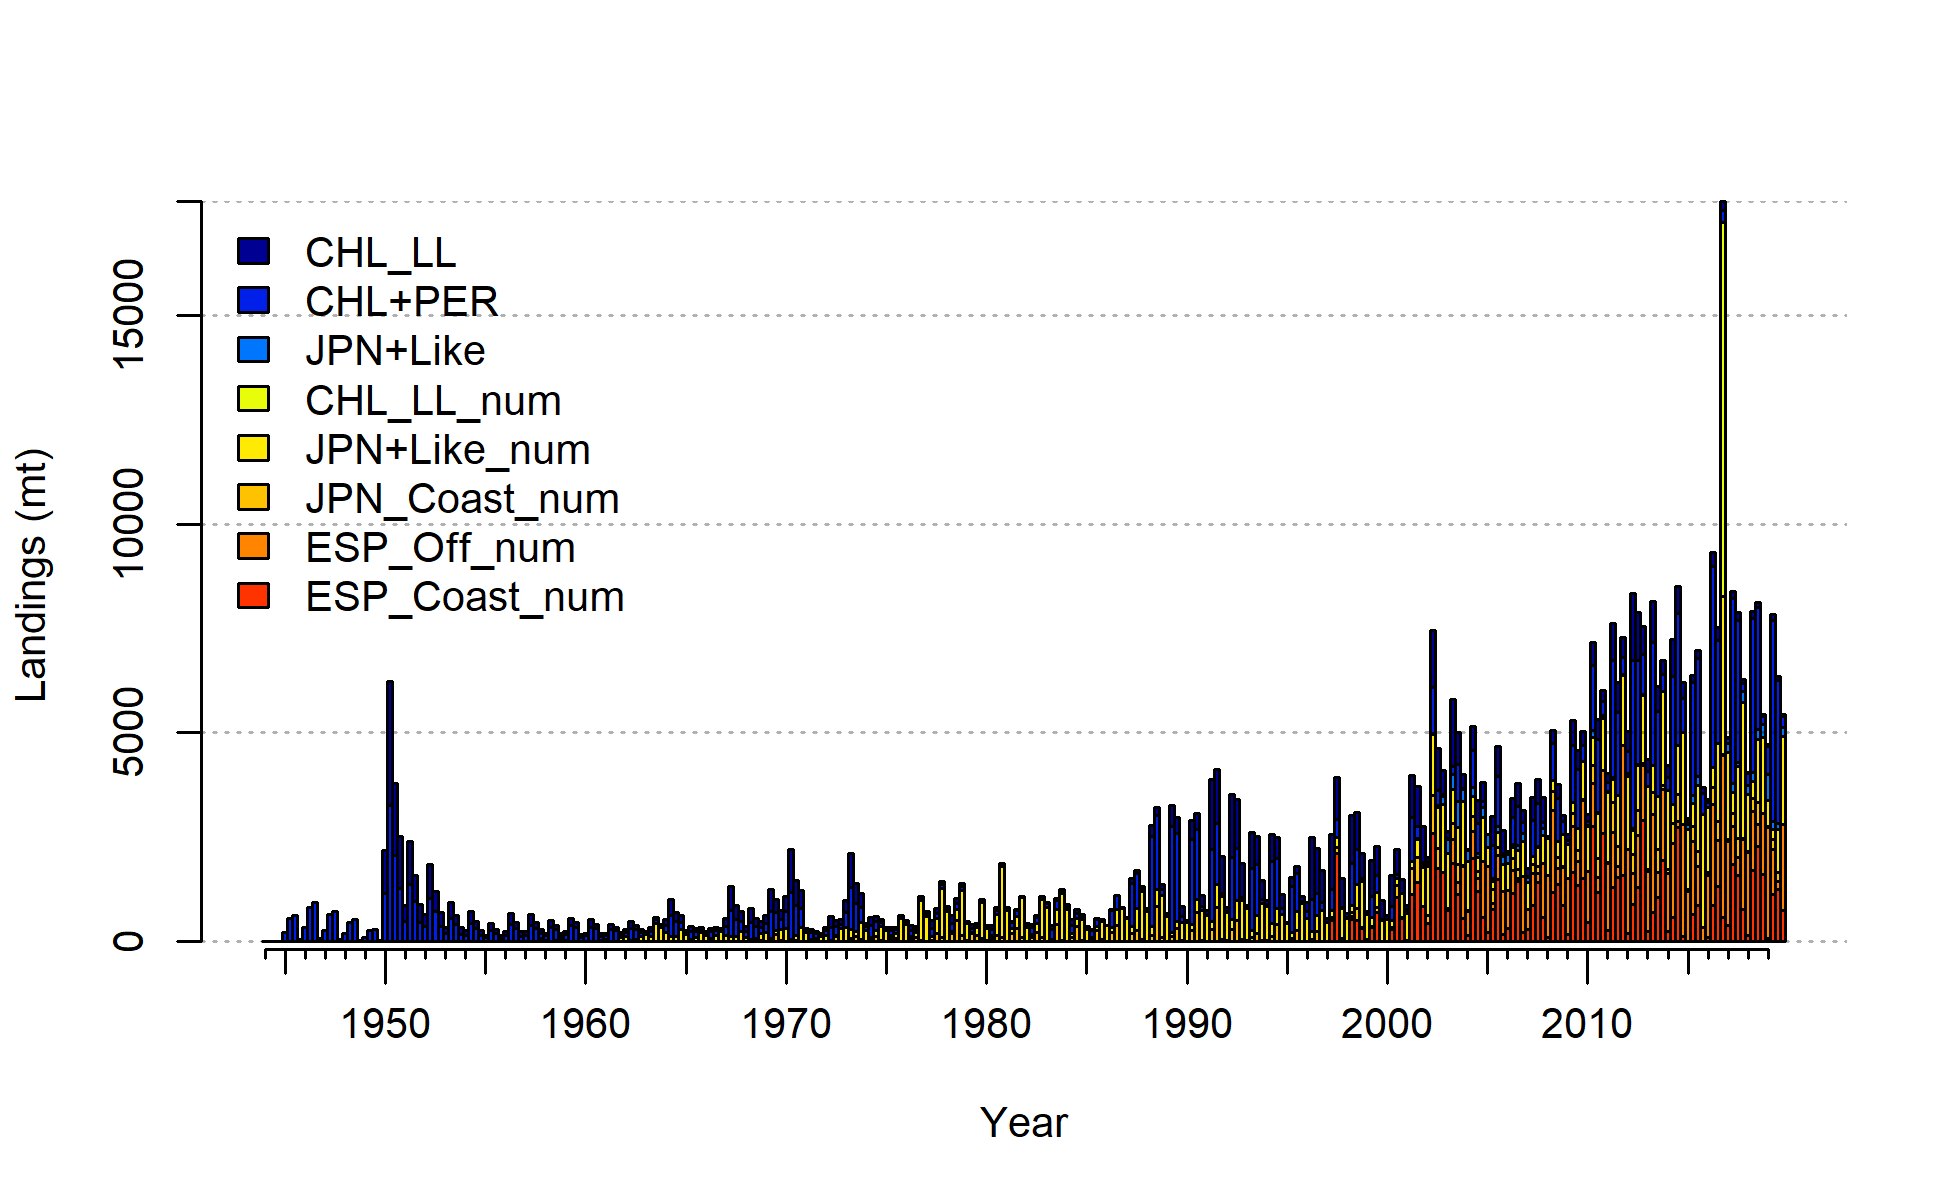
landings stacked
file: catch2 landings stacked.png
.png)
observed and expected landings (if different). Catch input in numbers is compared here to catch in biomass, making this figure less useful for models like this with catch in numbers. Future versions of this plot will be improve to compare catch in the same units.
file: catch3 observed and expected landings (if different).png
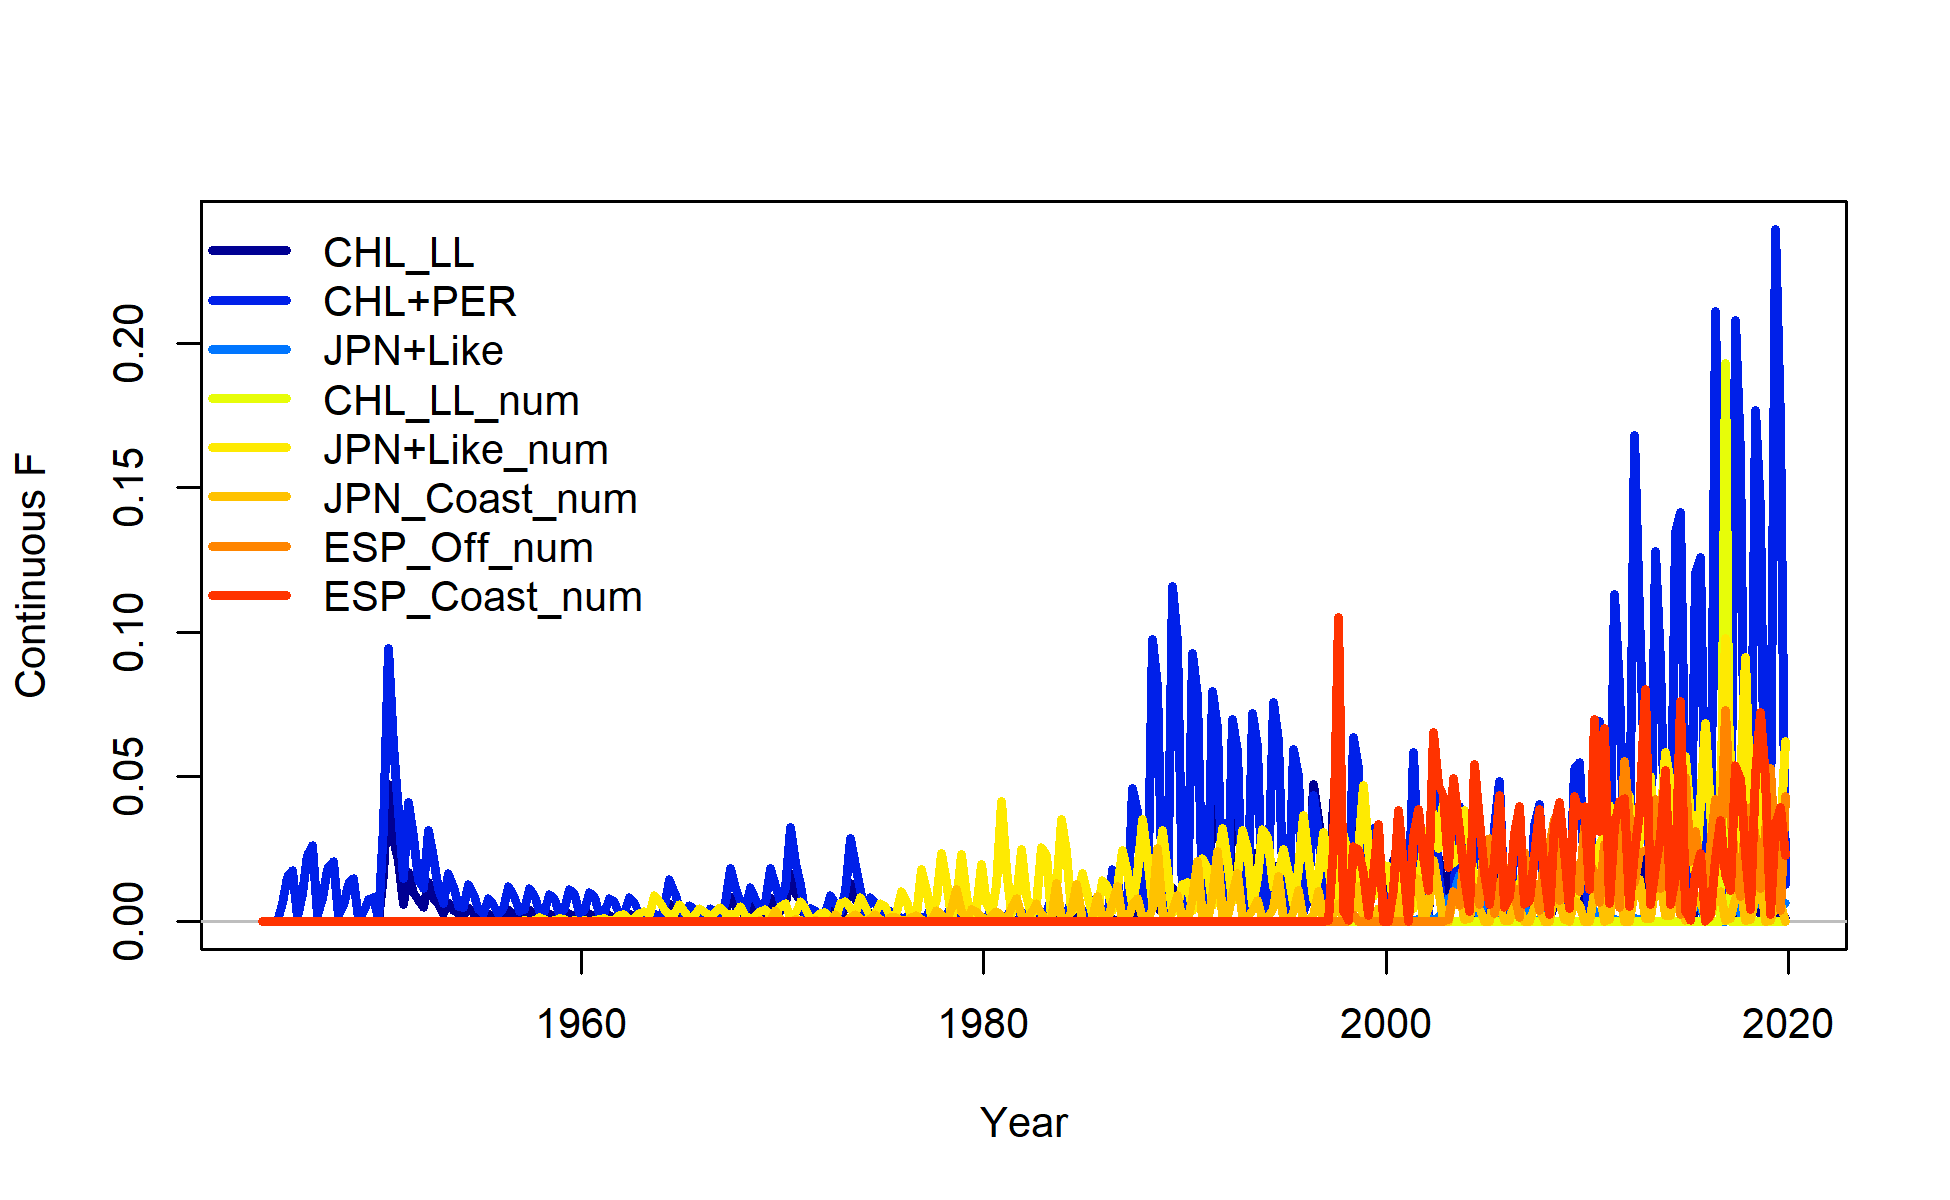
harvest rate
file: catch9 harvest rate.png
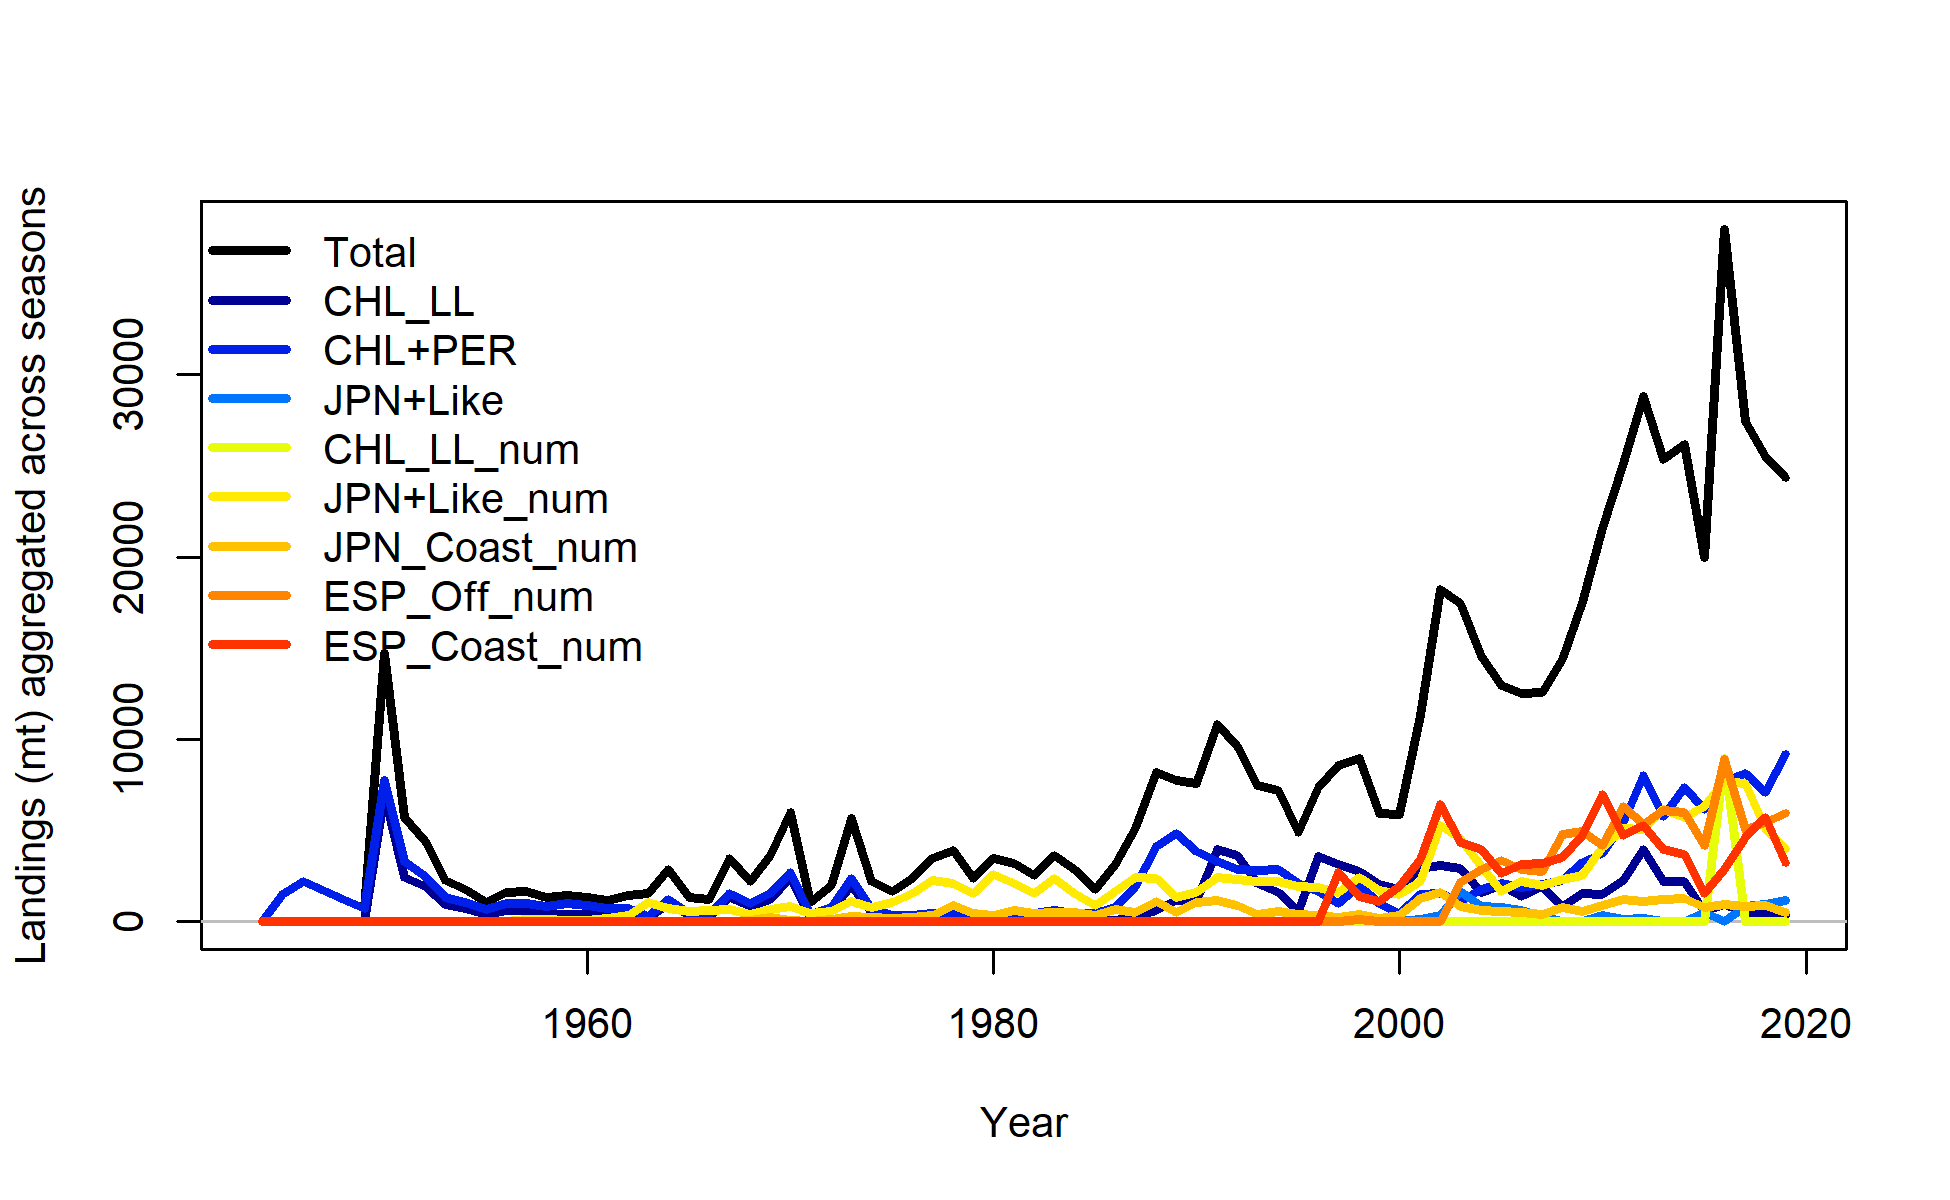
landings aggregated across seasons
file: catch10 landings aggregated across seasons.png
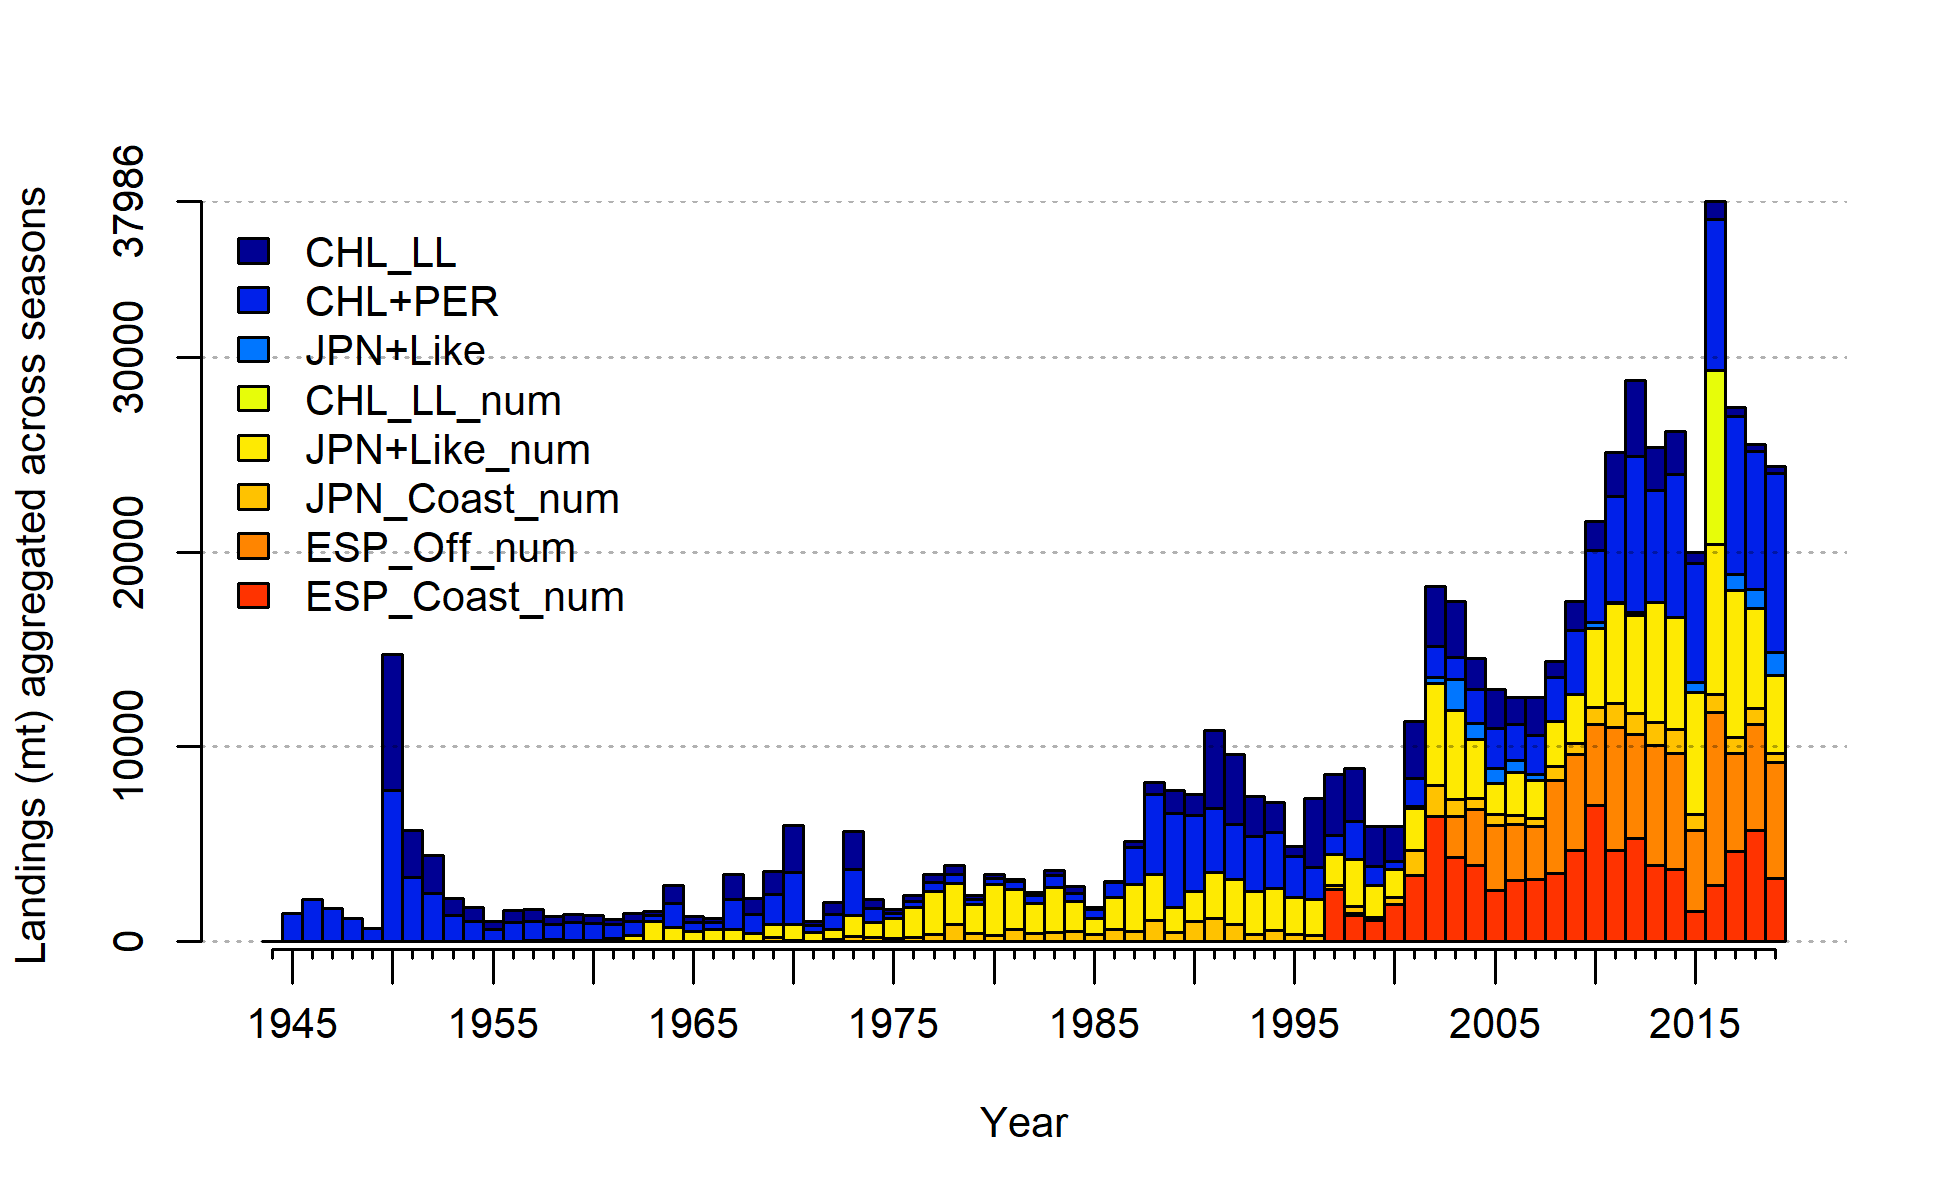
landings aggregated across seasons stacked
file: catch11 landings aggregated across seasons stacked.png