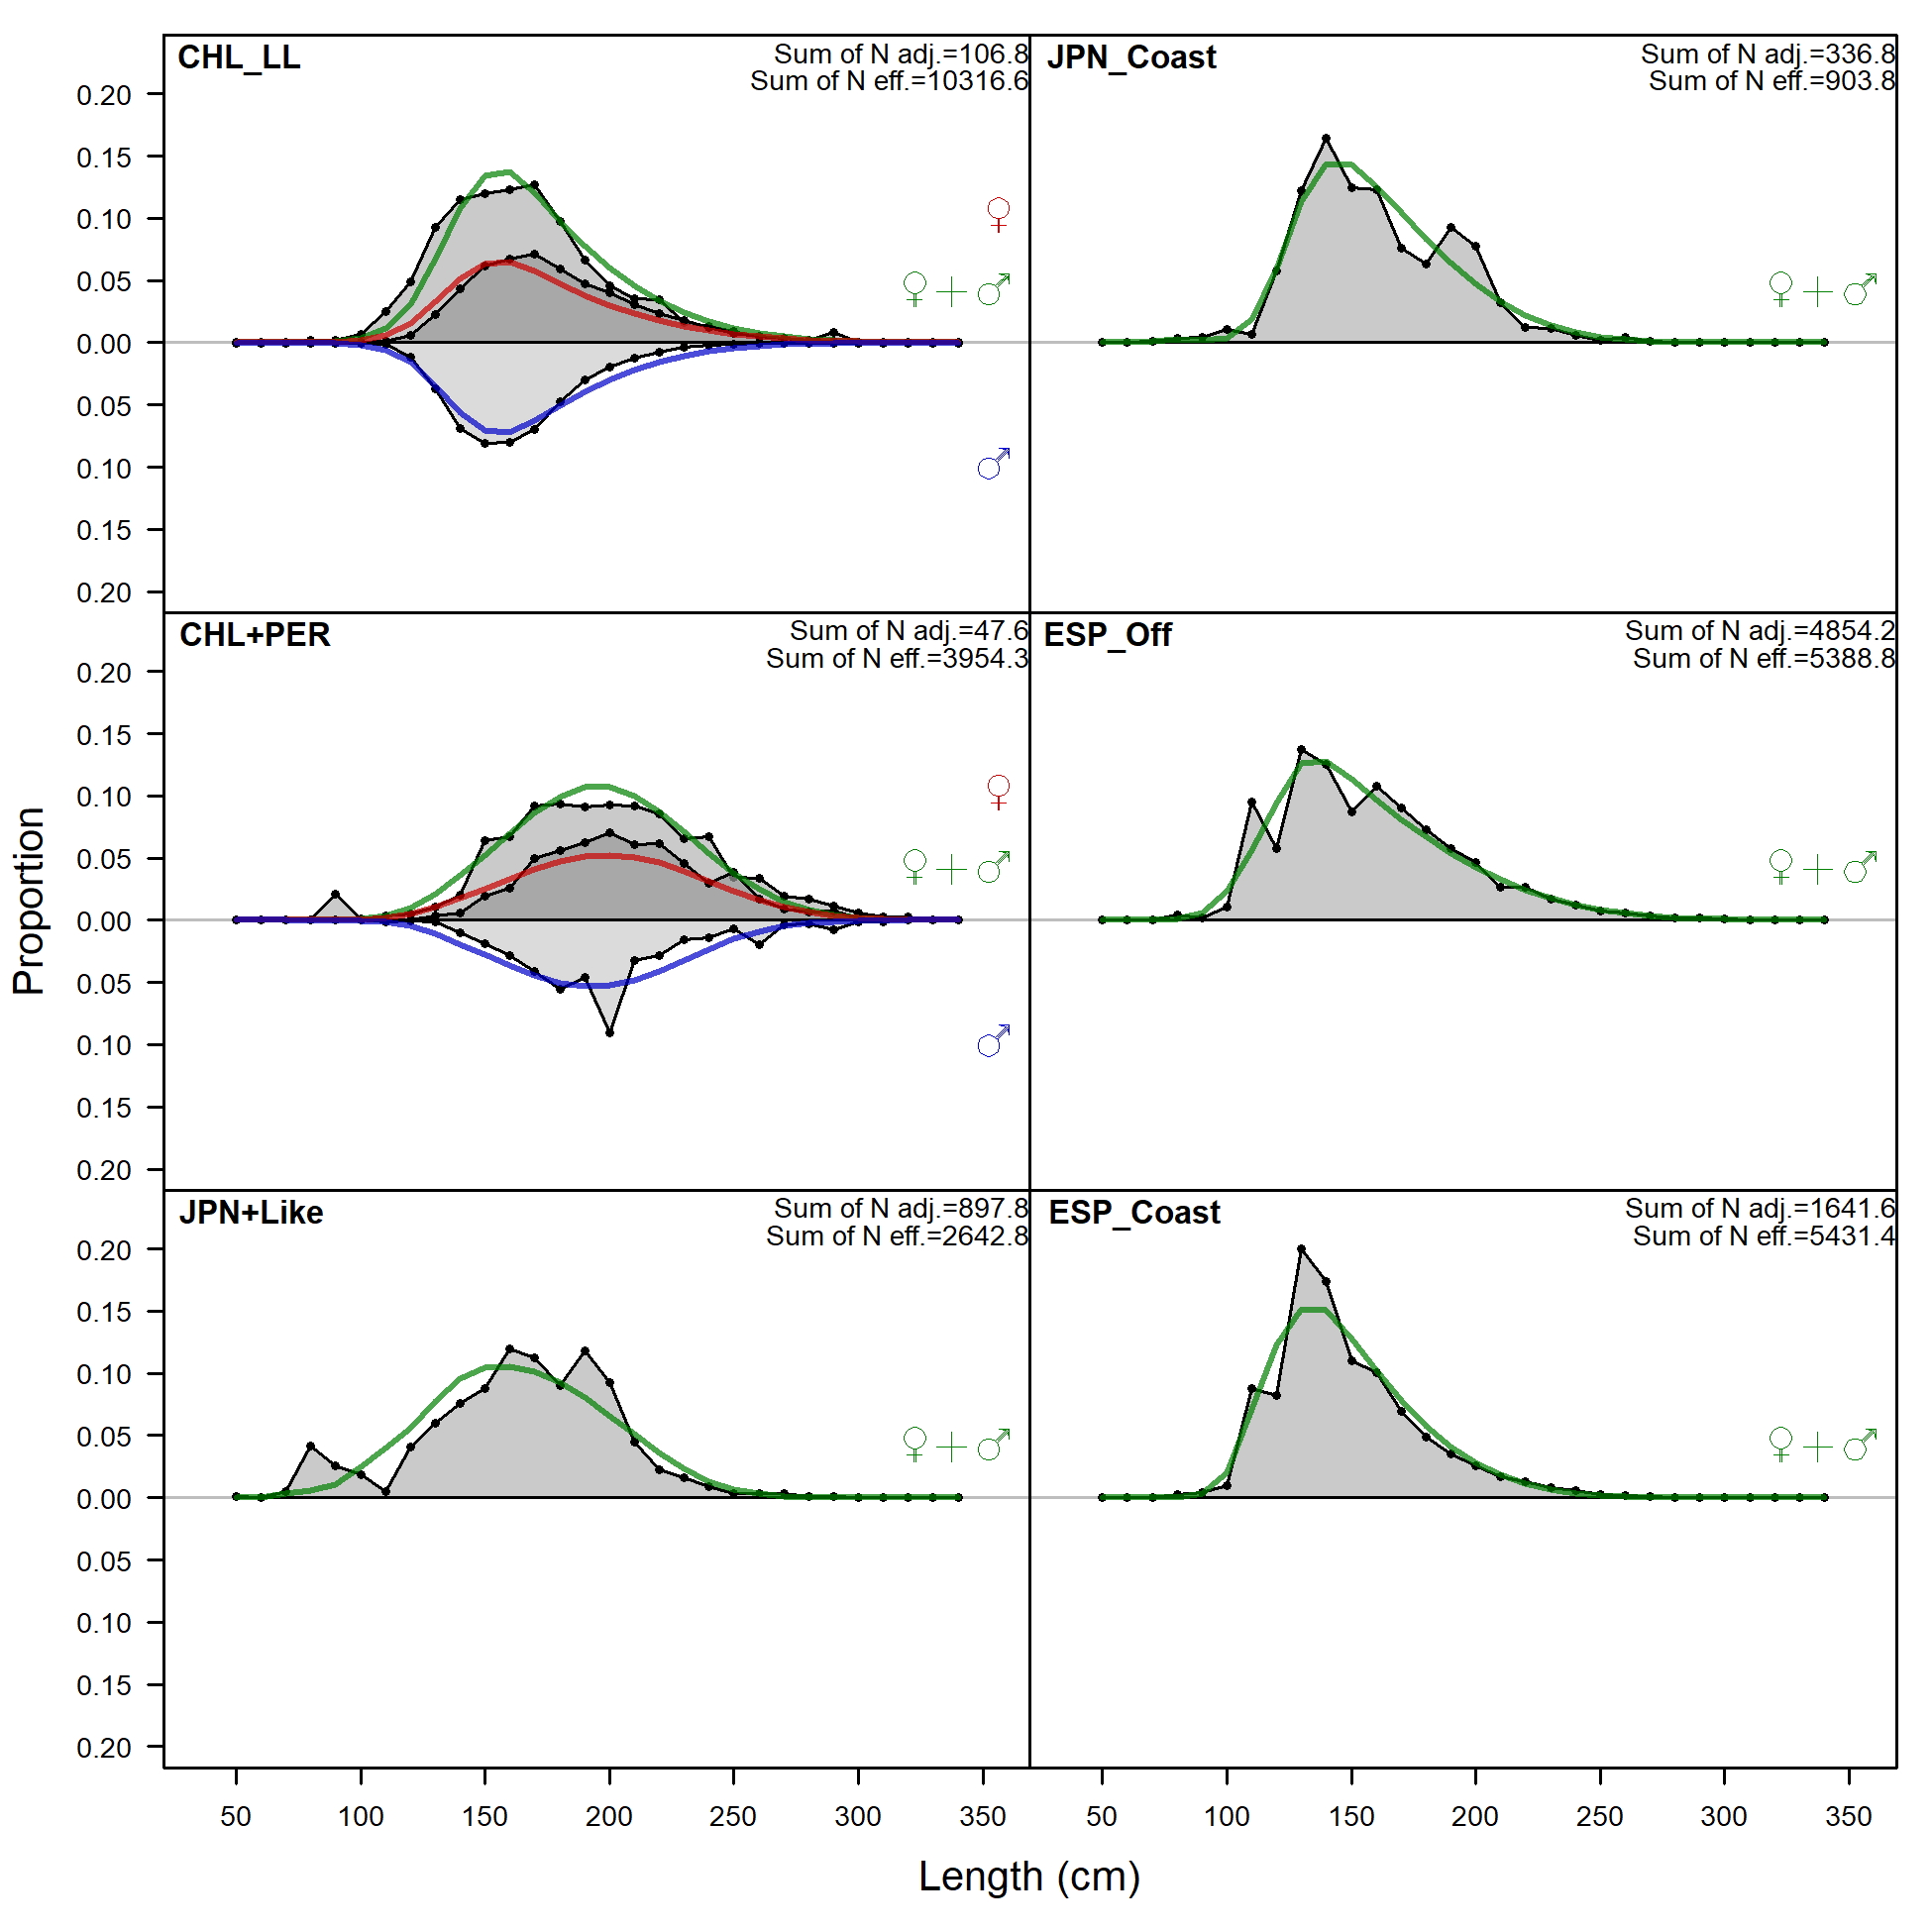
Length comps, aggregated across time by fleet.
Labels 'retained' and 'discard' indicate discarded or retained sampled for each fleet. Panels without this designation represent the whole catch.
file: comp_lenfit__aggregated_across_time.png
Length comps, aggregated across time by fleet.
Labels 'retained' and 'discard' indicate discarded or retained sampled for each fleet. Panels without this designation represent the whole catch.
file: comp_lenfit__aggregated_across_time.png
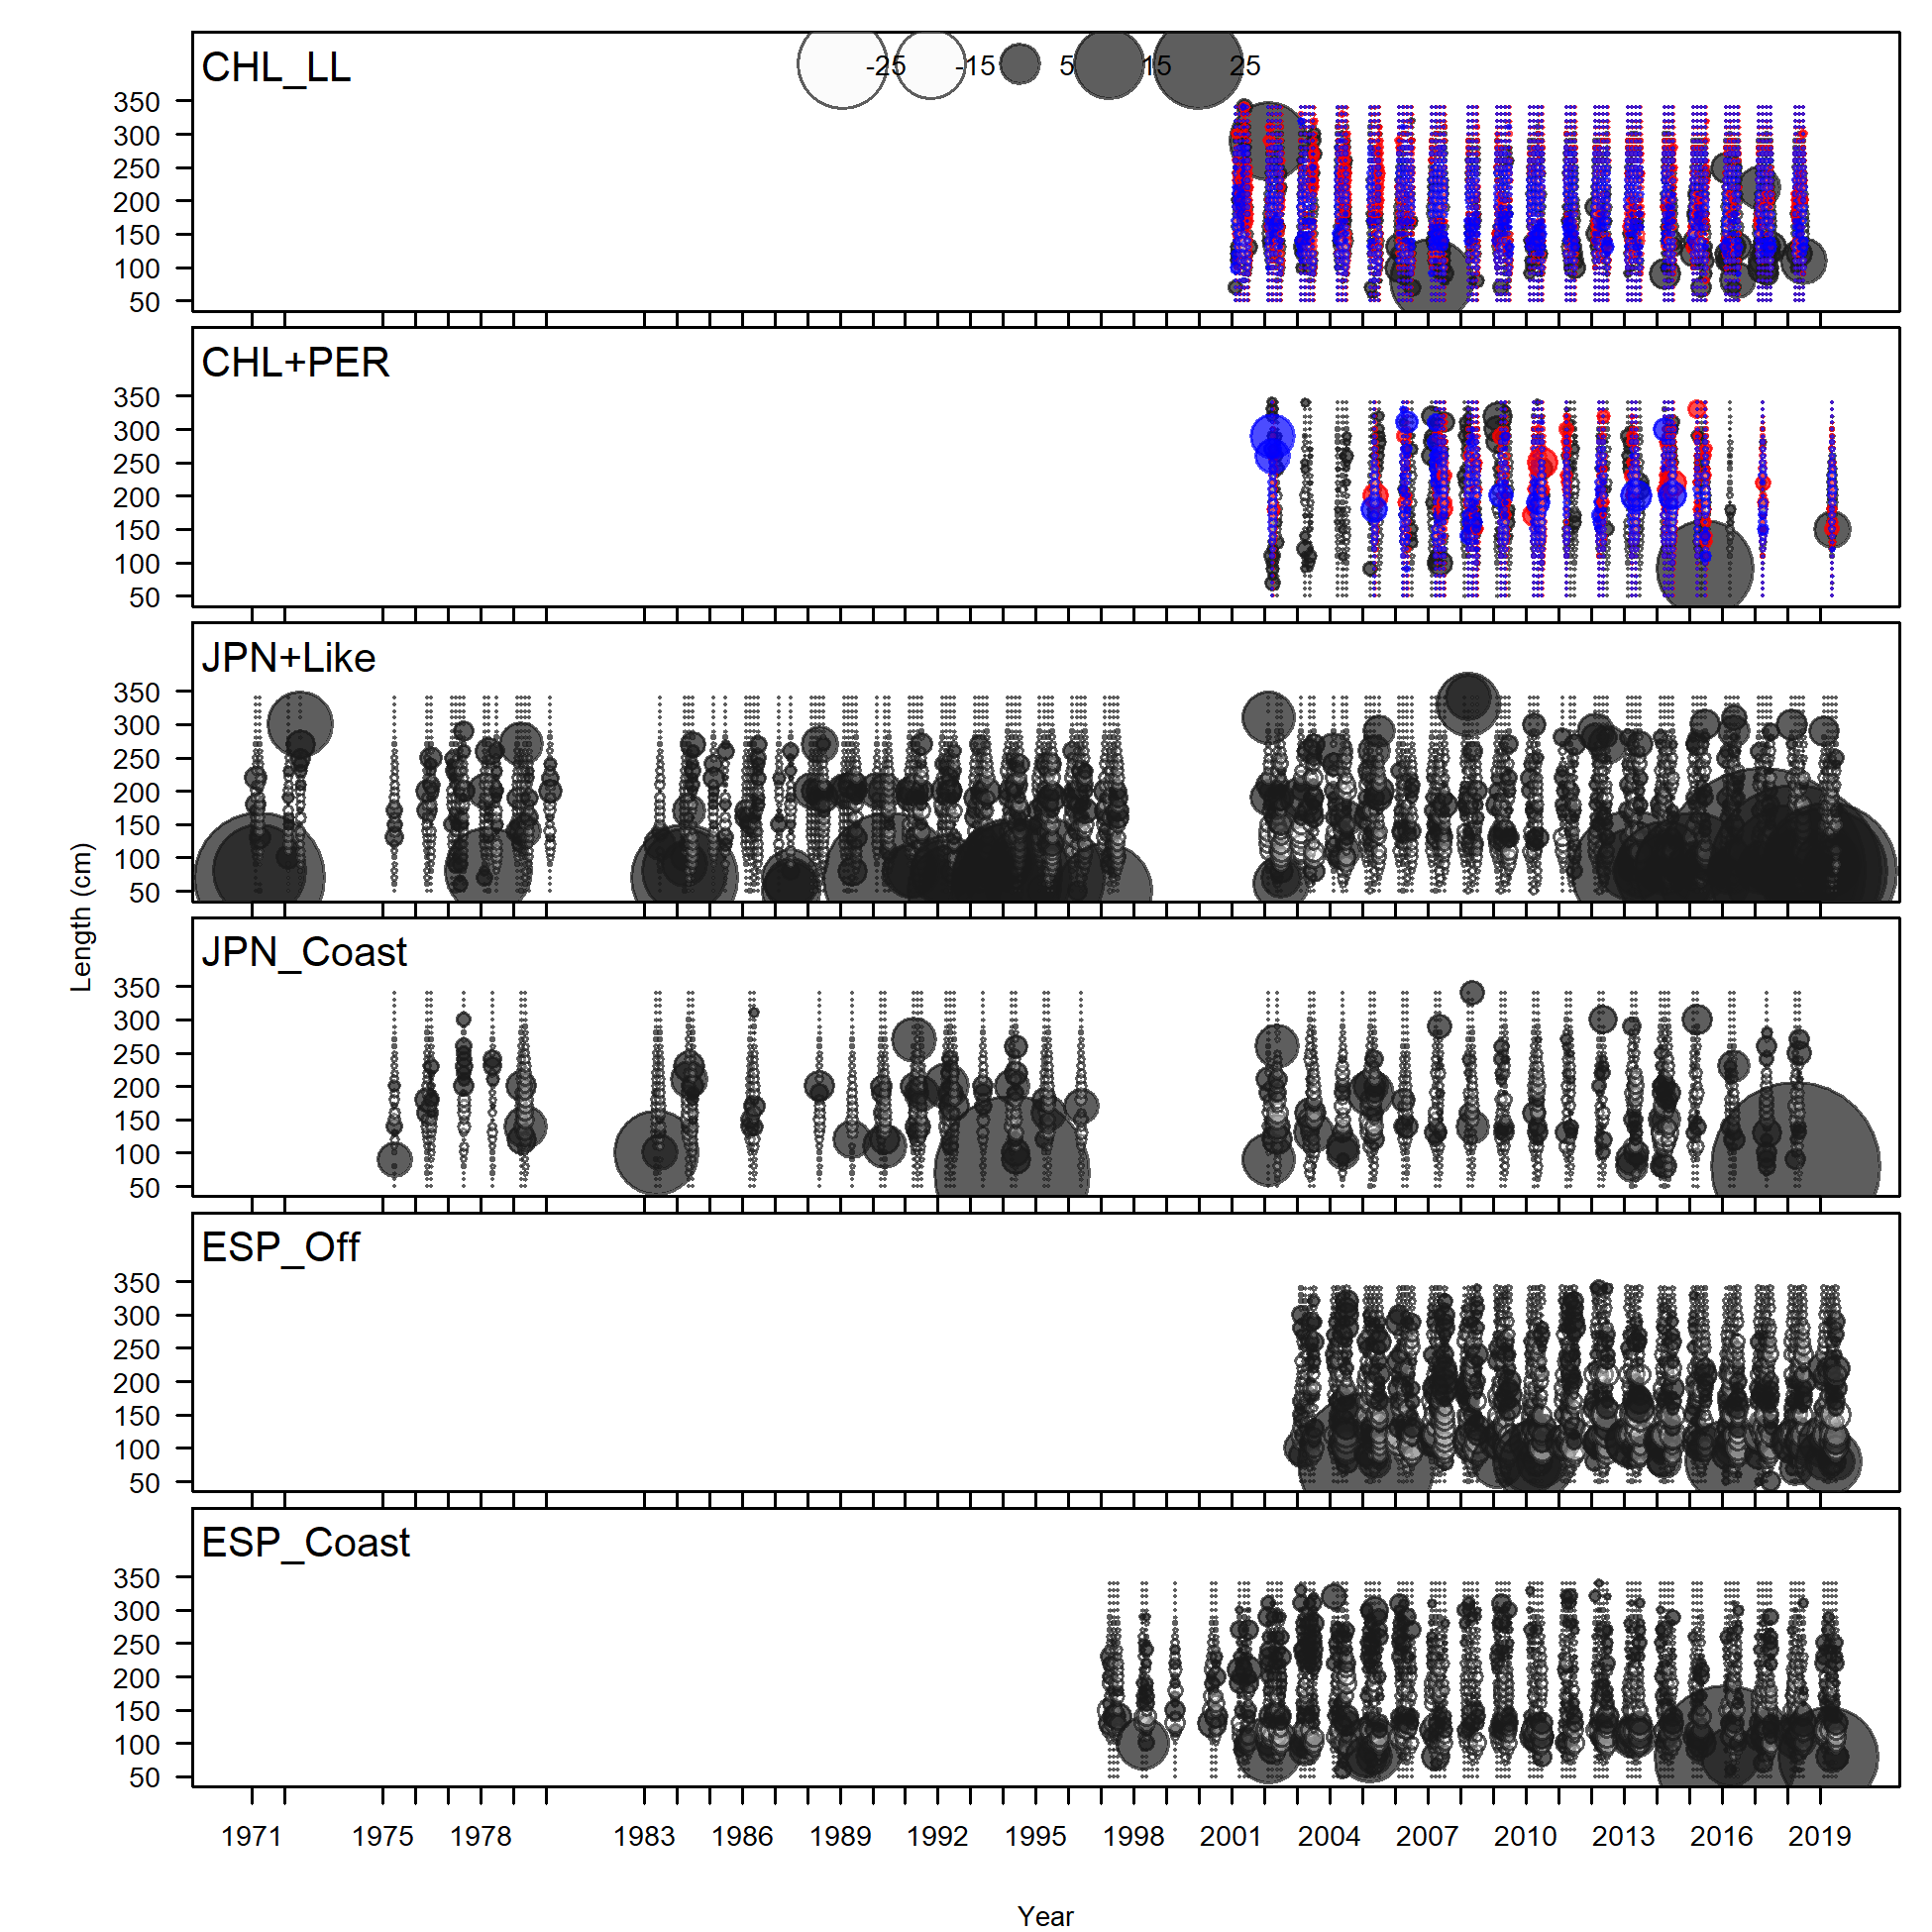
Pearson residuals, comparing across fleets
Closed bubbles are positive residuals (observed > expected) and open bubbles are negative residuals (observed < expected).
file: comp_lenfit__multi-fleet_comparison.png
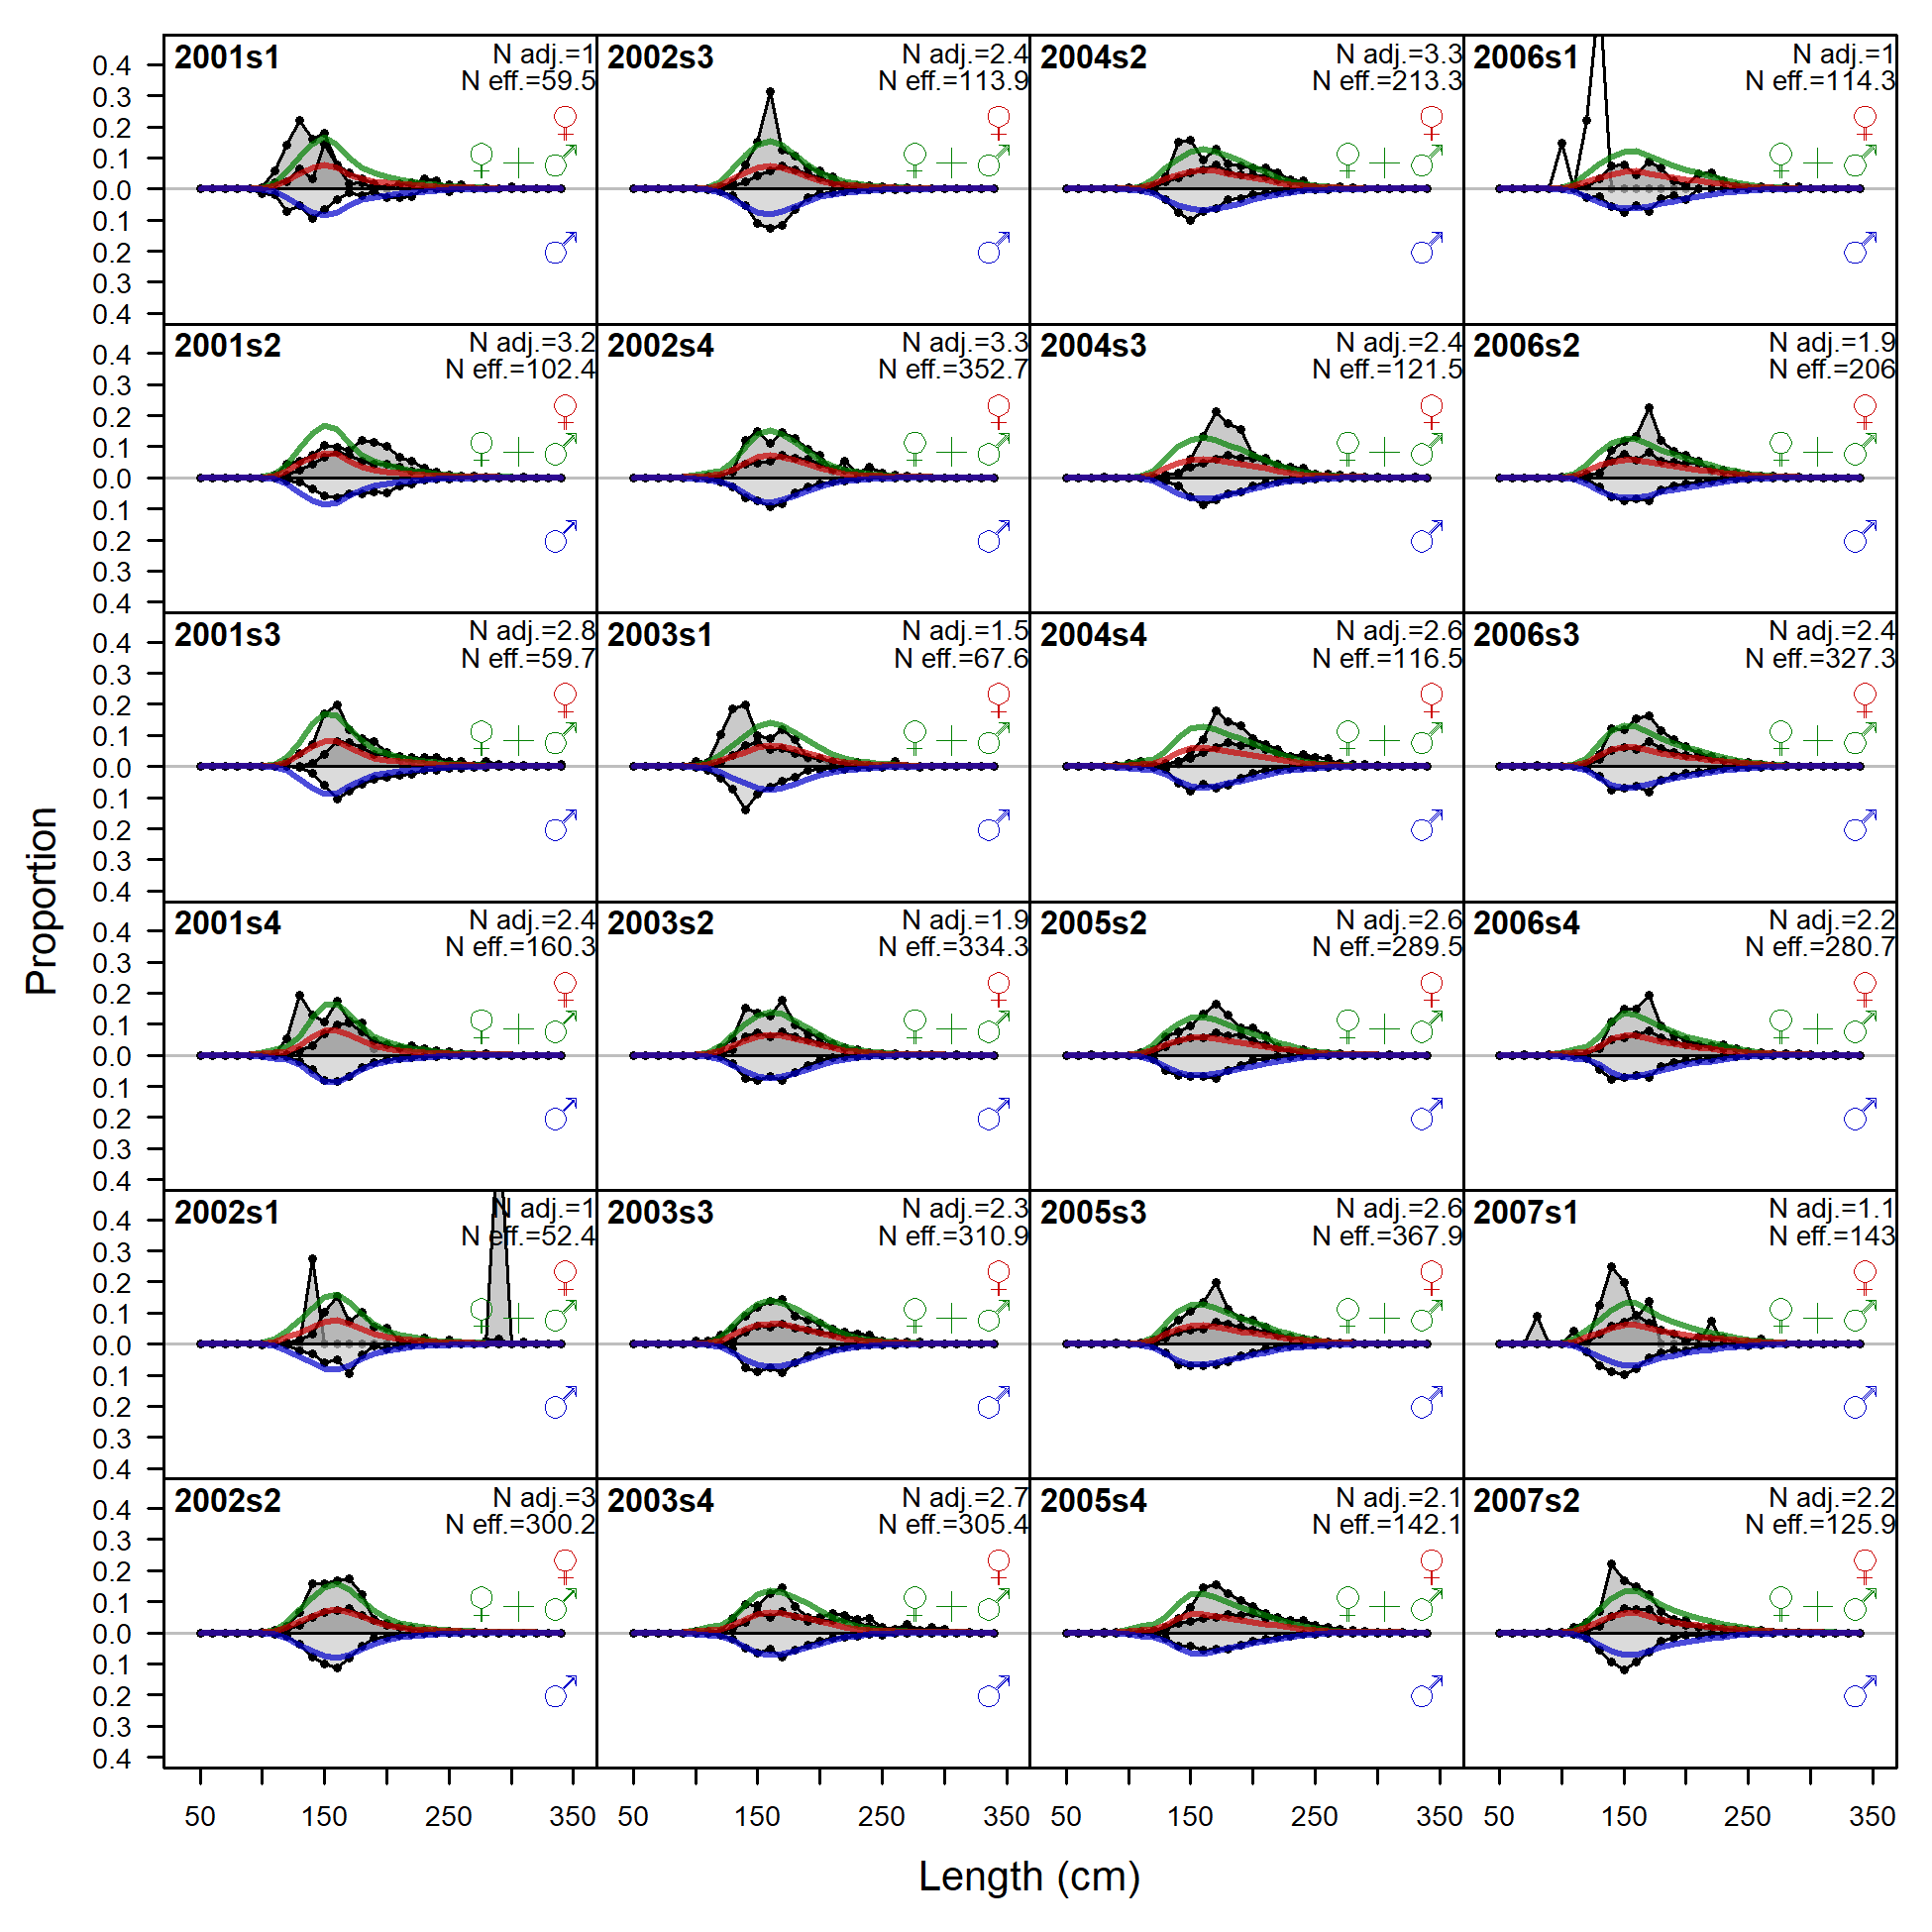
Length comps, whole catch, CHL_LL (plot 1 of 3).
'N adj.' is the input sample size after data-weighting adjustment. N eff. is the calculated effective sample size used in the McAllister-Ianelli tuning method.
file: comp_lenfit_flt1mkt0_page1.png
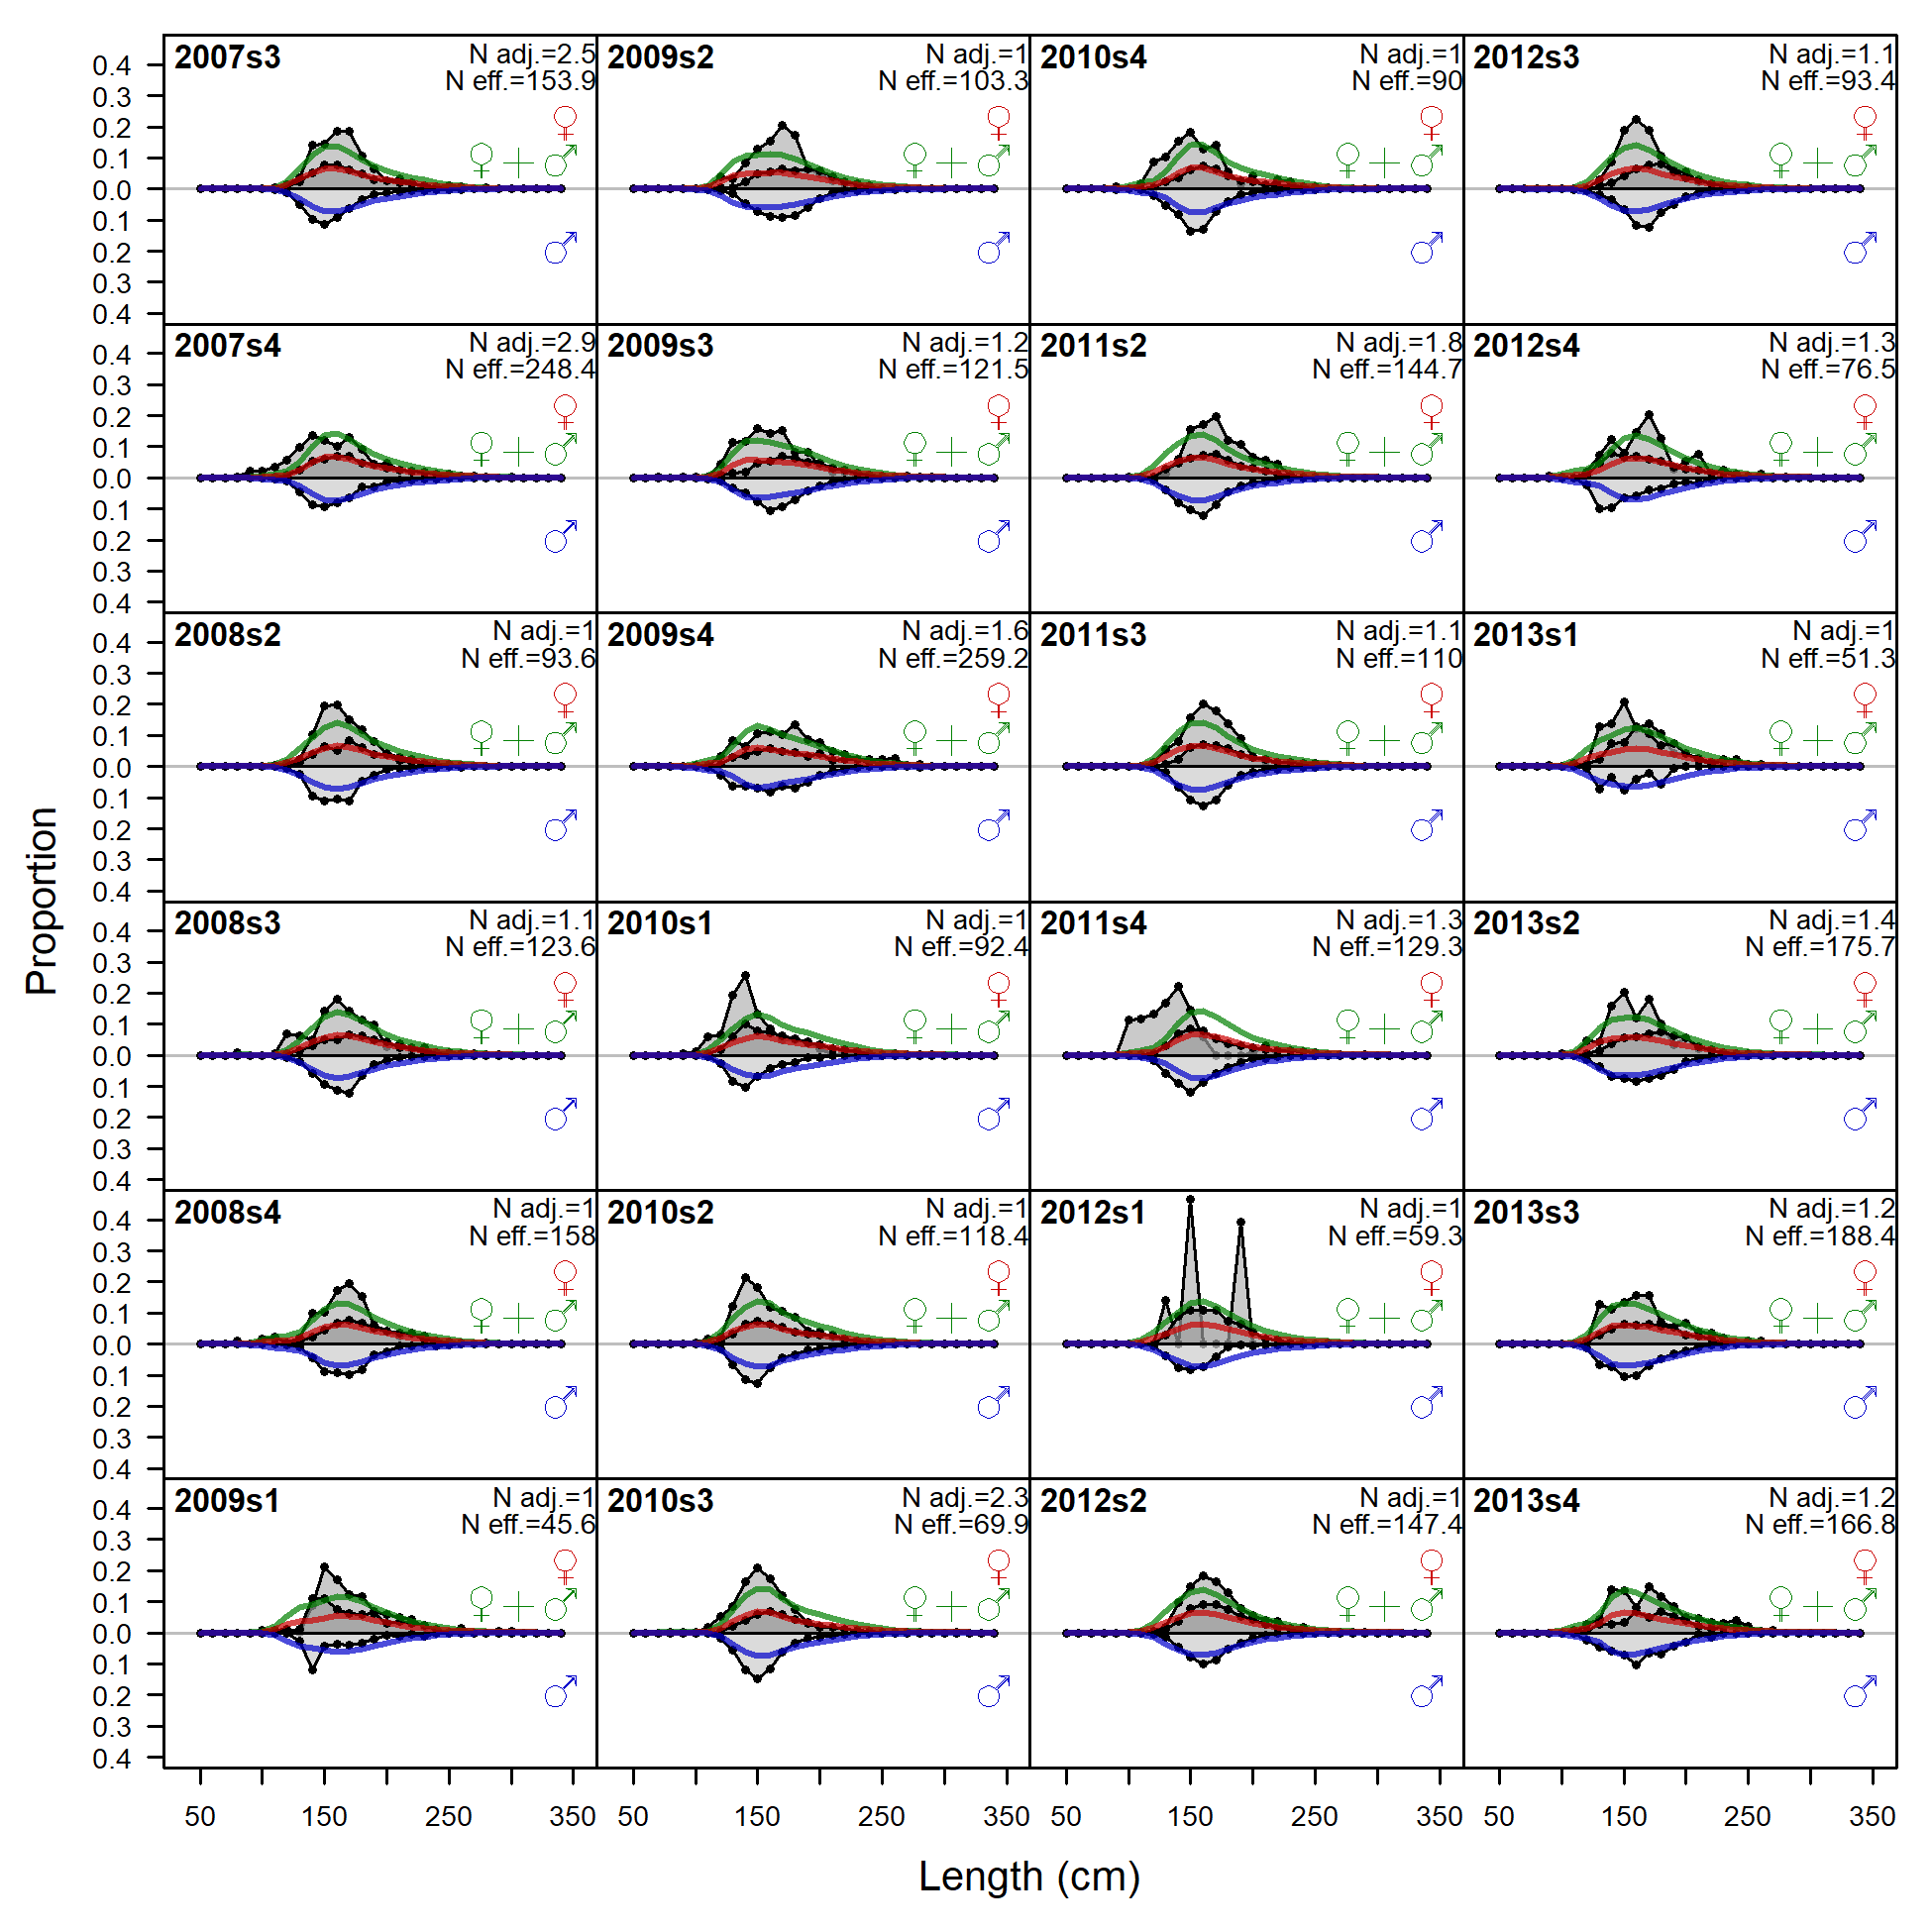
Length comps, whole catch, CHL_LL (plot 1 of 3).
'N adj.' is the input sample size after data-weighting adjustment. N eff. is the calculated effective sample size used in the McAllister-Ianelli tuning method. (plot 2 of 3)
file: comp_lenfit_flt1mkt0_page2.png
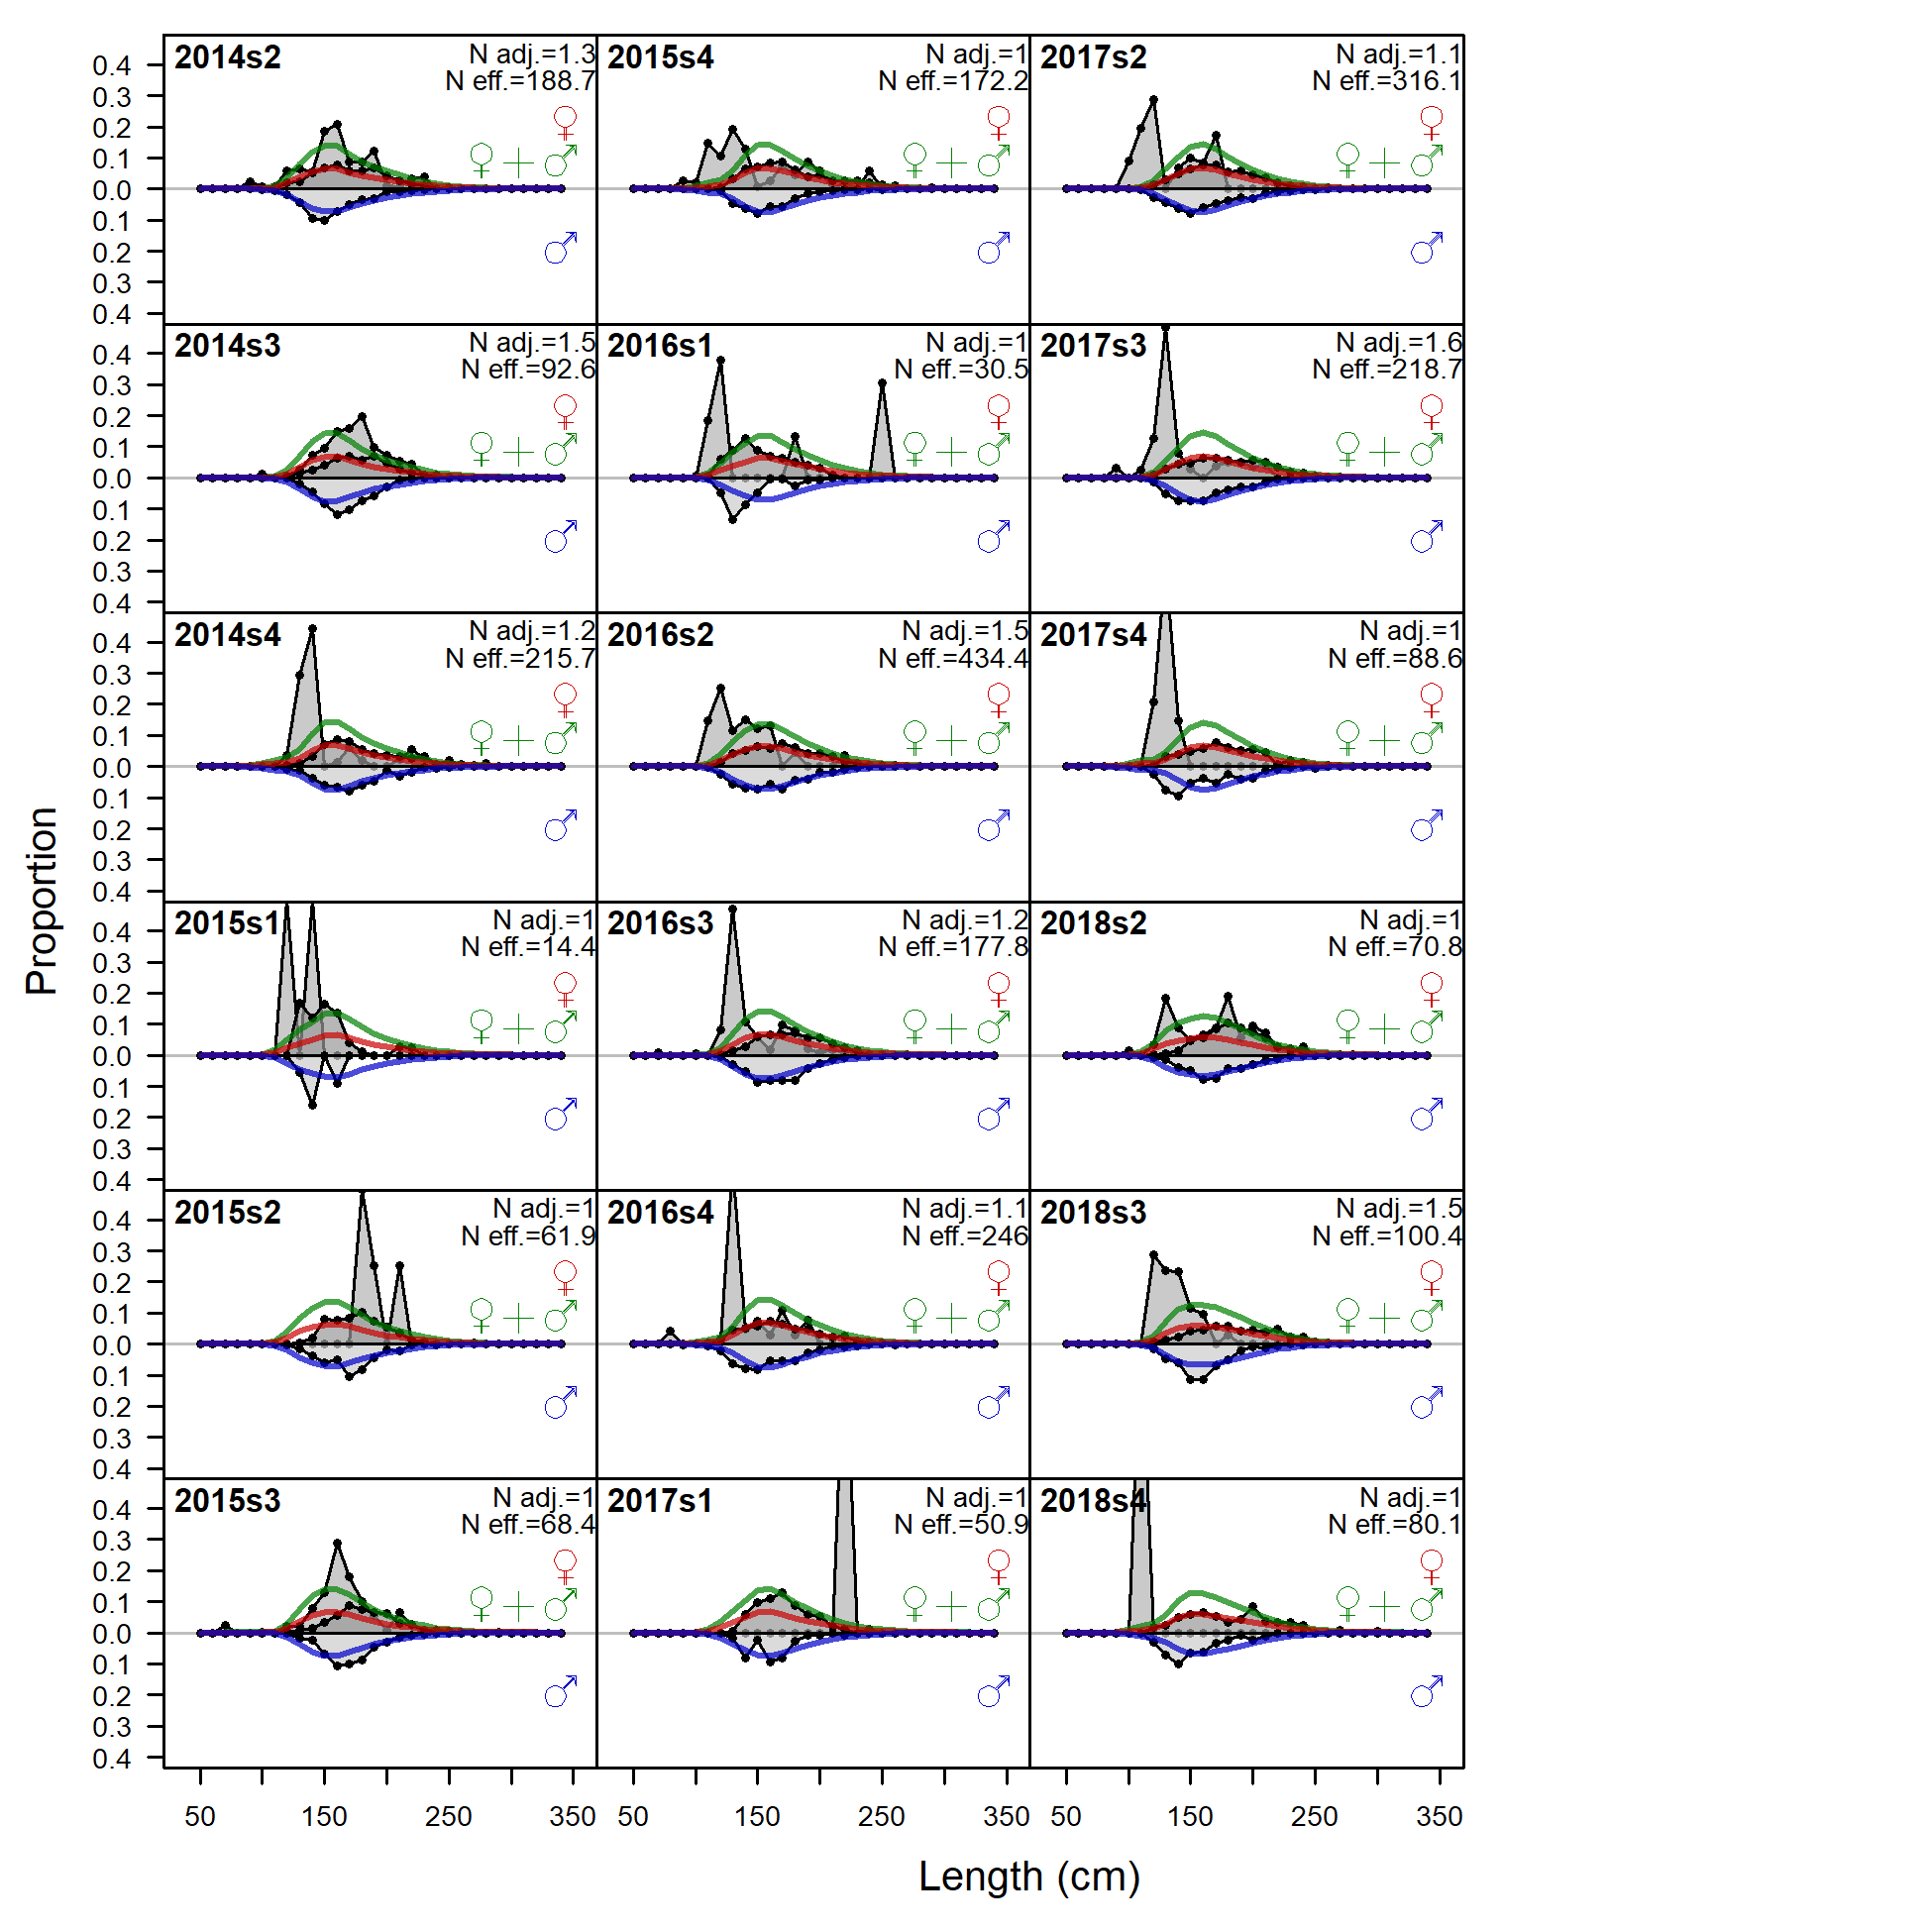
Length comps, whole catch, CHL_LL (plot 1 of 3).
'N adj.' is the input sample size after data-weighting adjustment. N eff. is the calculated effective sample size used in the McAllister-Ianelli tuning method. (plot 2 of 3) (plot 3 of 3)
file: comp_lenfit_flt1mkt0_page3.png
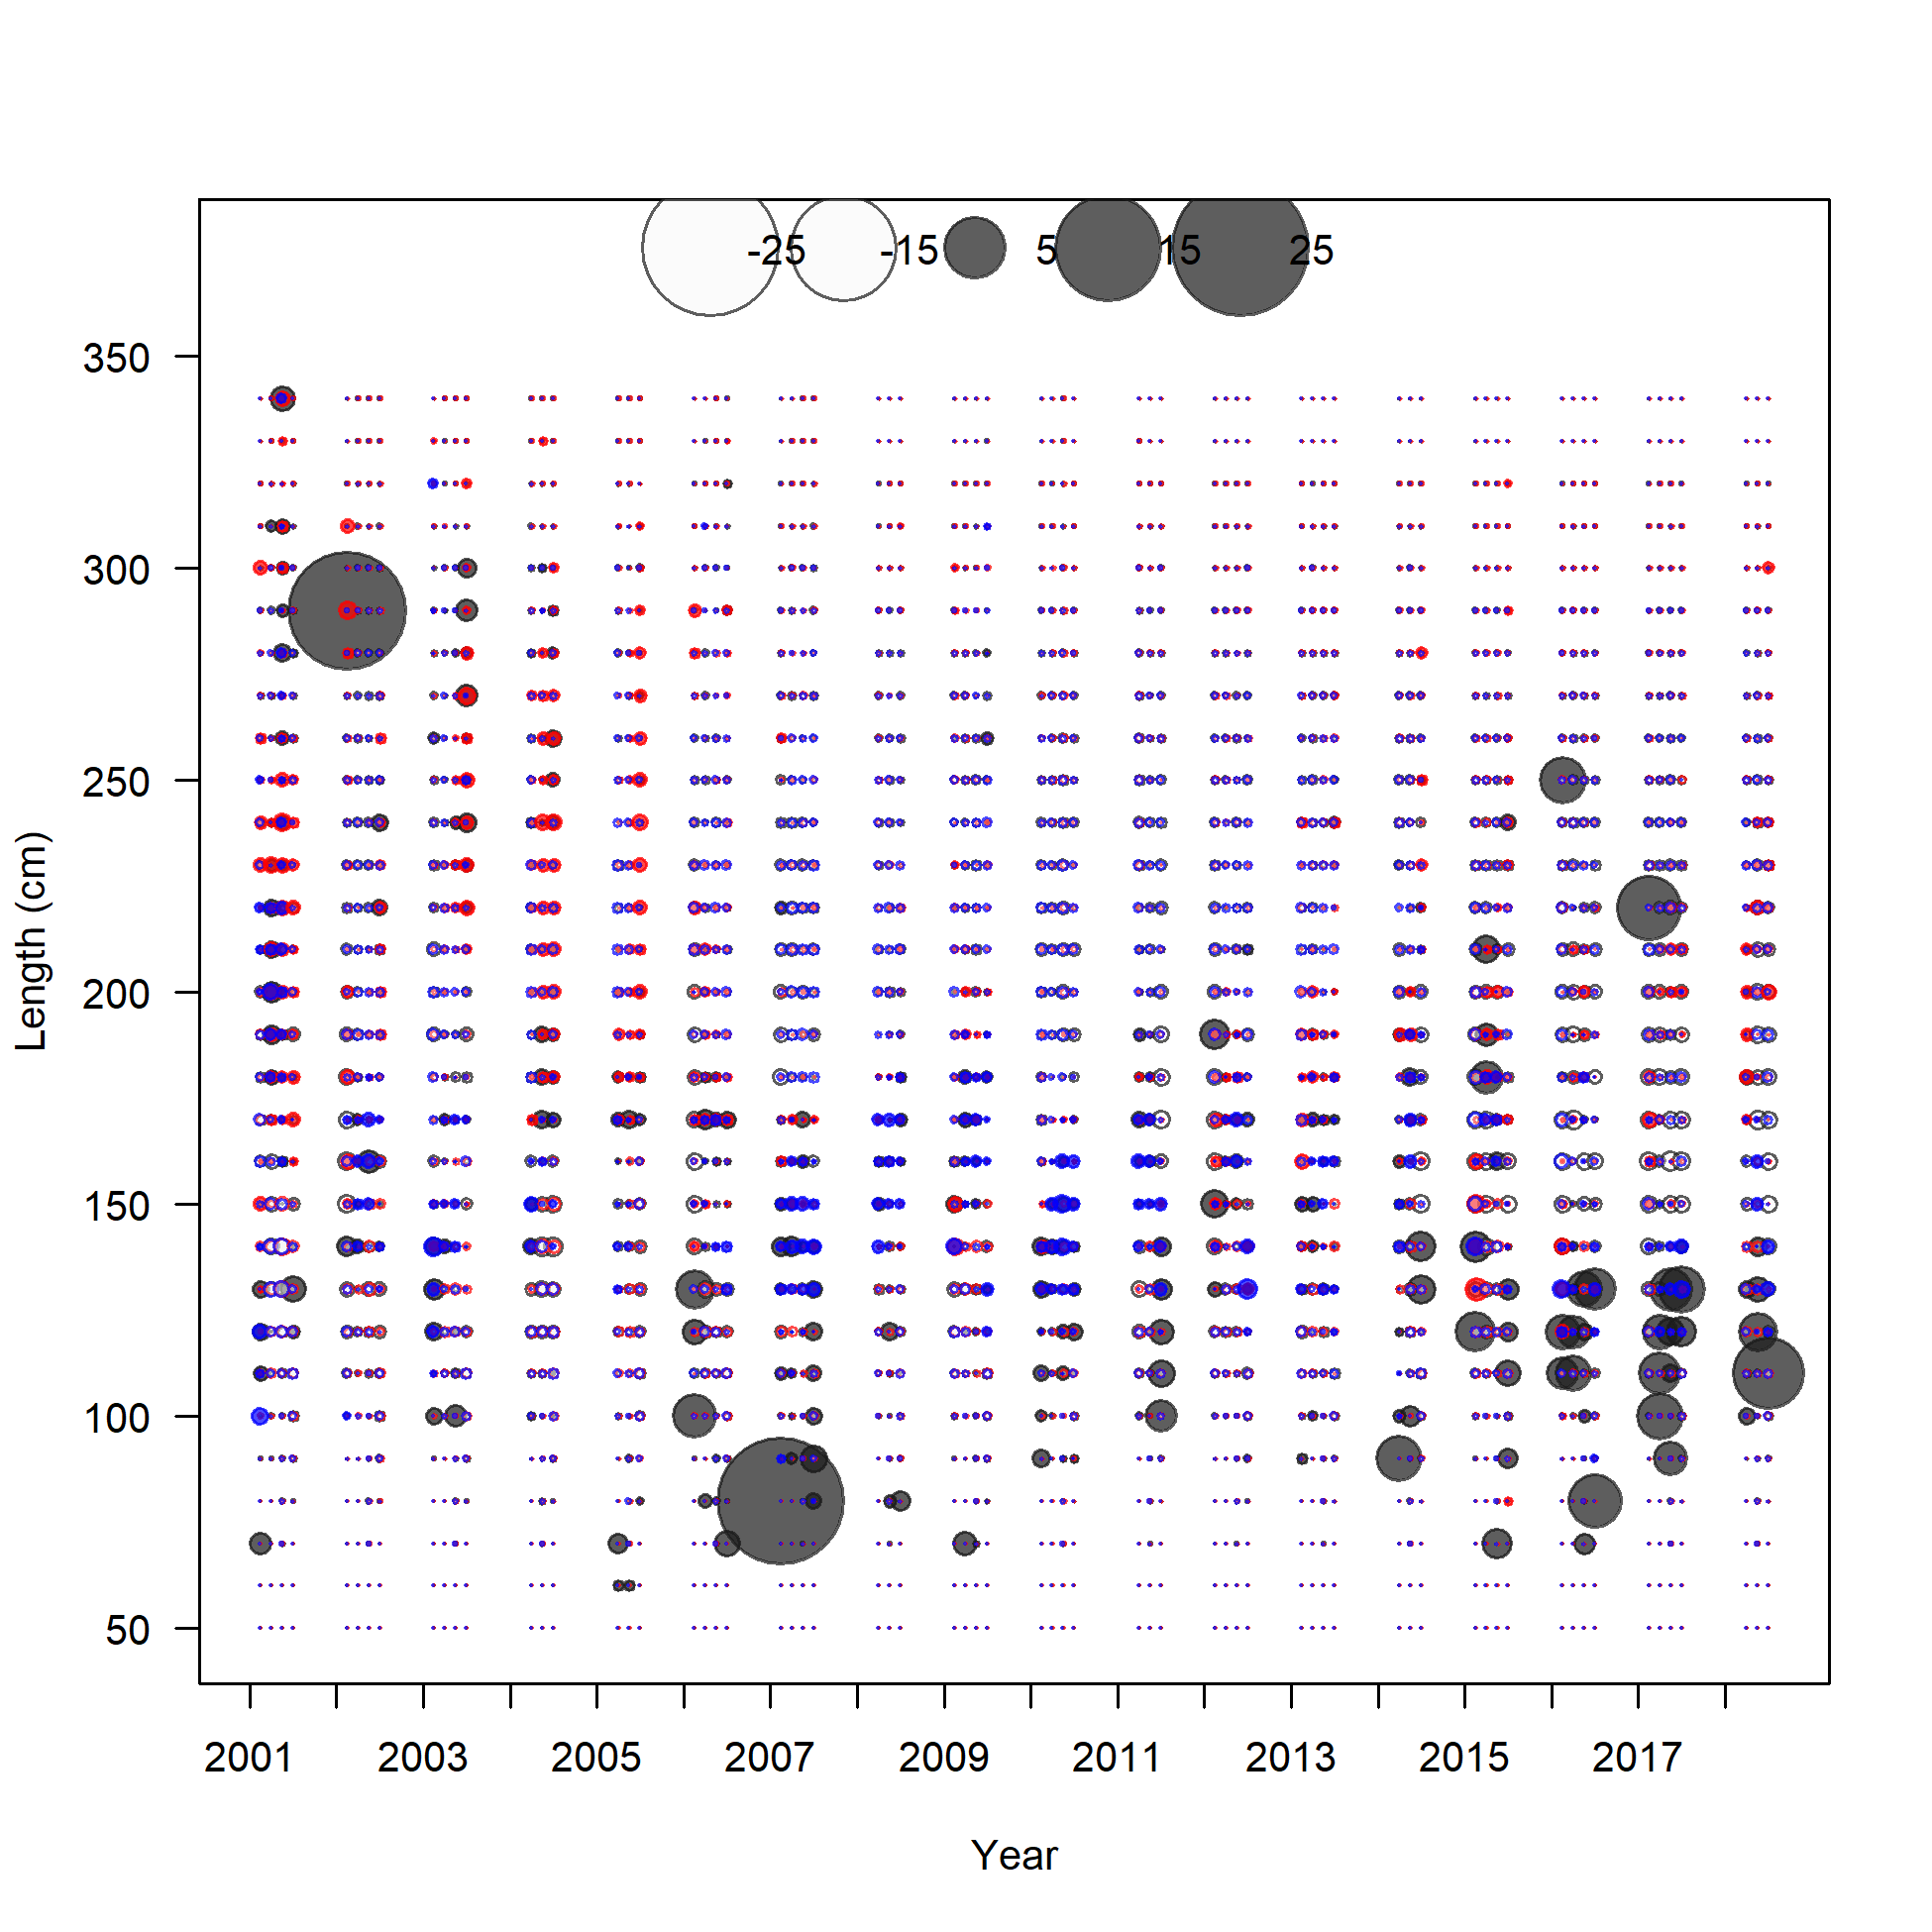
Pearson residuals, whole catch, CHL_LL (max=21.29) (plot 3 of 3)
Closed bubbles are positive residuals (observed > expected) and open bubbles are negative residuals (observed < expected).
file: comp_lenfit_residsflt1mkt0_page3.png
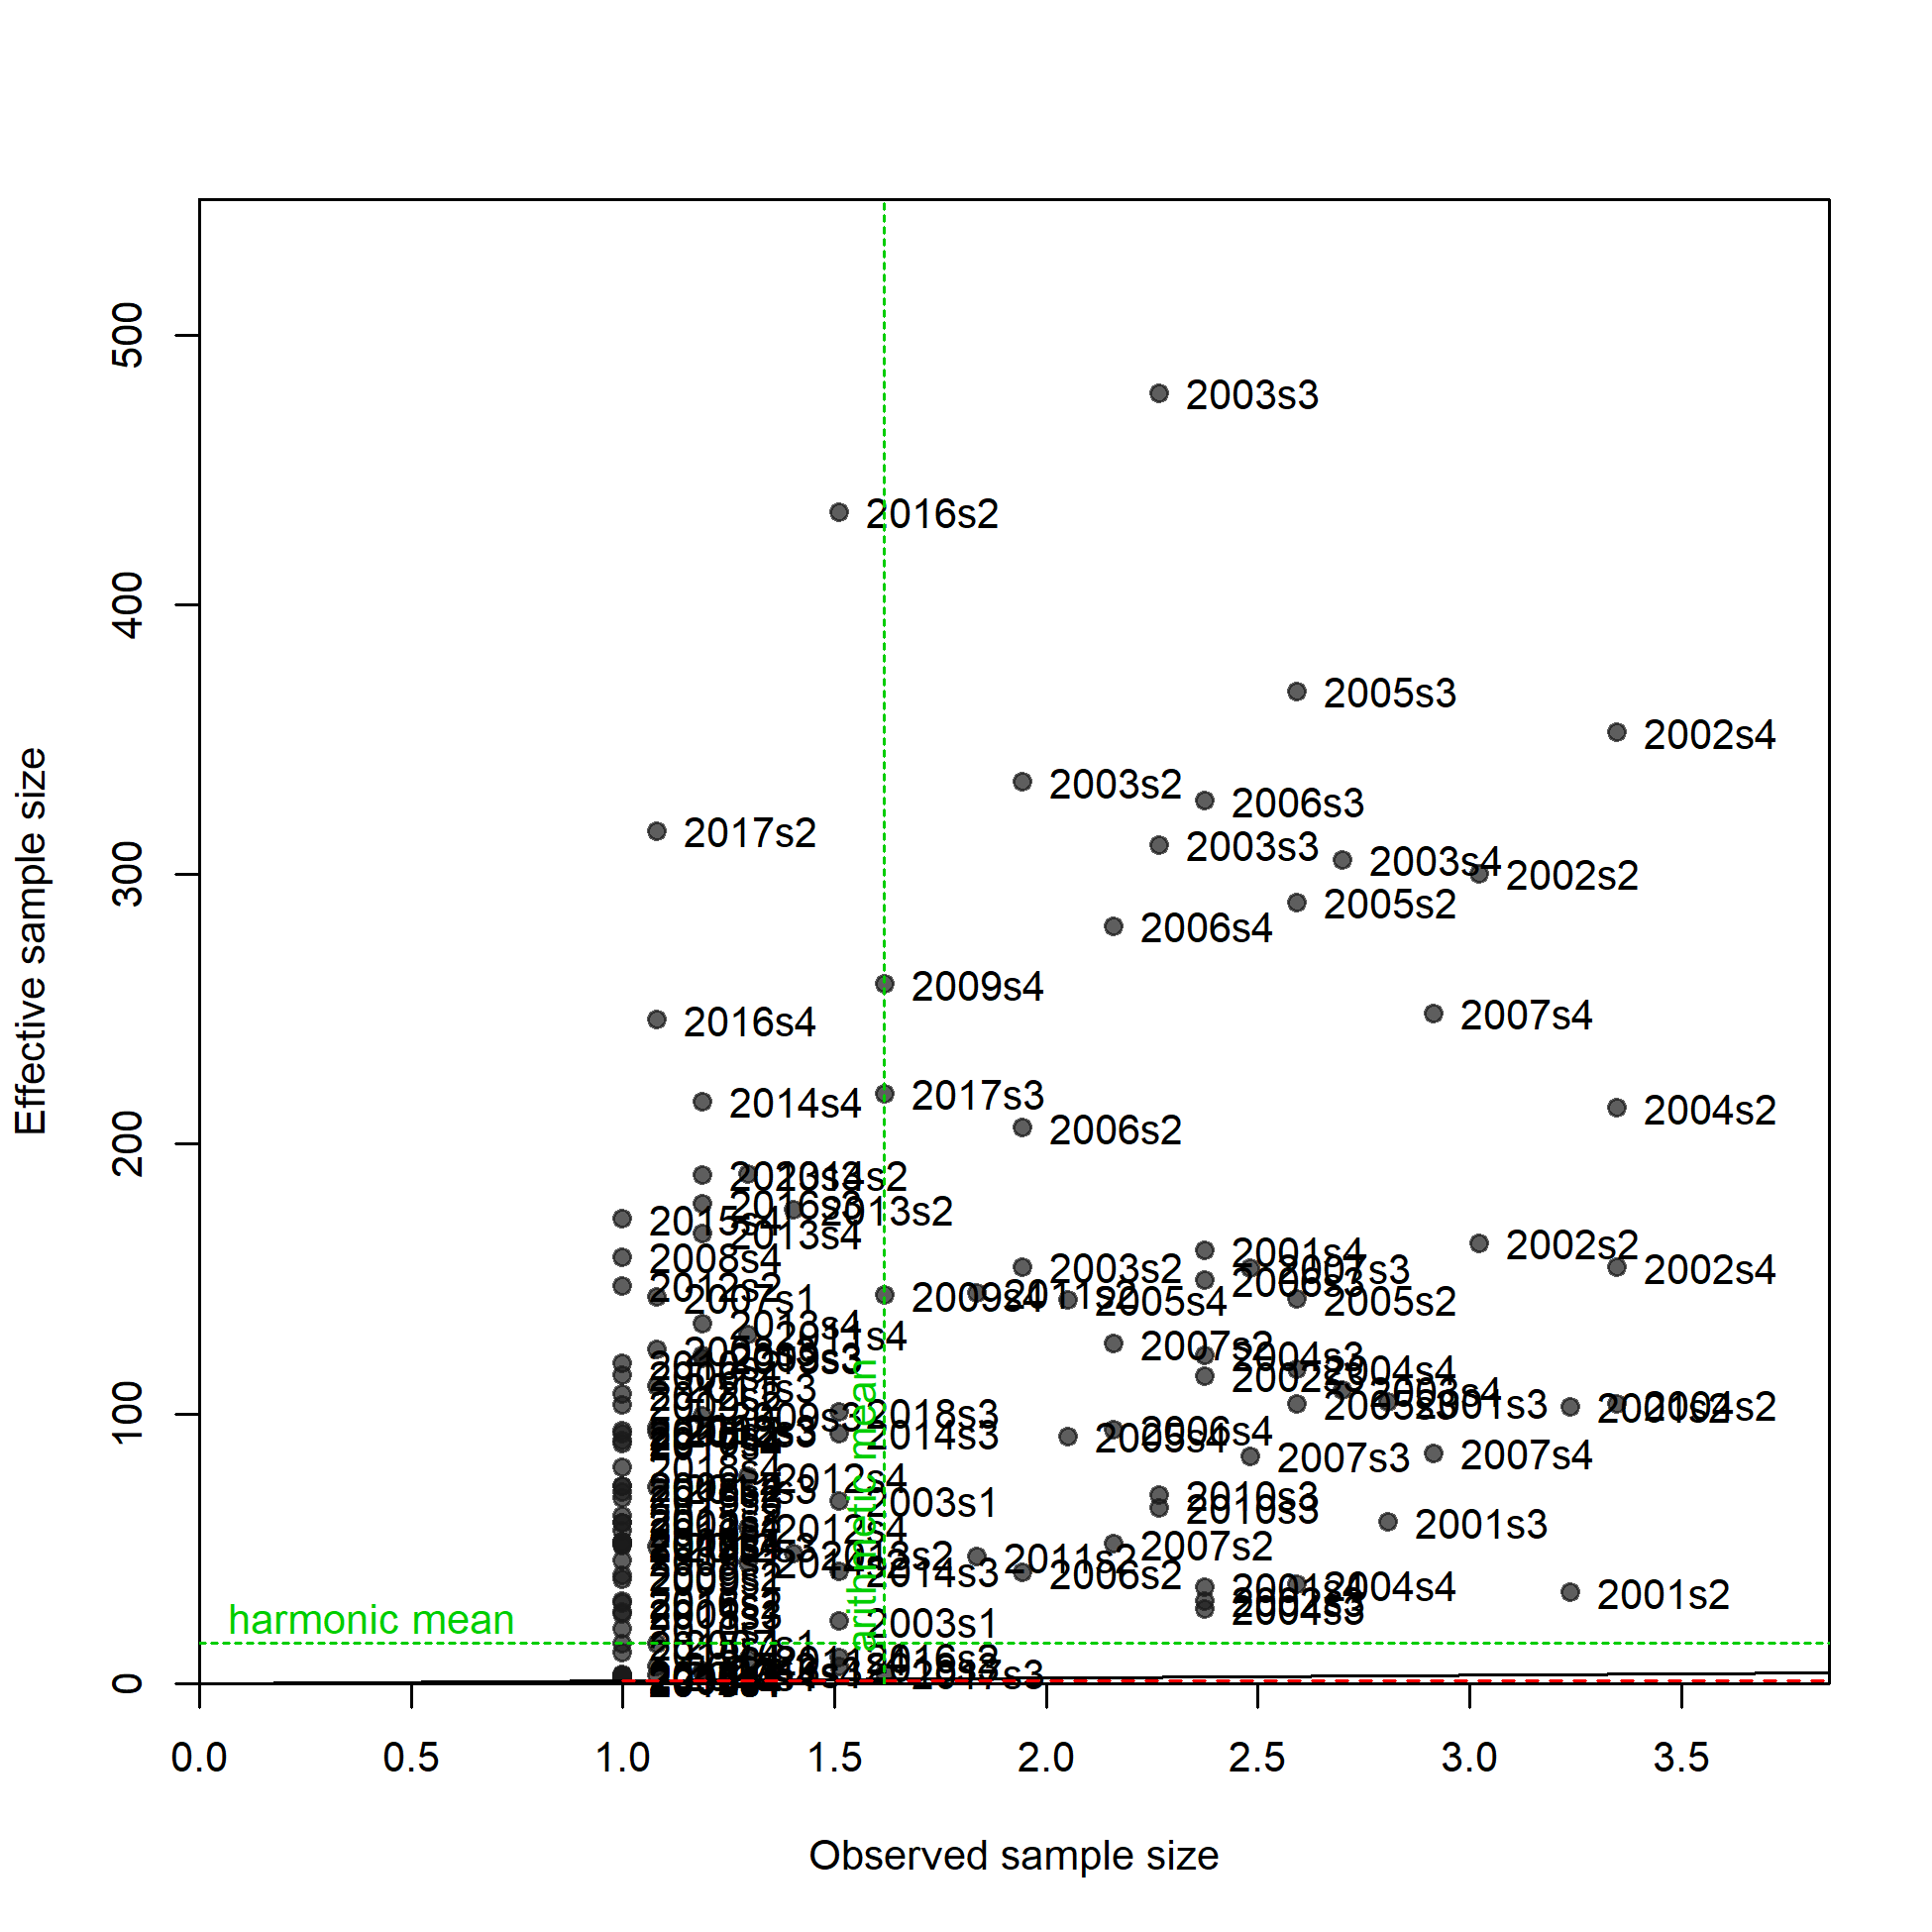
N-EffN comparison, Length comps, whole catch, CHL_LL
file: comp_lenfit_sampsize_flt1mkt0.png
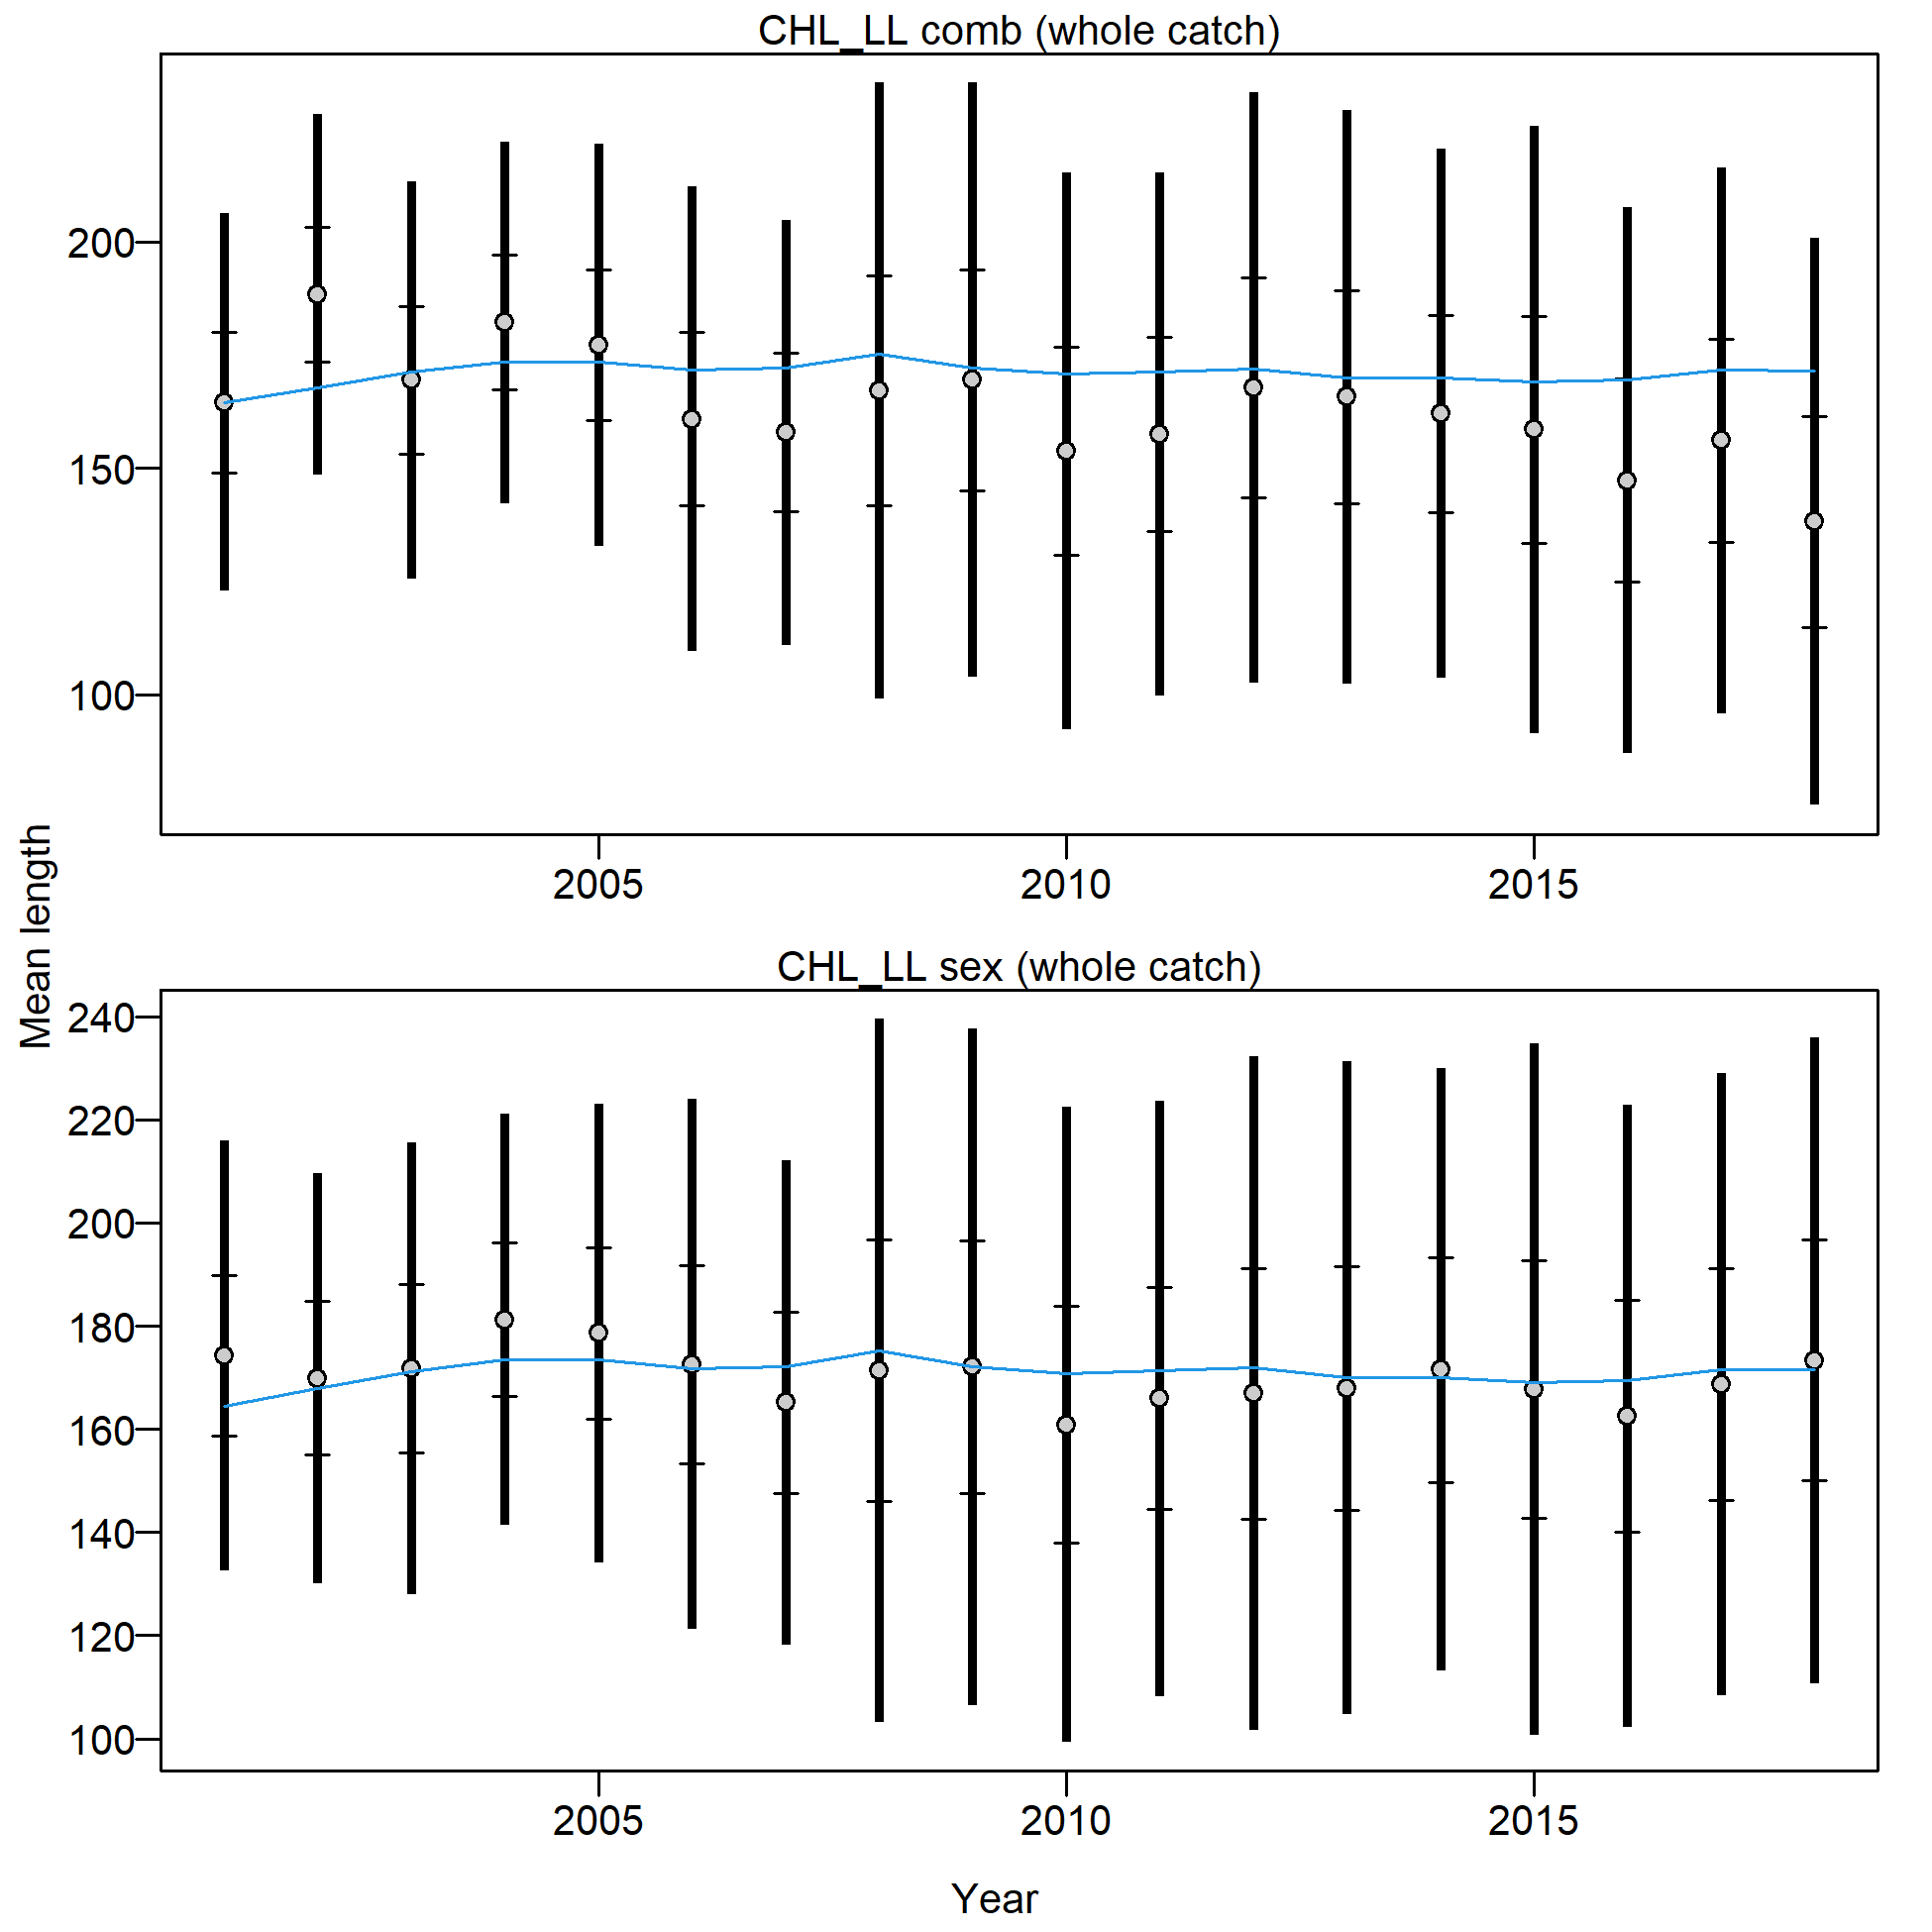
Mean length for CHL_LL with 95% confidence intervals based on current samples sizes.
Francis data weighting method TA1.8: thinner intervals (with capped ends) show result of further adjusting sample sizes based on suggested multiplier (with 95% interval) for len data from CHL_LL:
7.1888 (4.3546-16.7525)
For more info, see
Francis, R.I.C.C. (2011). Data weighting in statistical fisheries stock assessment models. Can. J. Fish. Aquat. Sci. 68: 1124-1138. https://doi.org/10.1139/f2011-025
Length comps, whole catch, CHL+PER (plot 1 of 2).
'N adj.' is the input sample size after data-weighting adjustment. N eff. is the calculated effective sample size used in the McAllister-Ianelli tuning method.
file: comp_lenfit_flt2mkt0_page1.png
Length comps, whole catch, CHL+PER (plot 1 of 2).
'N adj.' is the input sample size after data-weighting adjustment. N eff. is the calculated effective sample size used in the McAllister-Ianelli tuning method. (plot 2 of 2)
file: comp_lenfit_flt2mkt0_page2.png
Pearson residuals, whole catch, CHL+PER (max=29.05) (plot 2 of 2)
Closed bubbles are positive residuals (observed > expected) and open bubbles are negative residuals (observed < expected).
file: comp_lenfit_residsflt2mkt0_page2.png
N-EffN comparison, Length comps, whole catch, CHL+PER
file: comp_lenfit_sampsize_flt2mkt0.png

Mean length for CHL+PER with 95% confidence intervals based on current samples sizes.
Francis data weighting method TA1.8: thinner intervals (with capped ends) show result of further adjusting sample sizes based on suggested multiplier (with 95% interval) for len data from CHL+PER:
5.1599 (2.6837-19.5238)
For more info, see
Francis, R.I.C.C. (2011). Data weighting in statistical fisheries stock assessment models. Can. J. Fish. Aquat. Sci. 68: 1124-1138. https://doi.org/10.1139/f2011-025
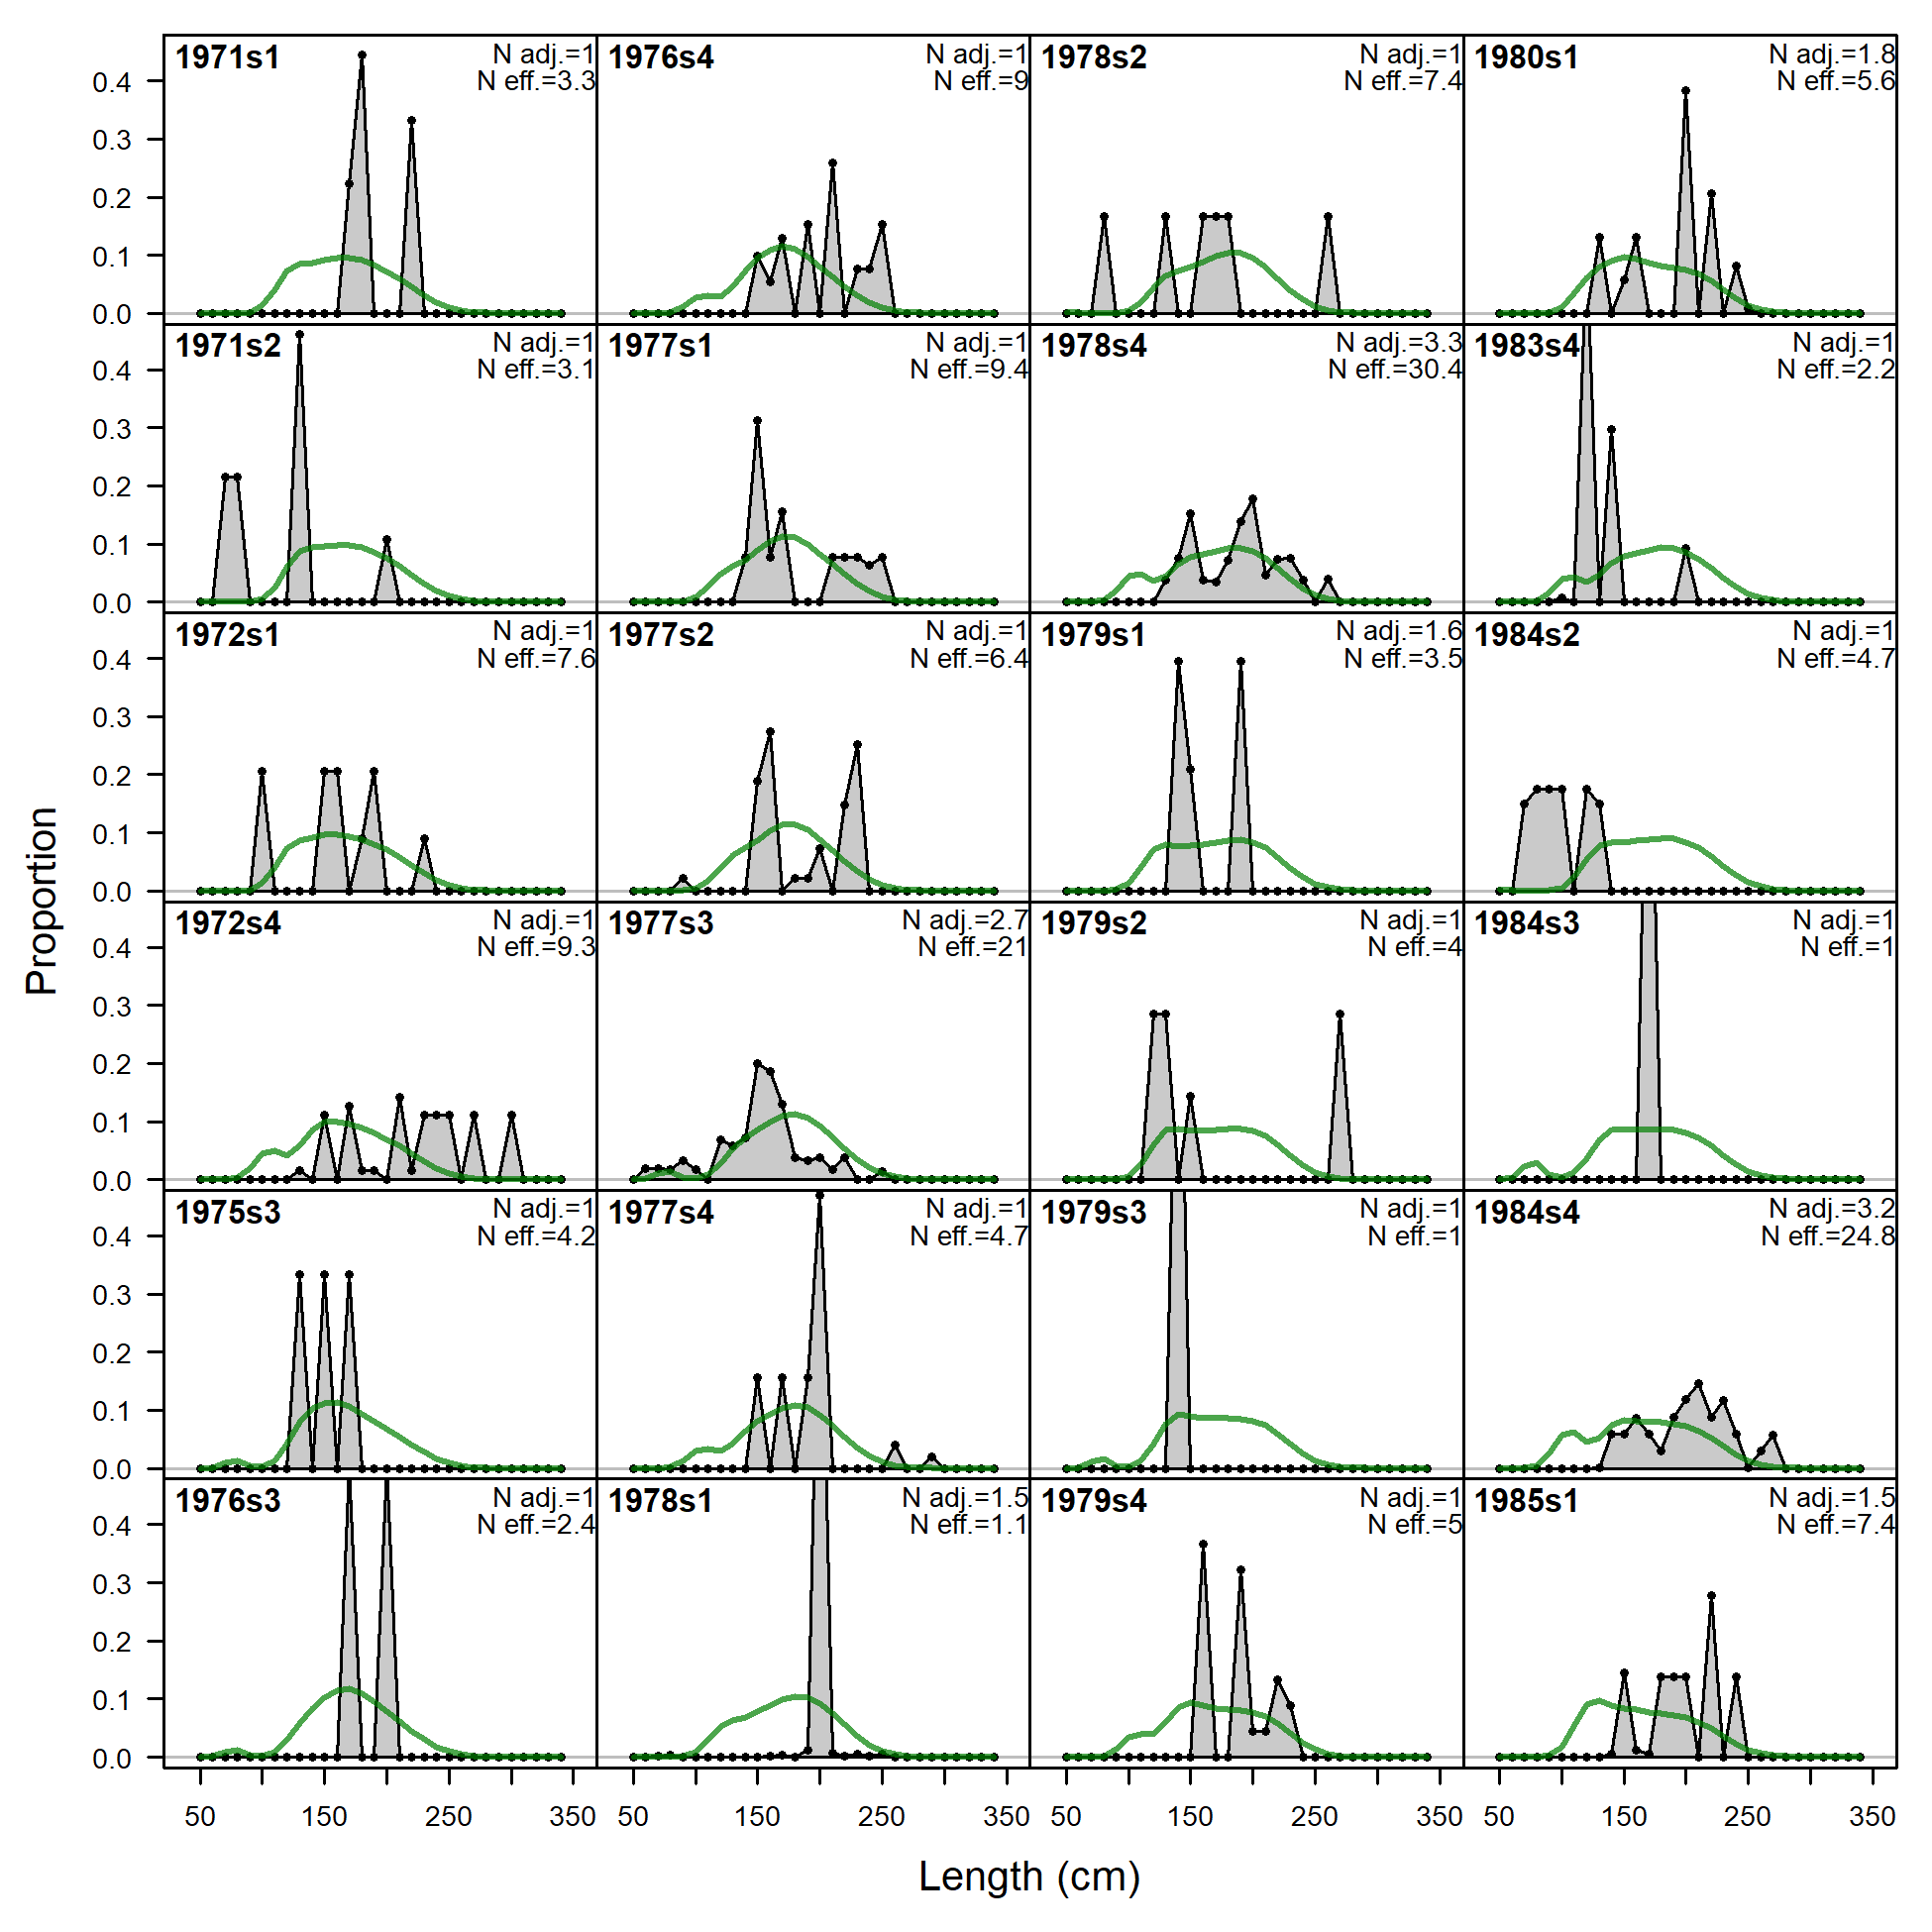
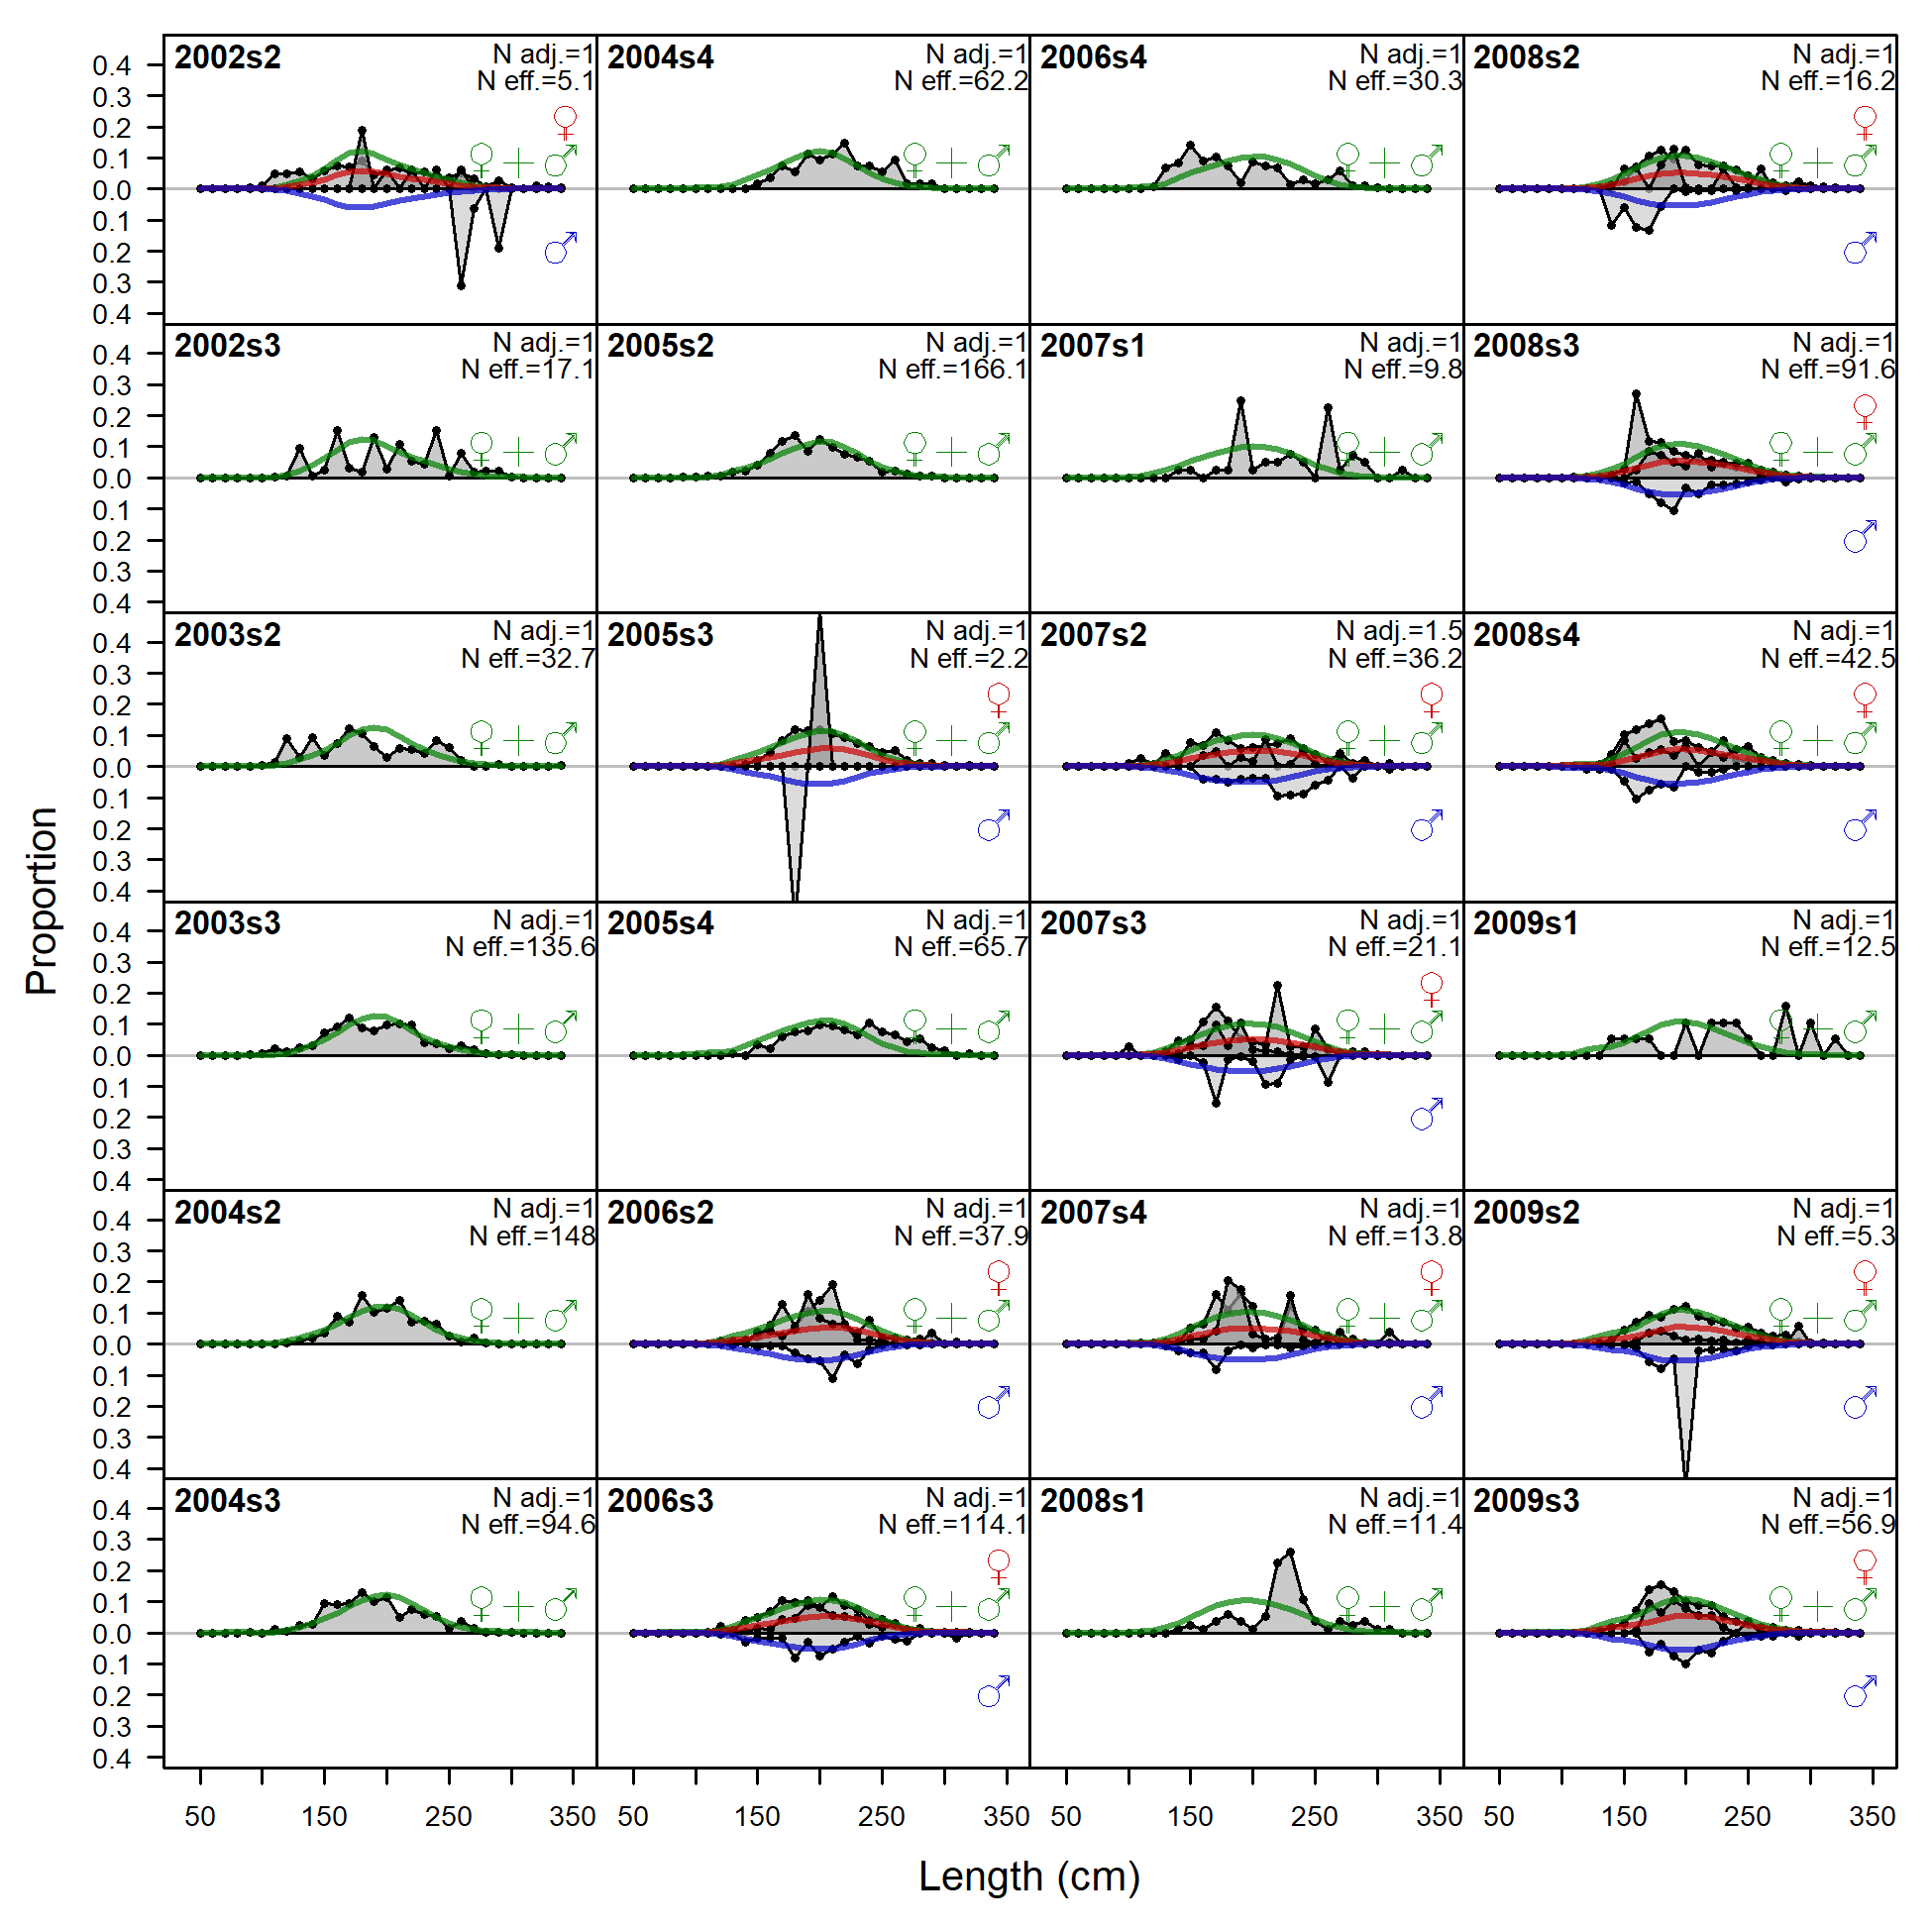
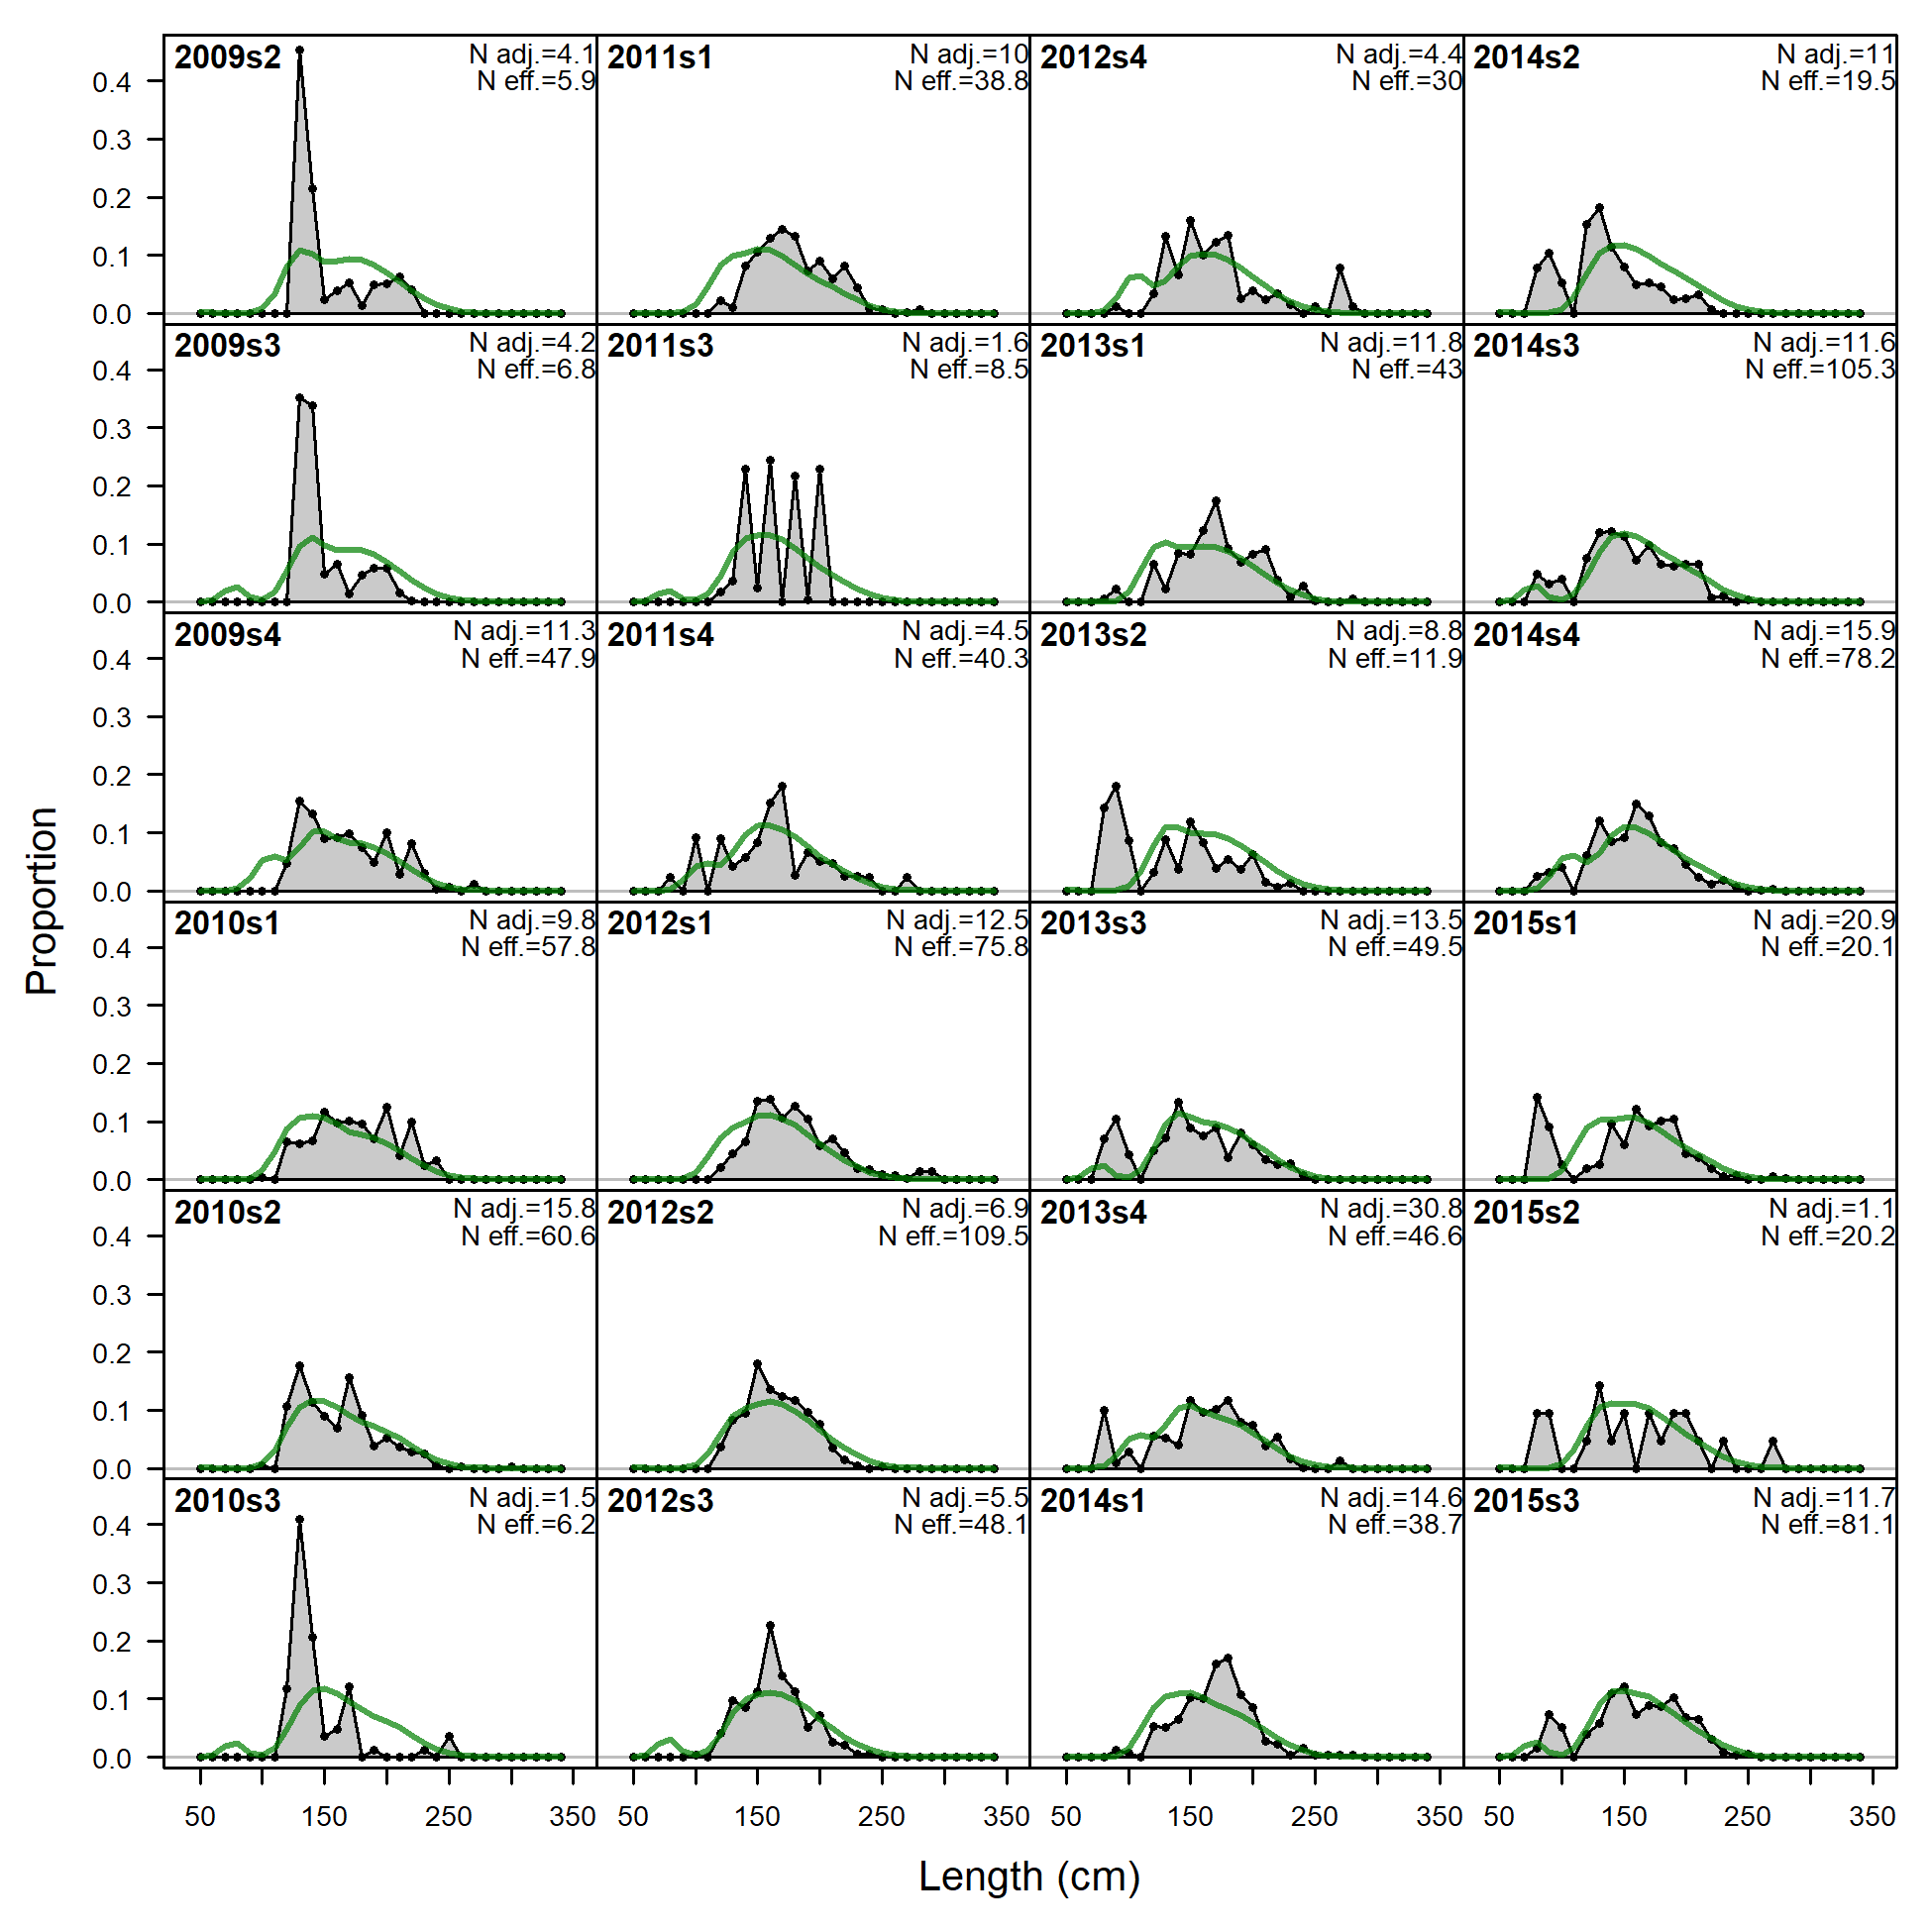
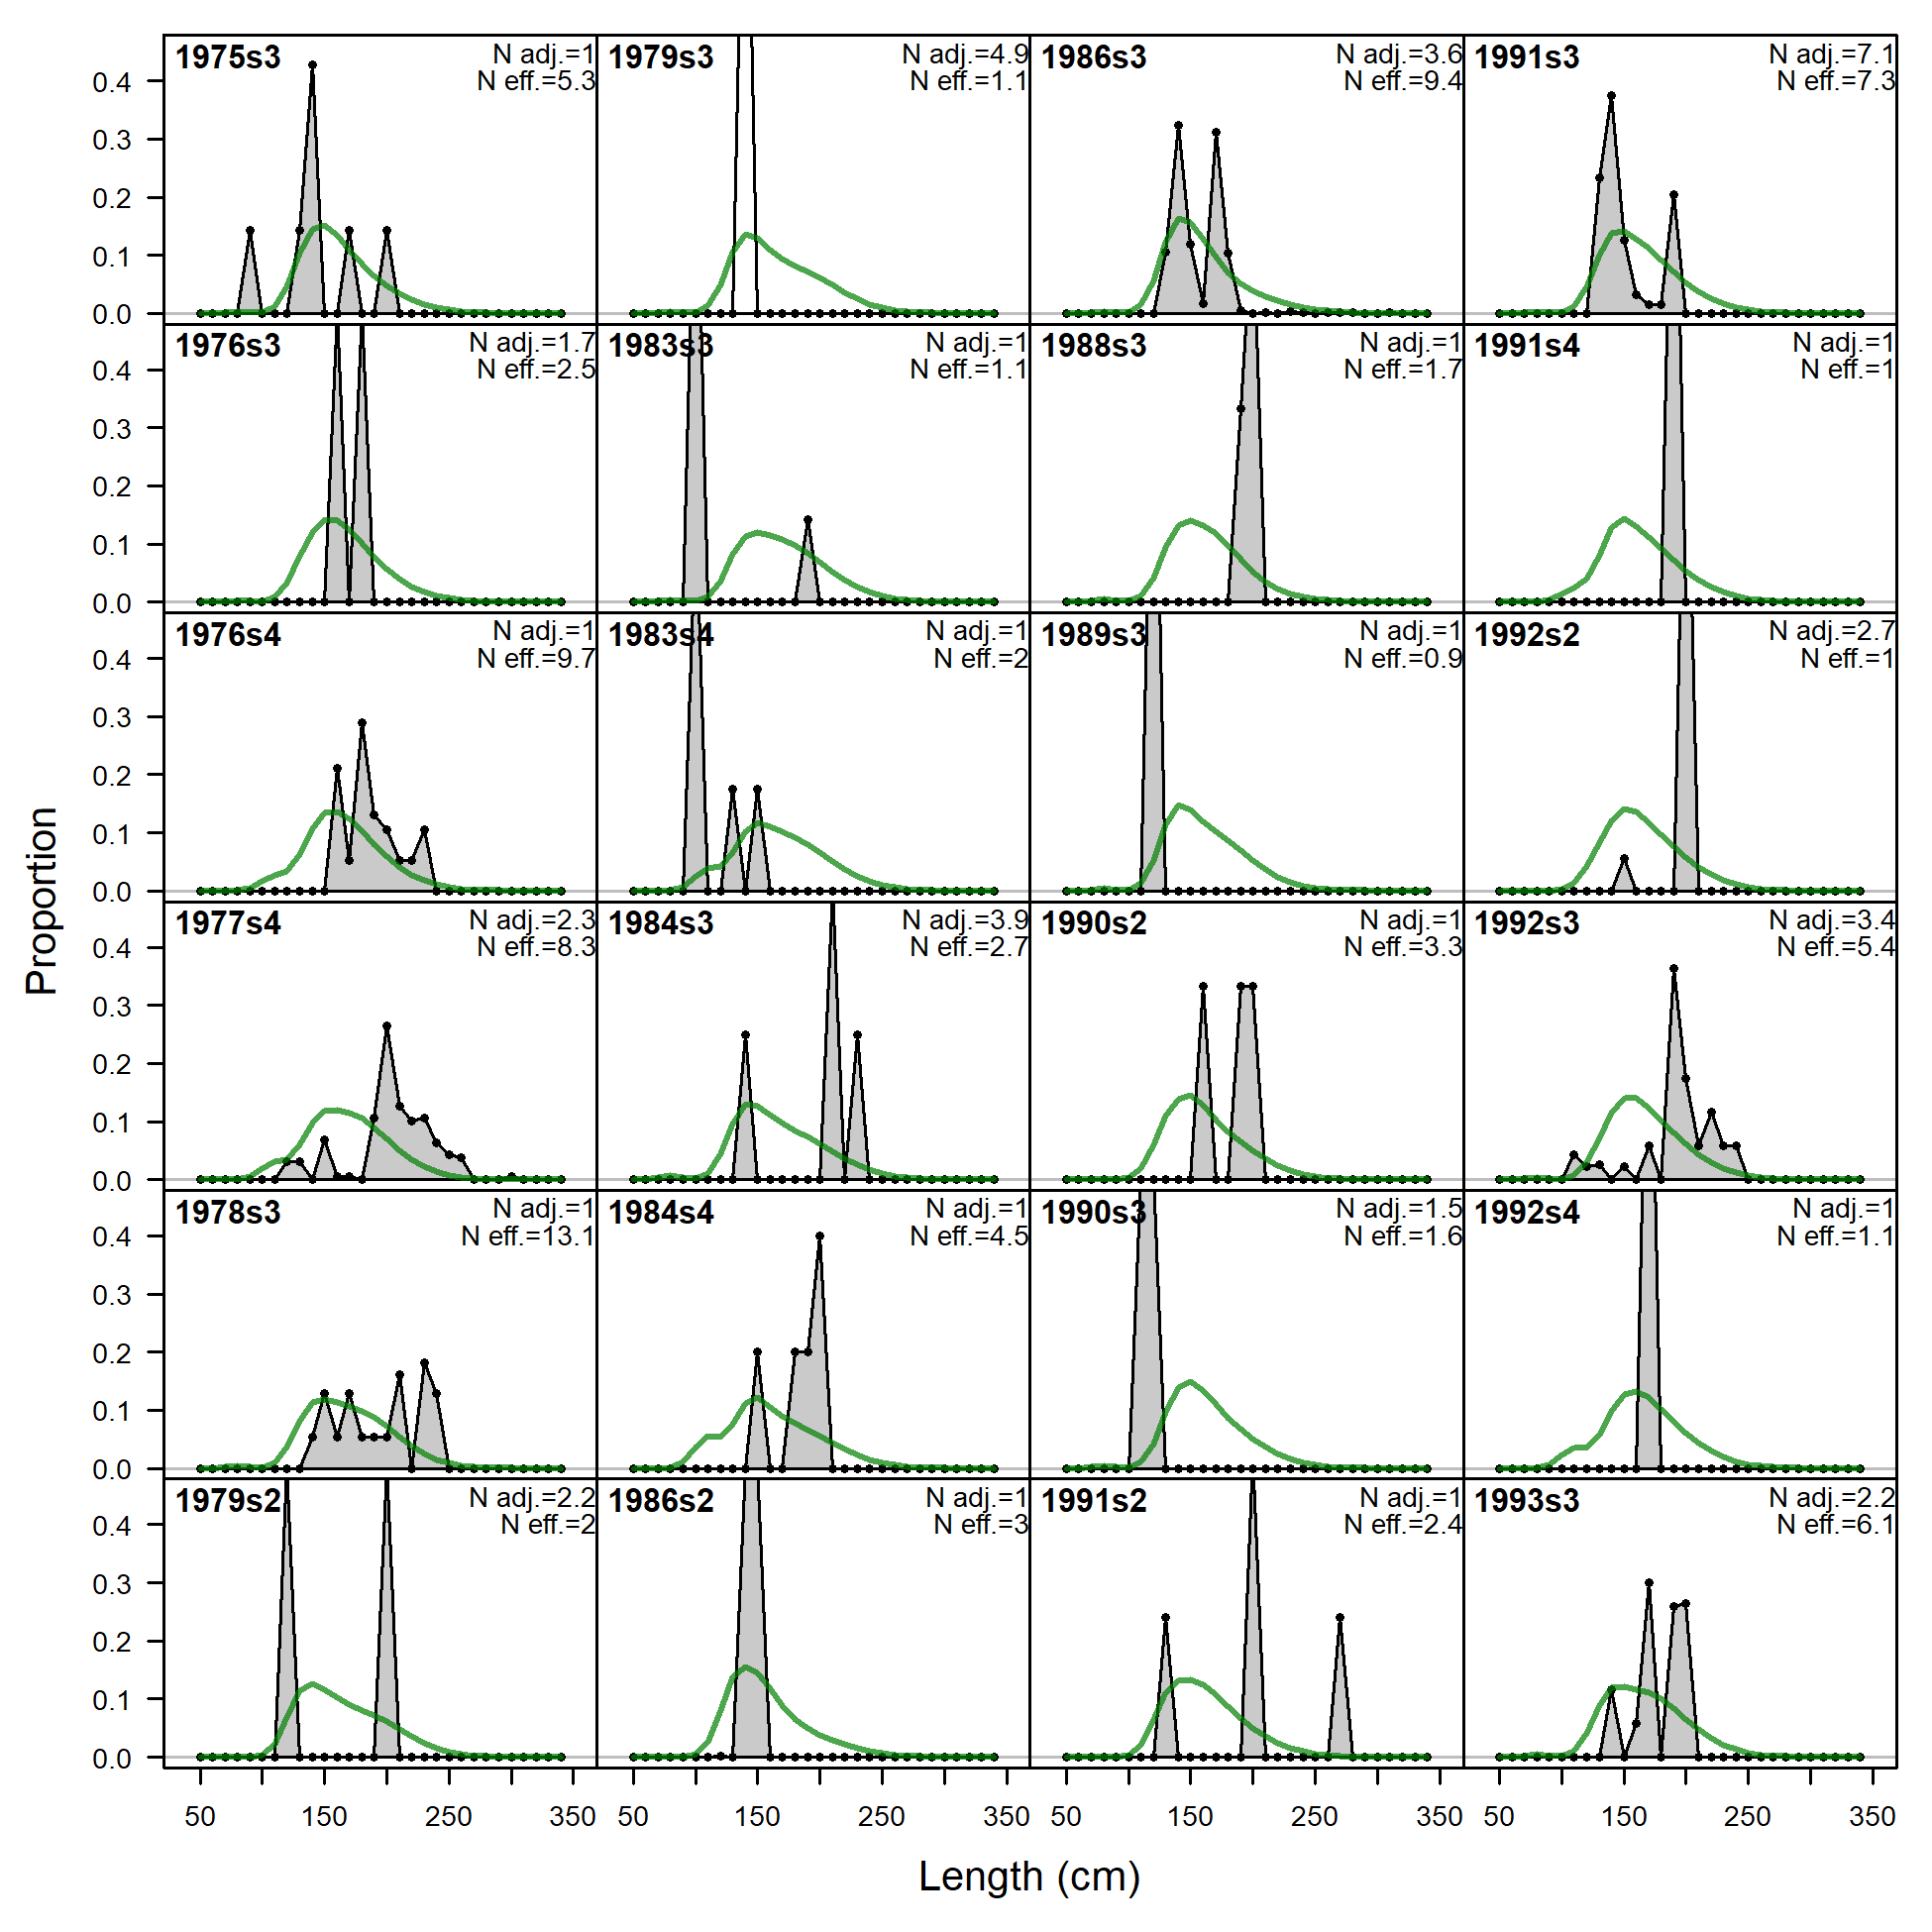
Length comps, whole catch, JPN+Like (plot 1 of 6).
'N adj.' is the input sample size after data-weighting adjustment. N eff. is the calculated effective sample size used in the McAllister-Ianelli tuning method.
file: comp_lenfit_flt3mkt0_page1.png
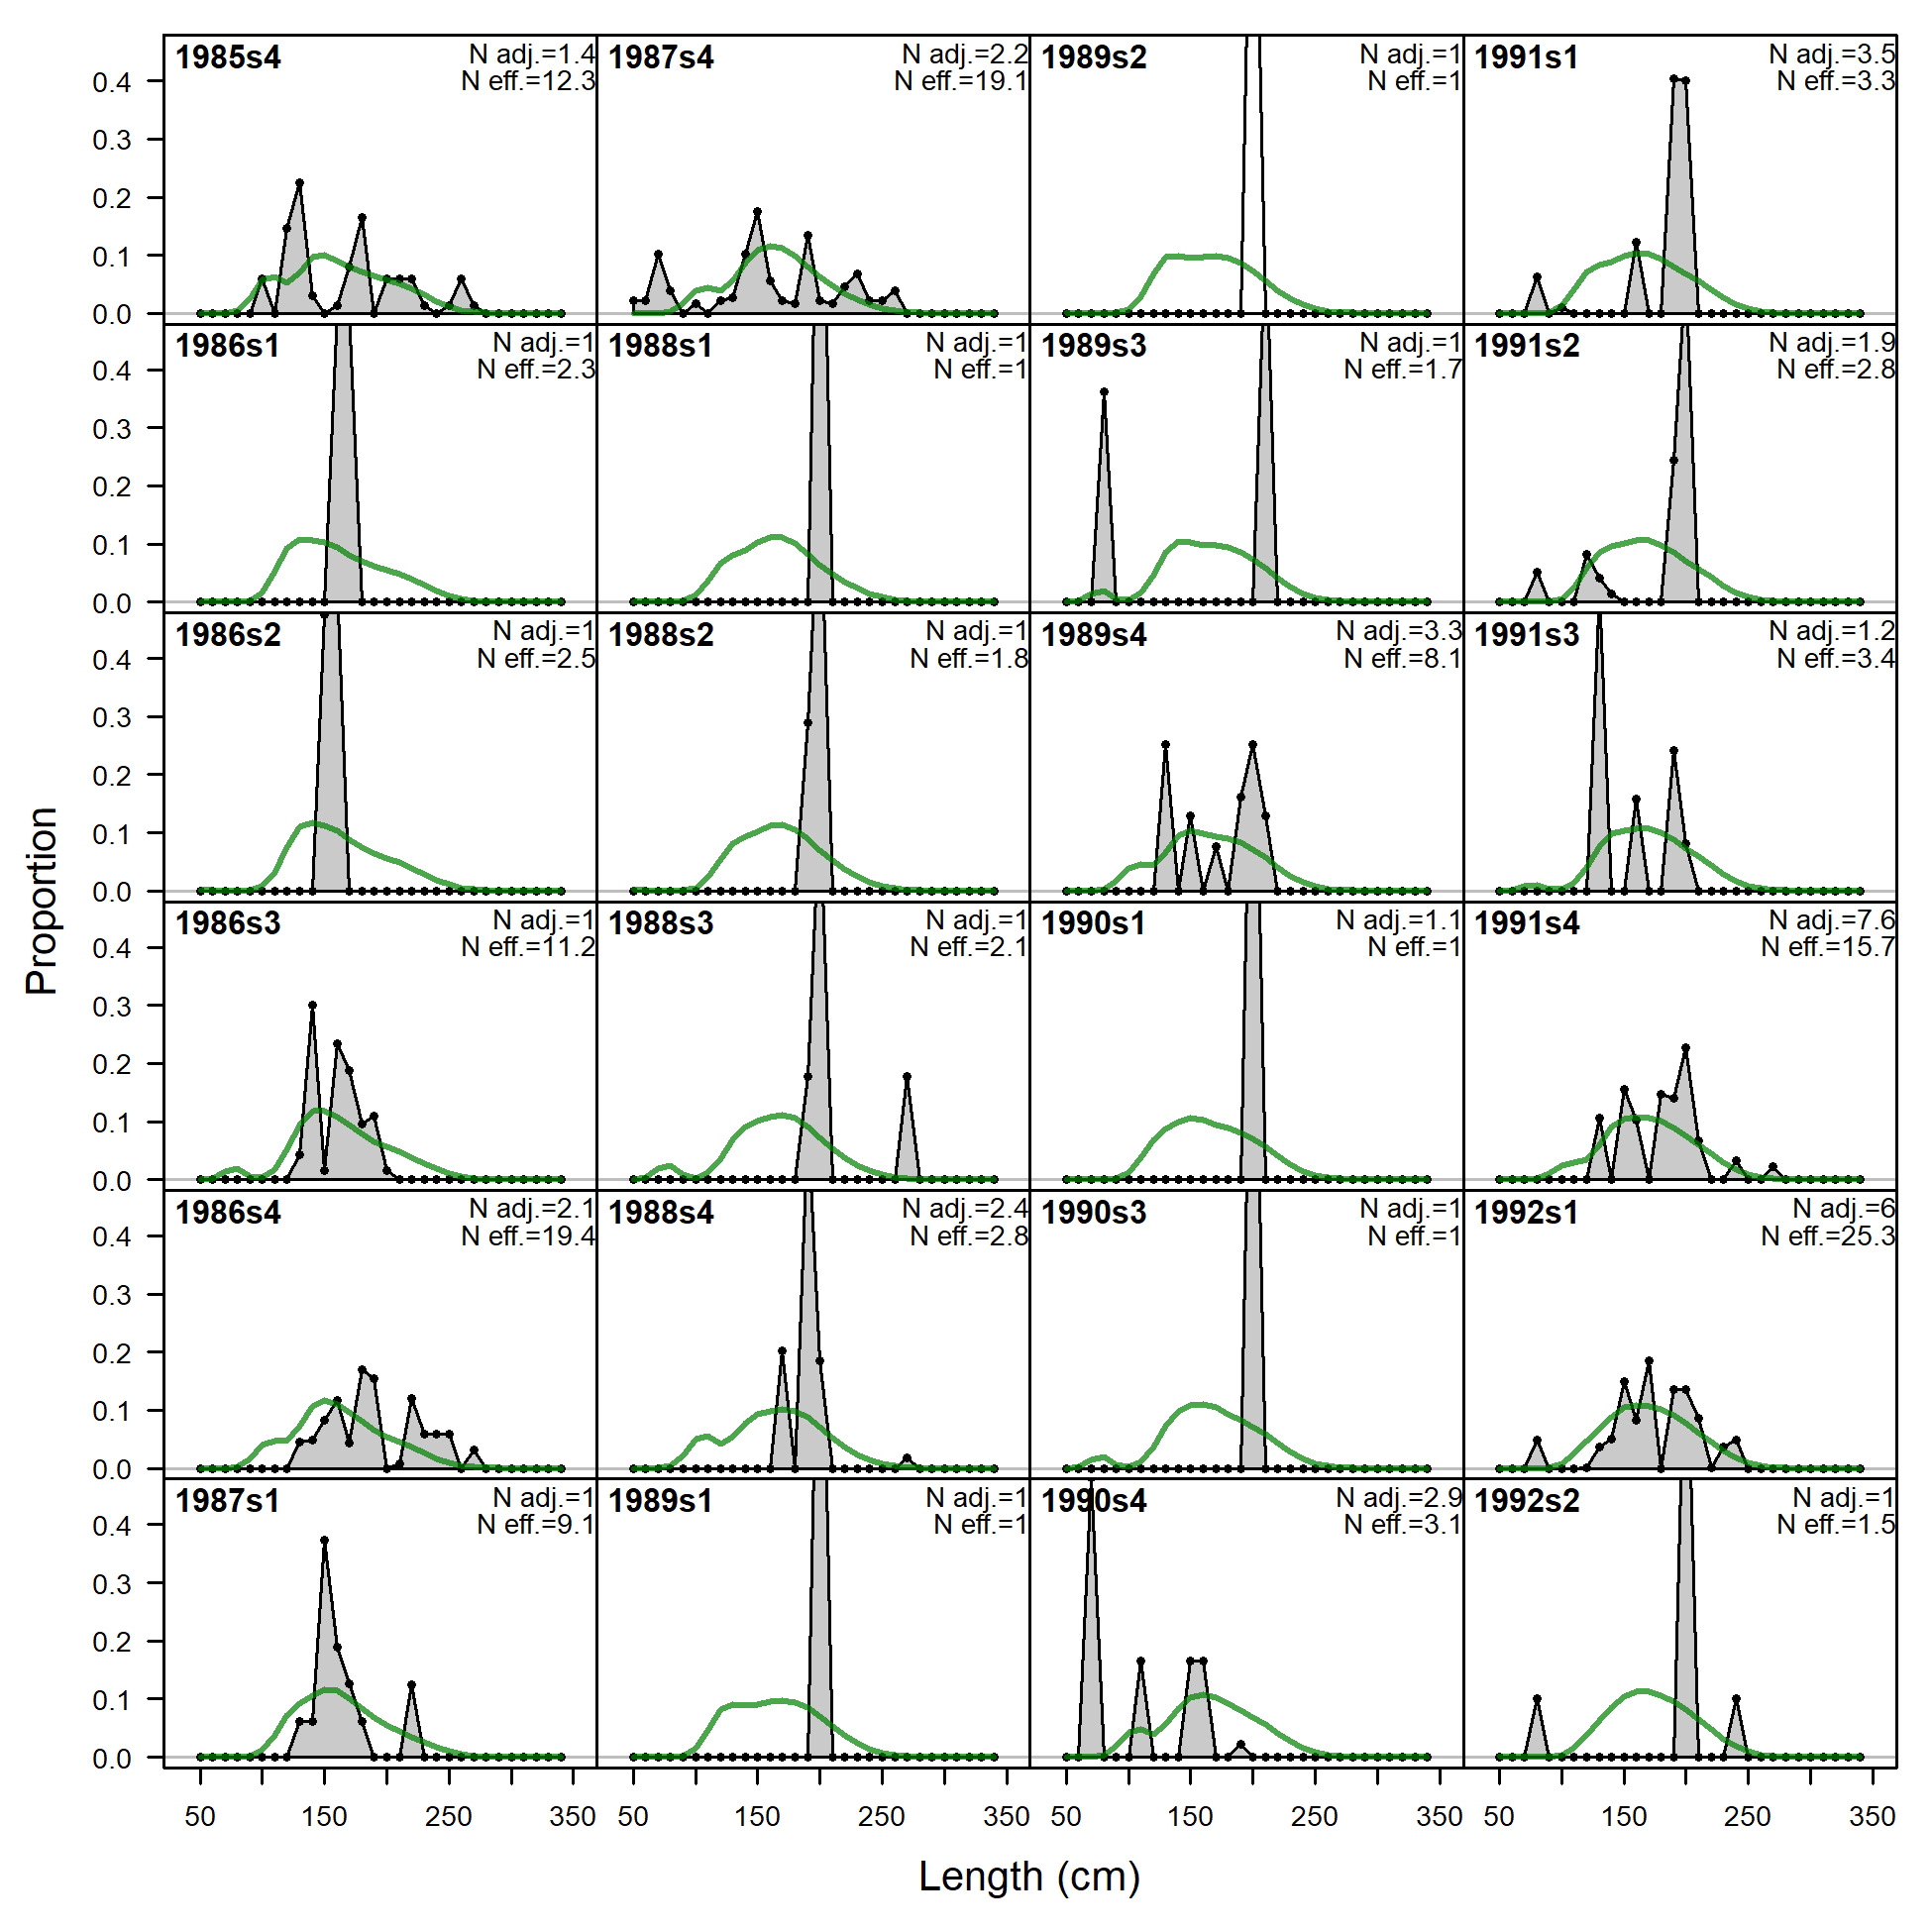
Length comps, whole catch, JPN+Like (plot 1 of 6).
'N adj.' is the input sample size after data-weighting adjustment. N eff. is the calculated effective sample size used in the McAllister-Ianelli tuning method. (plot 2 of 6)
file: comp_lenfit_flt3mkt0_page2.png
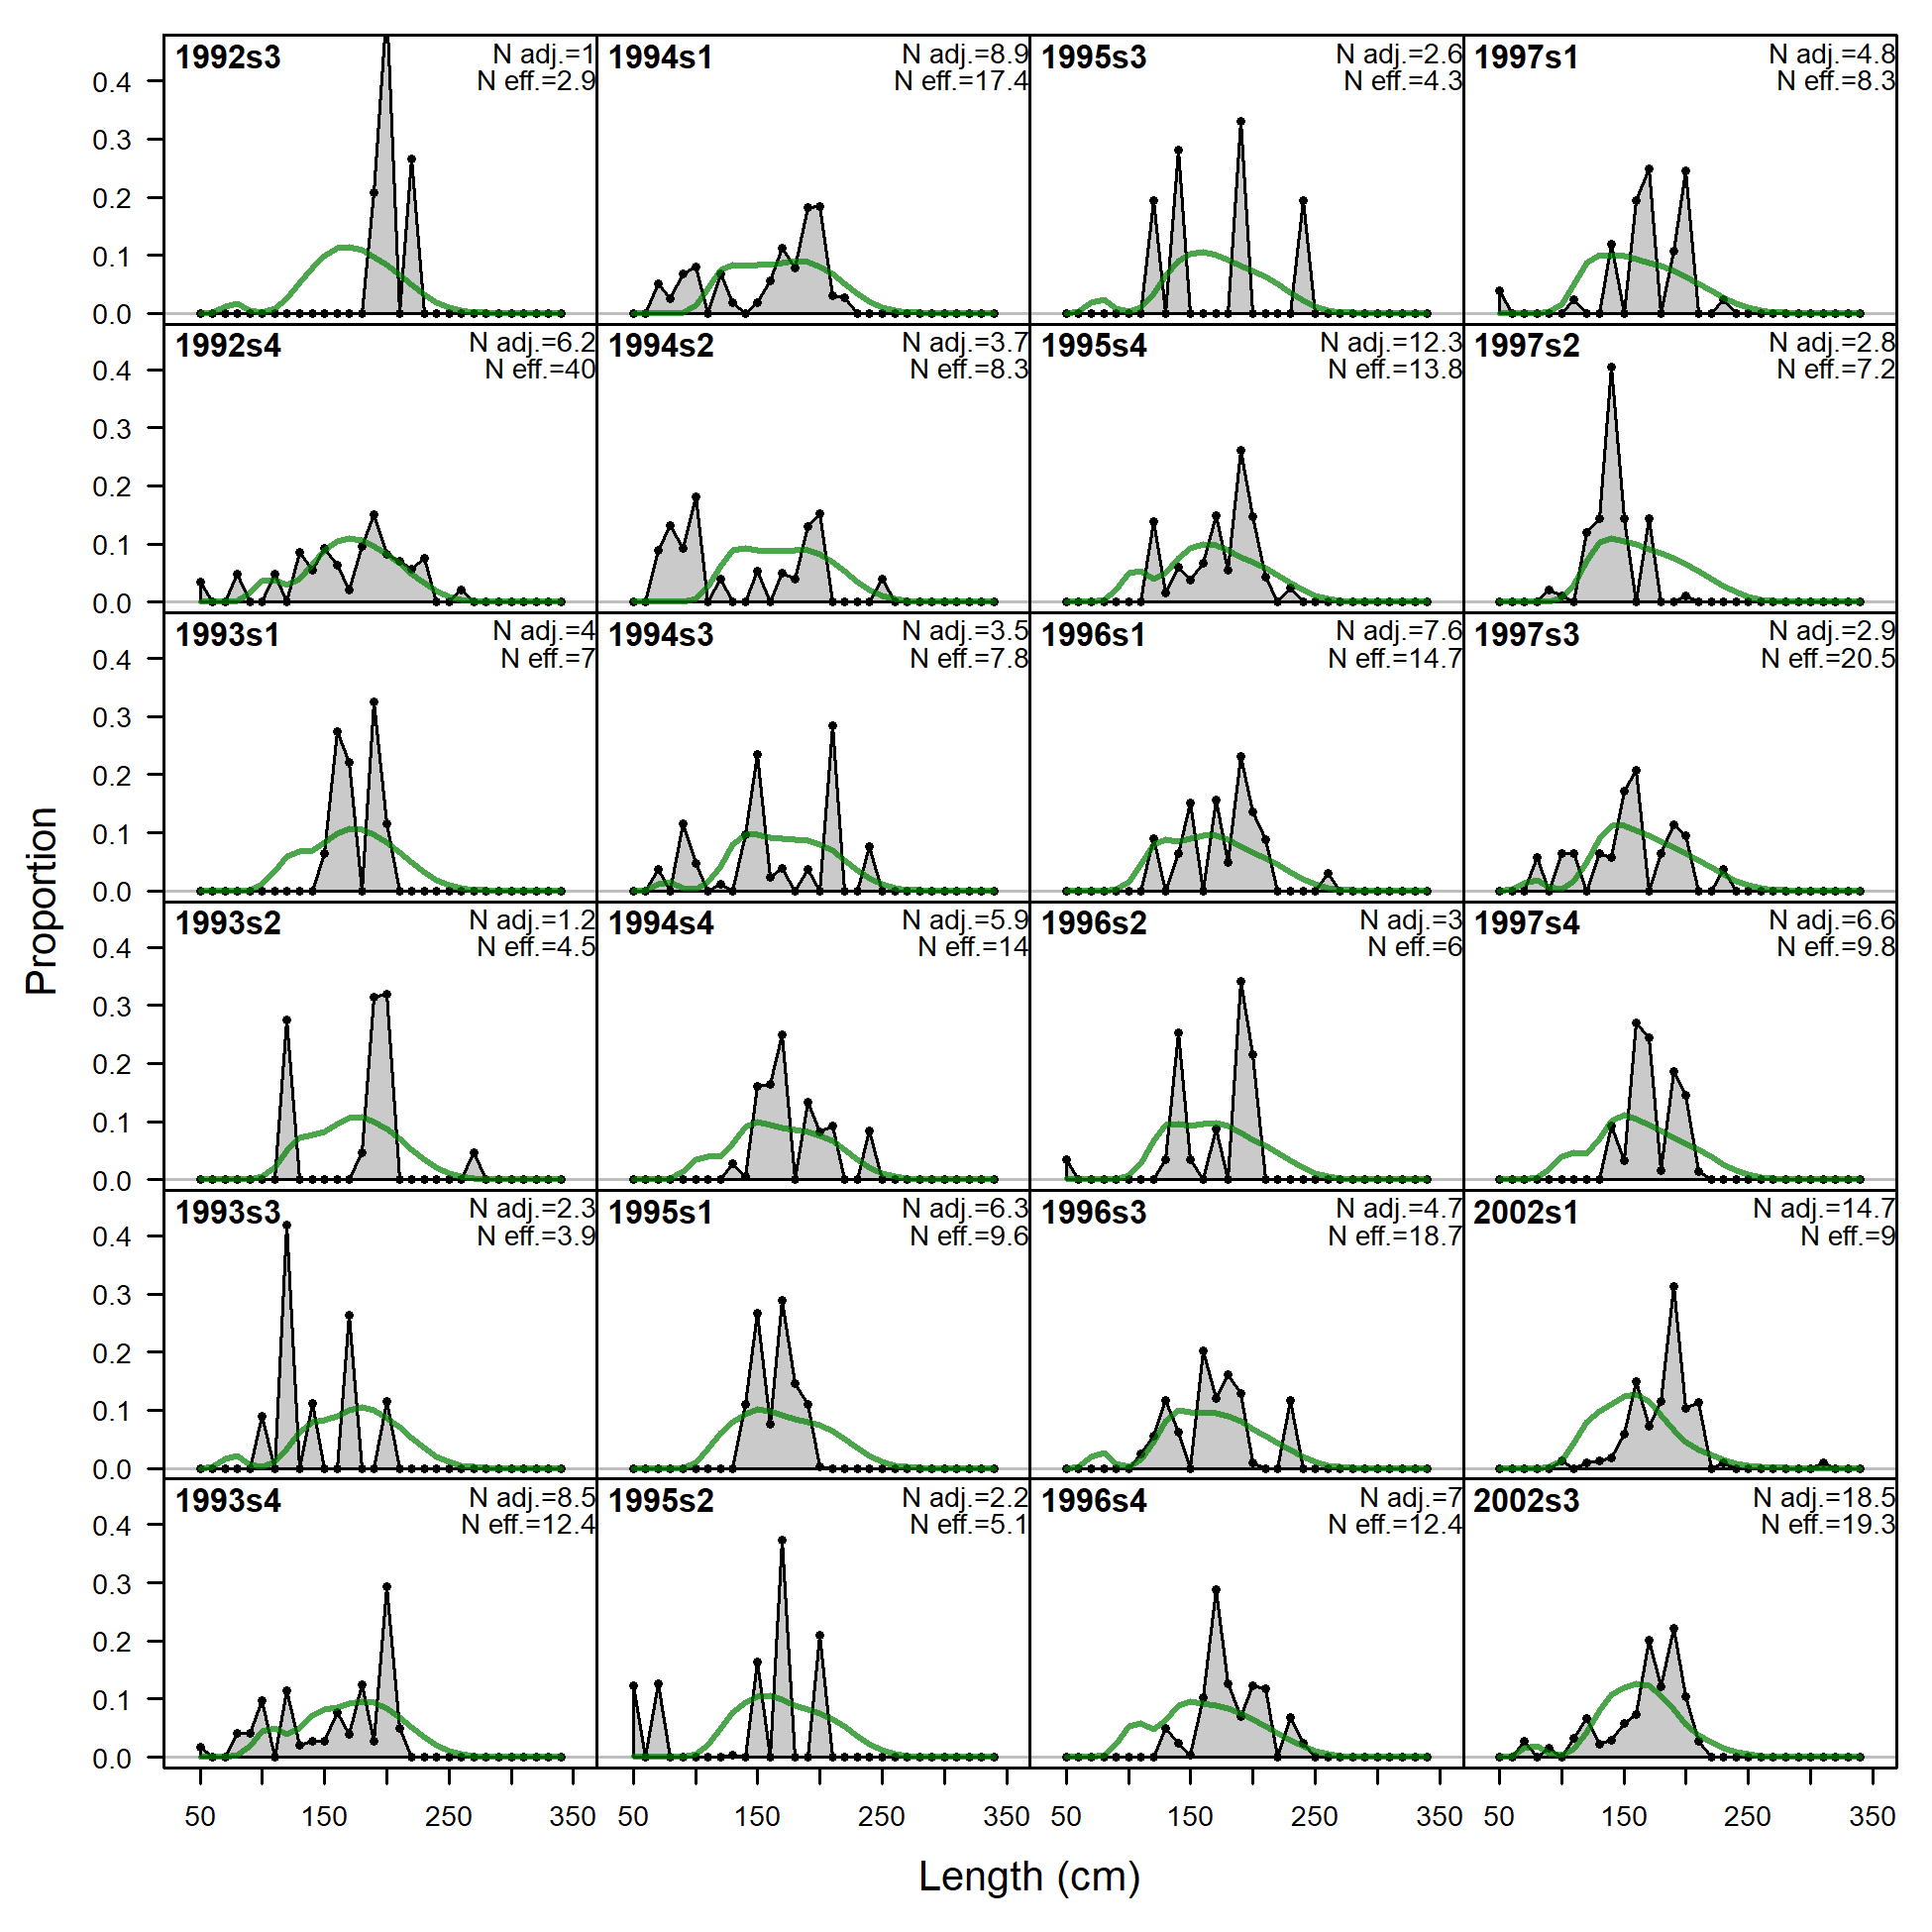
Length comps, whole catch, JPN+Like (plot 1 of 6).
'N adj.' is the input sample size after data-weighting adjustment. N eff. is the calculated effective sample size used in the McAllister-Ianelli tuning method. (plot 2 of 6) (plot 3 of 6)
file: comp_lenfit_flt3mkt0_page3.png
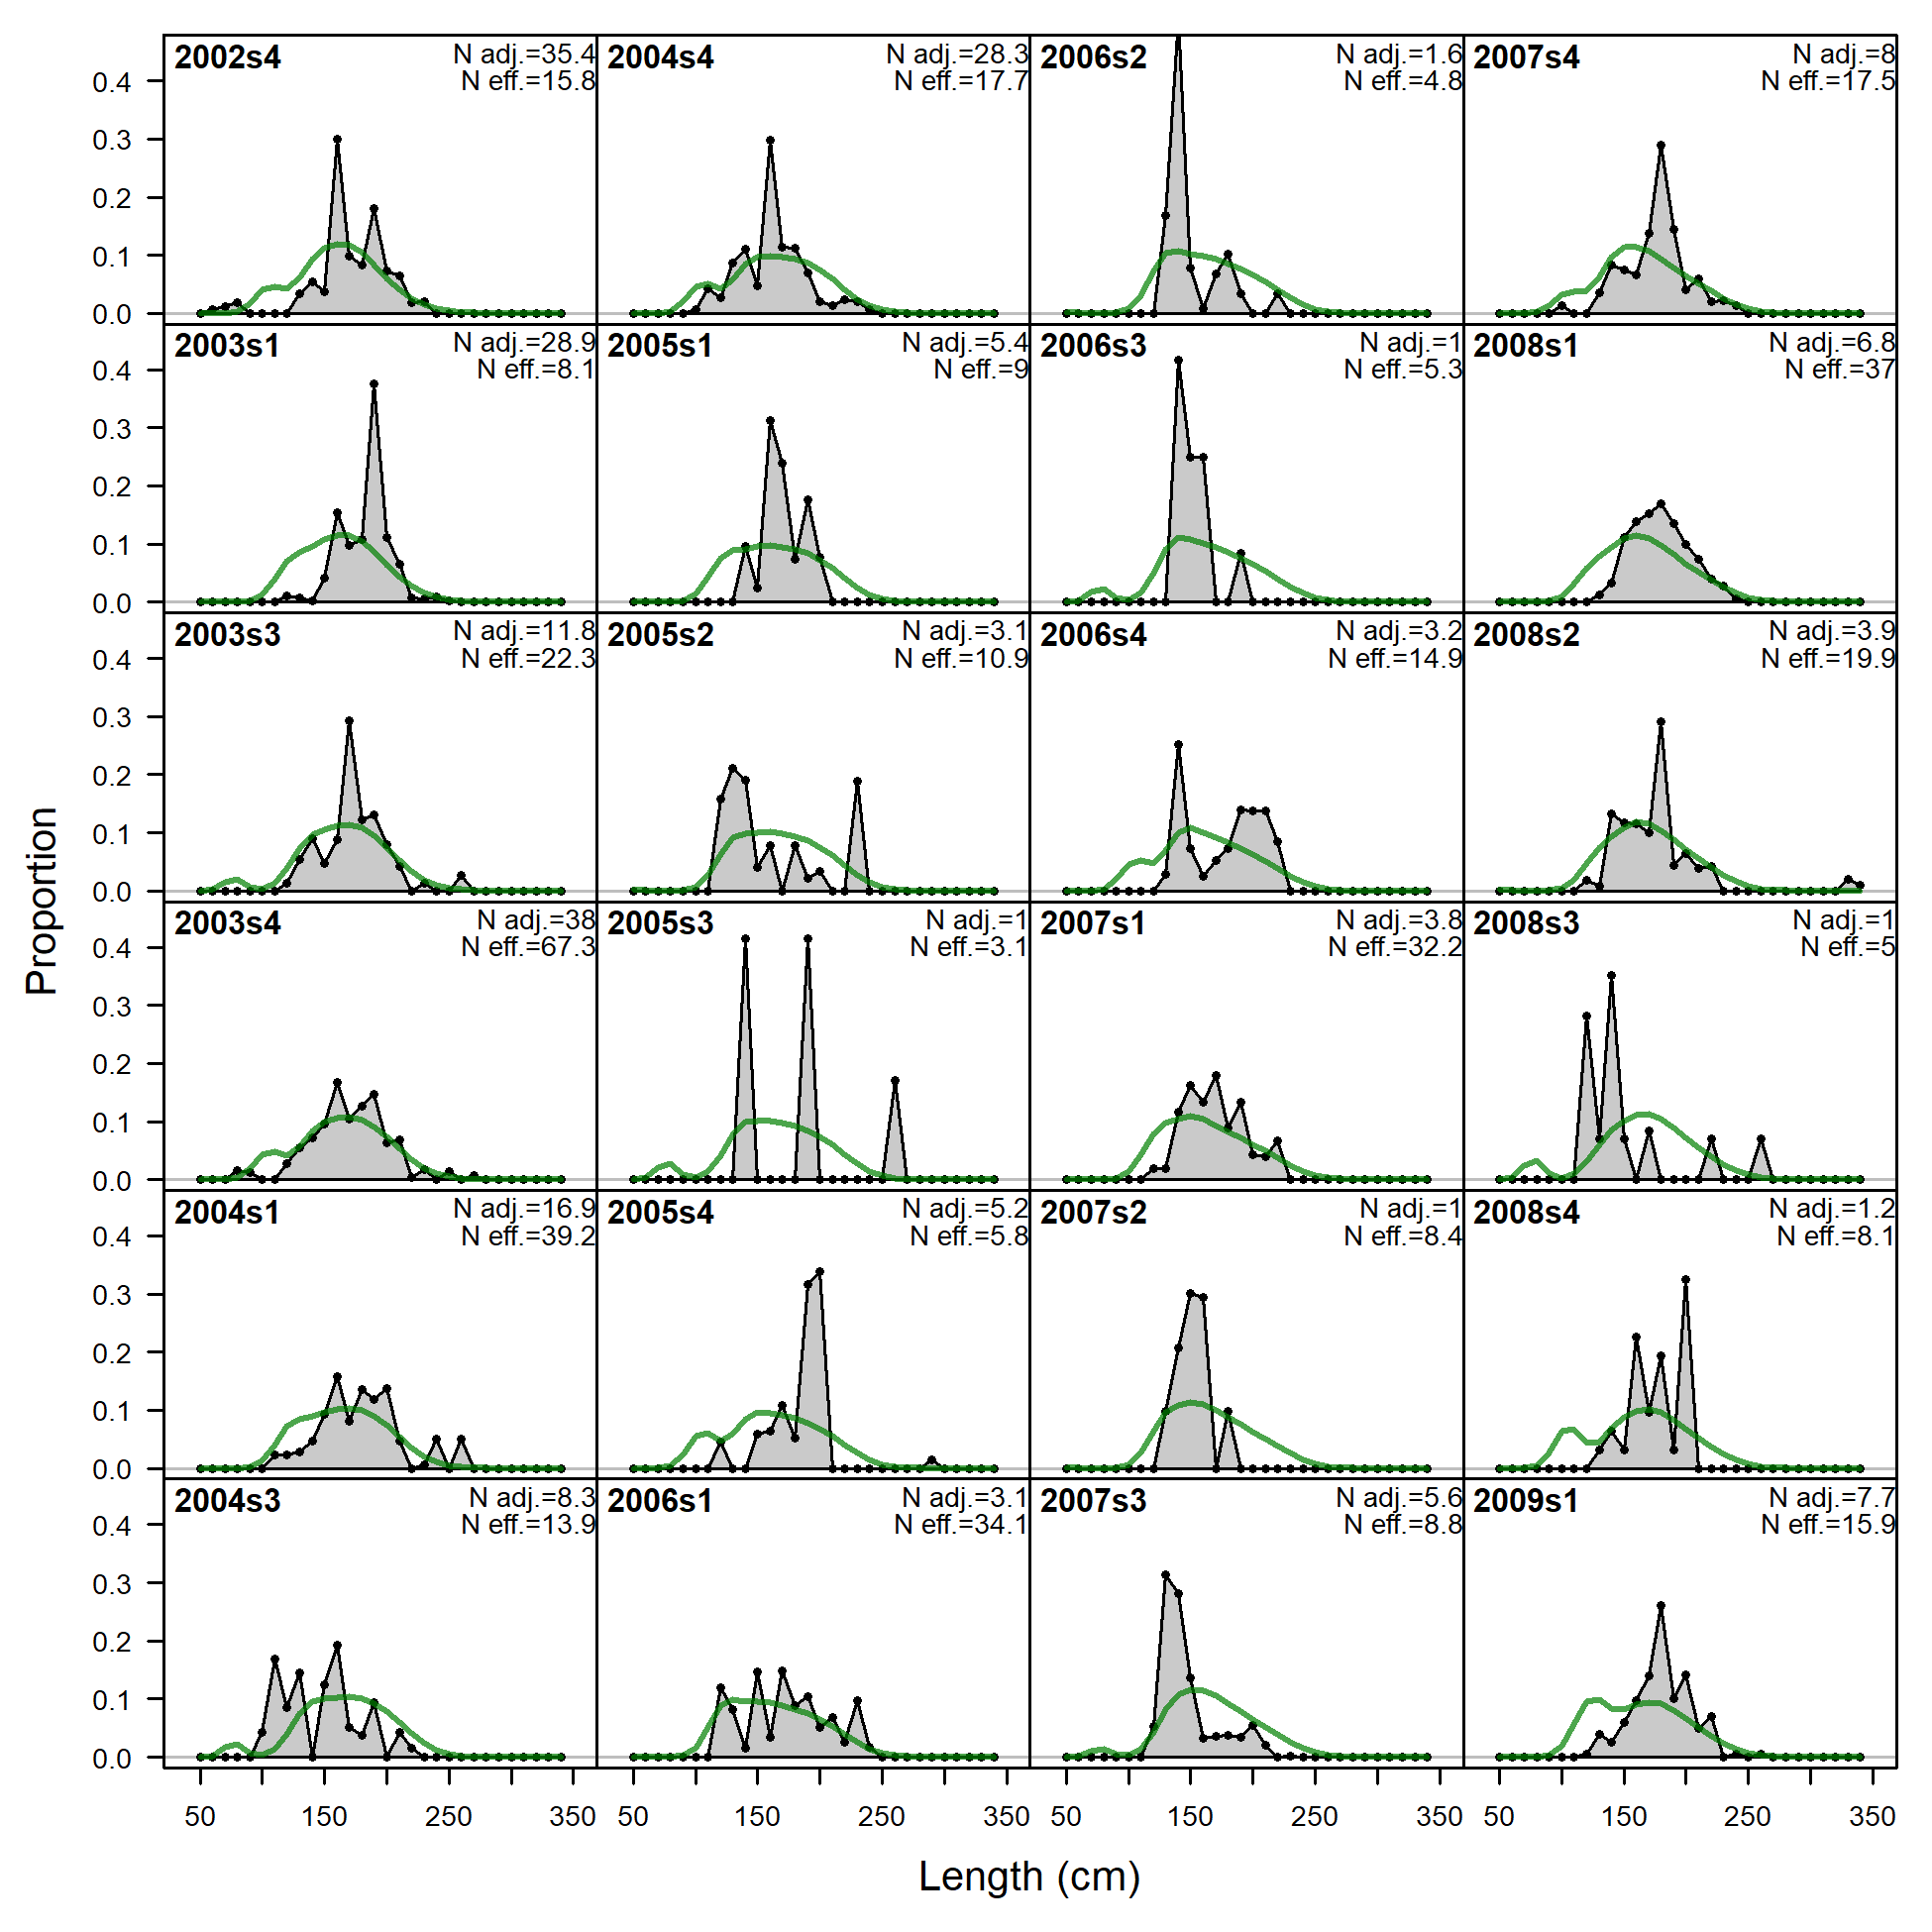
Length comps, whole catch, JPN+Like (plot 1 of 6).
'N adj.' is the input sample size after data-weighting adjustment. N eff. is the calculated effective sample size used in the McAllister-Ianelli tuning method. (plot 2 of 6) (plot 3 of 6) (plot 4 of 6)
file: comp_lenfit_flt3mkt0_page4.png
Length comps, whole catch, JPN+Like (plot 1 of 6).
'N adj.' is the input sample size after data-weighting adjustment. N eff. is the calculated effective sample size used in the McAllister-Ianelli tuning method. (plot 2 of 6) (plot 3 of 6) (plot 4 of 6) (plot 5 of 6)
file: comp_lenfit_flt3mkt0_page5.png
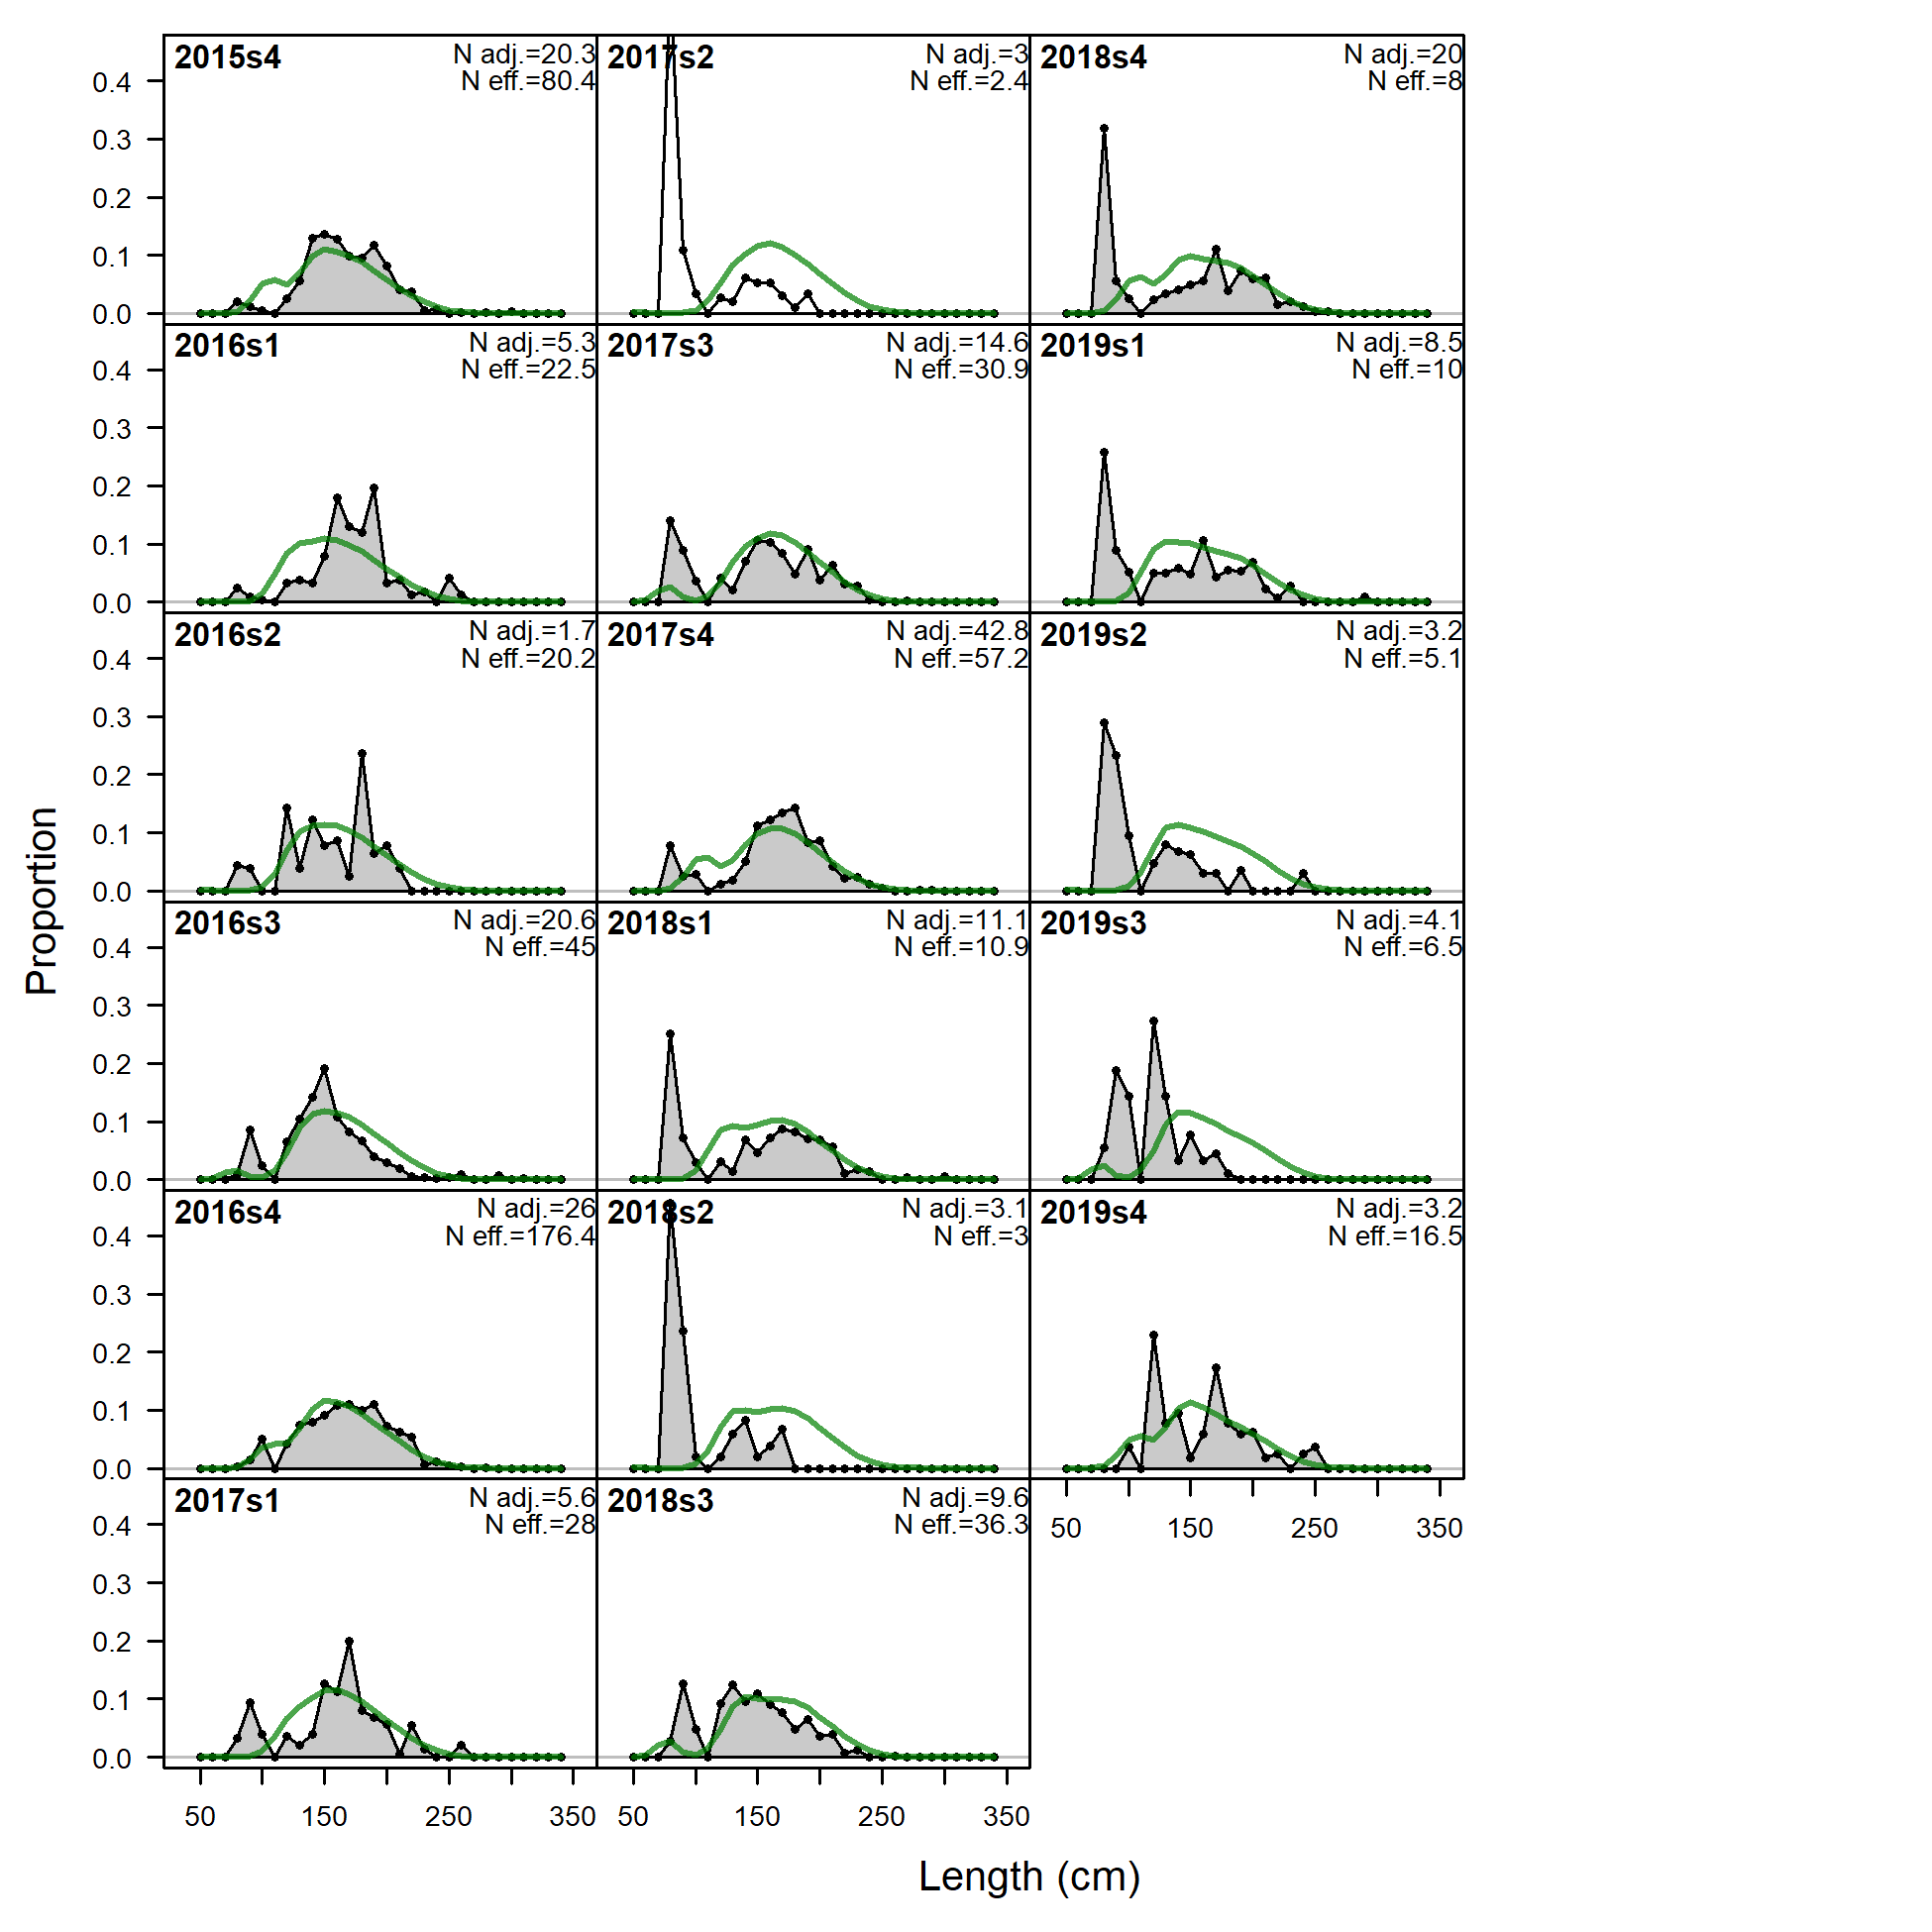
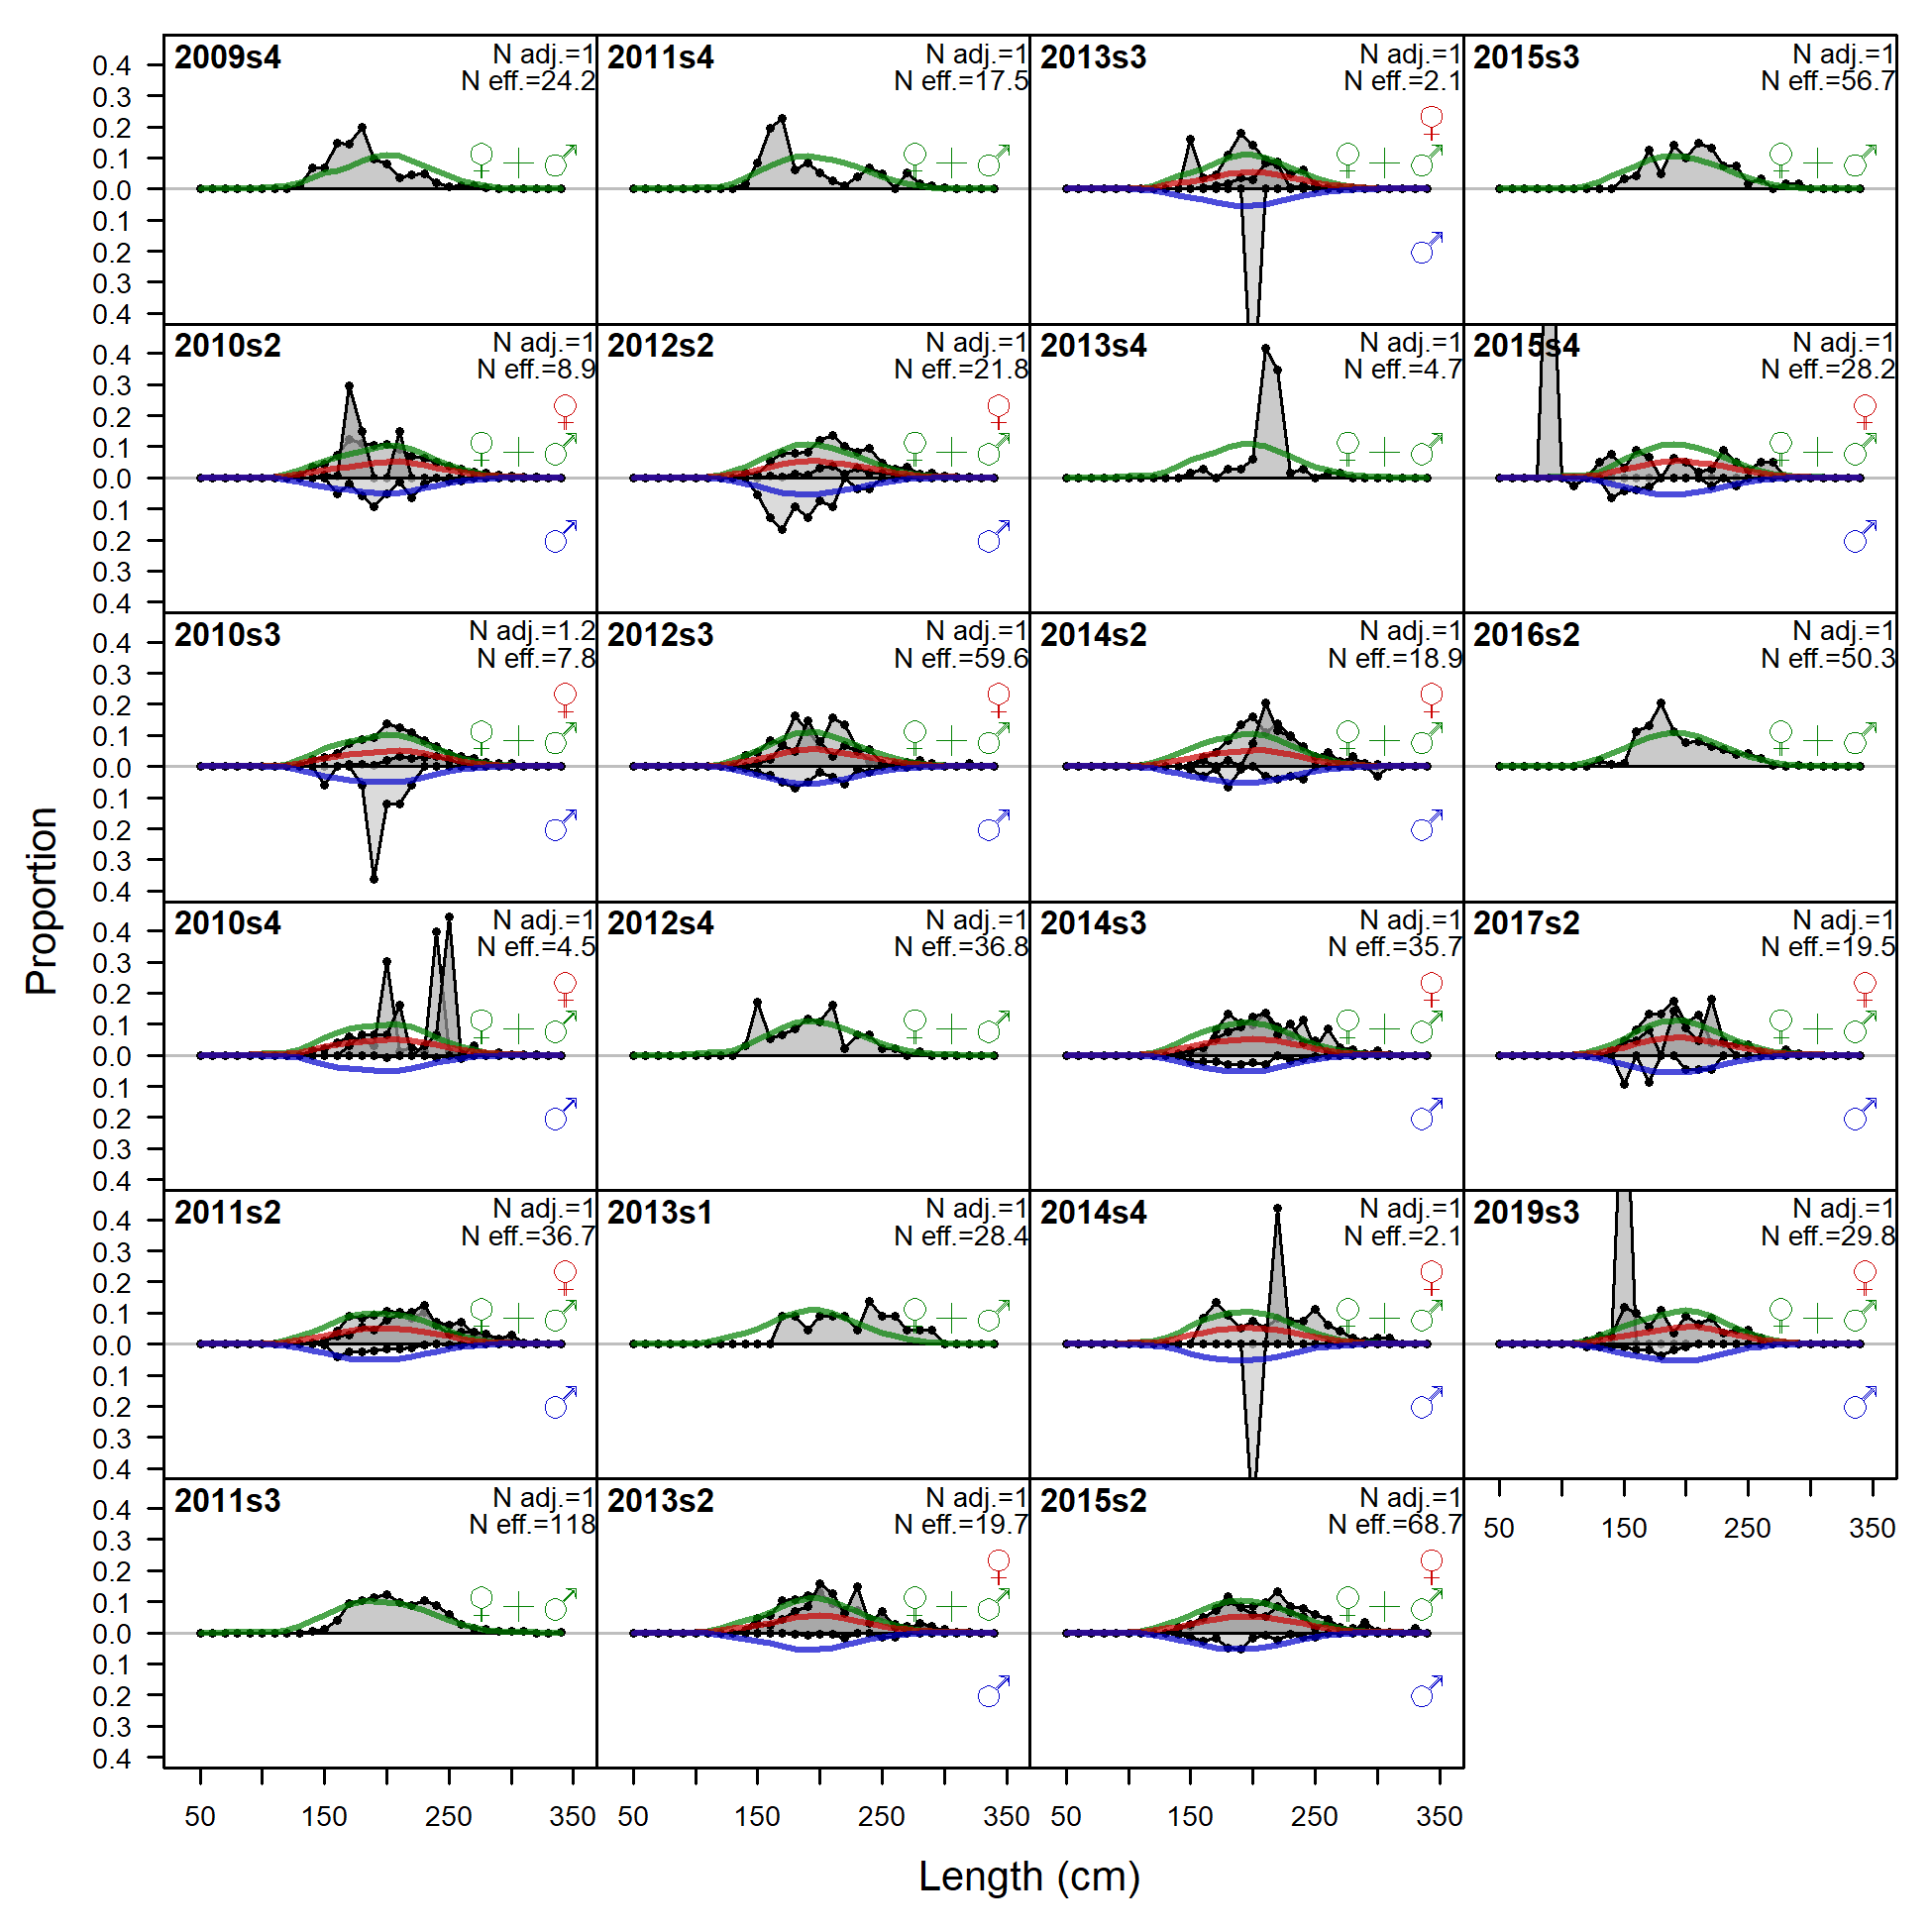
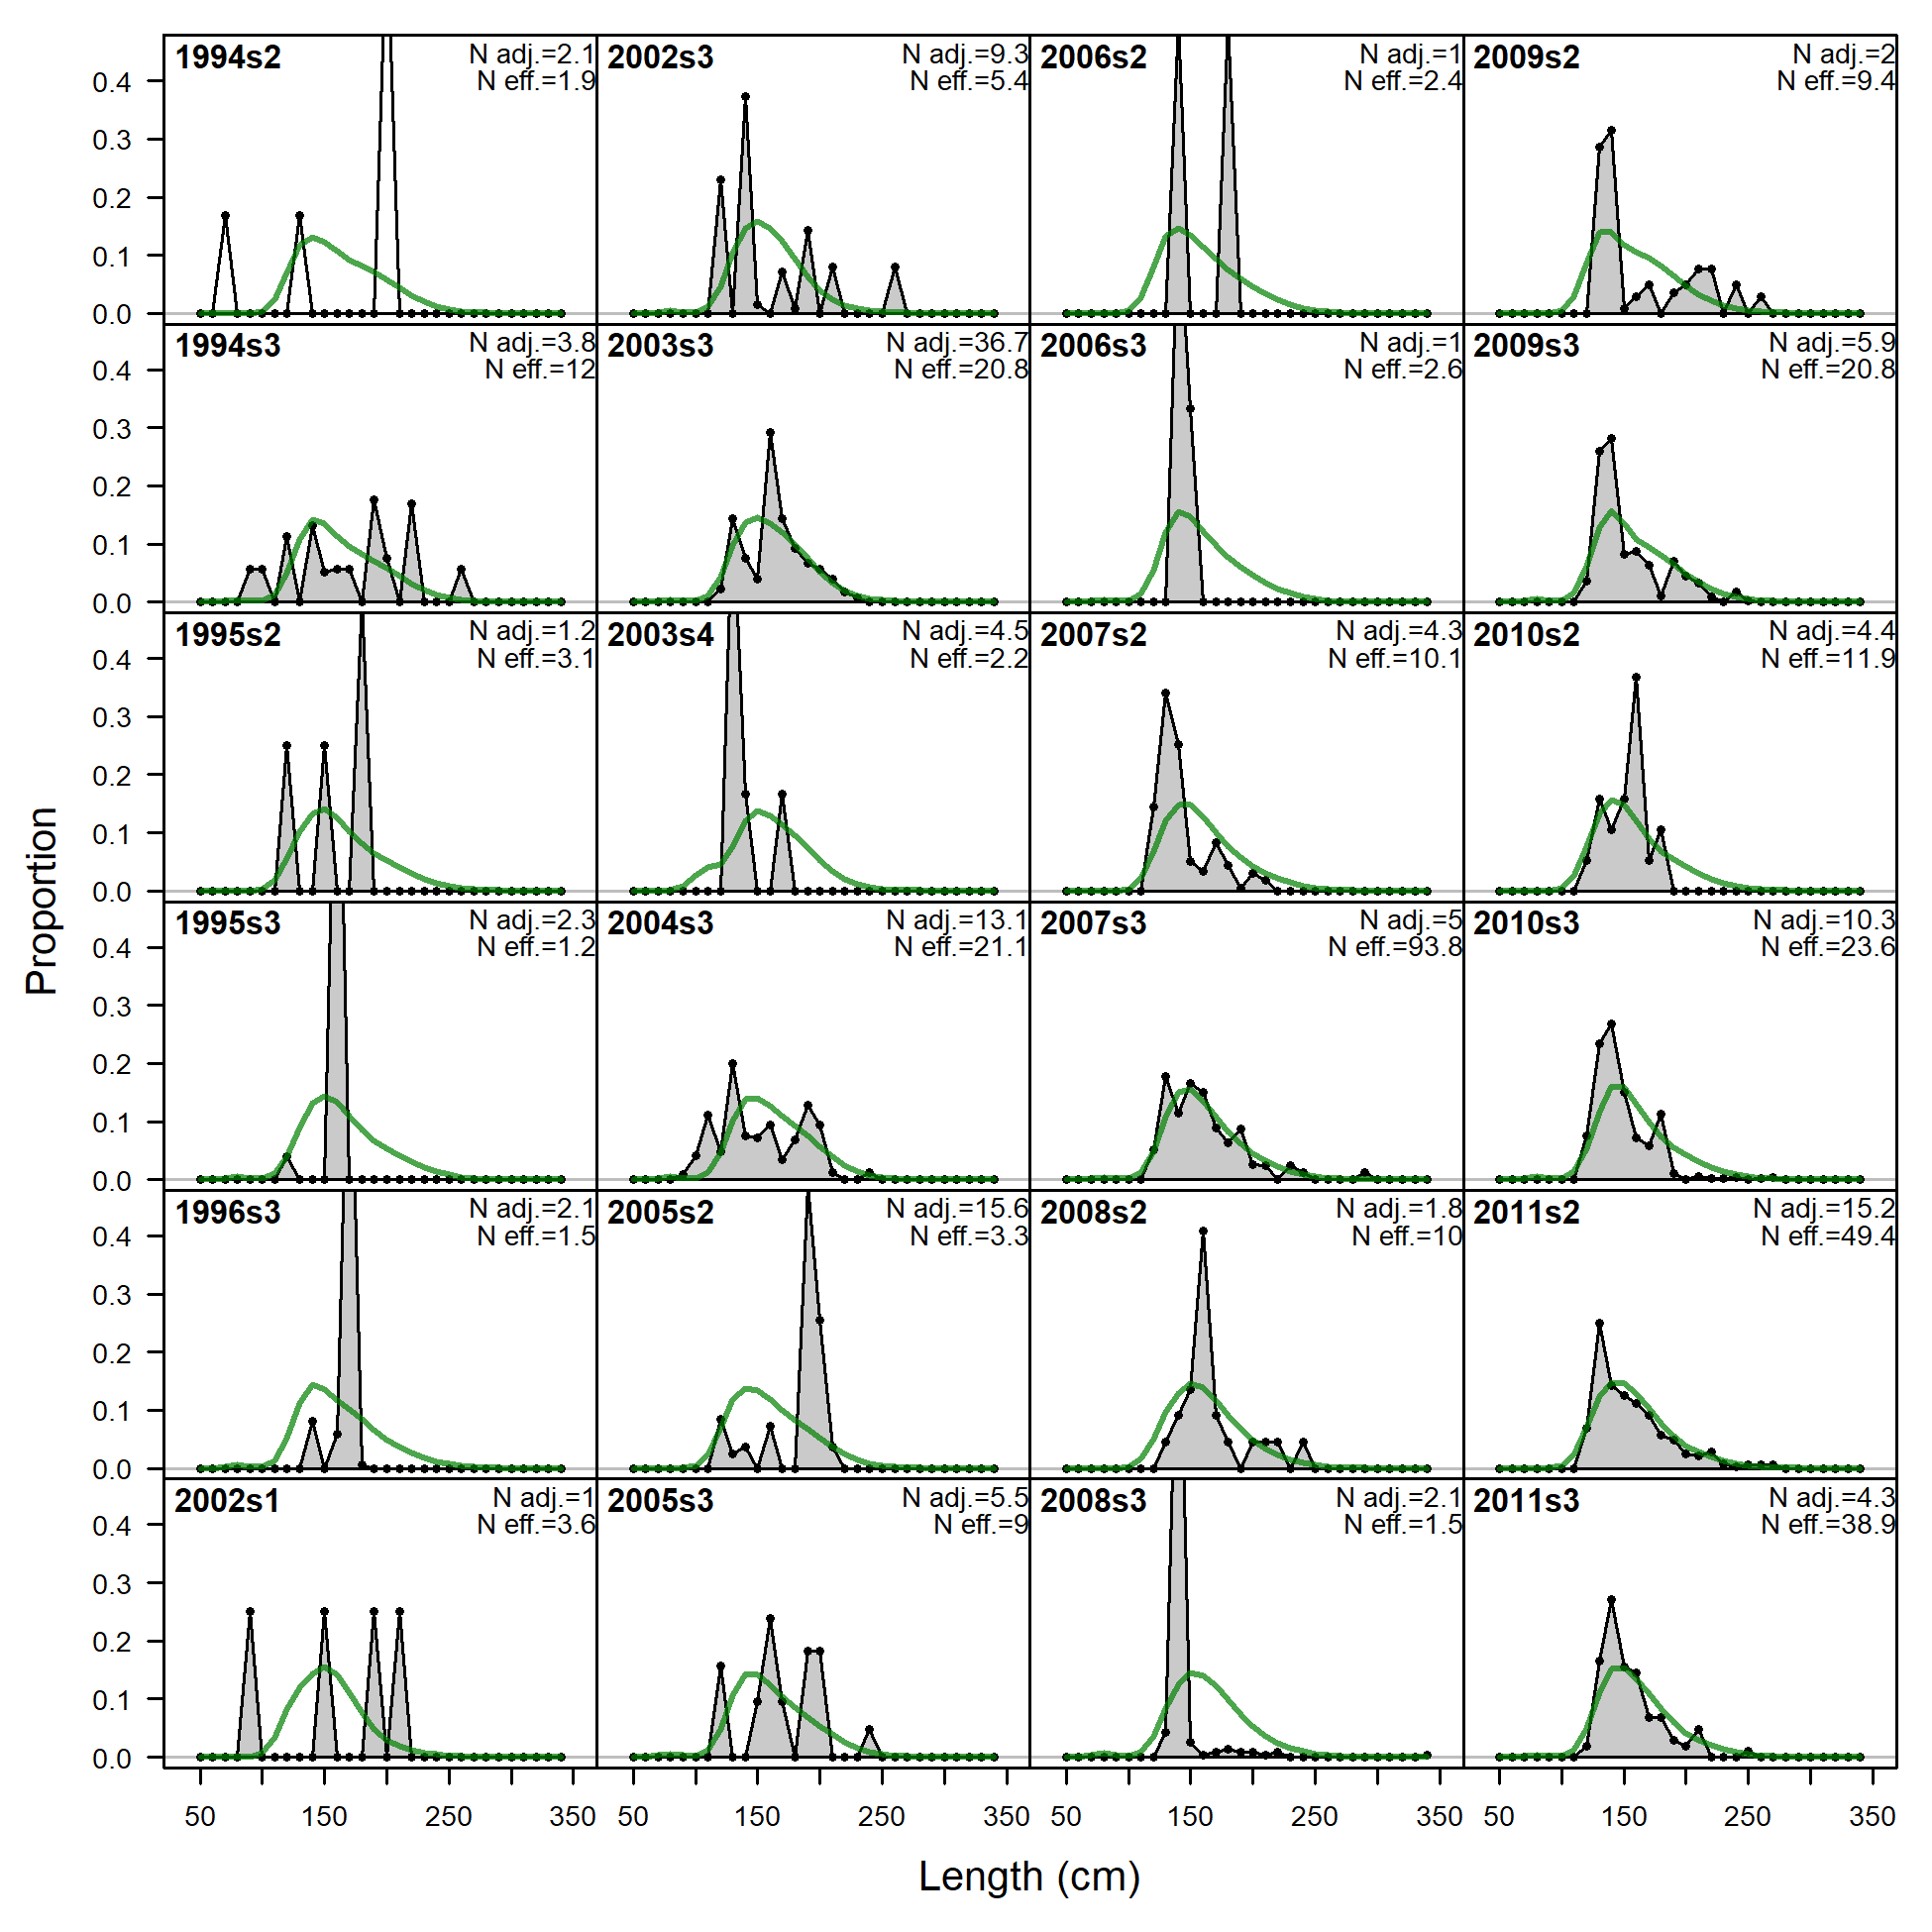
Length comps, whole catch, JPN+Like (plot 1 of 6).
'N adj.' is the input sample size after data-weighting adjustment. N eff. is the calculated effective sample size used in the McAllister-Ianelli tuning method. (plot 2 of 6) (plot 3 of 6) (plot 4 of 6) (plot 5 of 6) (plot 6 of 6)
file: comp_lenfit_flt3mkt0_page6.png
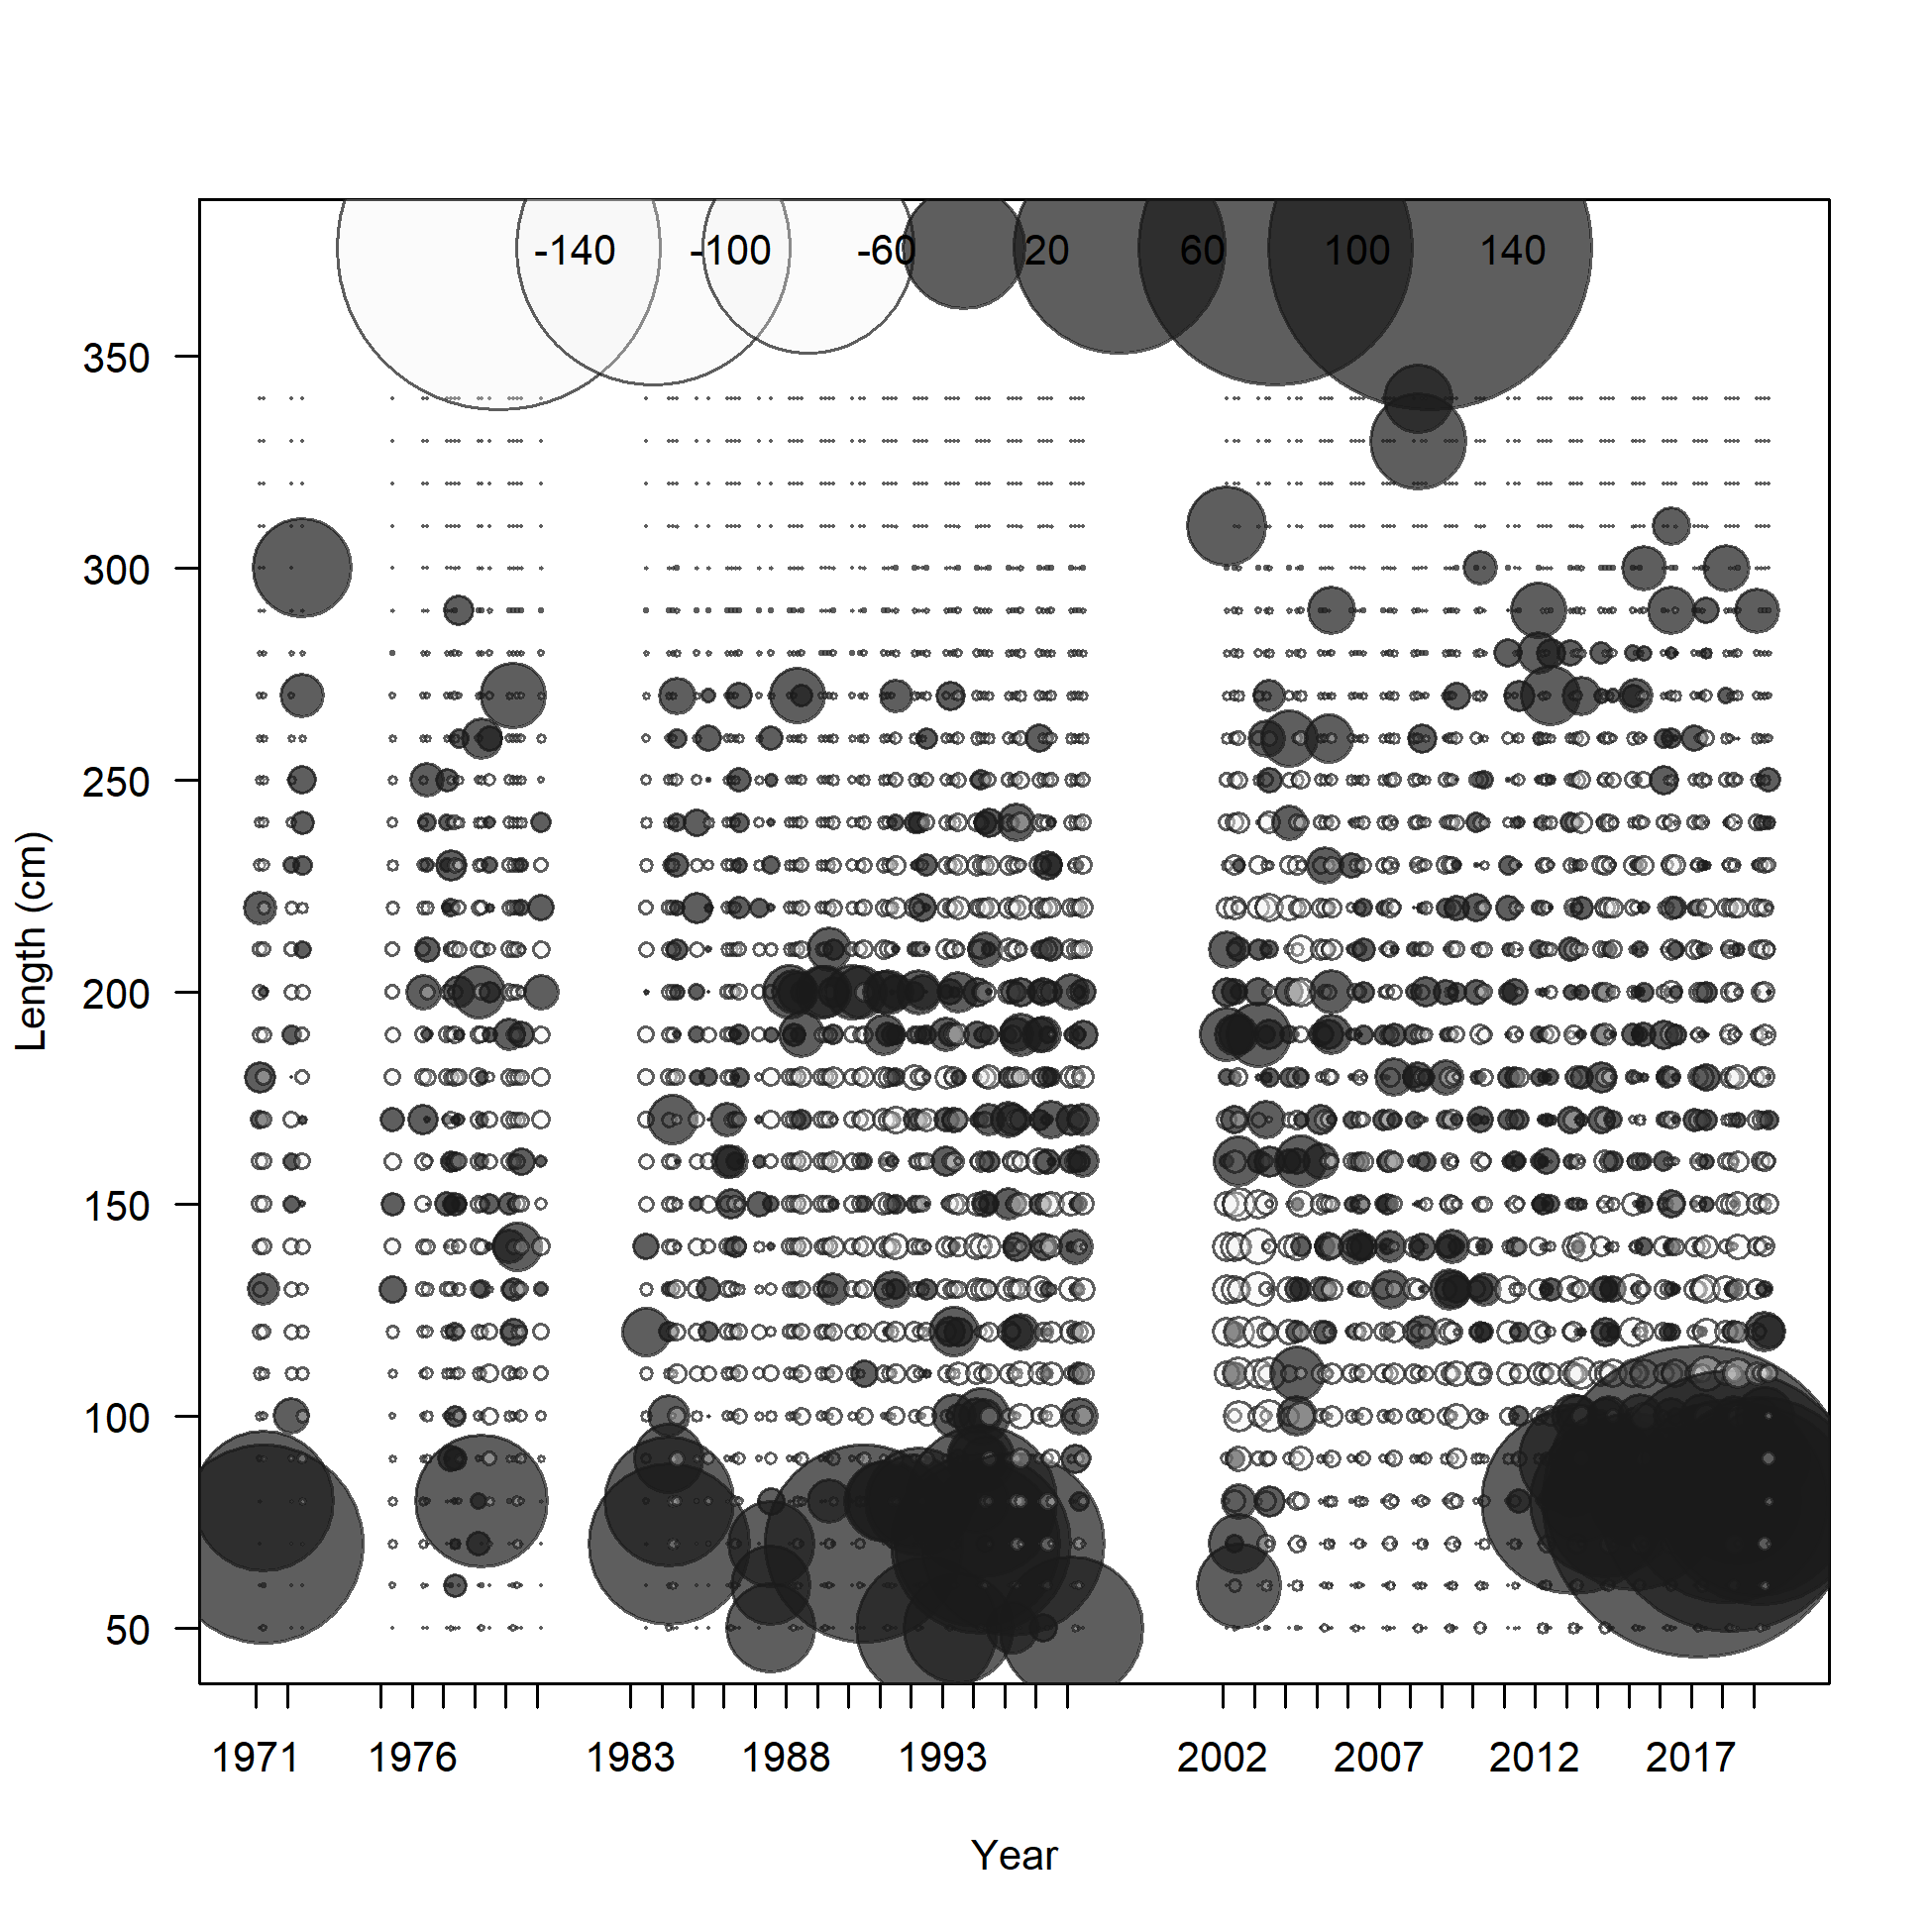
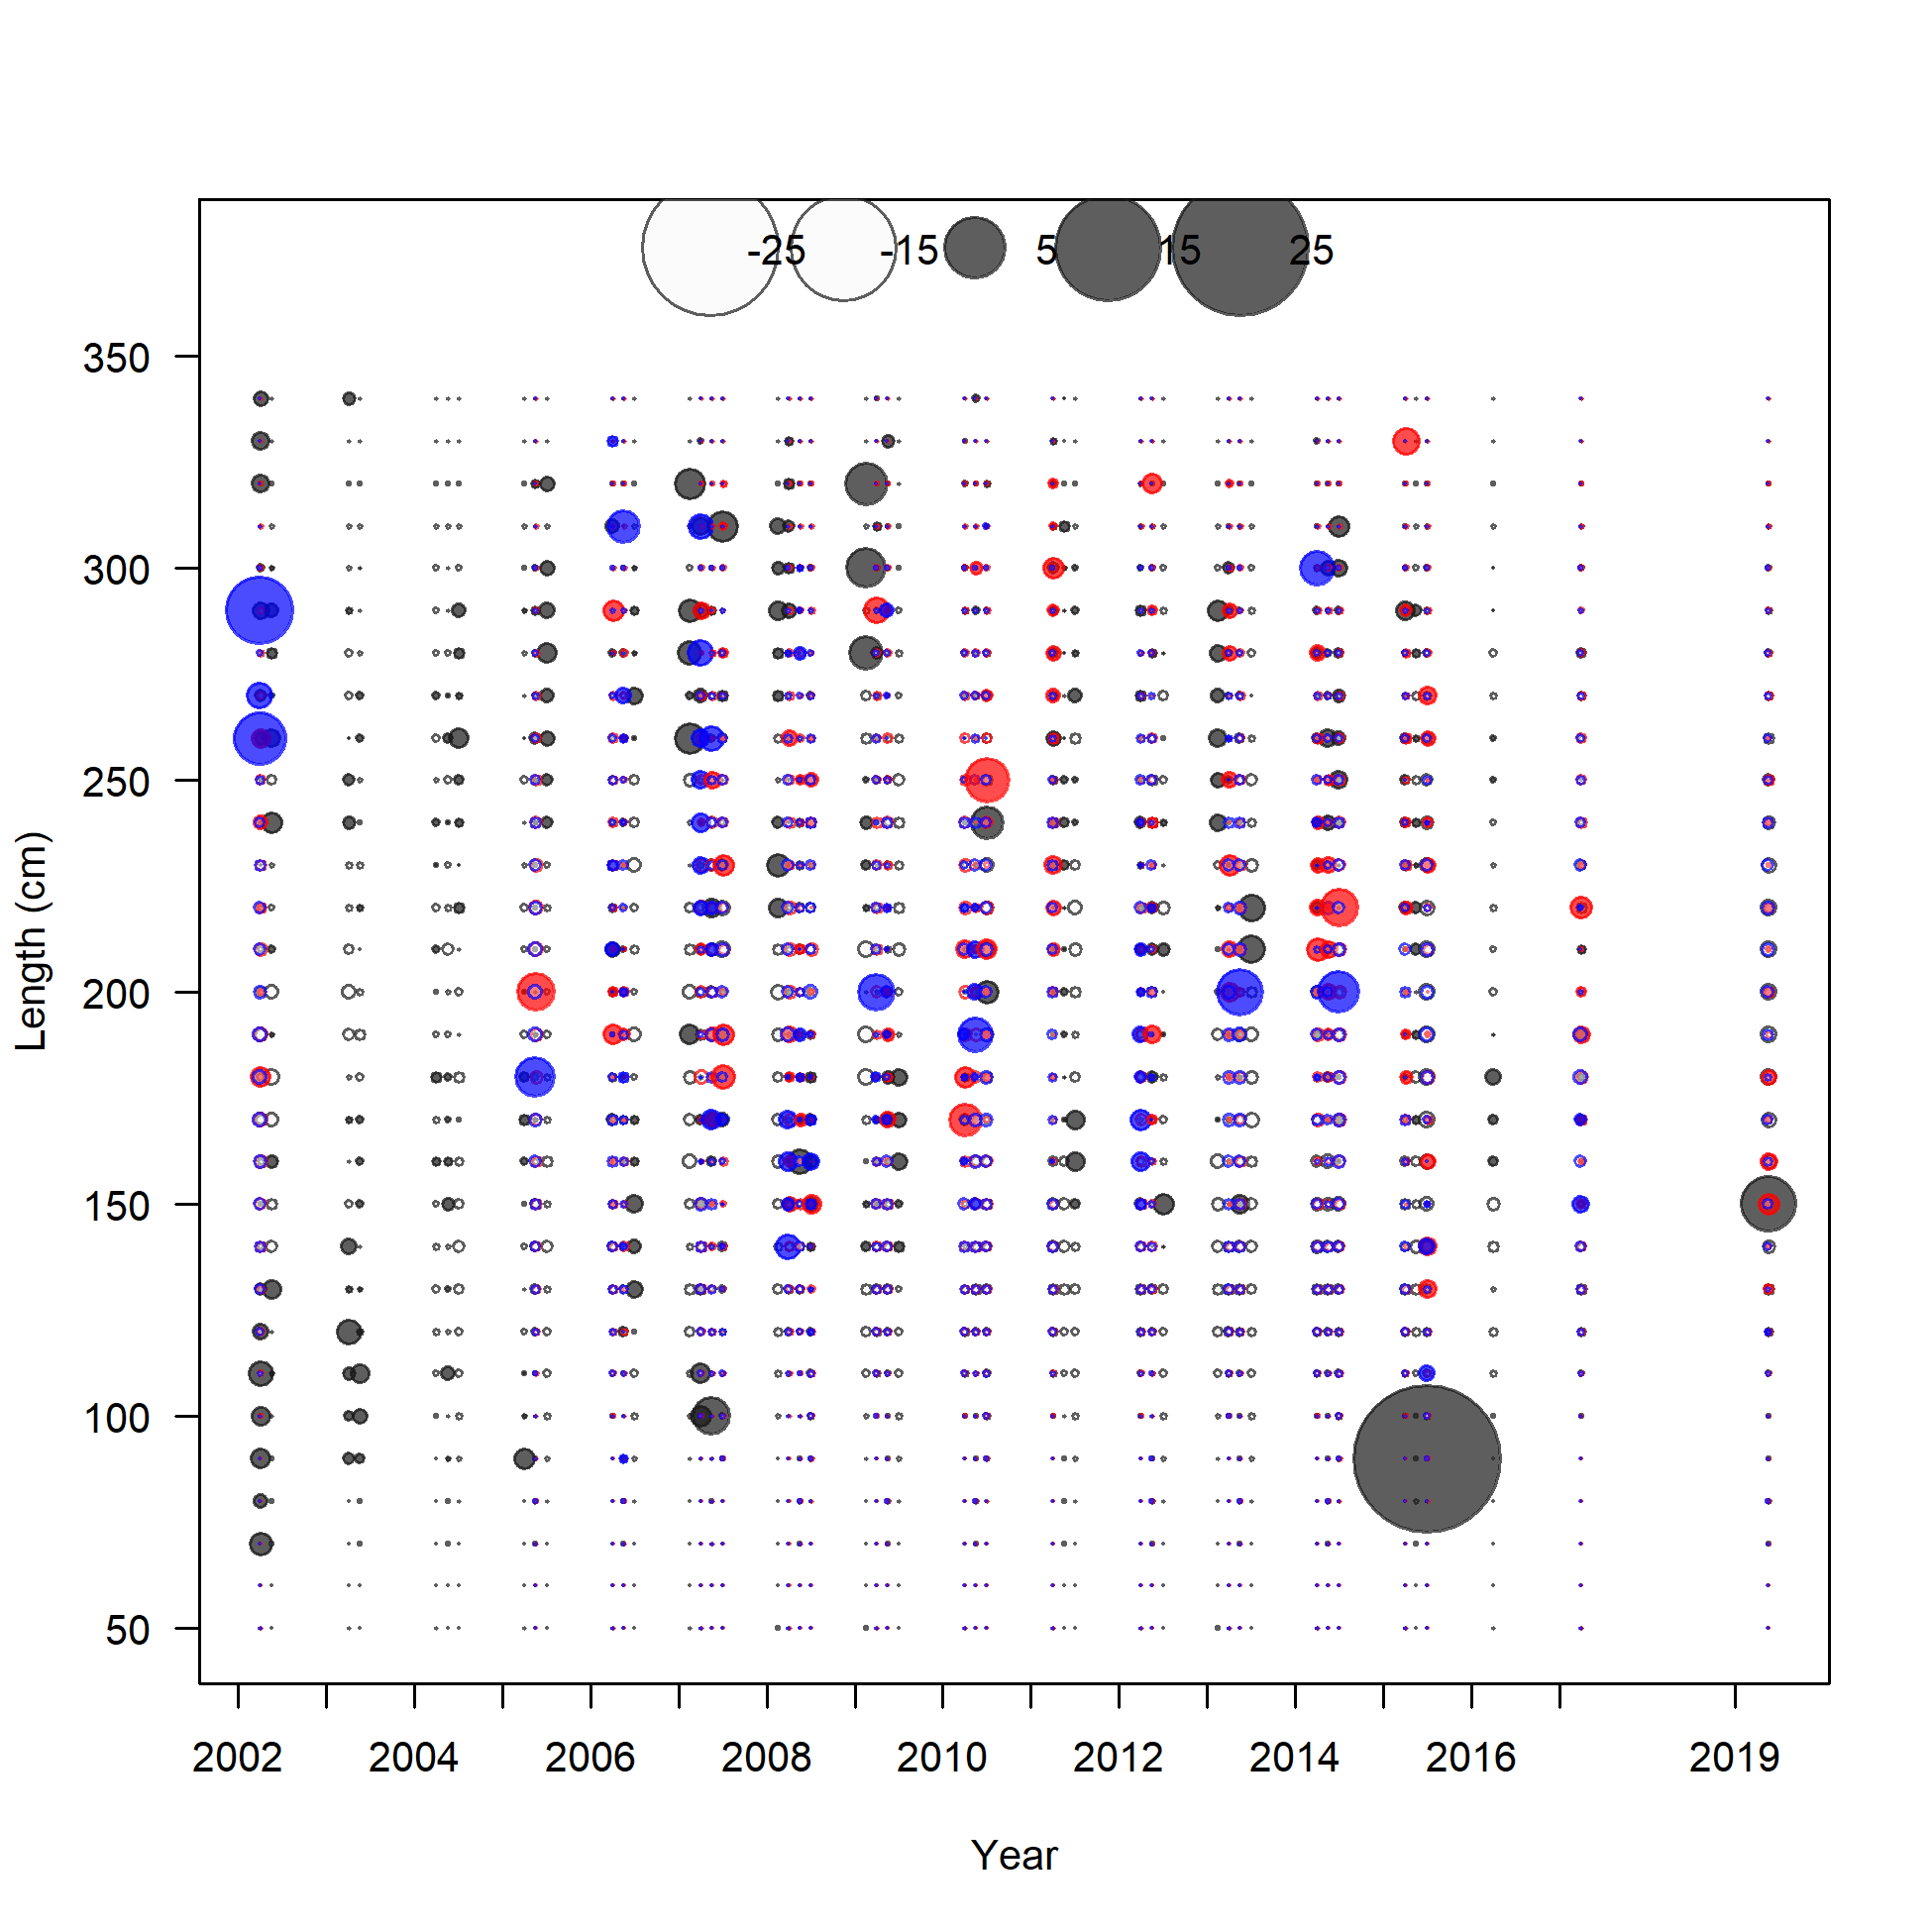
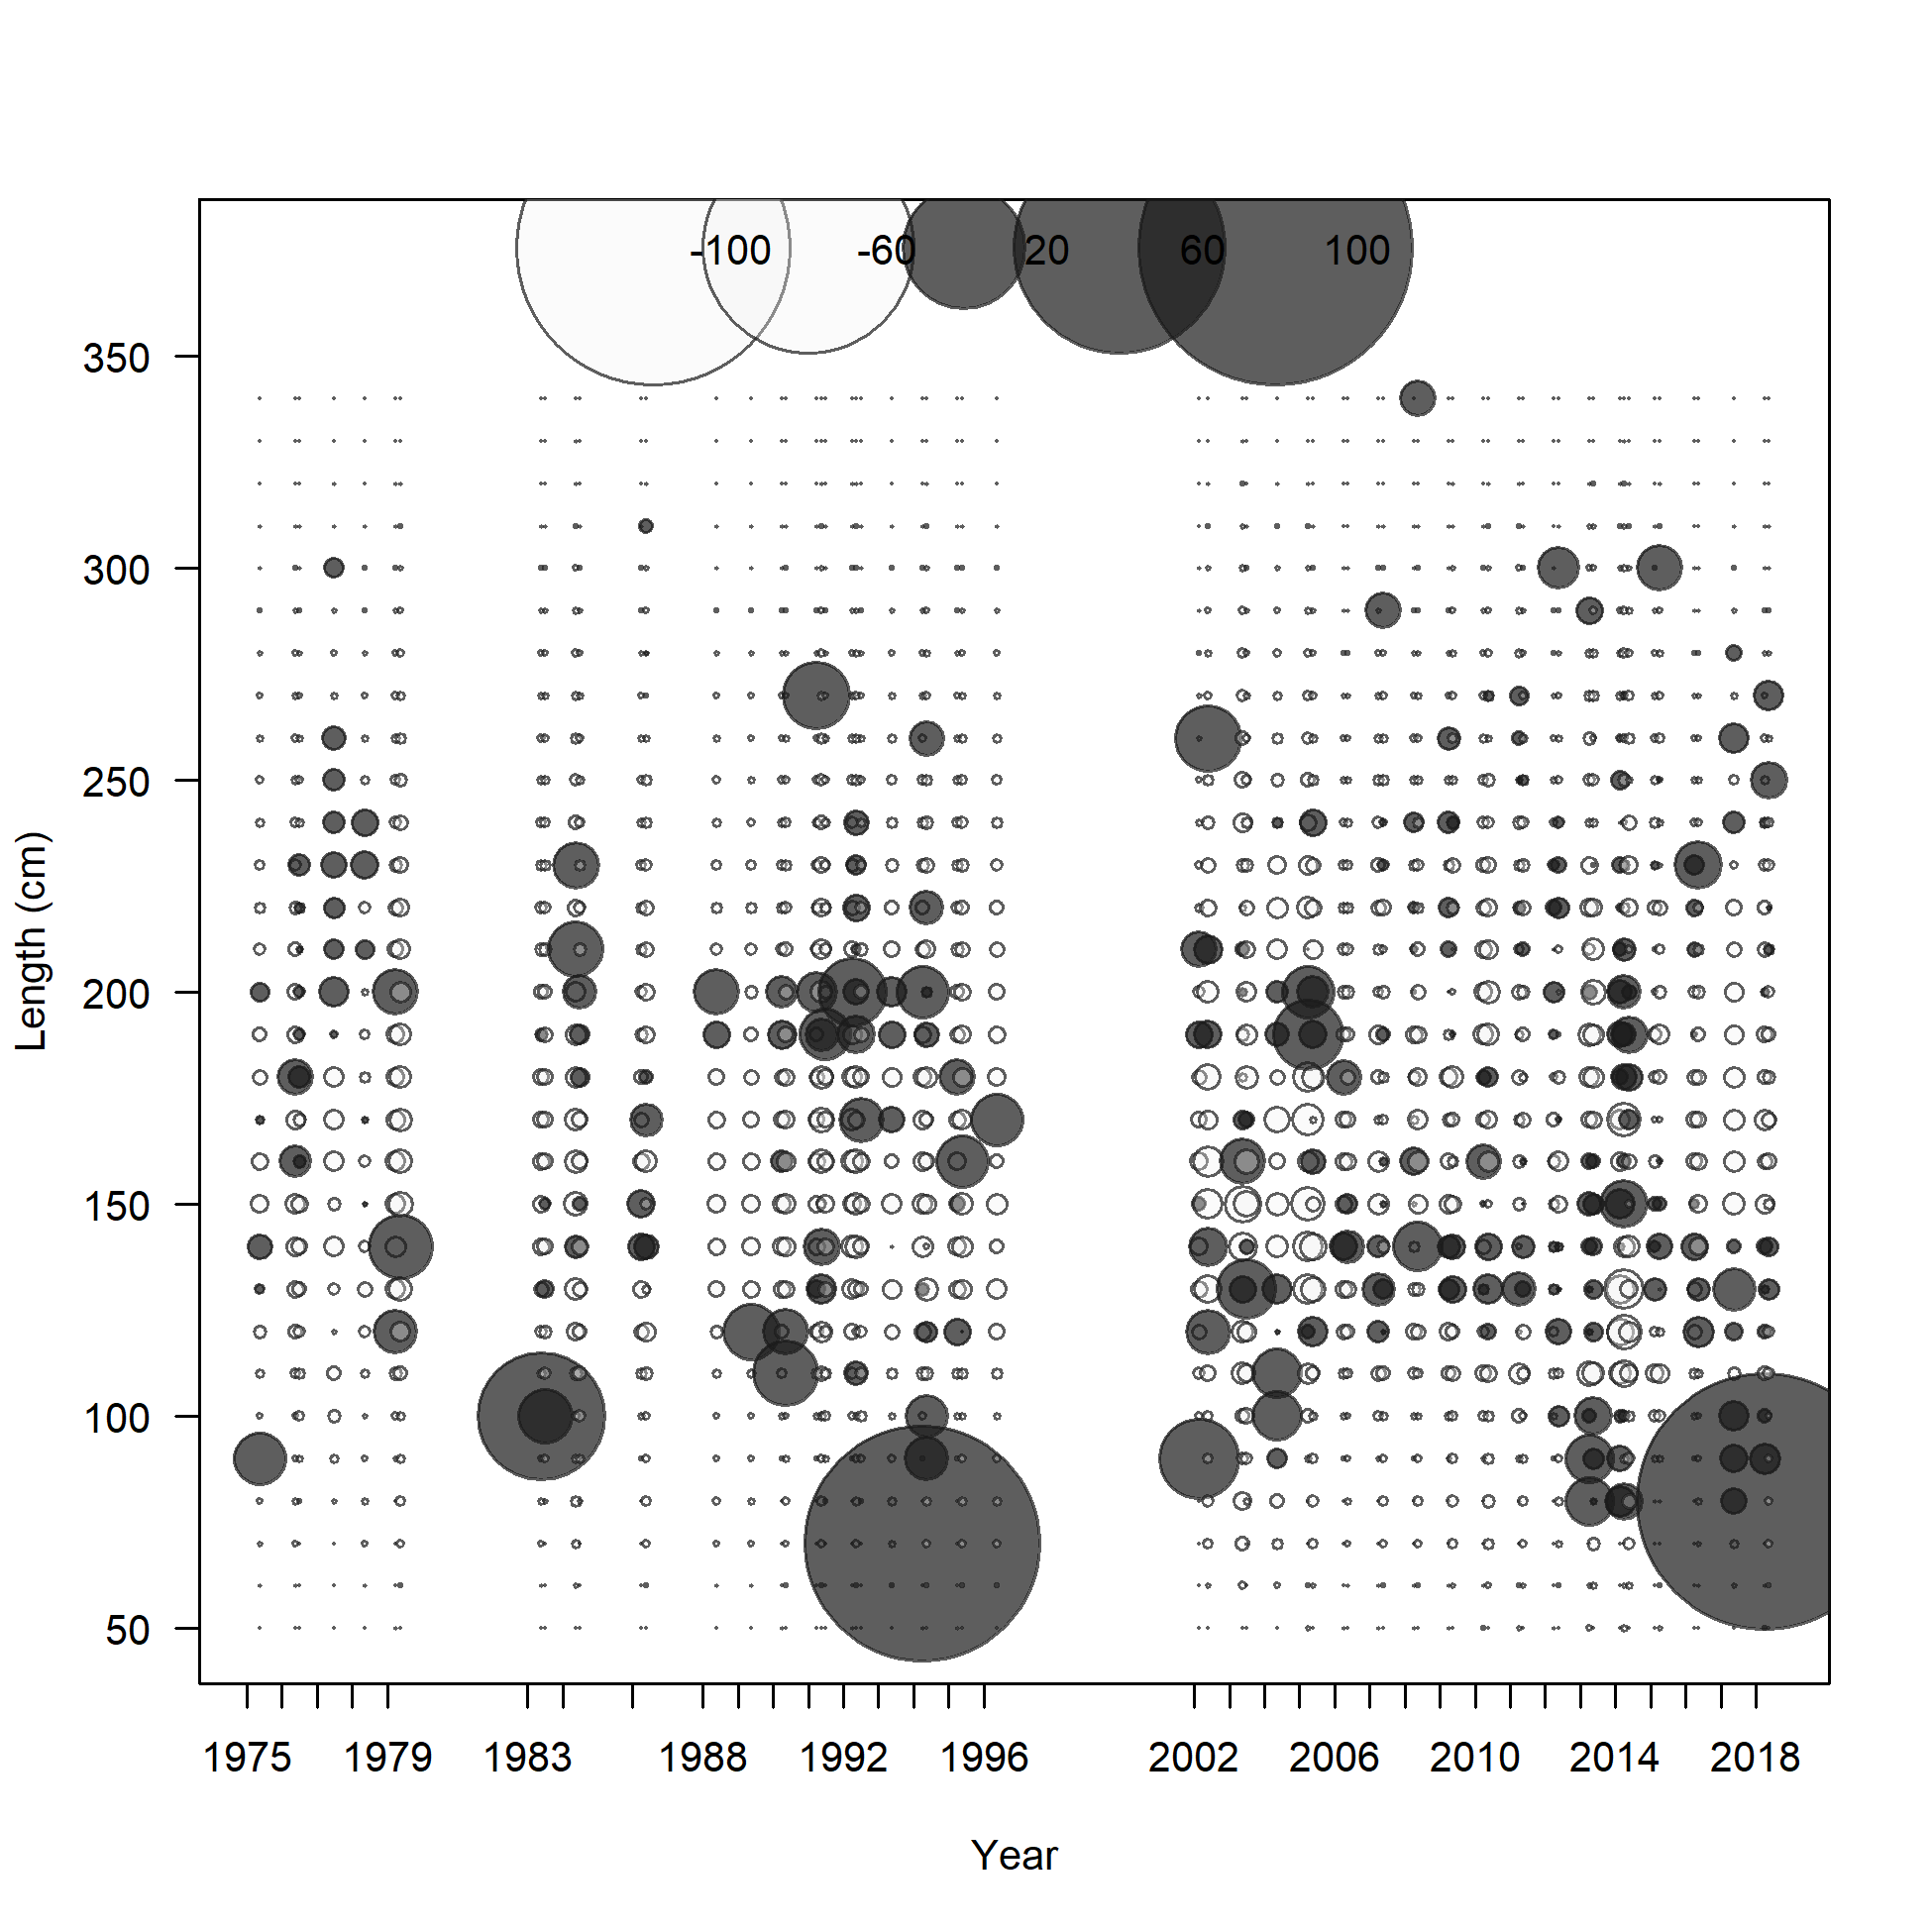
Pearson residuals, whole catch, JPN+Like (max=129.69) (plot 6 of 6)
Closed bubbles are positive residuals (observed > expected) and open bubbles are negative residuals (observed < expected).
file: comp_lenfit_residsflt3mkt0_page6.png
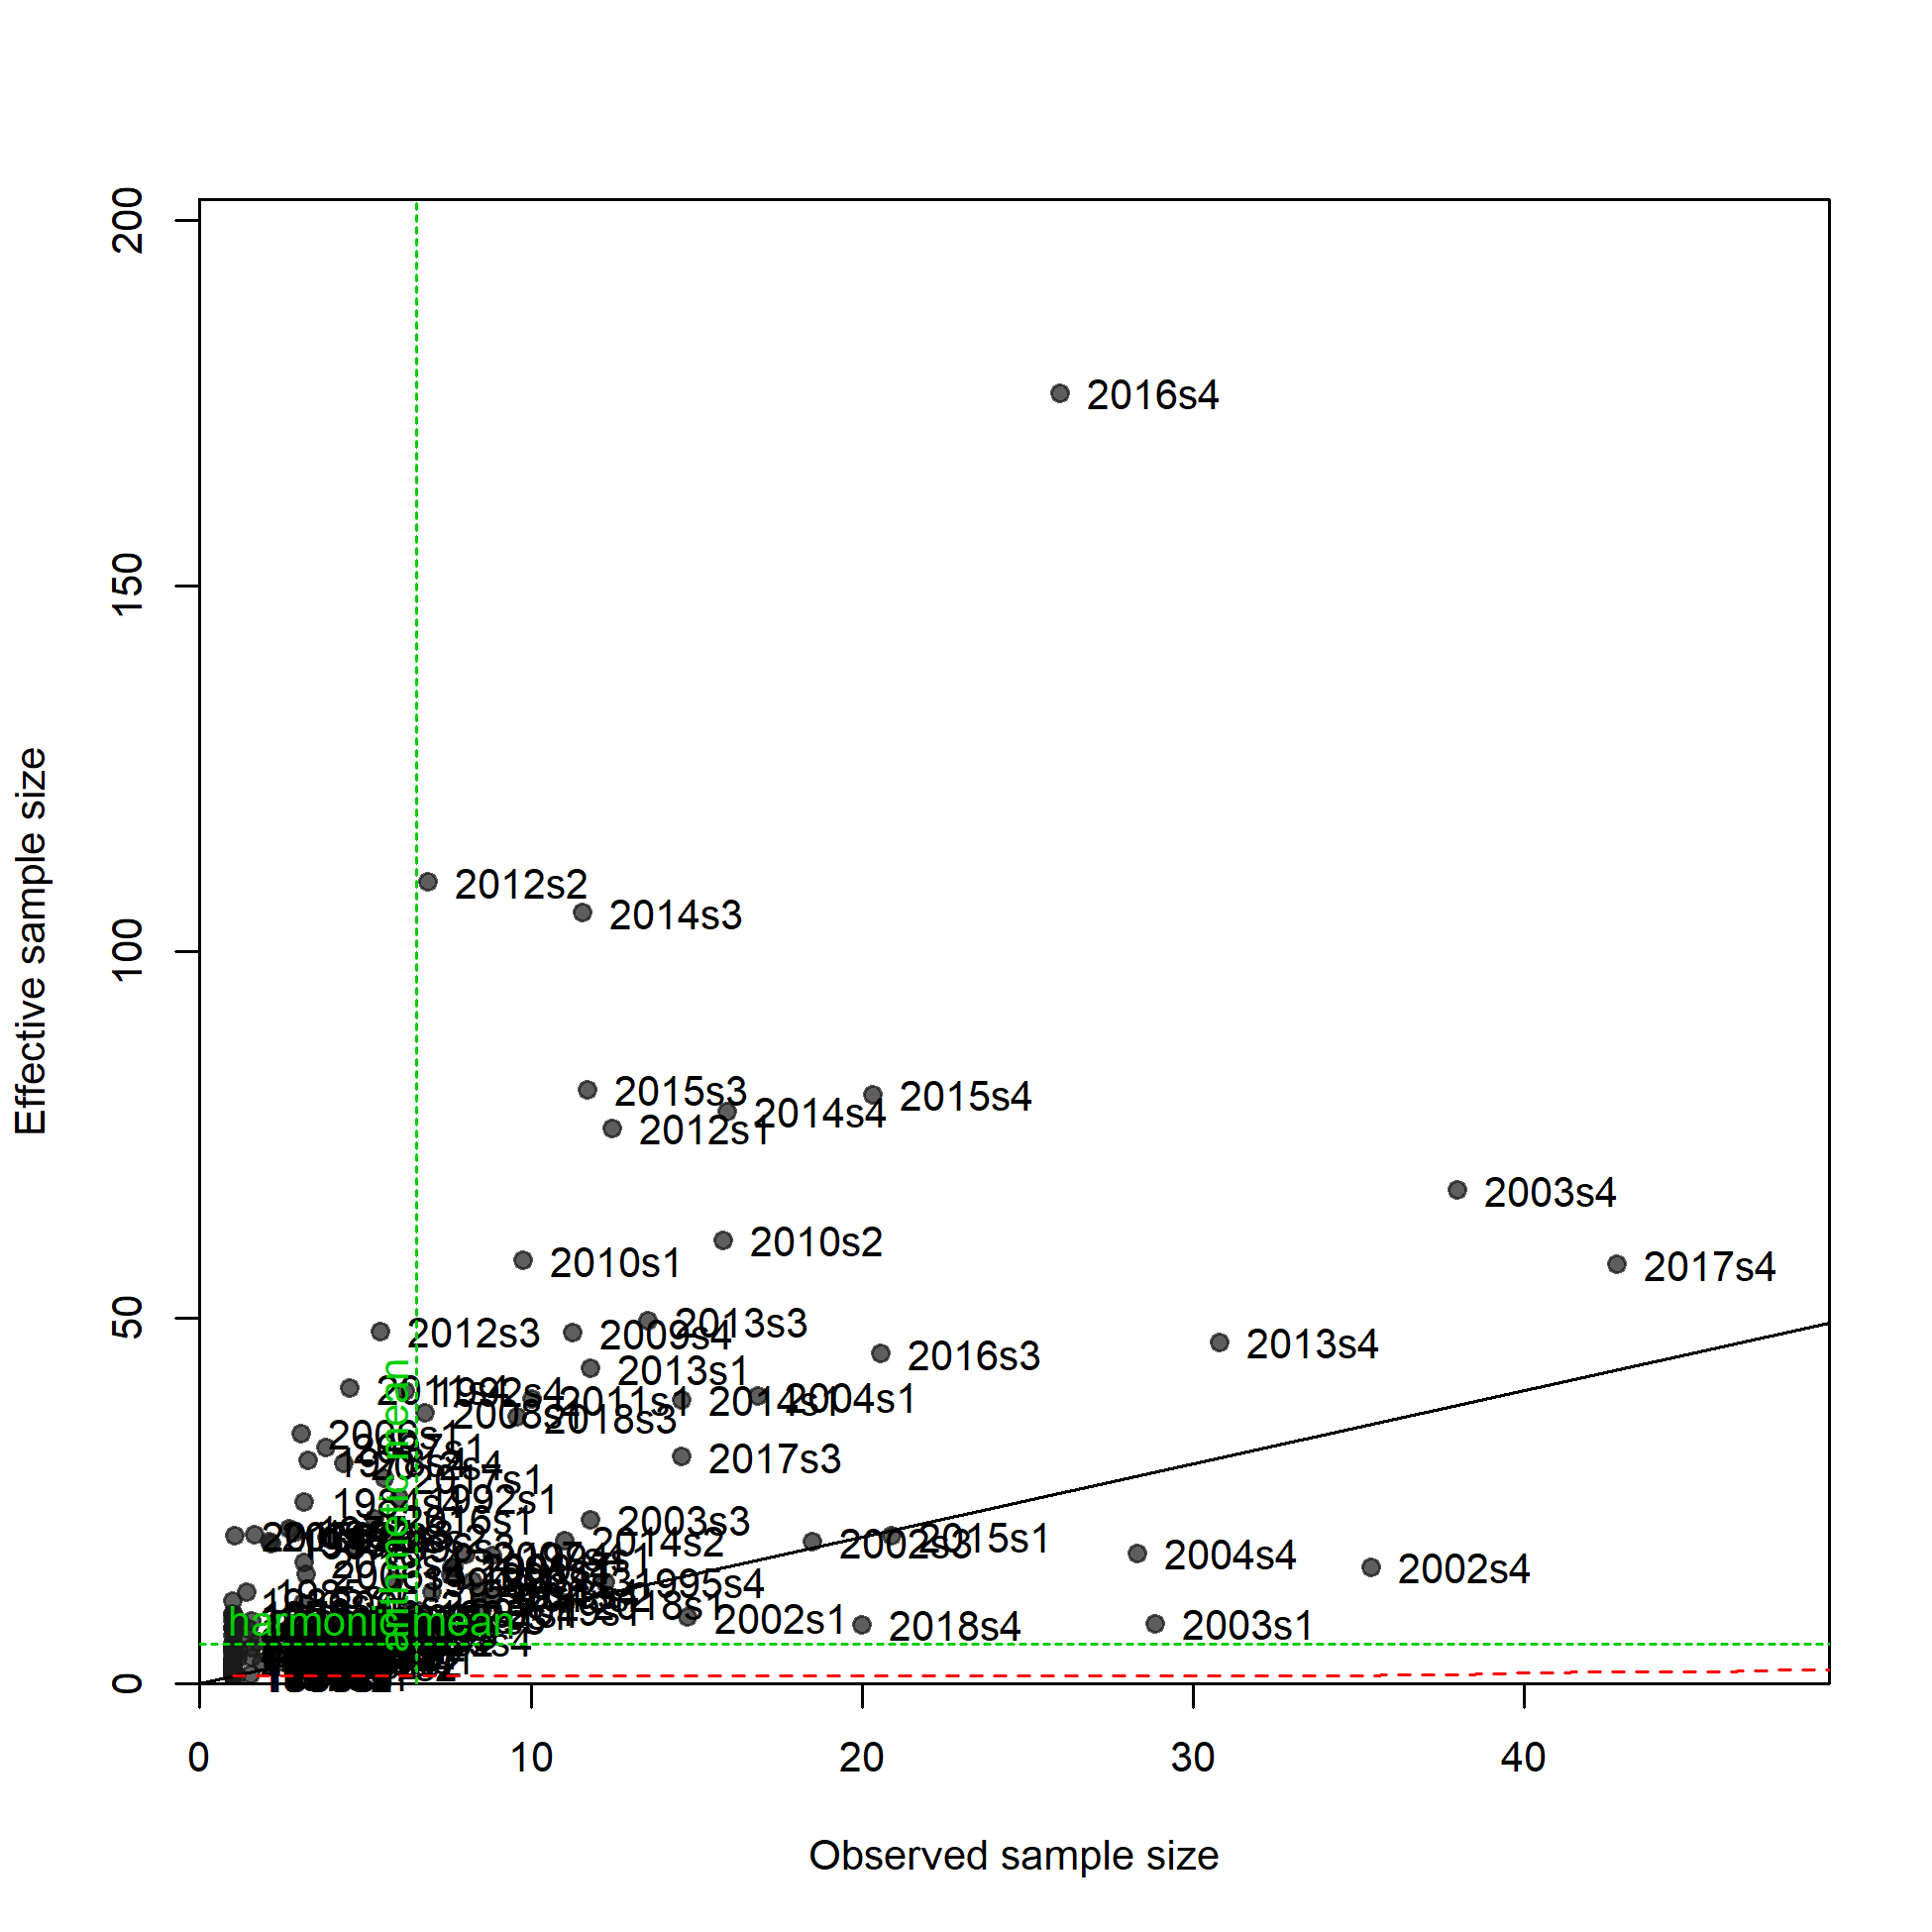
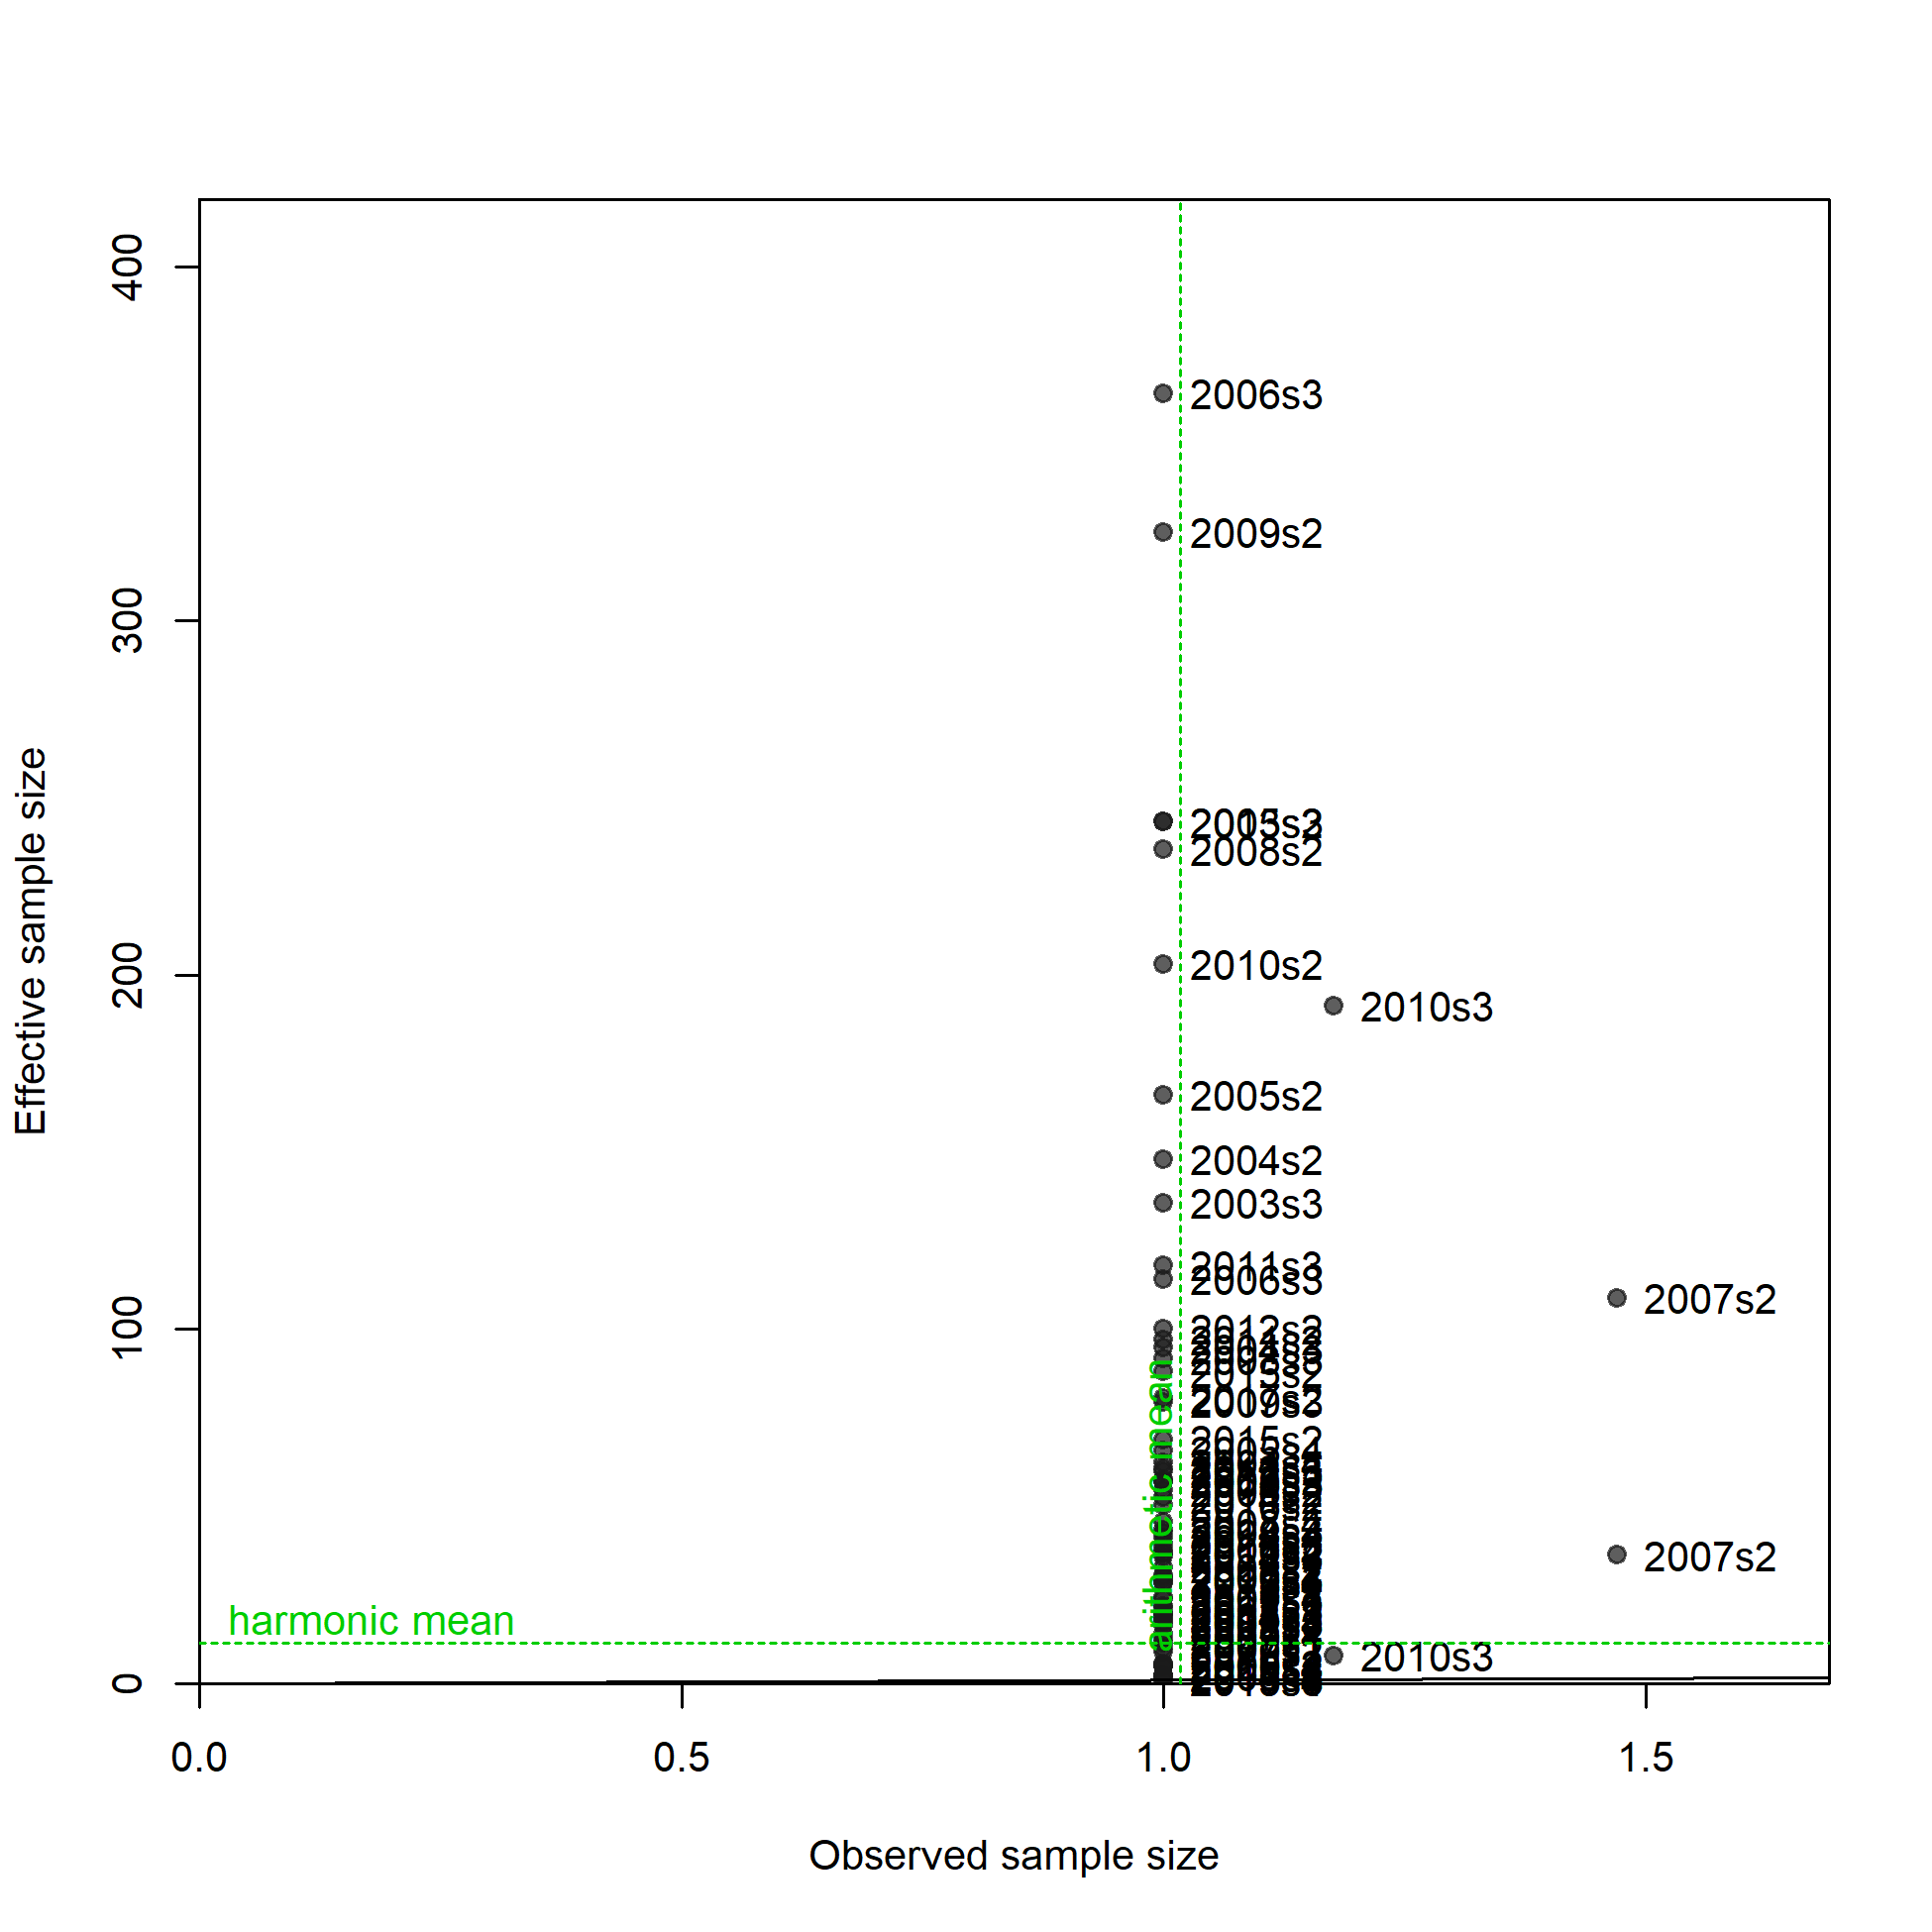
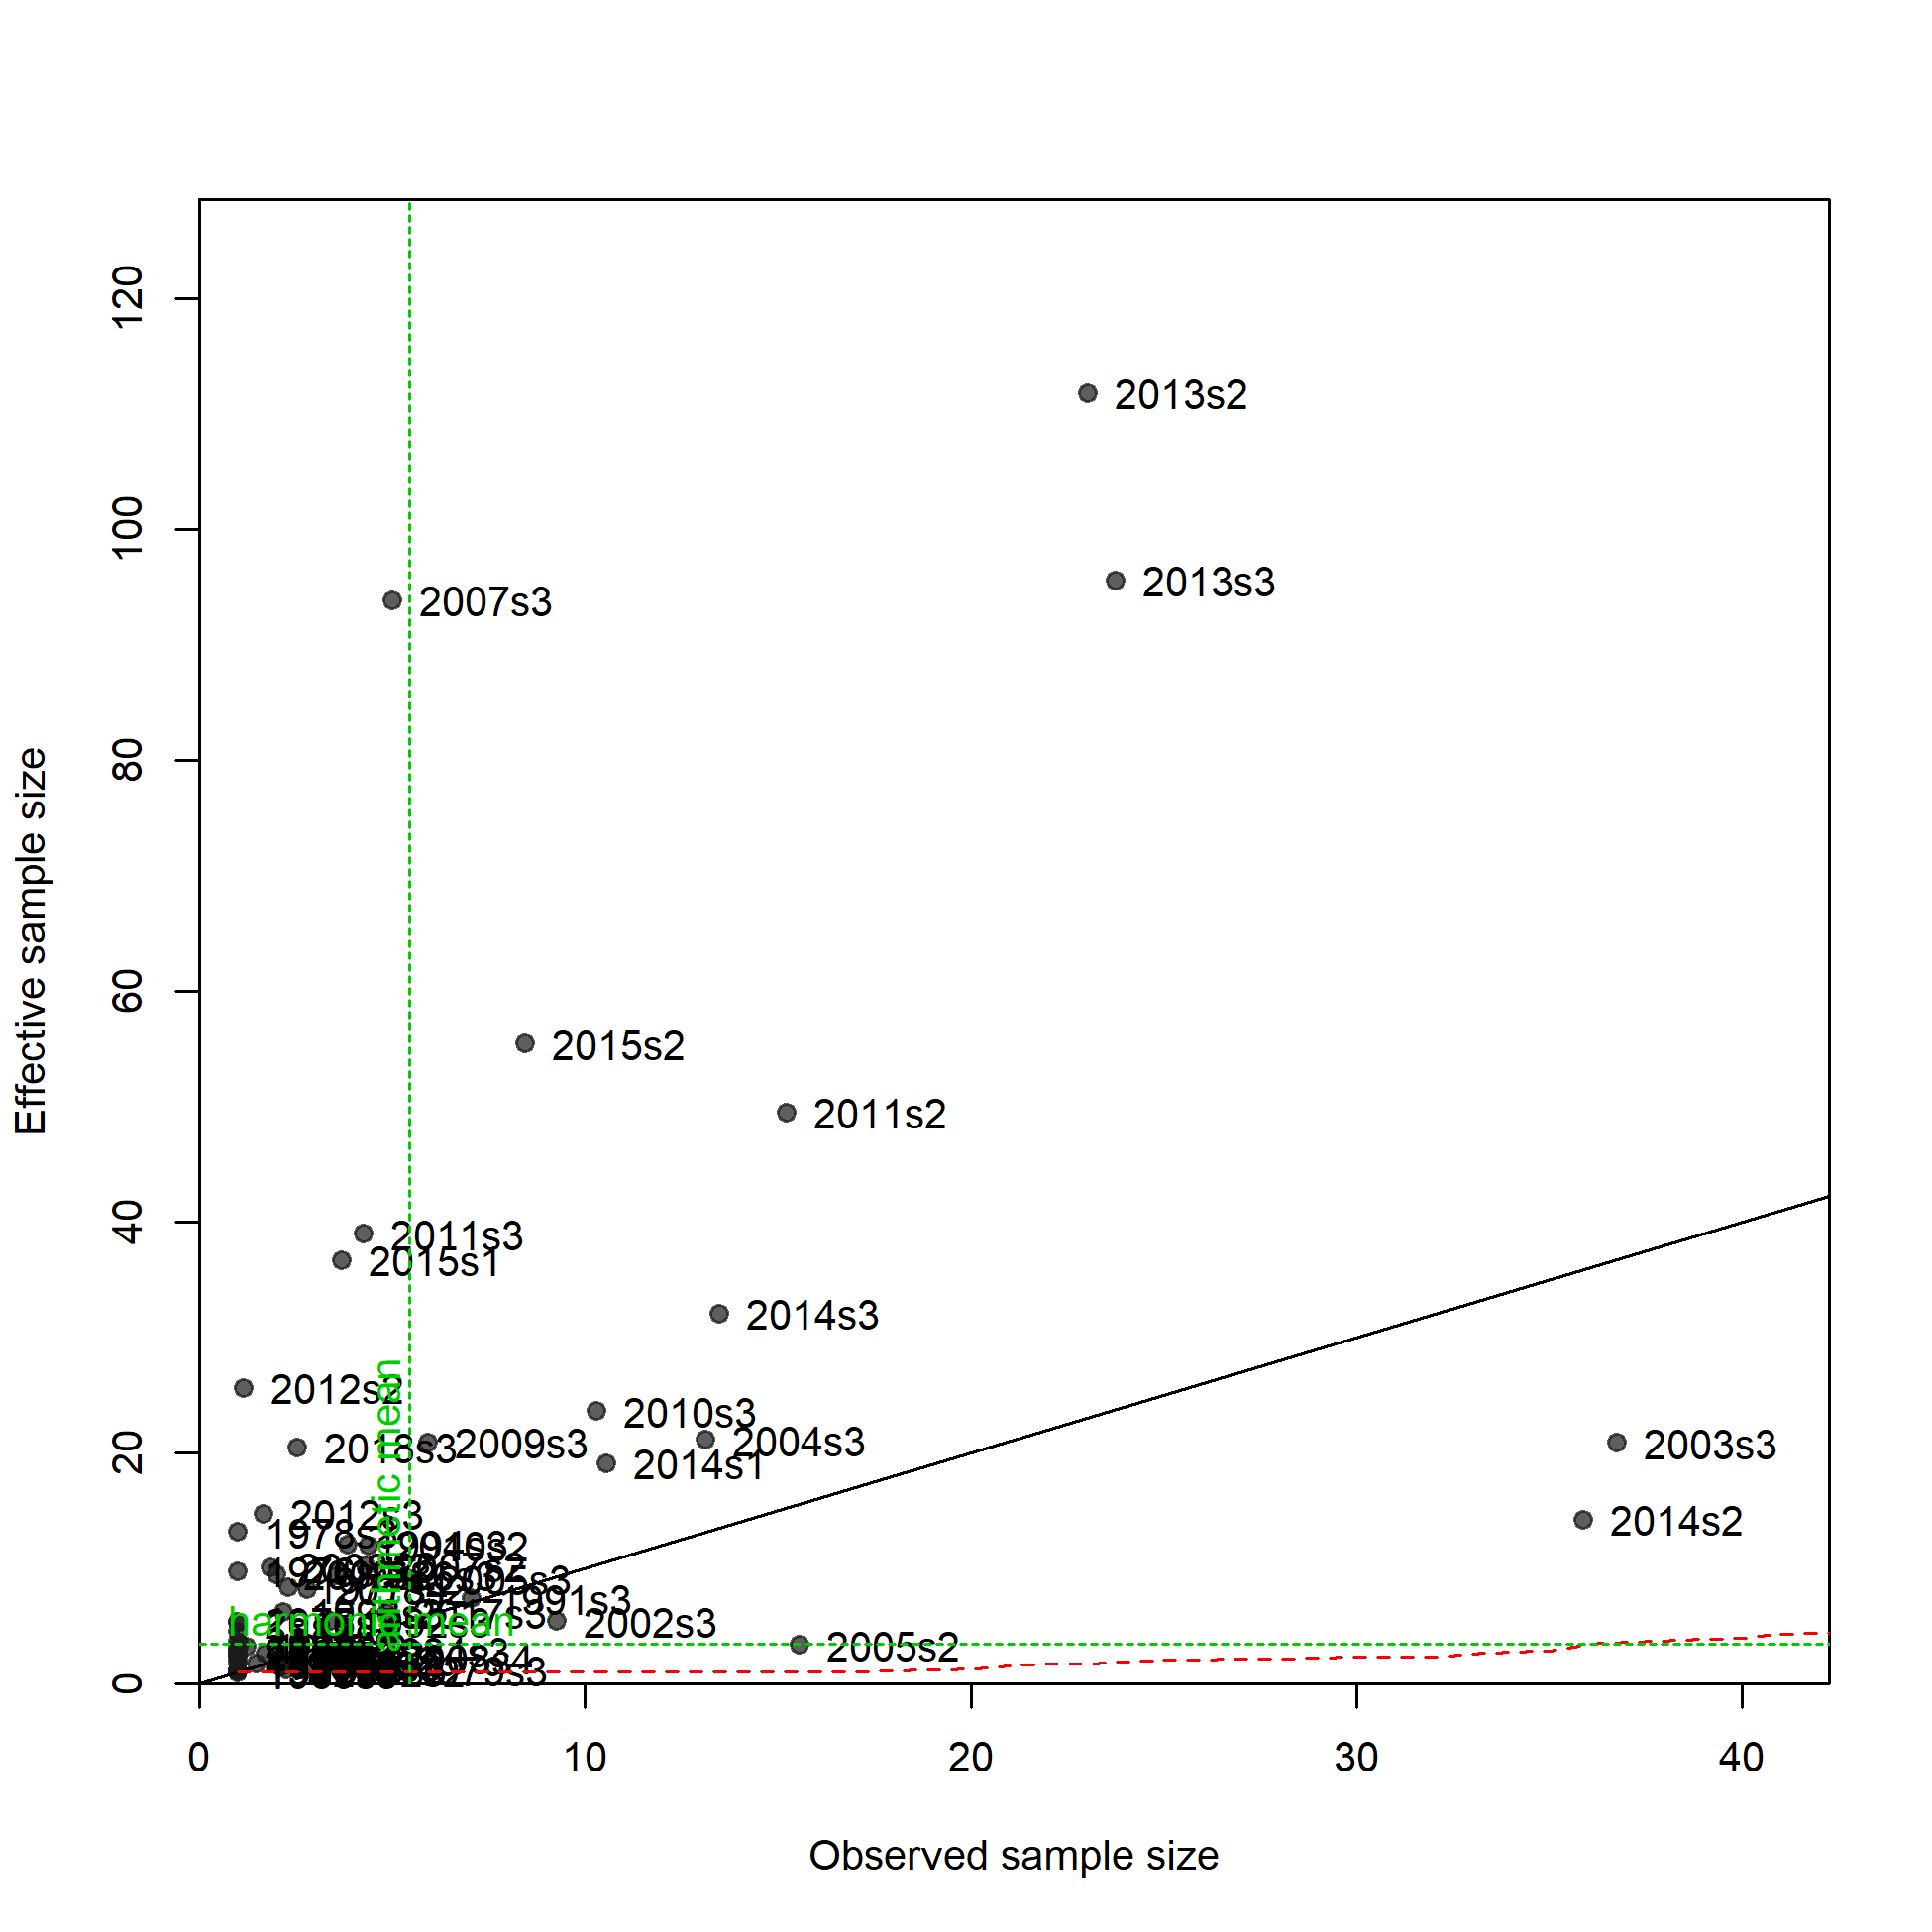
N-EffN comparison, Length comps, whole catch, JPN+Like
file: comp_lenfit_sampsize_flt3mkt0.png

Mean length for JPN+Like with 95% confidence intervals based on current samples sizes.
Francis data weighting method TA1.8: thinner intervals (with capped ends) show result of further adjusting sample sizes based on suggested multiplier (with 95% interval) for len data from JPN+Like:
1.2491 (0.7778-3.0549)
For more info, see
Francis, R.I.C.C. (2011). Data weighting in statistical fisheries stock assessment models. Can. J. Fish. Aquat. Sci. 68: 1124-1138. https://doi.org/10.1139/f2011-025
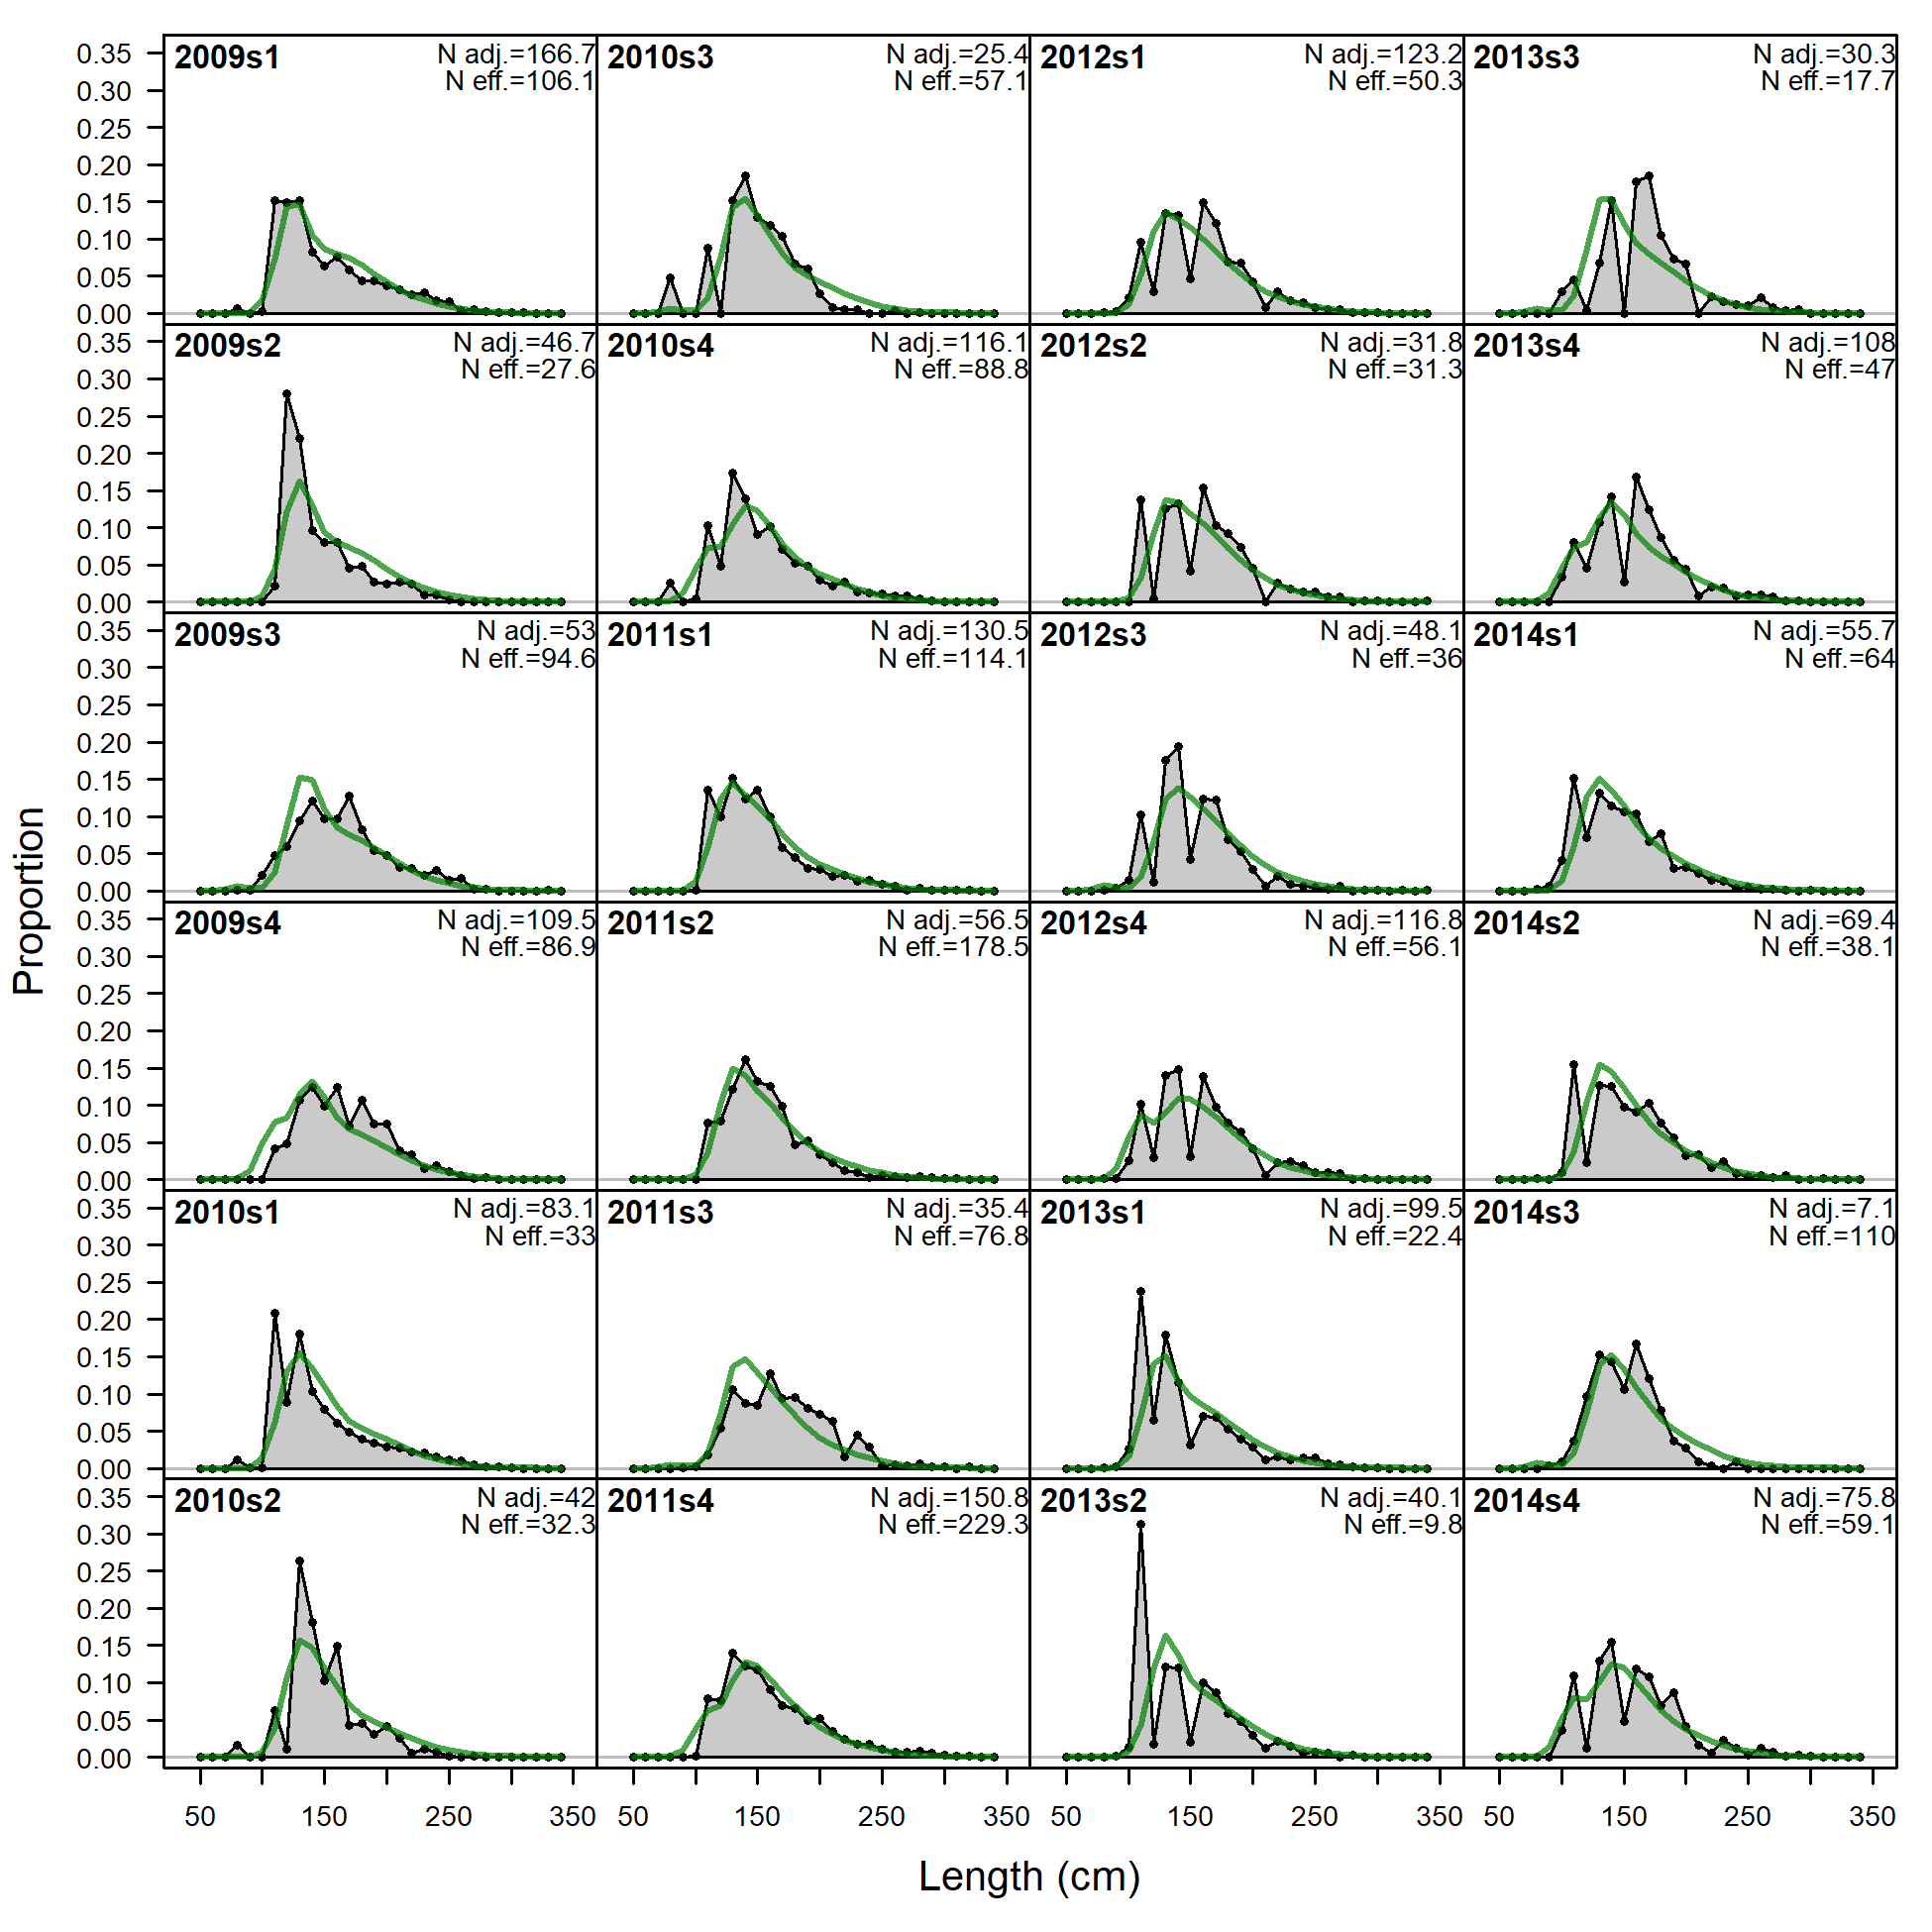
Length comps, whole catch, JPN_Coast (plot 1 of 3).
'N adj.' is the input sample size after data-weighting adjustment. N eff. is the calculated effective sample size used in the McAllister-Ianelli tuning method.
file: comp_lenfit_flt4mkt0_page1.png
Length comps, whole catch, JPN_Coast (plot 1 of 3).
'N adj.' is the input sample size after data-weighting adjustment. N eff. is the calculated effective sample size used in the McAllister-Ianelli tuning method. (plot 2 of 3)
file: comp_lenfit_flt4mkt0_page2.png

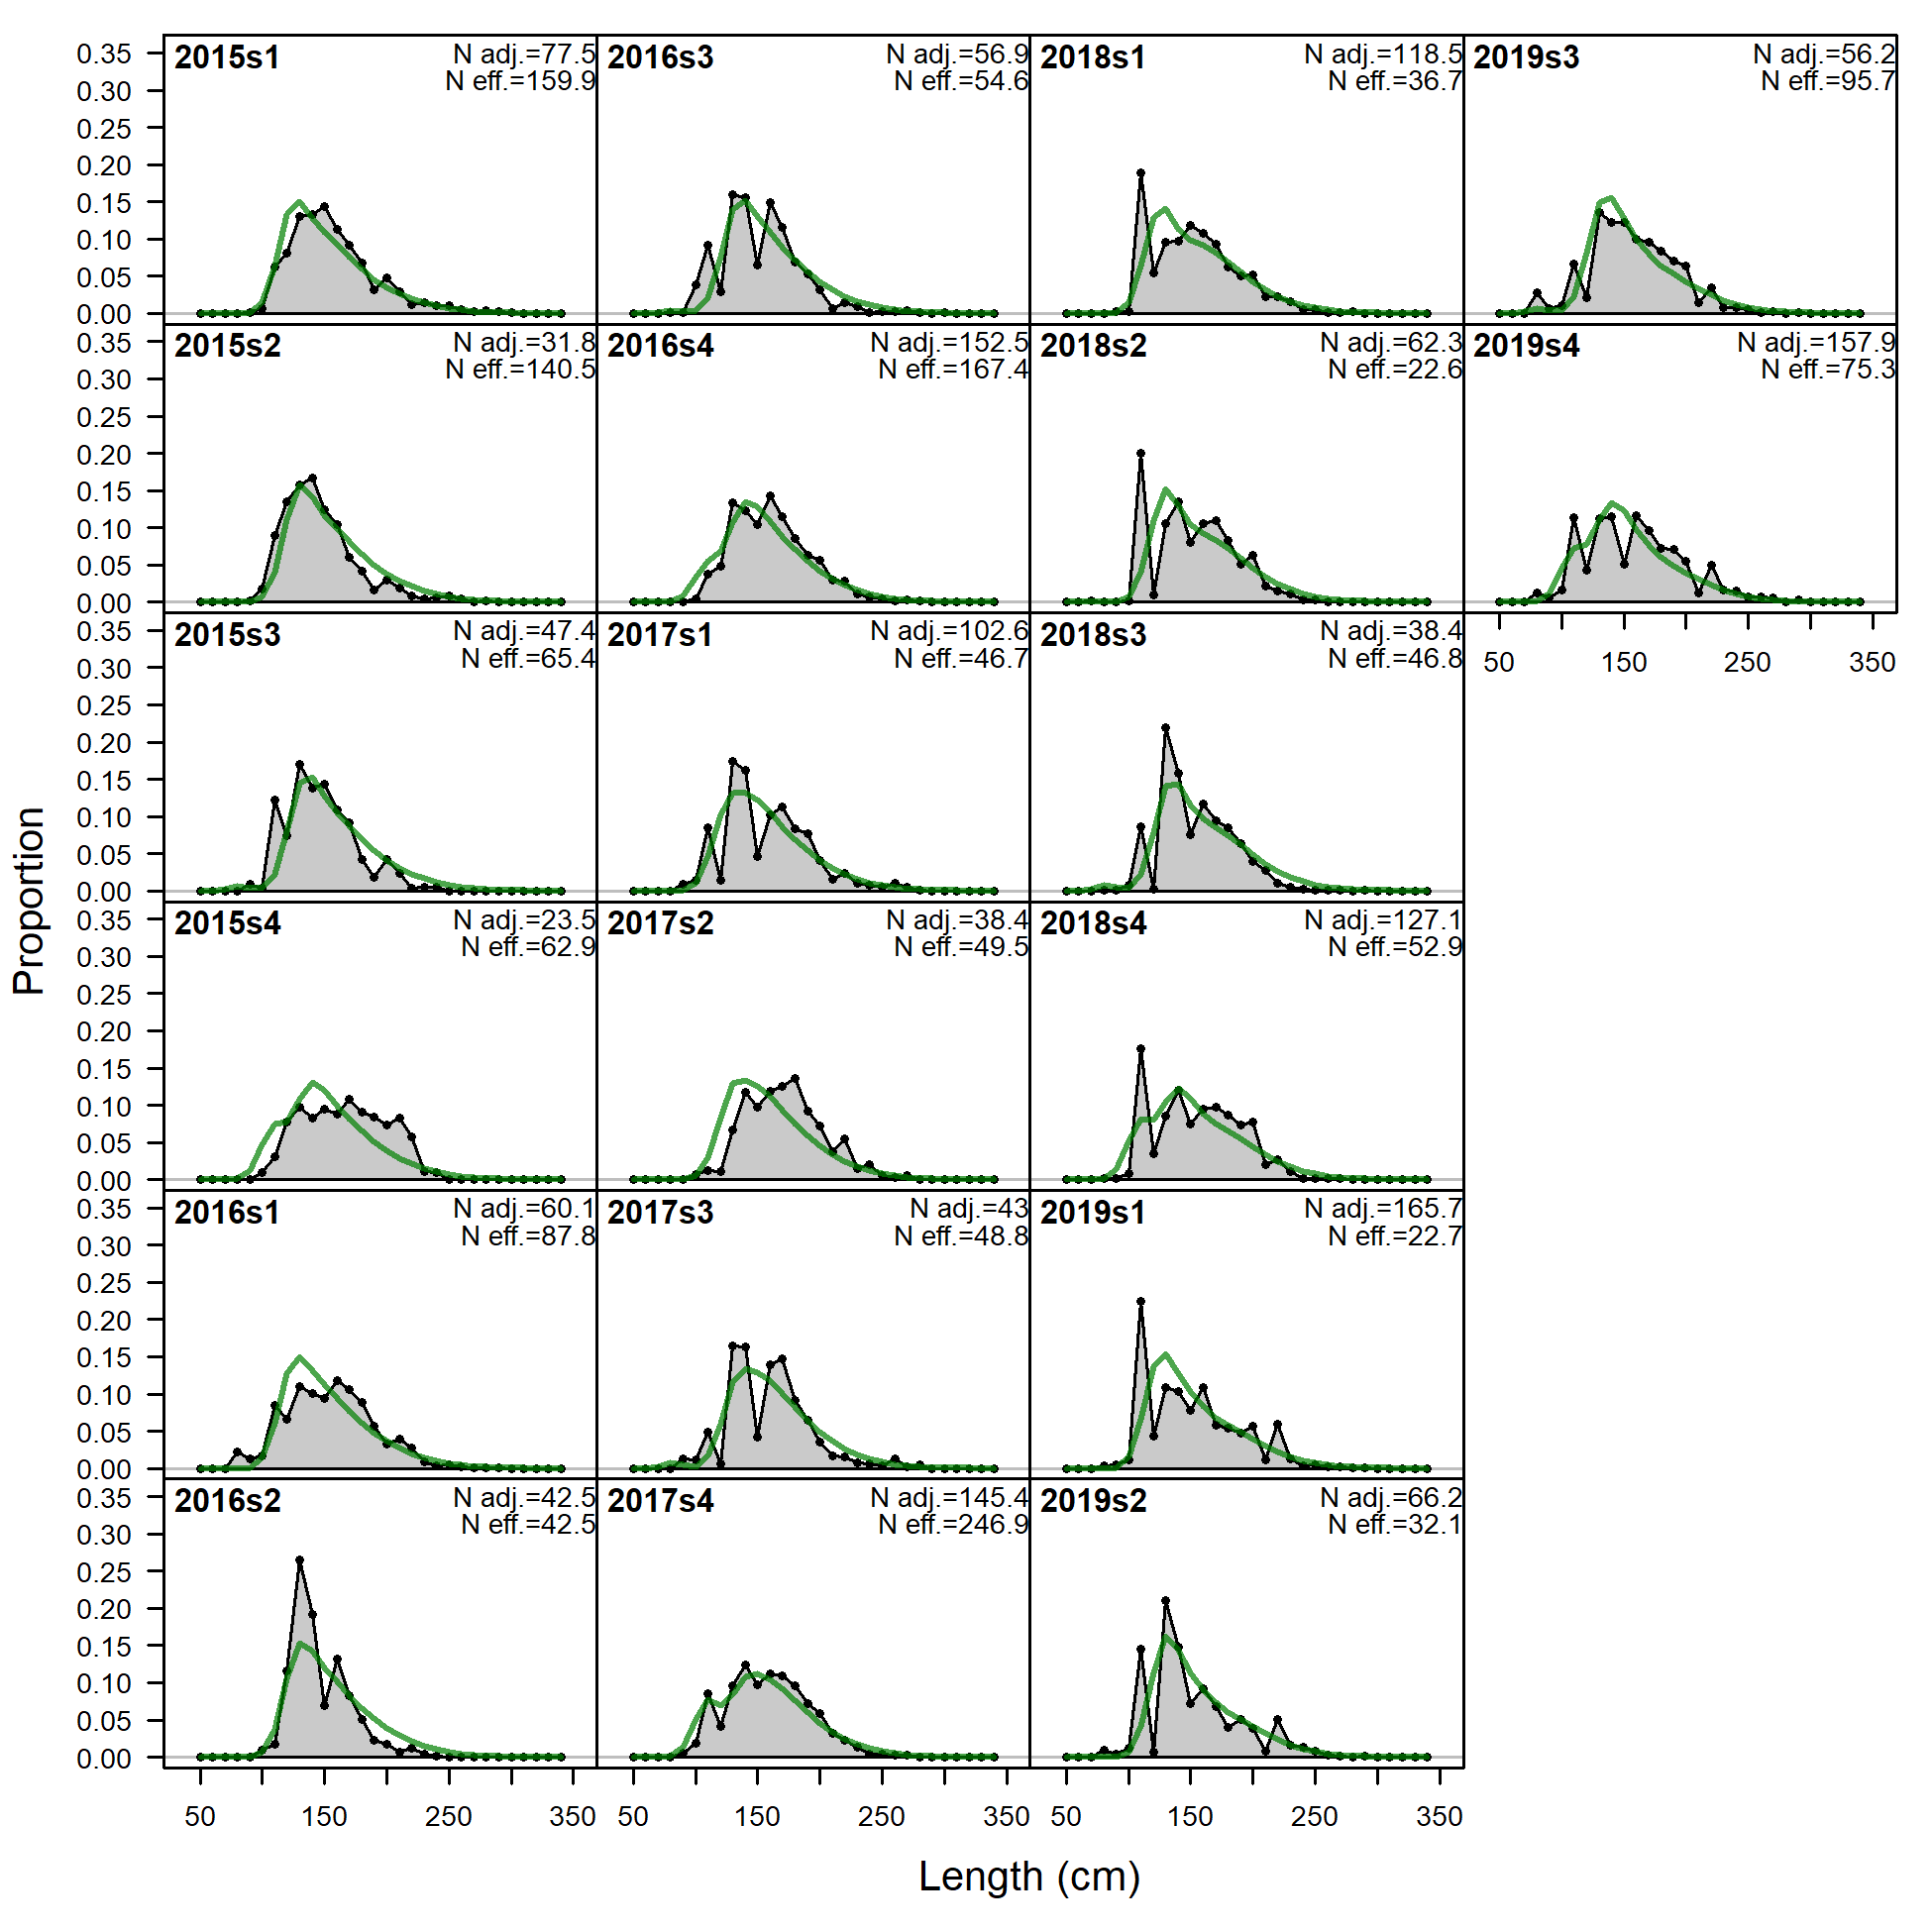
Length comps, whole catch, JPN_Coast (plot 1 of 3).
'N adj.' is the input sample size after data-weighting adjustment. N eff. is the calculated effective sample size used in the McAllister-Ianelli tuning method. (plot 2 of 3) (plot 3 of 3)
file: comp_lenfit_flt4mkt0_page3.png
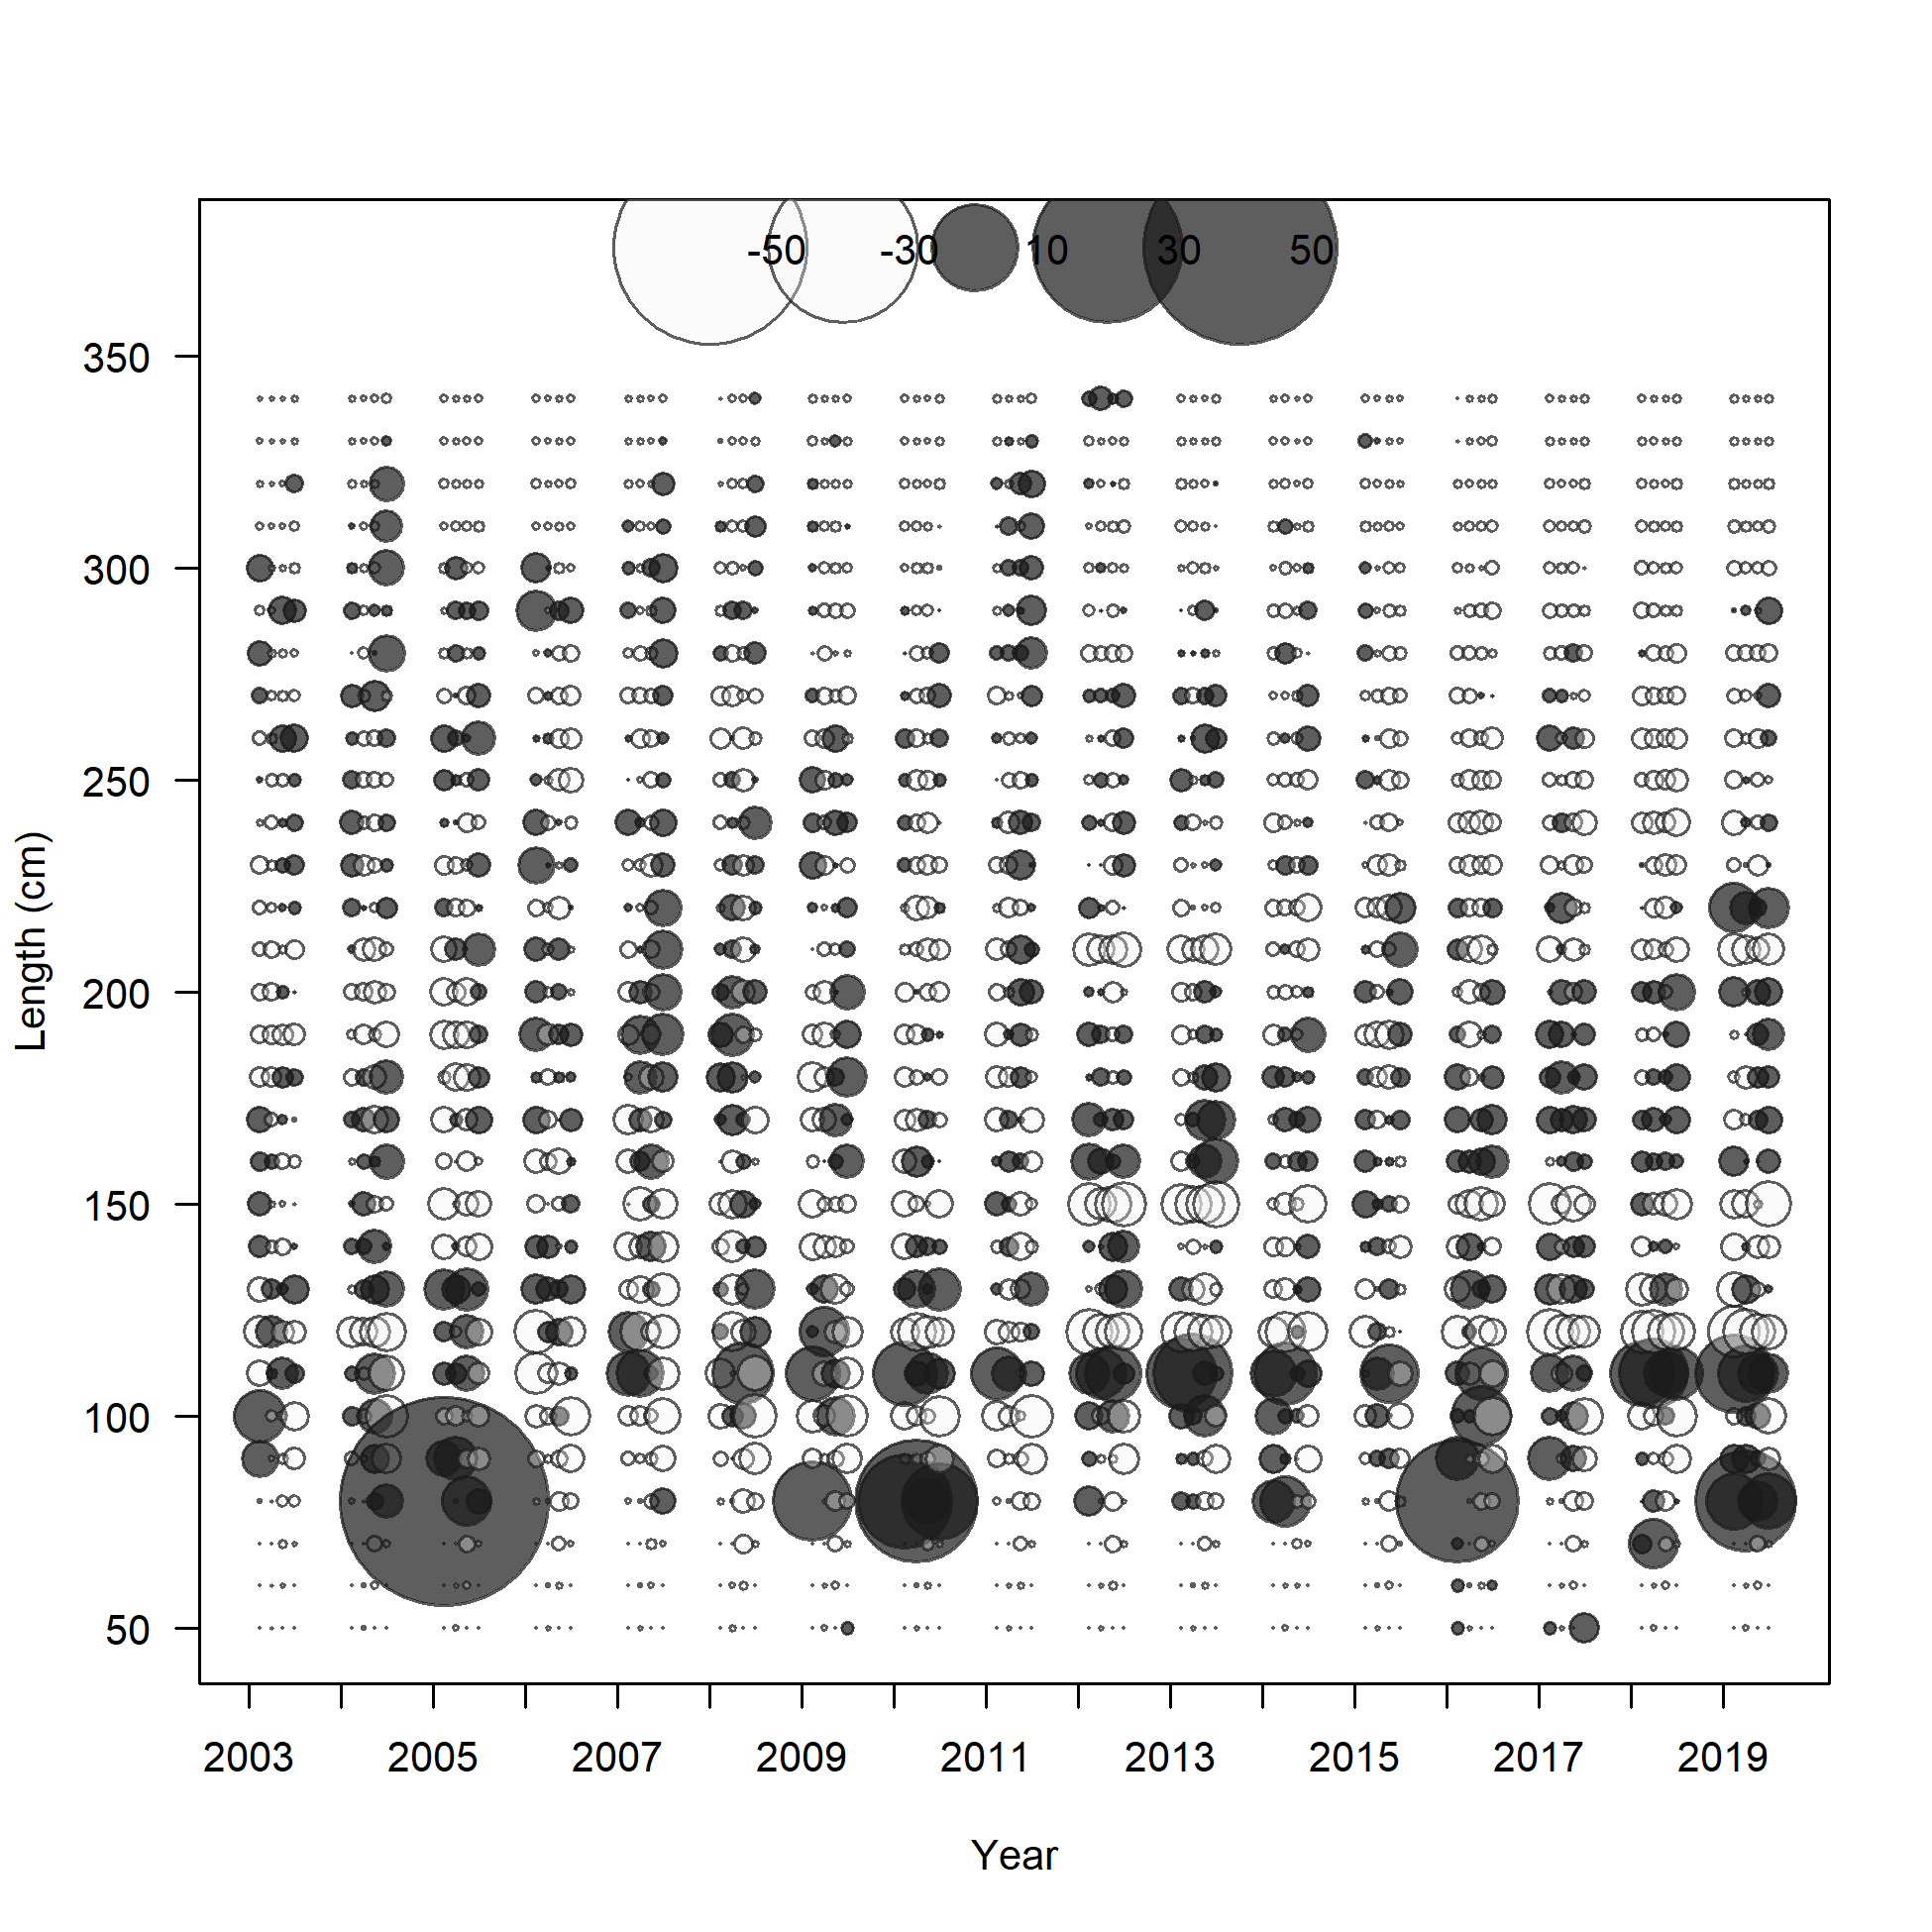
Pearson residuals, whole catch, JPN_Coast (max=87.3) (plot 3 of 3)
Closed bubbles are positive residuals (observed > expected) and open bubbles are negative residuals (observed < expected).
file: comp_lenfit_residsflt4mkt0_page3.png
N-EffN comparison, Length comps, whole catch, JPN_Coast
file: comp_lenfit_sampsize_flt4mkt0.png
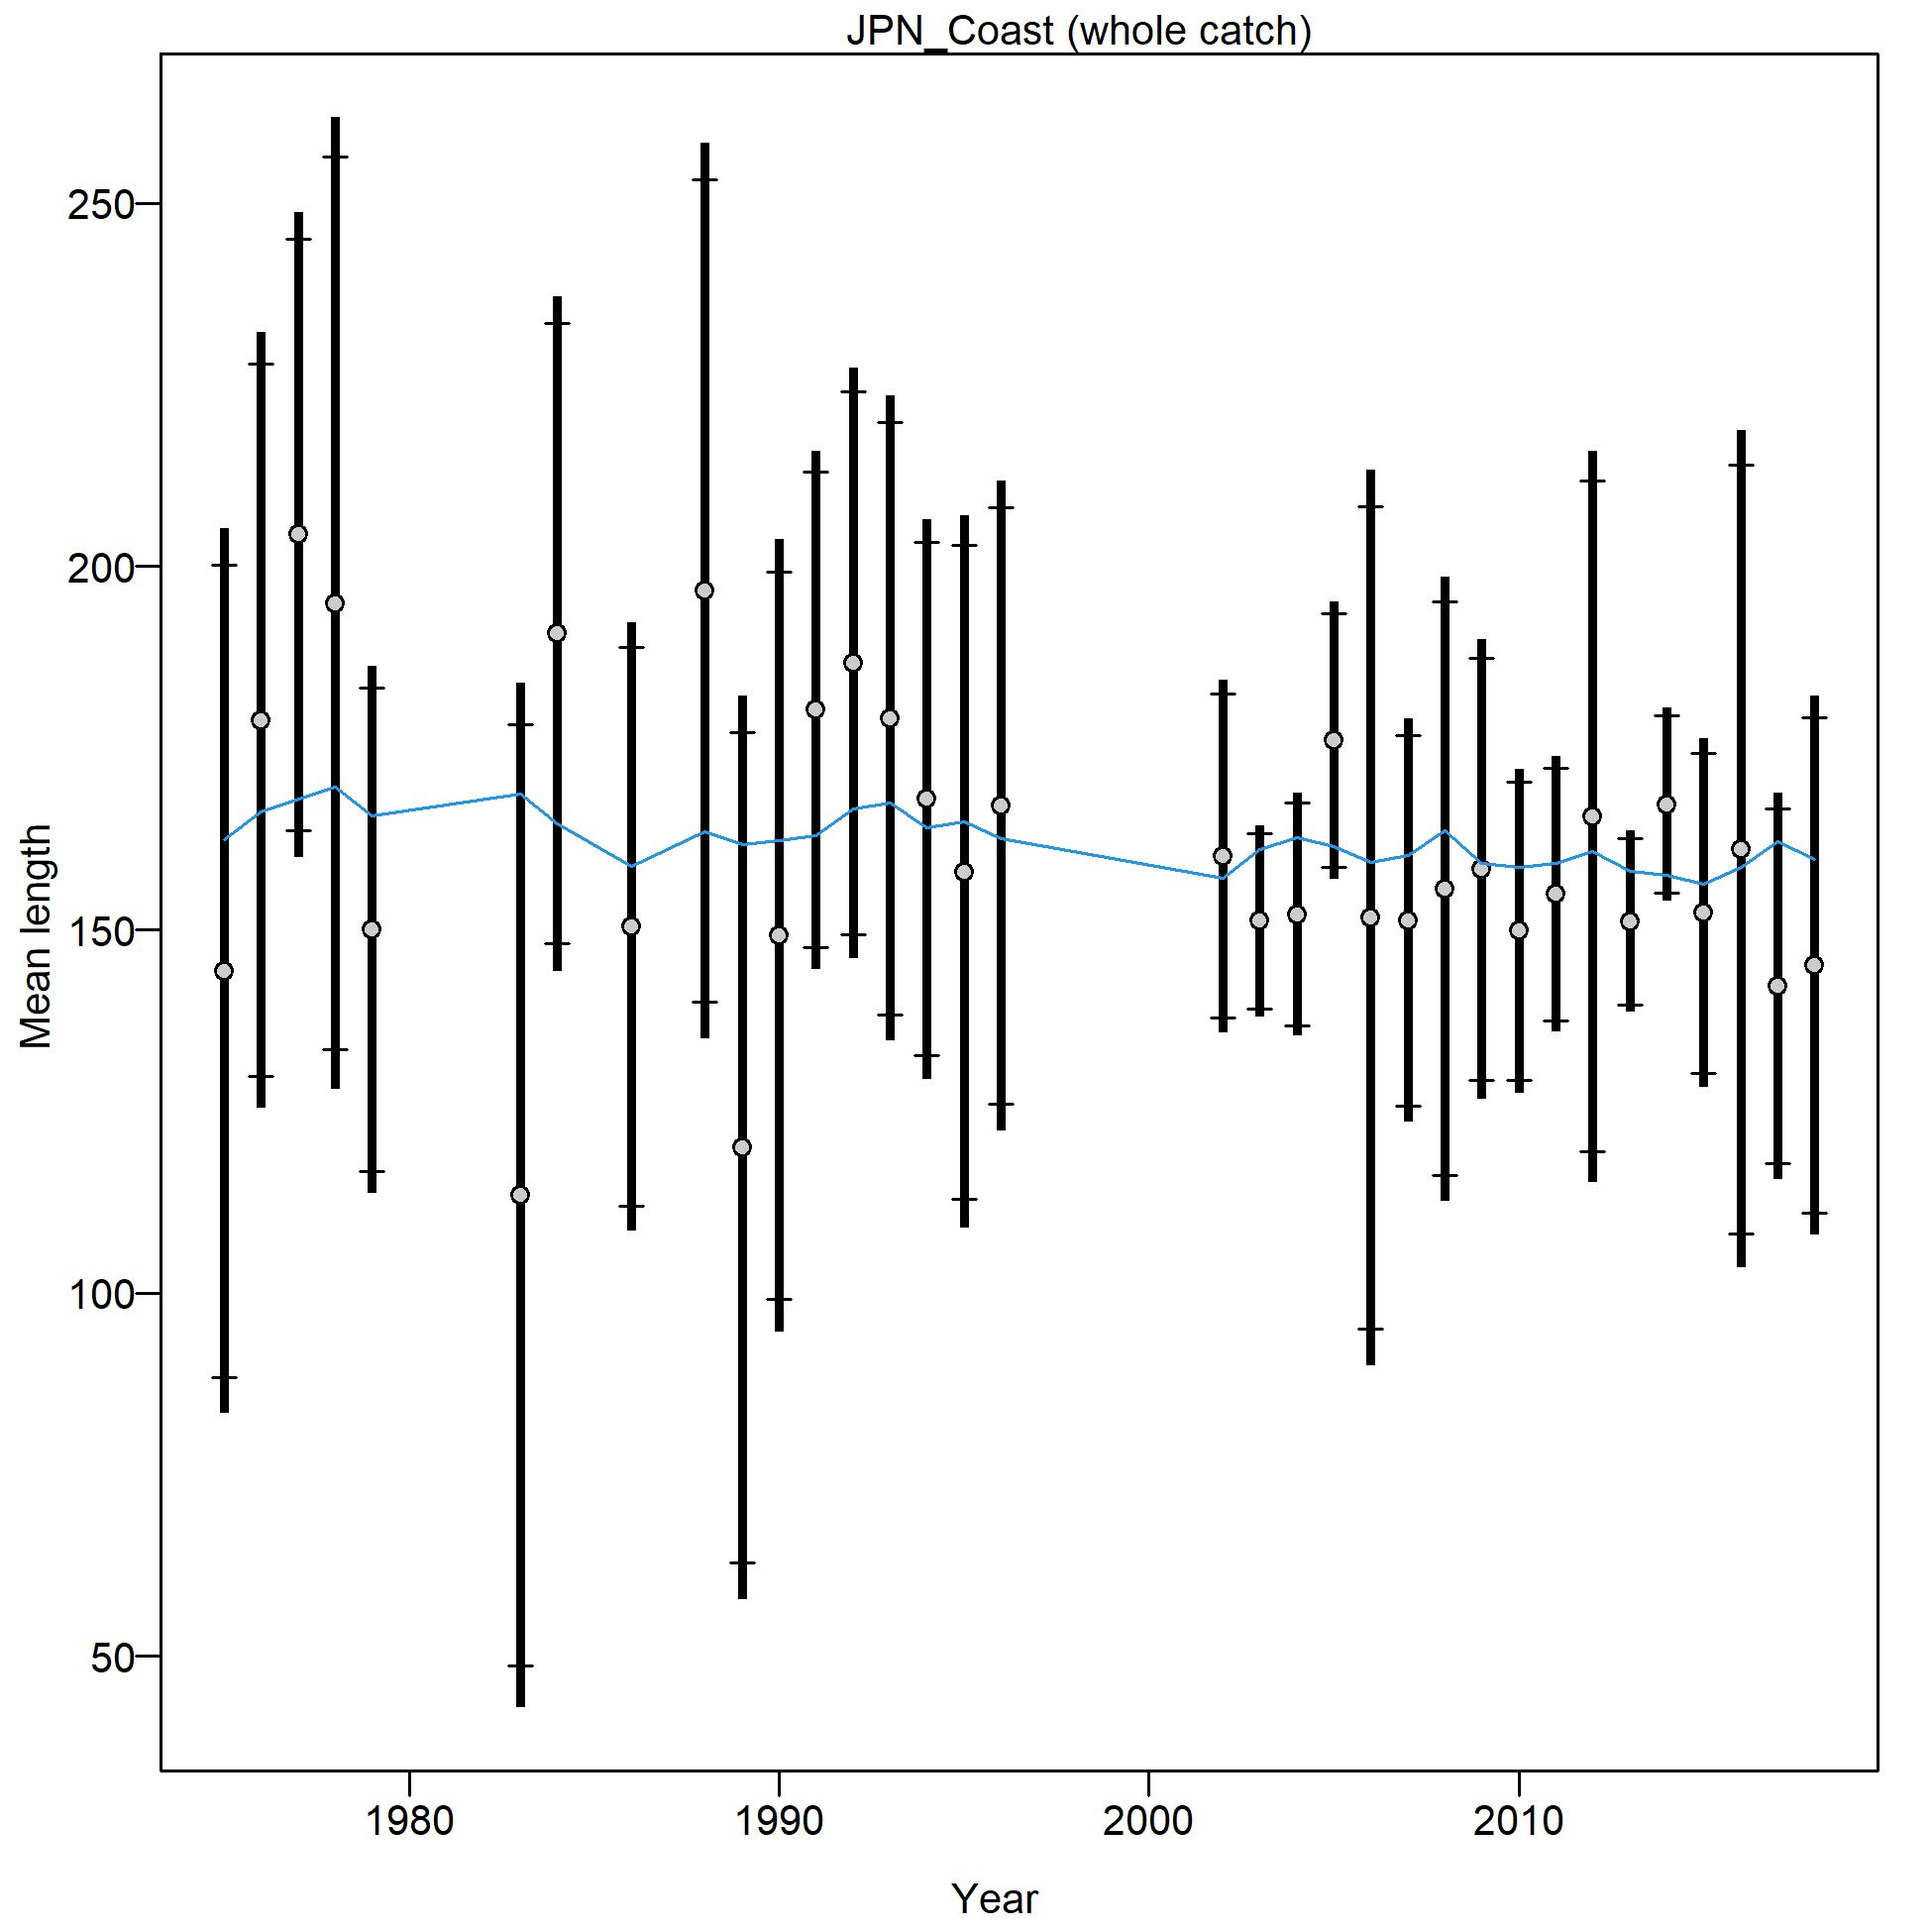
Mean length for JPN_Coast with 95% confidence intervals based on current samples sizes.
Francis data weighting method TA1.8: thinner intervals (with capped ends) show result of further adjusting sample sizes based on suggested multiplier (with 95% interval) for len data from JPN_Coast:
1.1867 (0.8908-1.9456)
For more info, see
Francis, R.I.C.C. (2011). Data weighting in statistical fisheries stock assessment models. Can. J. Fish. Aquat. Sci. 68: 1124-1138. https://doi.org/10.1139/f2011-025

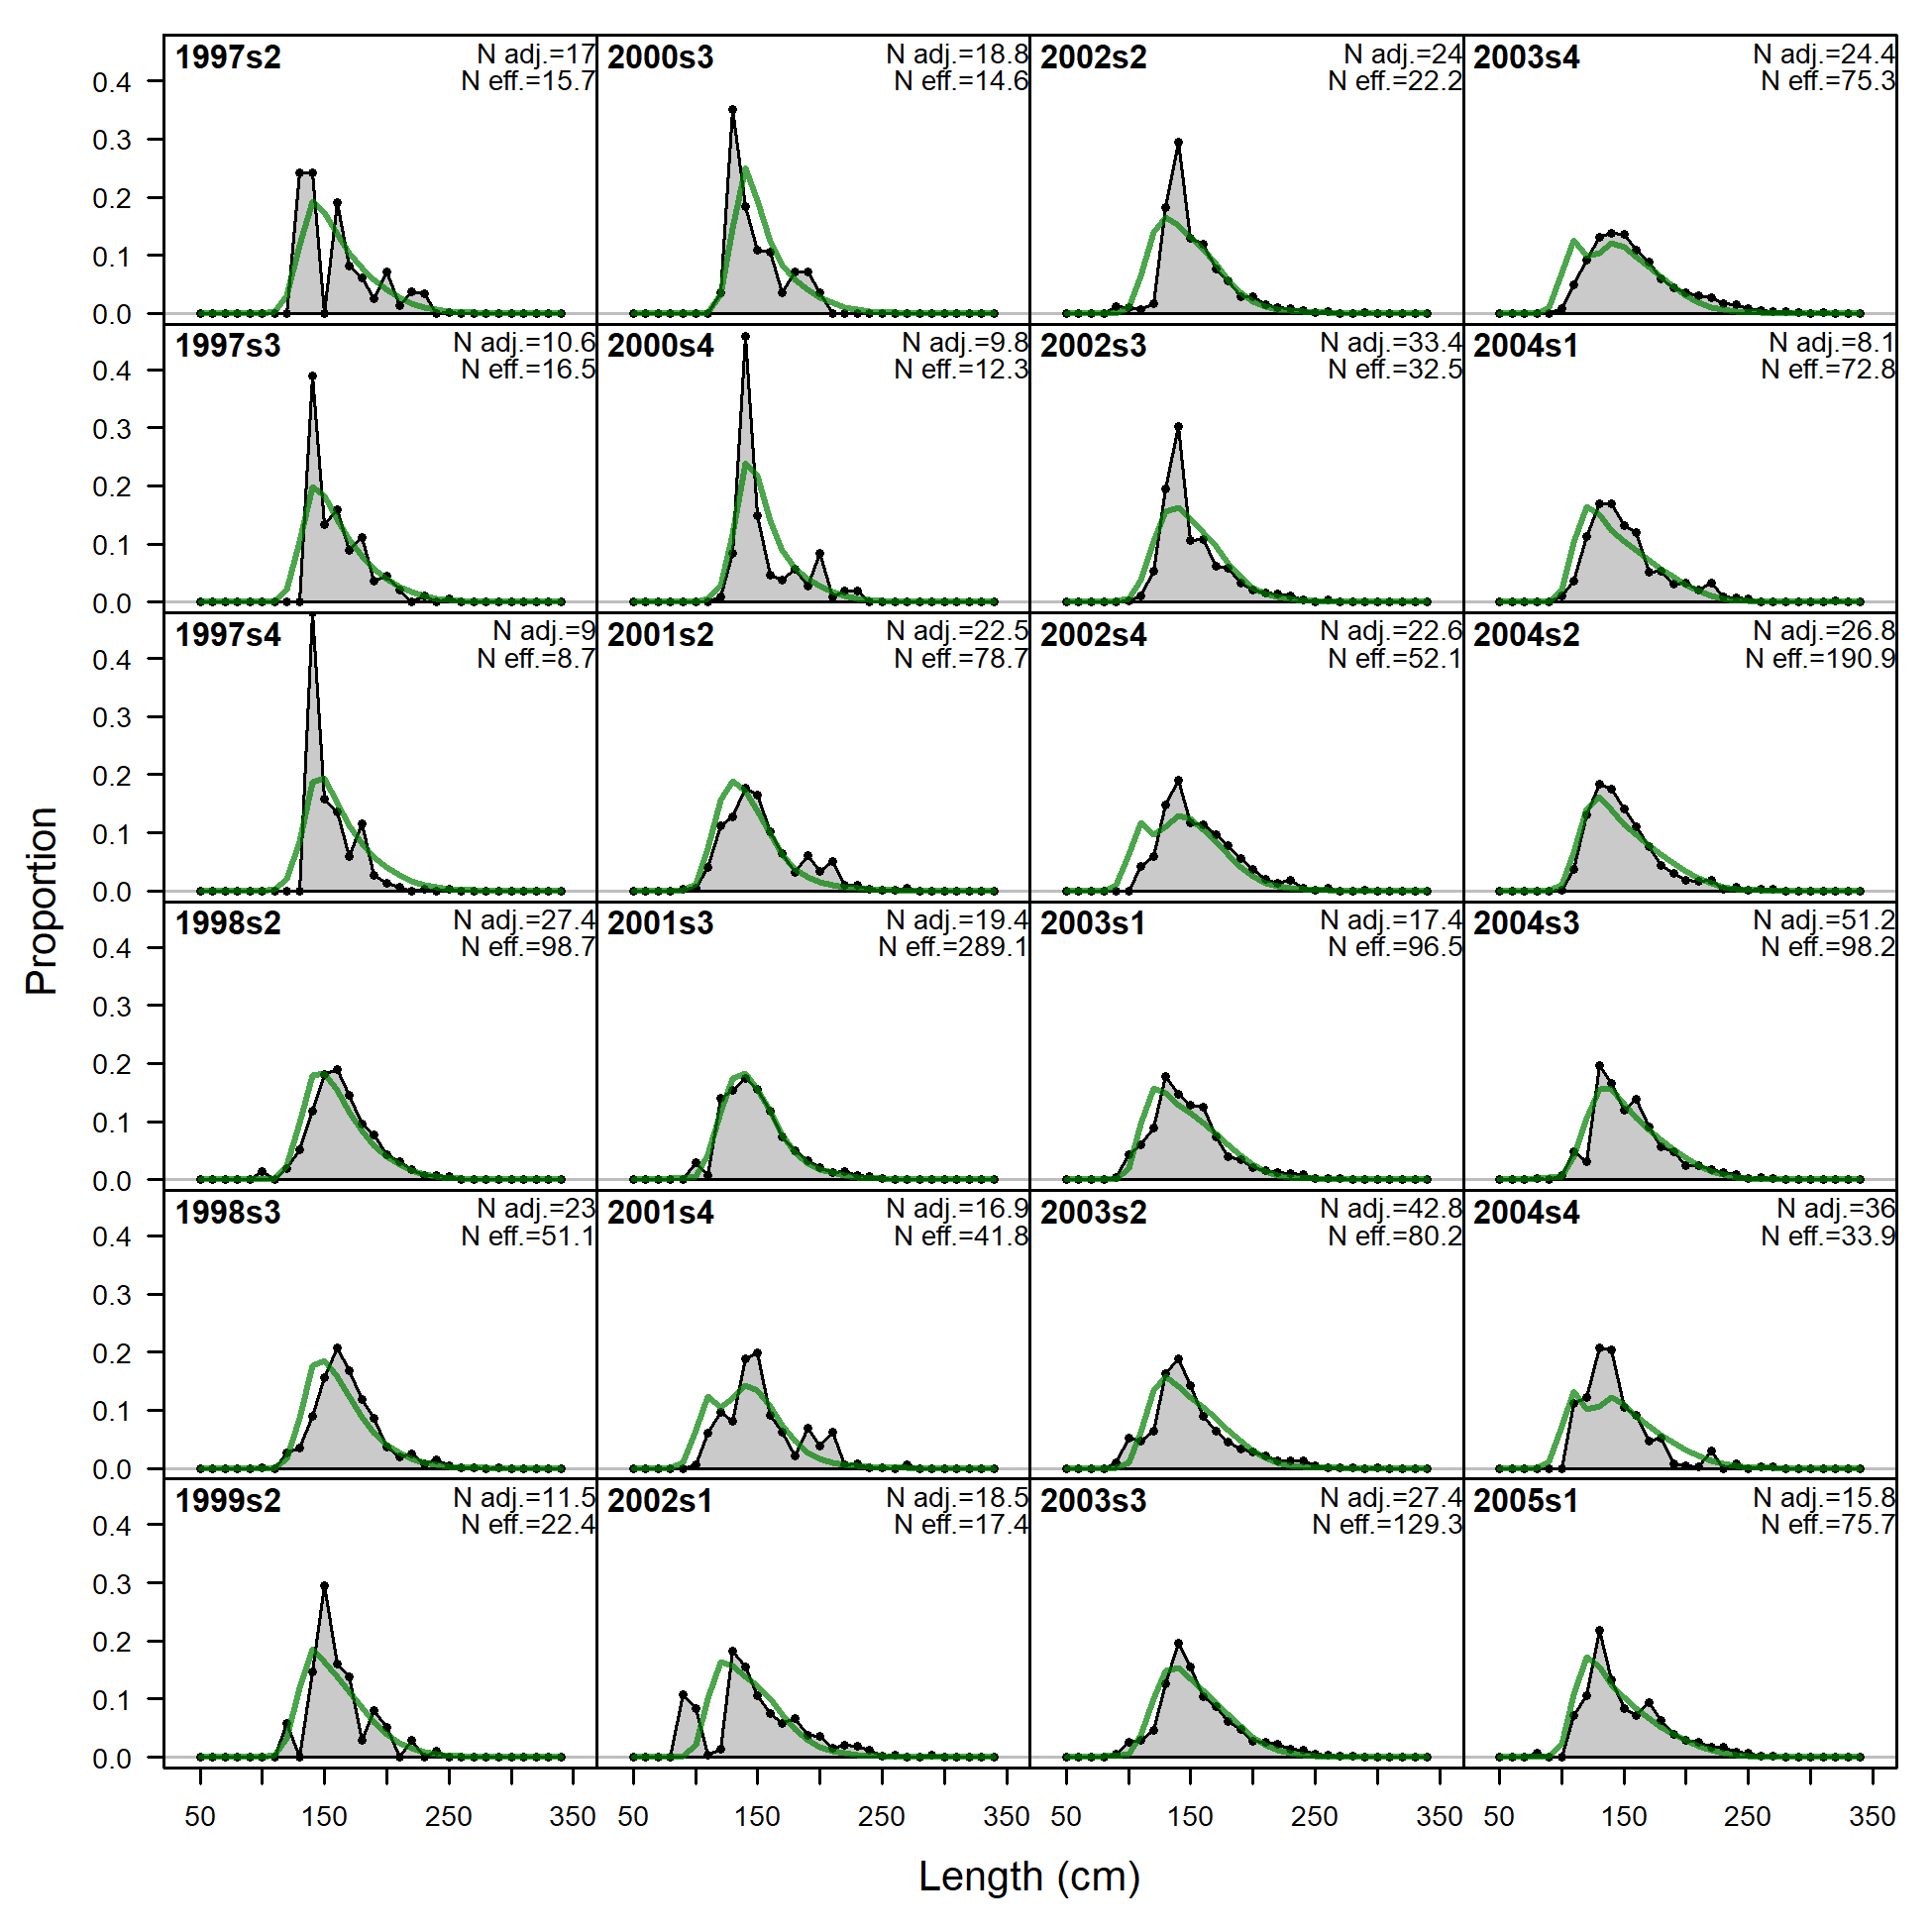
Length comps, whole catch, ESP_Off (plot 1 of 3).
'N adj.' is the input sample size after data-weighting adjustment. N eff. is the calculated effective sample size used in the McAllister-Ianelli tuning method.
file: comp_lenfit_flt5mkt0_page1.png
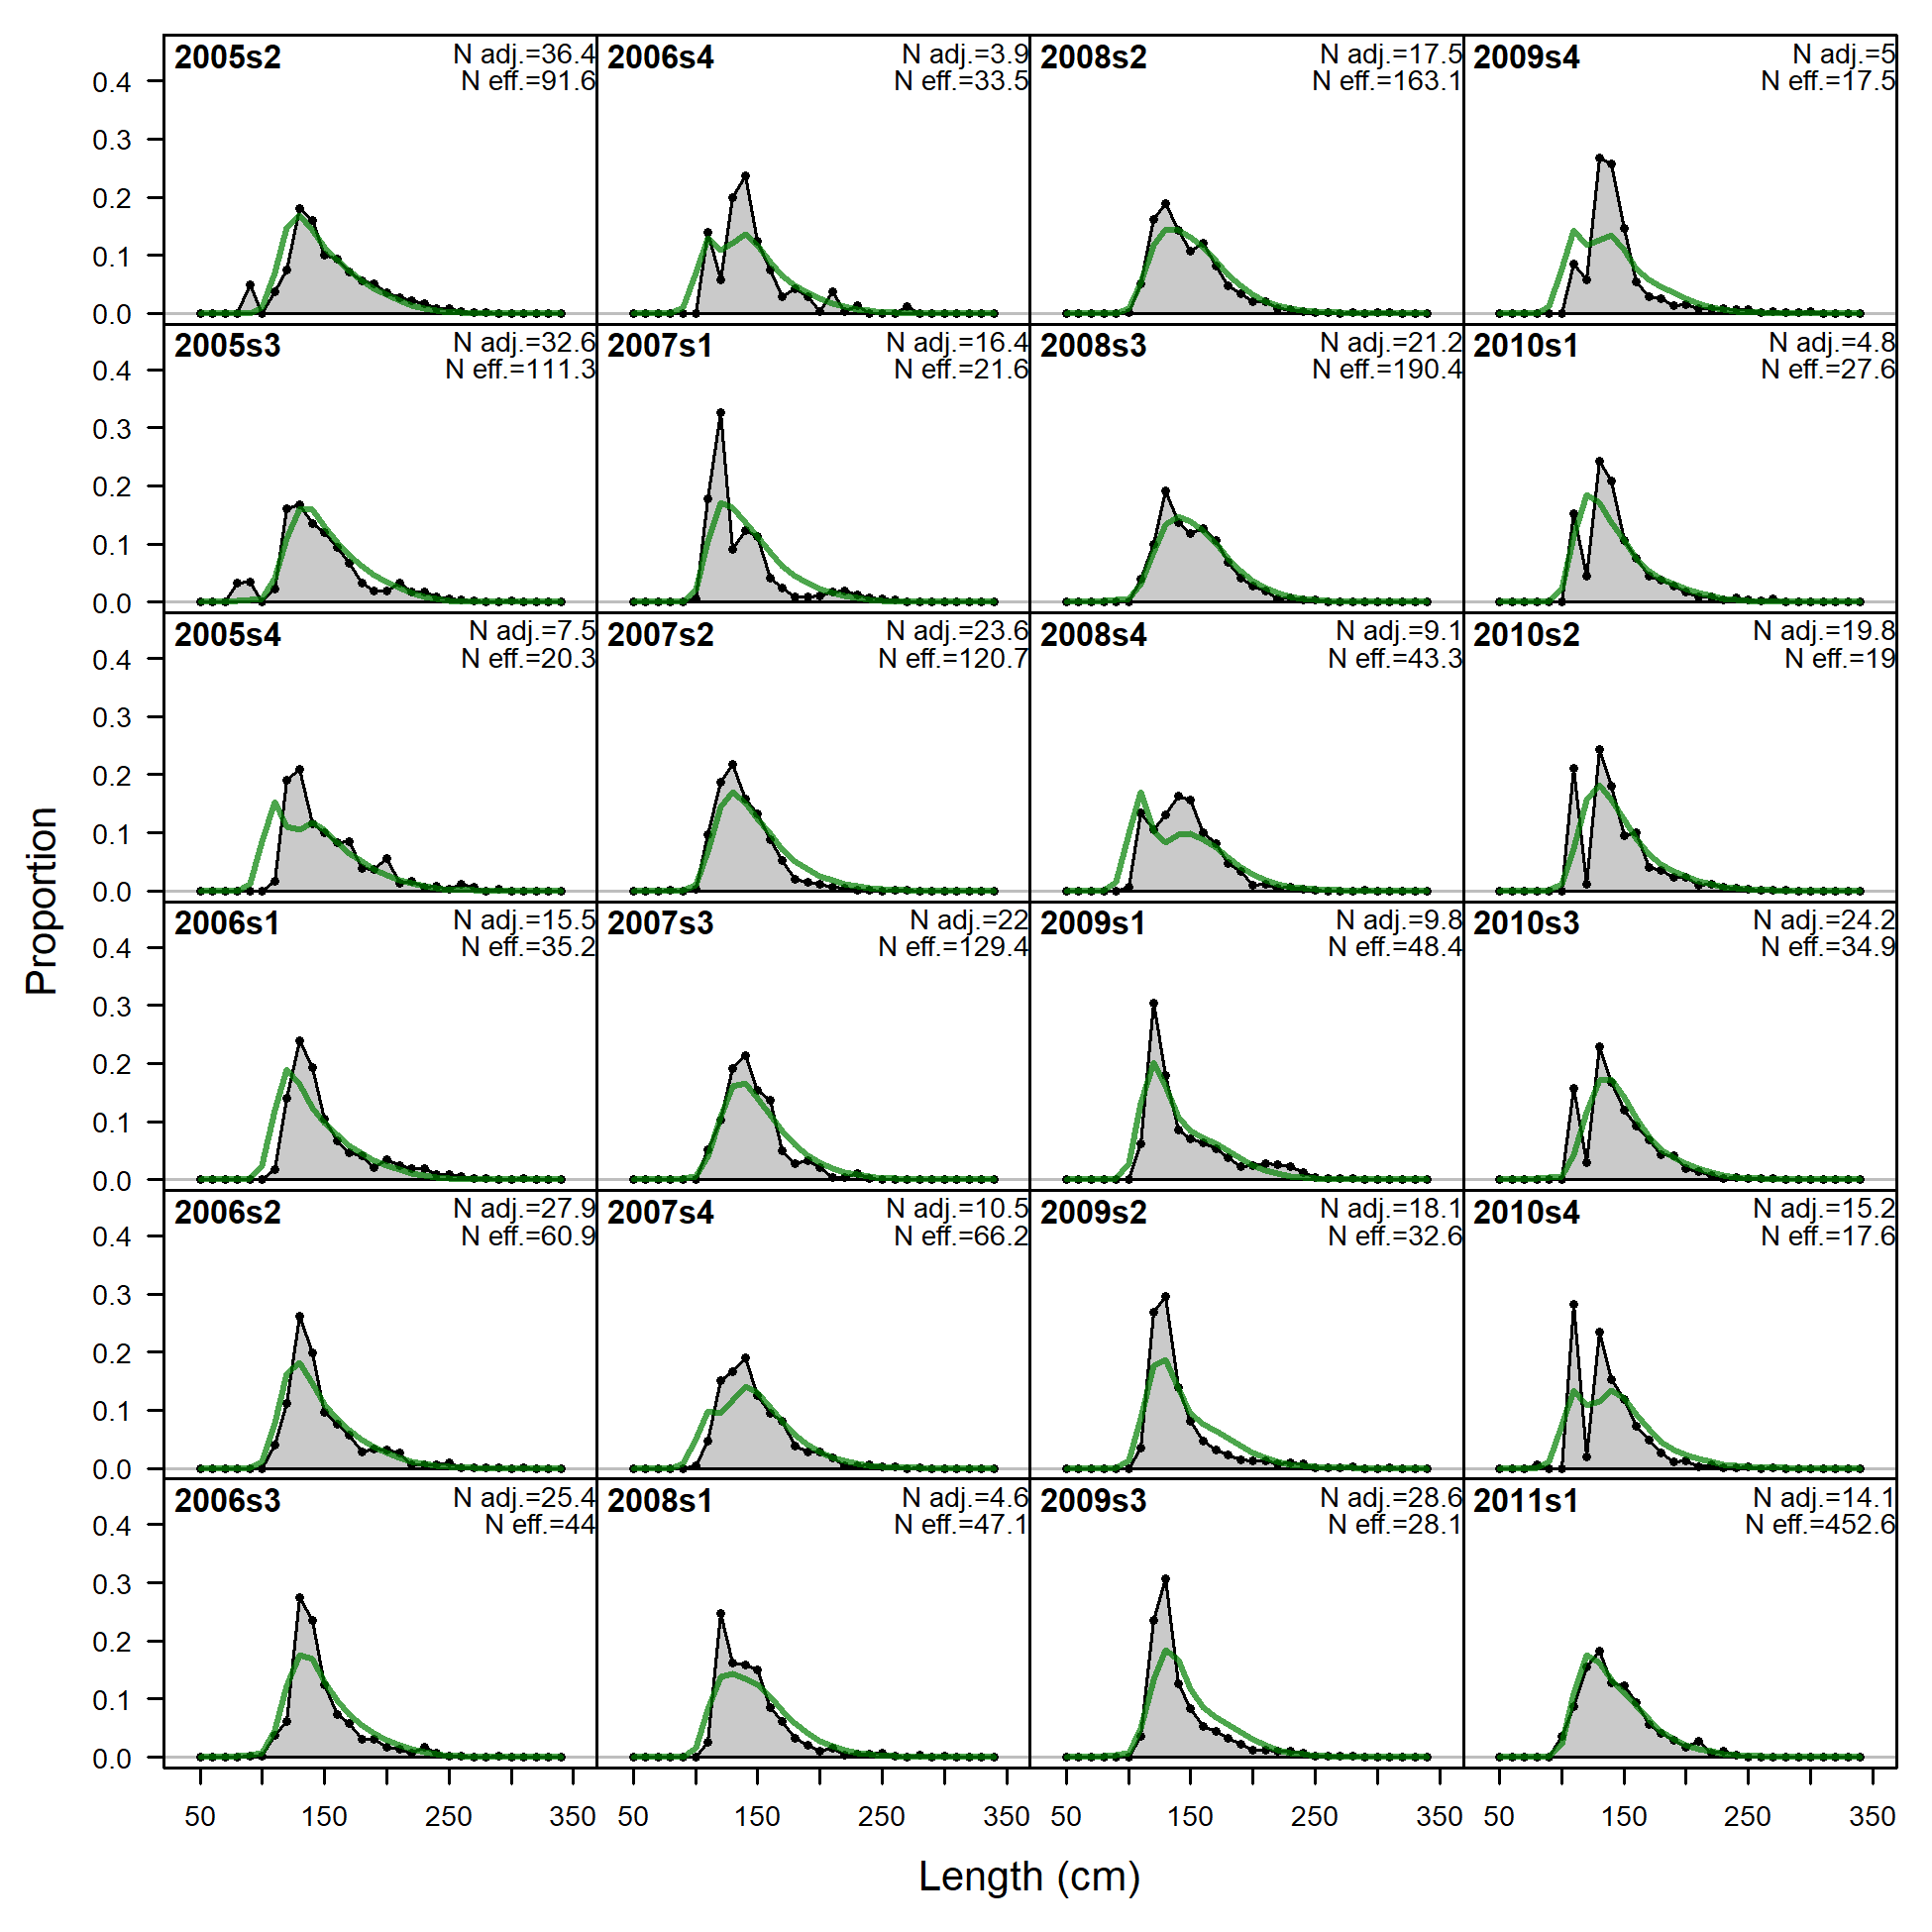
Length comps, whole catch, ESP_Off (plot 1 of 3).
'N adj.' is the input sample size after data-weighting adjustment. N eff. is the calculated effective sample size used in the McAllister-Ianelli tuning method. (plot 2 of 3)
file: comp_lenfit_flt5mkt0_page2.png
Length comps, whole catch, ESP_Off (plot 1 of 3).
'N adj.' is the input sample size after data-weighting adjustment. N eff. is the calculated effective sample size used in the McAllister-Ianelli tuning method. (plot 2 of 3) (plot 3 of 3)
file: comp_lenfit_flt5mkt0_page3.png
Pearson residuals, whole catch, ESP_Off (max=58.04) (plot 3 of 3)
Closed bubbles are positive residuals (observed > expected) and open bubbles are negative residuals (observed < expected).
file: comp_lenfit_residsflt5mkt0_page3.png
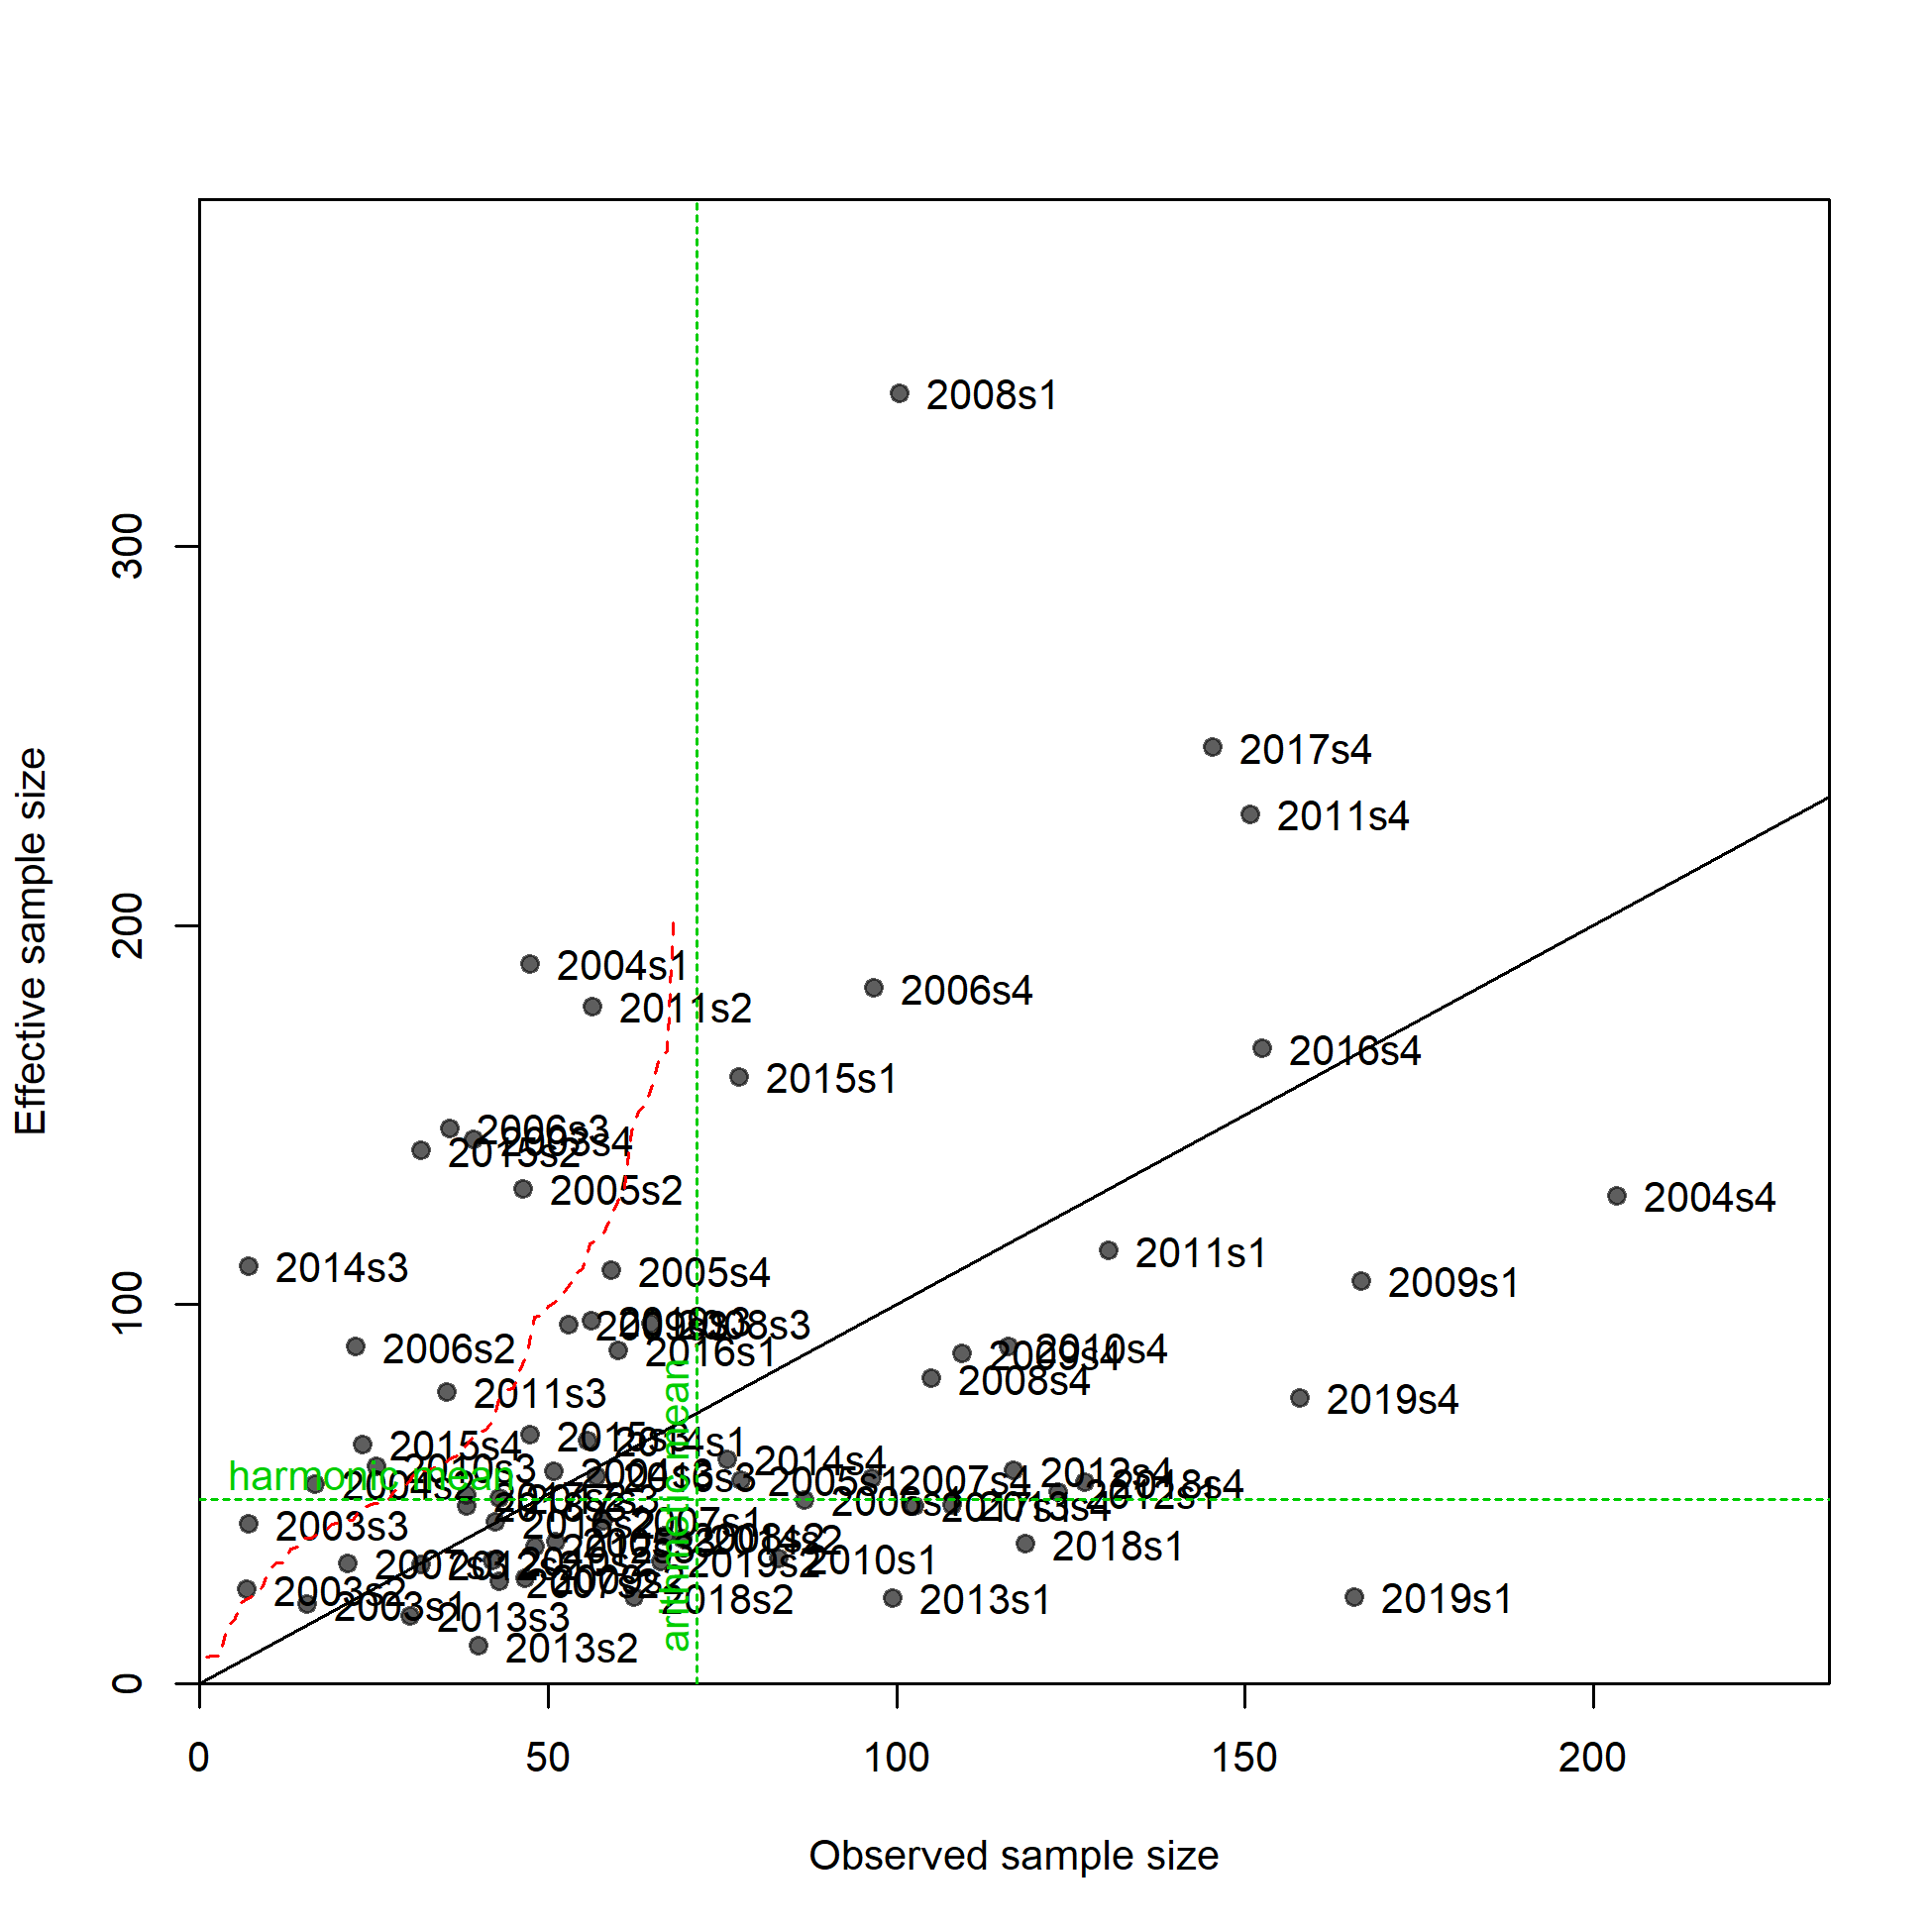
N-EffN comparison, Length comps, whole catch, ESP_Off
file: comp_lenfit_sampsize_flt5mkt0.png
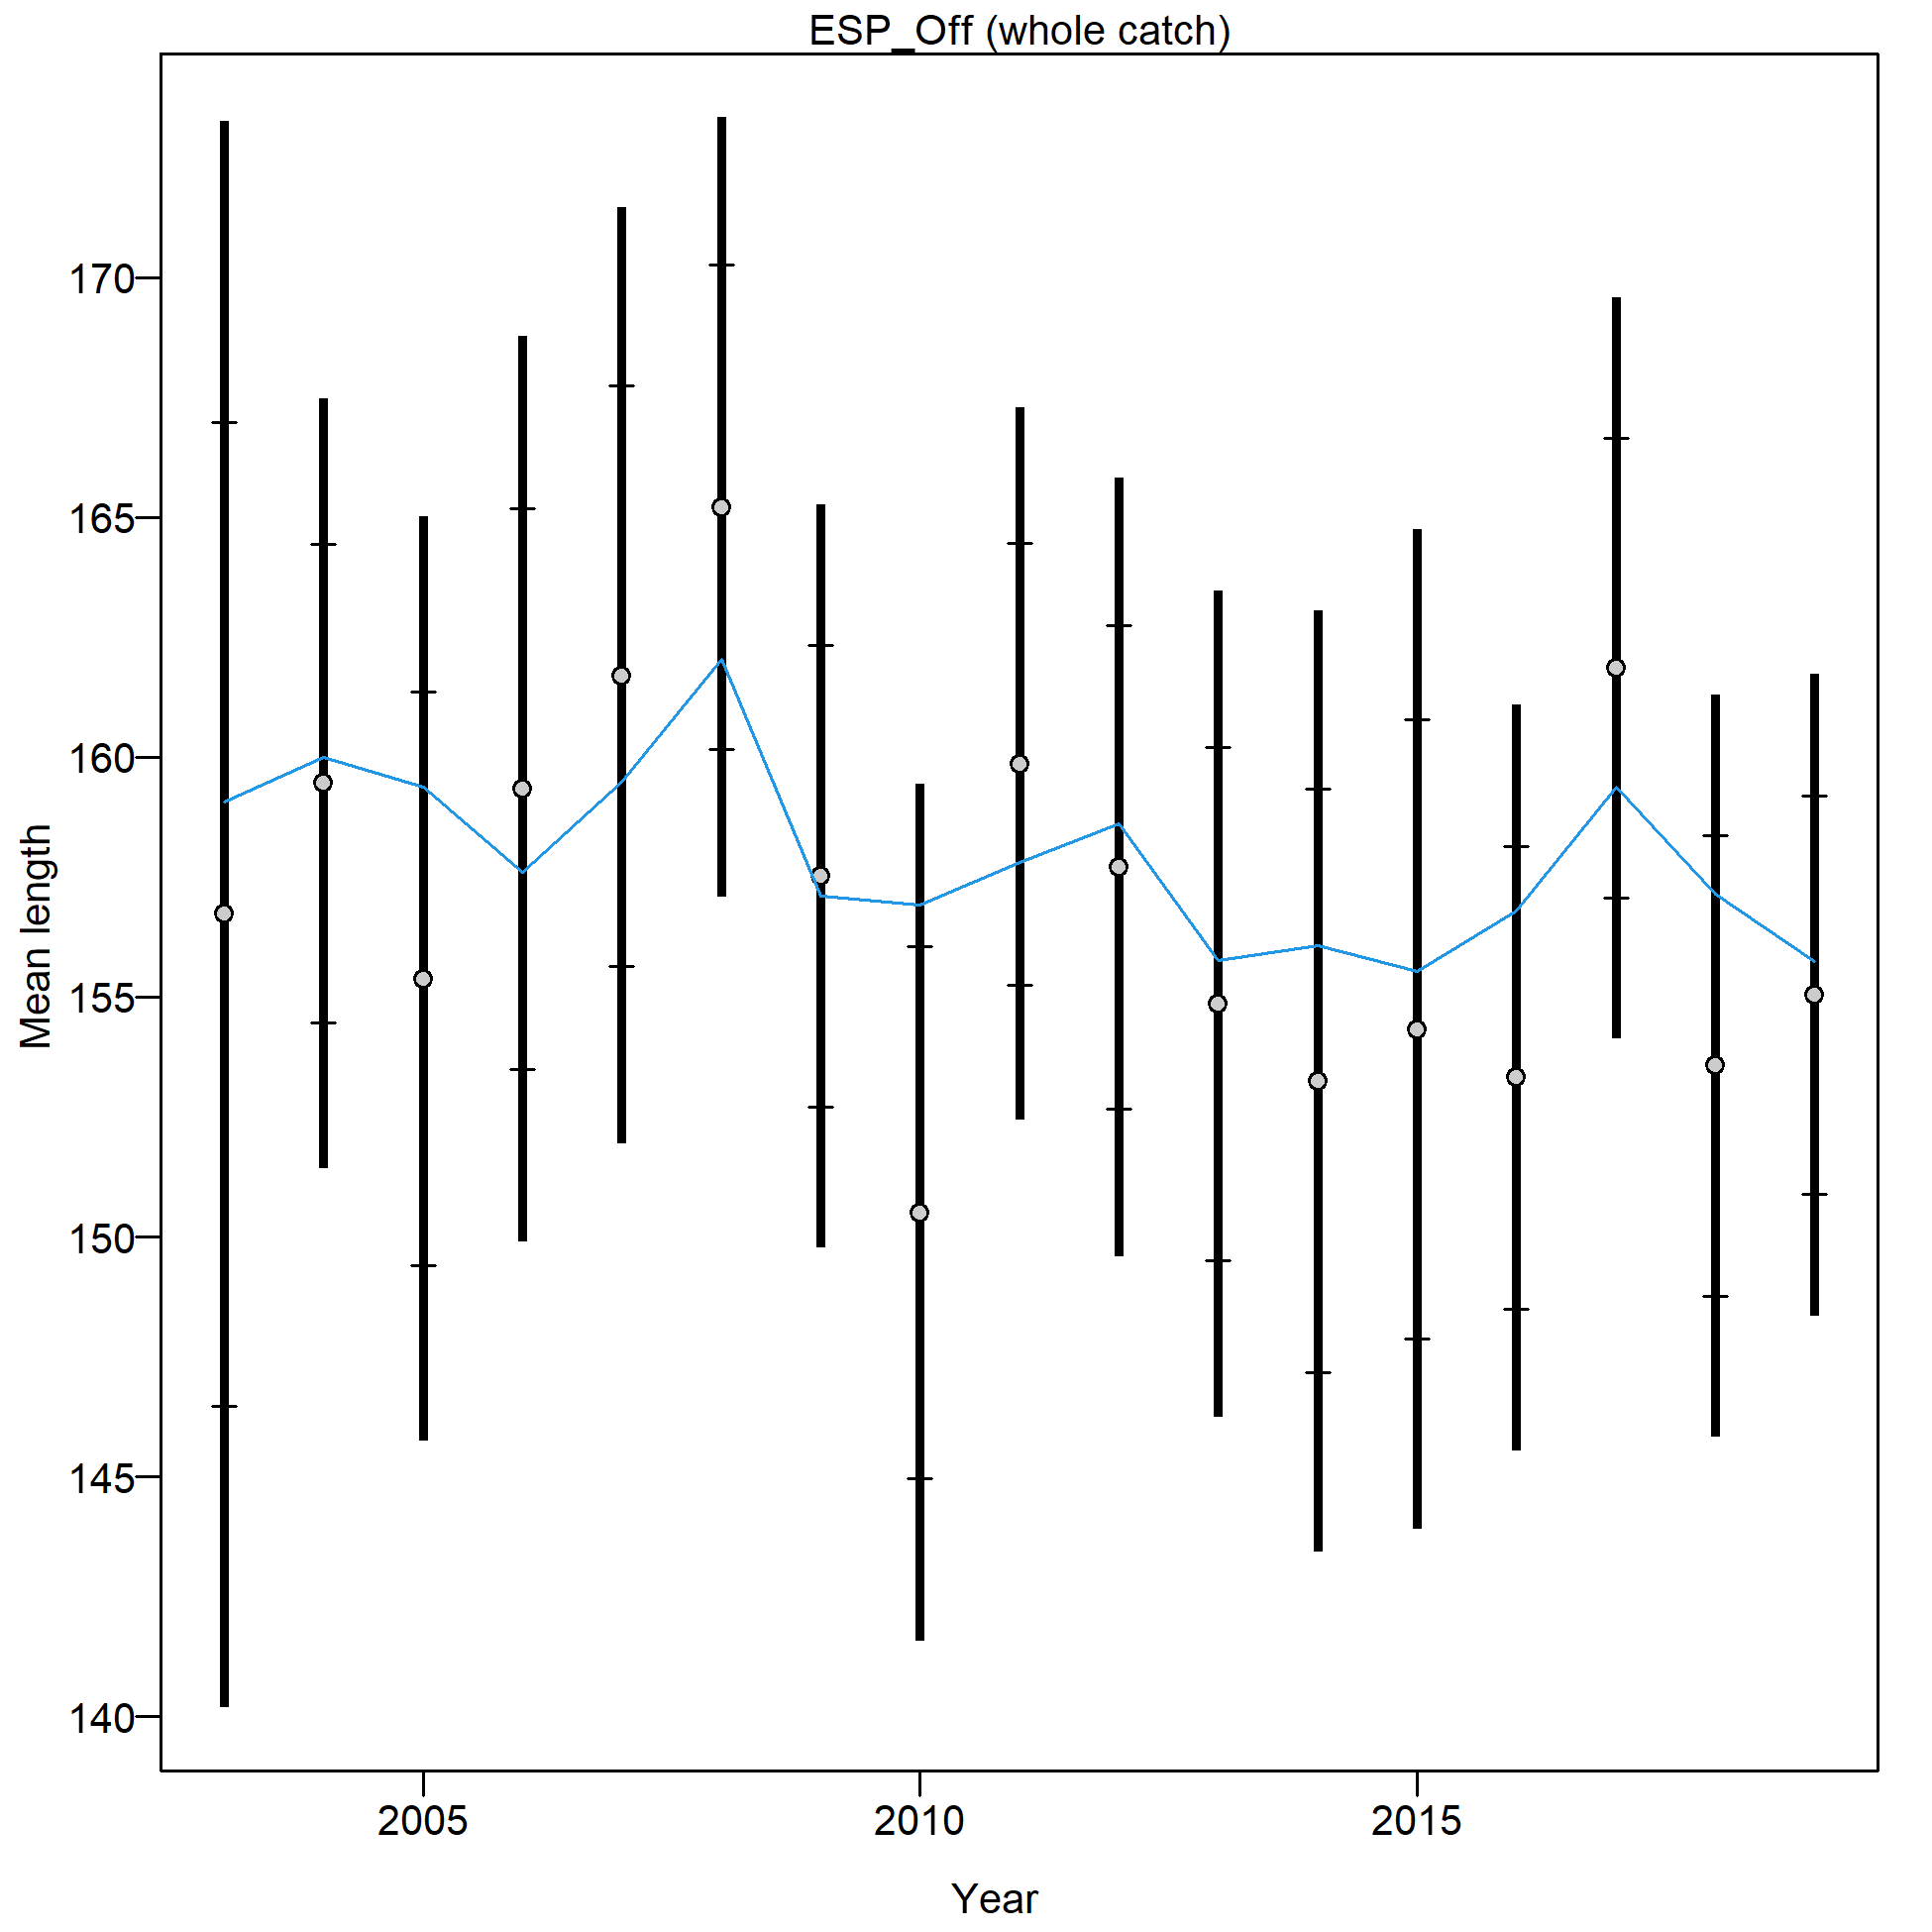
Mean length for ESP_Off with 95% confidence intervals based on current samples sizes.
Francis data weighting method TA1.8: thinner intervals (with capped ends) show result of further adjusting sample sizes based on suggested multiplier (with 95% interval) for len data from ESP_Off:
2.5976 (1.7071-5.7873)
For more info, see
Francis, R.I.C.C. (2011). Data weighting in statistical fisheries stock assessment models. Can. J. Fish. Aquat. Sci. 68: 1124-1138. https://doi.org/10.1139/f2011-025
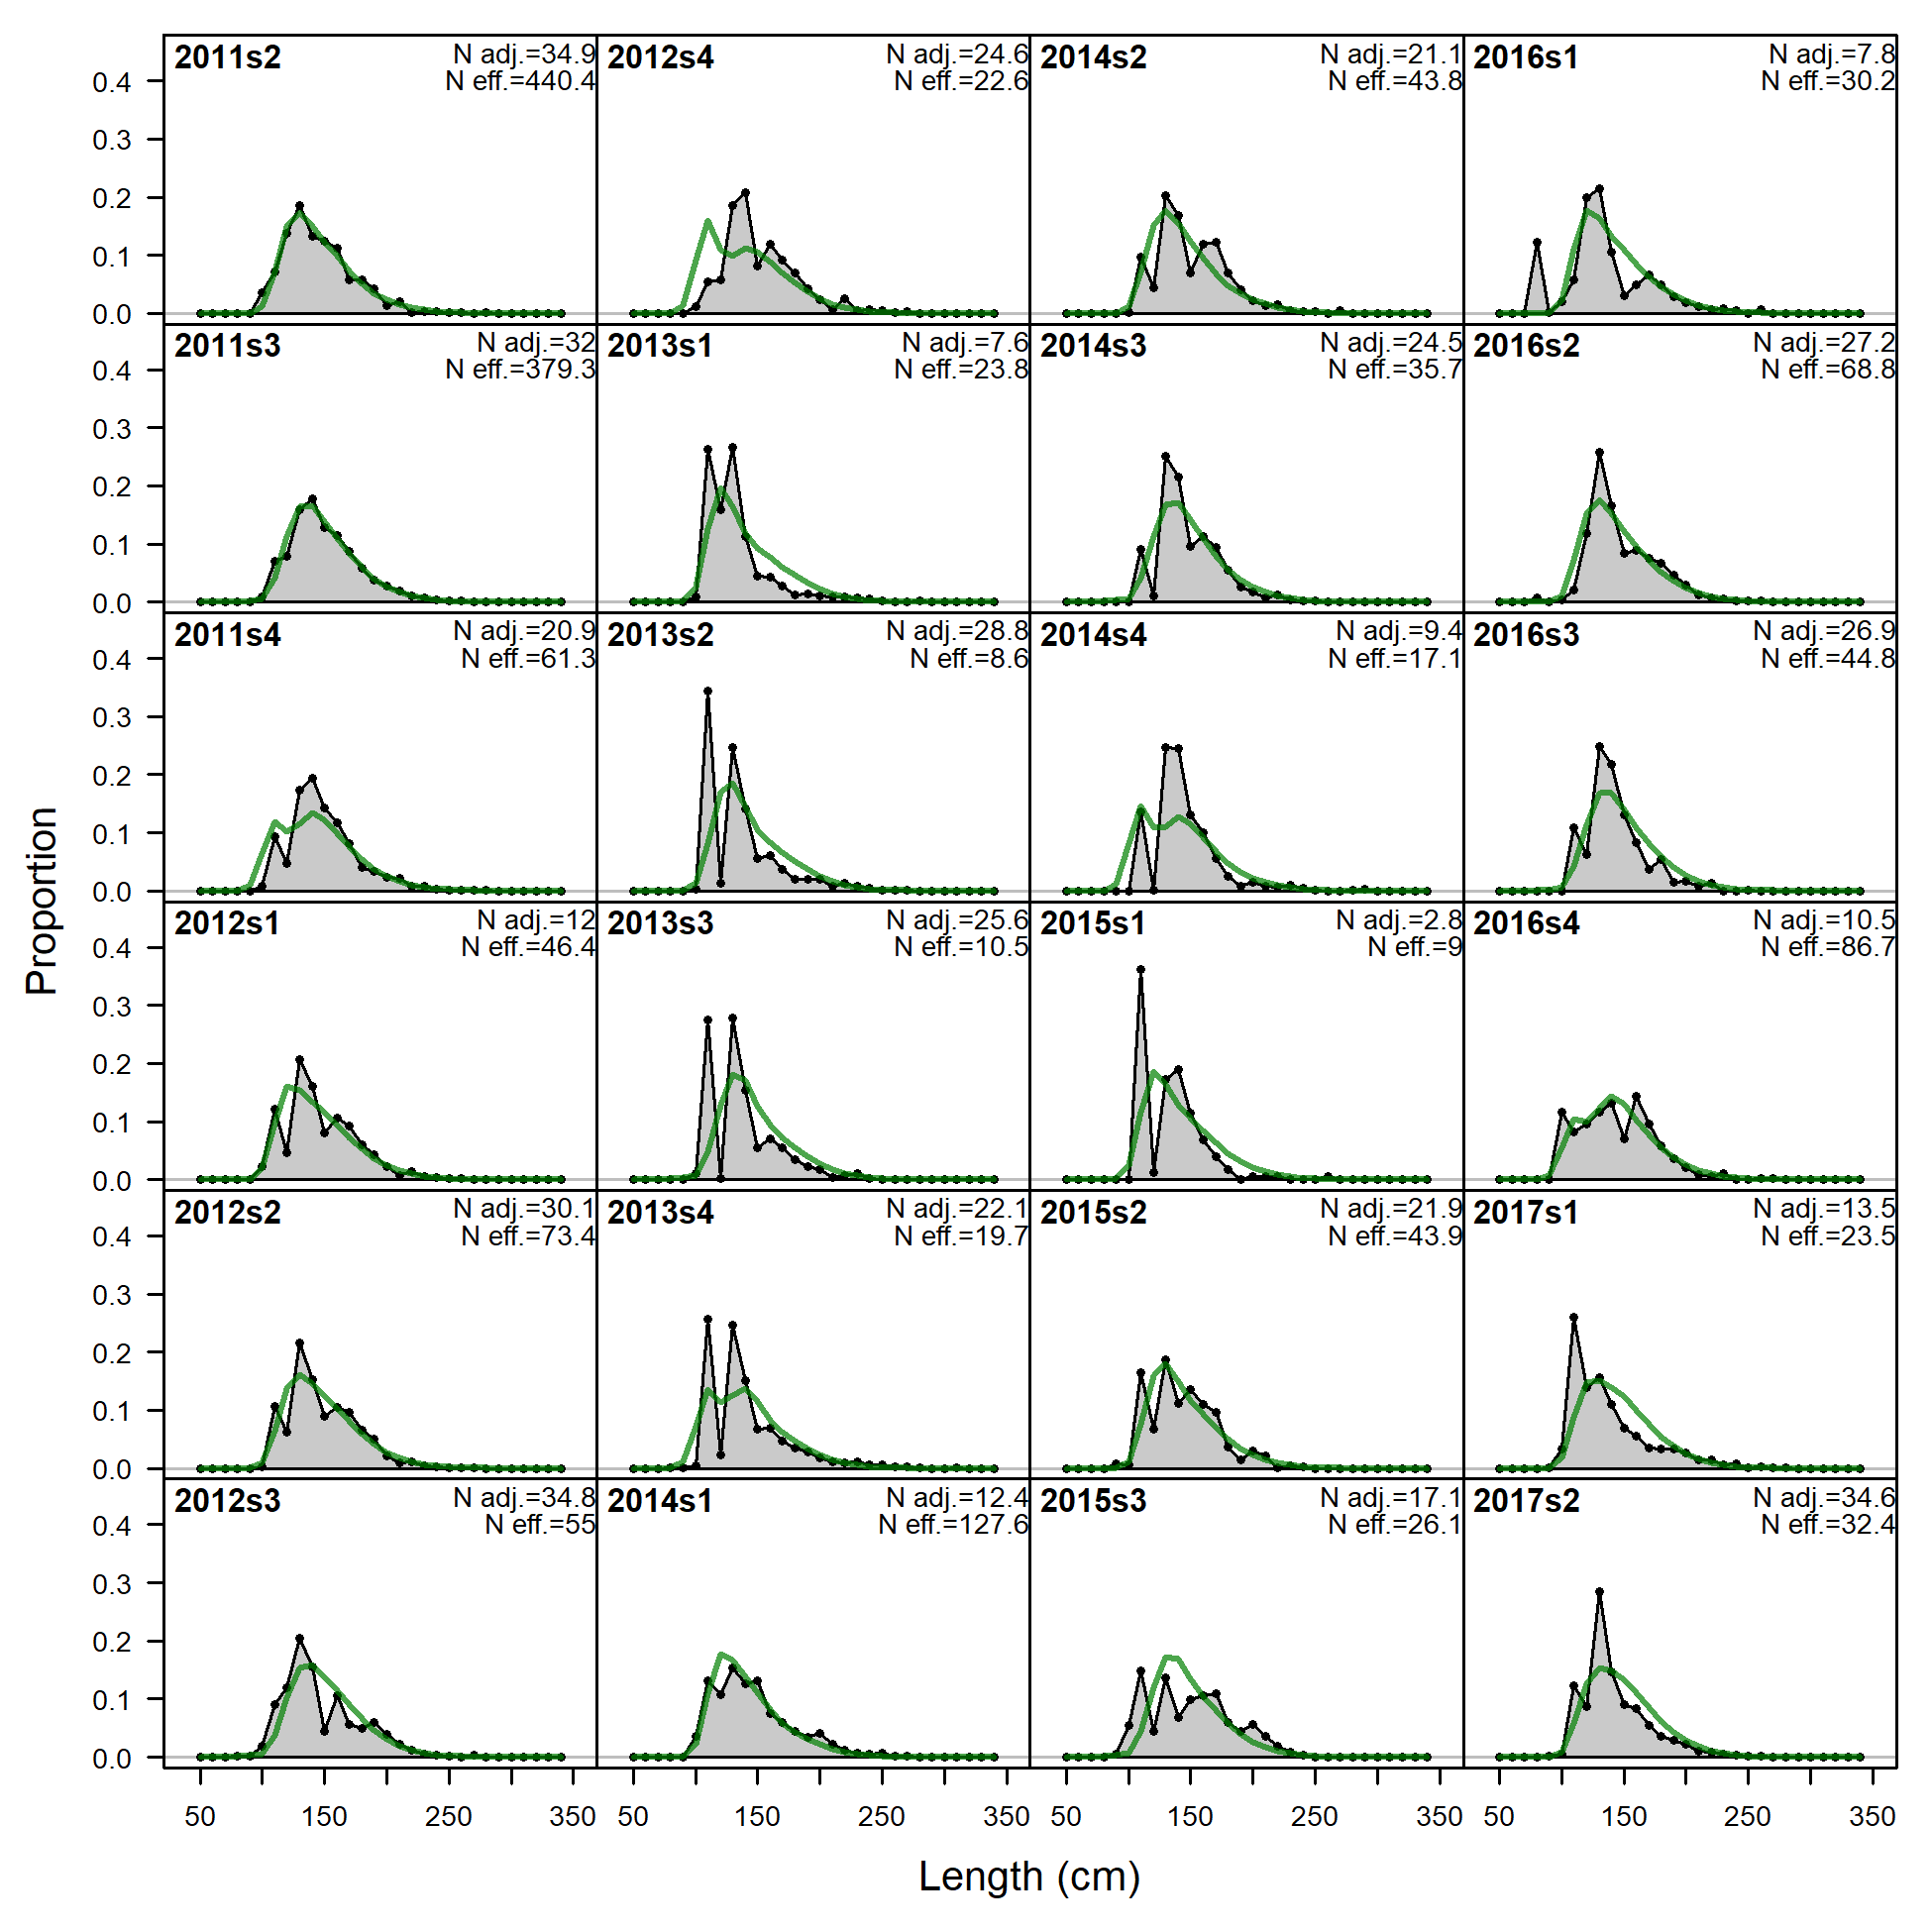
Length comps, whole catch, ESP_Coast (plot 1 of 4).
'N adj.' is the input sample size after data-weighting adjustment. N eff. is the calculated effective sample size used in the McAllister-Ianelli tuning method.
file: comp_lenfit_flt6mkt0_page1.png
Length comps, whole catch, ESP_Coast (plot 1 of 4).
'N adj.' is the input sample size after data-weighting adjustment. N eff. is the calculated effective sample size used in the McAllister-Ianelli tuning method. (plot 2 of 4)
file: comp_lenfit_flt6mkt0_page2.png
Length comps, whole catch, ESP_Coast (plot 1 of 4).
'N adj.' is the input sample size after data-weighting adjustment. N eff. is the calculated effective sample size used in the McAllister-Ianelli tuning method. (plot 2 of 4) (plot 3 of 4)
file: comp_lenfit_flt6mkt0_page3.png
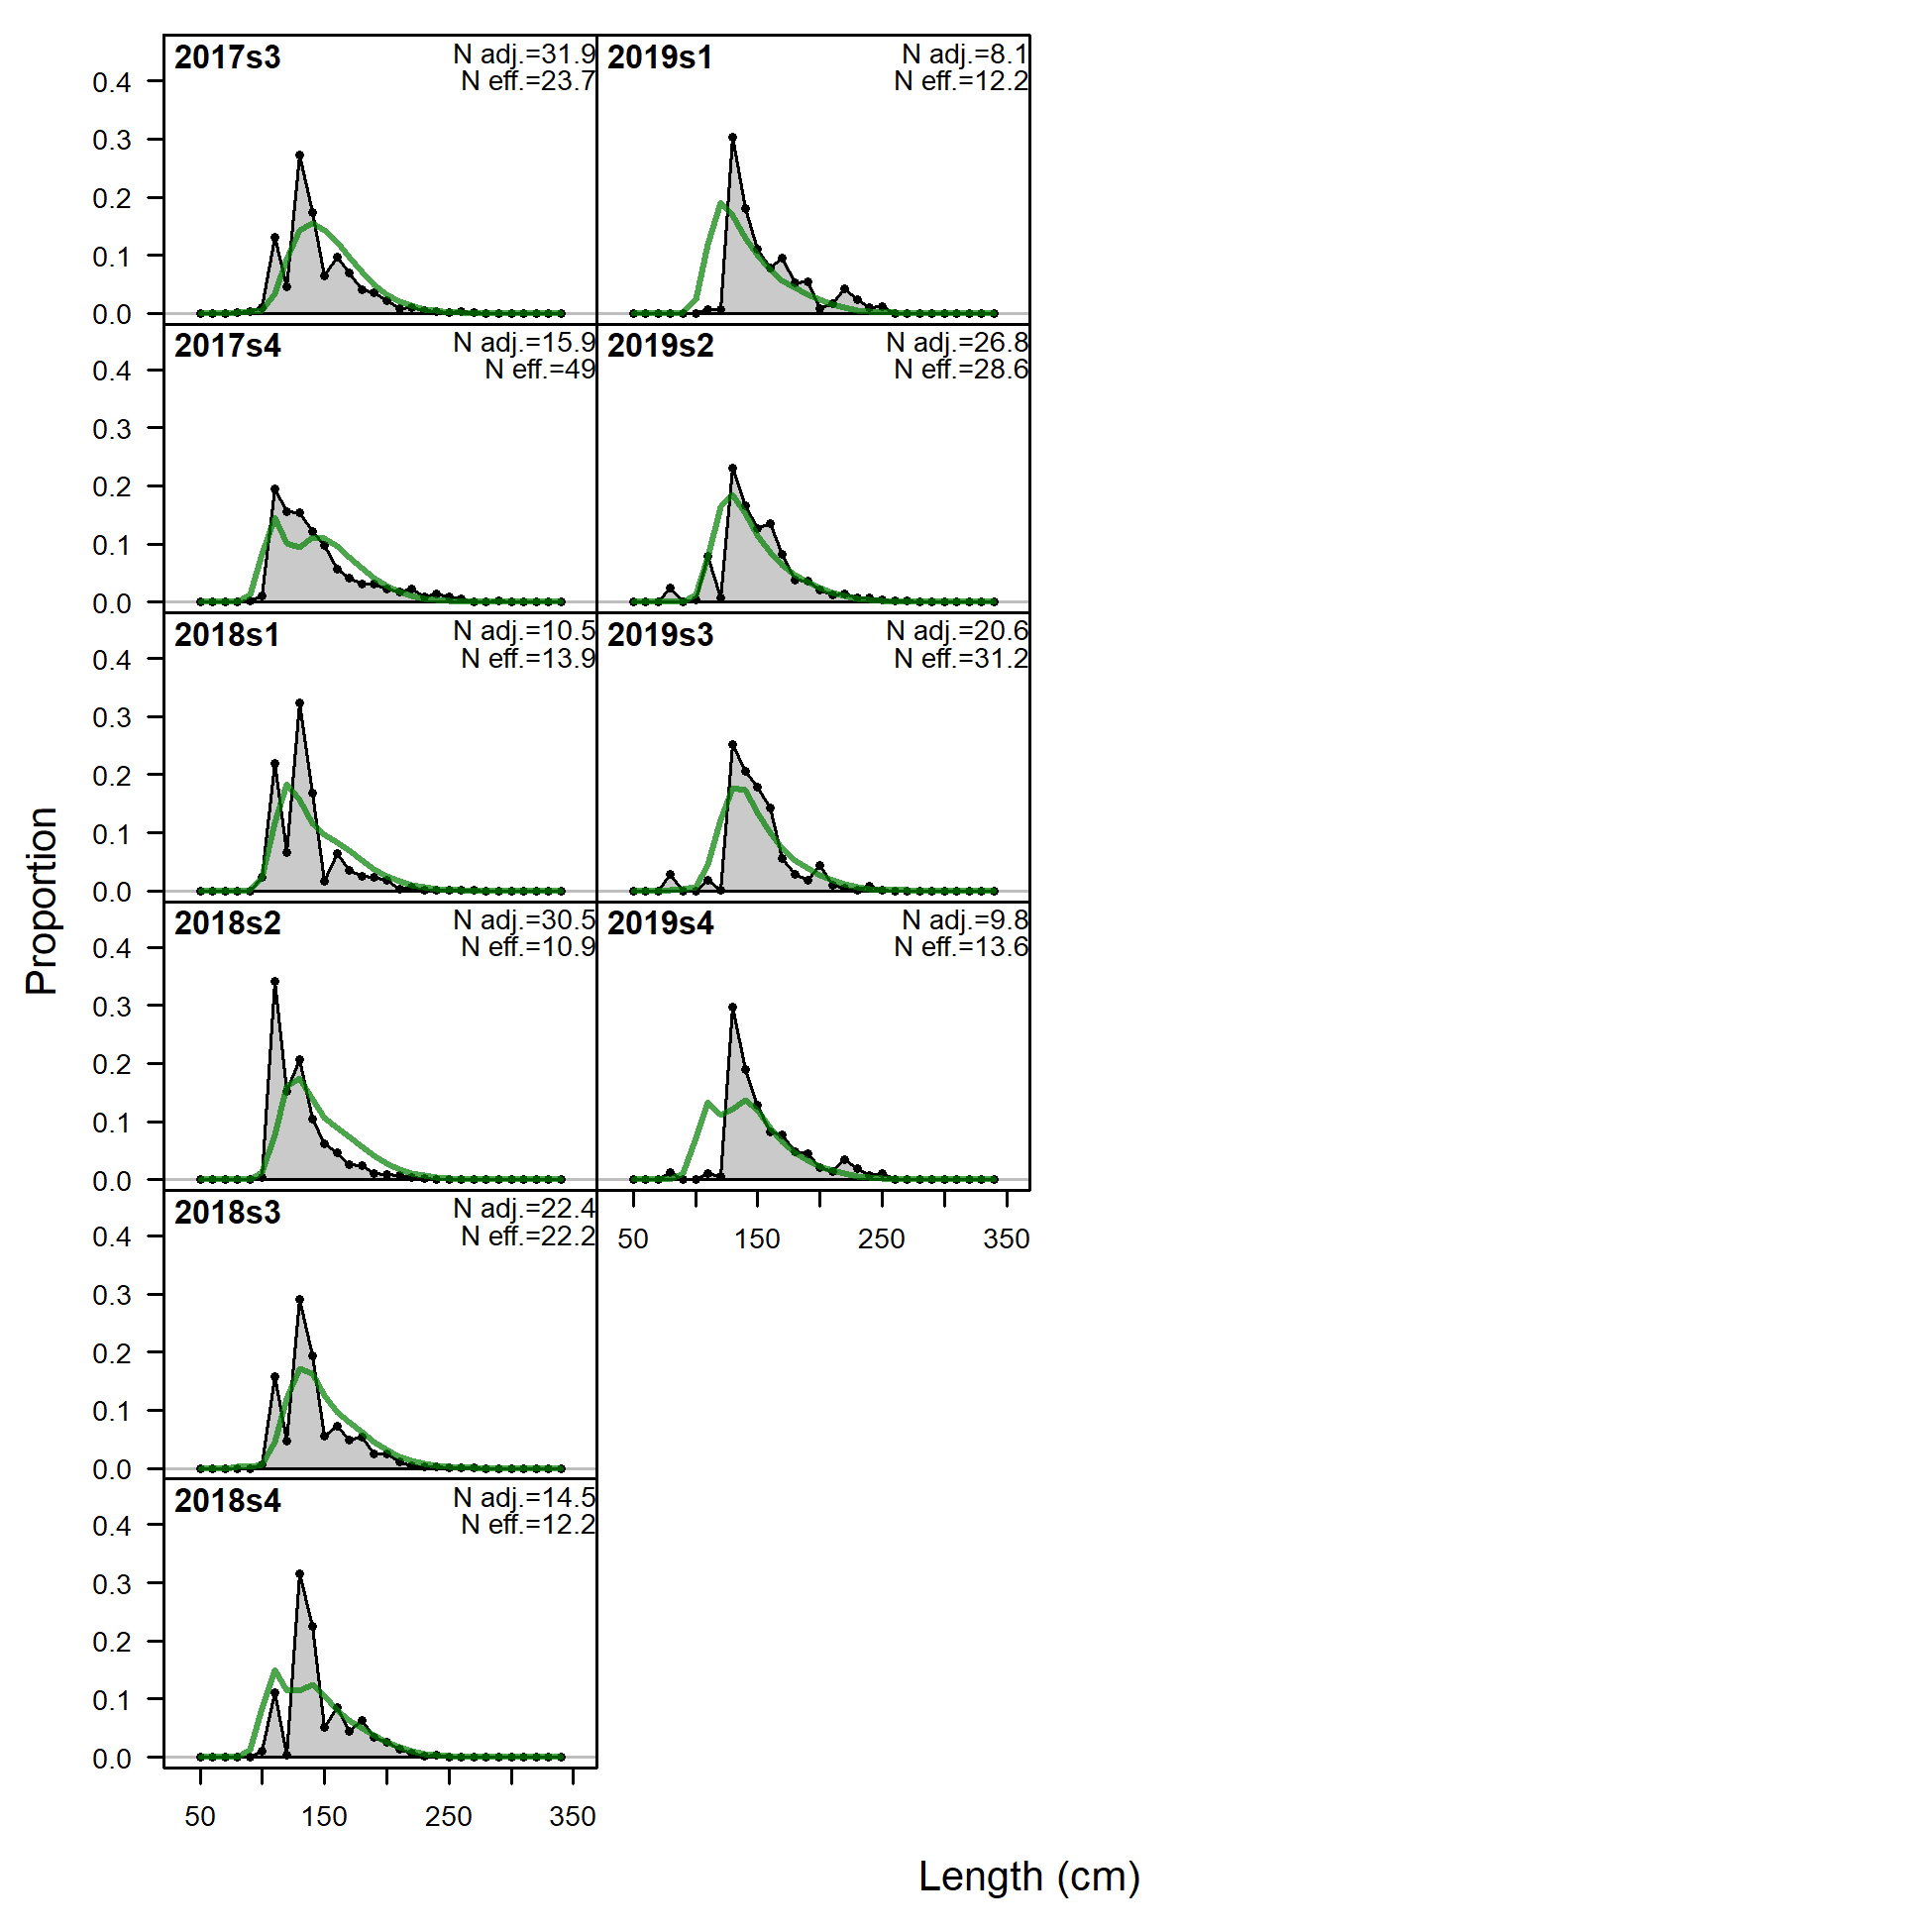
Length comps, whole catch, ESP_Coast (plot 1 of 4).
'N adj.' is the input sample size after data-weighting adjustment. N eff. is the calculated effective sample size used in the McAllister-Ianelli tuning method. (plot 2 of 4) (plot 3 of 4) (plot 4 of 4)
file: comp_lenfit_flt6mkt0_page4.png
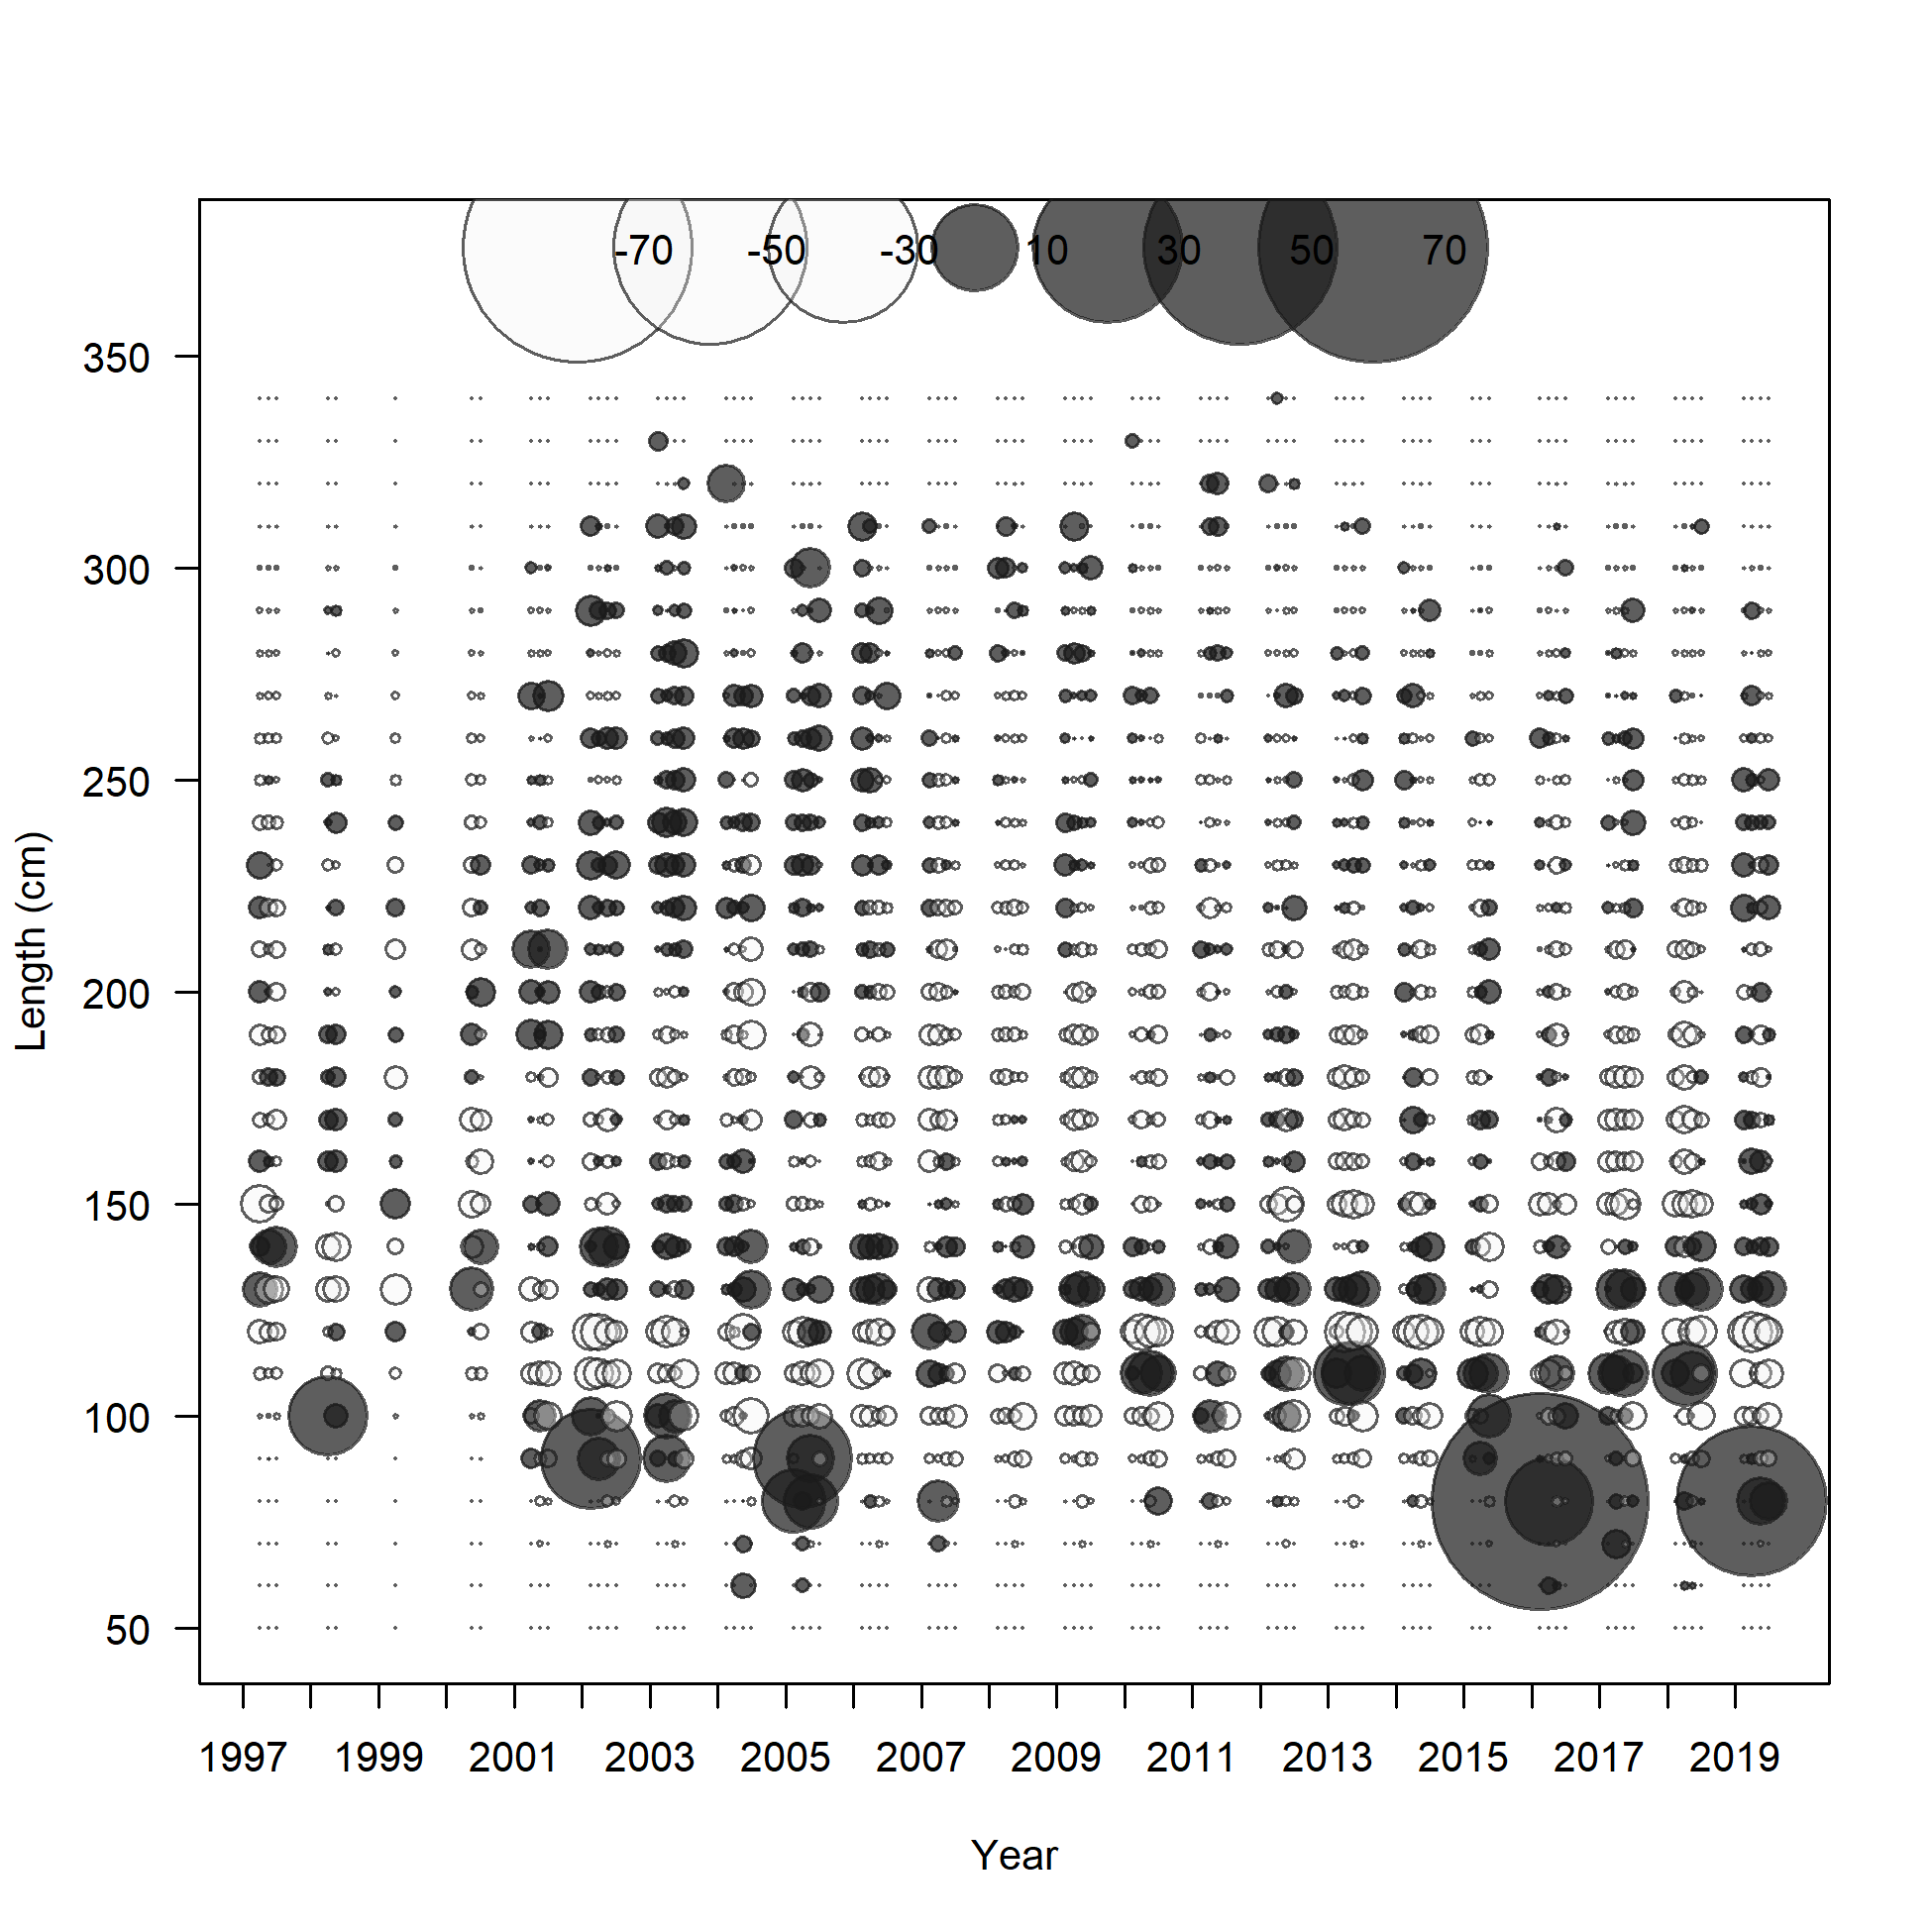
Pearson residuals, whole catch, ESP_Coast (max=62.43) (plot 4 of 4)
Closed bubbles are positive residuals (observed > expected) and open bubbles are negative residuals (observed < expected).
file: comp_lenfit_residsflt6mkt0_page4.png

N-EffN comparison, Length comps, whole catch, ESP_Coast
file: comp_lenfit_sampsize_flt6mkt0.png
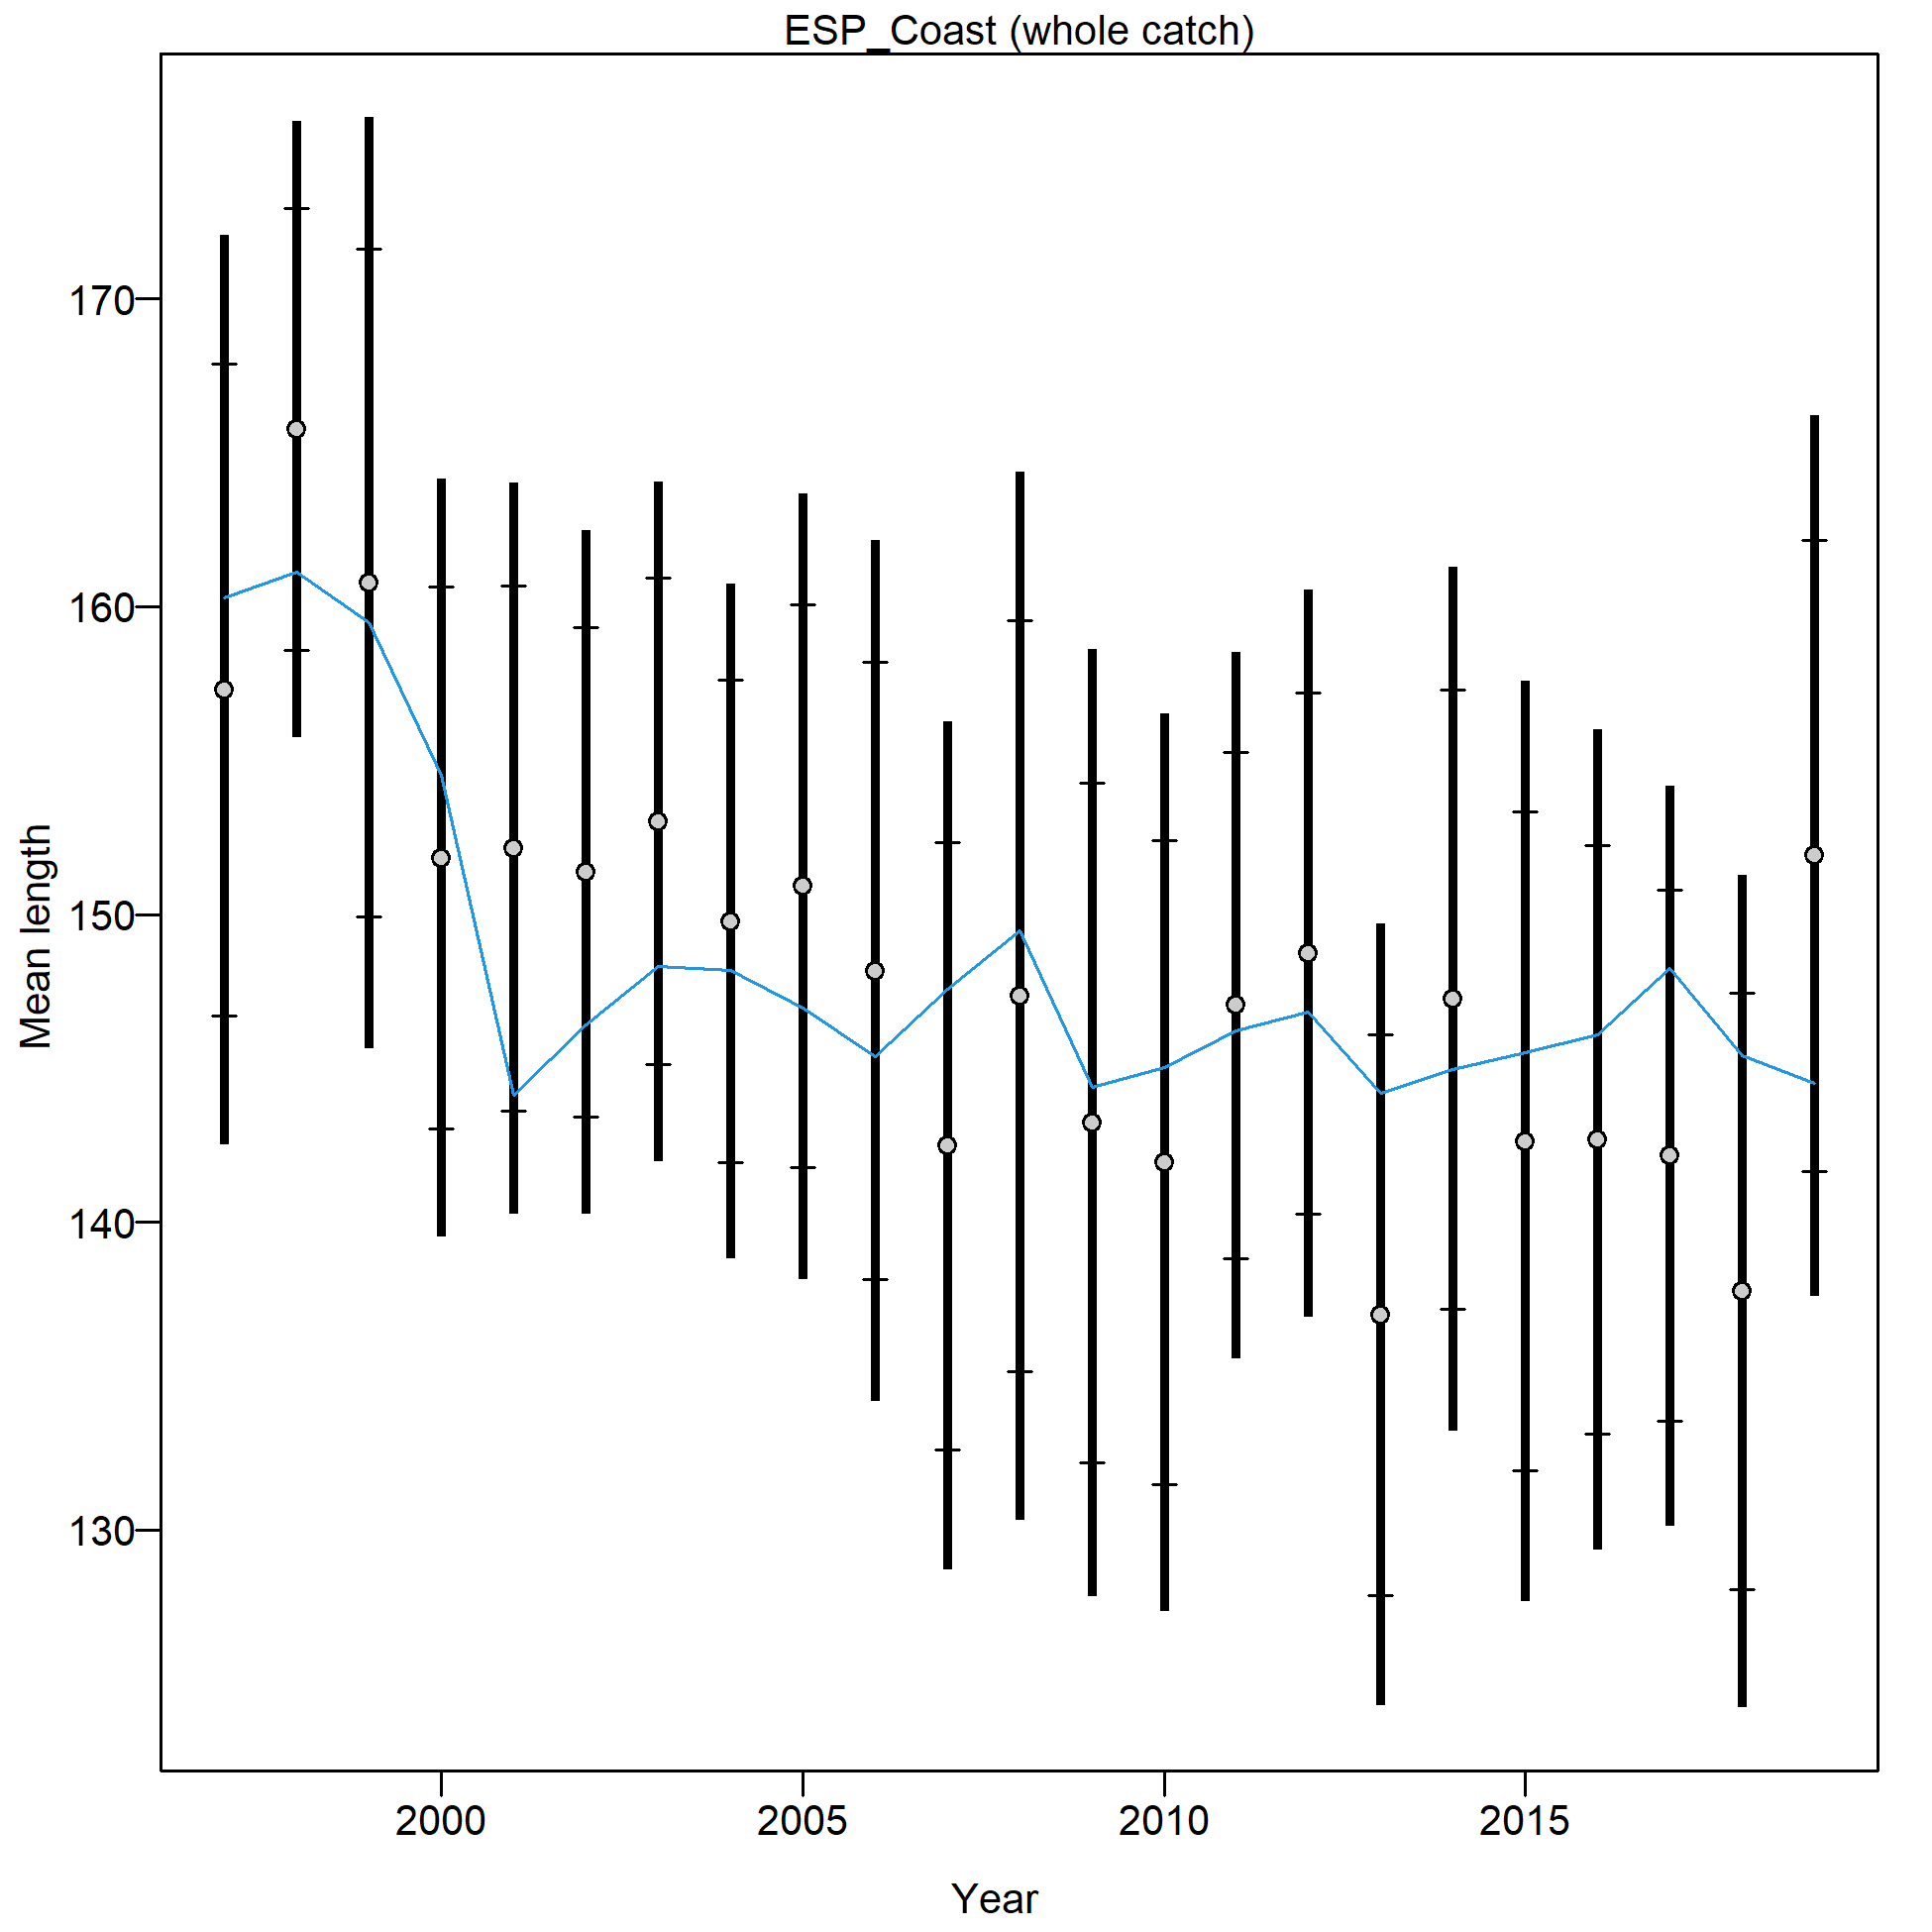
Mean length for ESP_Coast with 95% confidence intervals based on current samples sizes.
Francis data weighting method TA1.8: thinner intervals (with capped ends) show result of further adjusting sample sizes based on suggested multiplier (with 95% interval) for len data from ESP_Coast:
1.9461 (1.3817-3.4361)
For more info, see
Francis, R.I.C.C. (2011). Data weighting in statistical fisheries stock assessment models. Can. J. Fish. Aquat. Sci. 68: 1124-1138. https://doi.org/10.1139/f2011-025
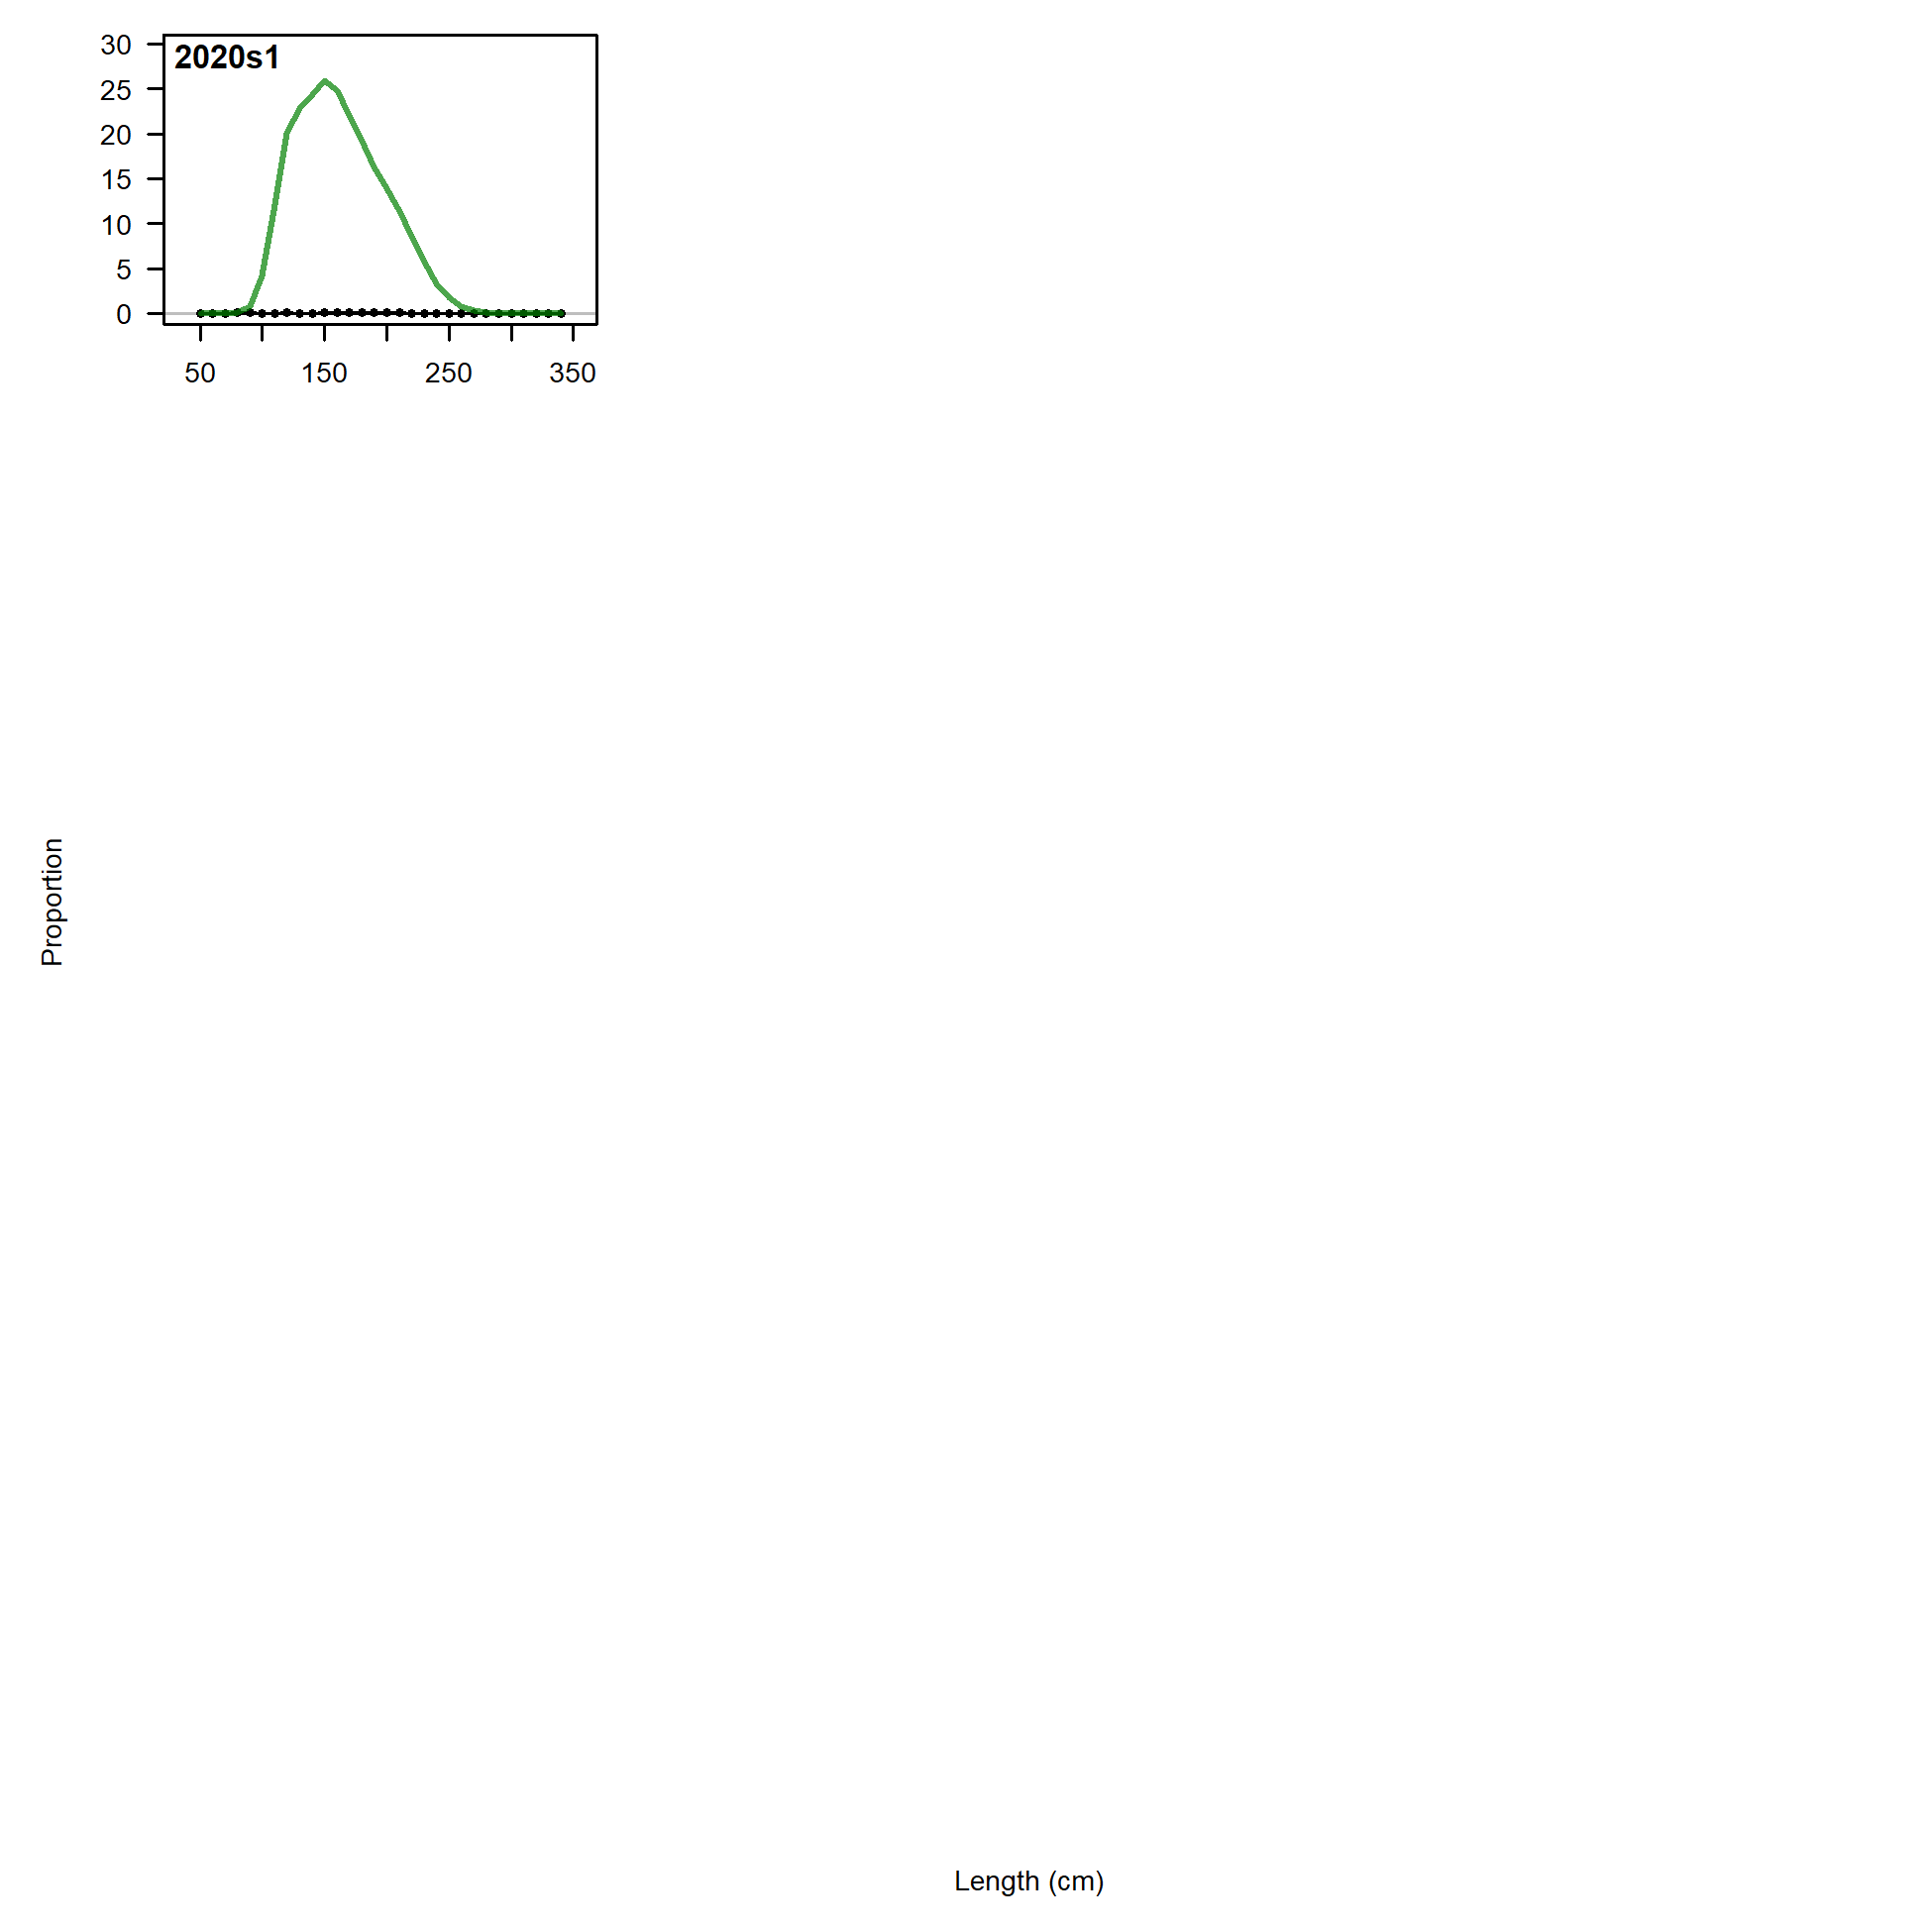
Ghost length comps, whole catch, JPN+Like.
'N adj.' is the input sample size after data-weighting adjustment. N eff. is the calculated effective sample size used in the McAllister-Ianelli tuning method.
file: comp_gstlenfit_flt3mkt0.png

Pearson residuals, whole catch, JPN+Like (max=NA)
Closed bubbles are positive residuals (observed > expected) and open bubbles are negative residuals (observed < expected).
file: comp_gstlenfit_residsflt3mkt0.png
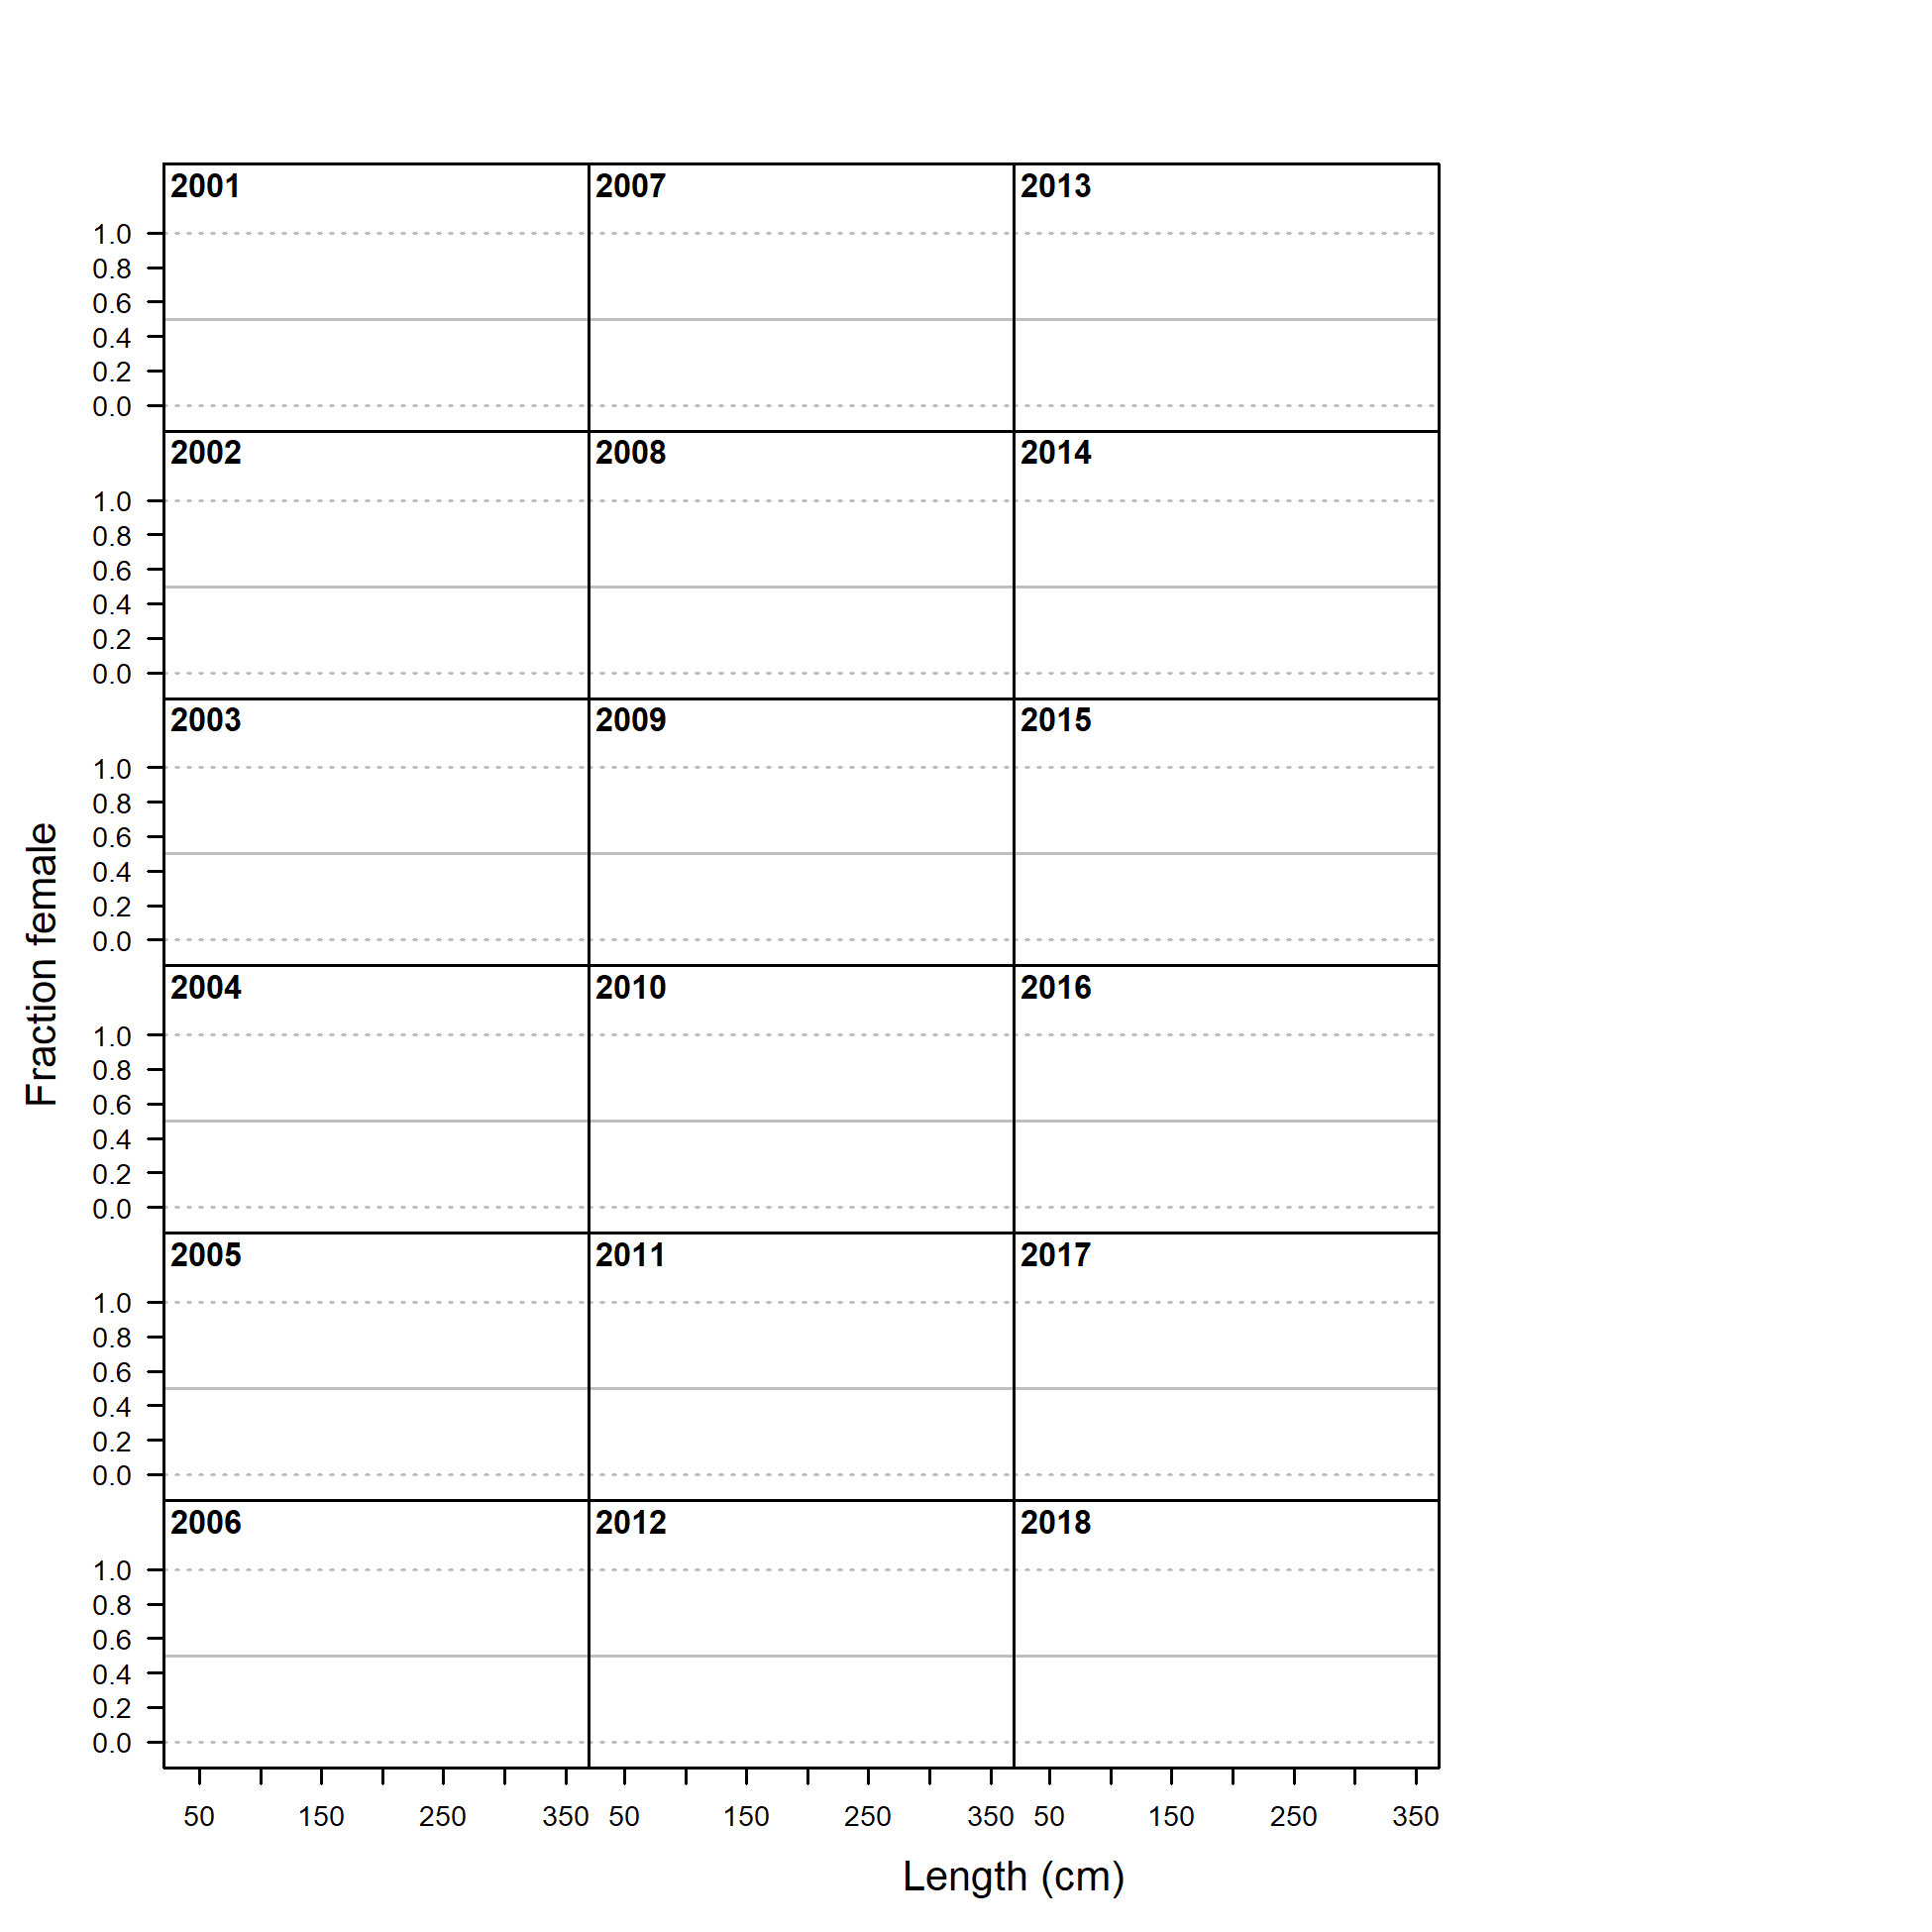
Sex ratios for length comps, whole catch, CHL_LL.
Observed sex ratios (points) with 75% intervals (vertical lines) calculated as a Jeffreys interval based on the adjusted input sample size. The model expectation is shown in the purple line.
file: sexratio_len_flt1mkt0.png
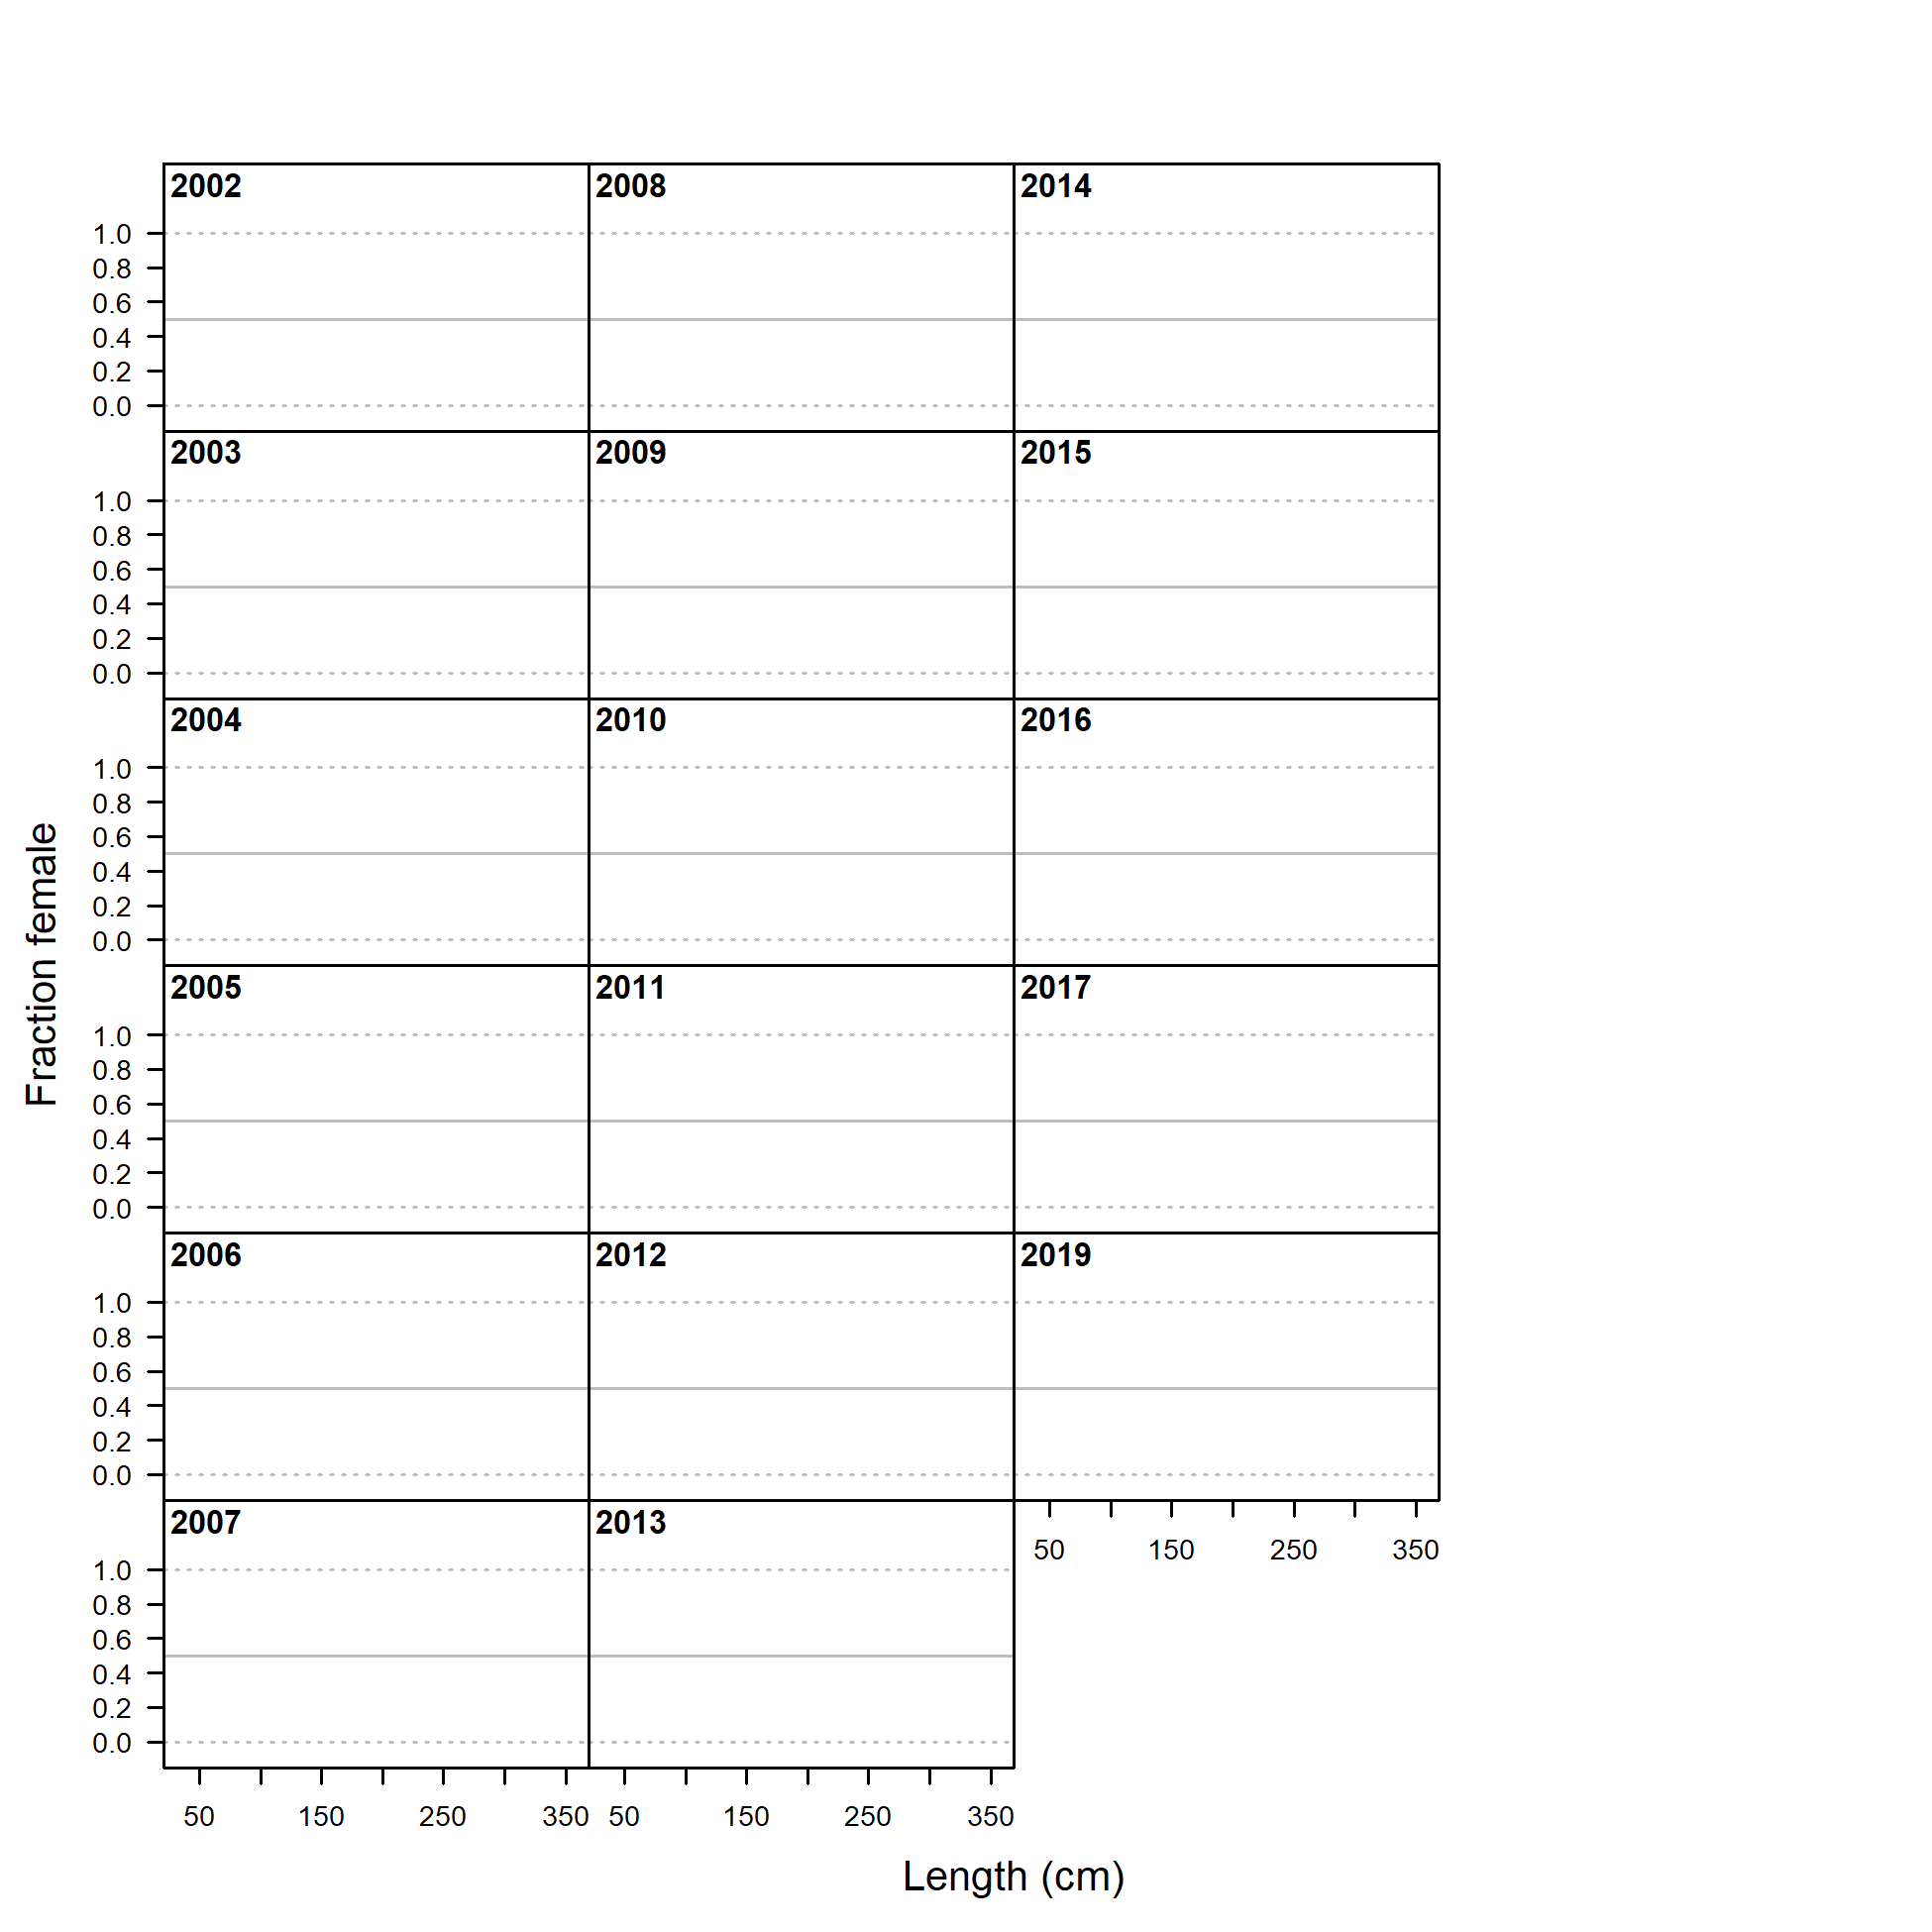
Sex ratios for length comps, whole catch, CHL+PER.
Observed sex ratios (points) with 75% intervals (vertical lines) calculated as a Jeffreys interval based on the adjusted input sample size. The model expectation is shown in the purple line.
file: sexratio_len_flt2mkt0.png