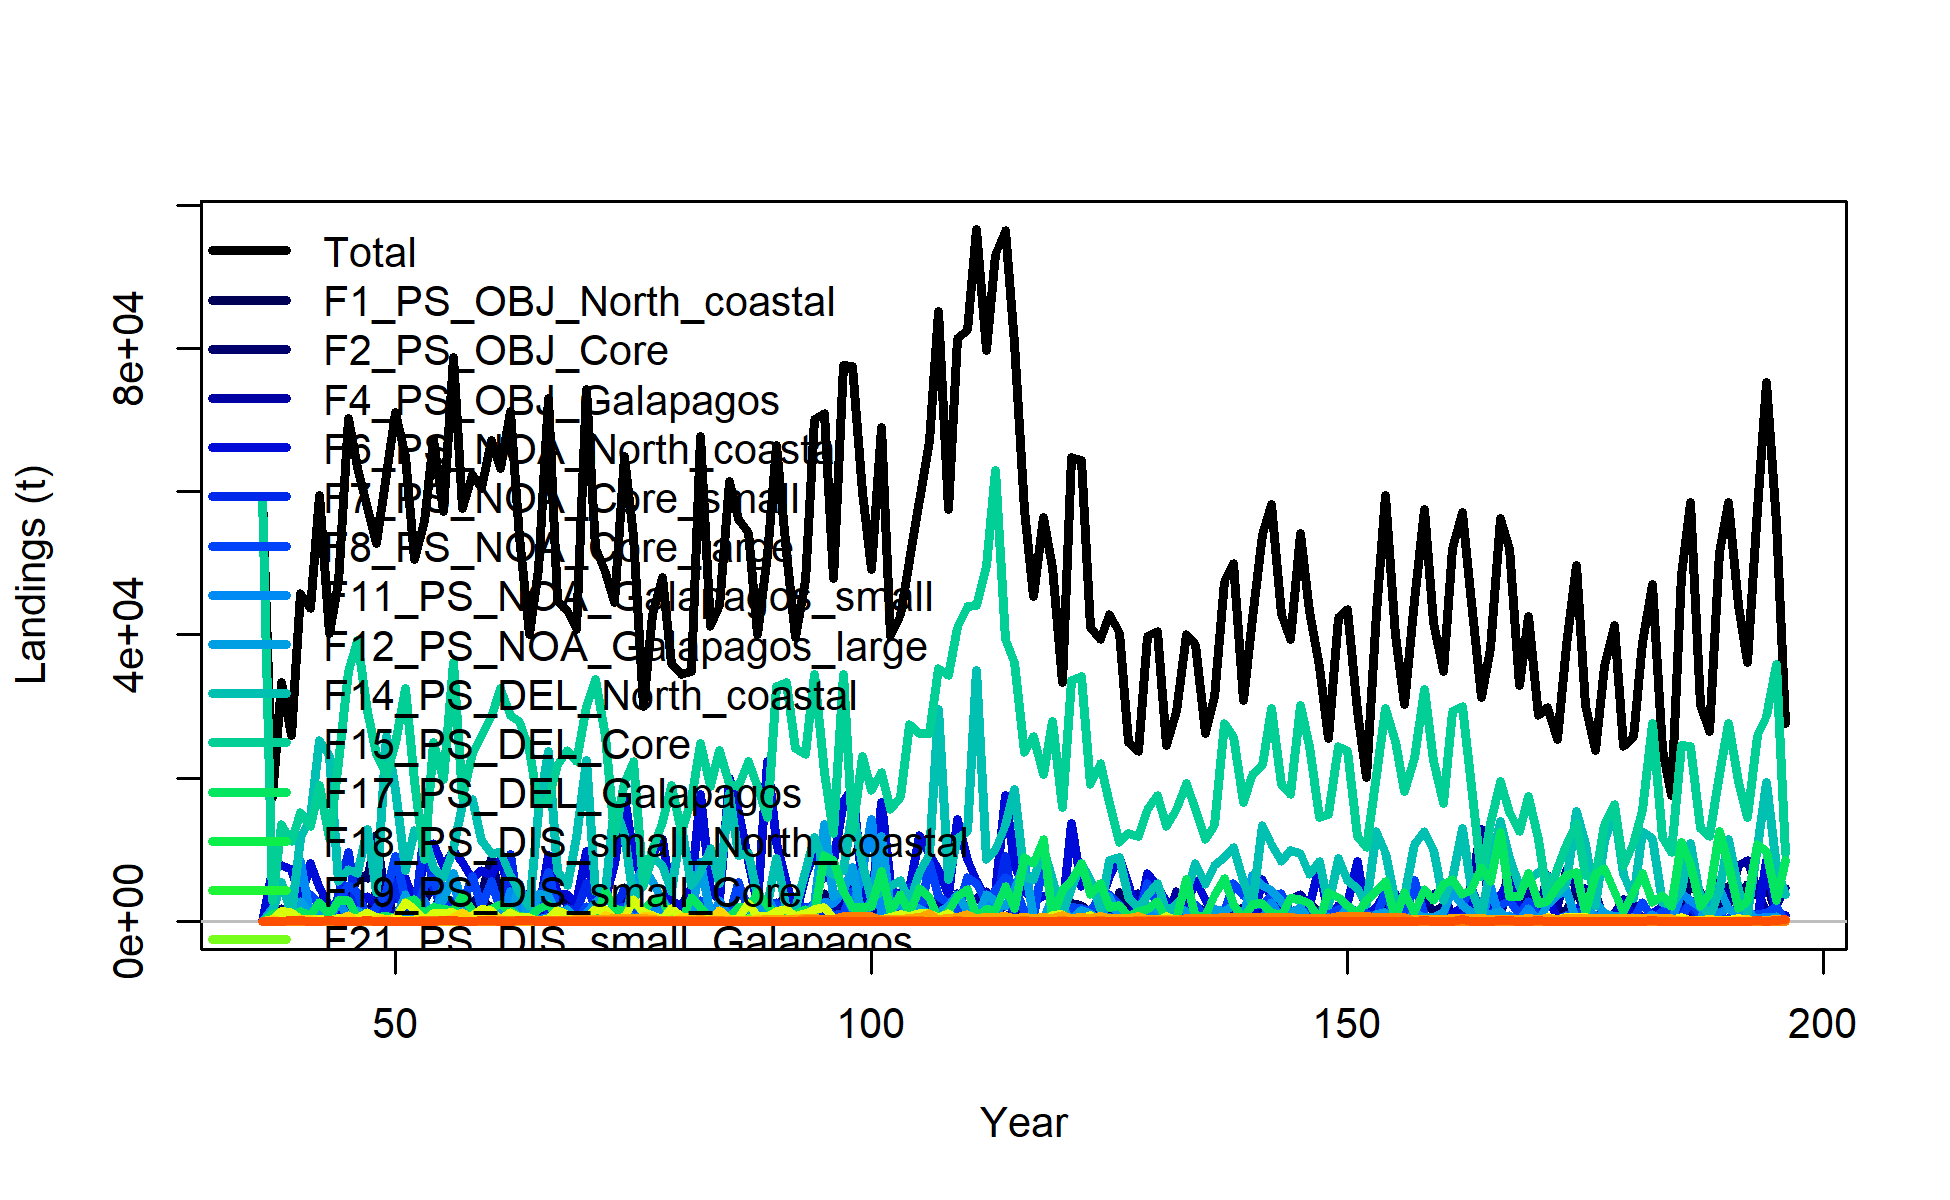
landings
file: catch1_landings.png
landings
file: catch1_landings.png
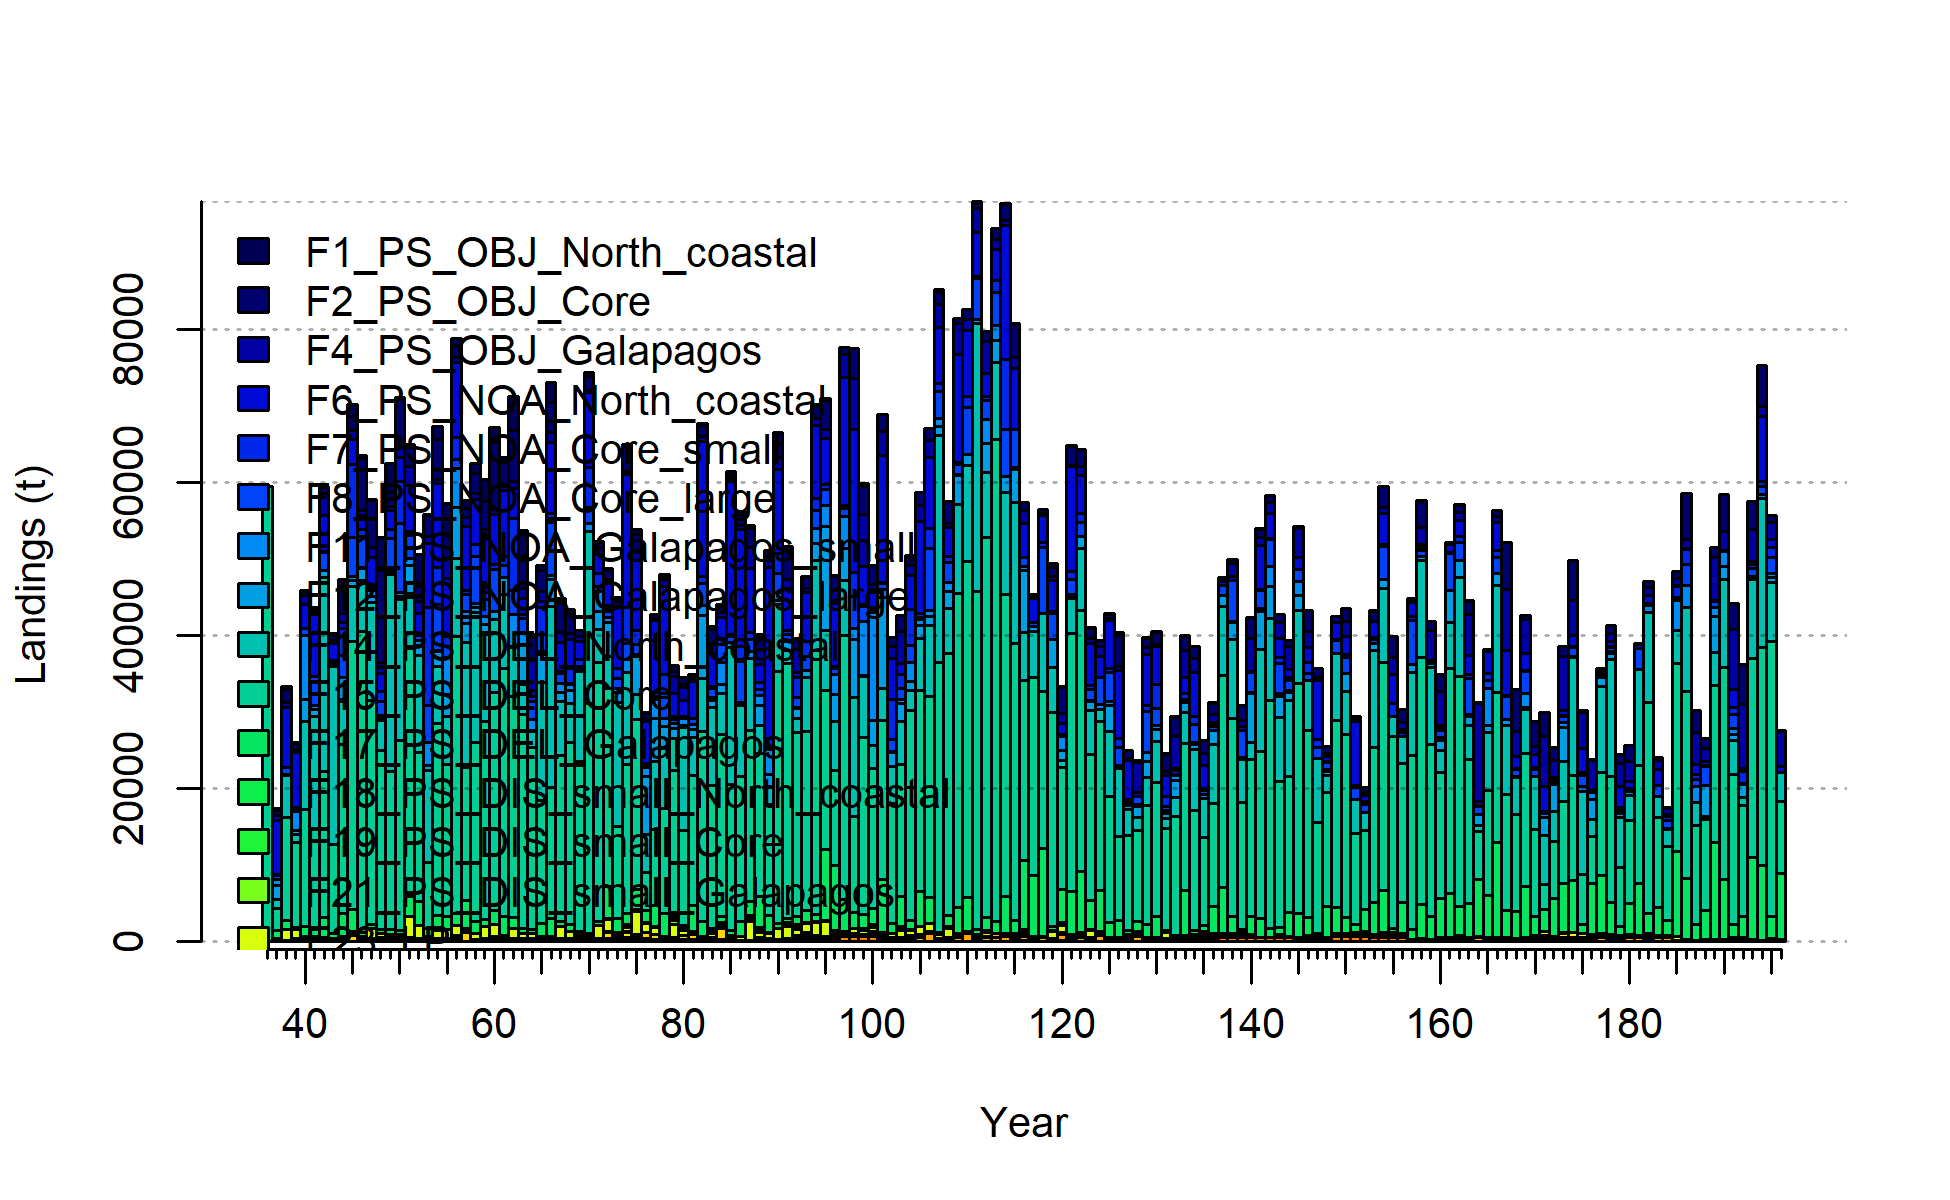
landings_stacked
file: catch2_landings_stacked.png
.png)
observed_and_expected_landings_(if_different). Catch input in numbers is compared here to catch in biomass, making this figure less useful for models like this with catch in numbers. Future versions of this plot will be improve to compare catch in the same units.
file: catch3_observed_and_expected_landings_(if_different).png
.png)
total_catch_(including_discards)
file: catch4_total_catch_(including_discards).png
_stacked.png)
total_catch_(including_discards)_stacked
file: catch5_total_catch_(including_discards)_stacked.png
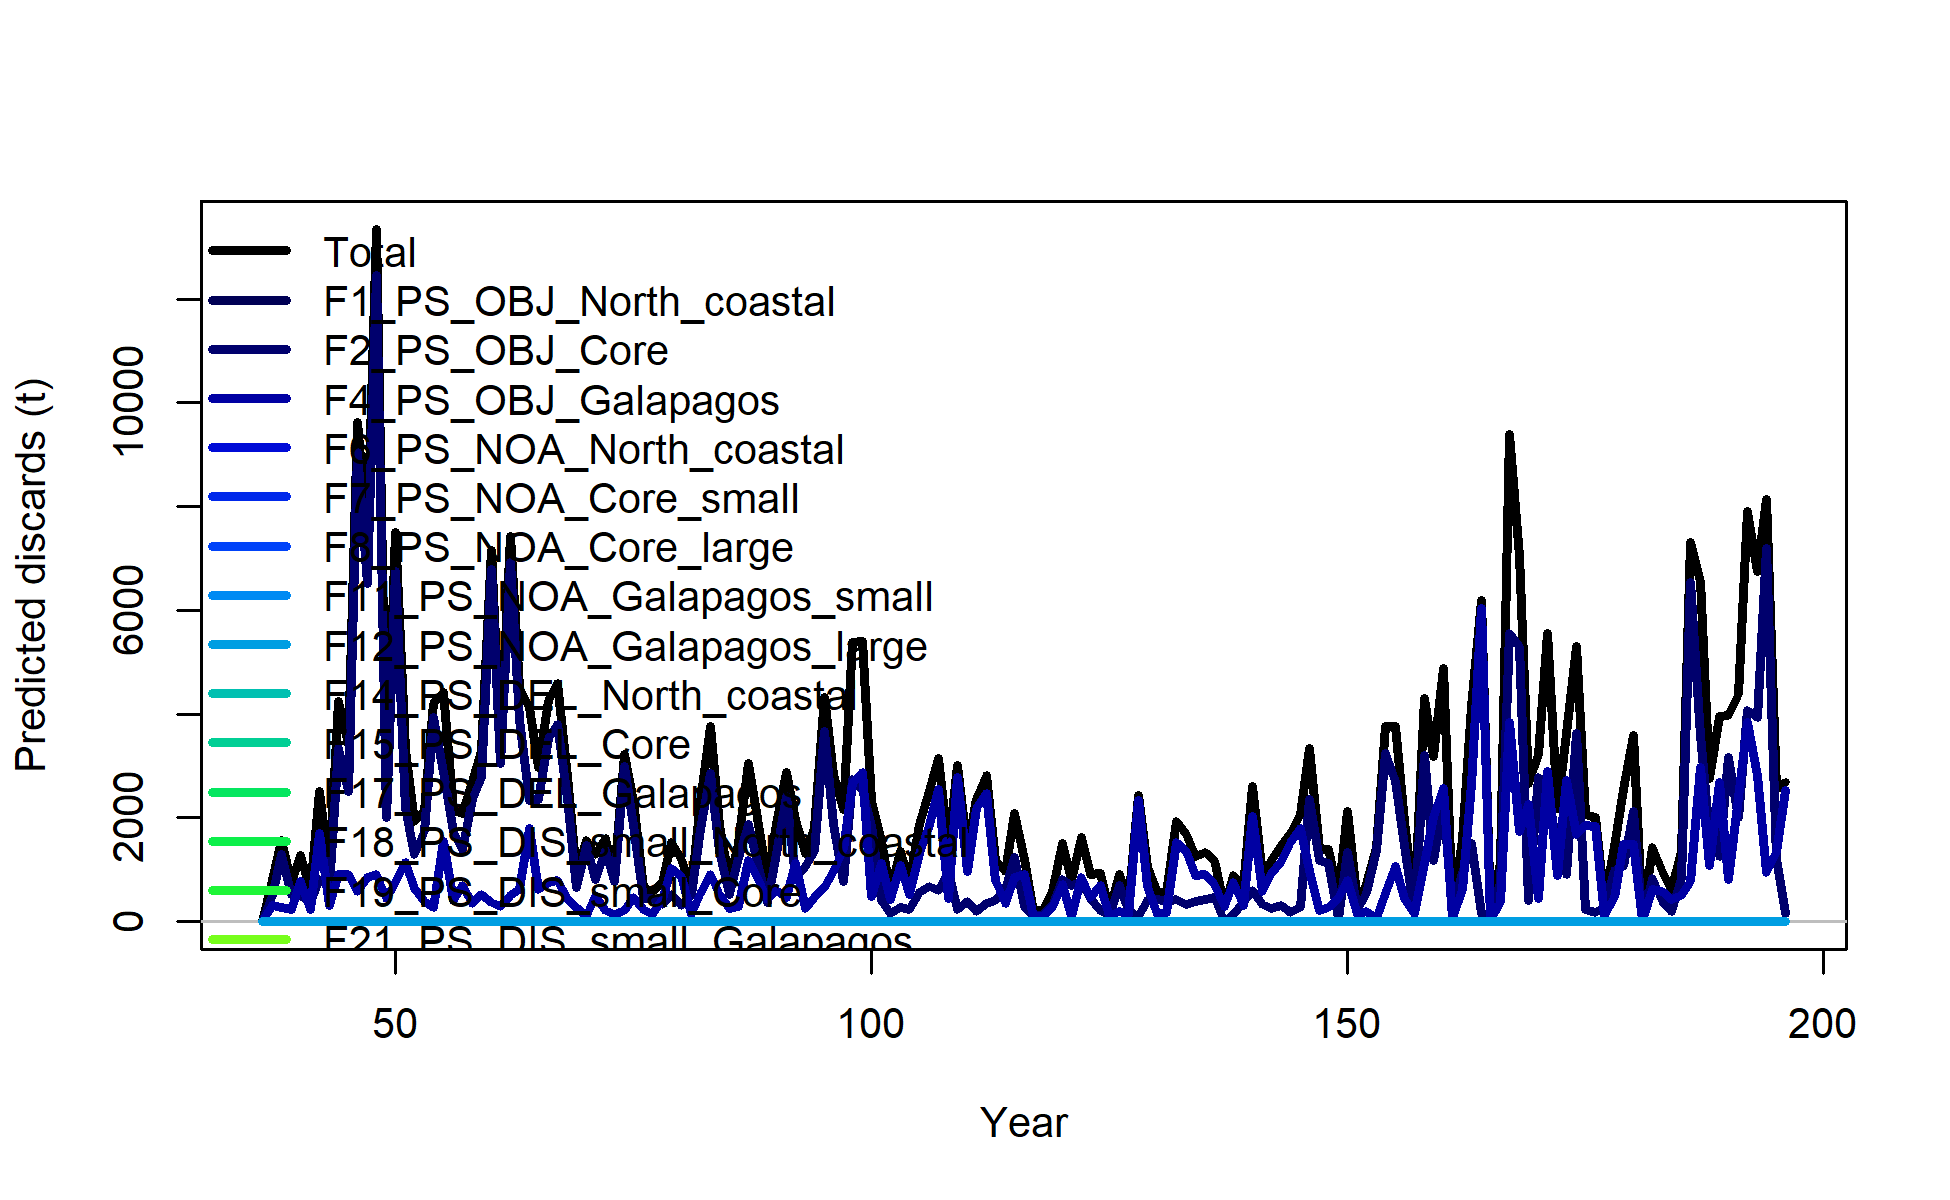
discards
file: catch6_discards.png
.png)
discards_stacked_plot_(depends_on_multiple_fleets)
file: catch7_discards_stacked_plot_(depends_on_multiple_fleets).png
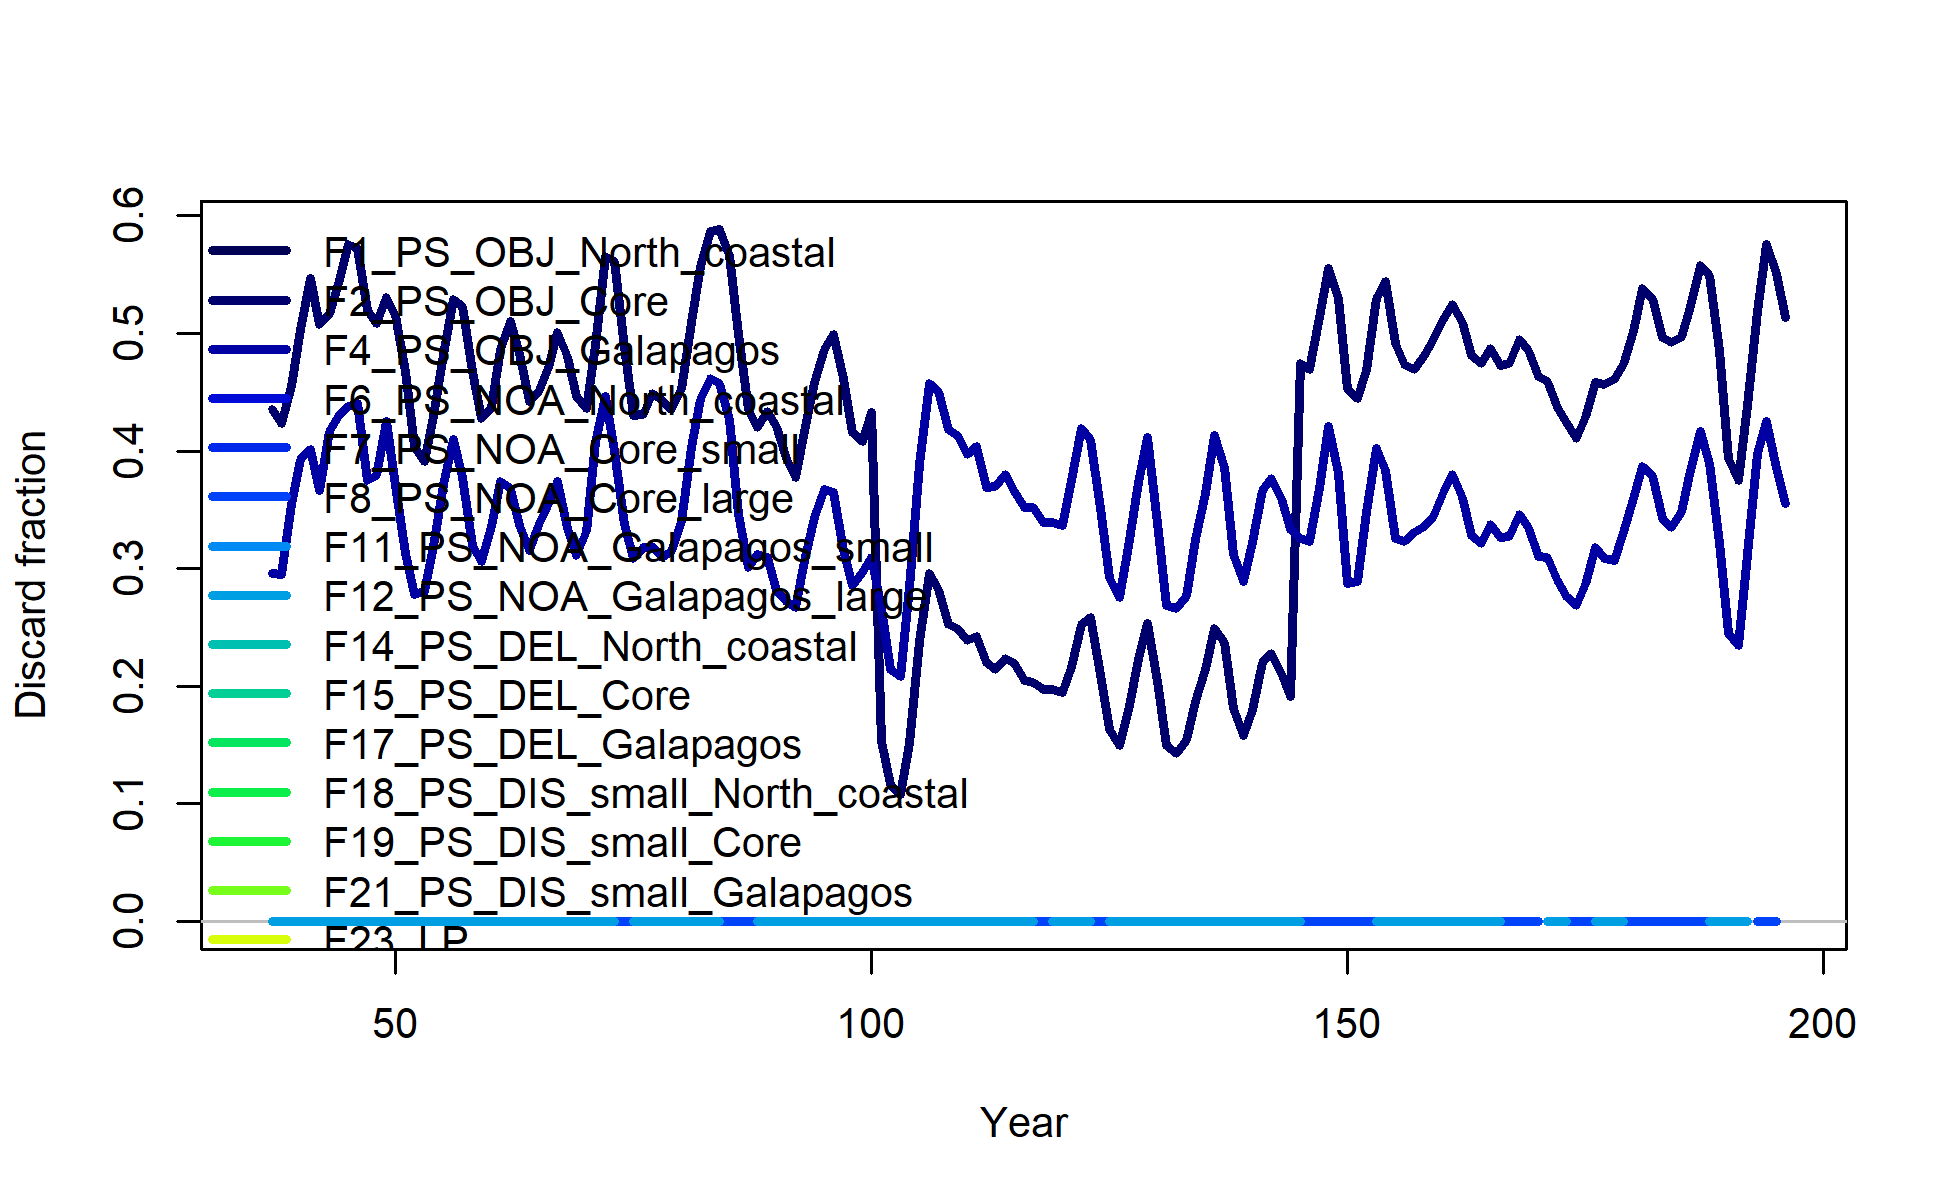
discard_fraction
file: catch8_discard_fraction.png
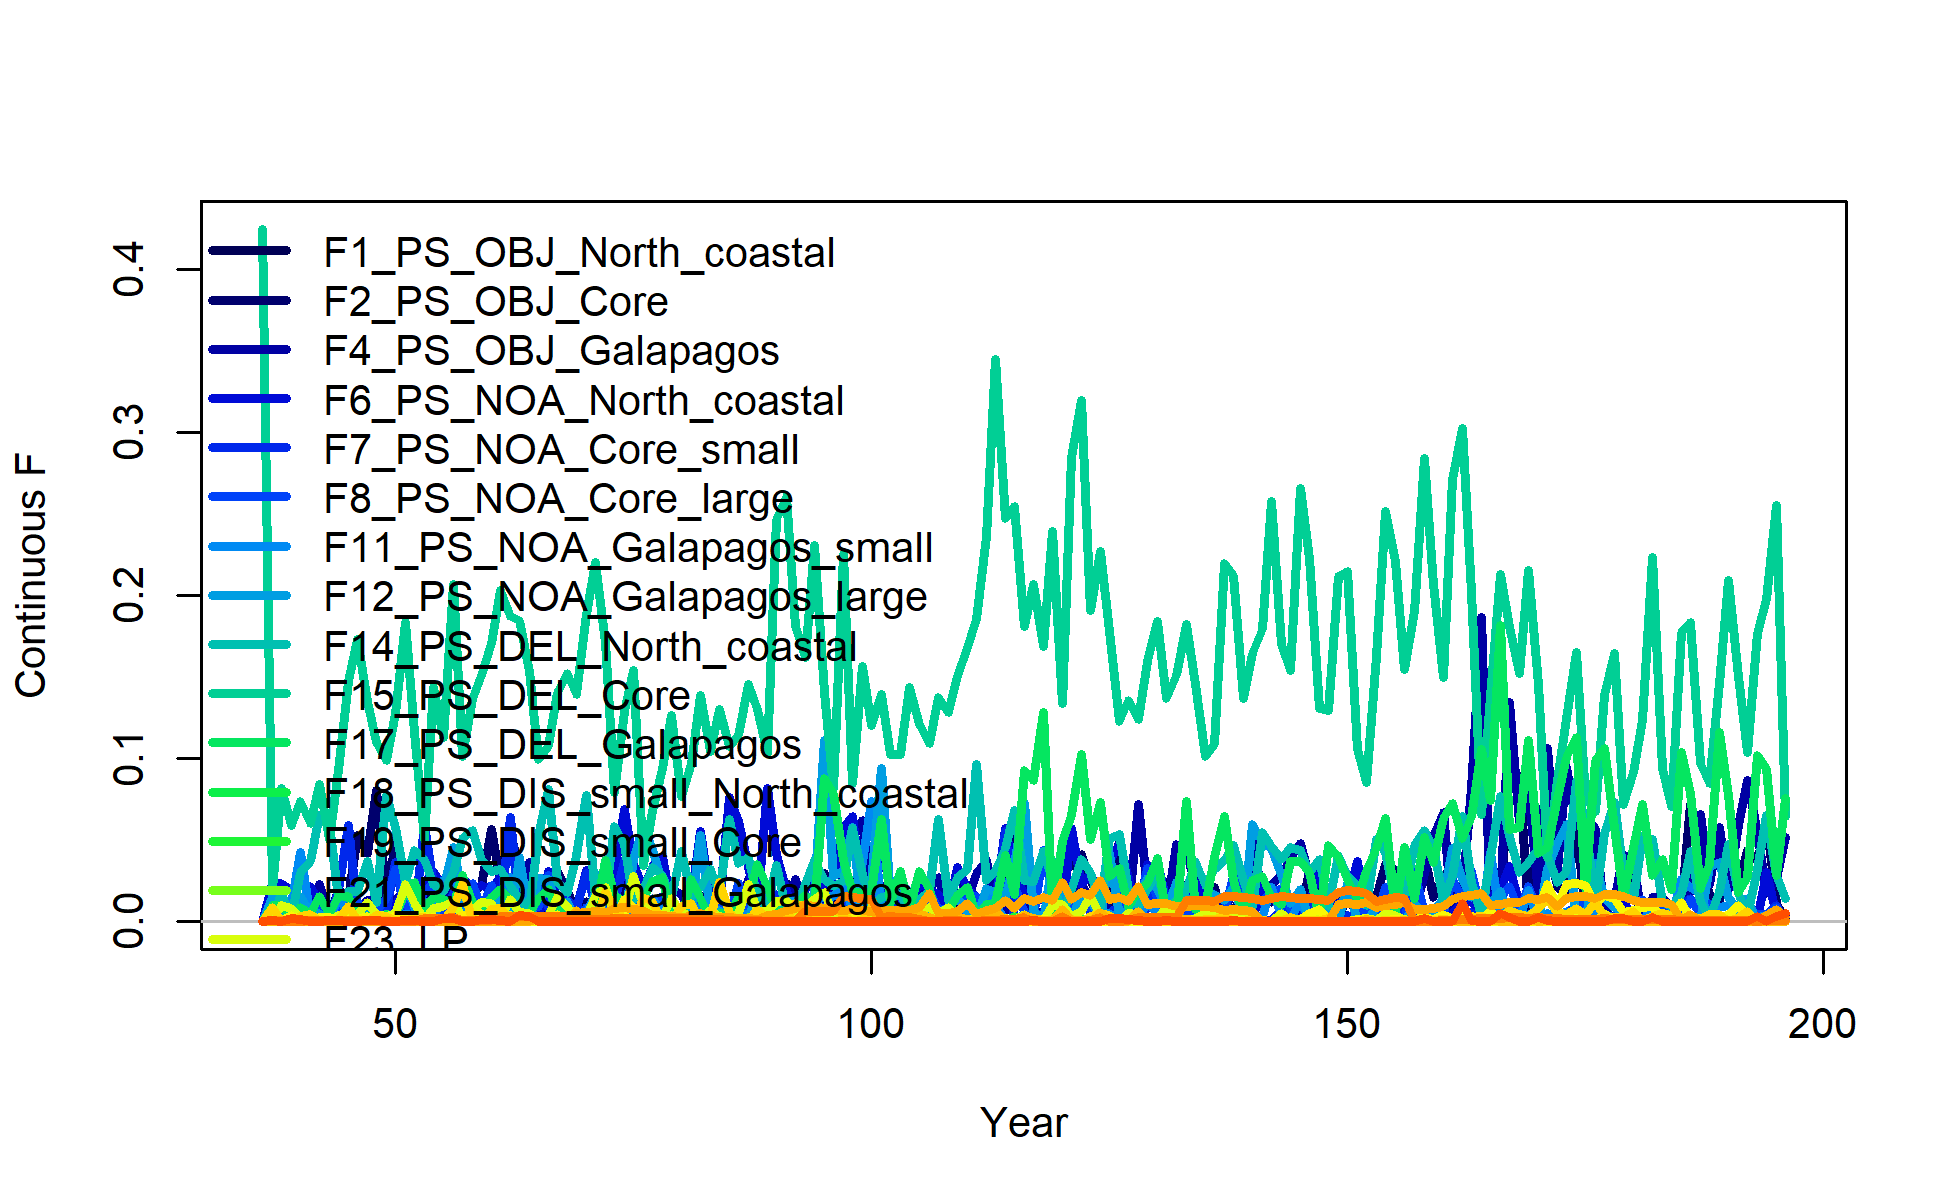
harvest_rate
file: catch9_harvest_rate.png

_landings_+_dead_discards
file: catch16_landings_+_dead_discards.png