
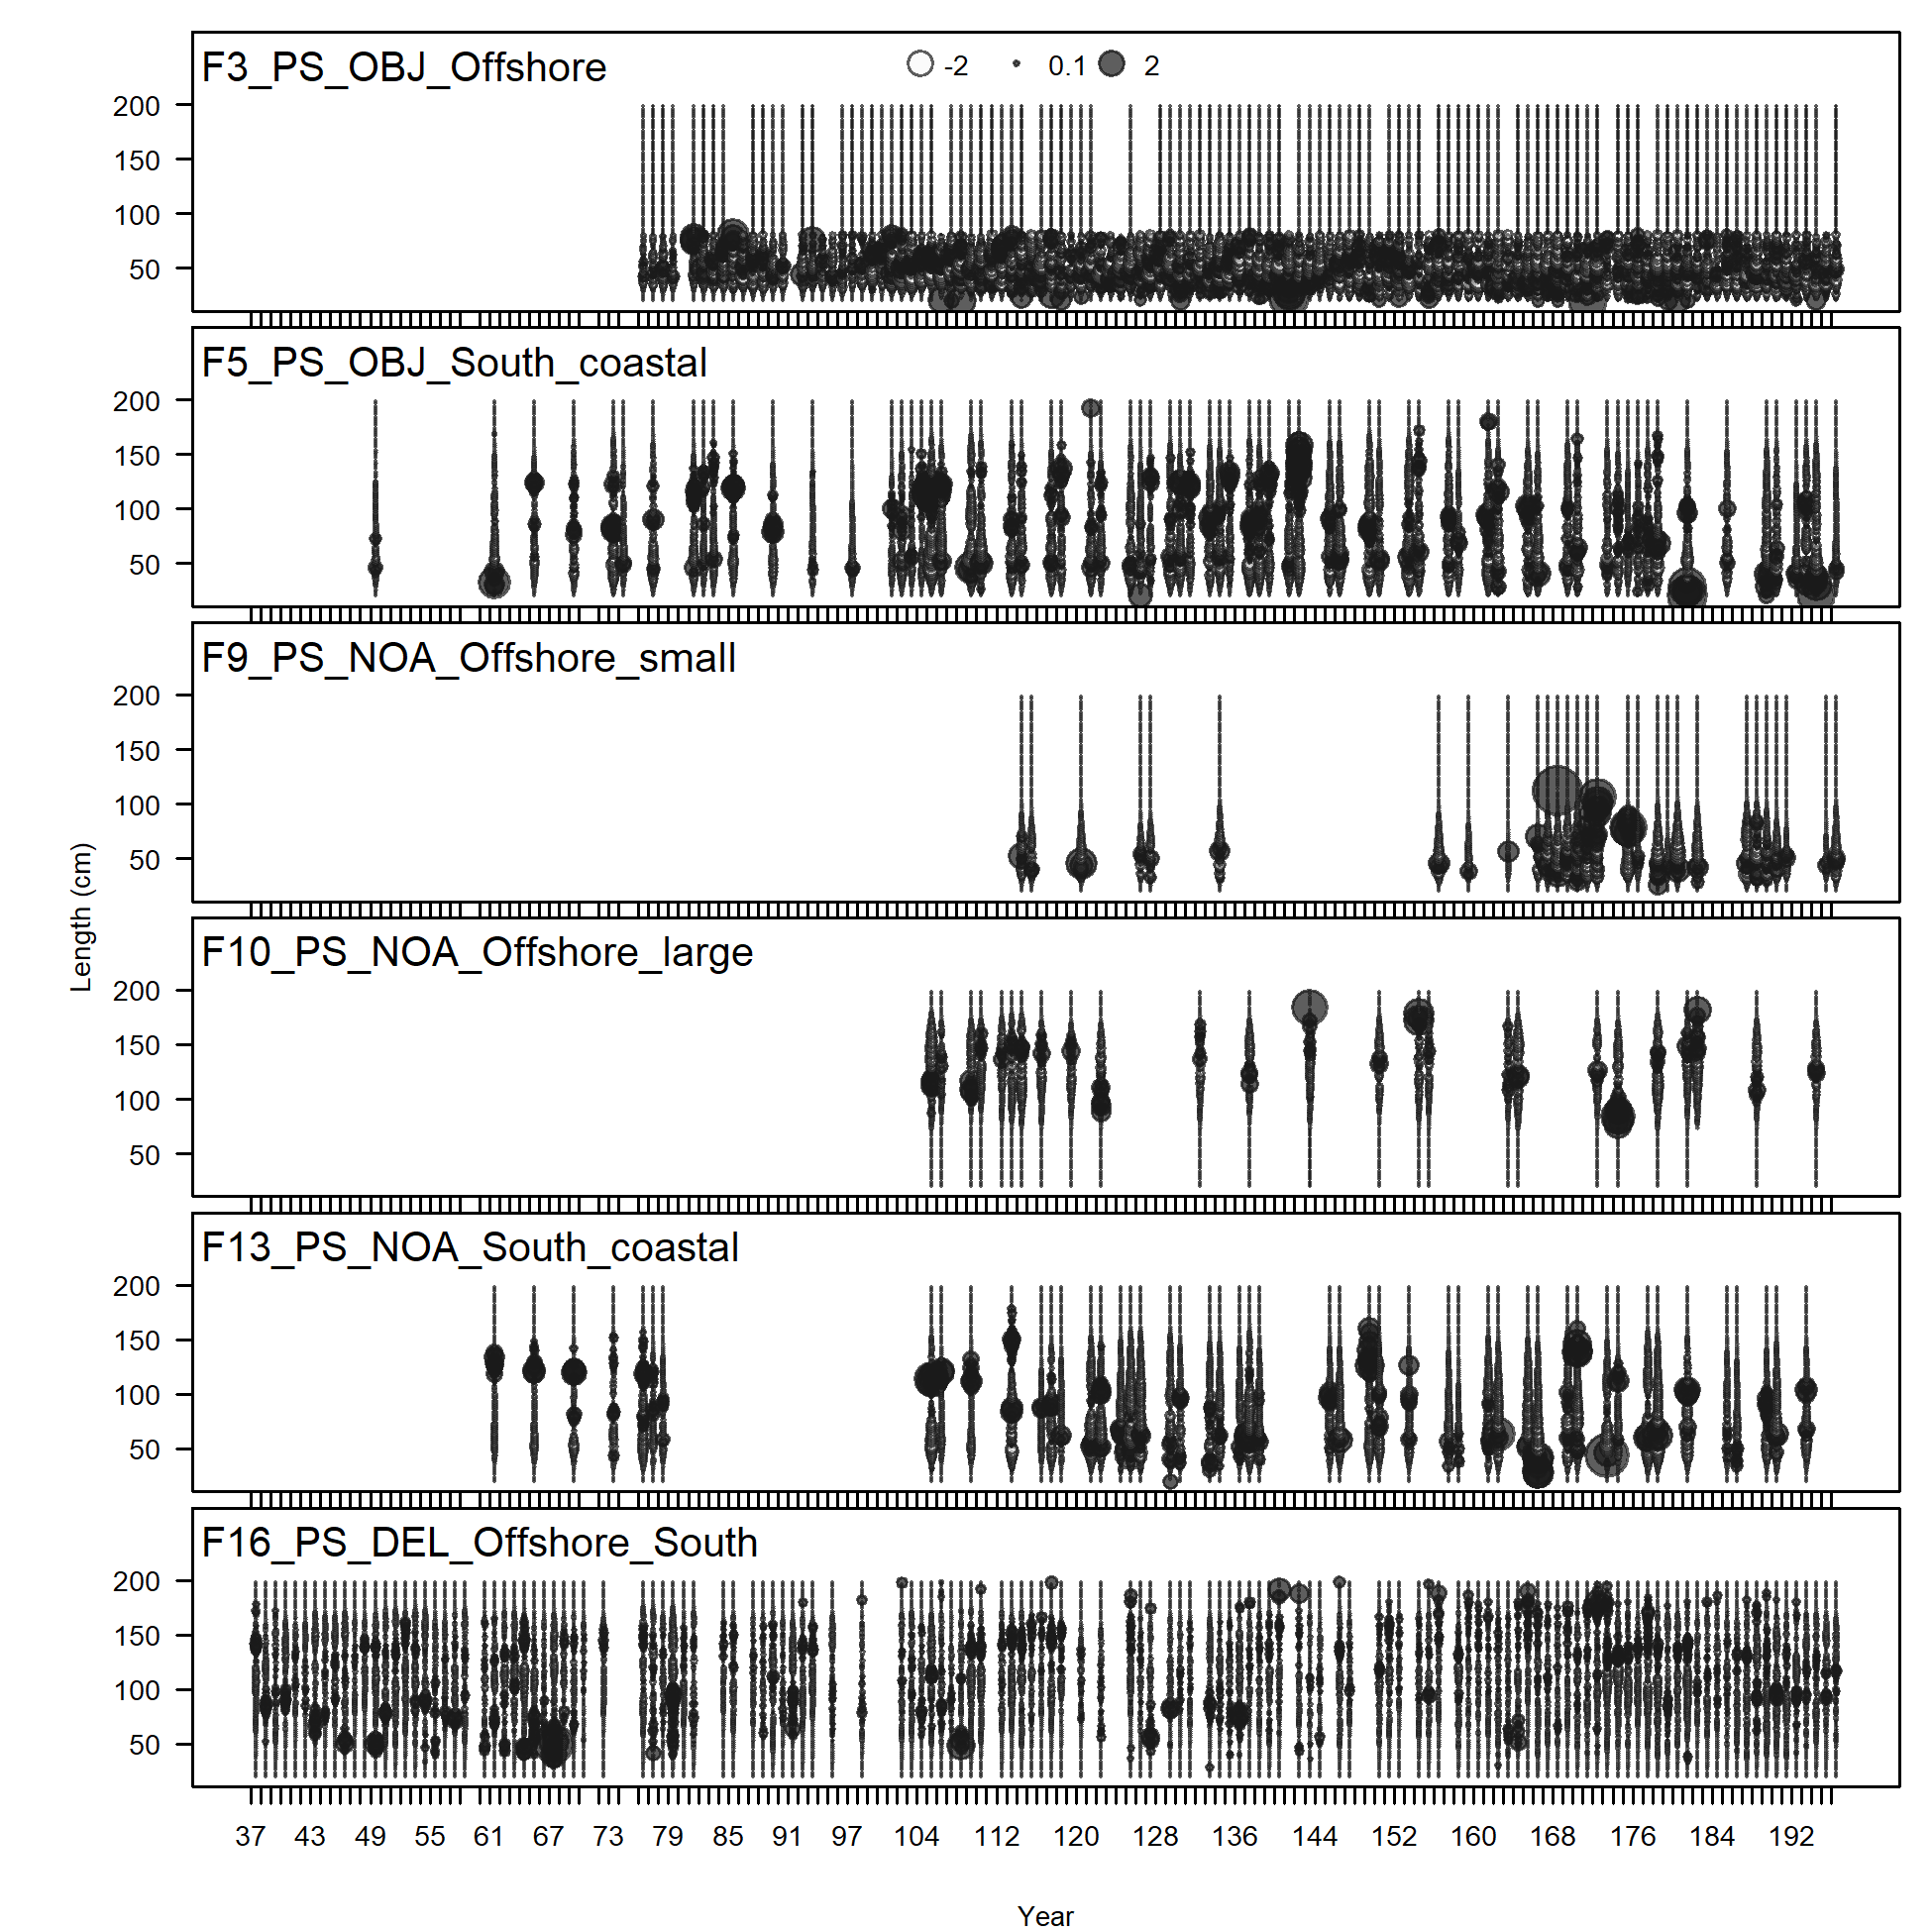
Length comps, aggregated across time by fleet.
Labels 'retained' and 'discard' indicate discarded or retained sampled for each fleet. Panels without this designation represent the whole catch.
file: comp_lenfit__aggregated_across_time.png
Length comps, aggregated across time by fleet.
Labels 'retained' and 'discard' indicate discarded or retained sampled for each fleet. Panels without this designation represent the whole catch.
file: comp_lenfit__aggregated_across_time.png
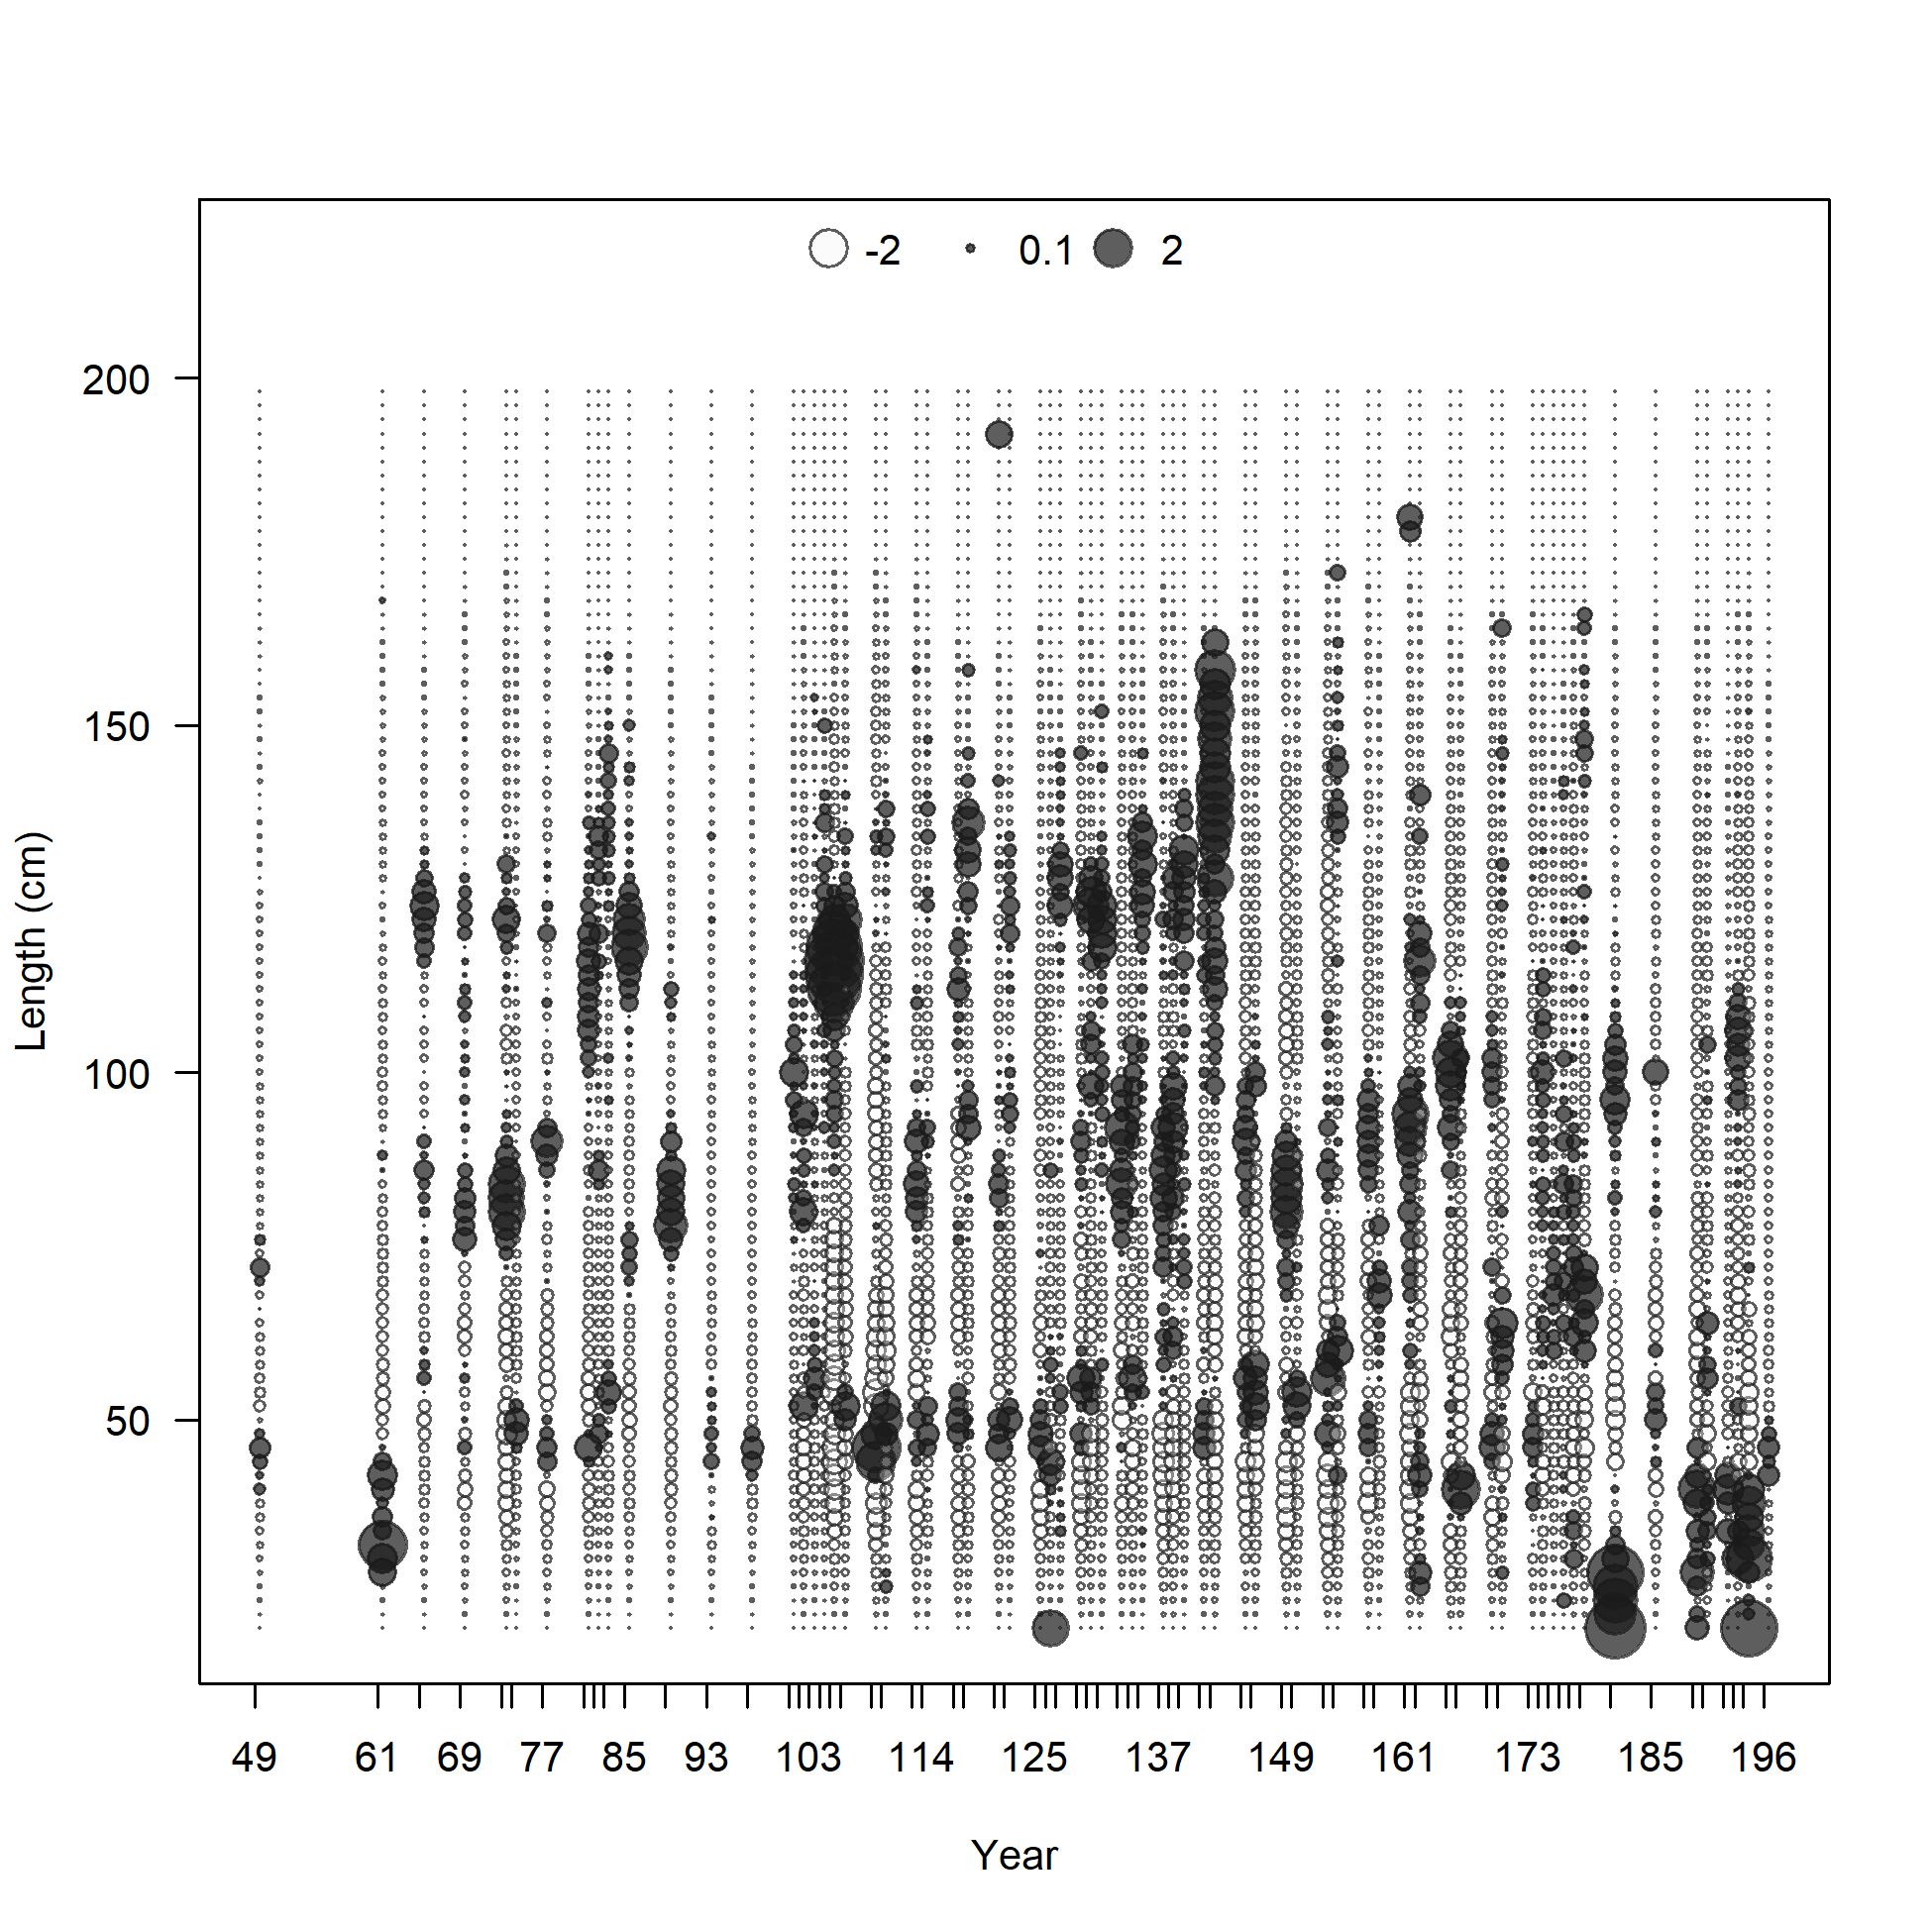
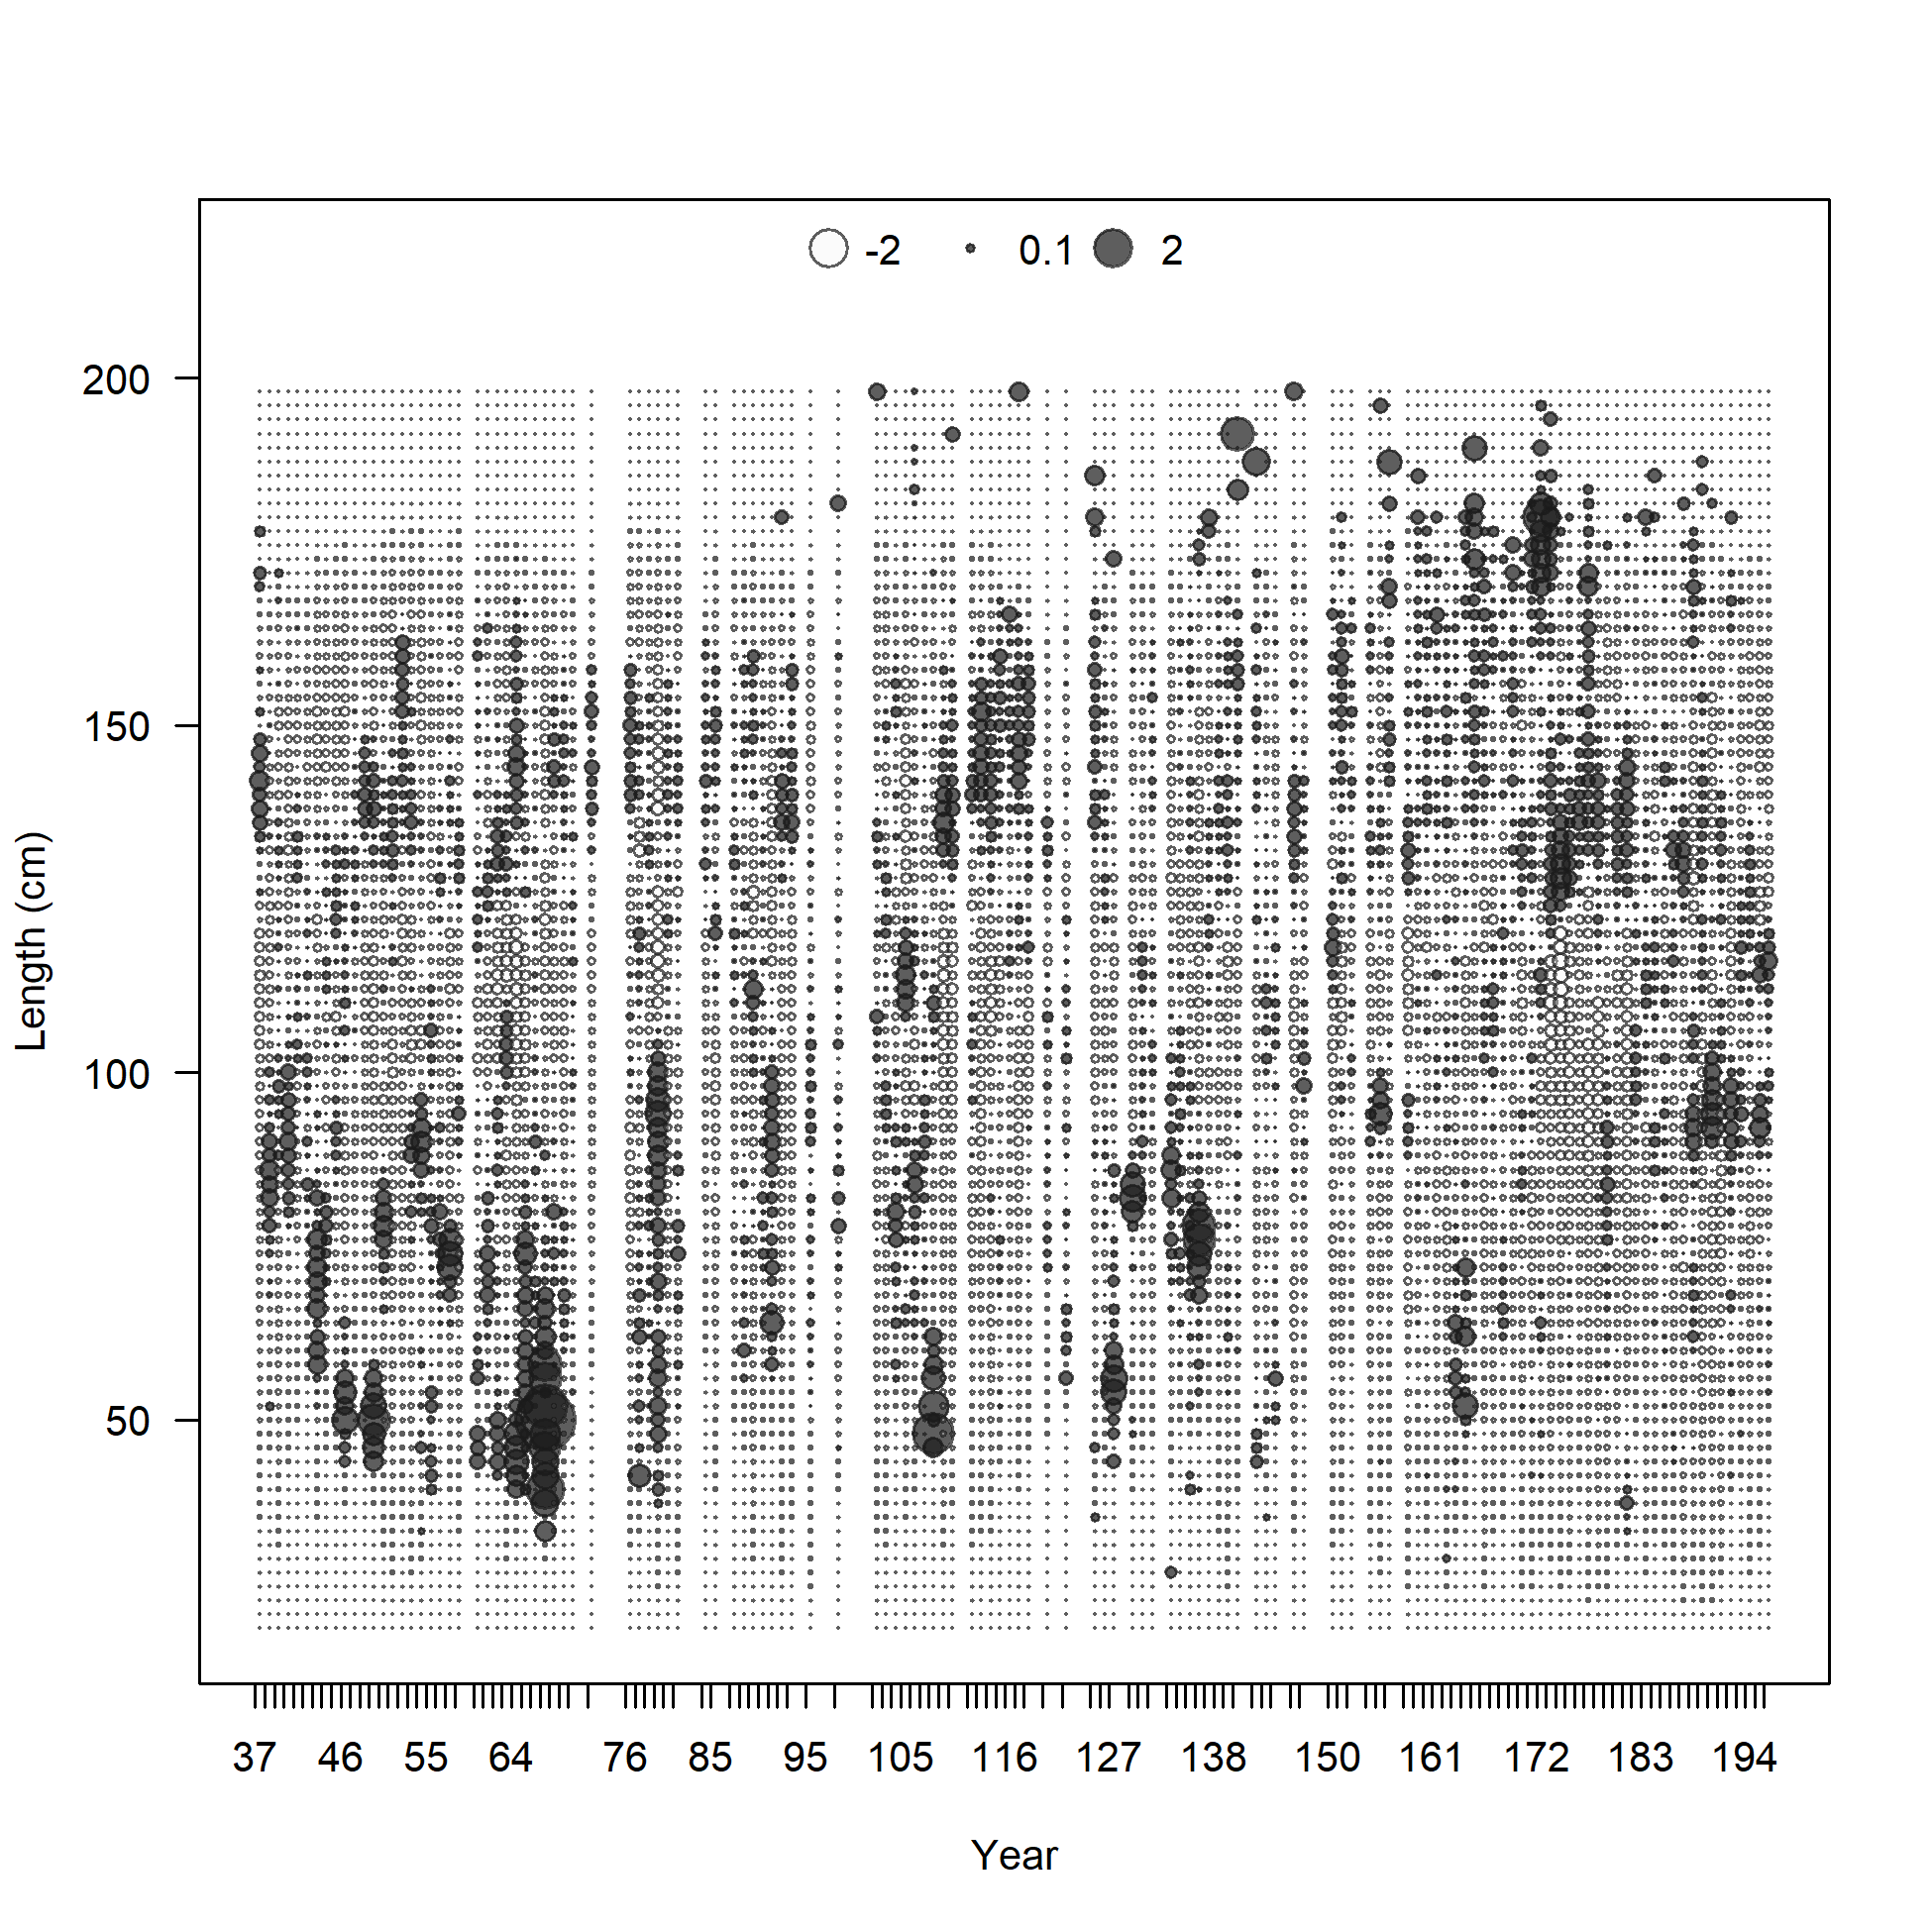
Pearson residuals, comparing across fleets
Closed bubbles are positive residuals (observed > expected) and open bubbles are negative residuals (observed < expected).
file: comp_lenfit__multi-fleet_comparison.png
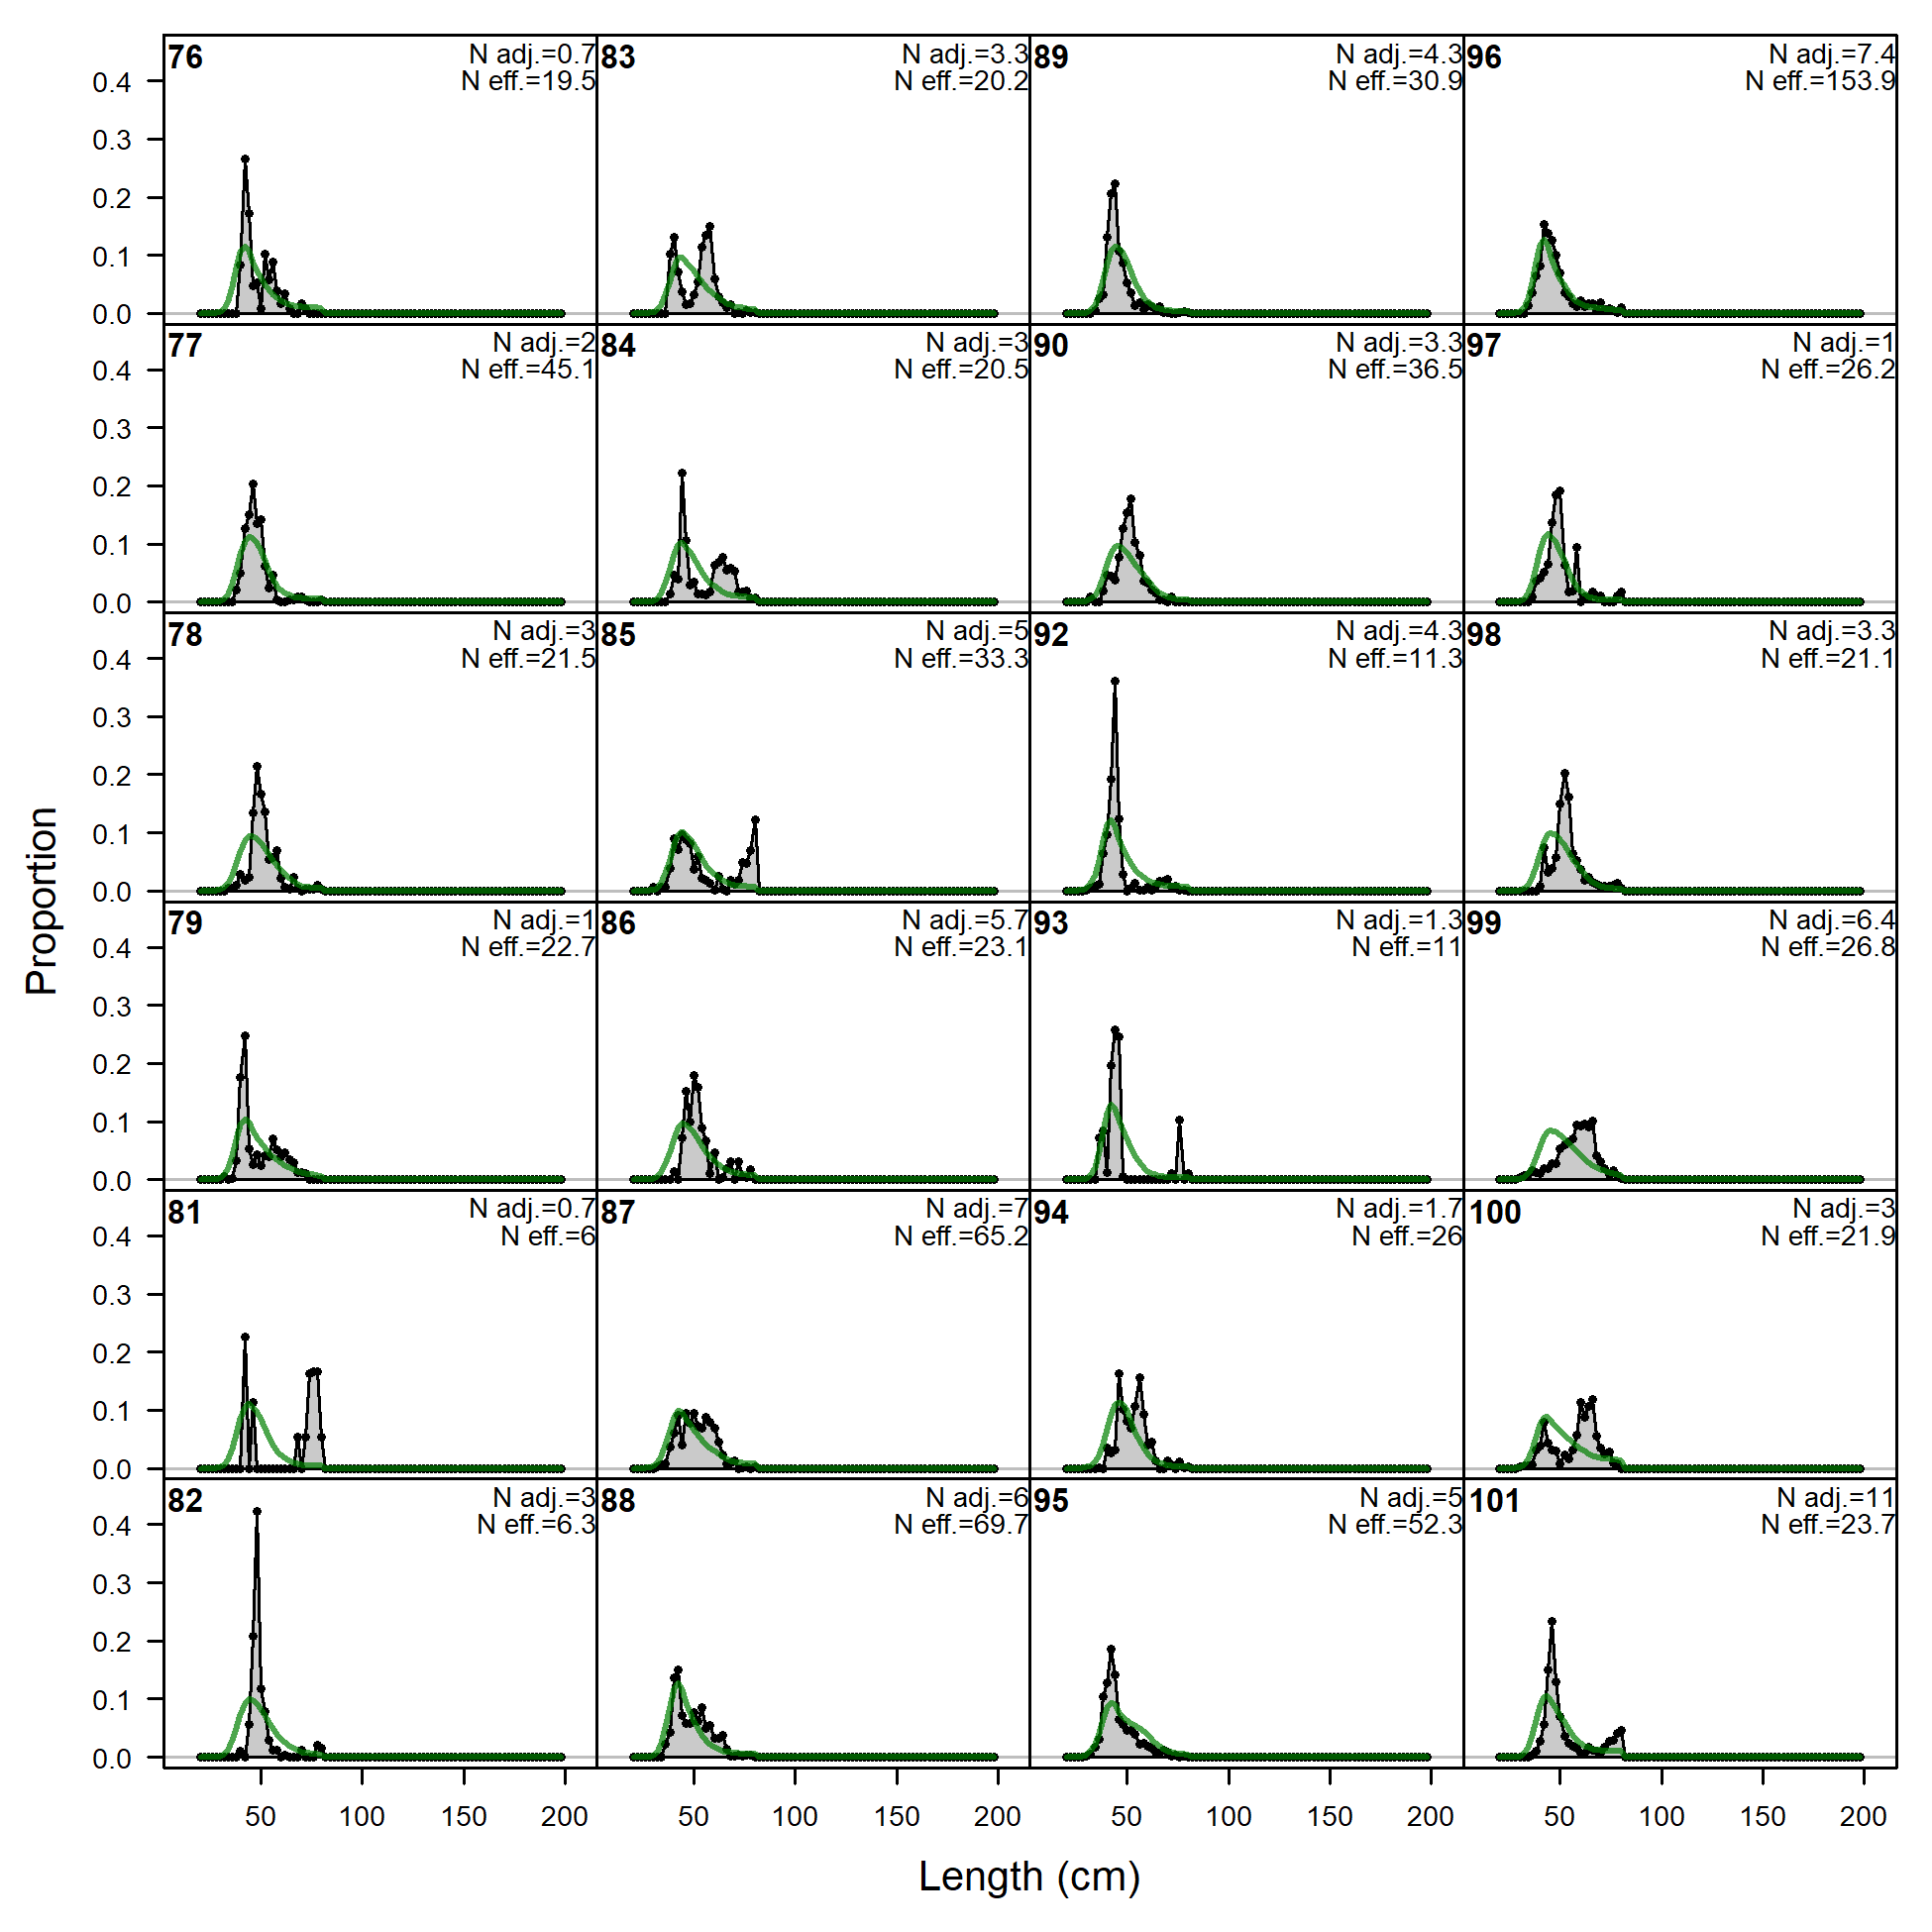
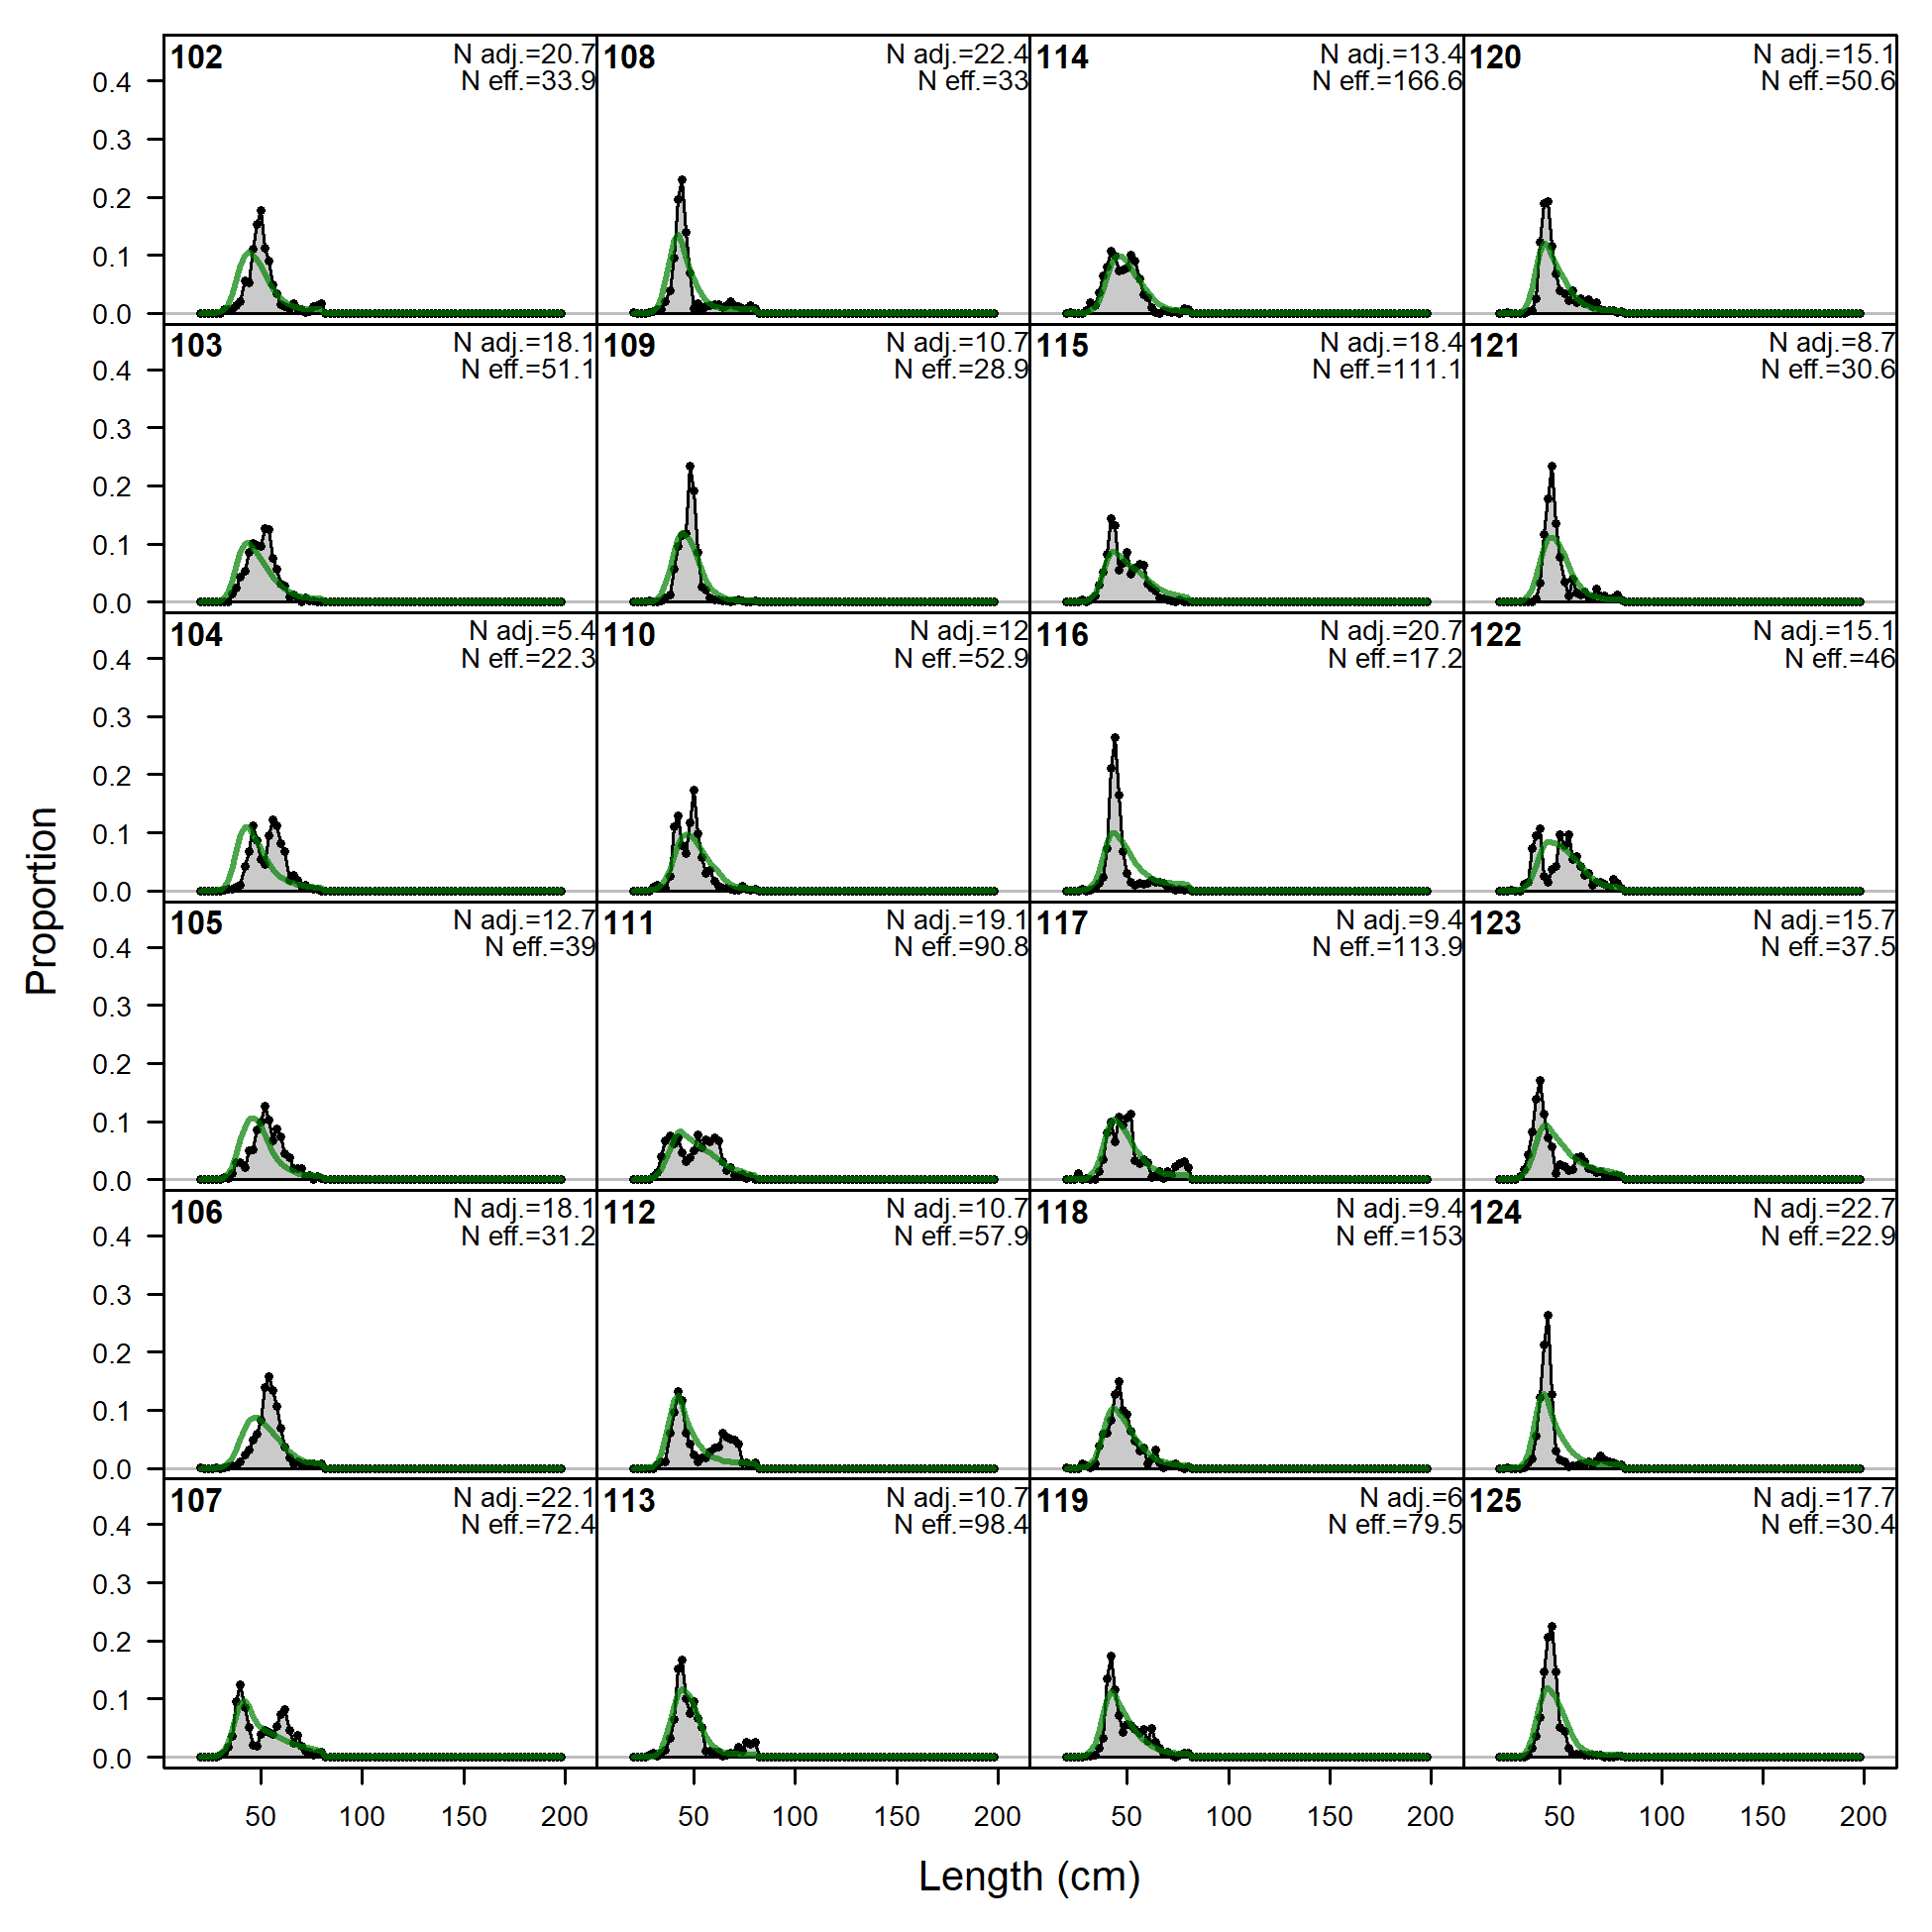
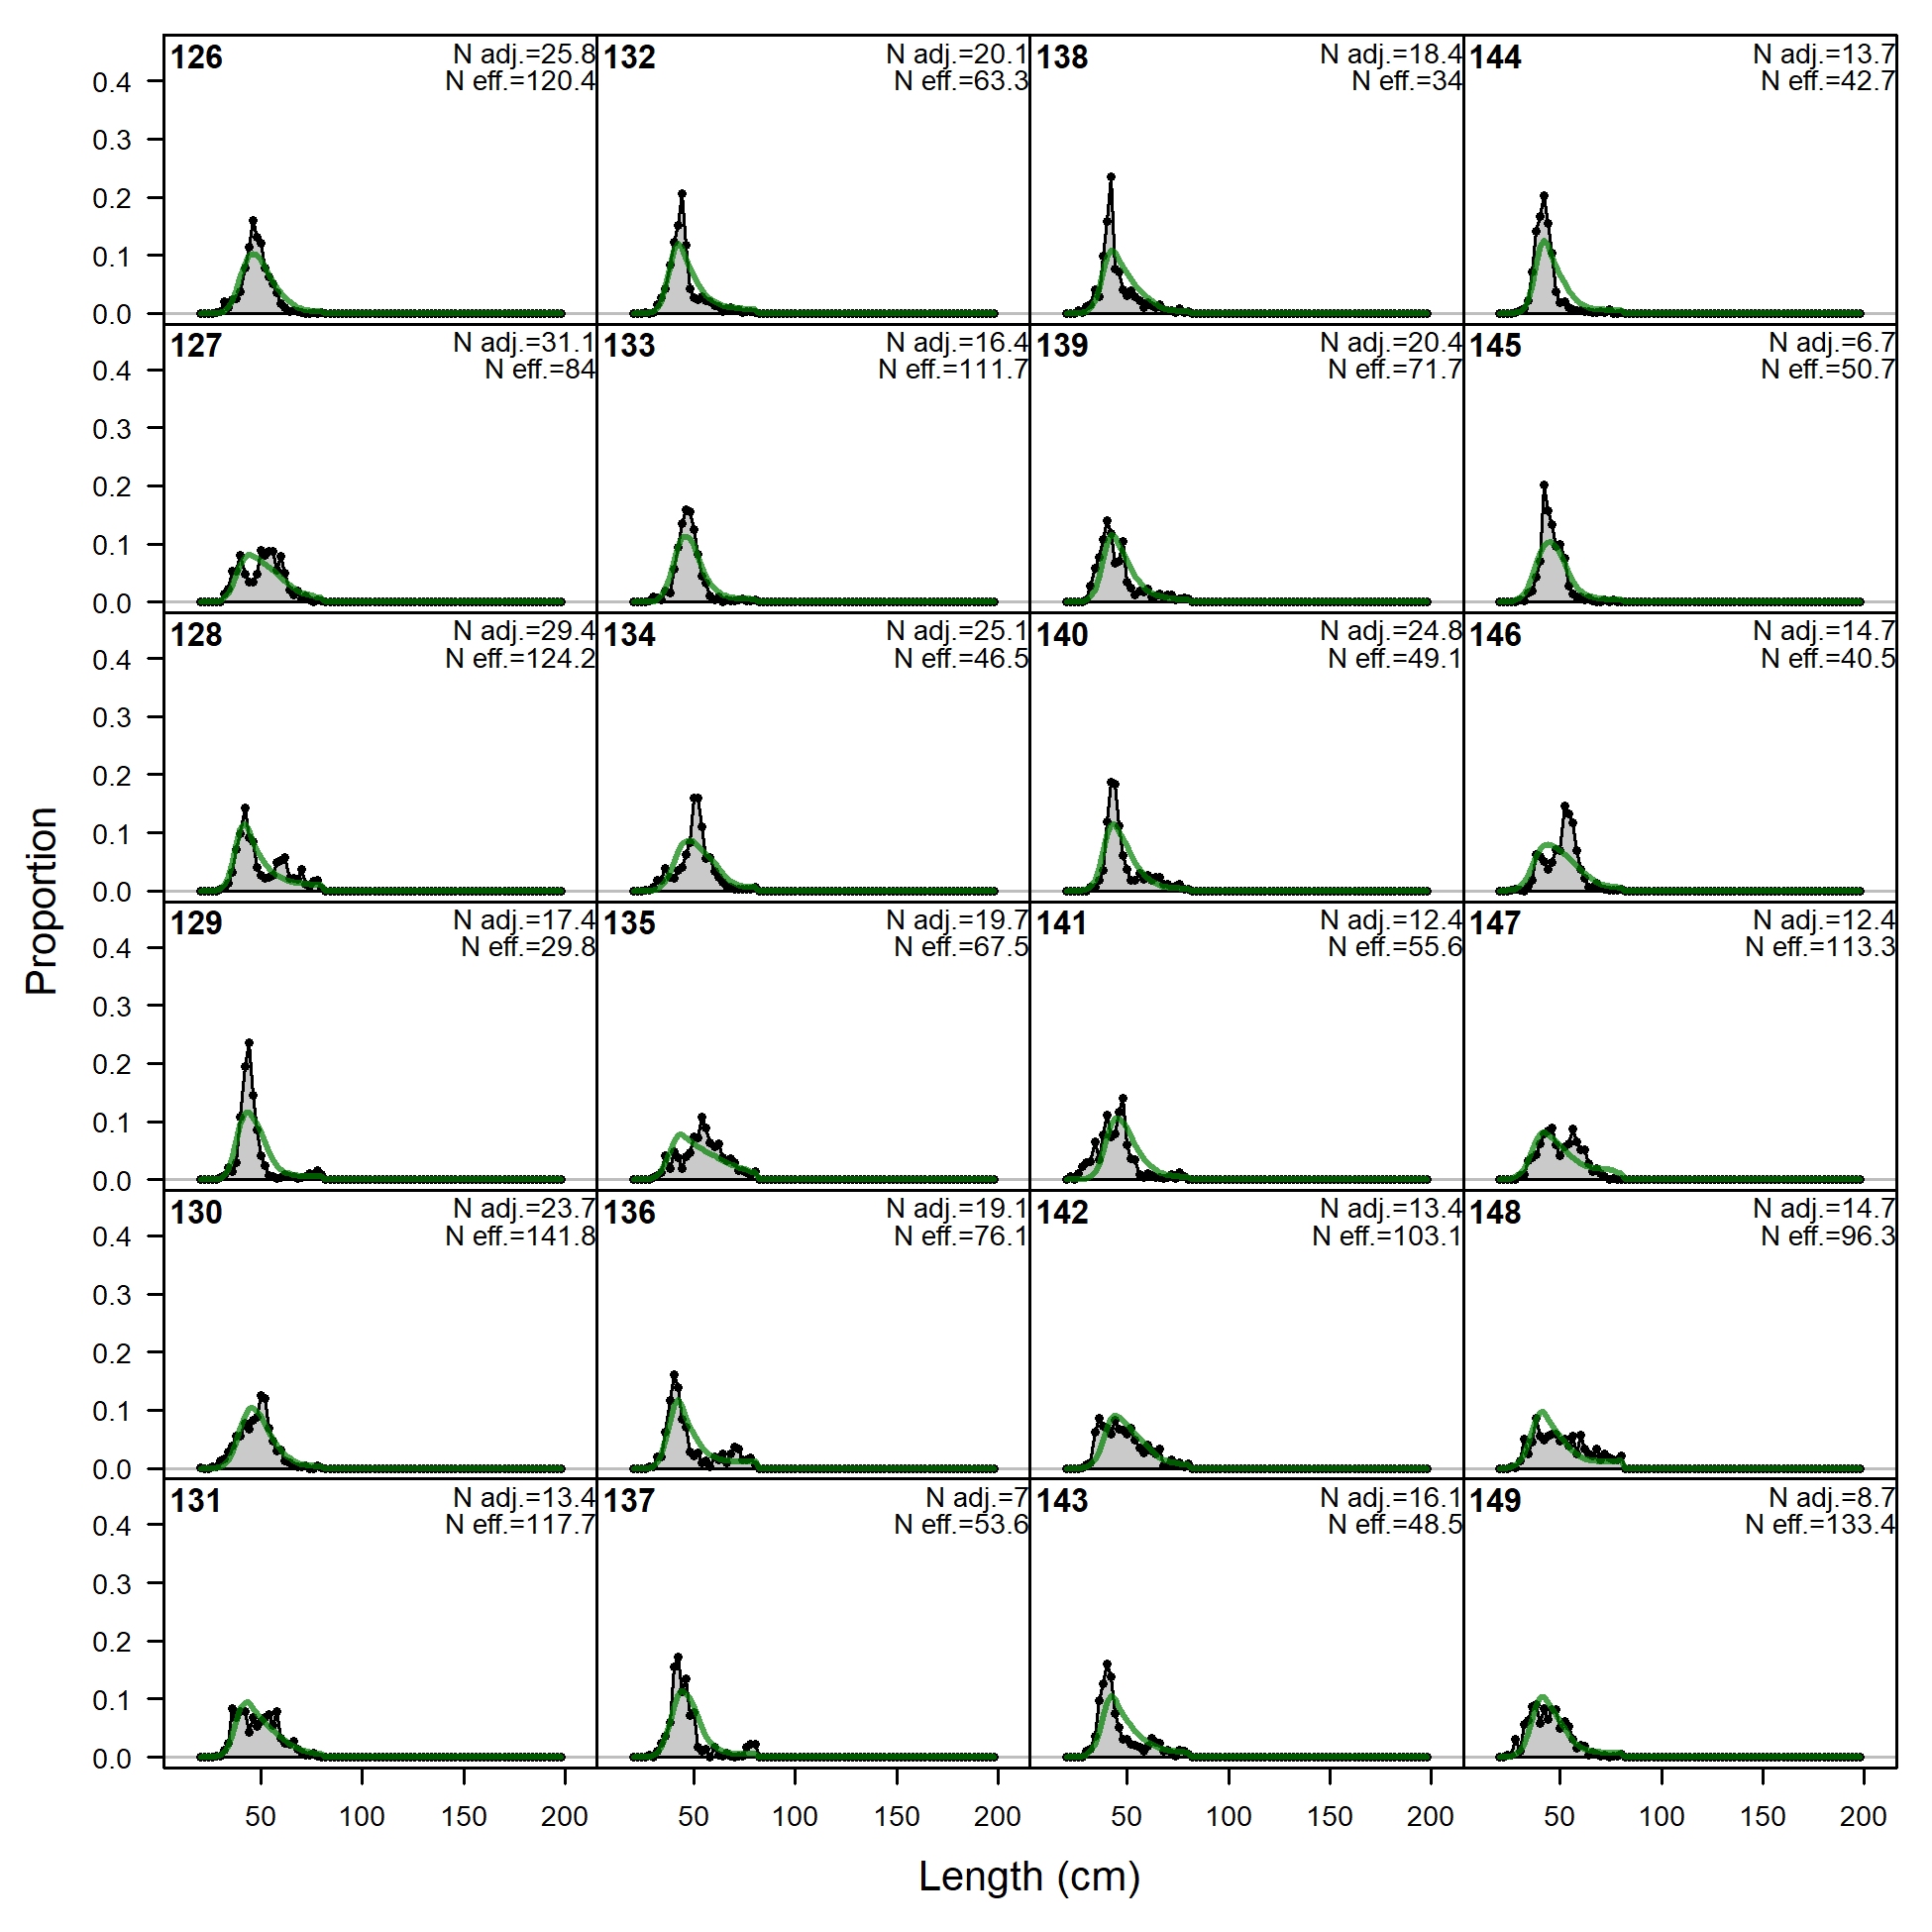
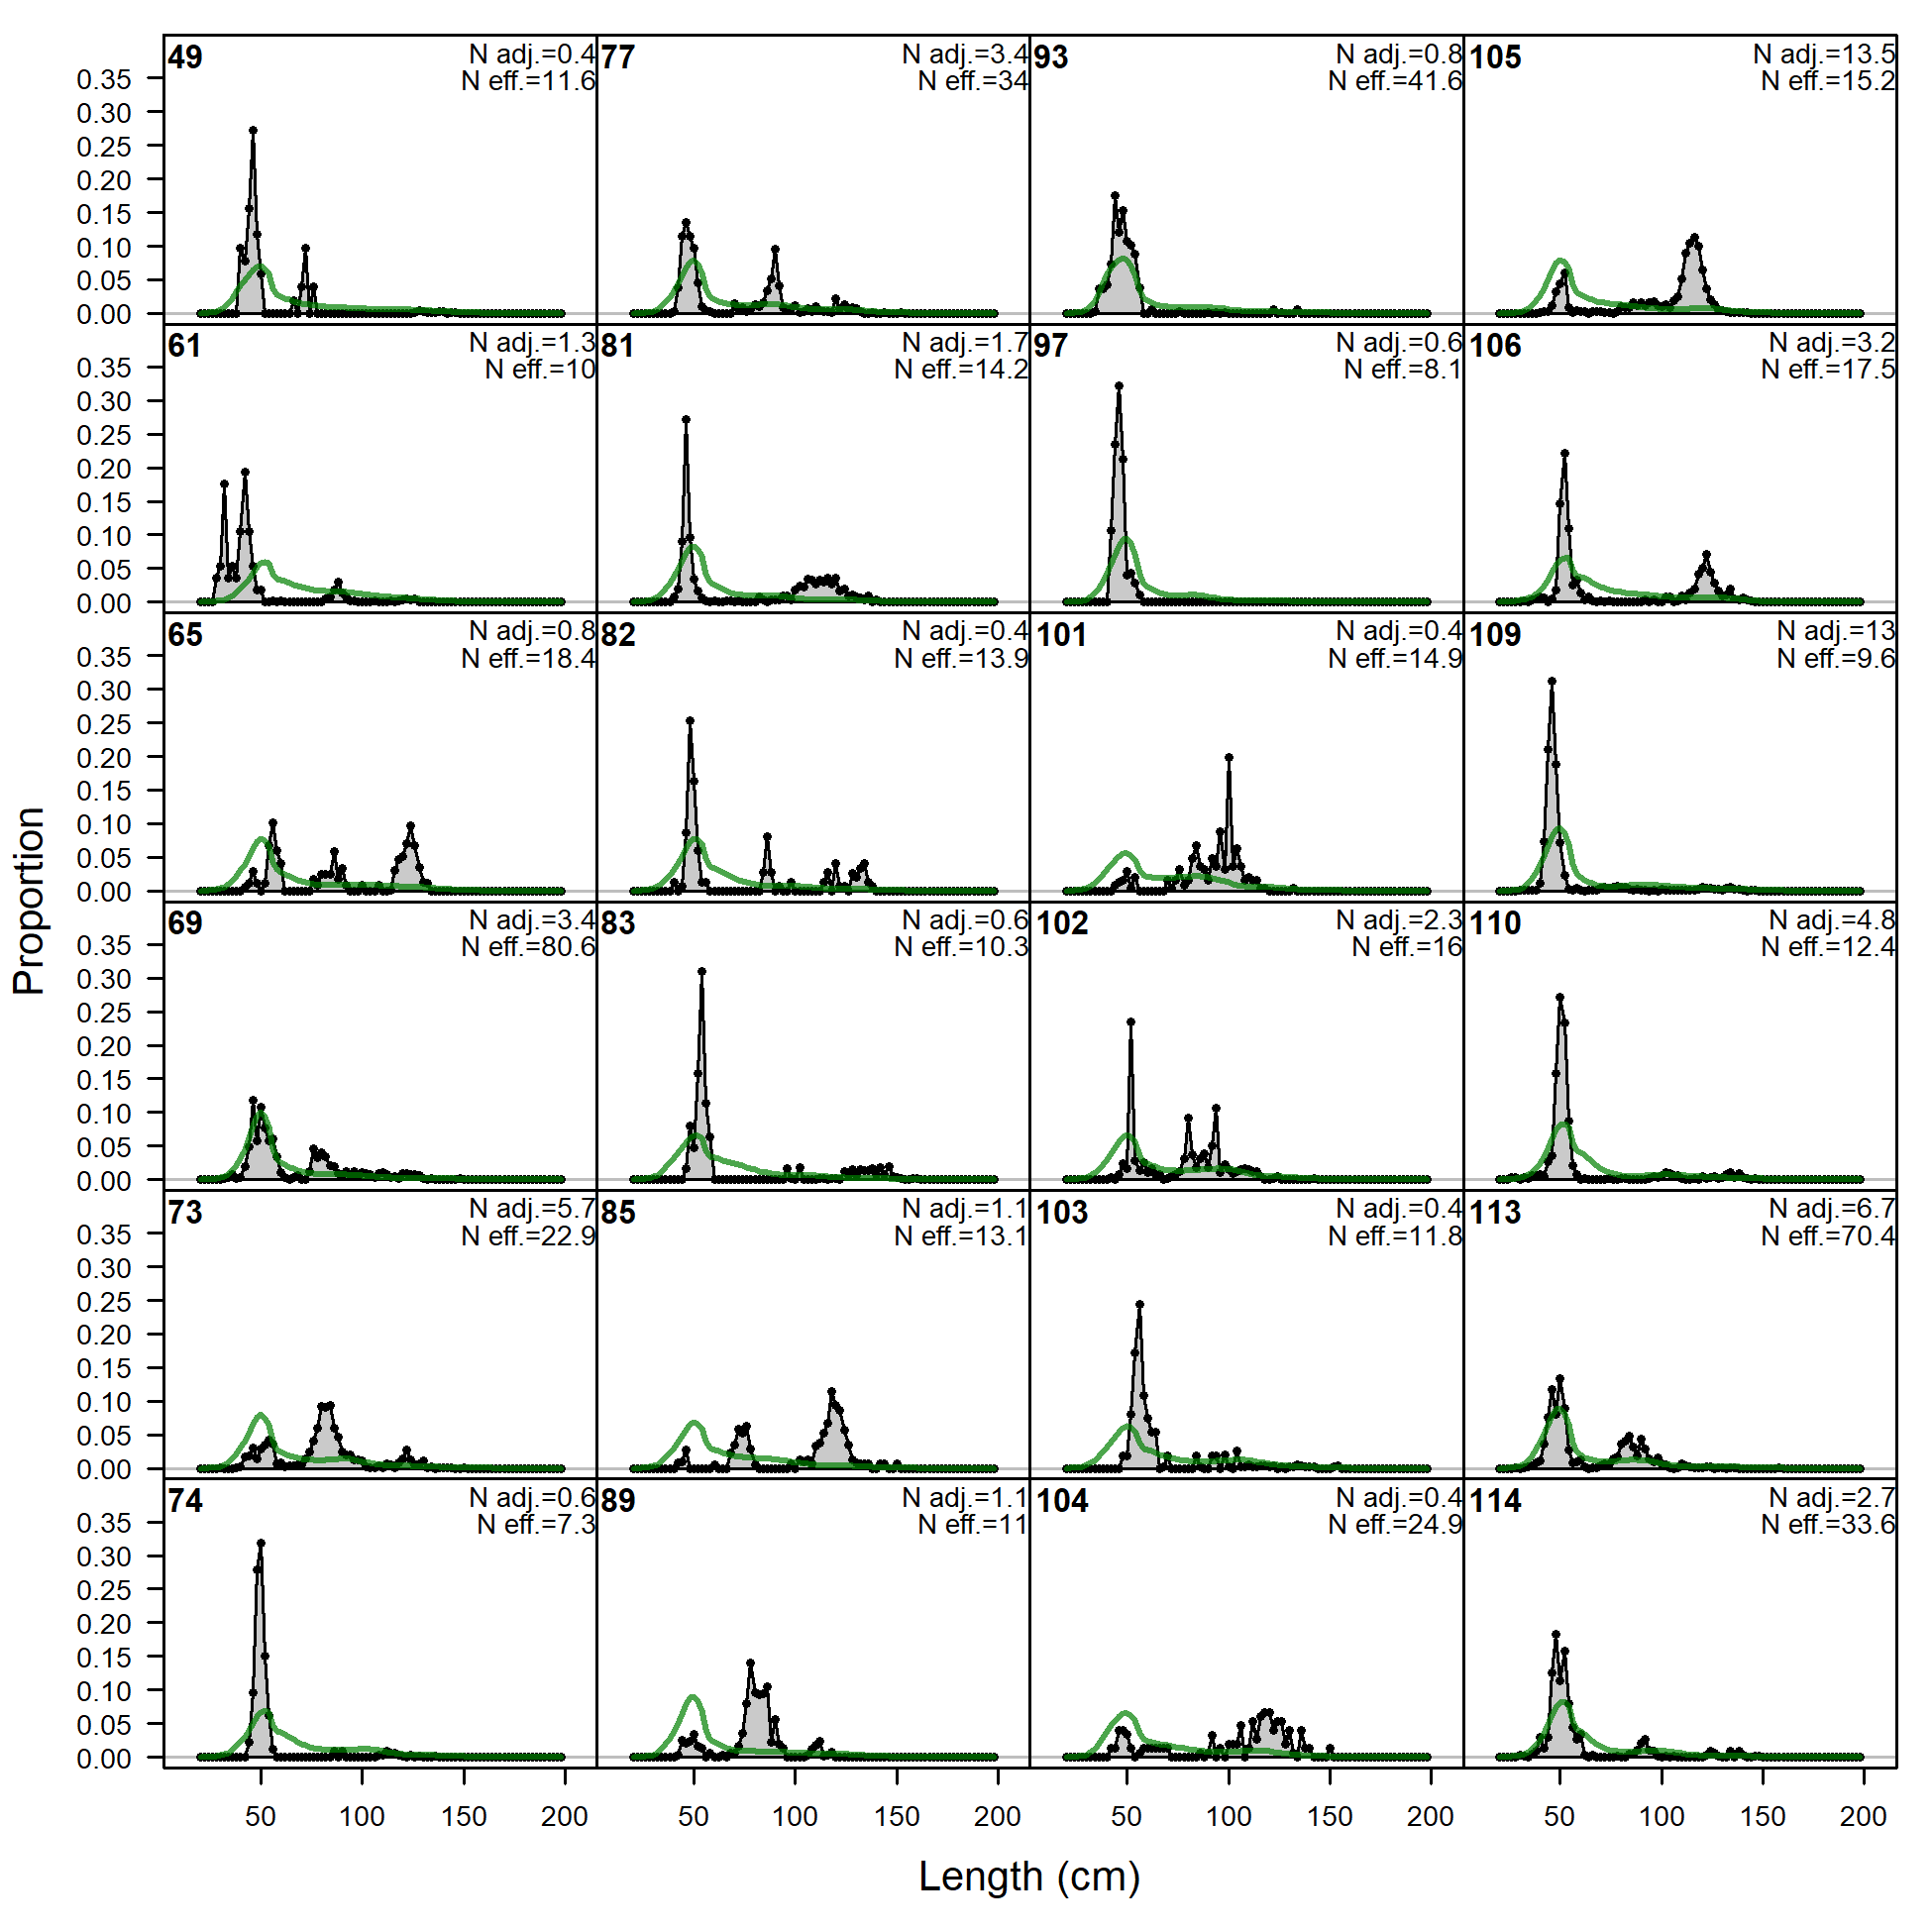
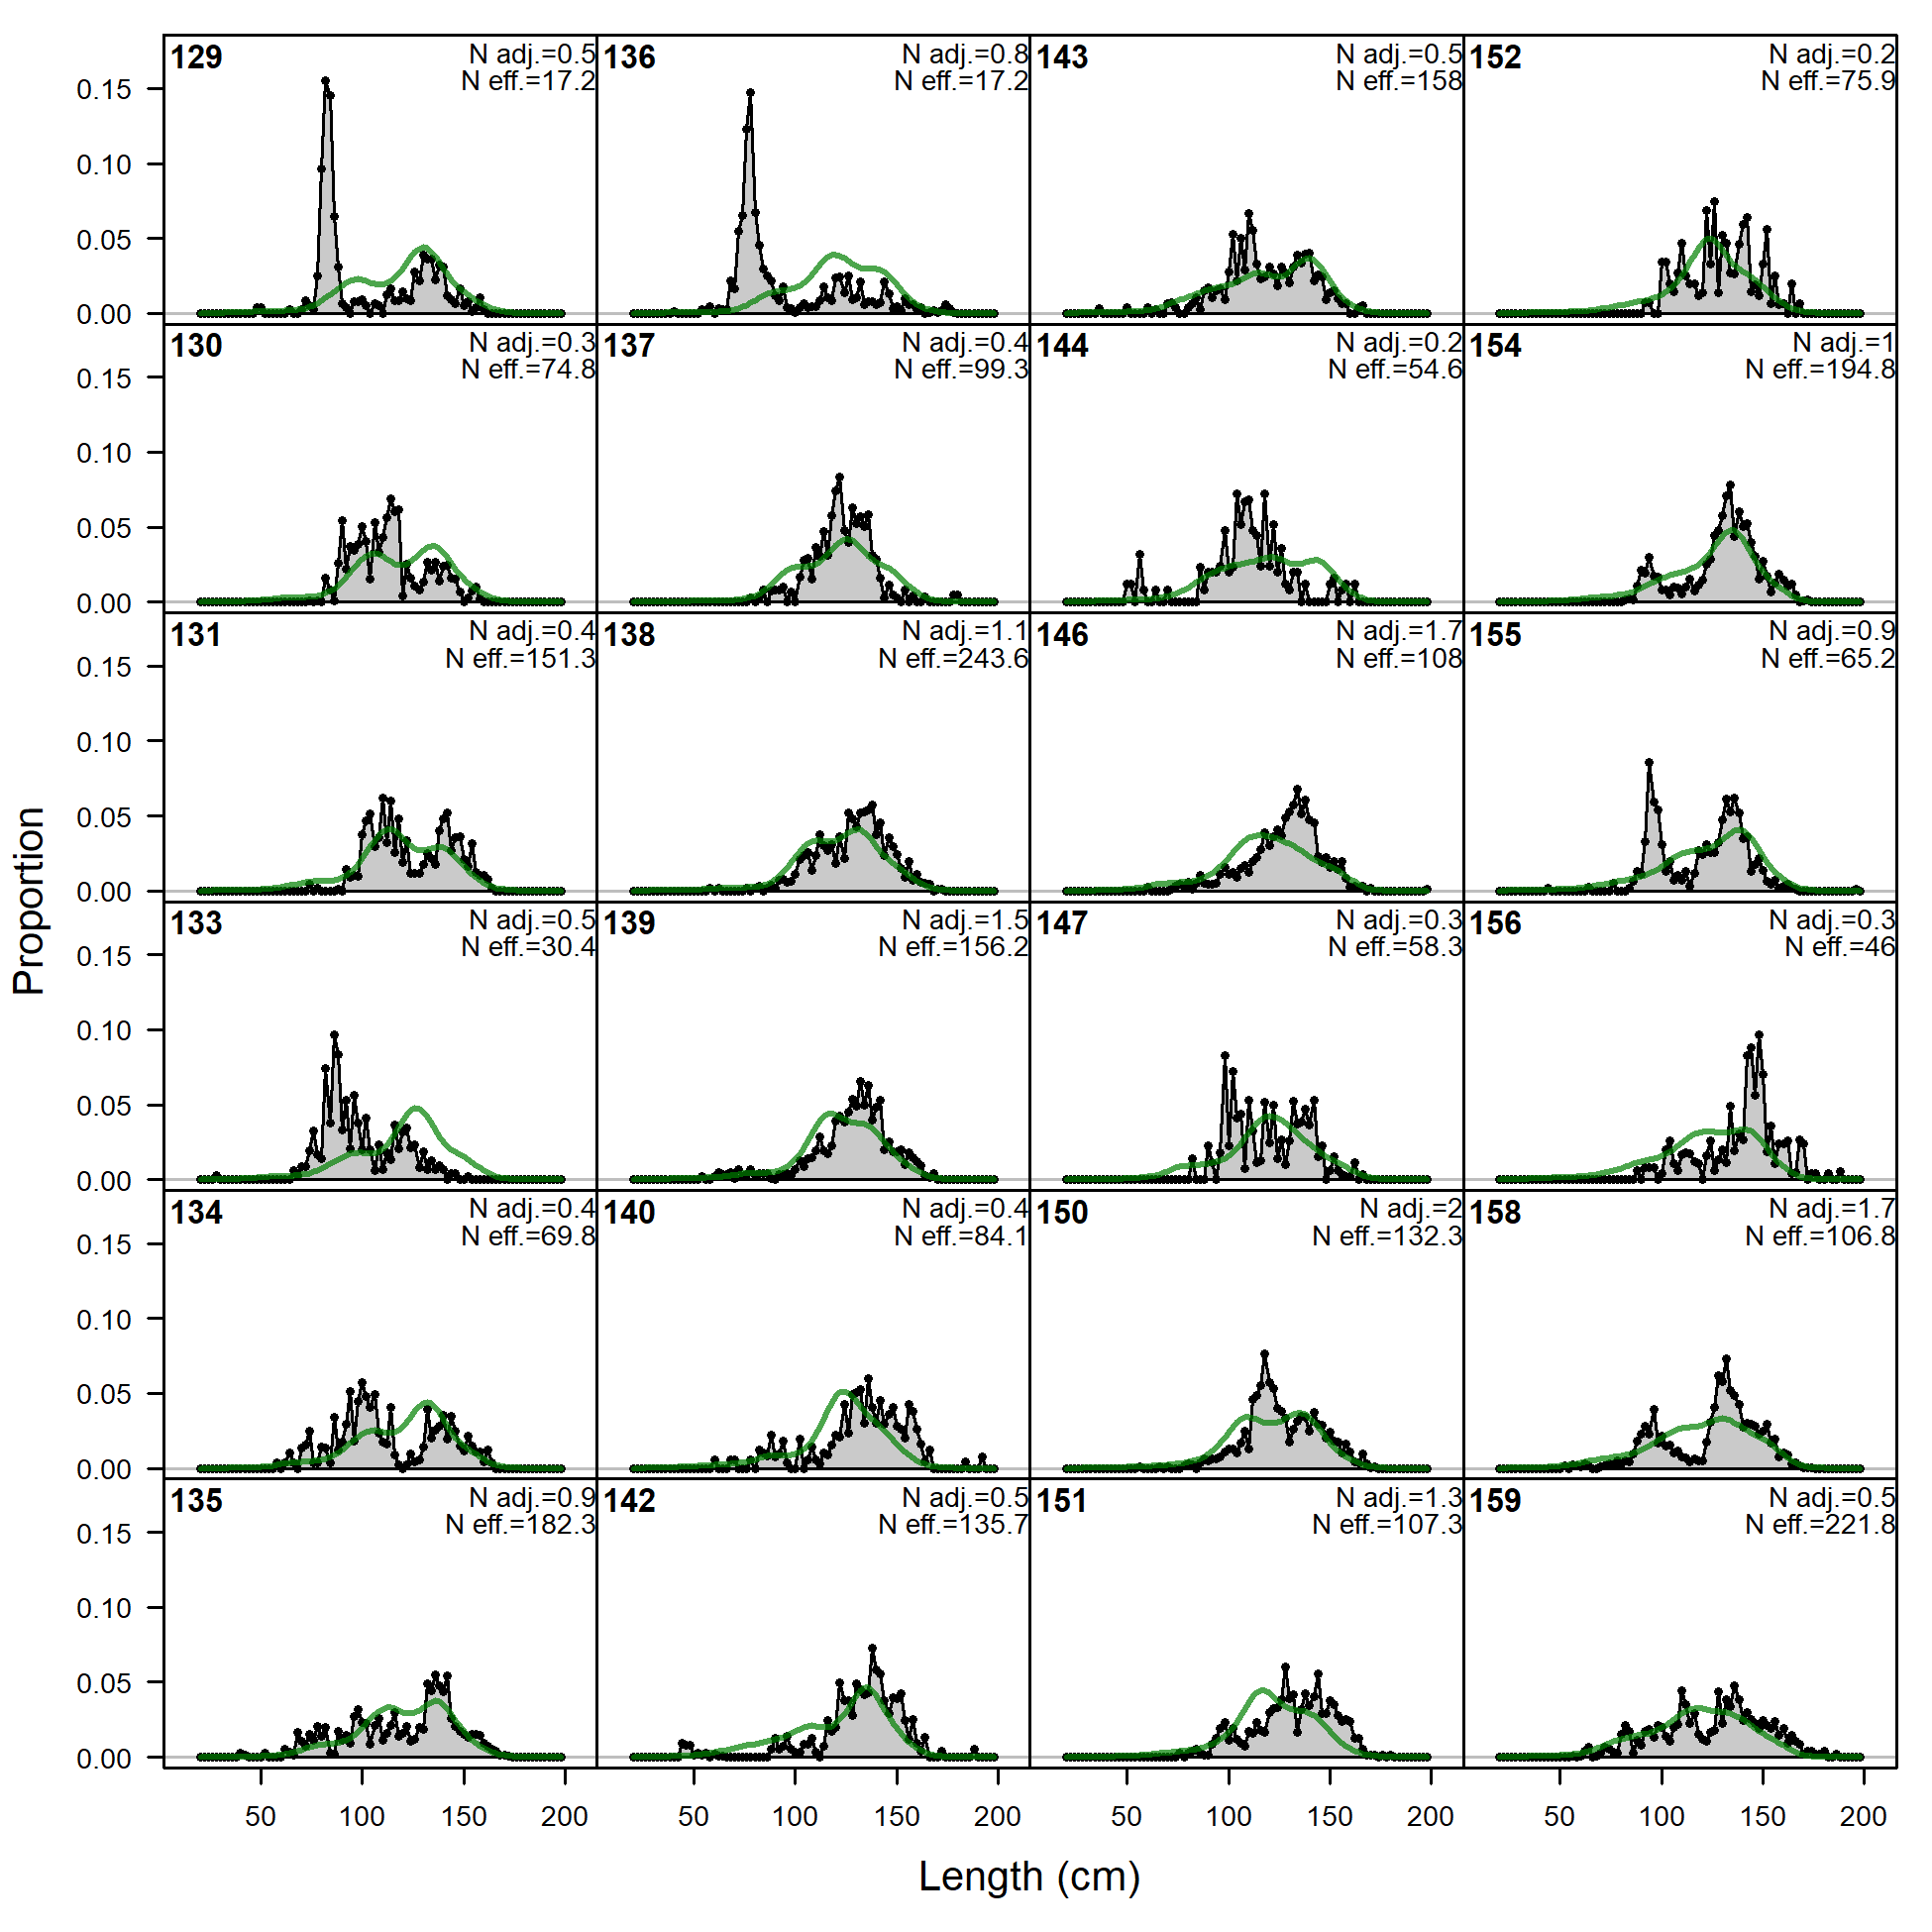
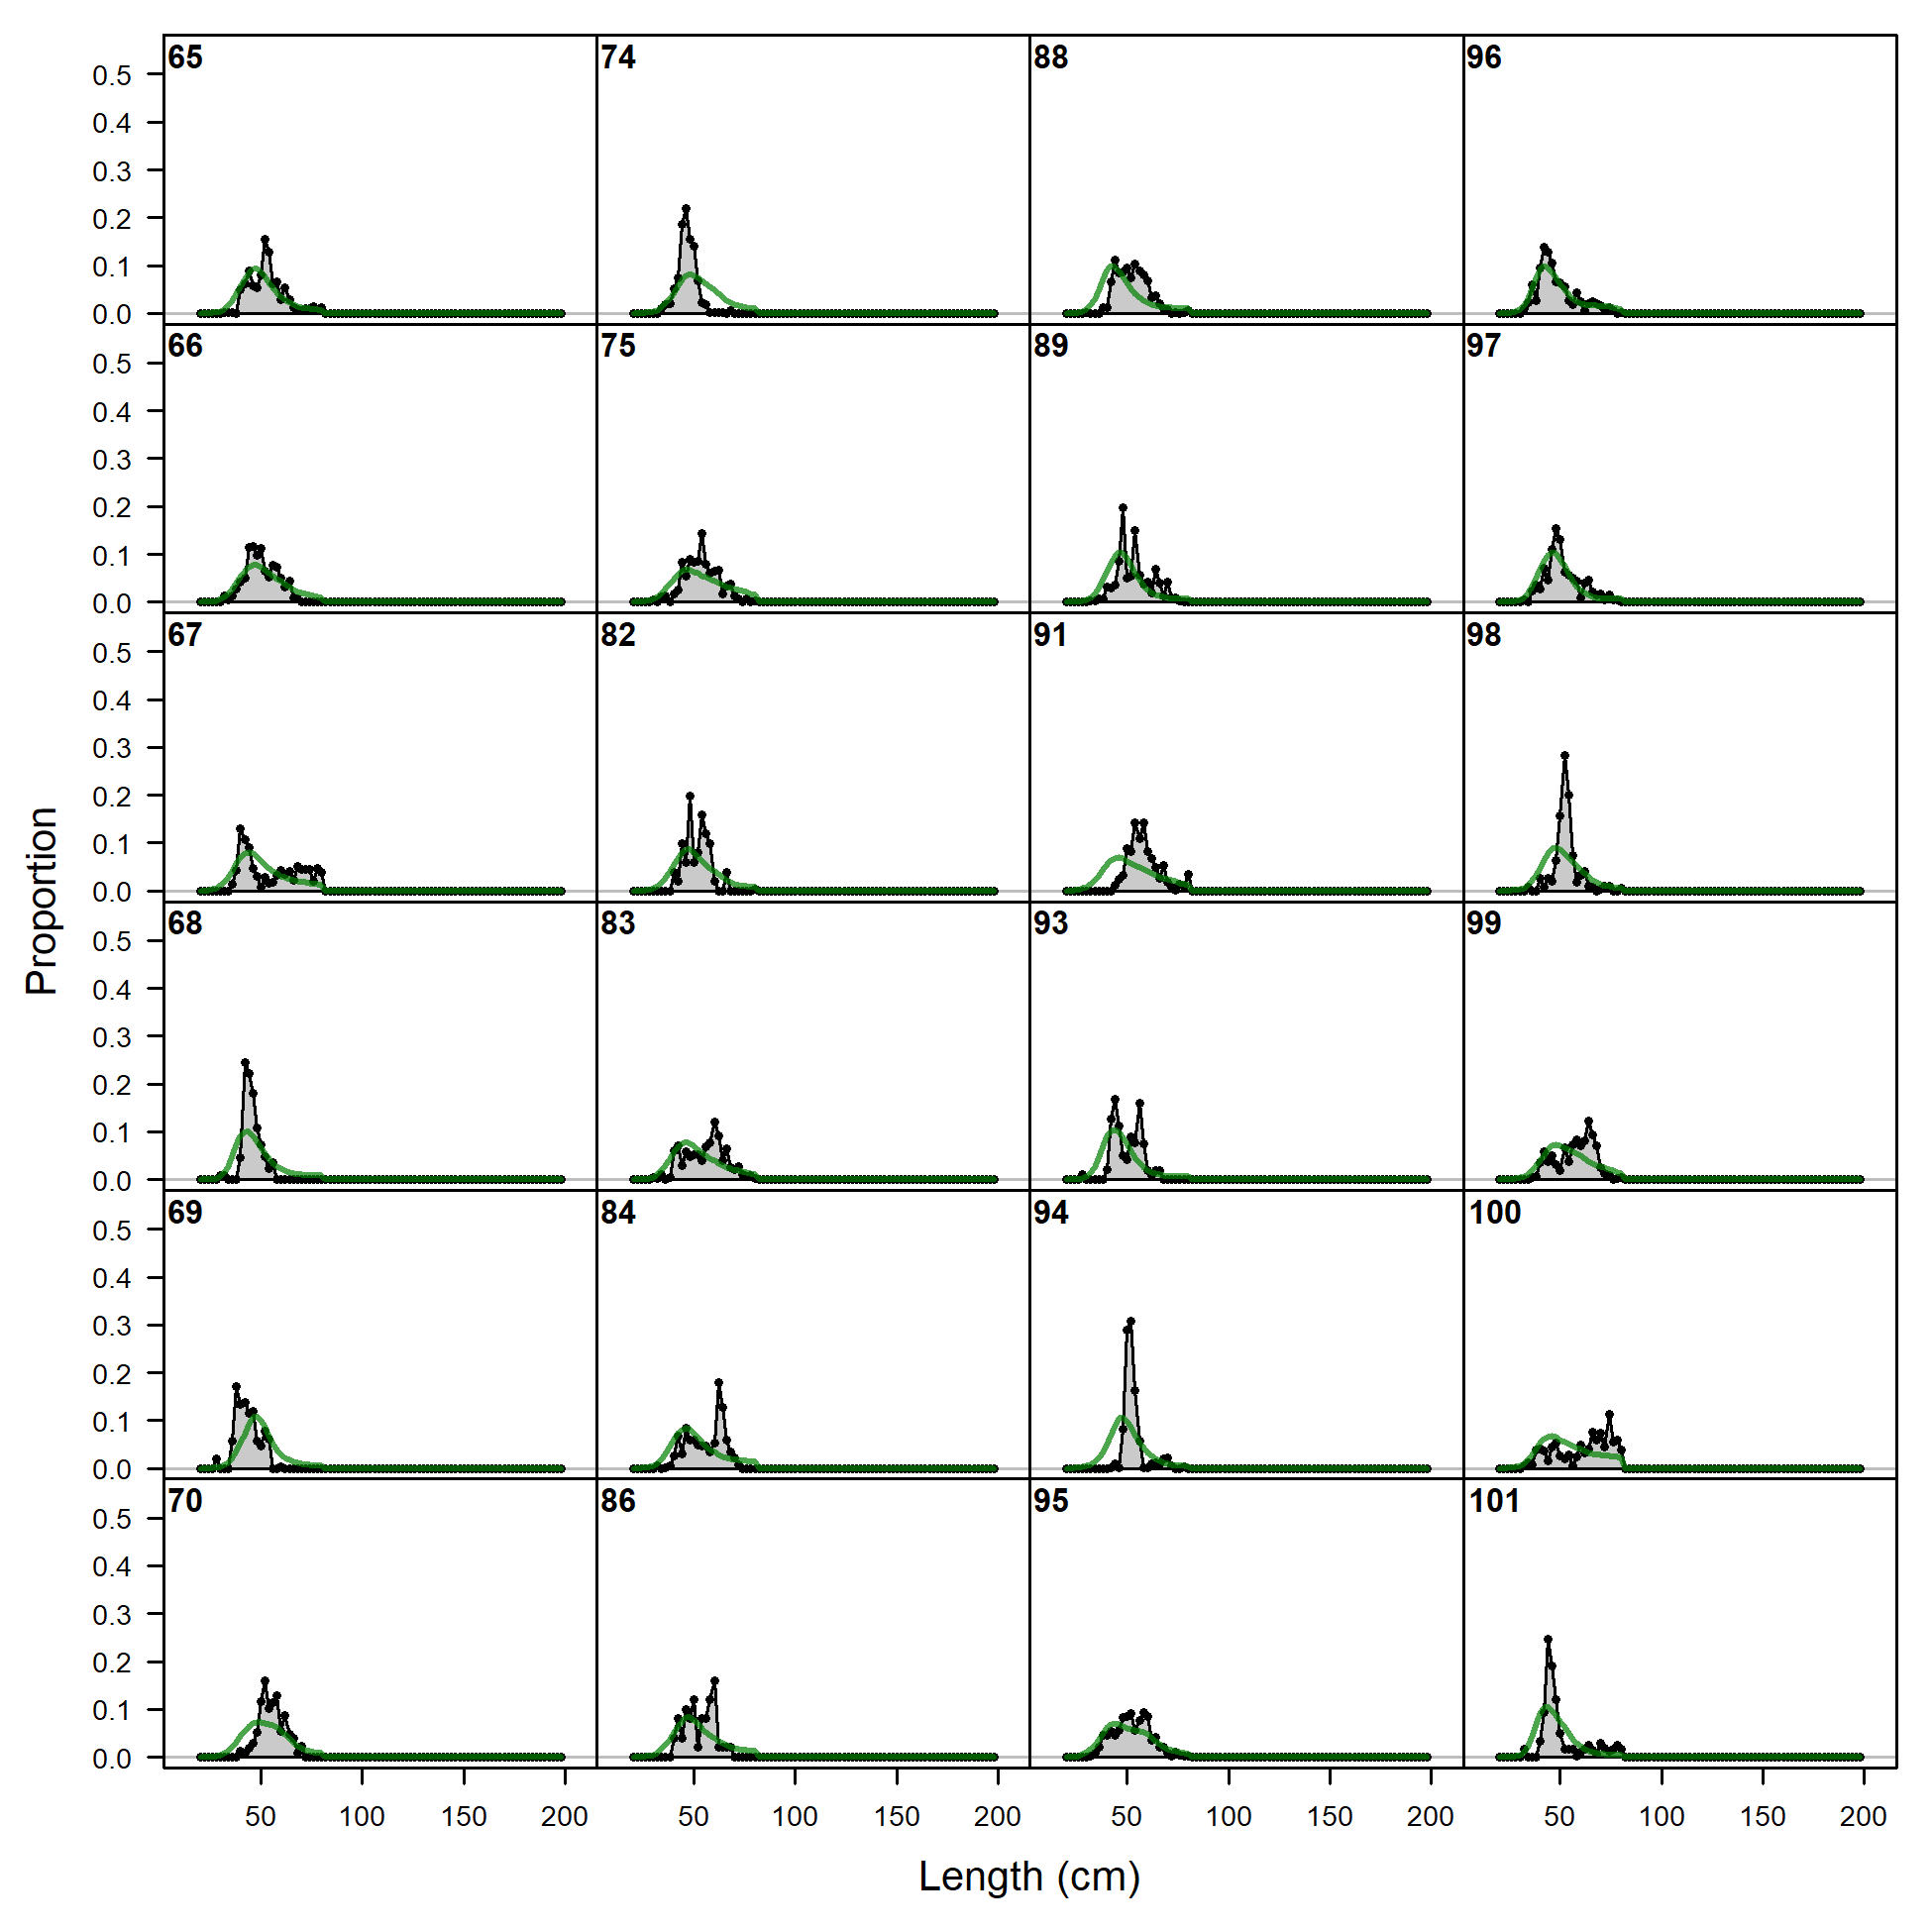
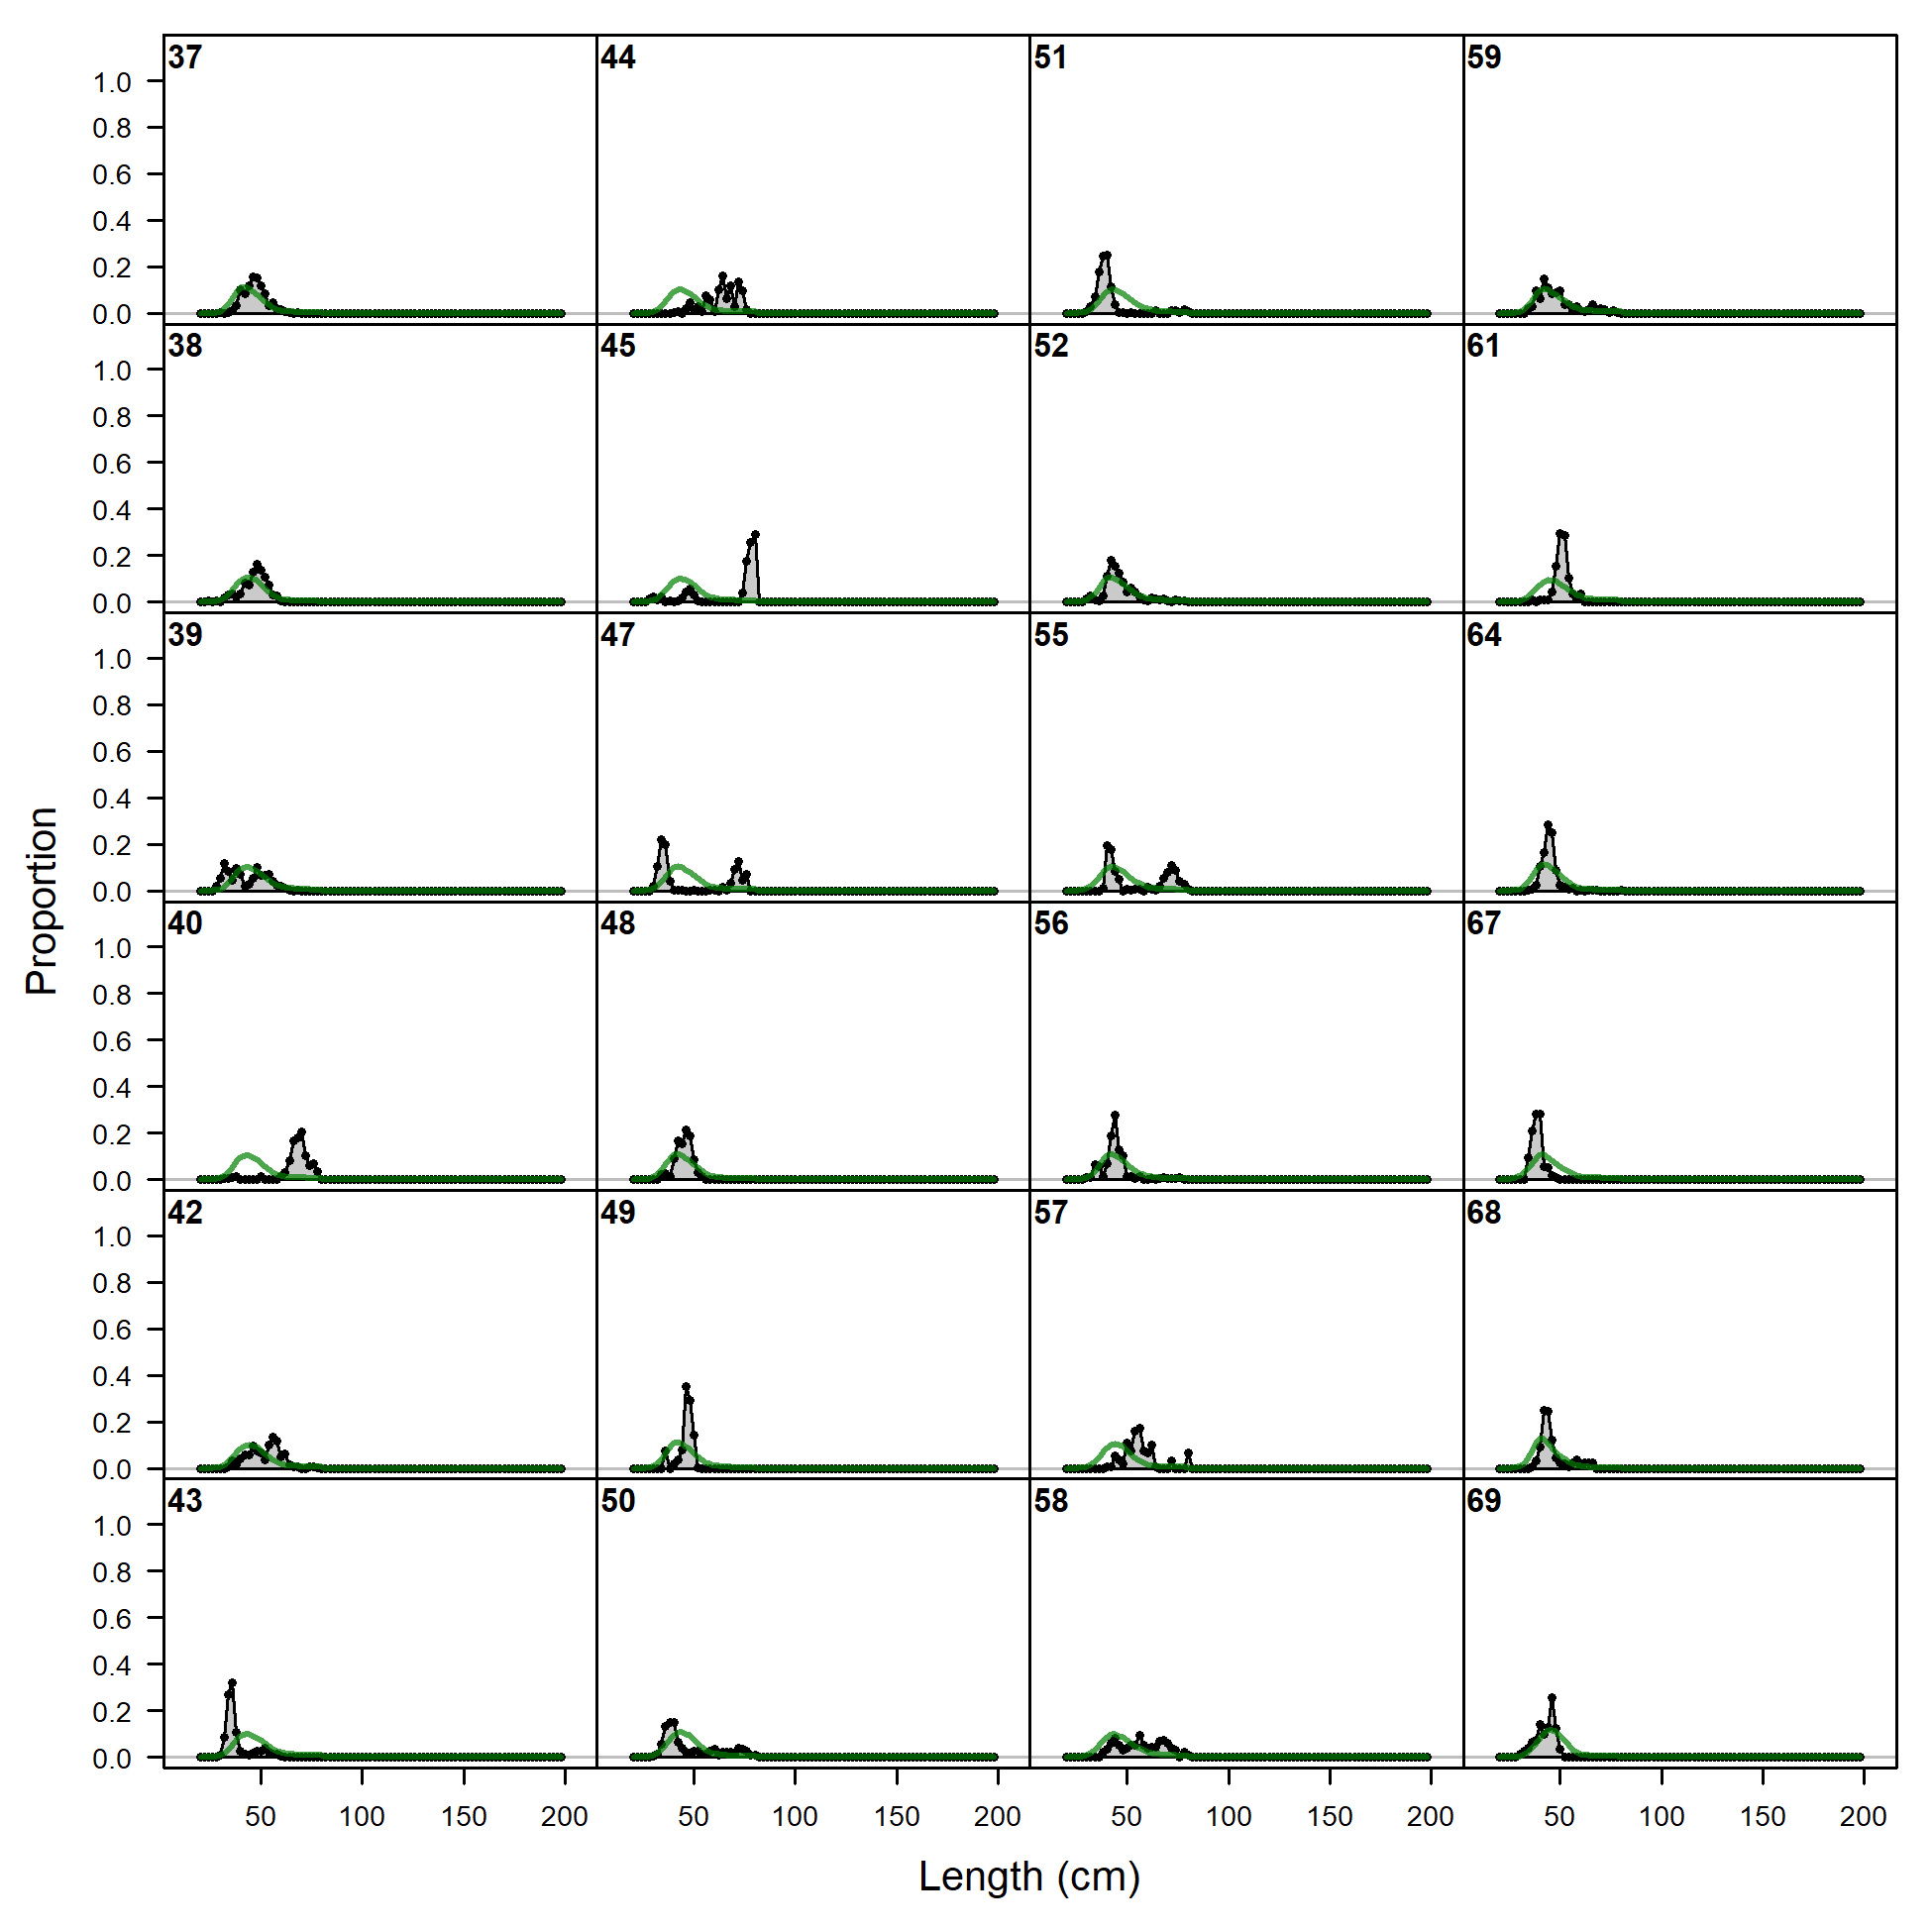
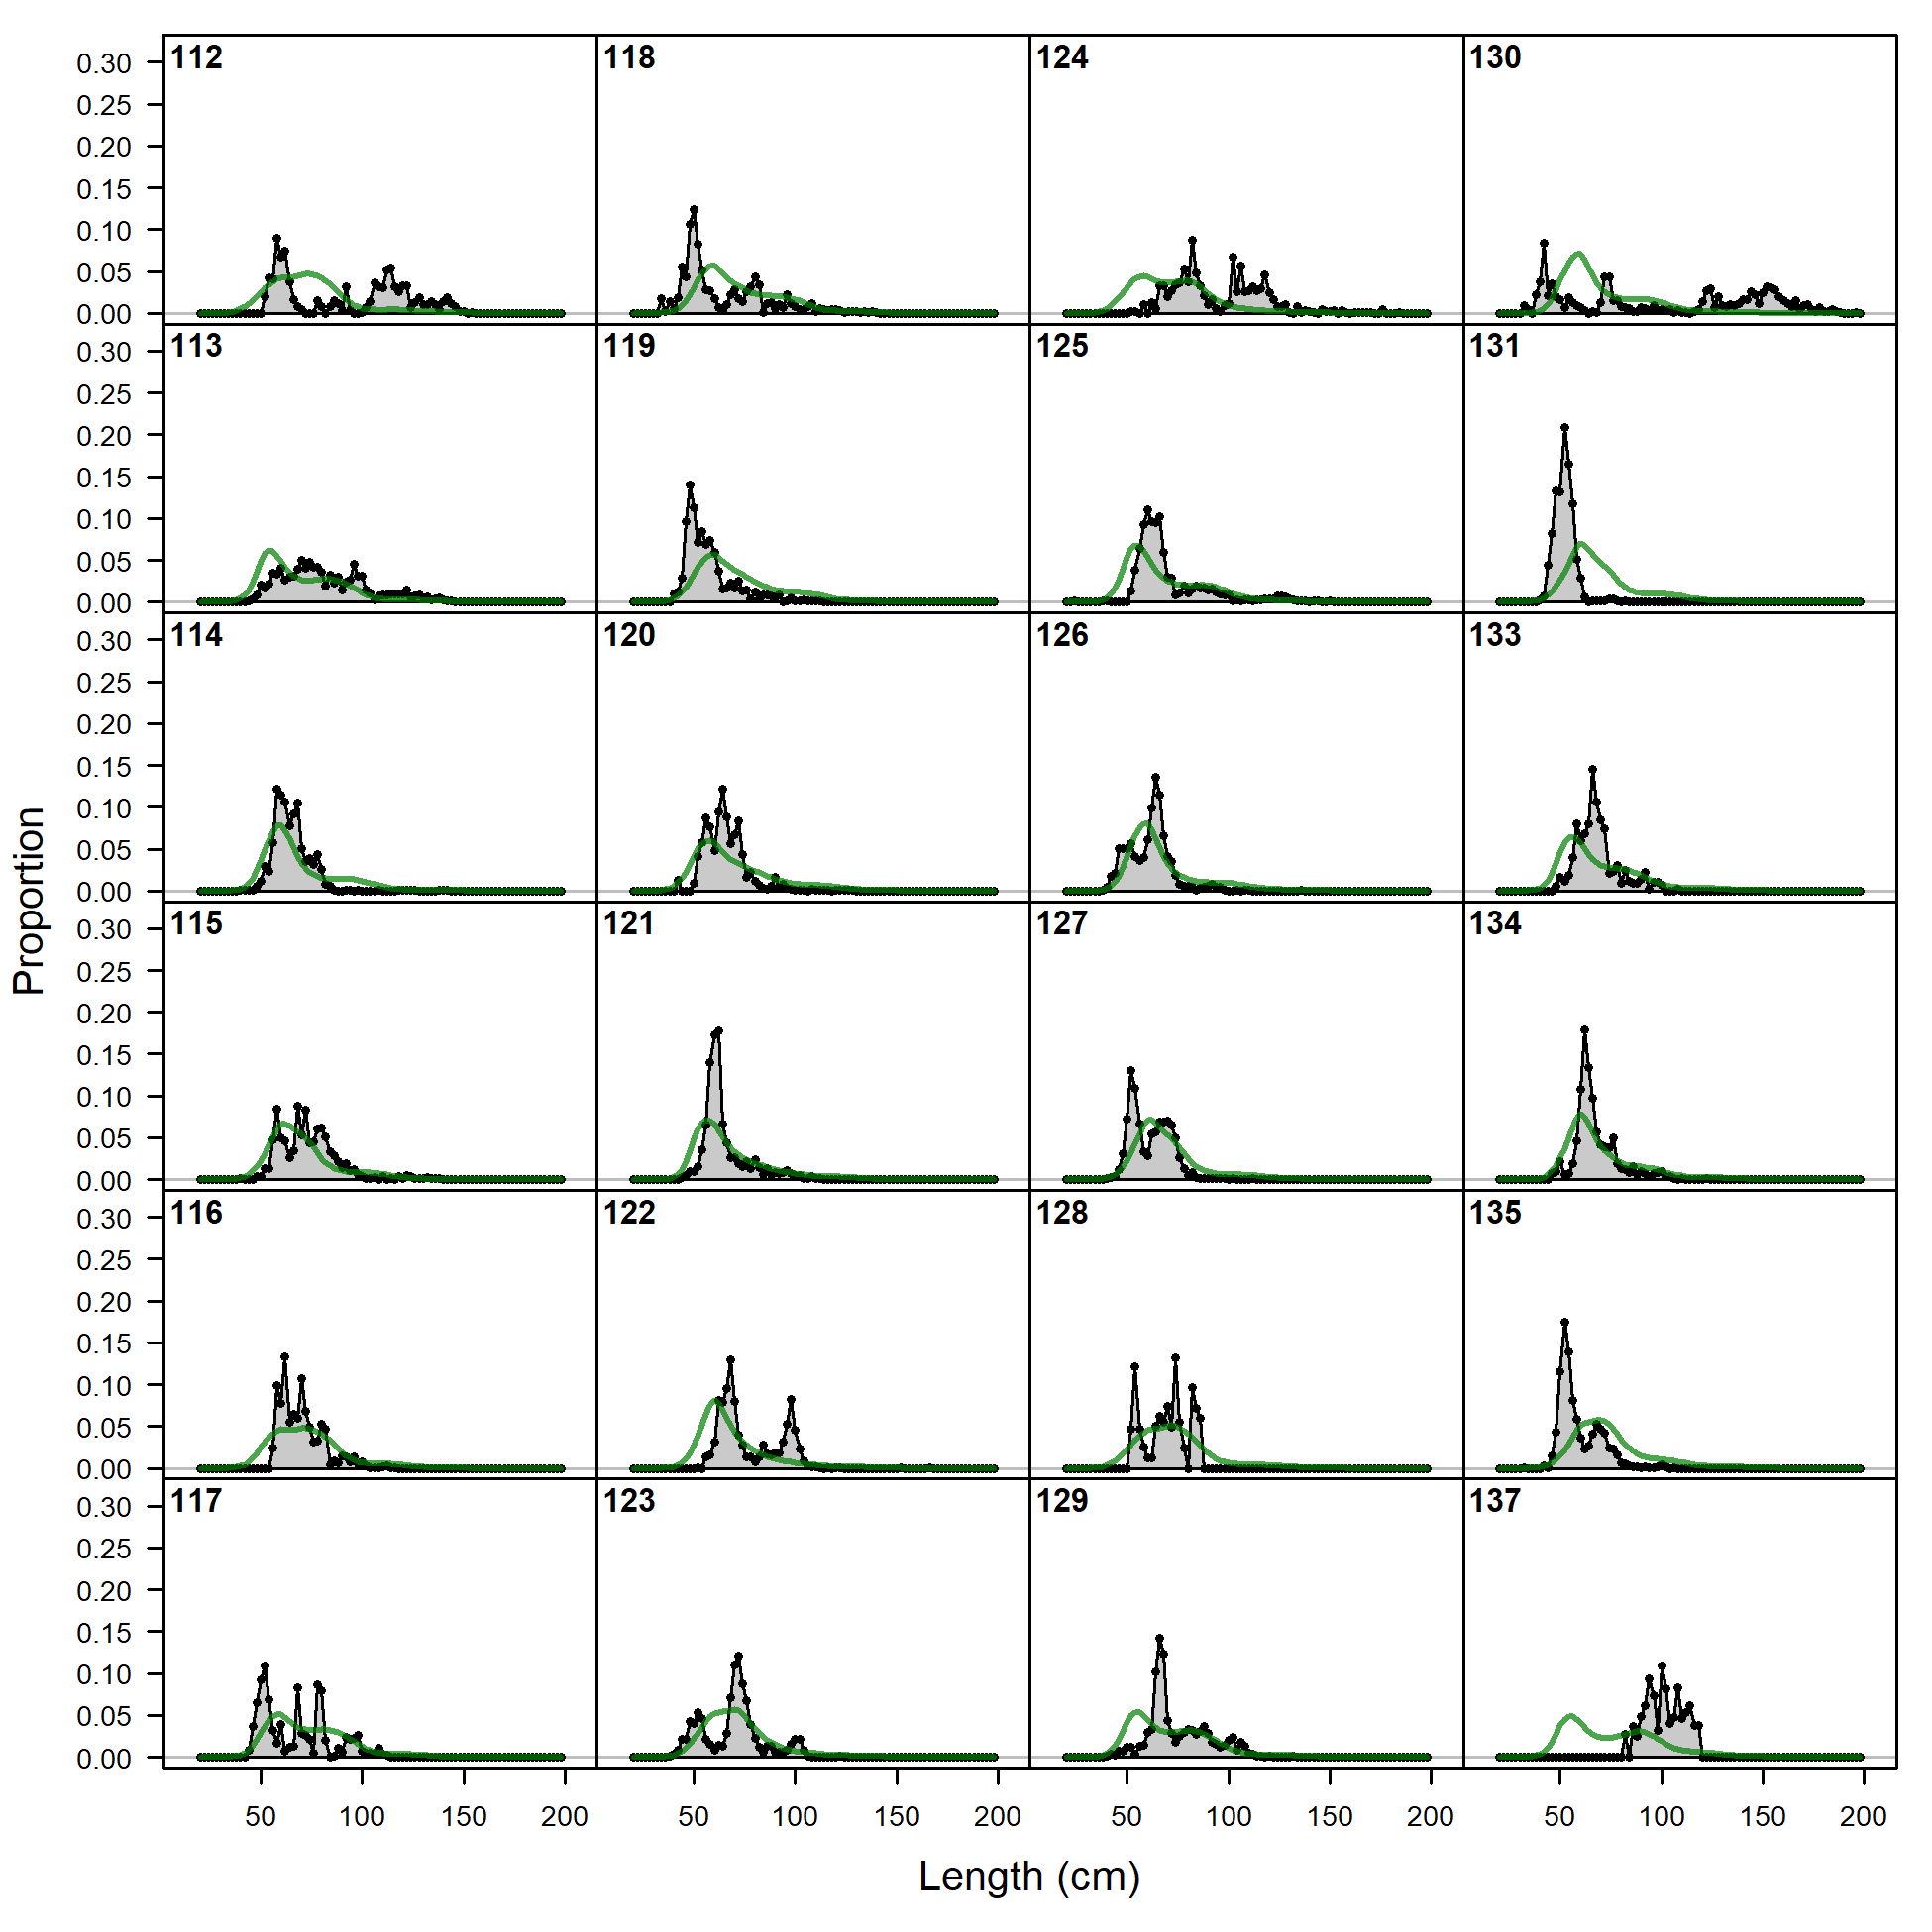
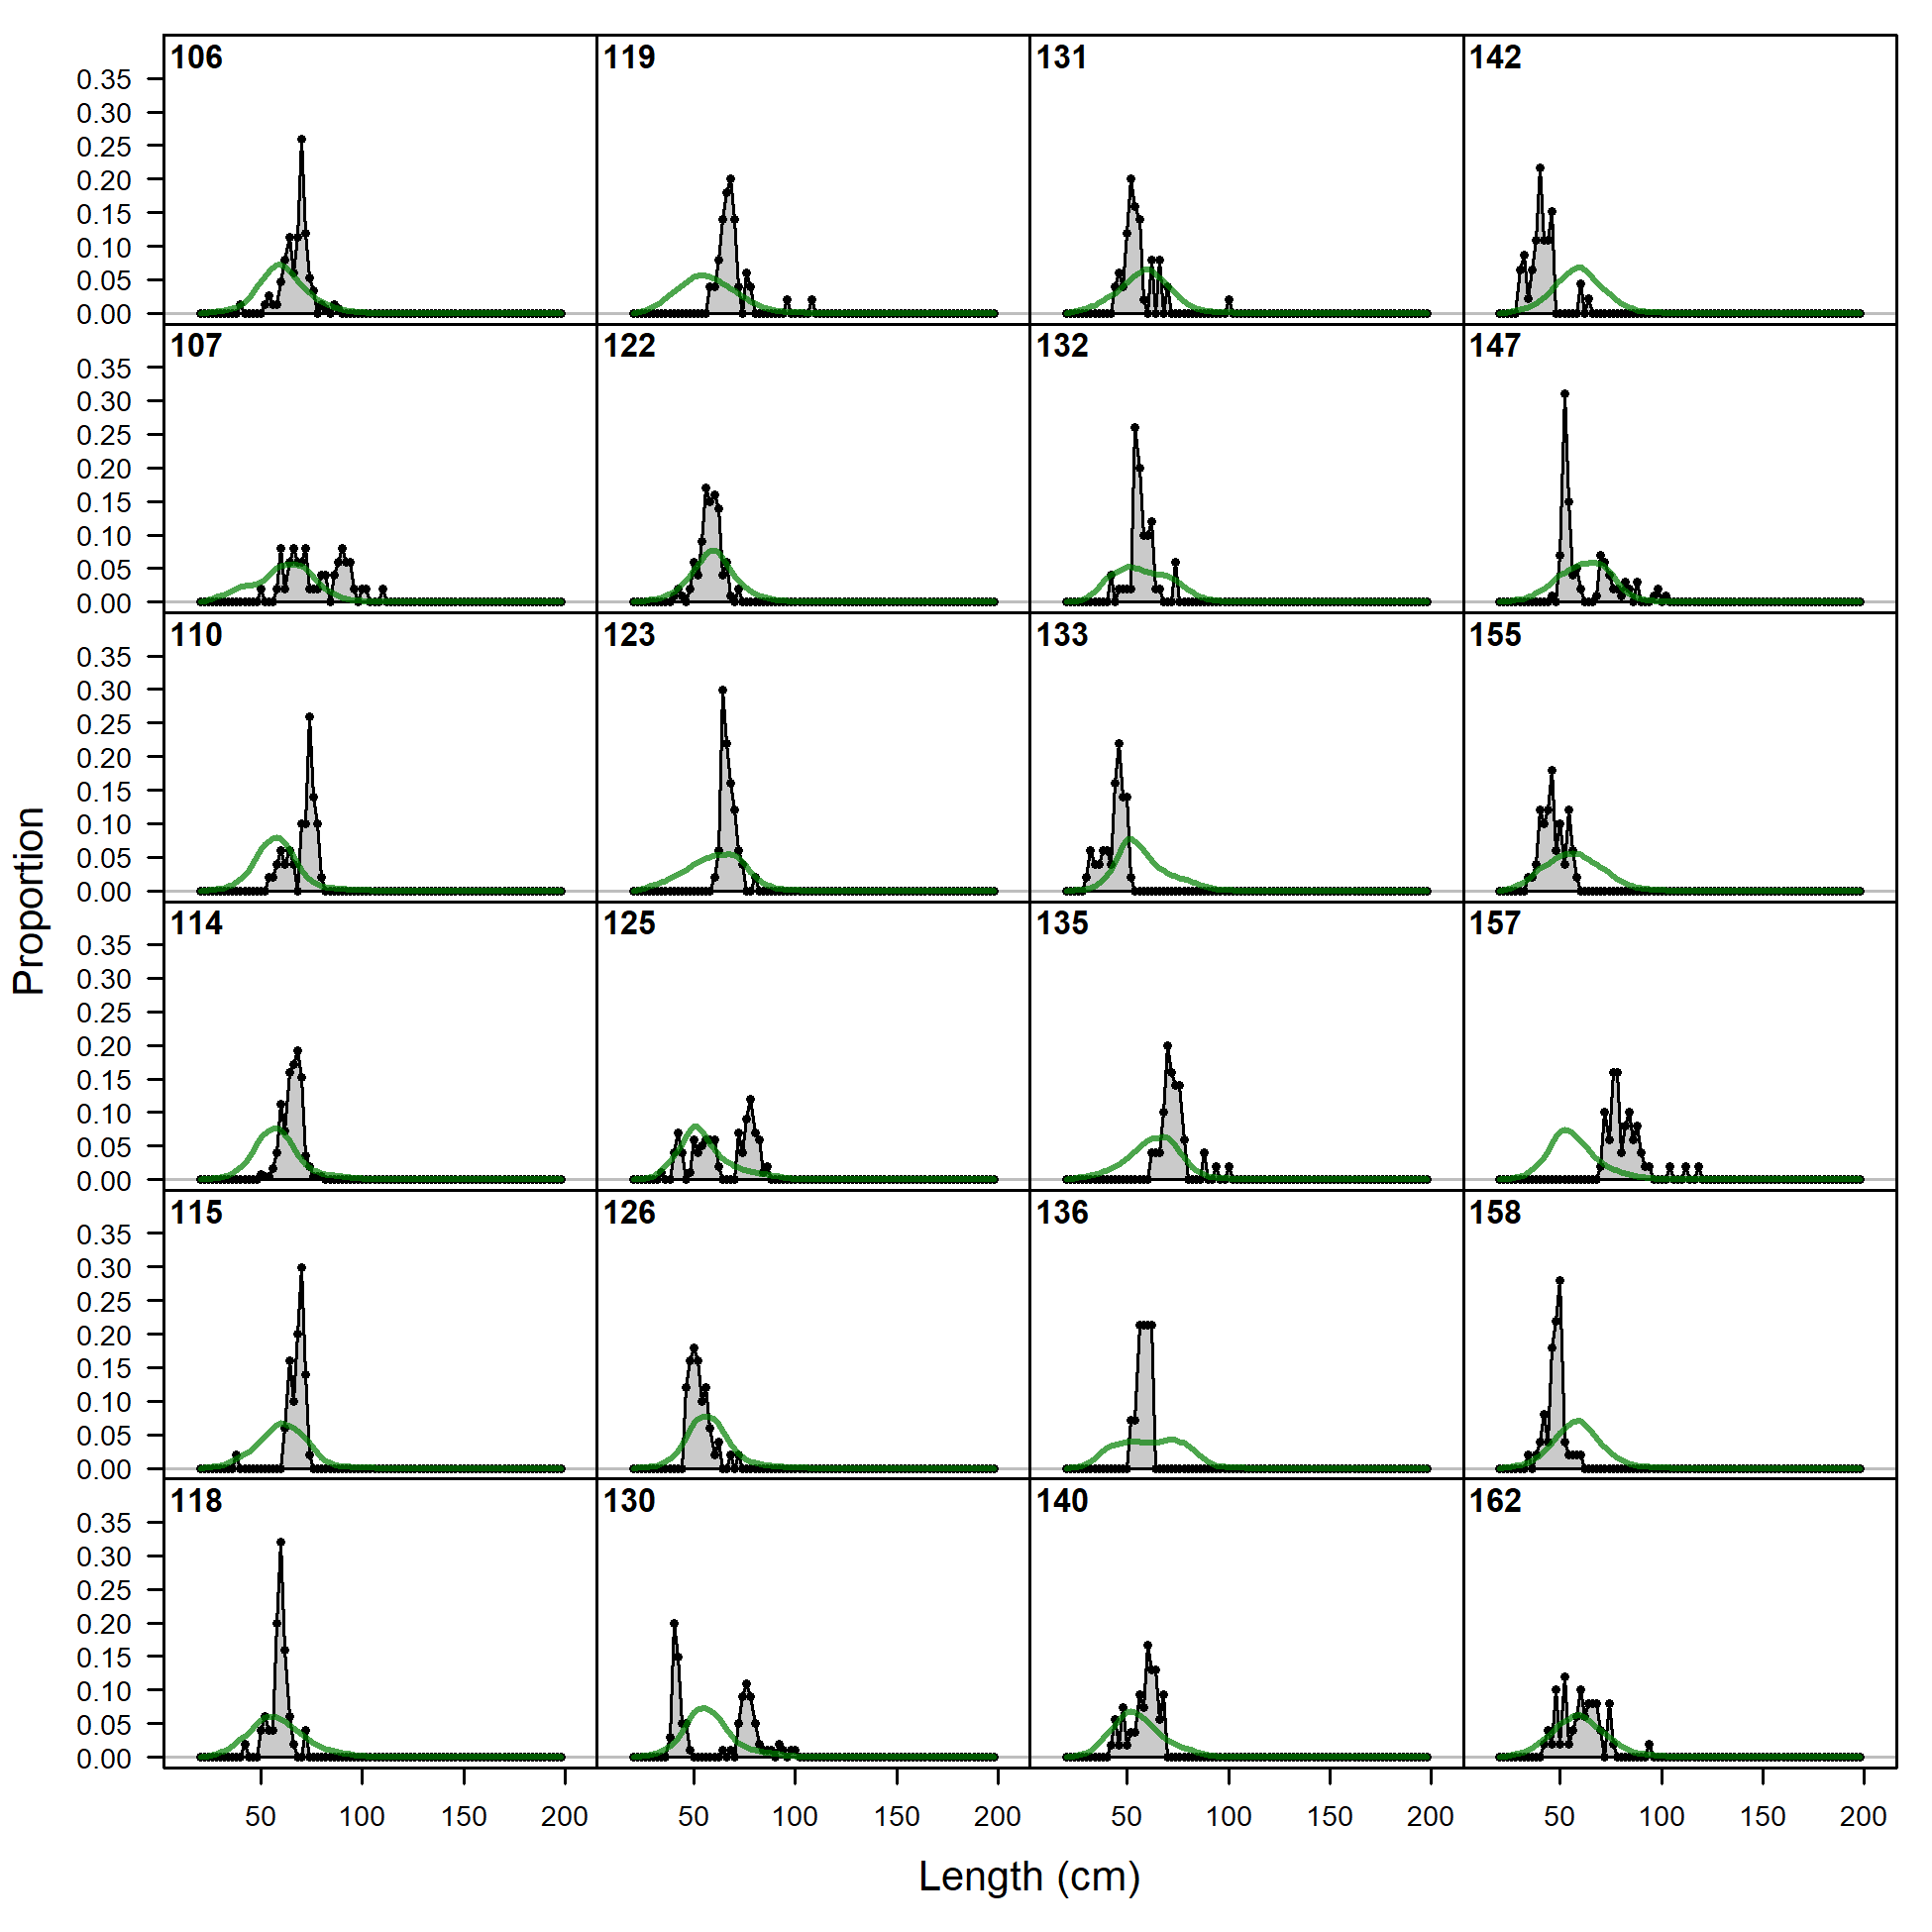
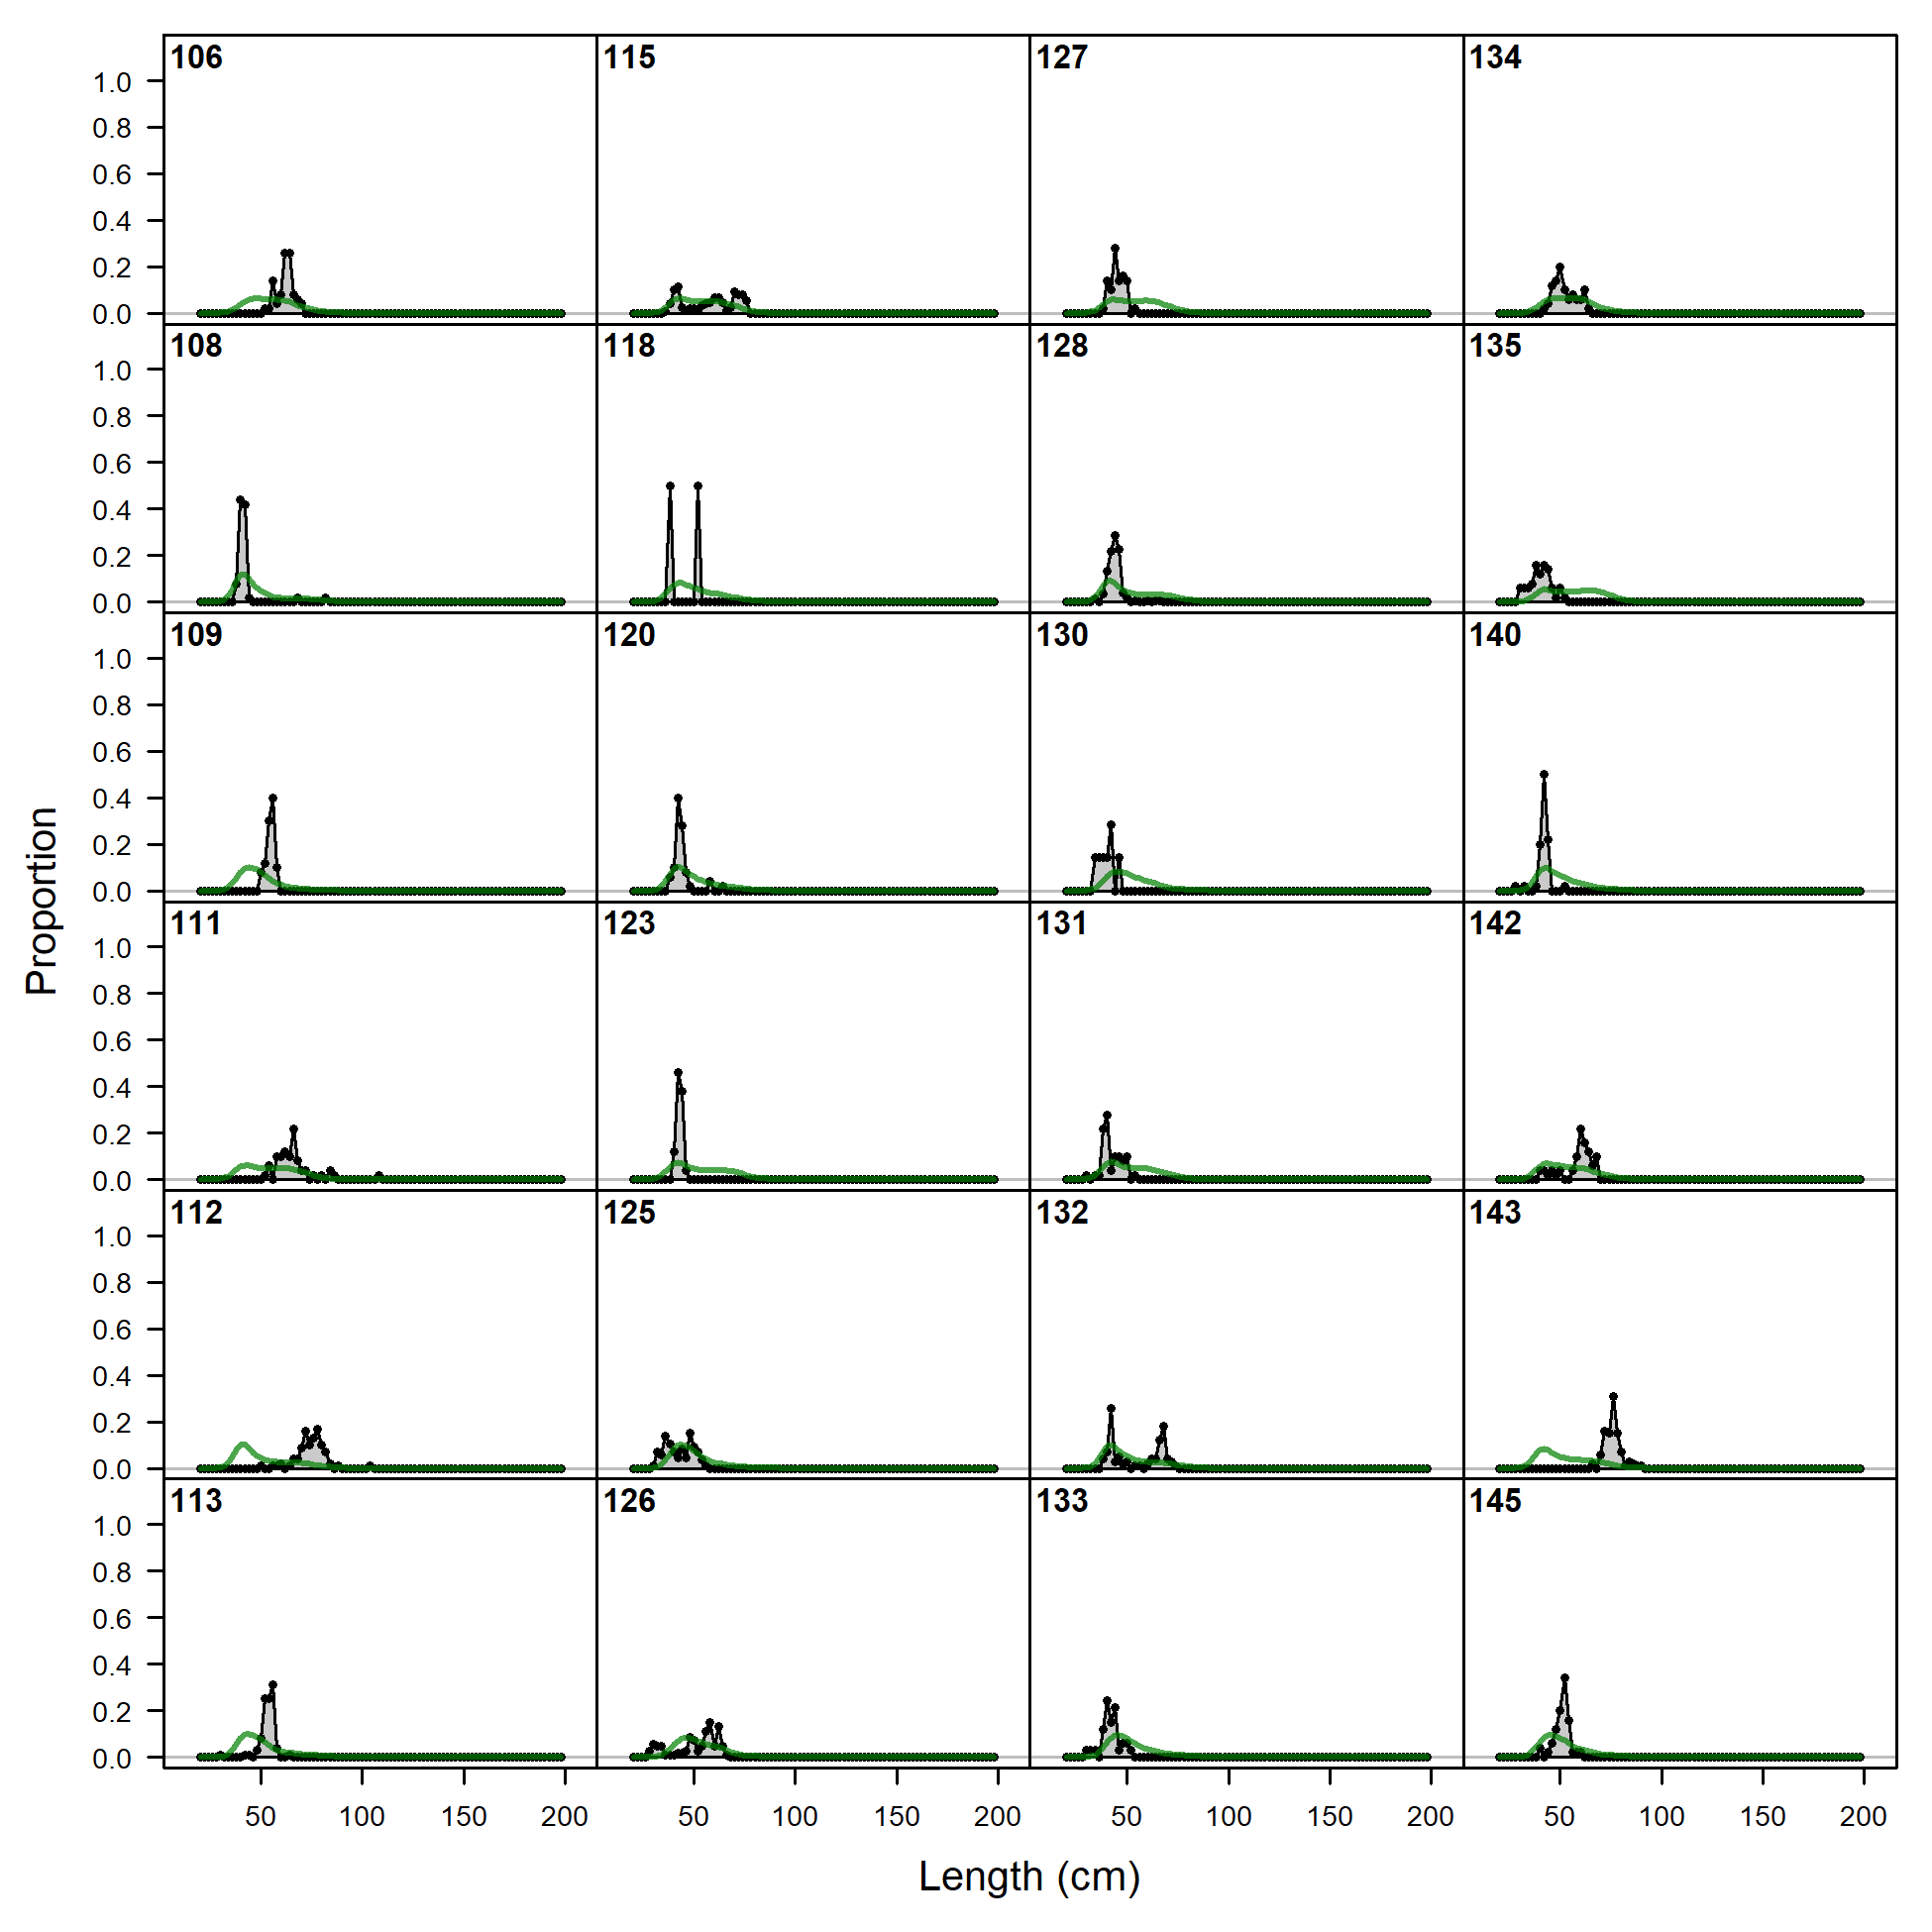
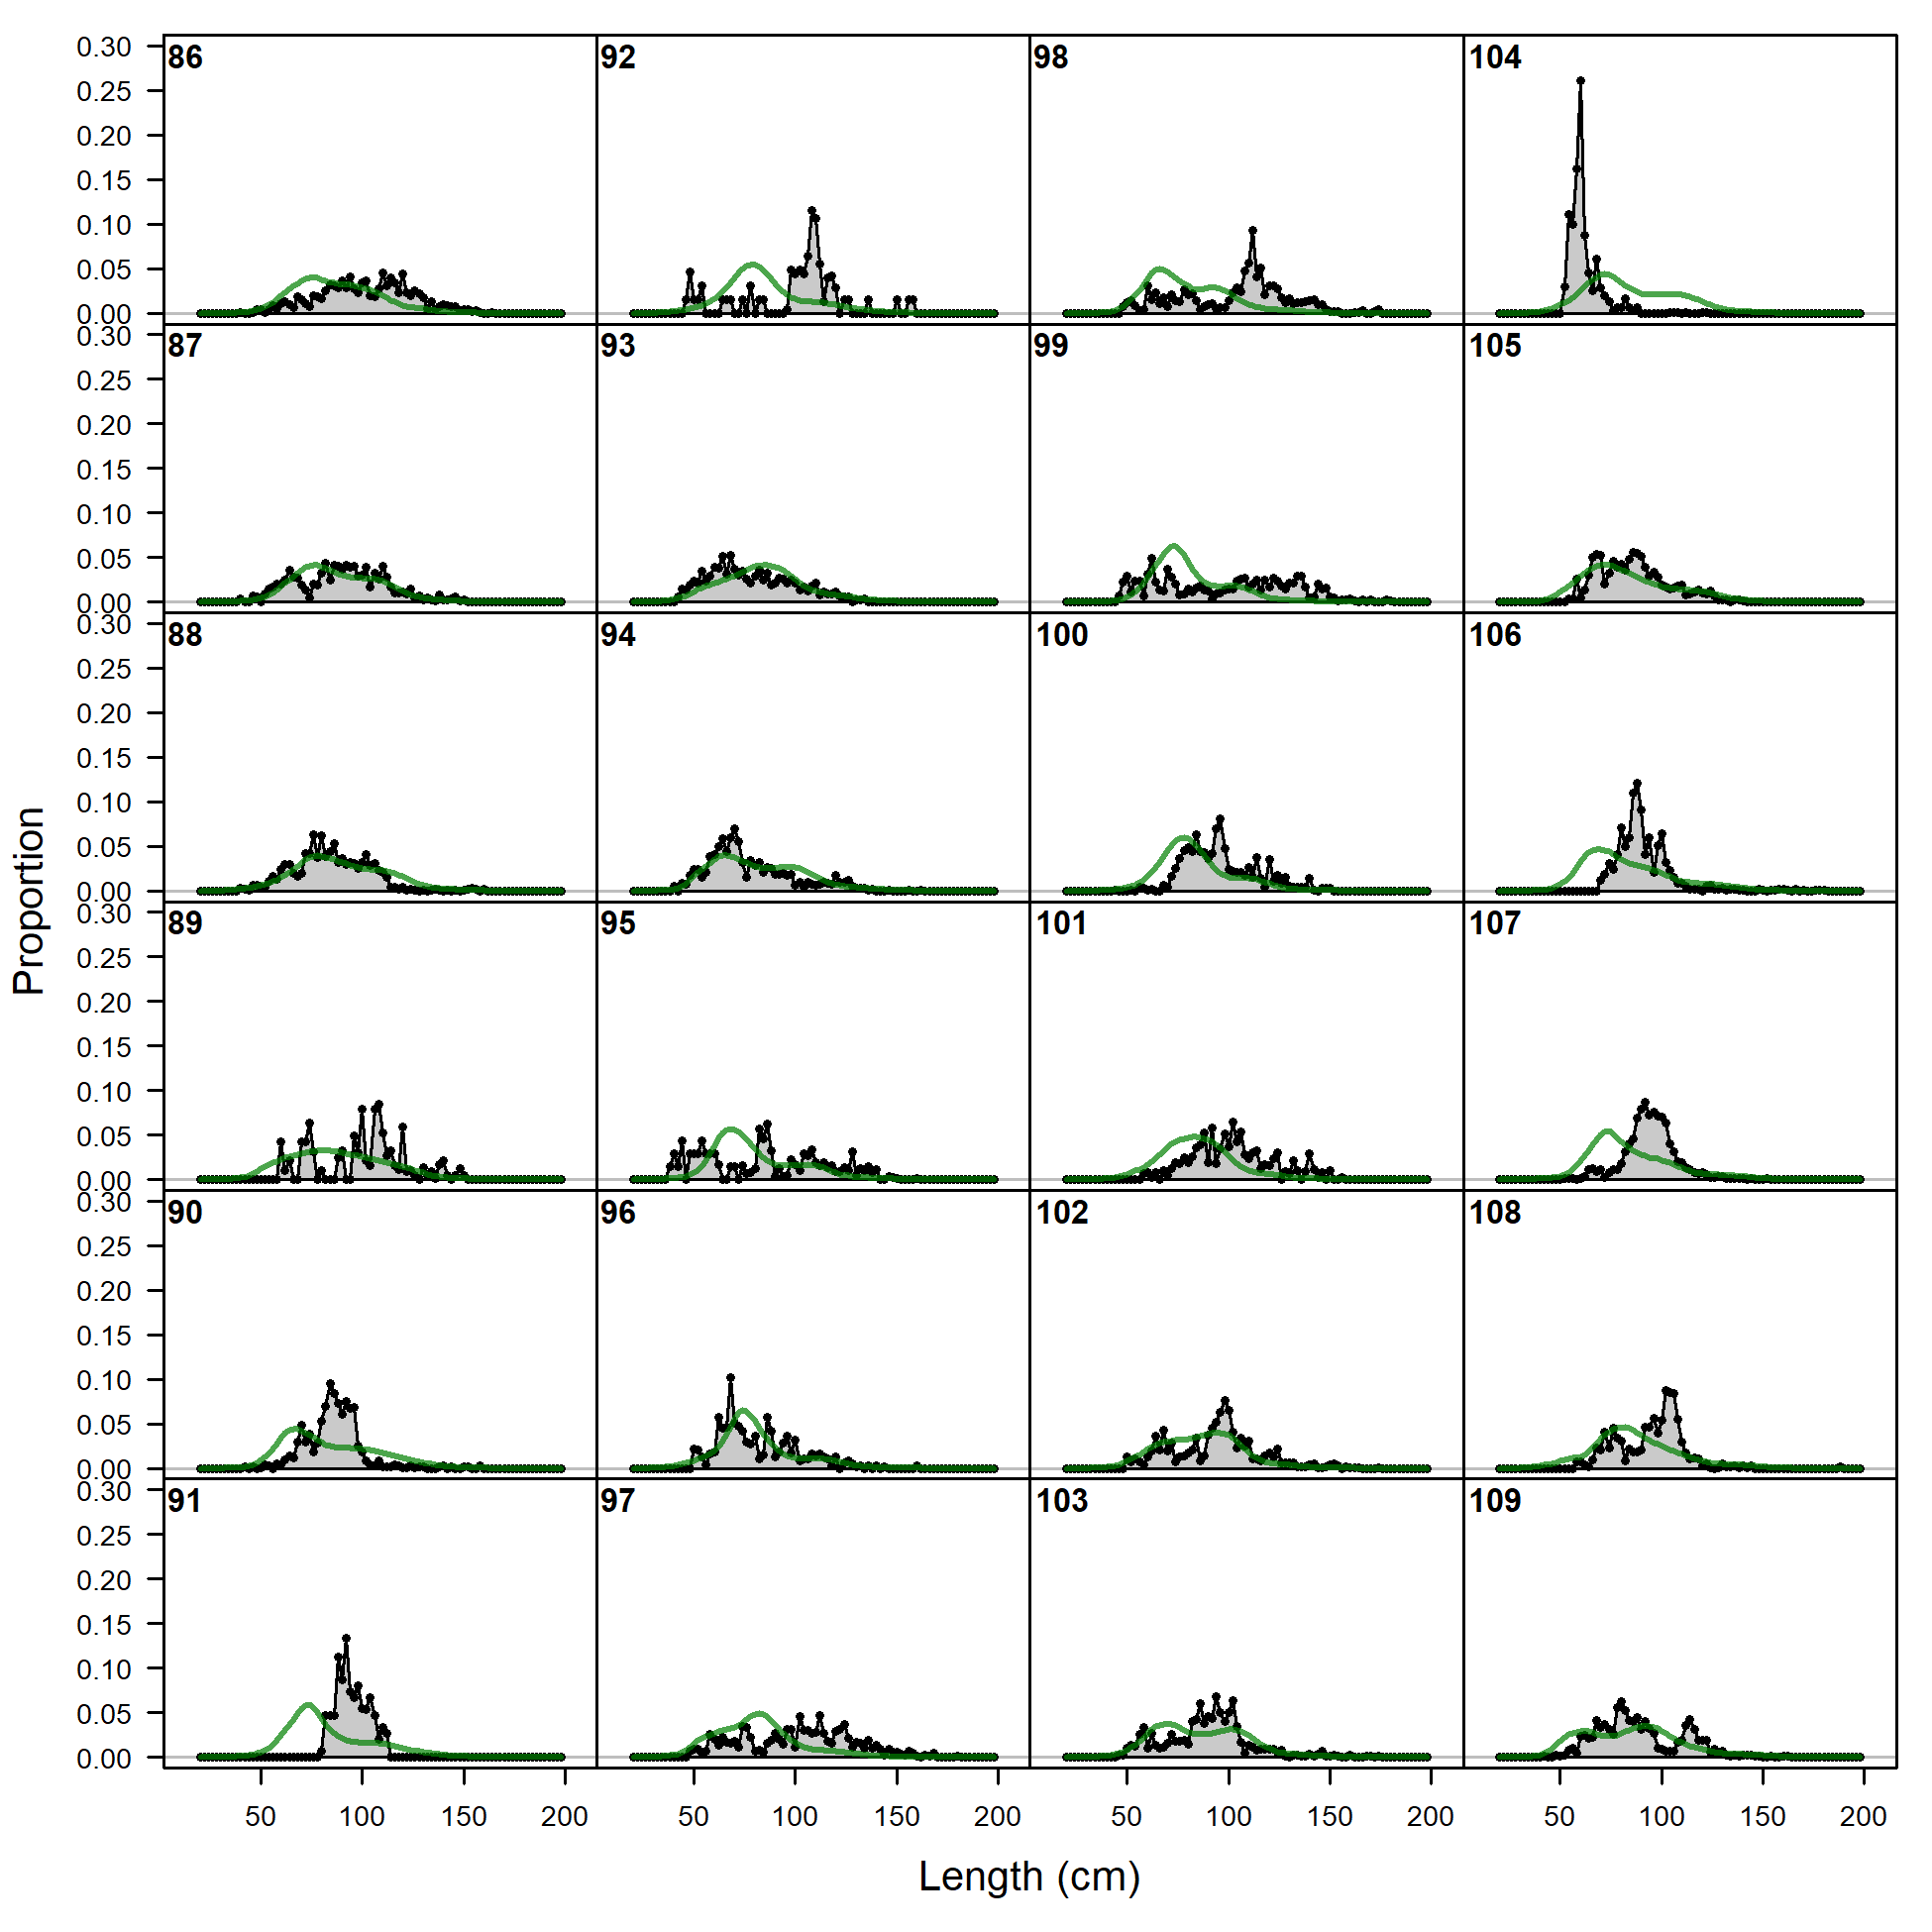
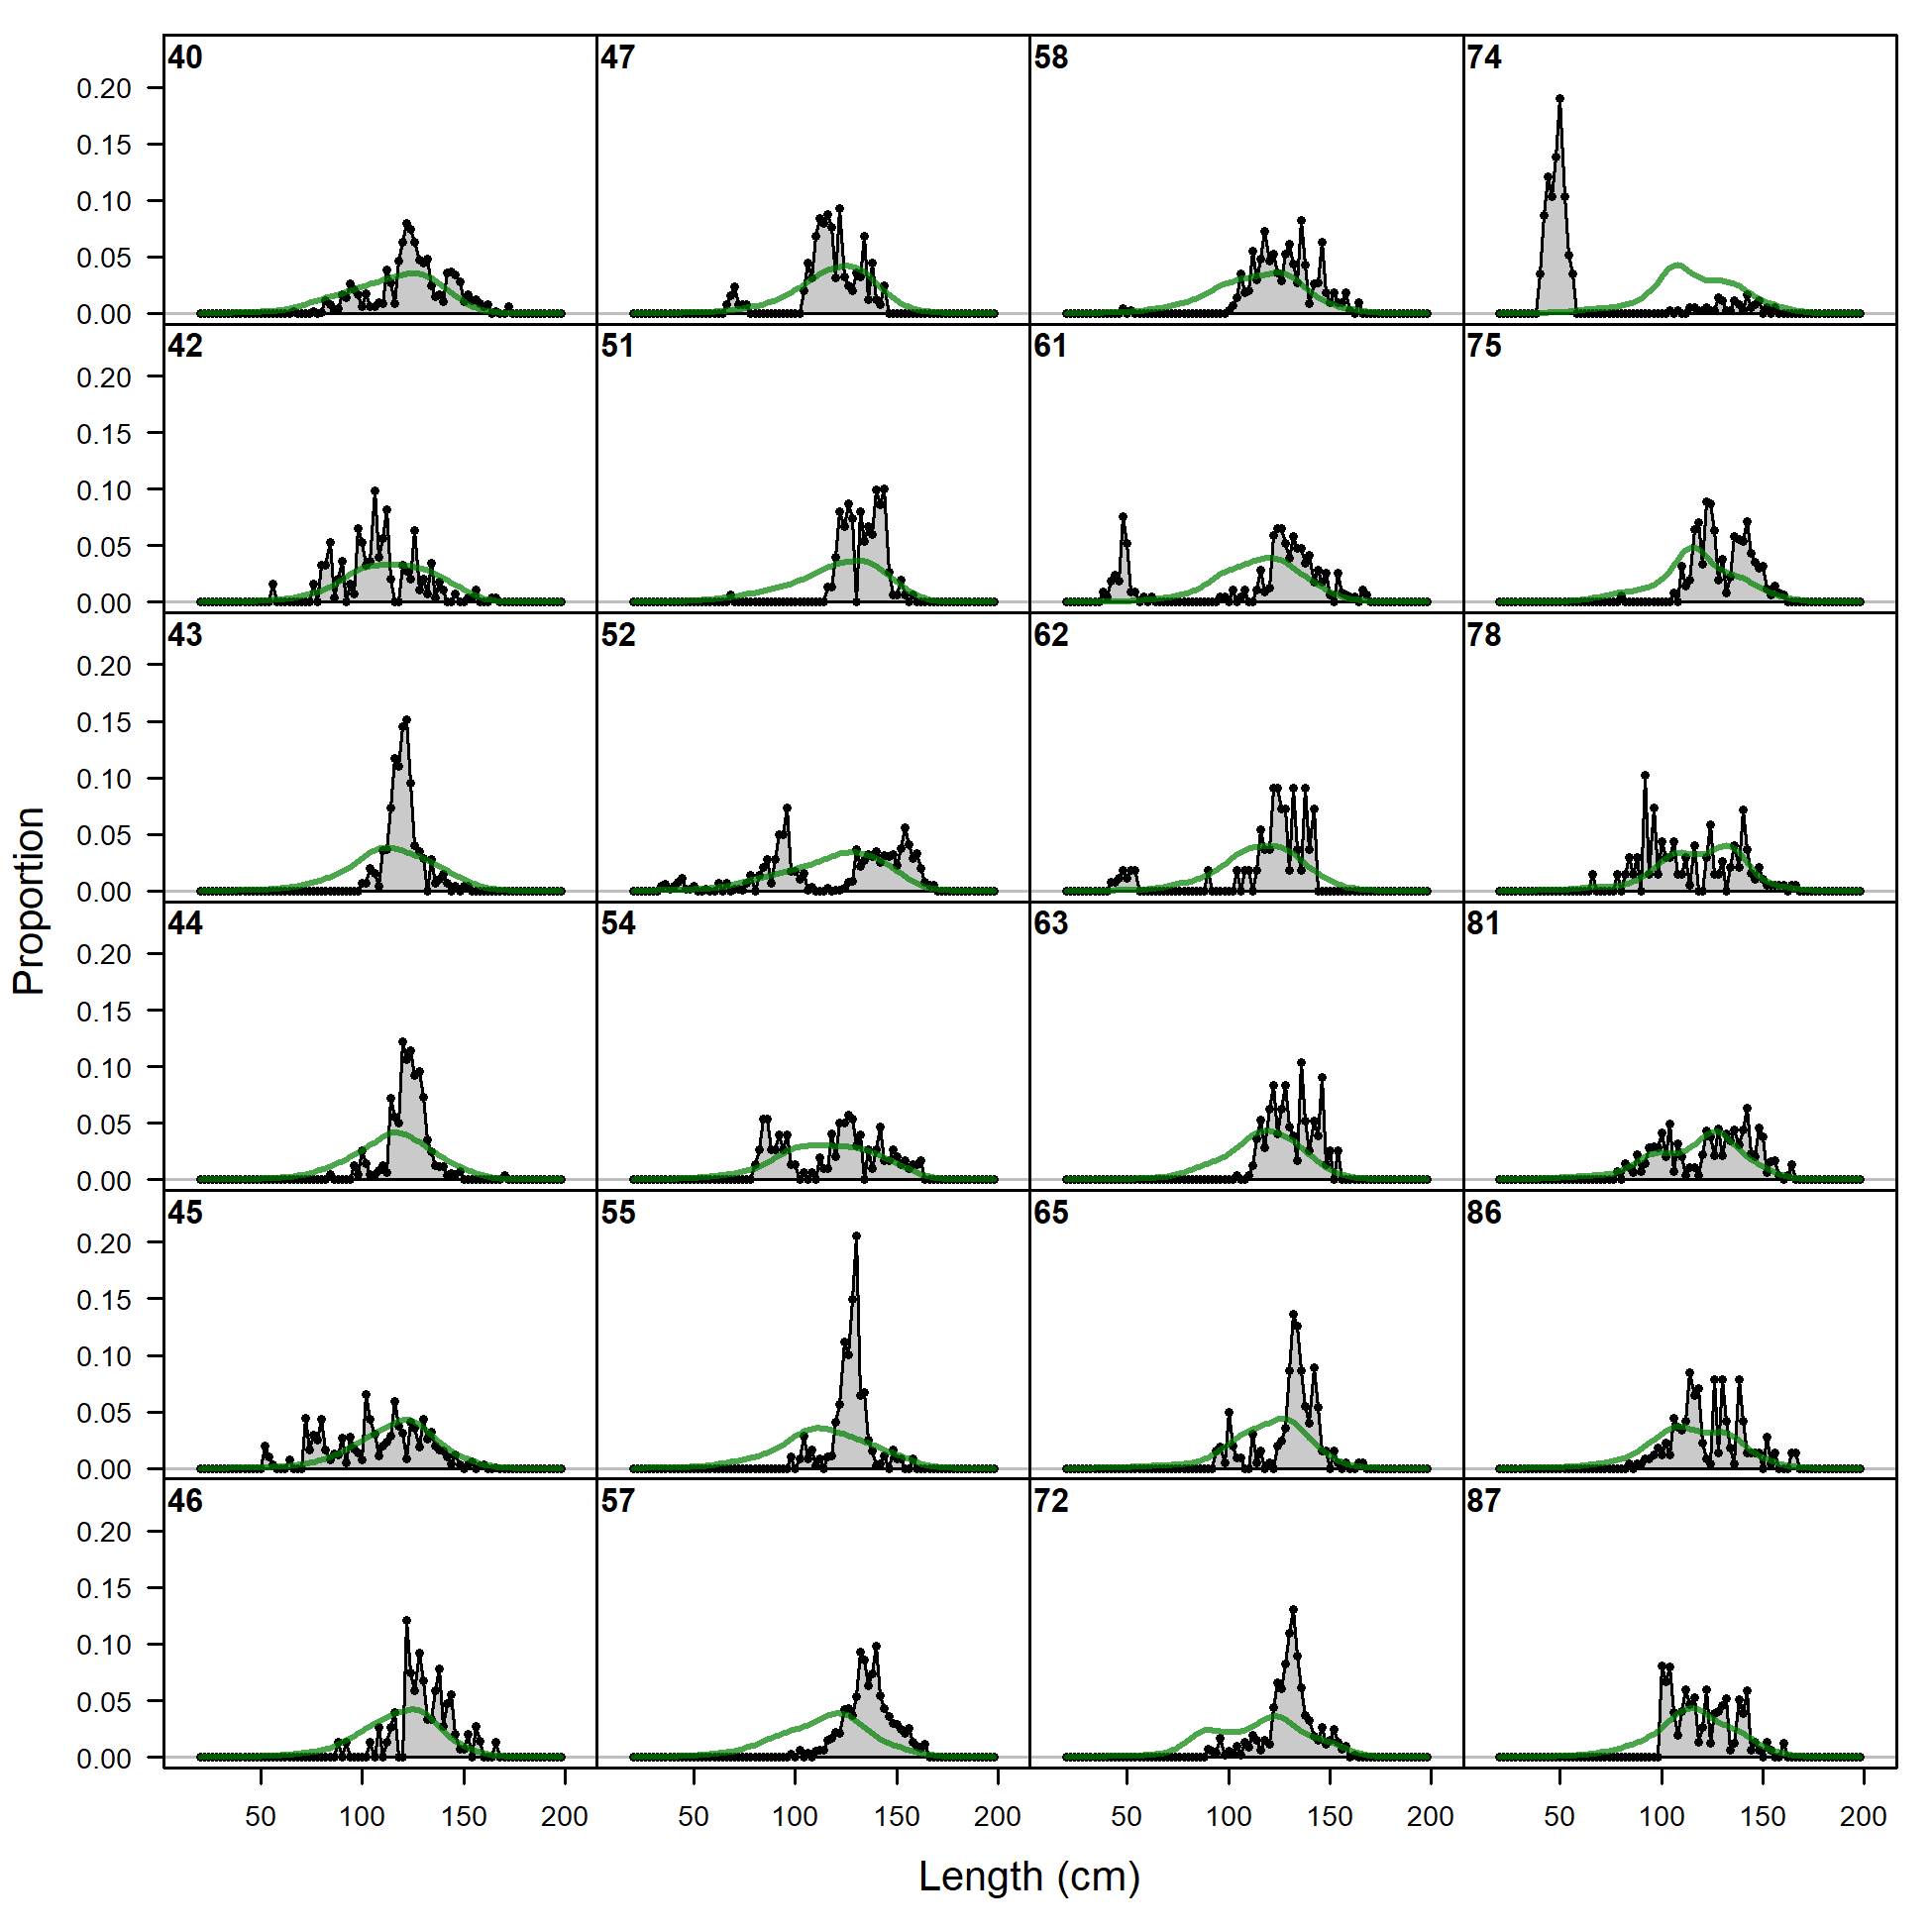
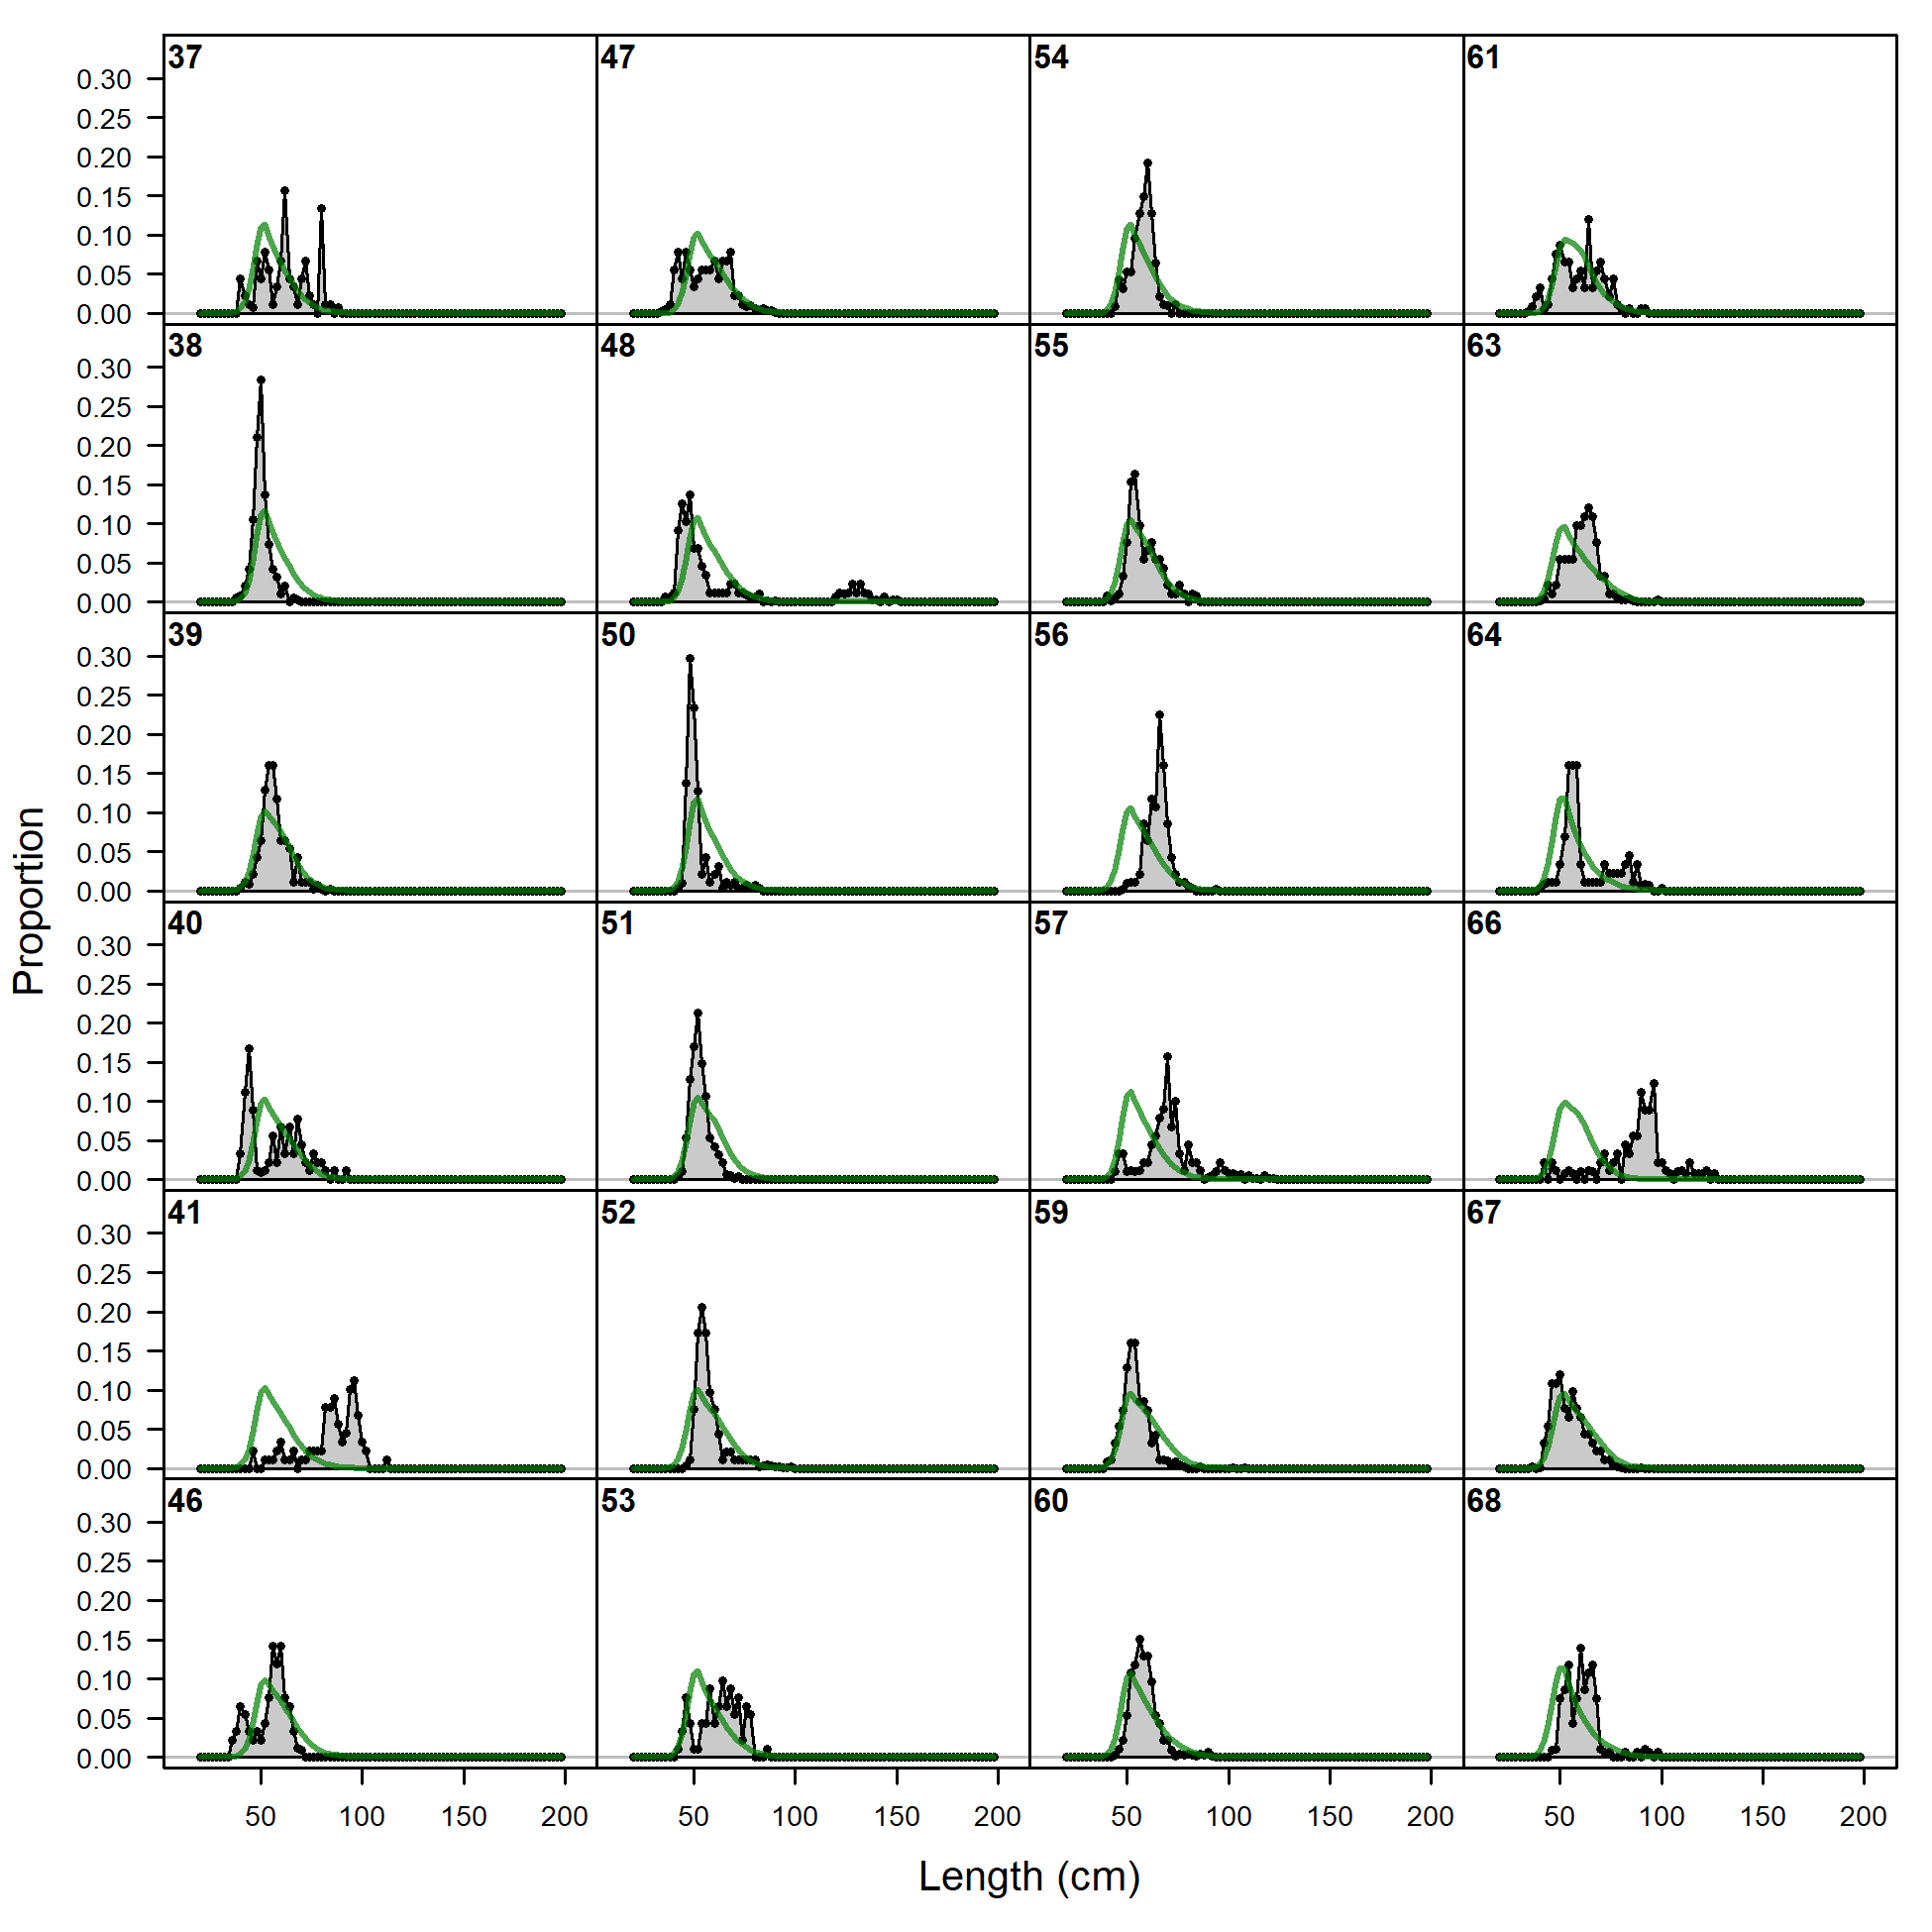
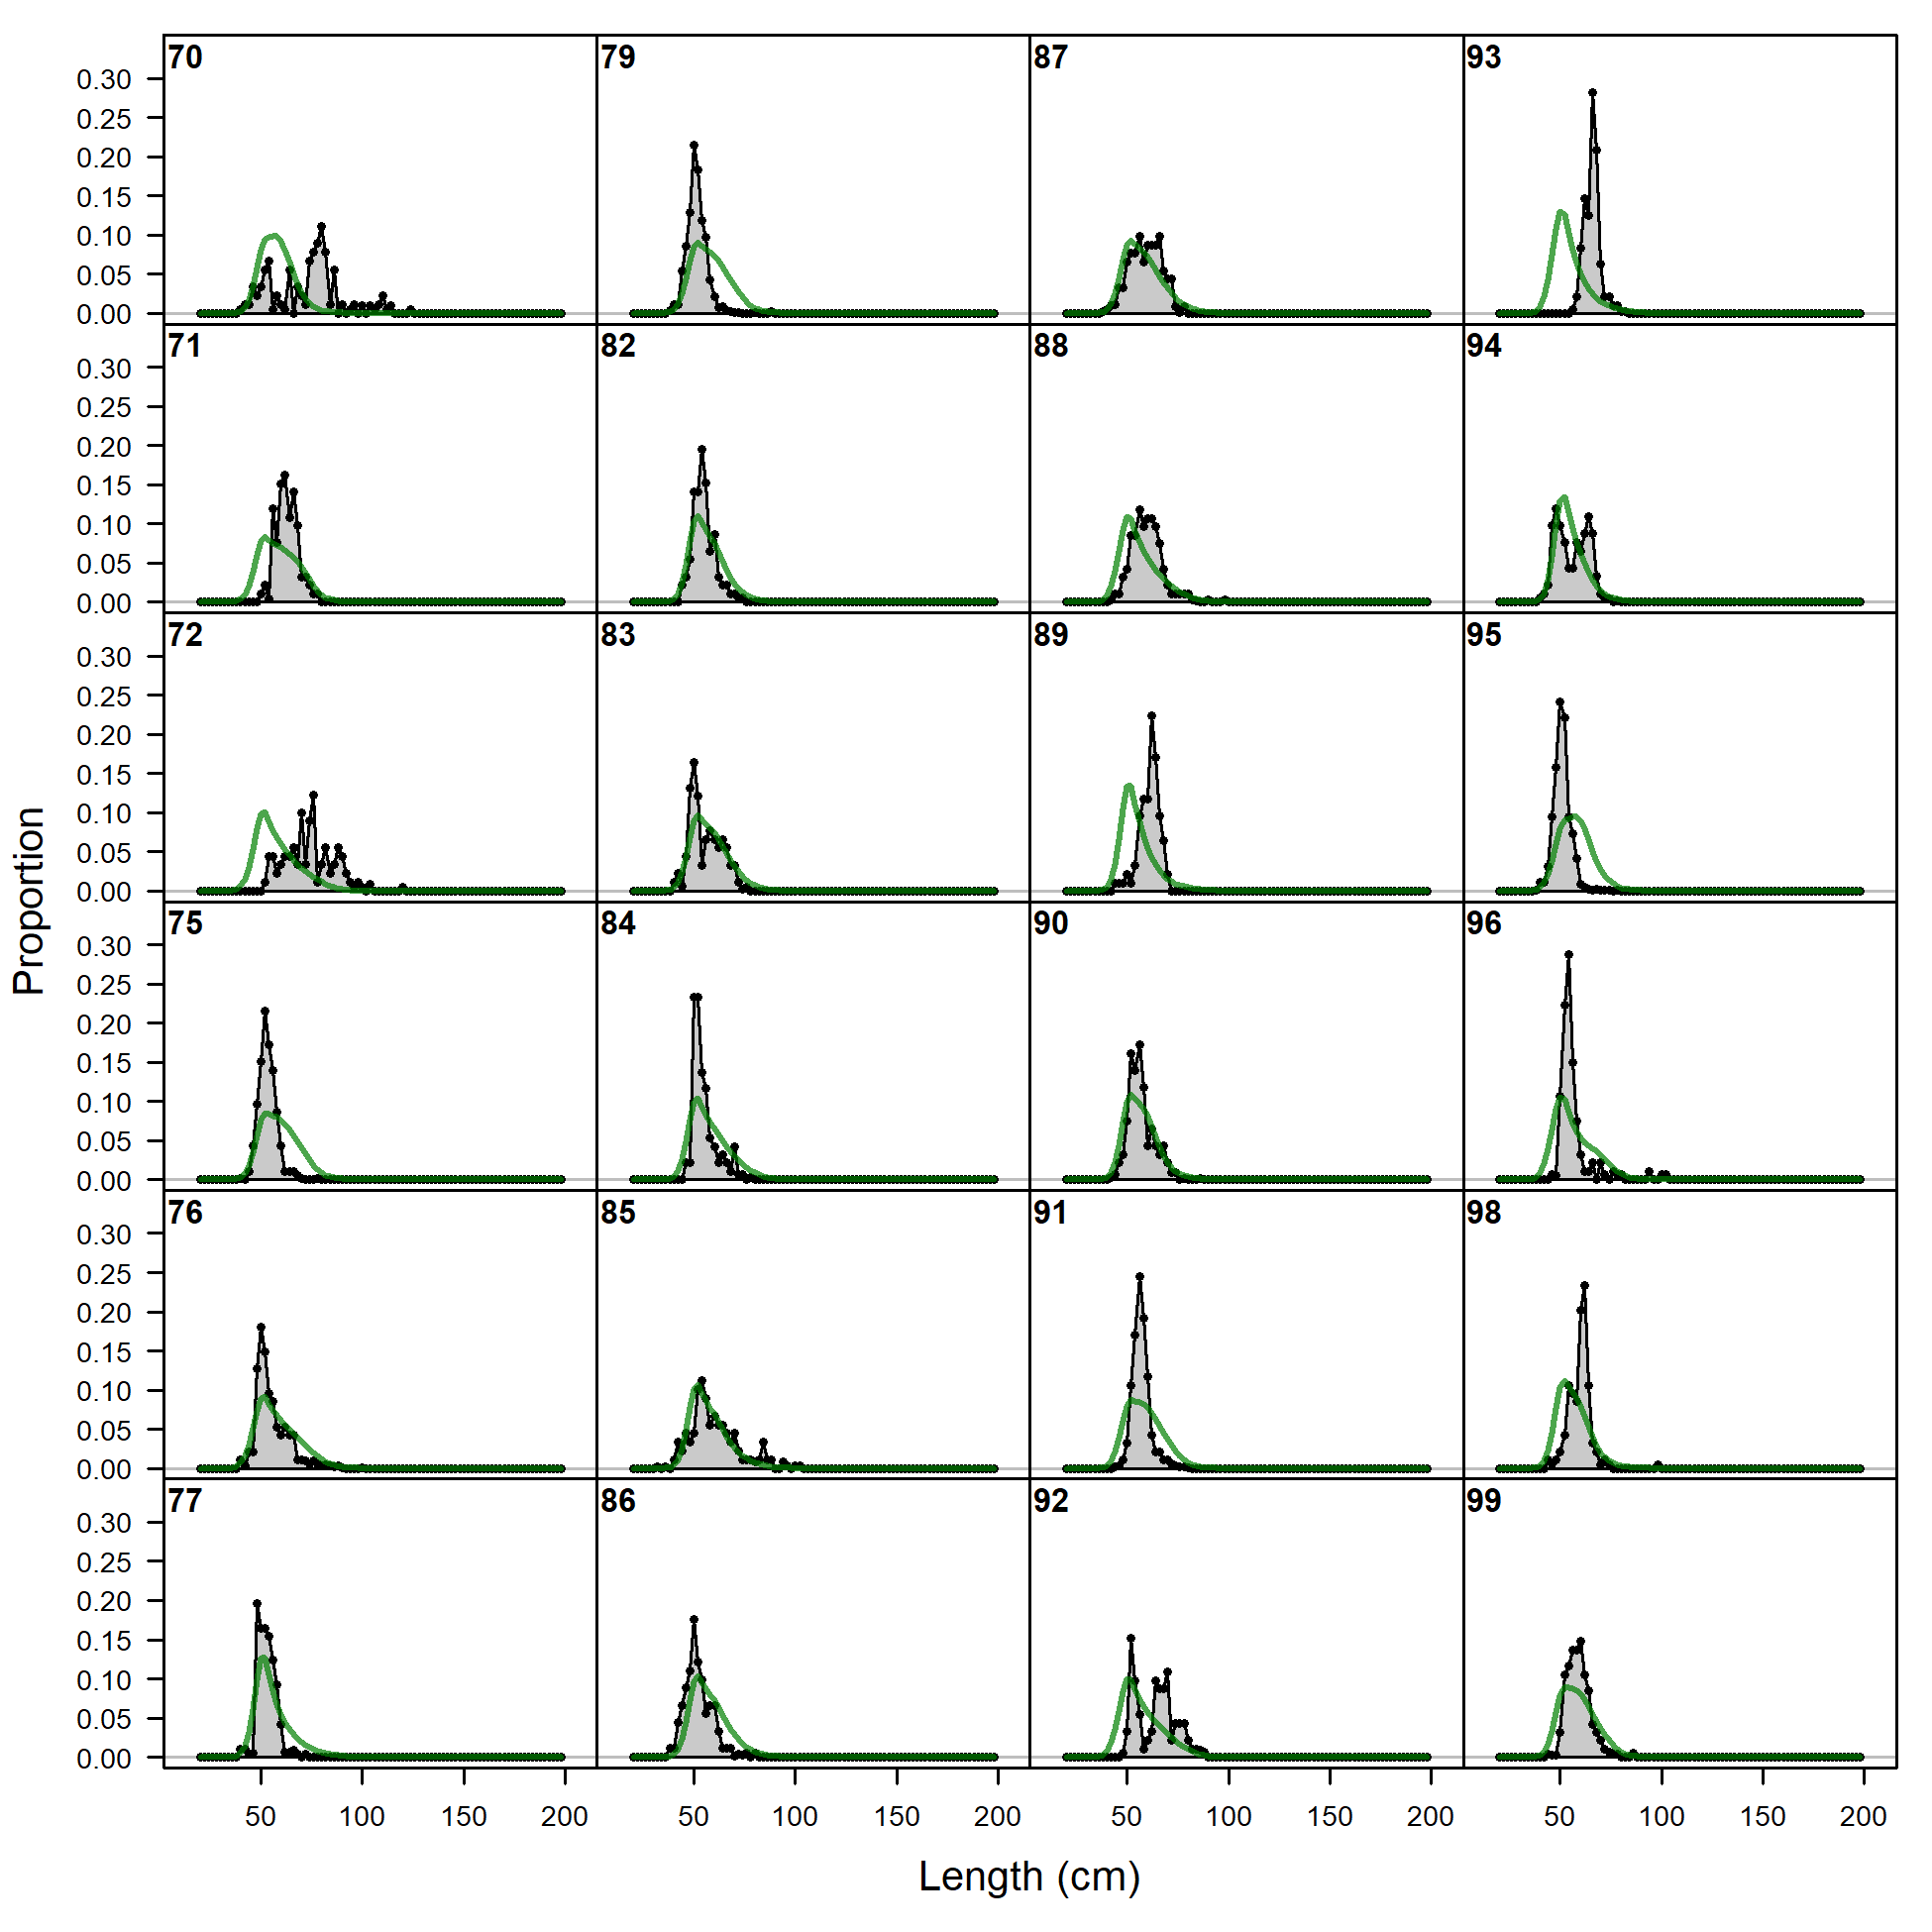
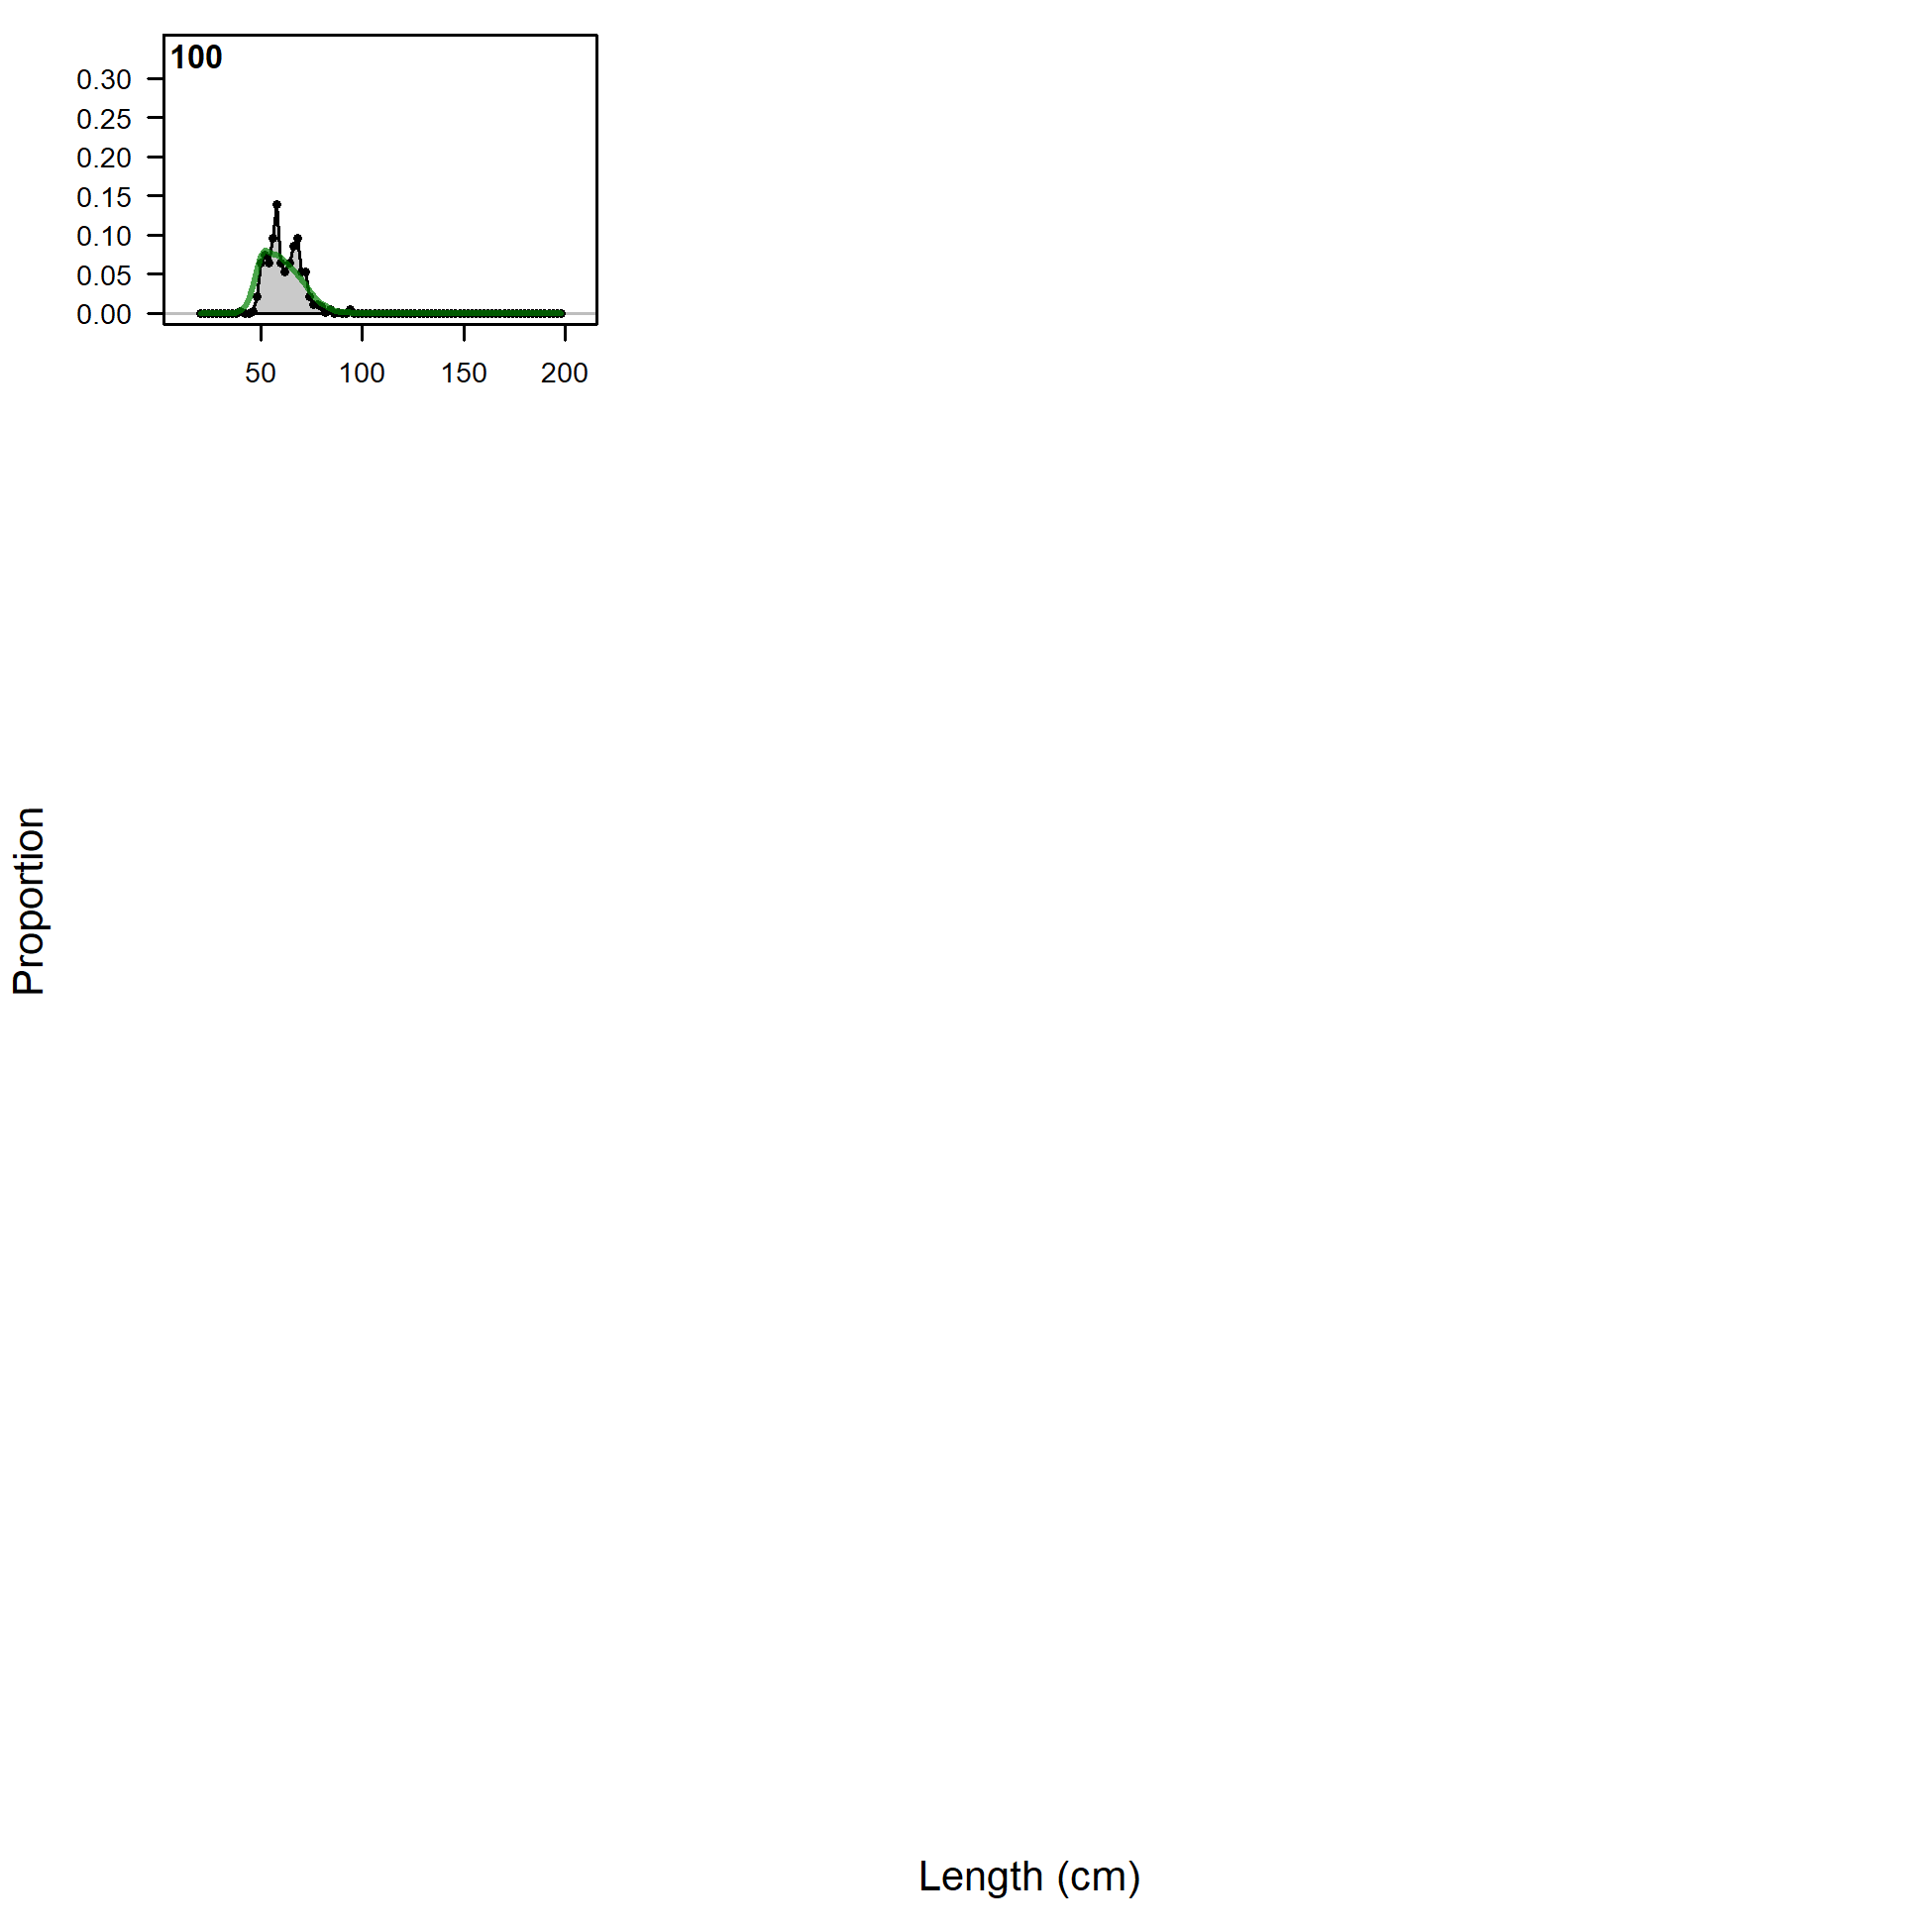
Length comps, retained, F3_PS_OBJ_Offshore (plot 1 of 5).
'N adj.' is the input sample size after data-weighting adjustment. N eff. is the calculated effective sample size used in the McAllister-Ianelli tuning method.
file: comp_lenfit_flt3mkt2_page1.png
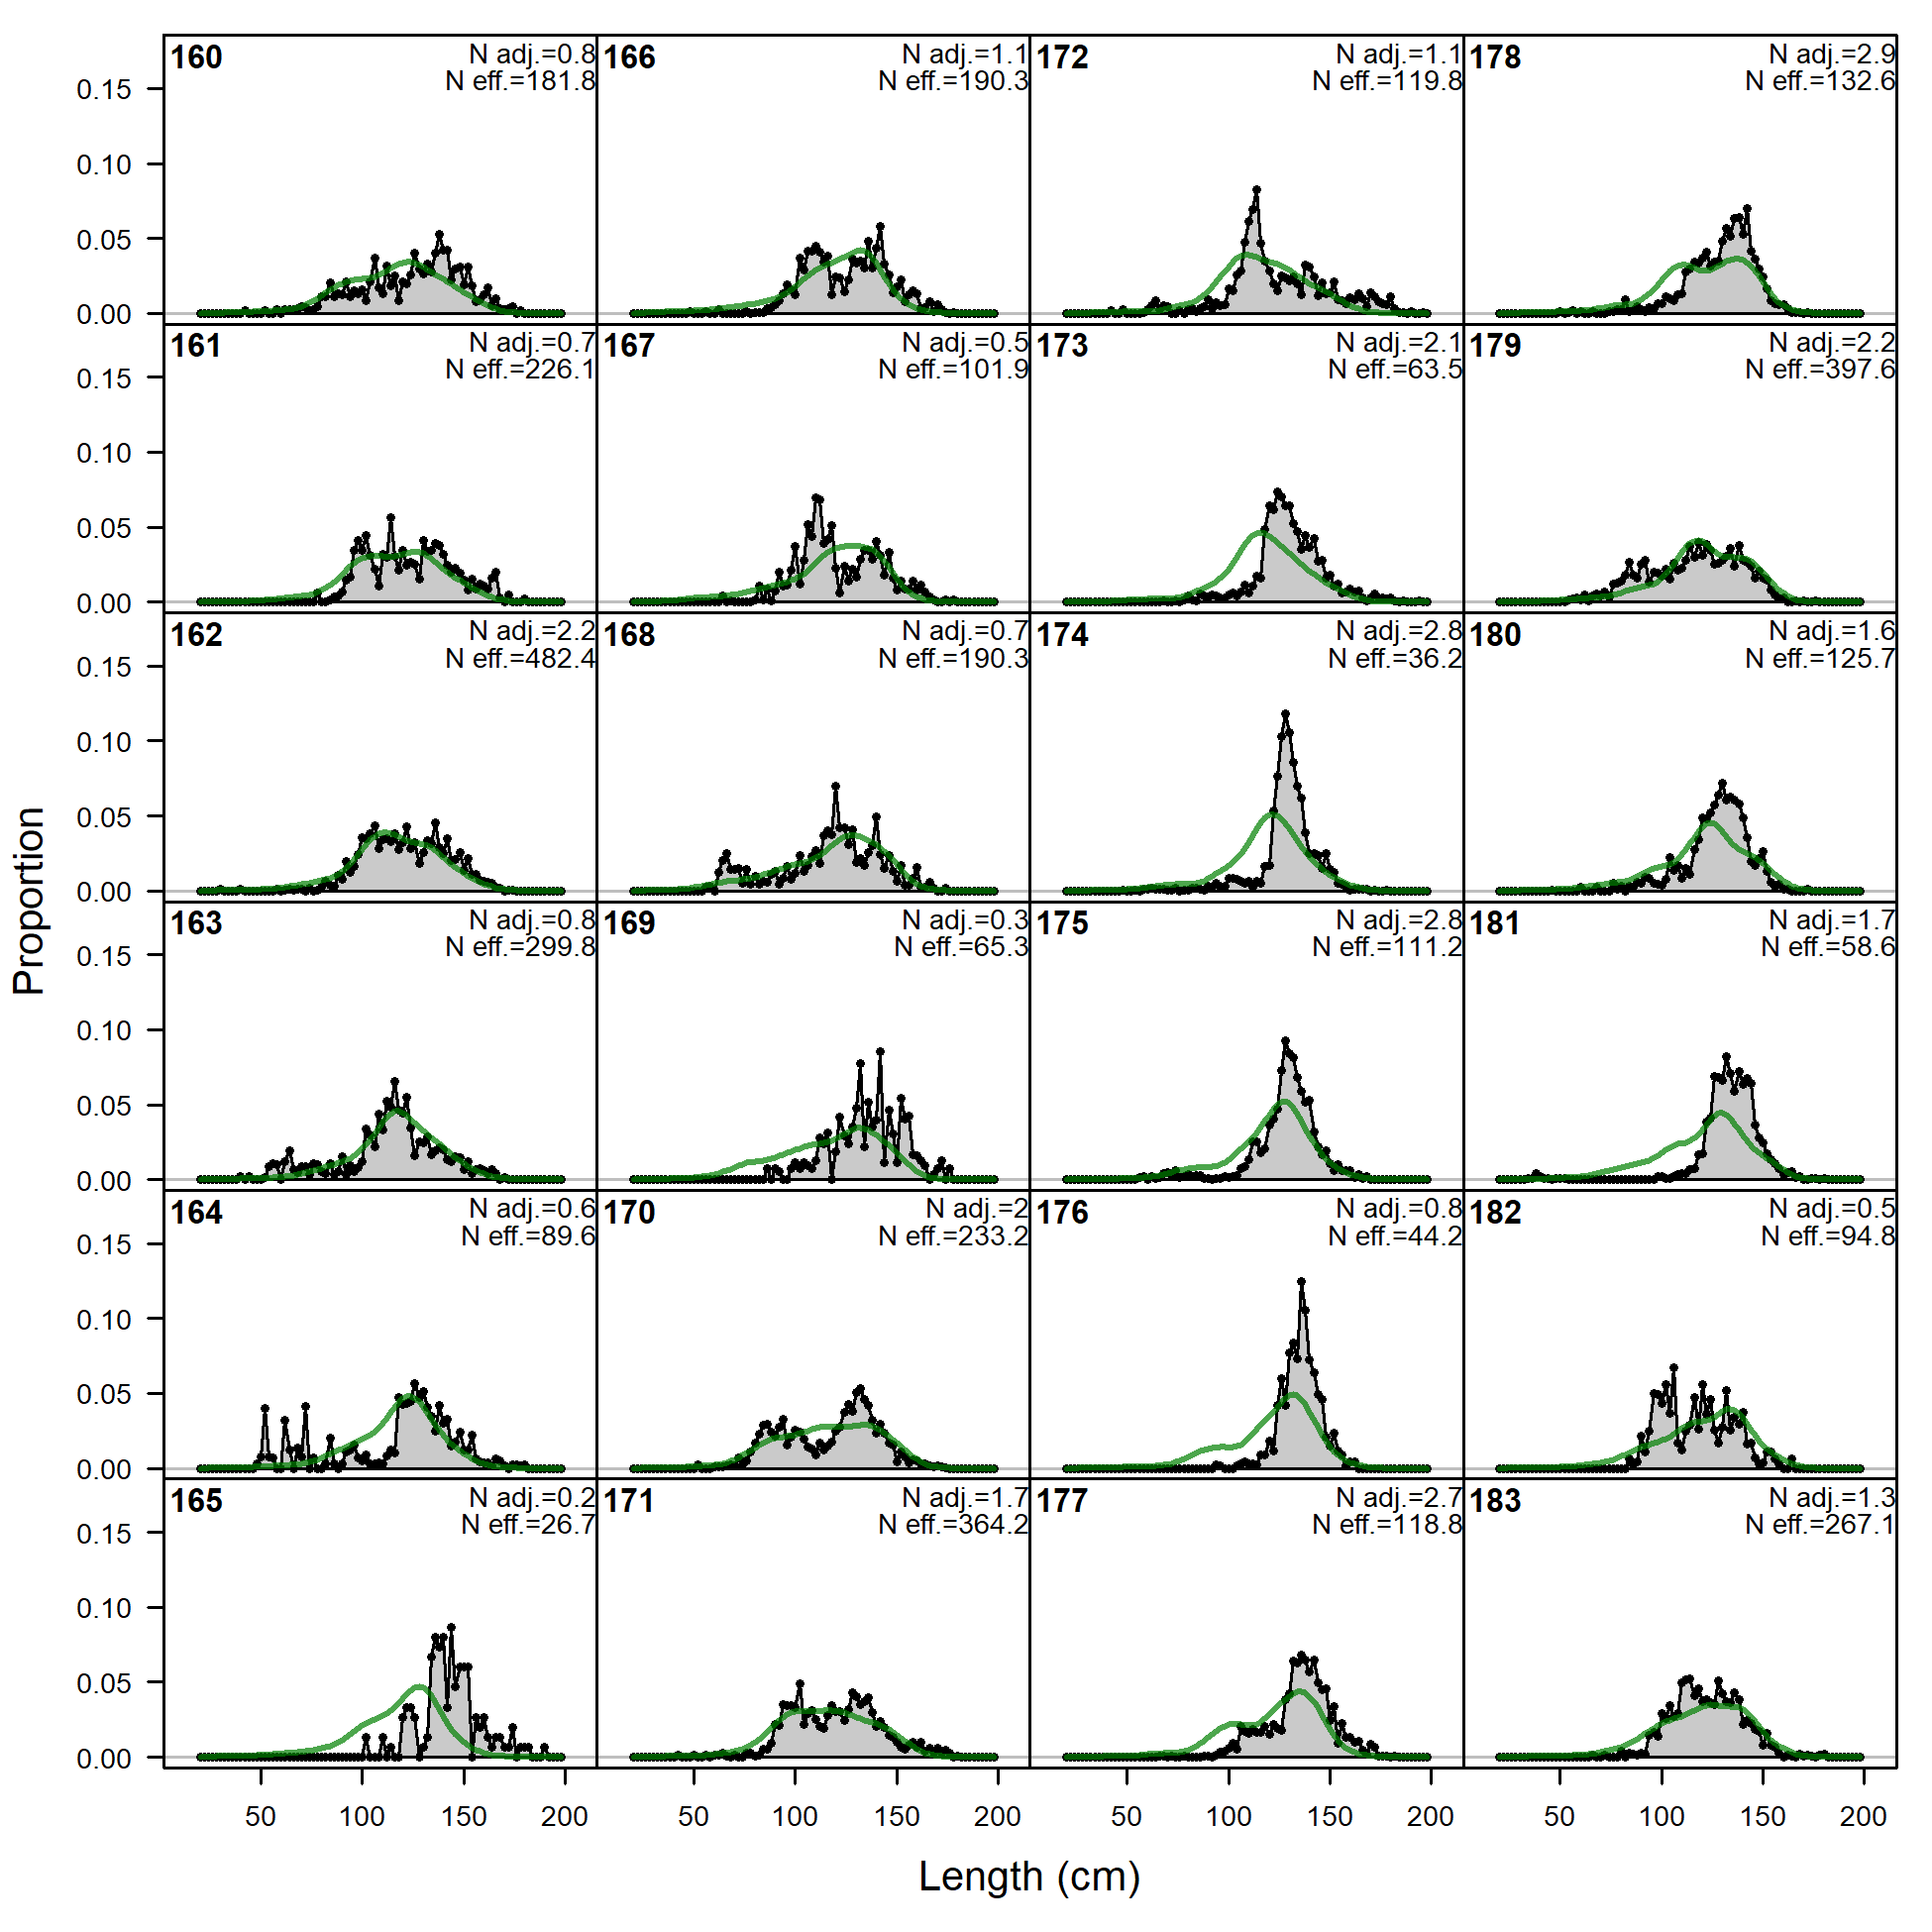
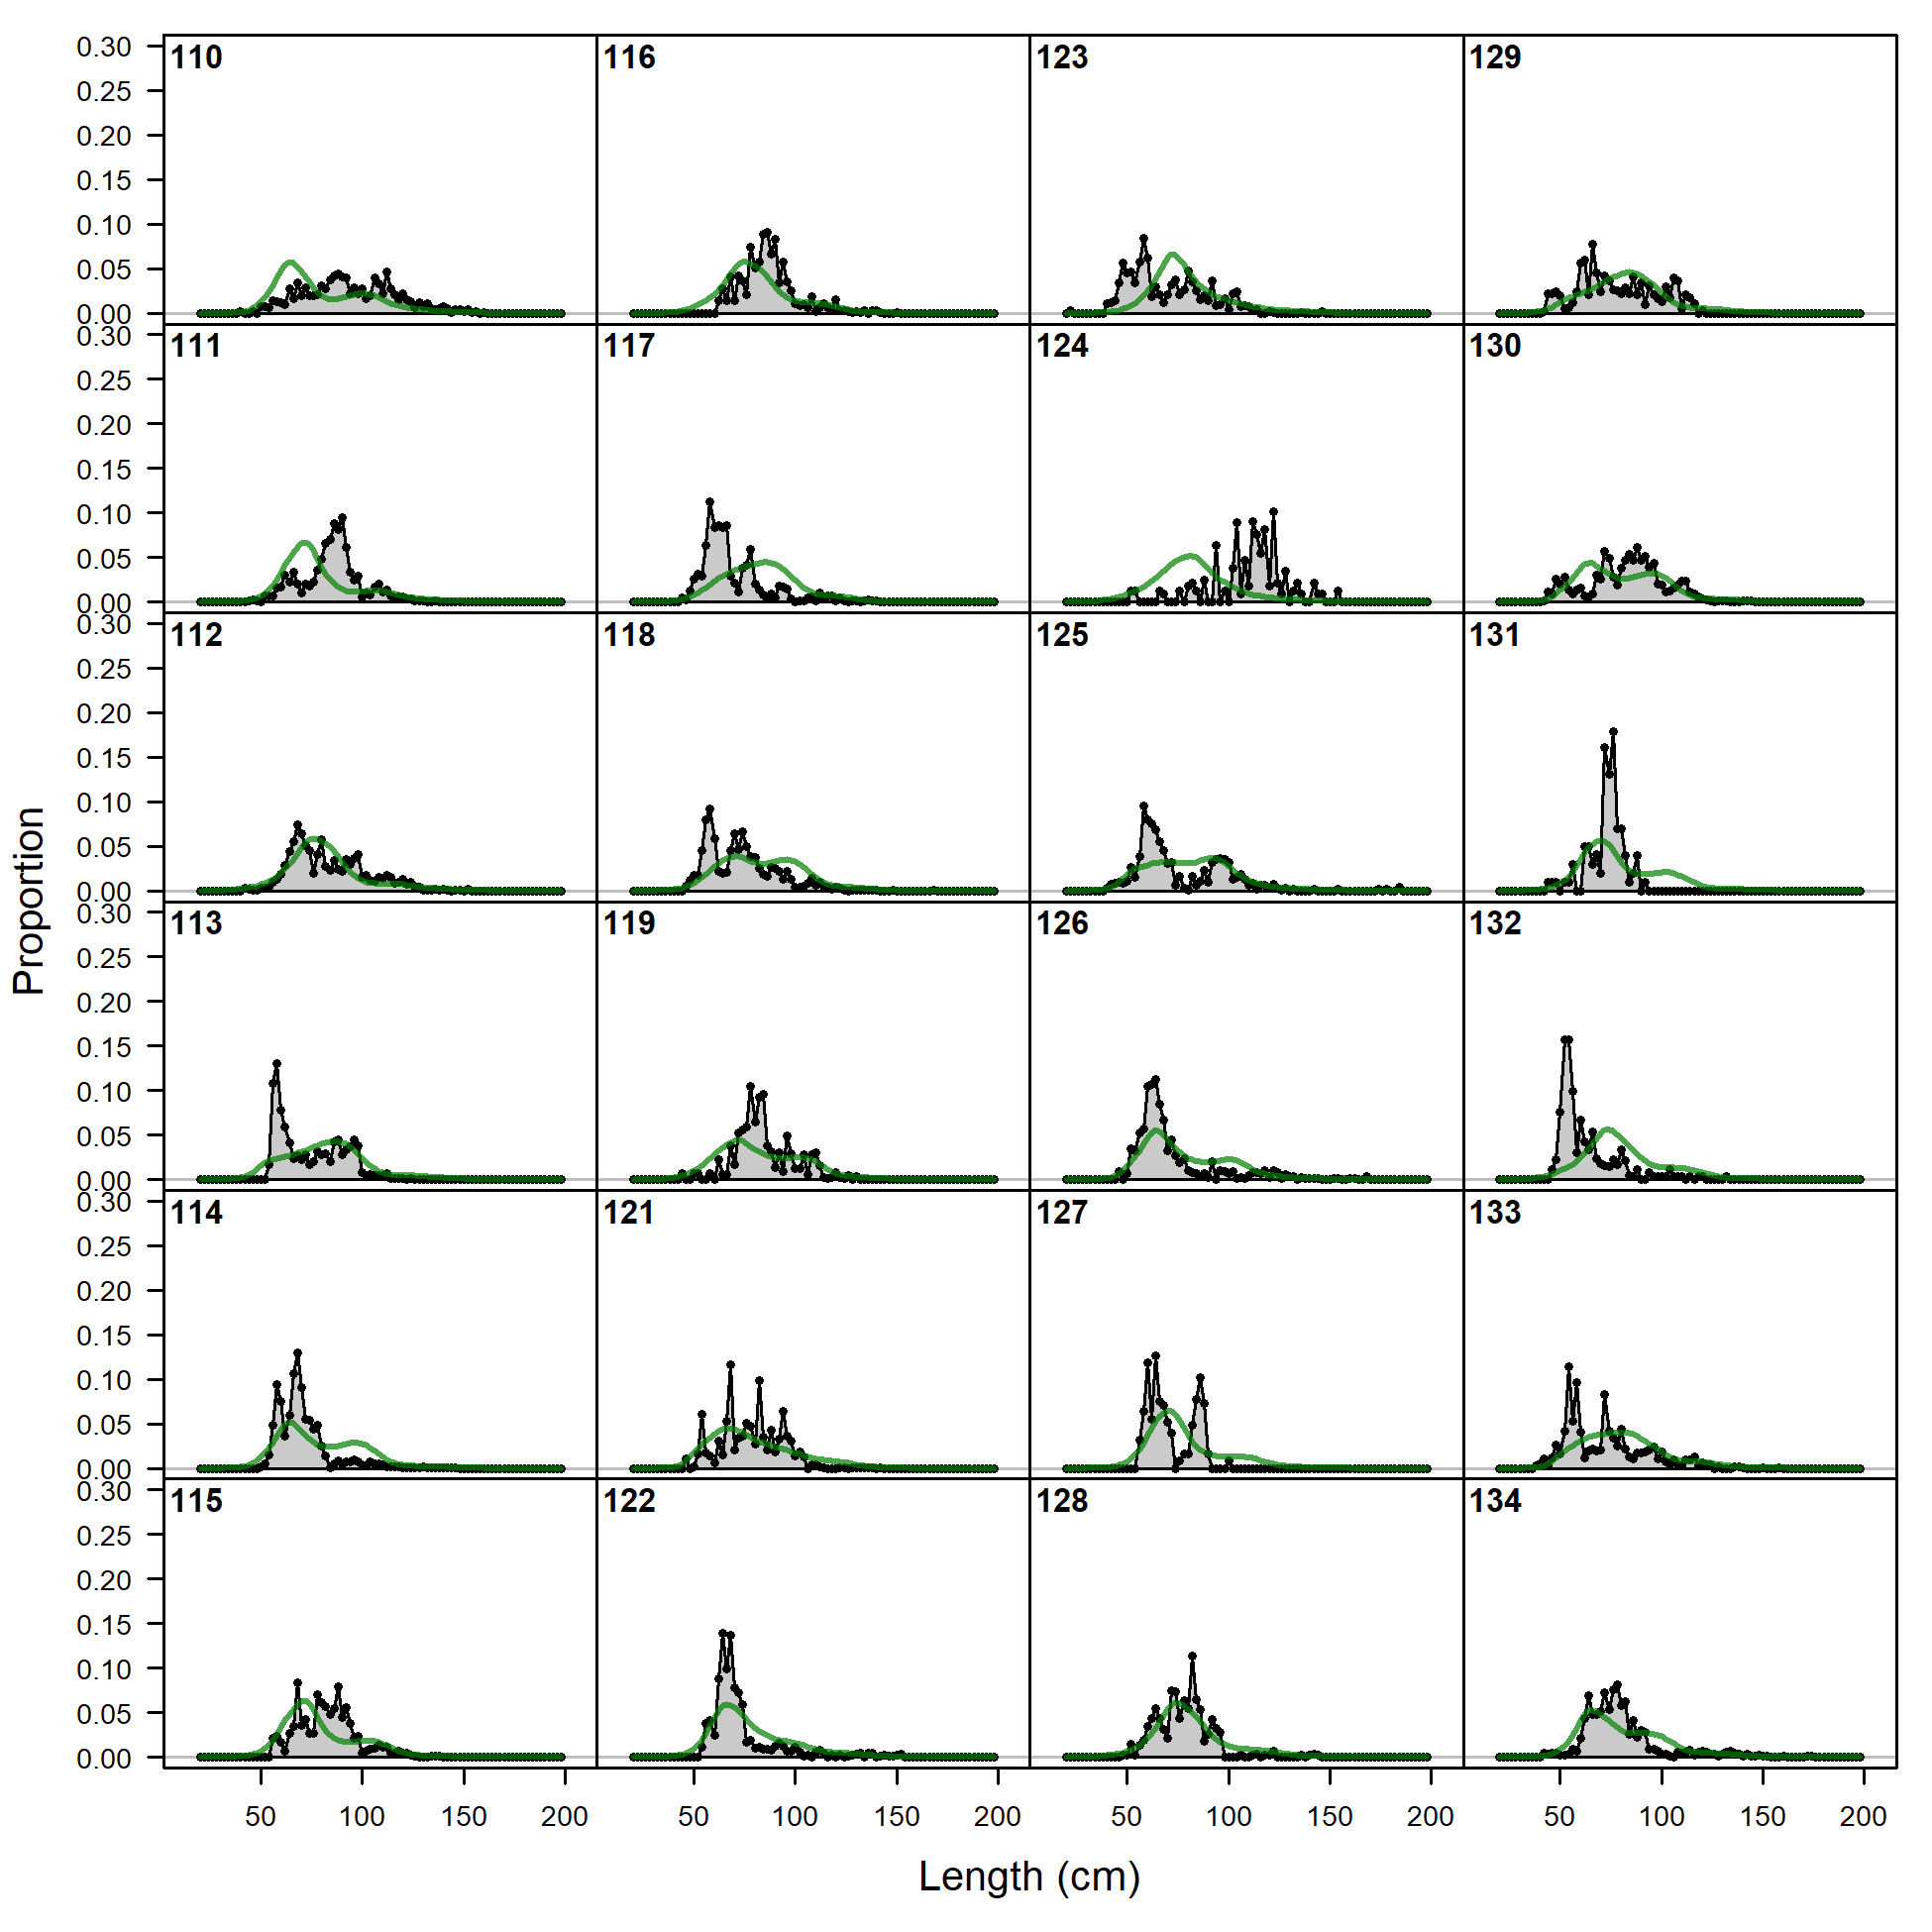
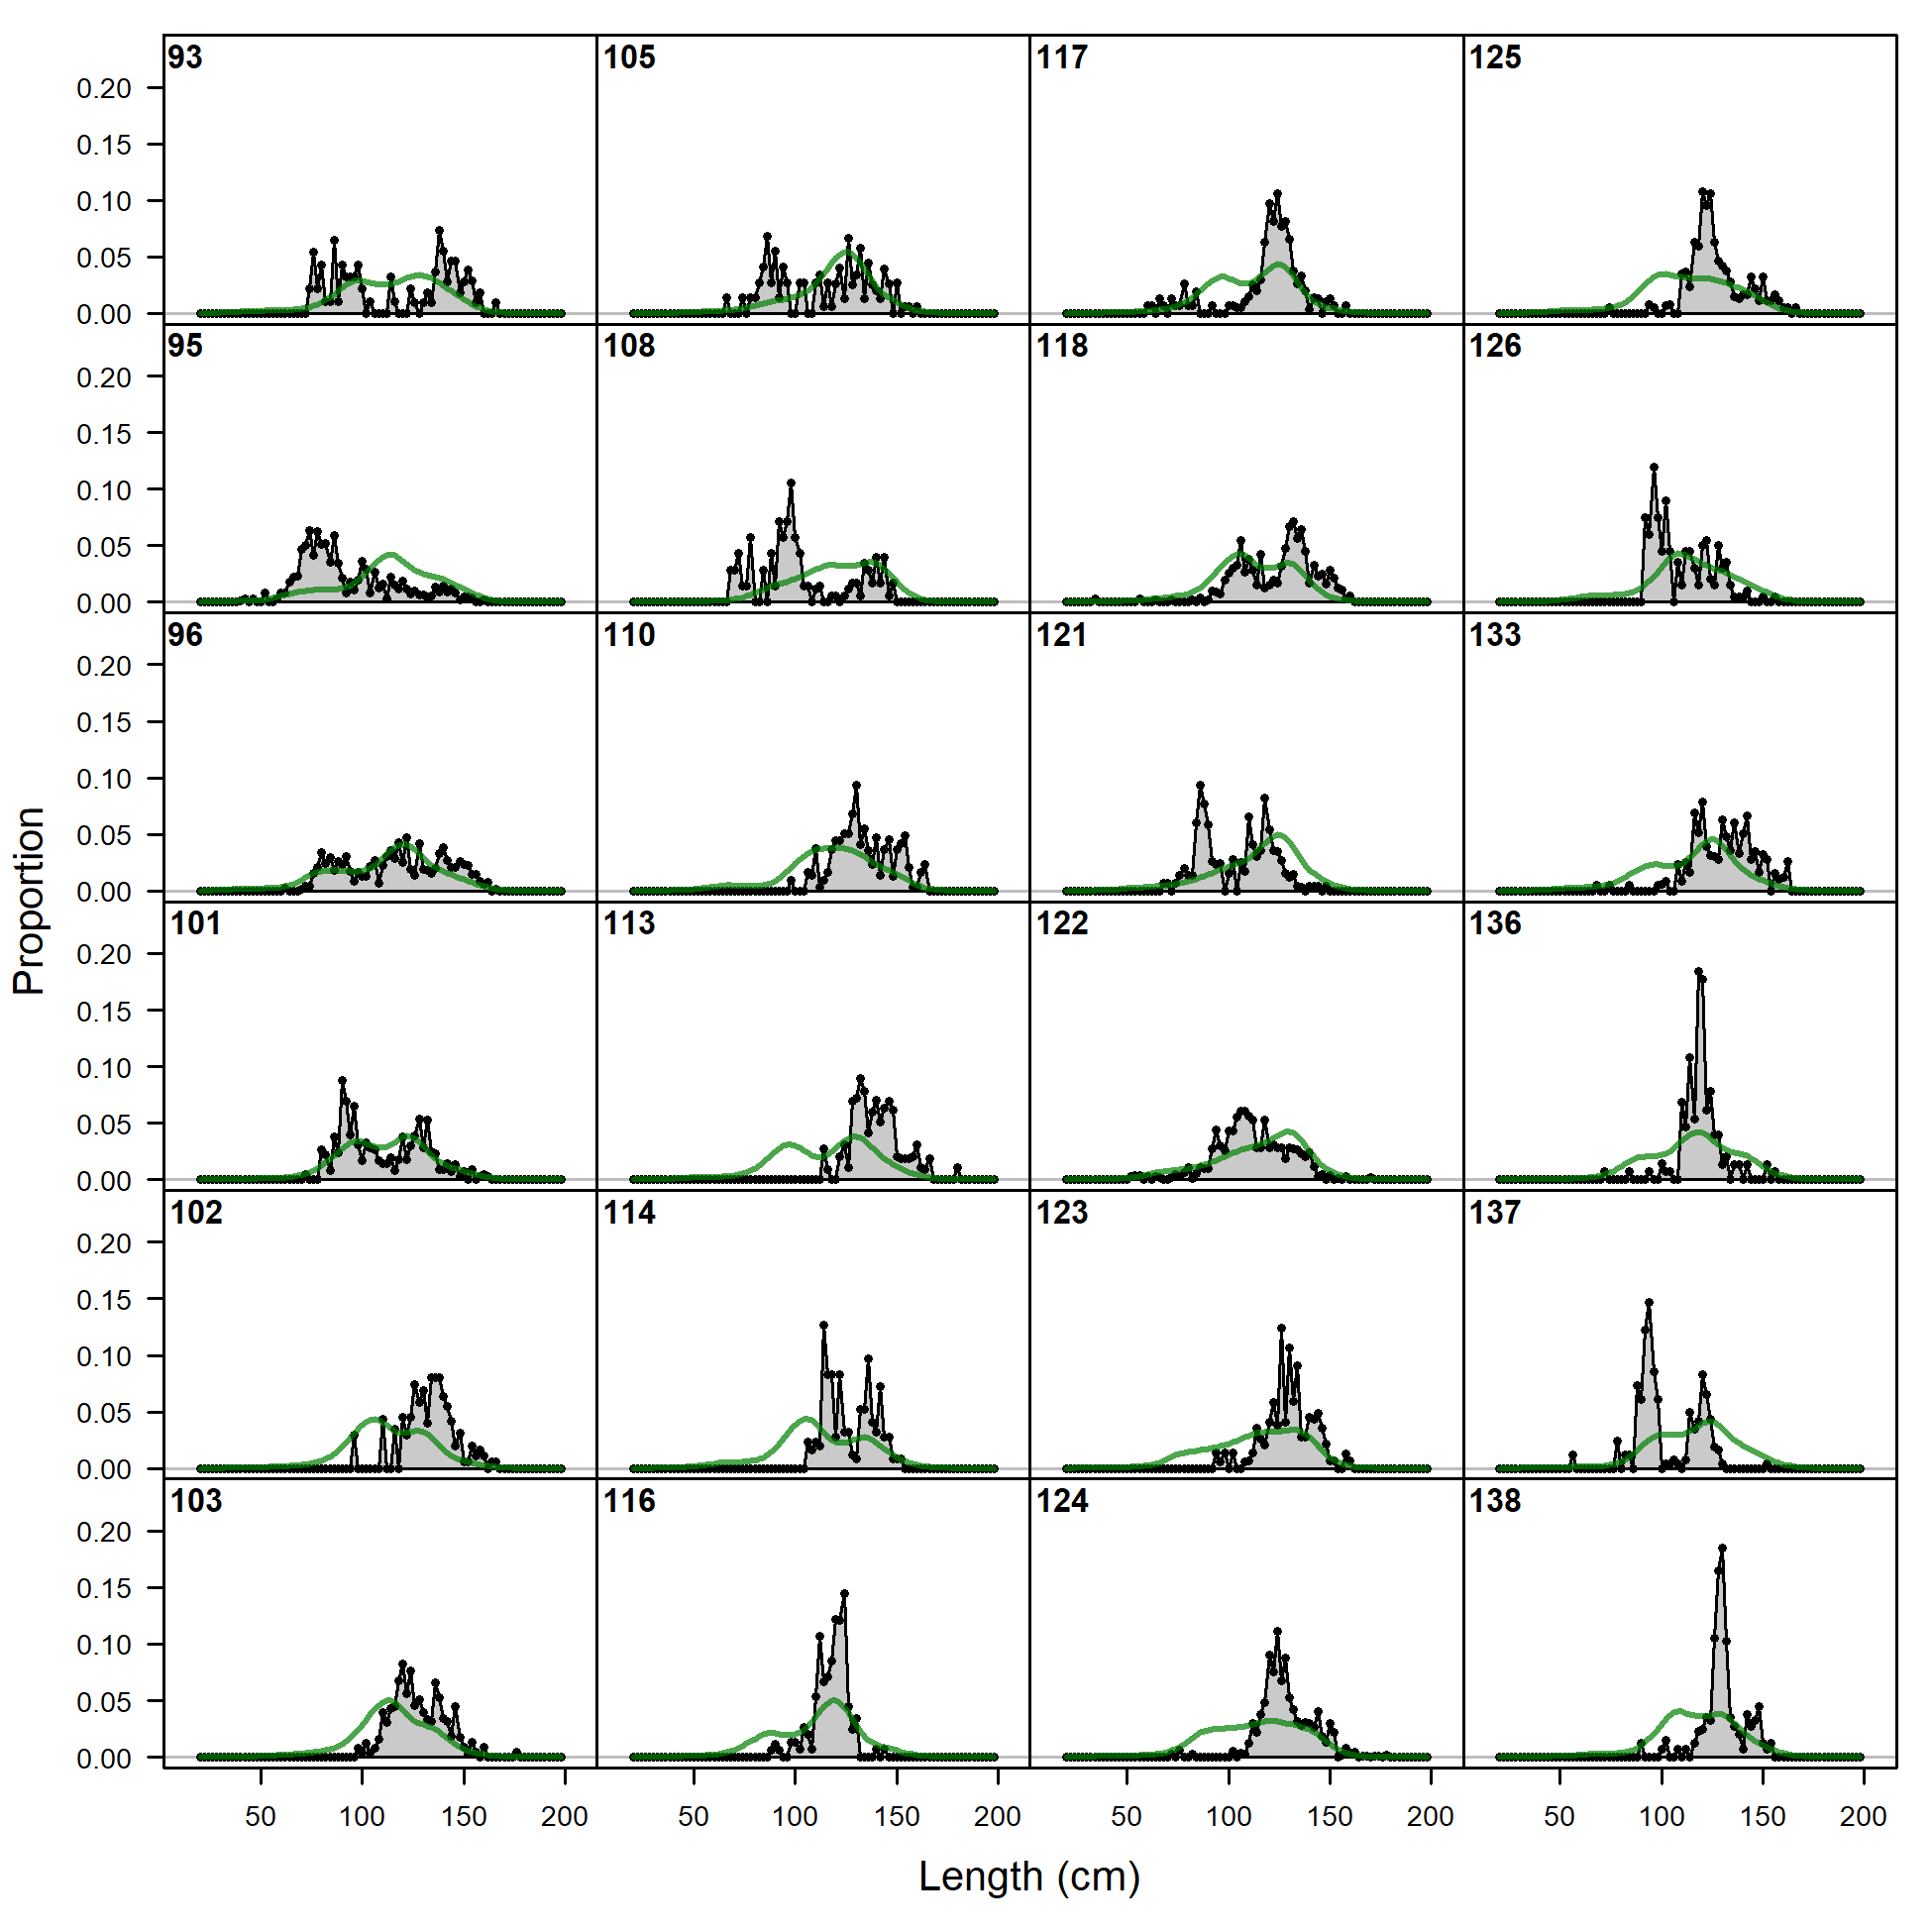
Length comps, retained, F3_PS_OBJ_Offshore (plot 1 of 5).
'N adj.' is the input sample size after data-weighting adjustment. N eff. is the calculated effective sample size used in the McAllister-Ianelli tuning method. (plot 2 of 5)
file: comp_lenfit_flt3mkt2_page2.png
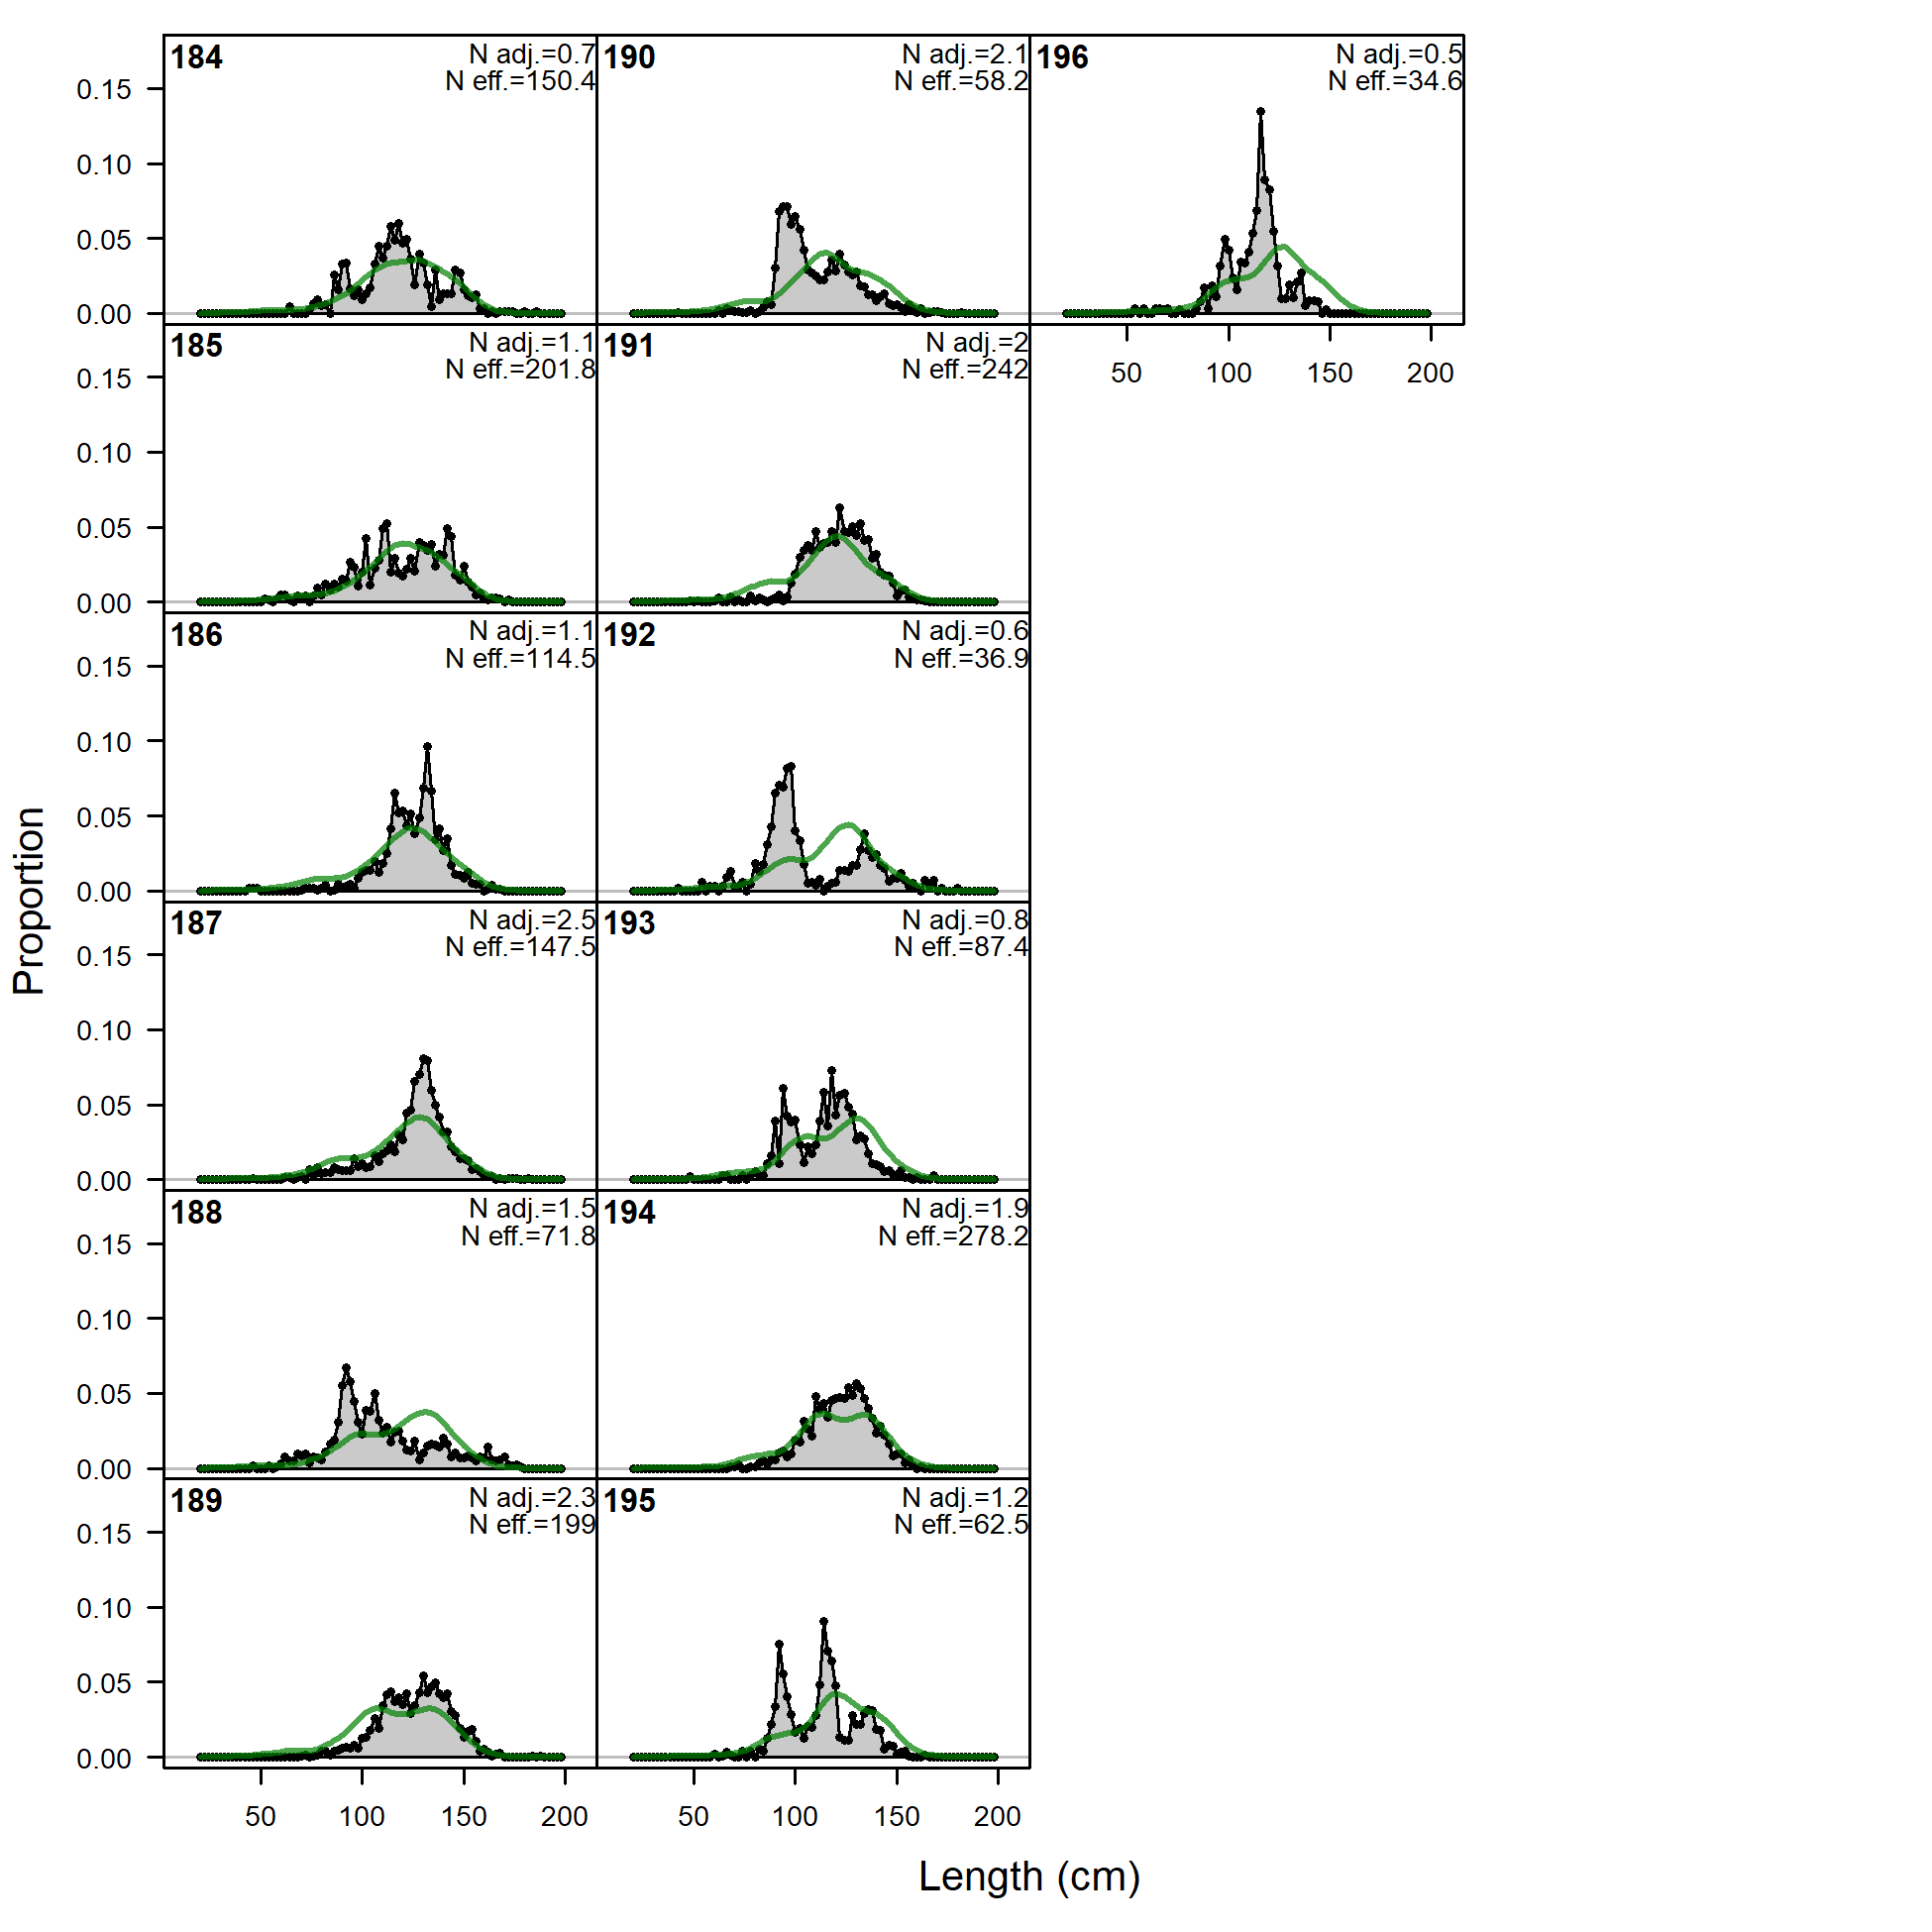
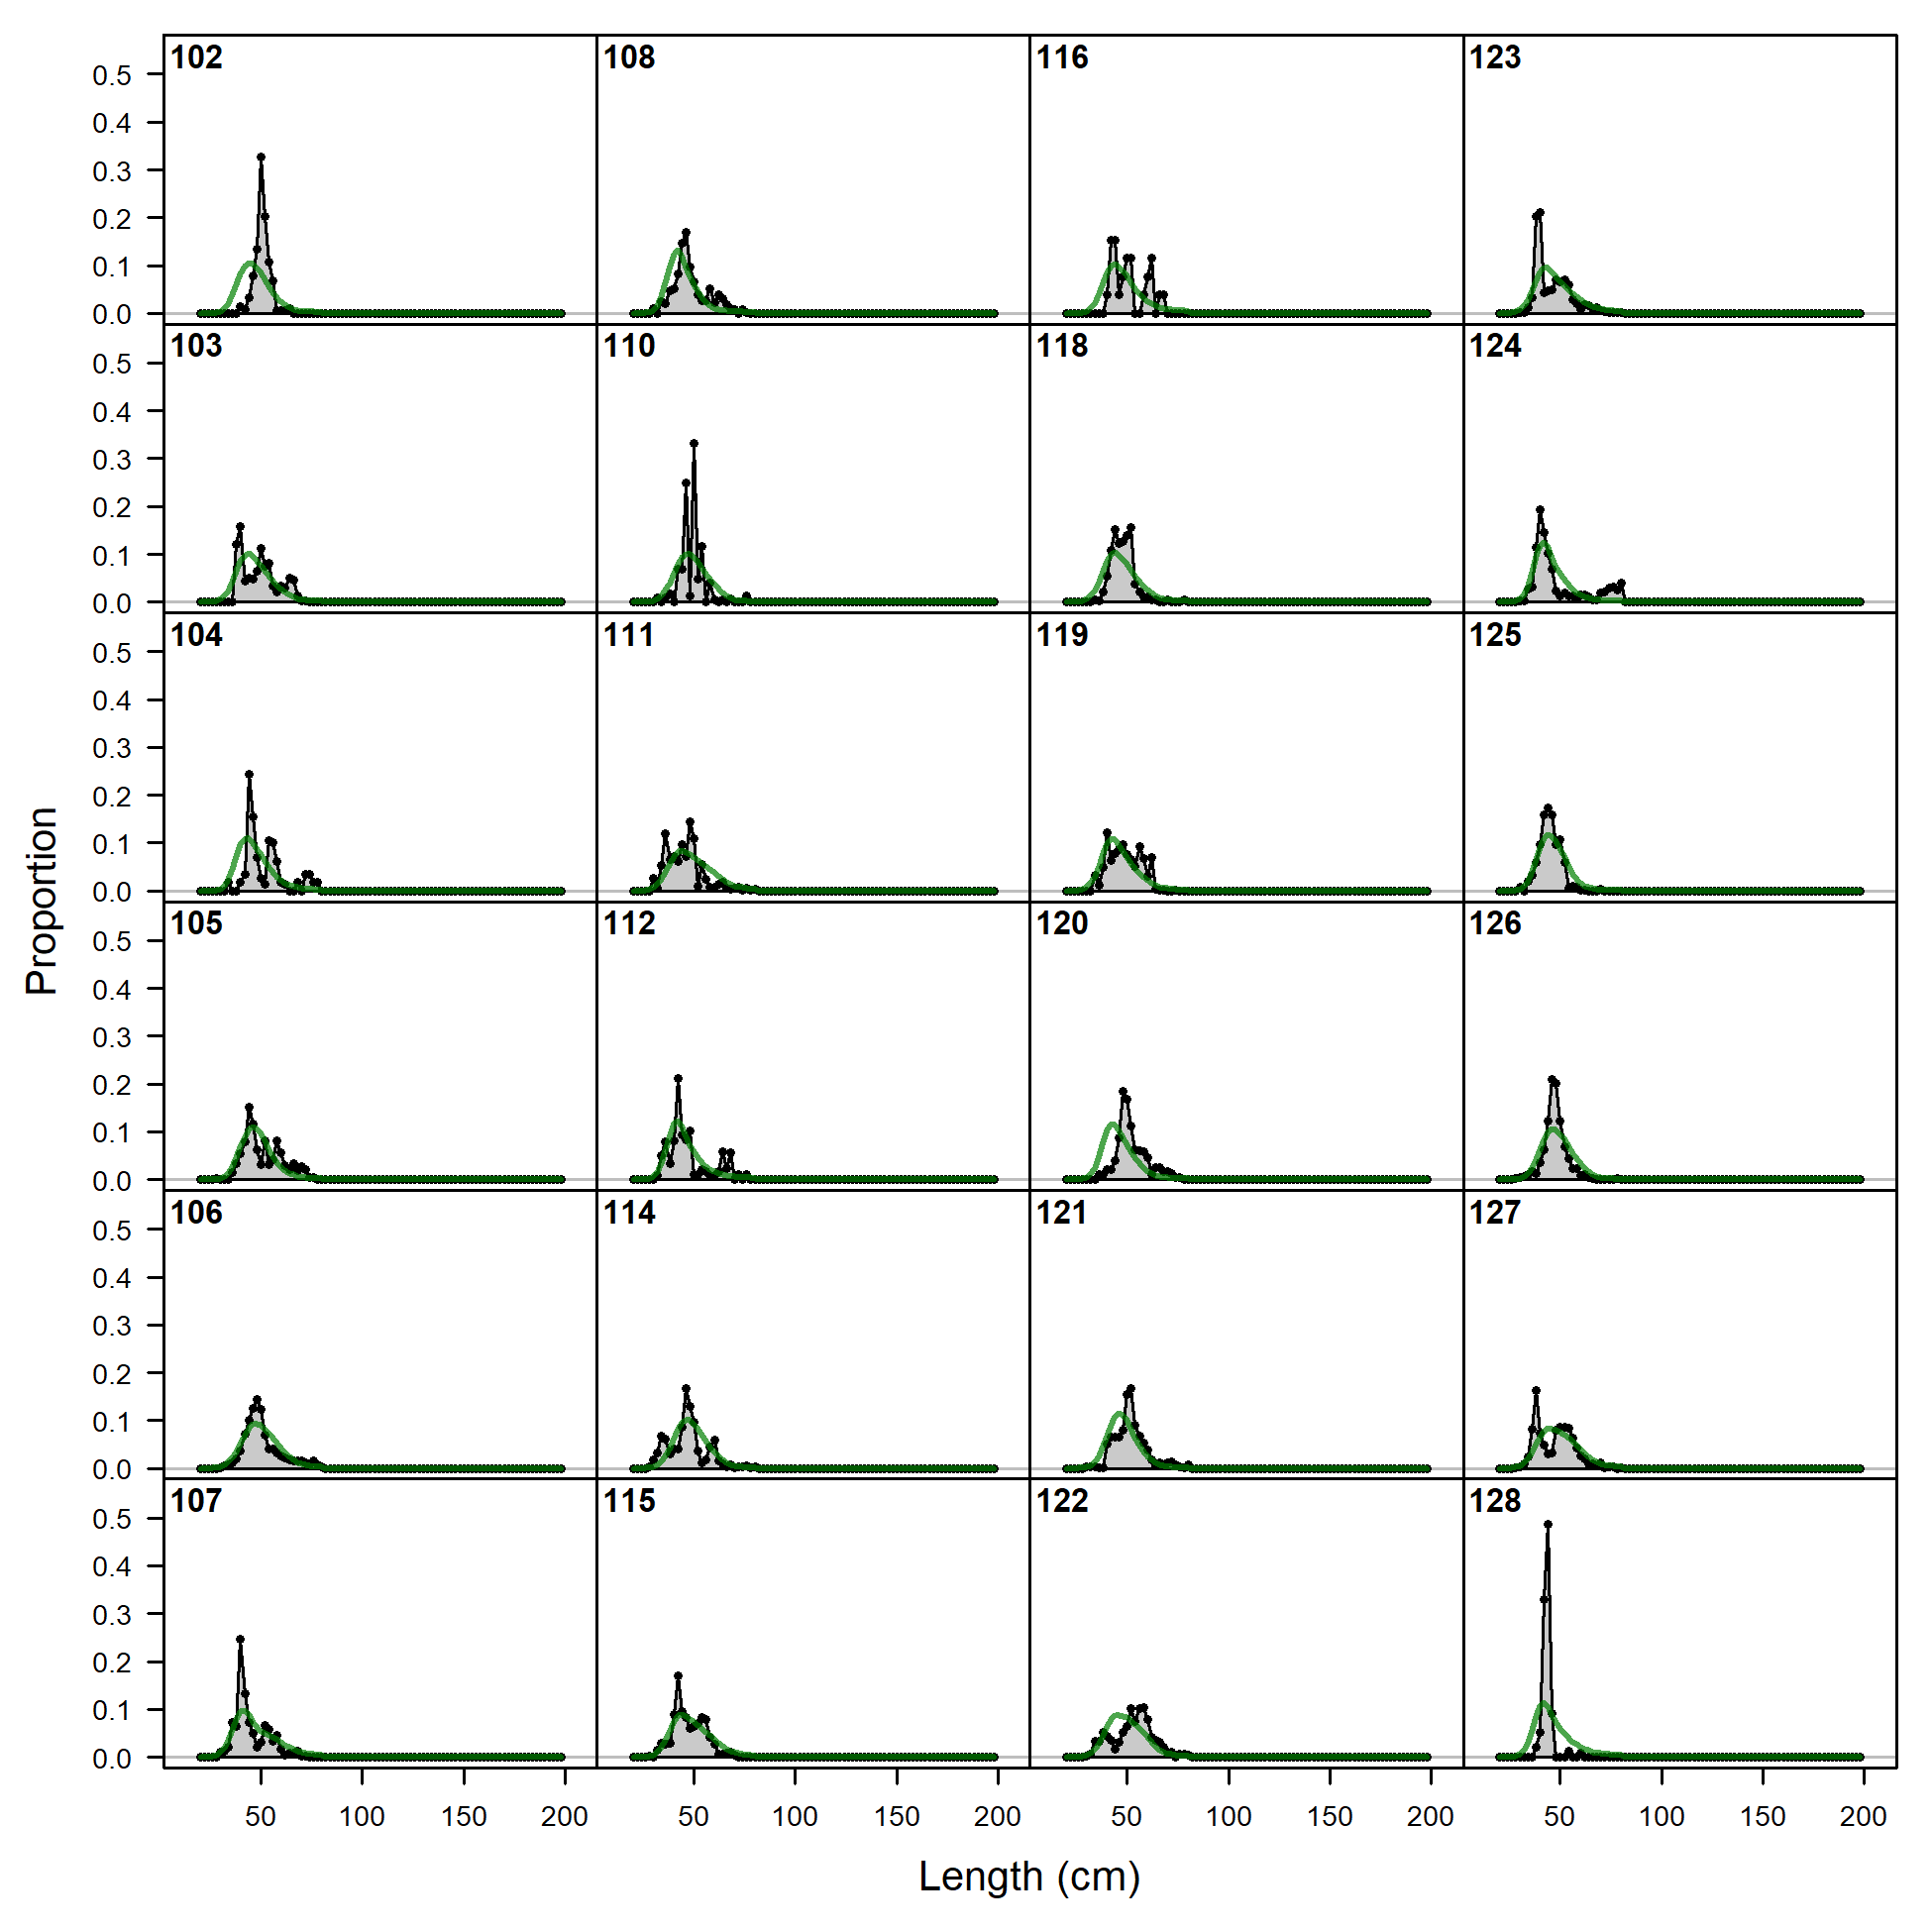
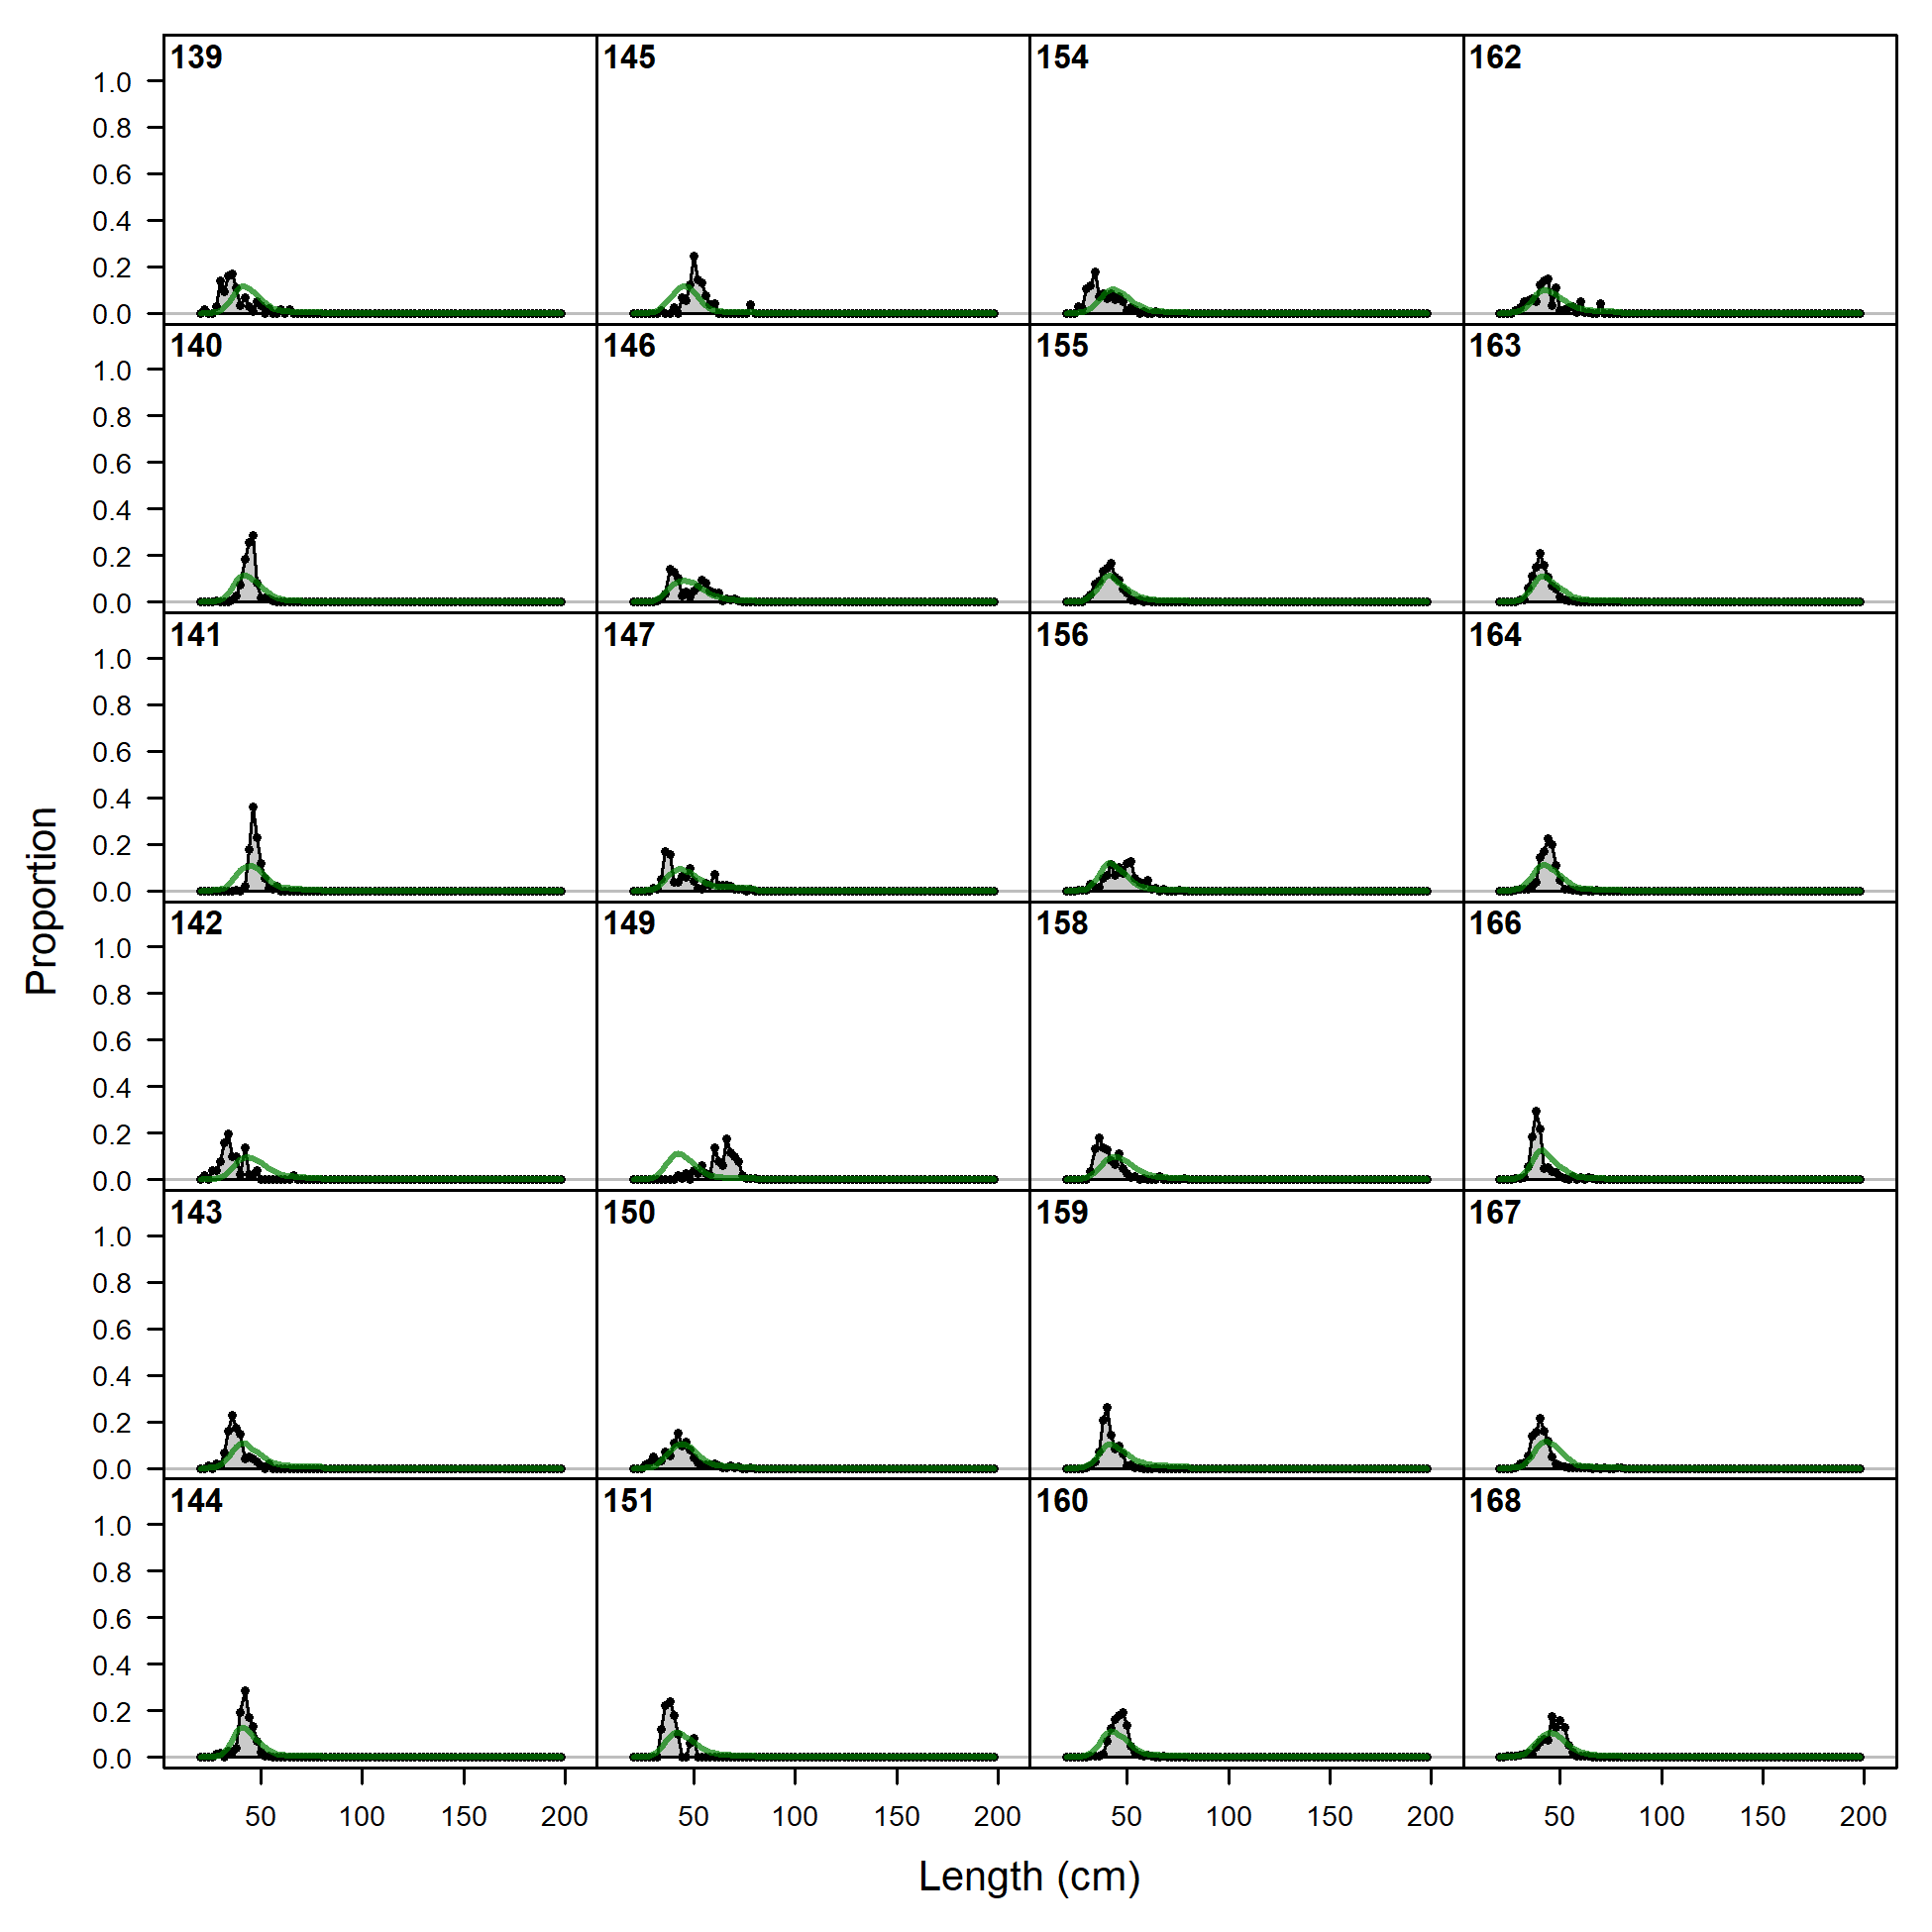
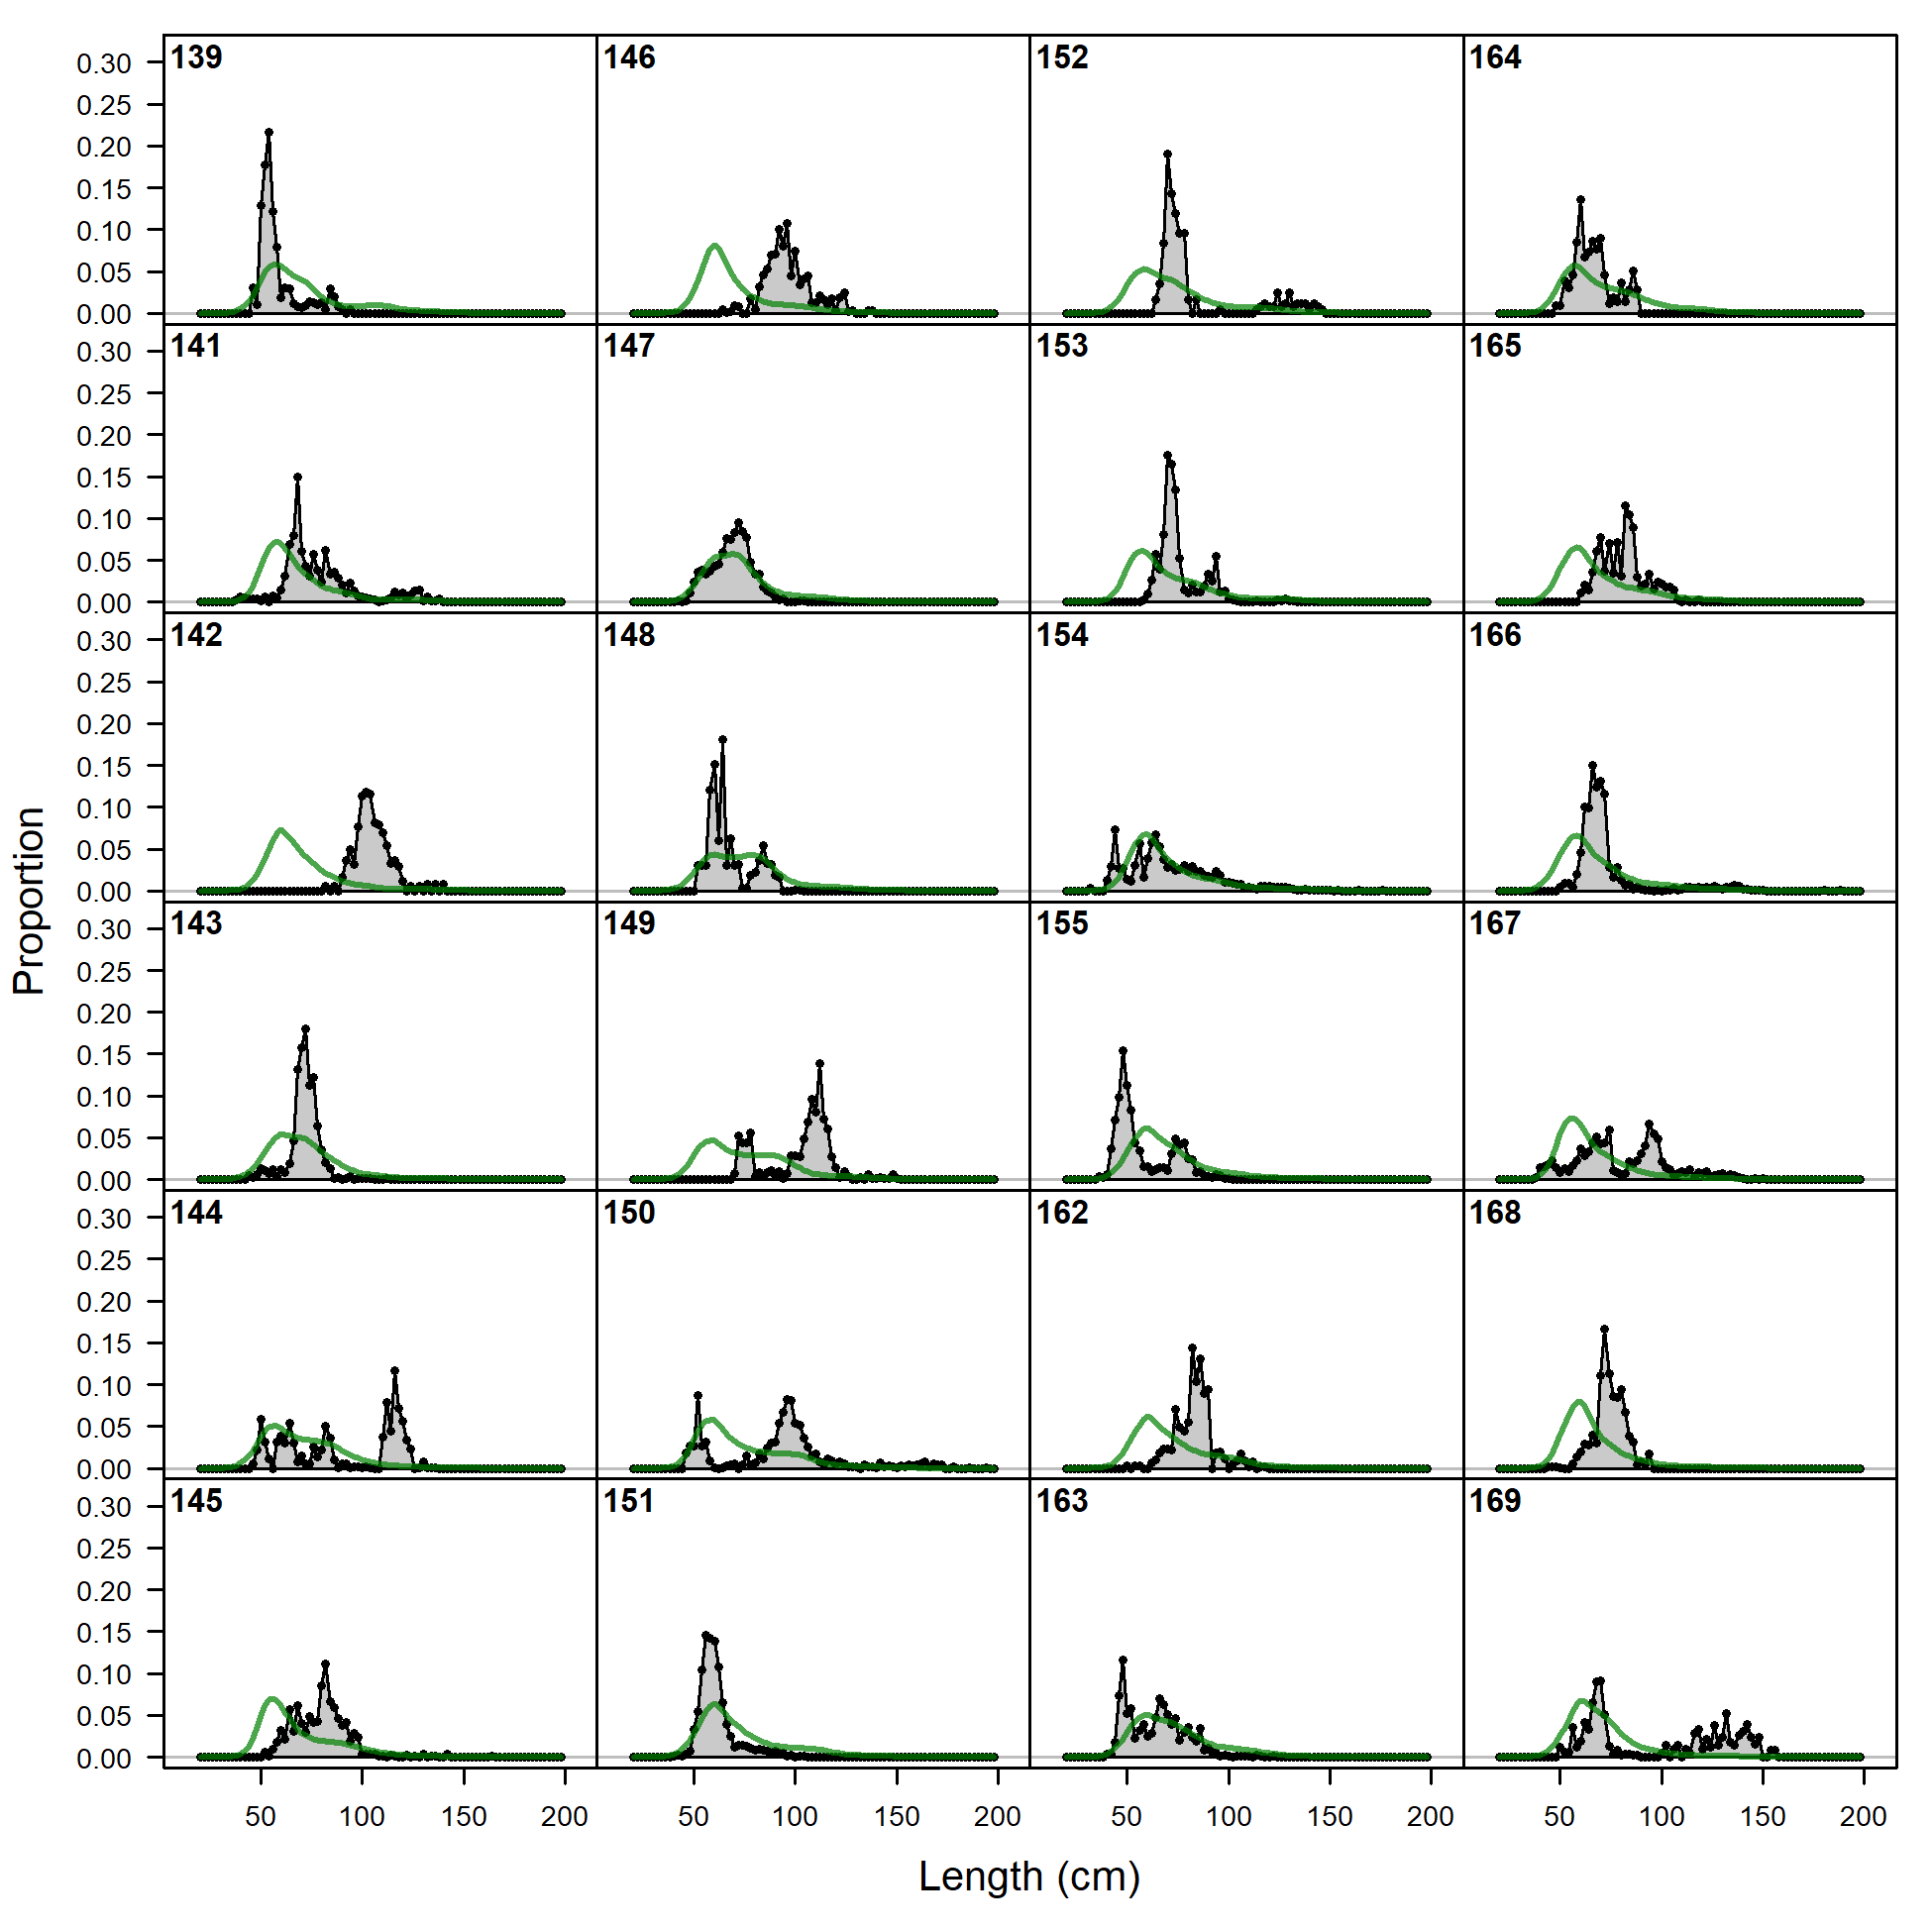
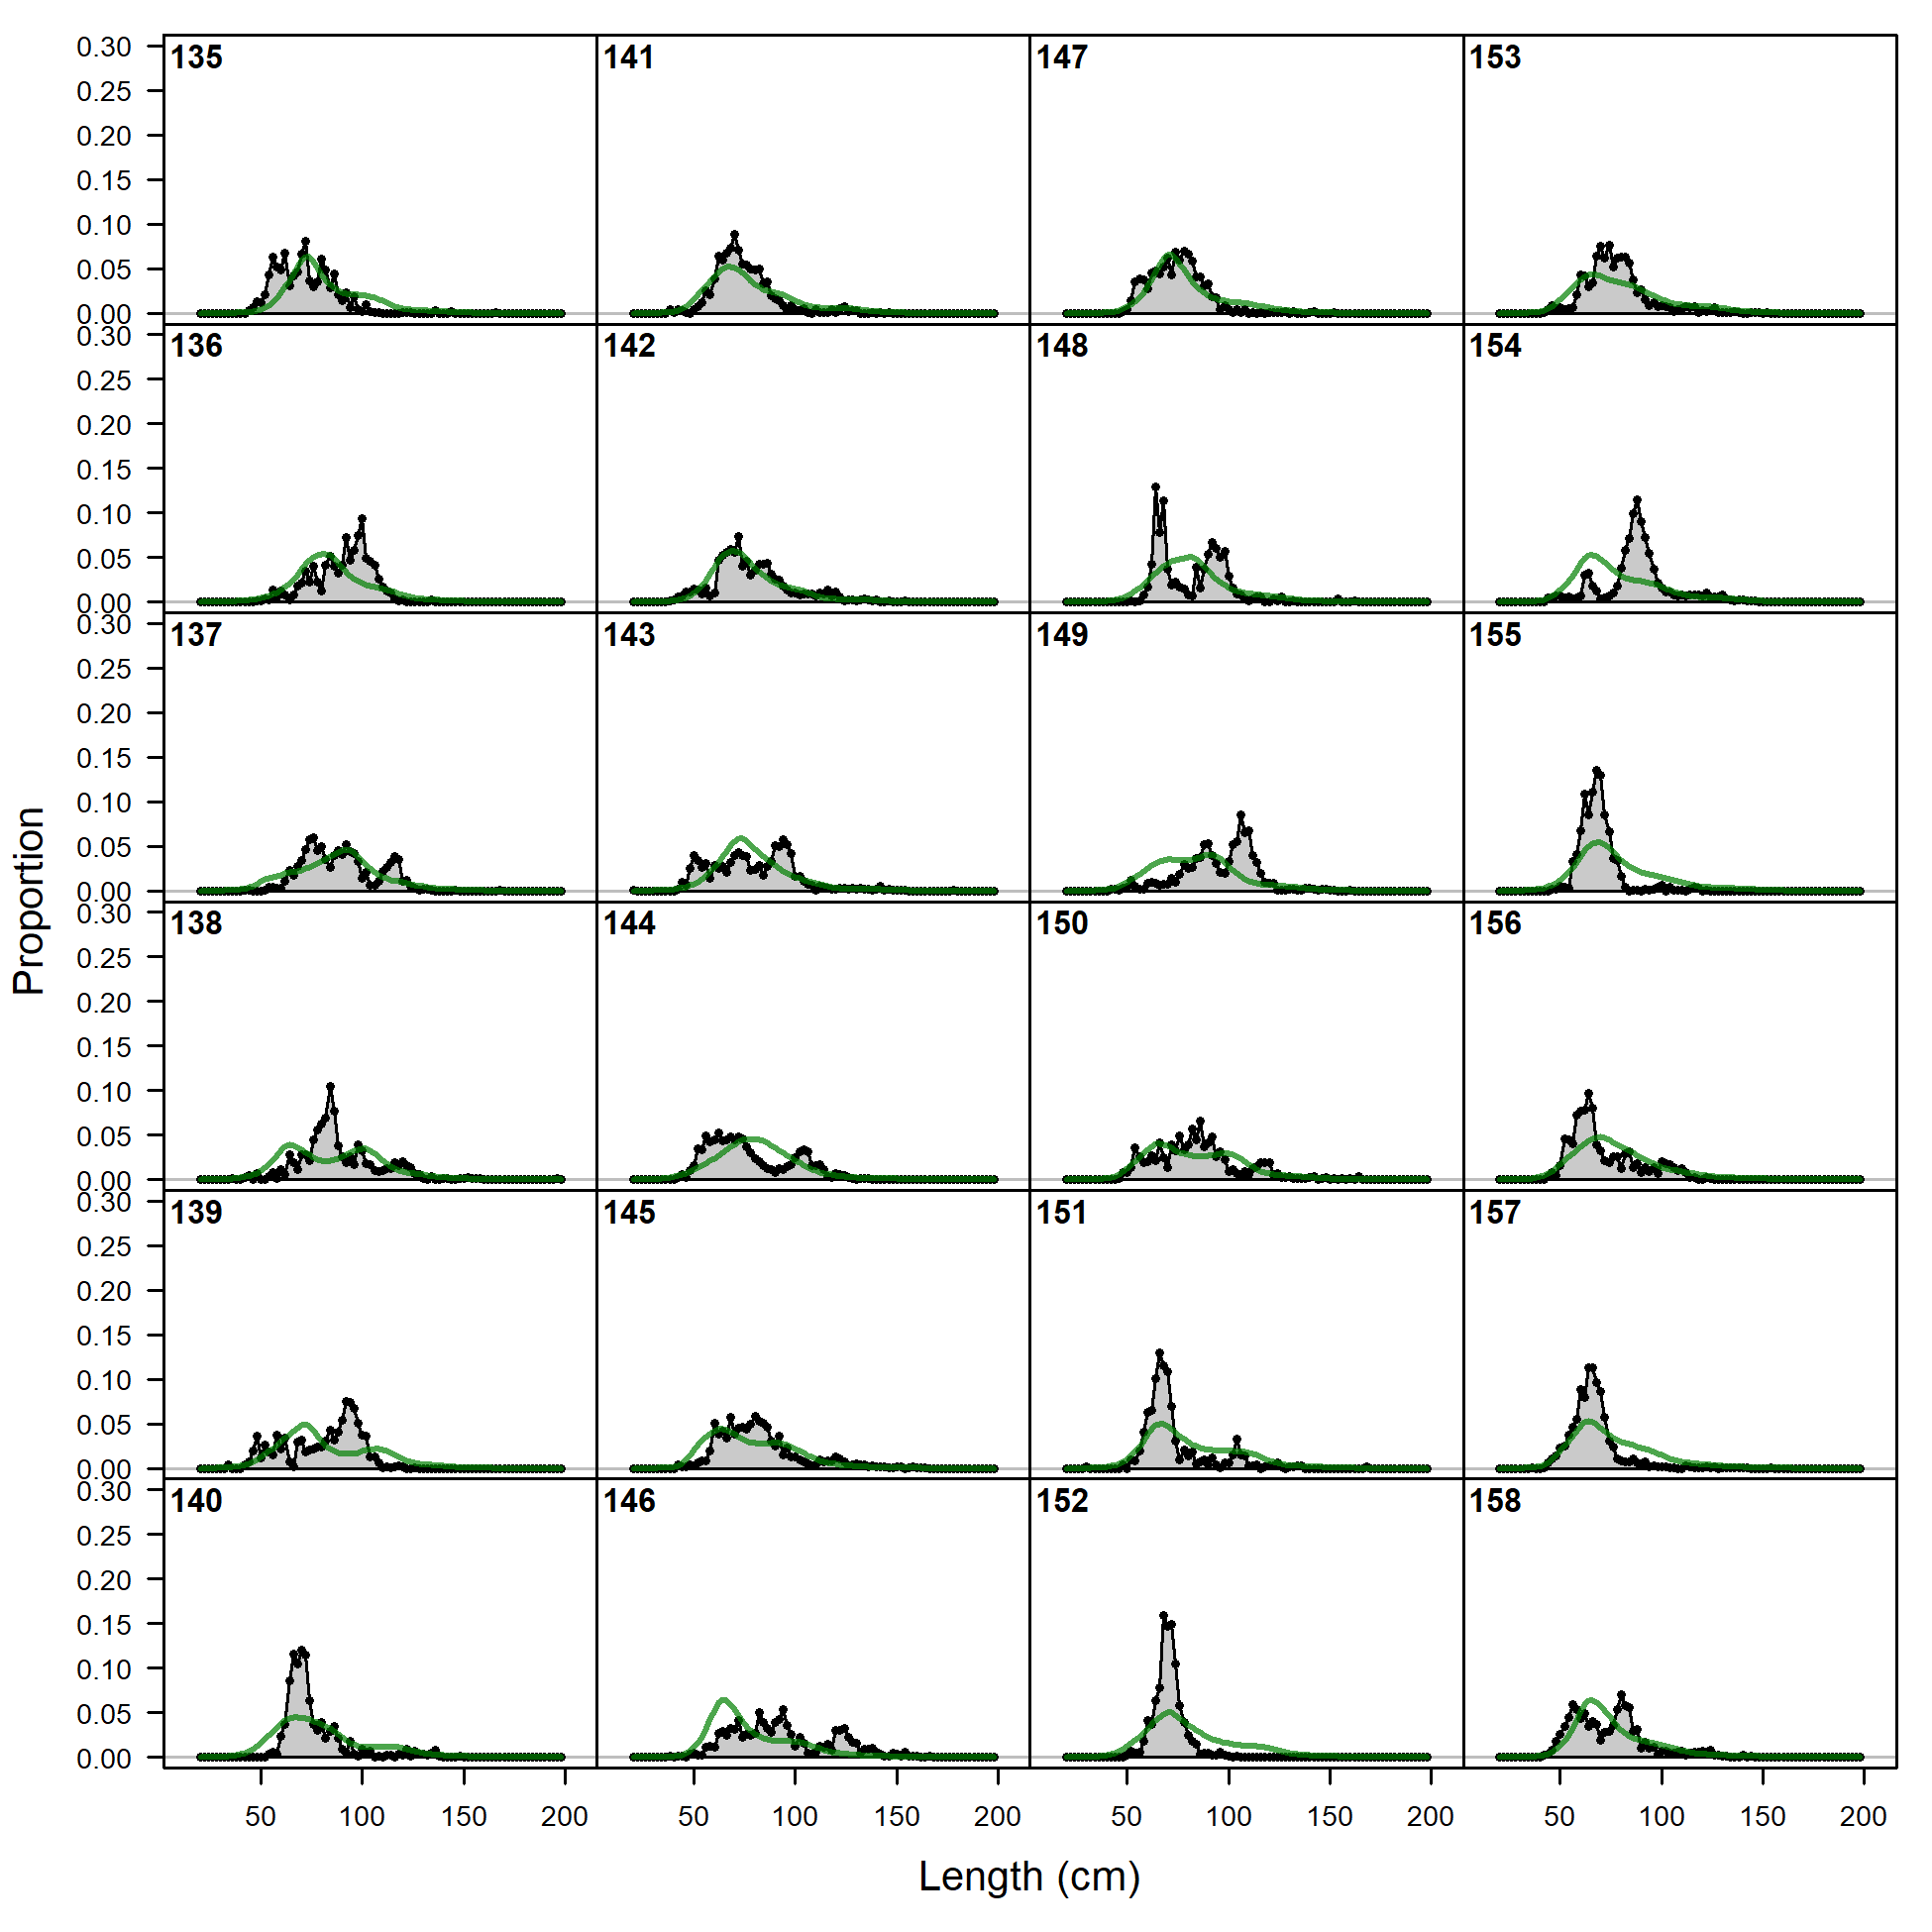
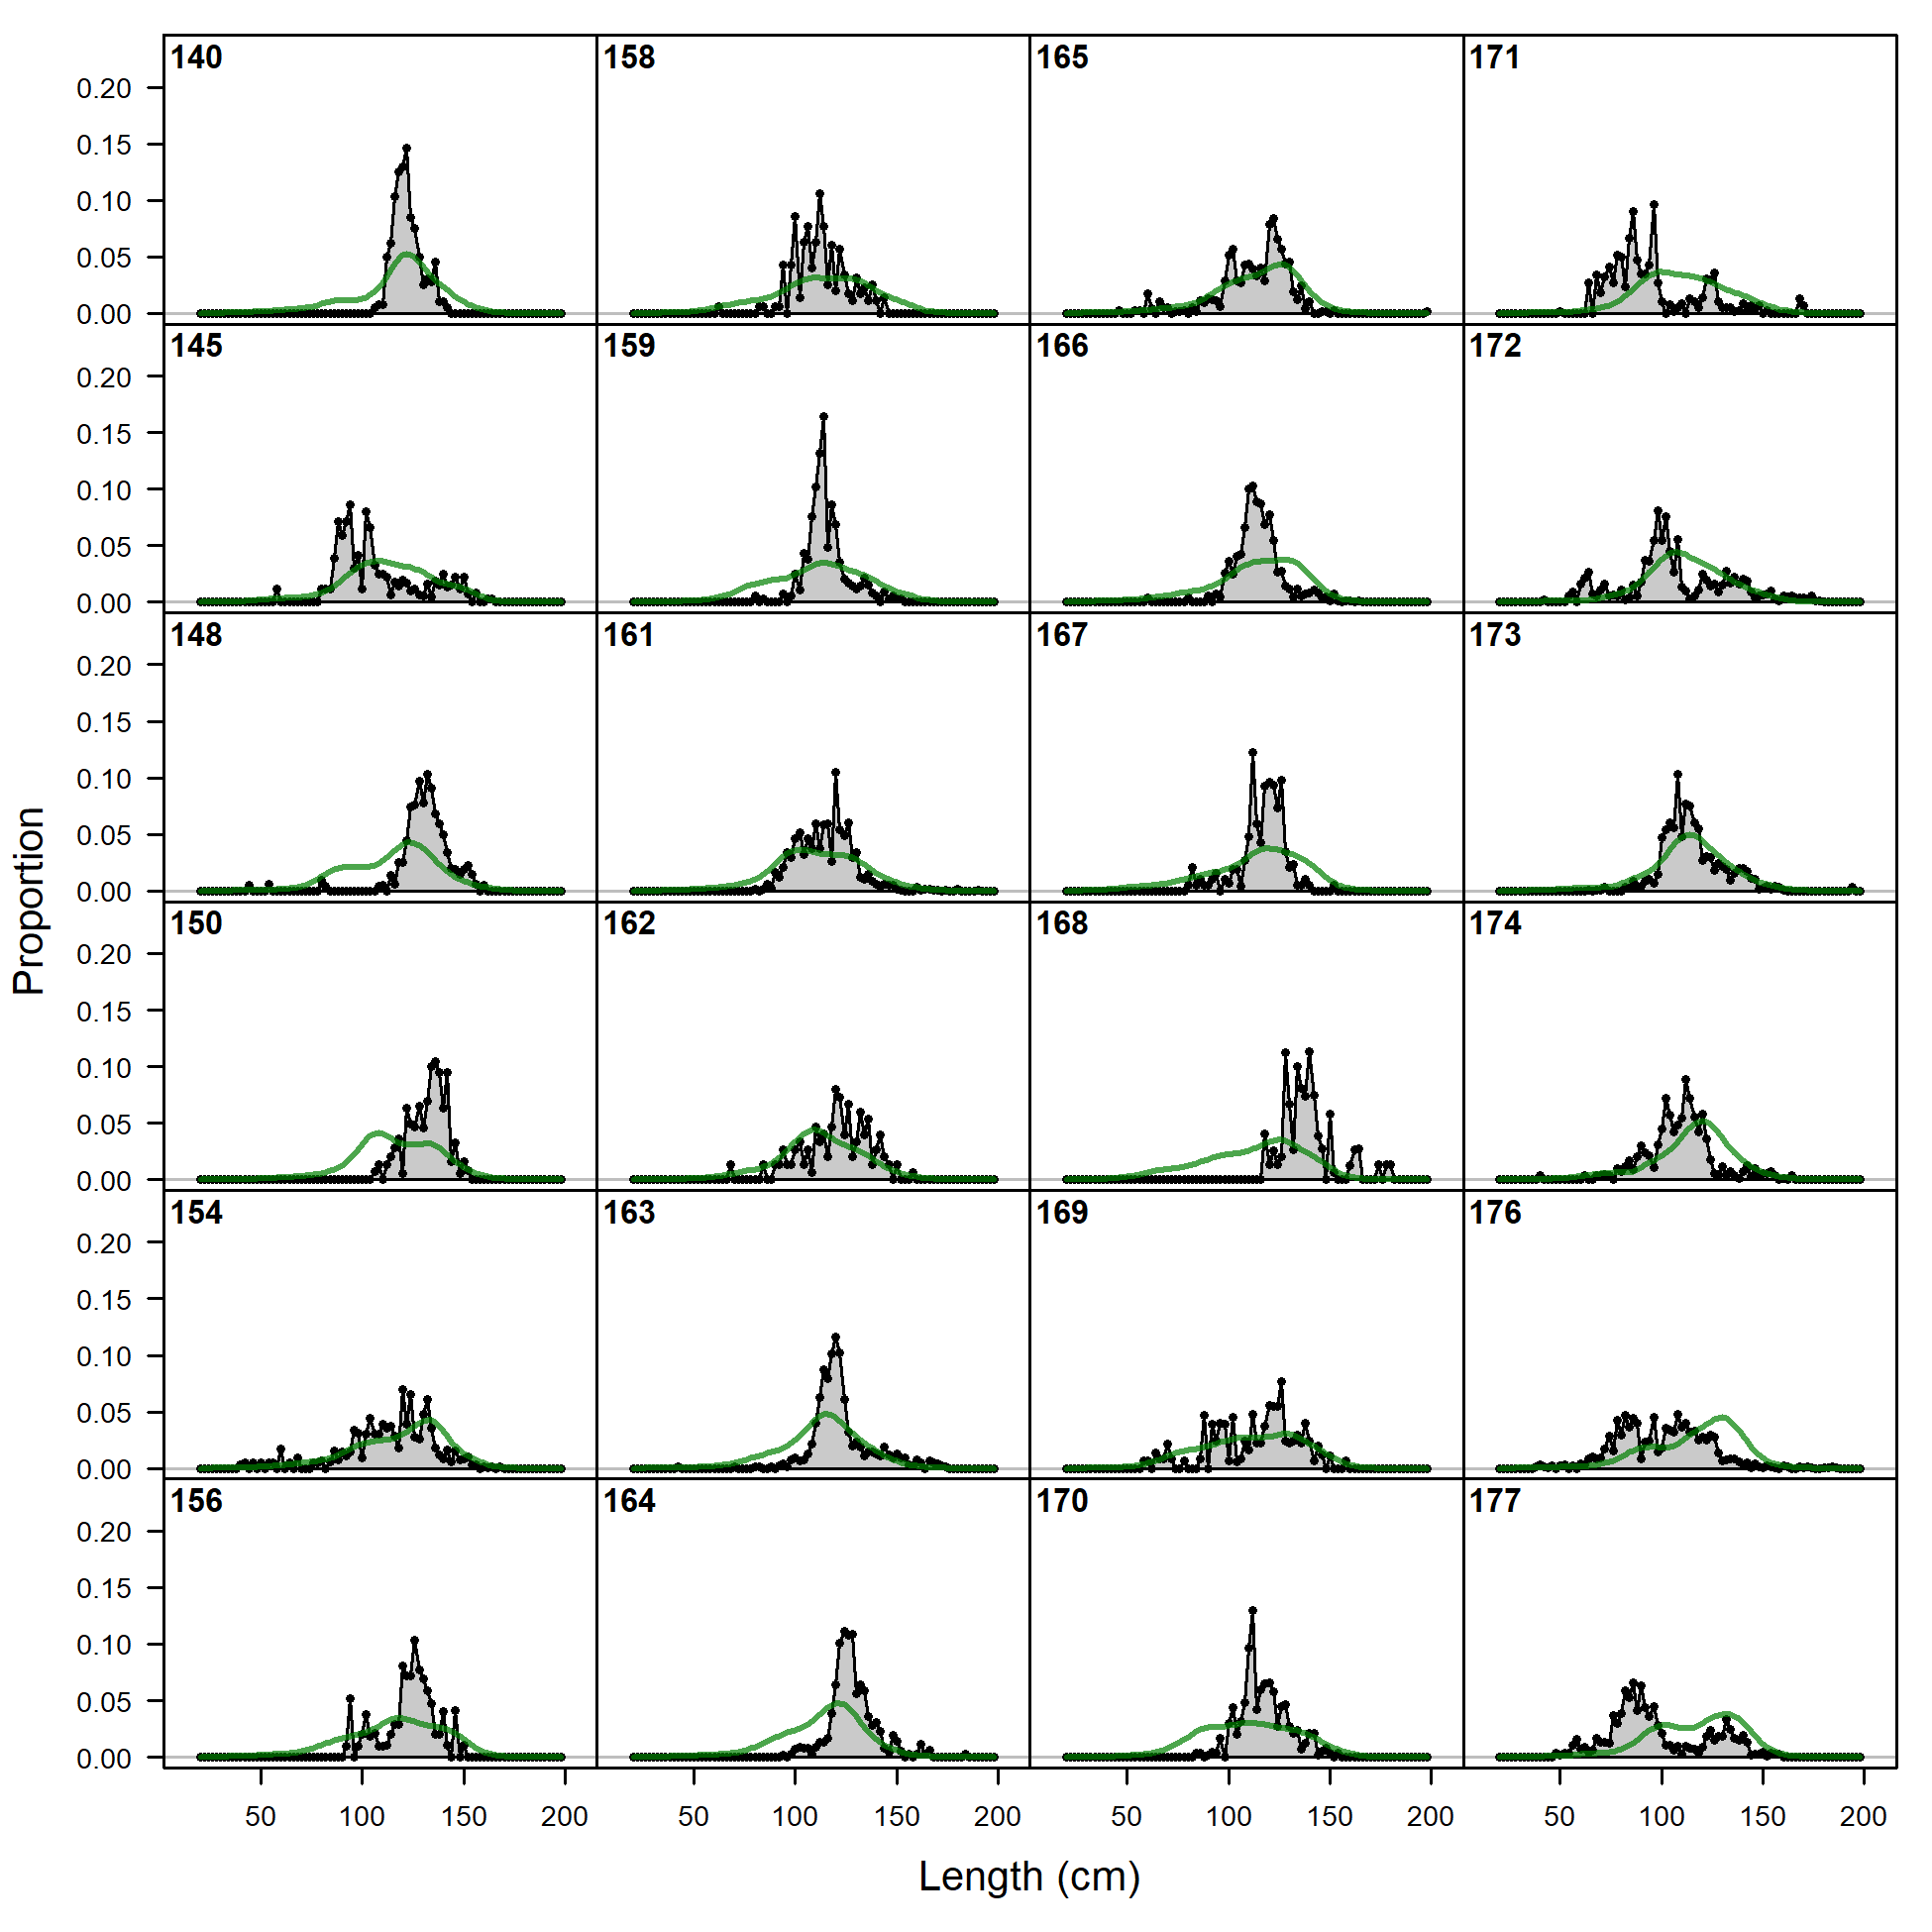
Length comps, retained, F3_PS_OBJ_Offshore (plot 1 of 5).
'N adj.' is the input sample size after data-weighting adjustment. N eff. is the calculated effective sample size used in the McAllister-Ianelli tuning method. (plot 2 of 5) (plot 3 of 5)
file: comp_lenfit_flt3mkt2_page3.png

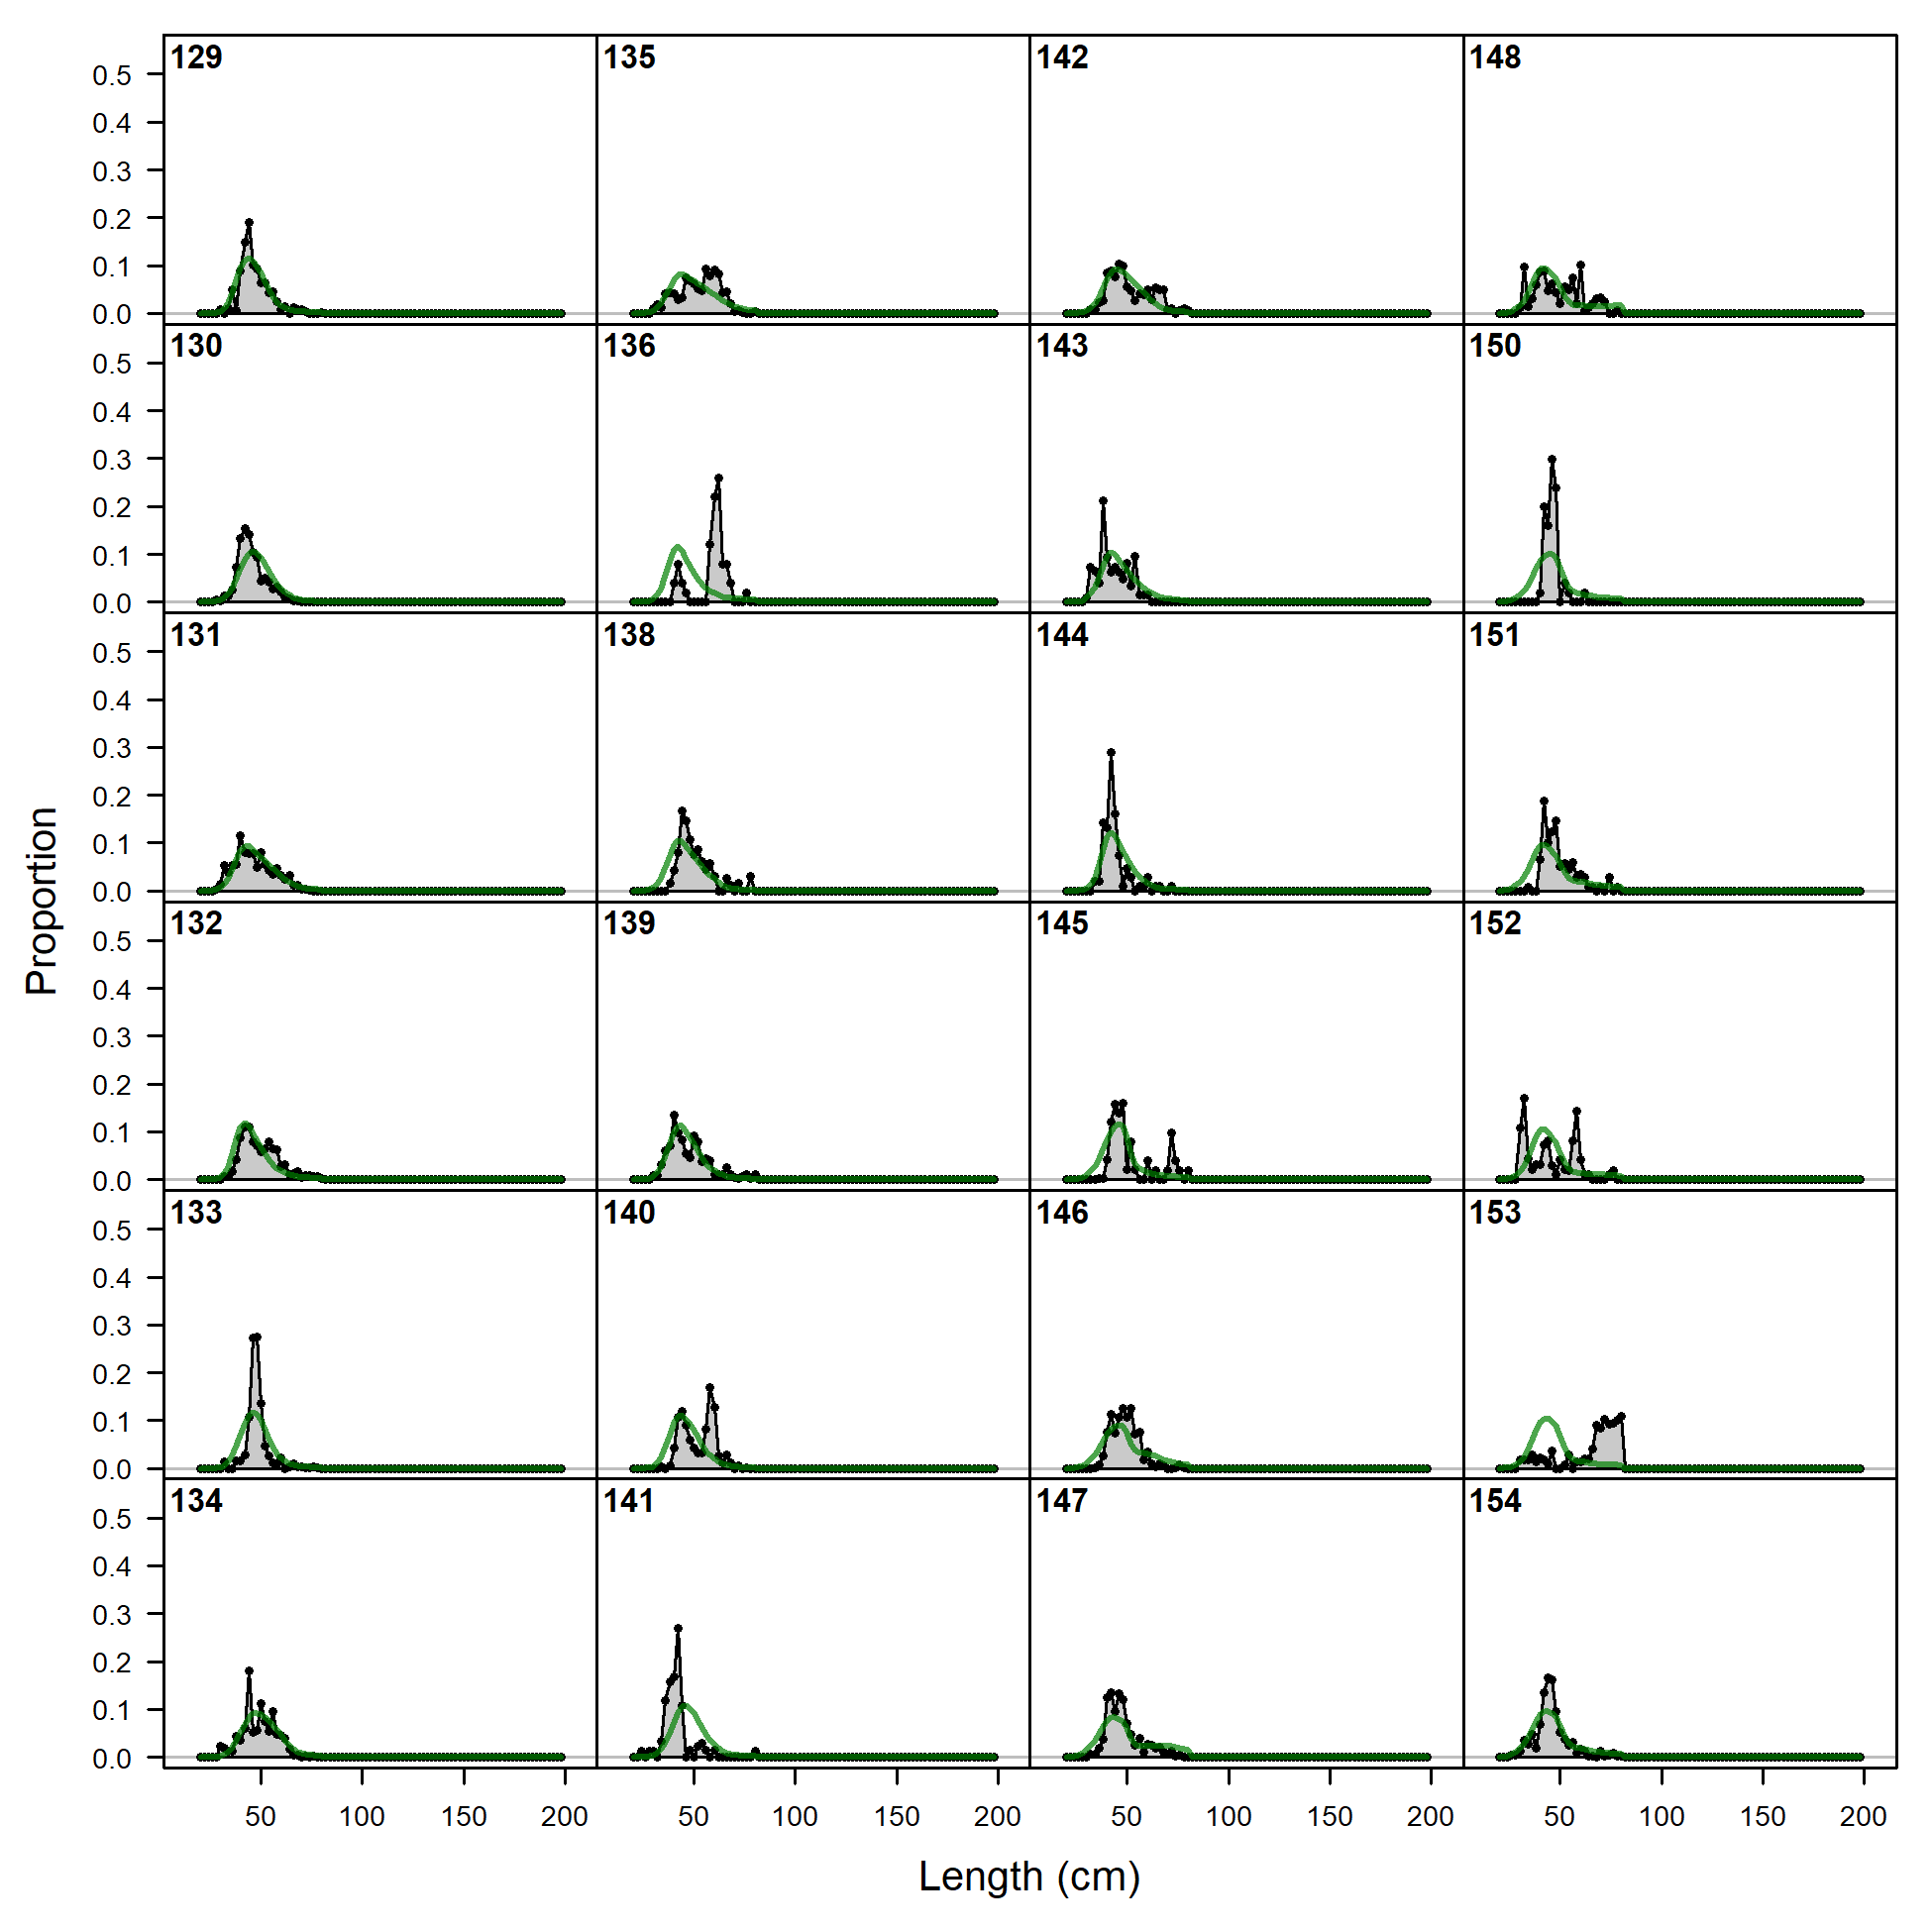
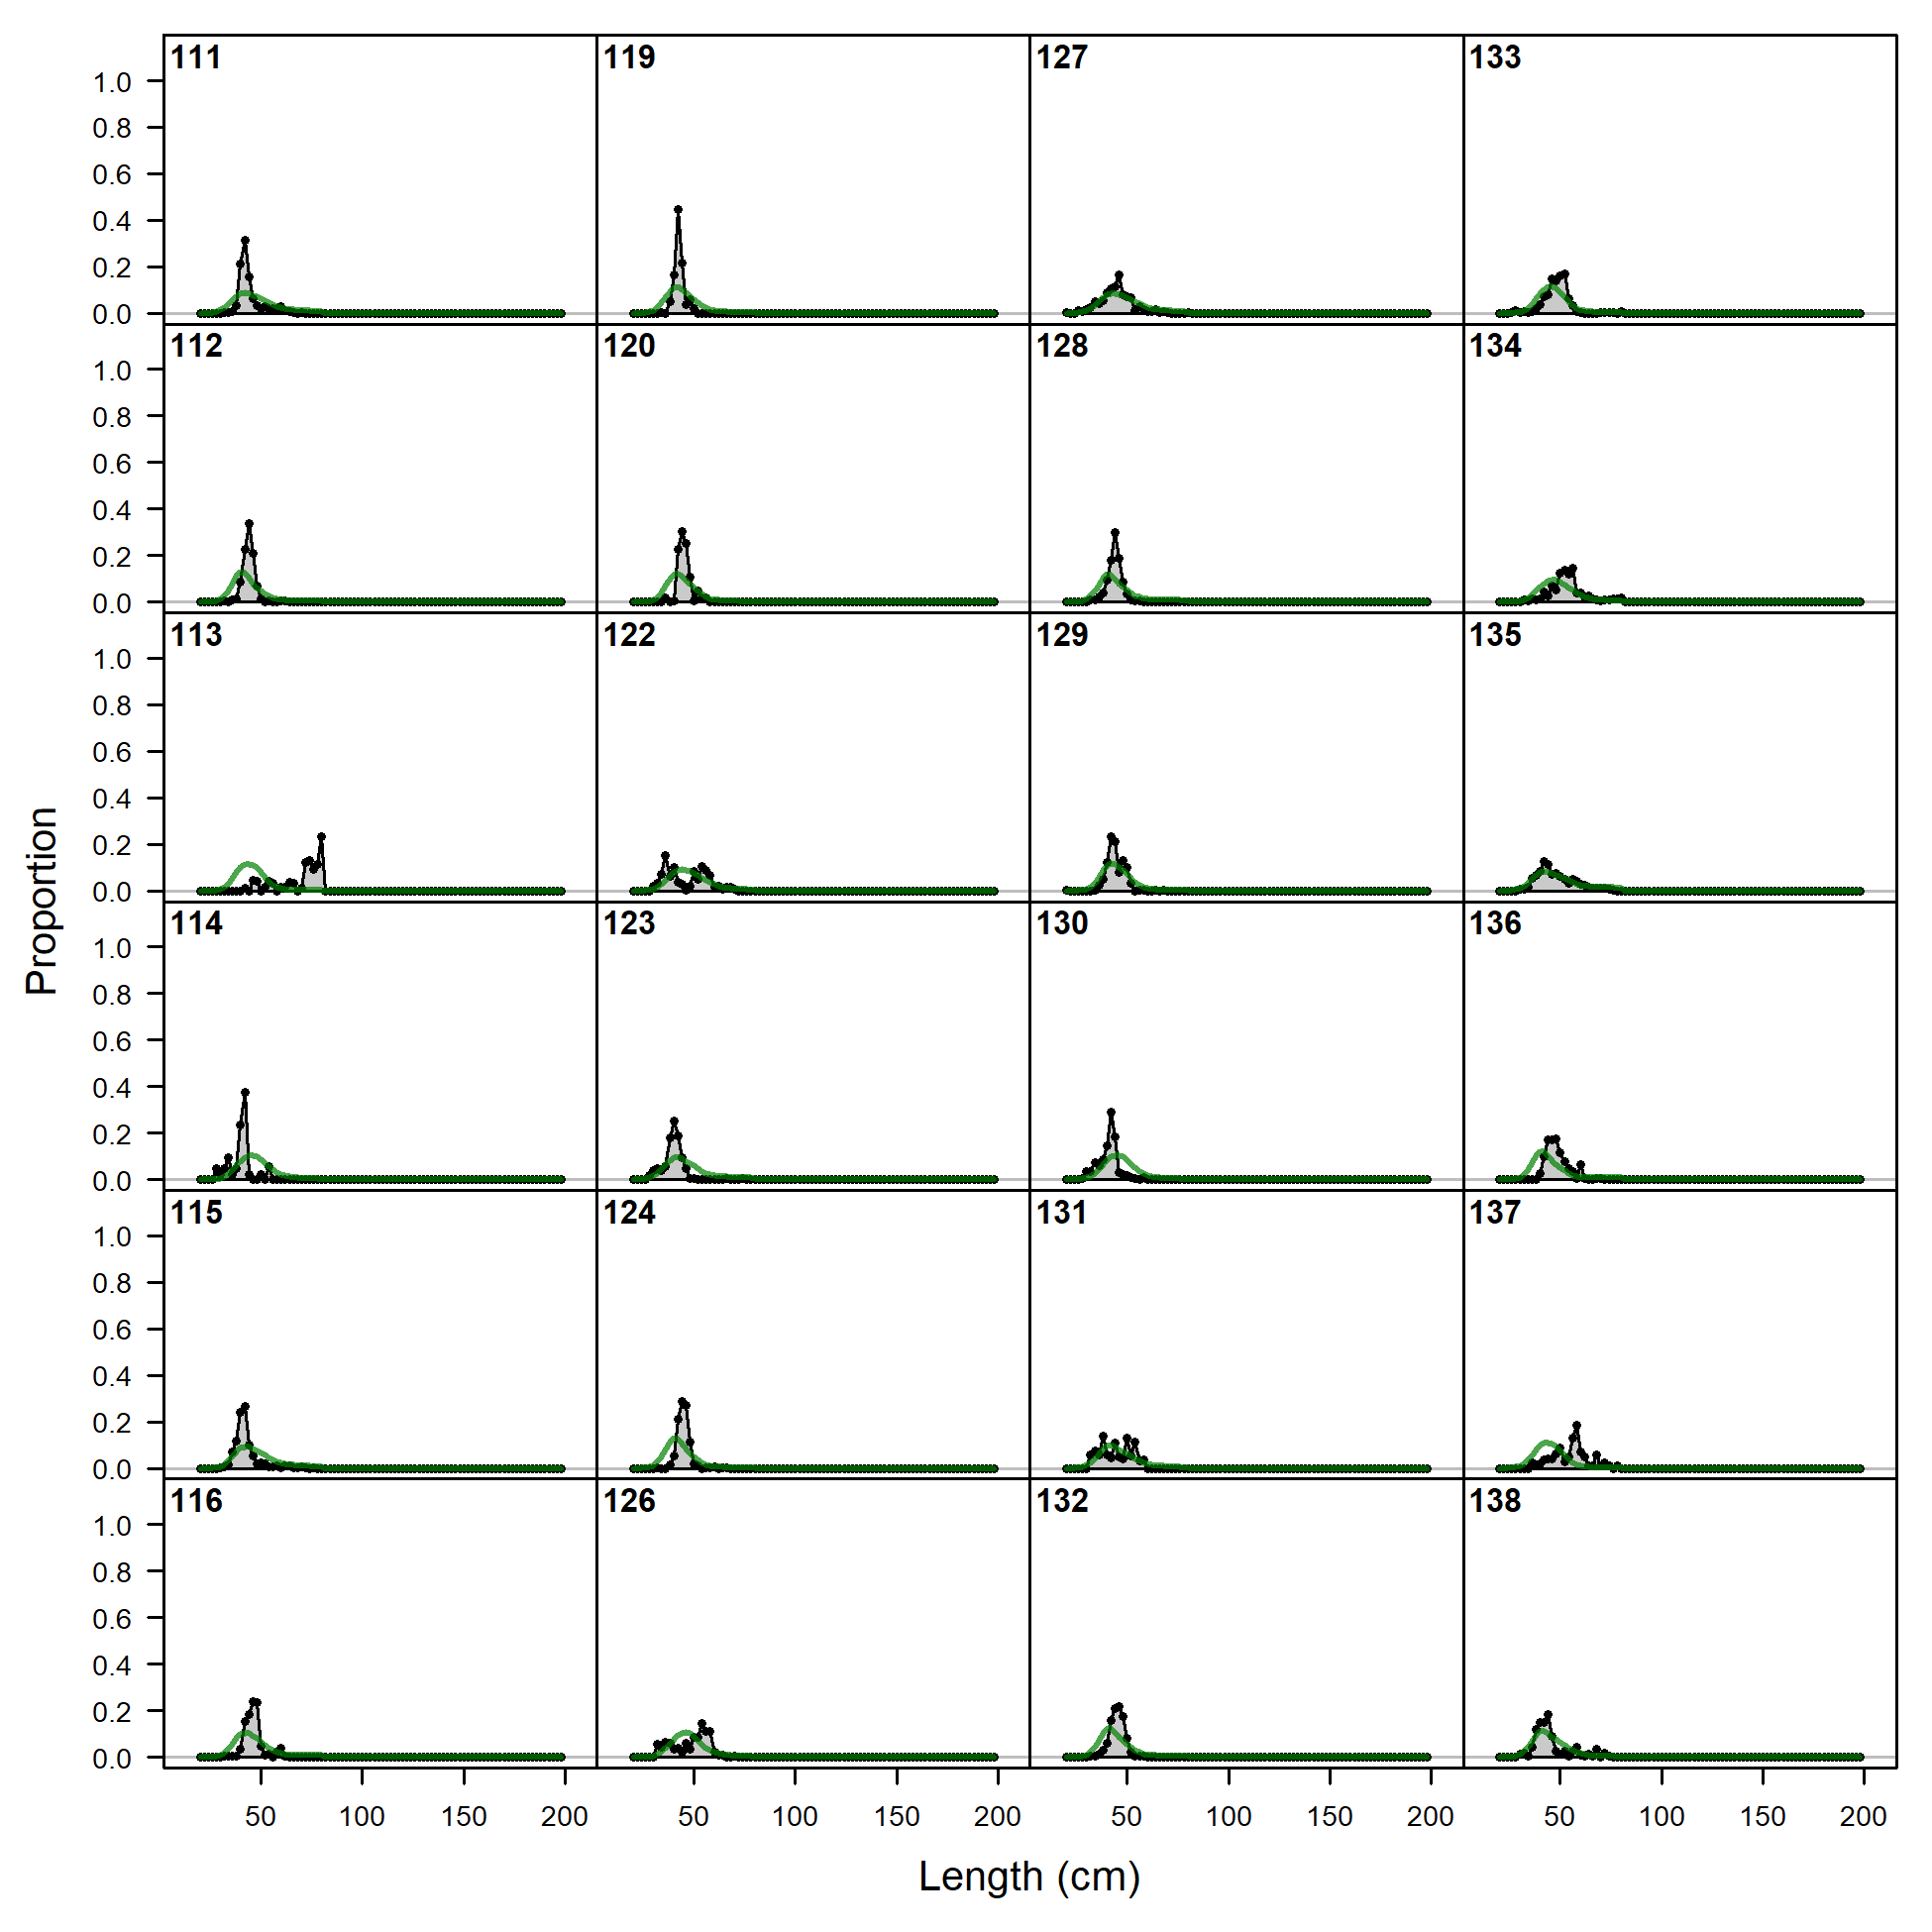
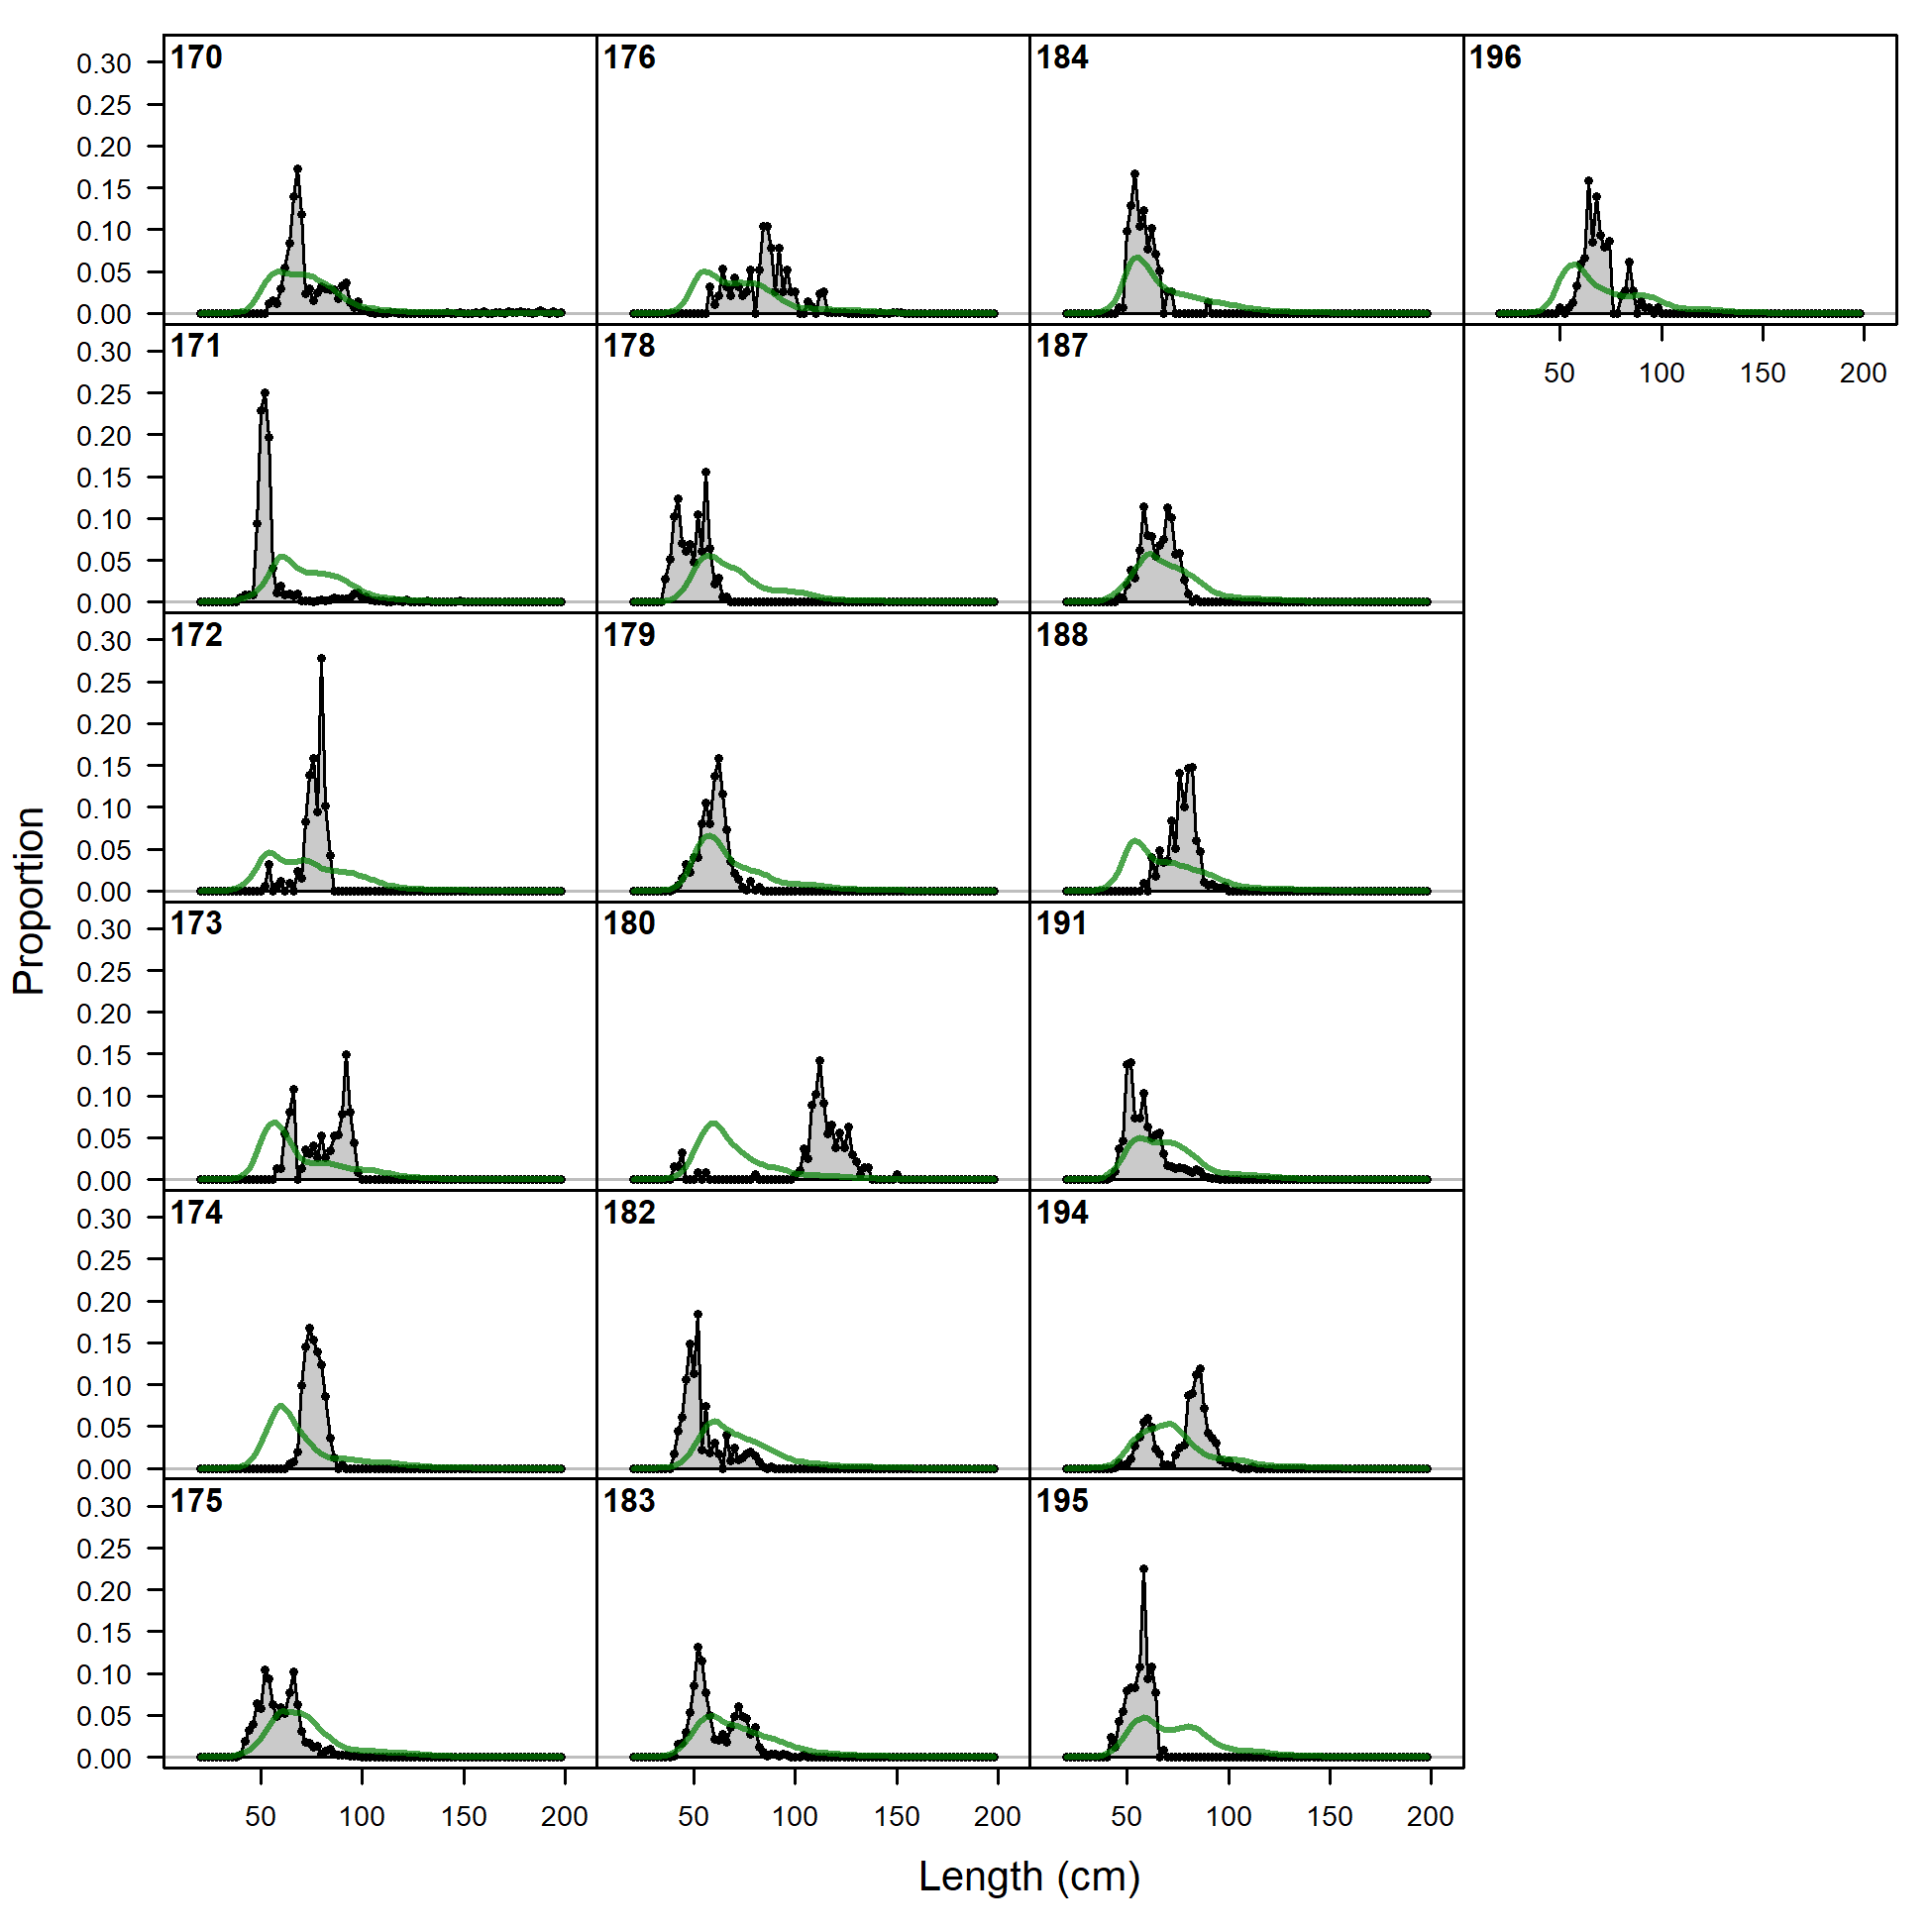
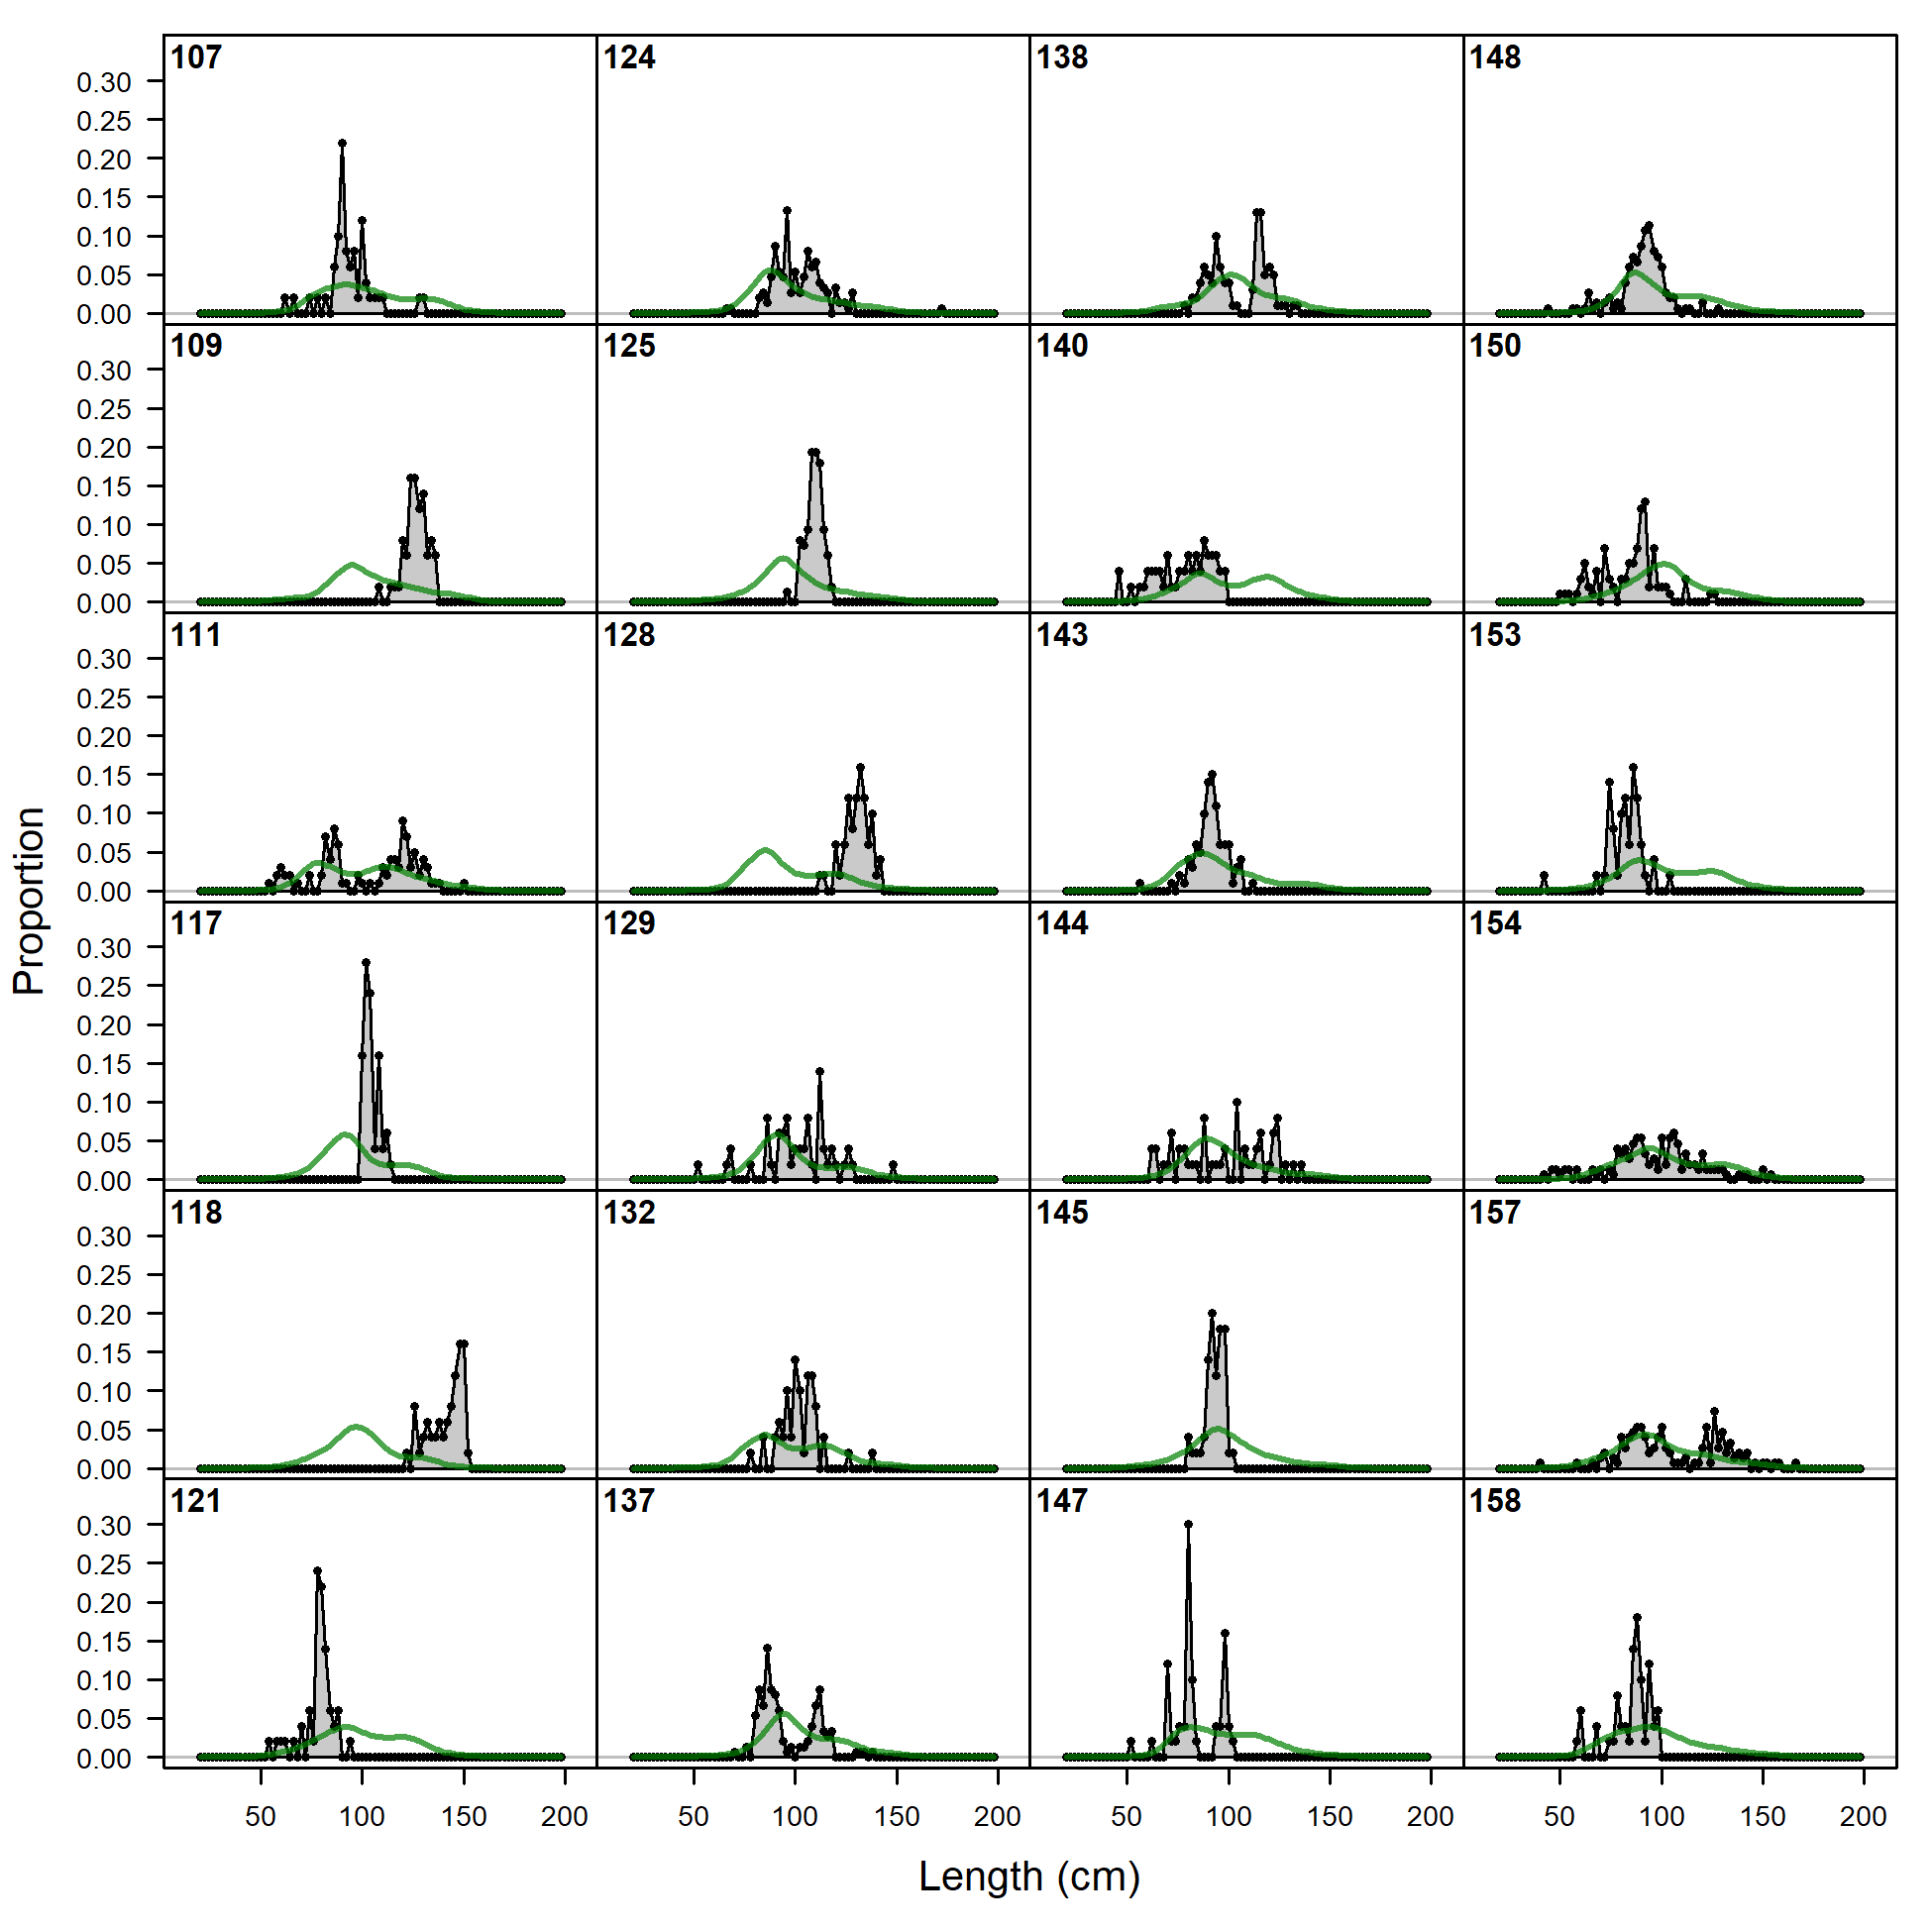
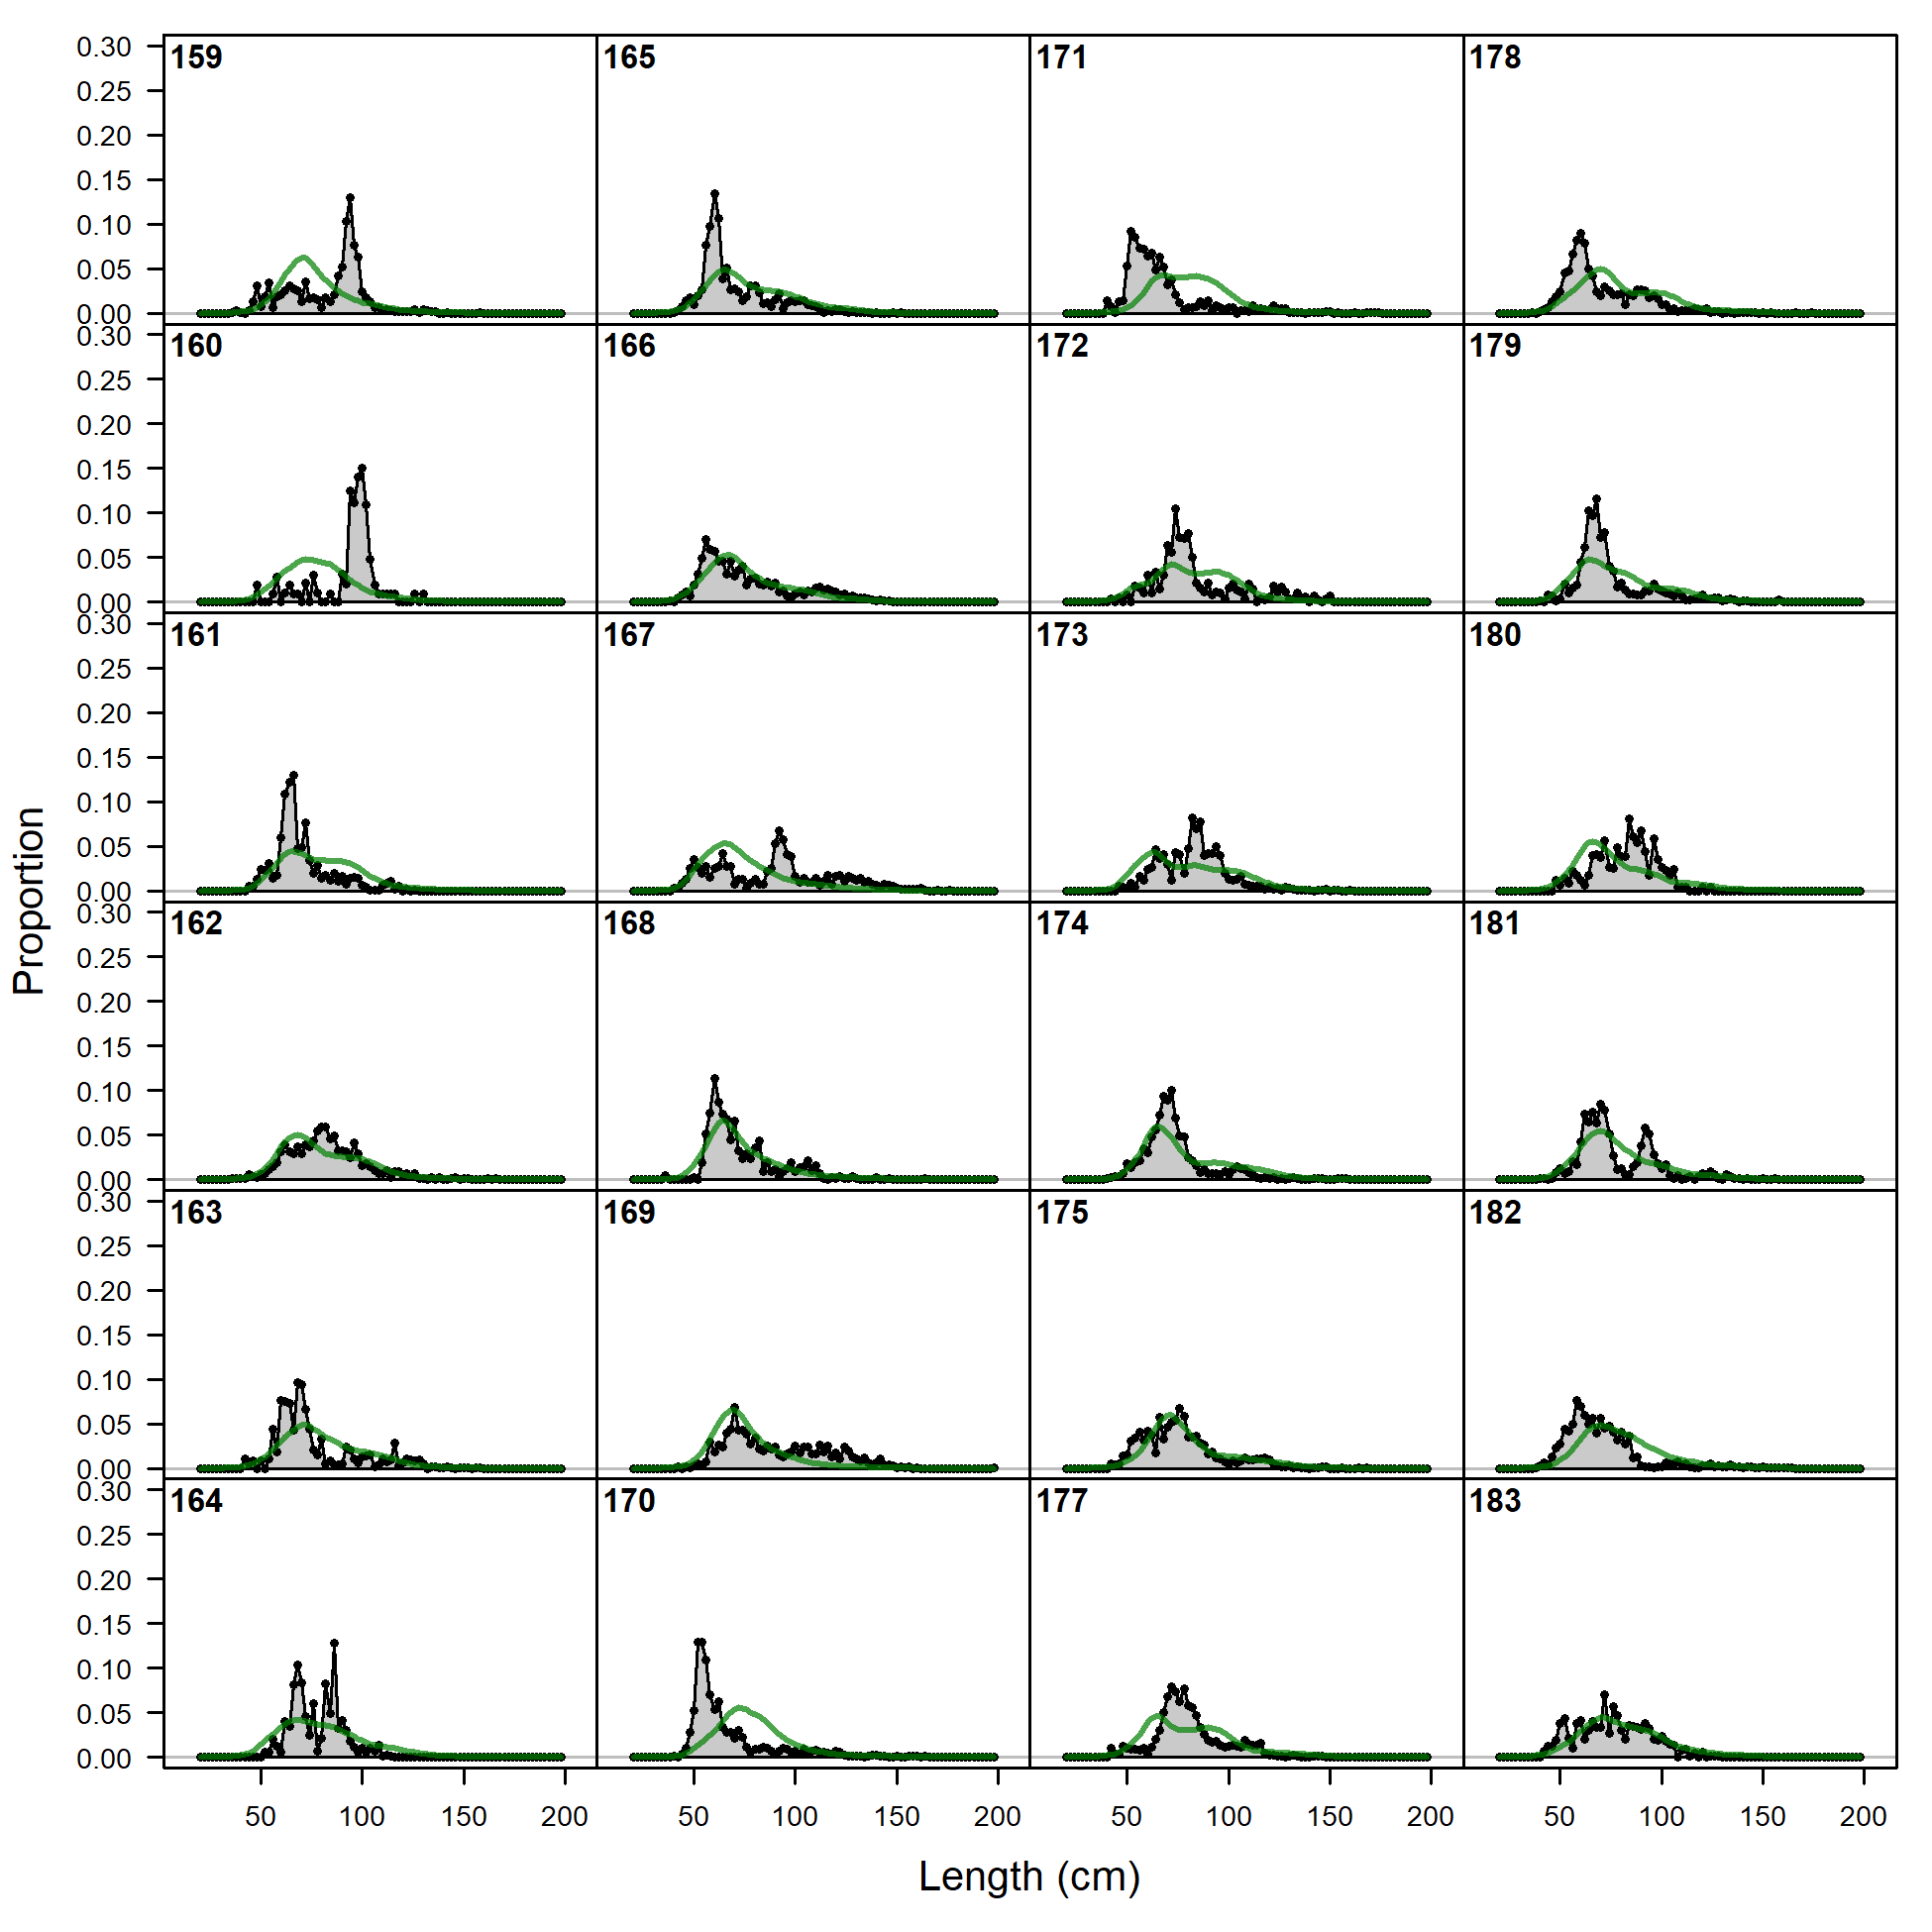
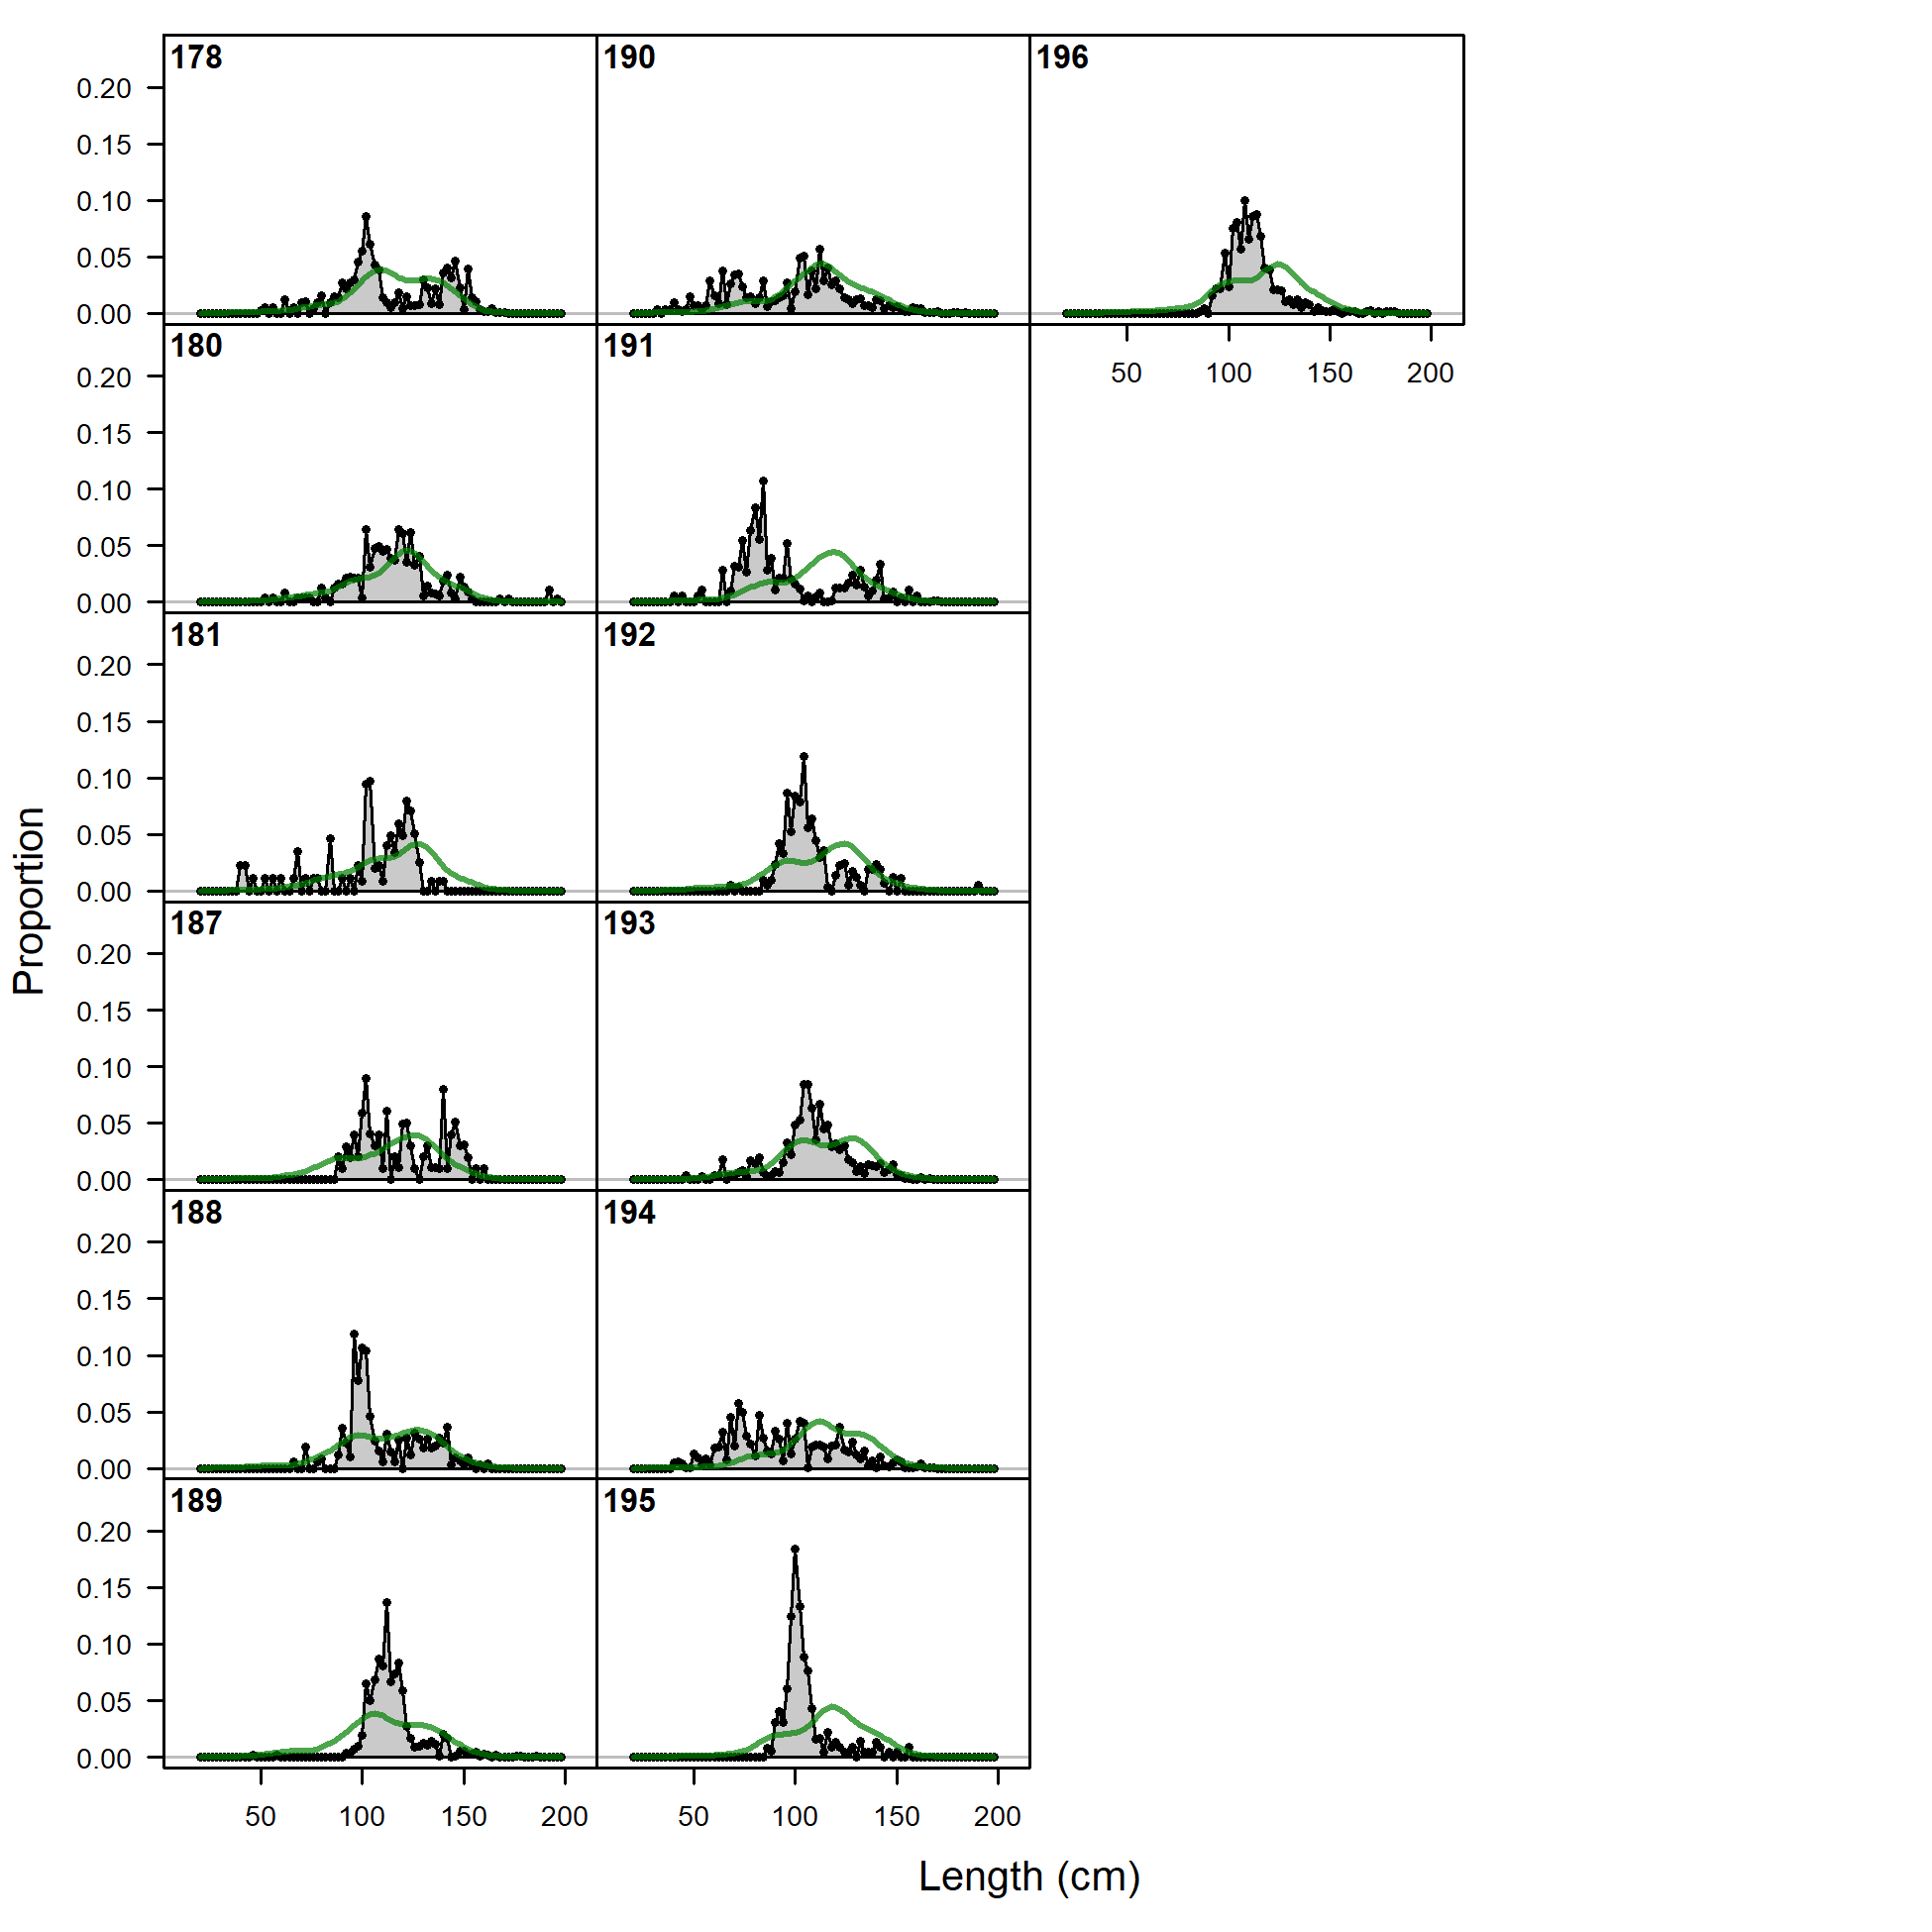
Length comps, retained, F3_PS_OBJ_Offshore (plot 1 of 5).
'N adj.' is the input sample size after data-weighting adjustment. N eff. is the calculated effective sample size used in the McAllister-Ianelli tuning method. (plot 2 of 5) (plot 3 of 5) (plot 4 of 5)
file: comp_lenfit_flt3mkt2_page4.png
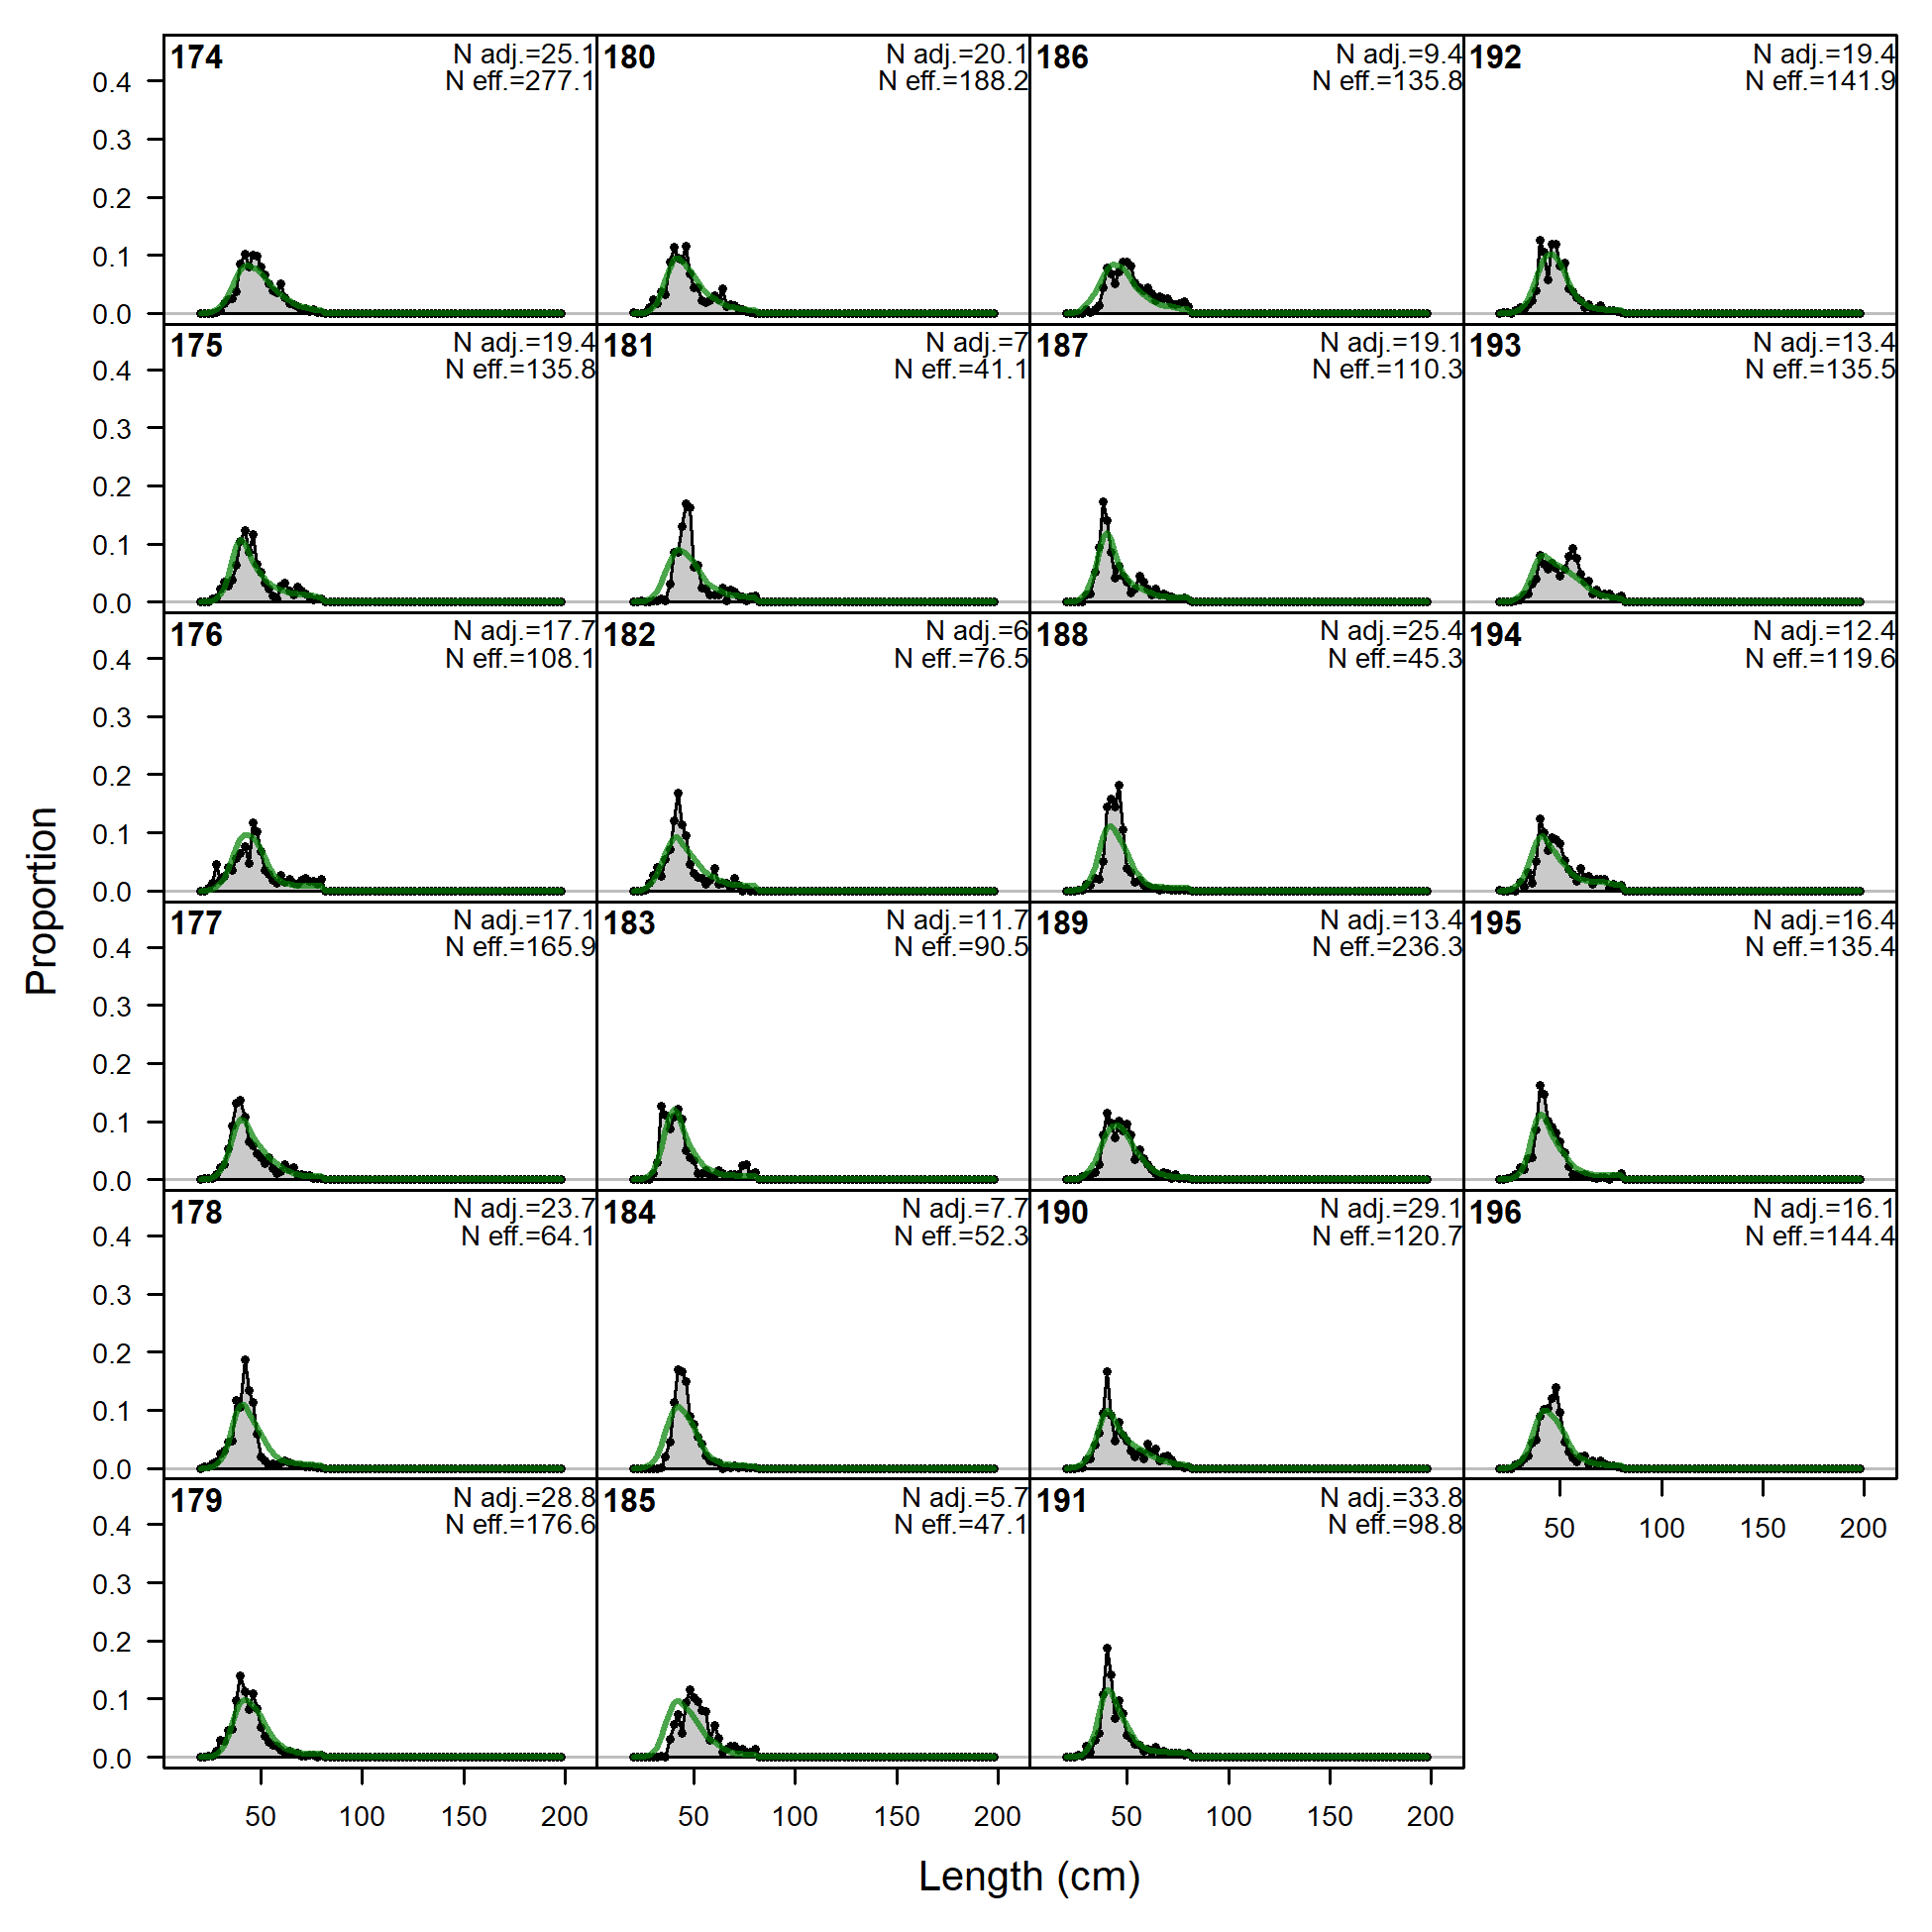
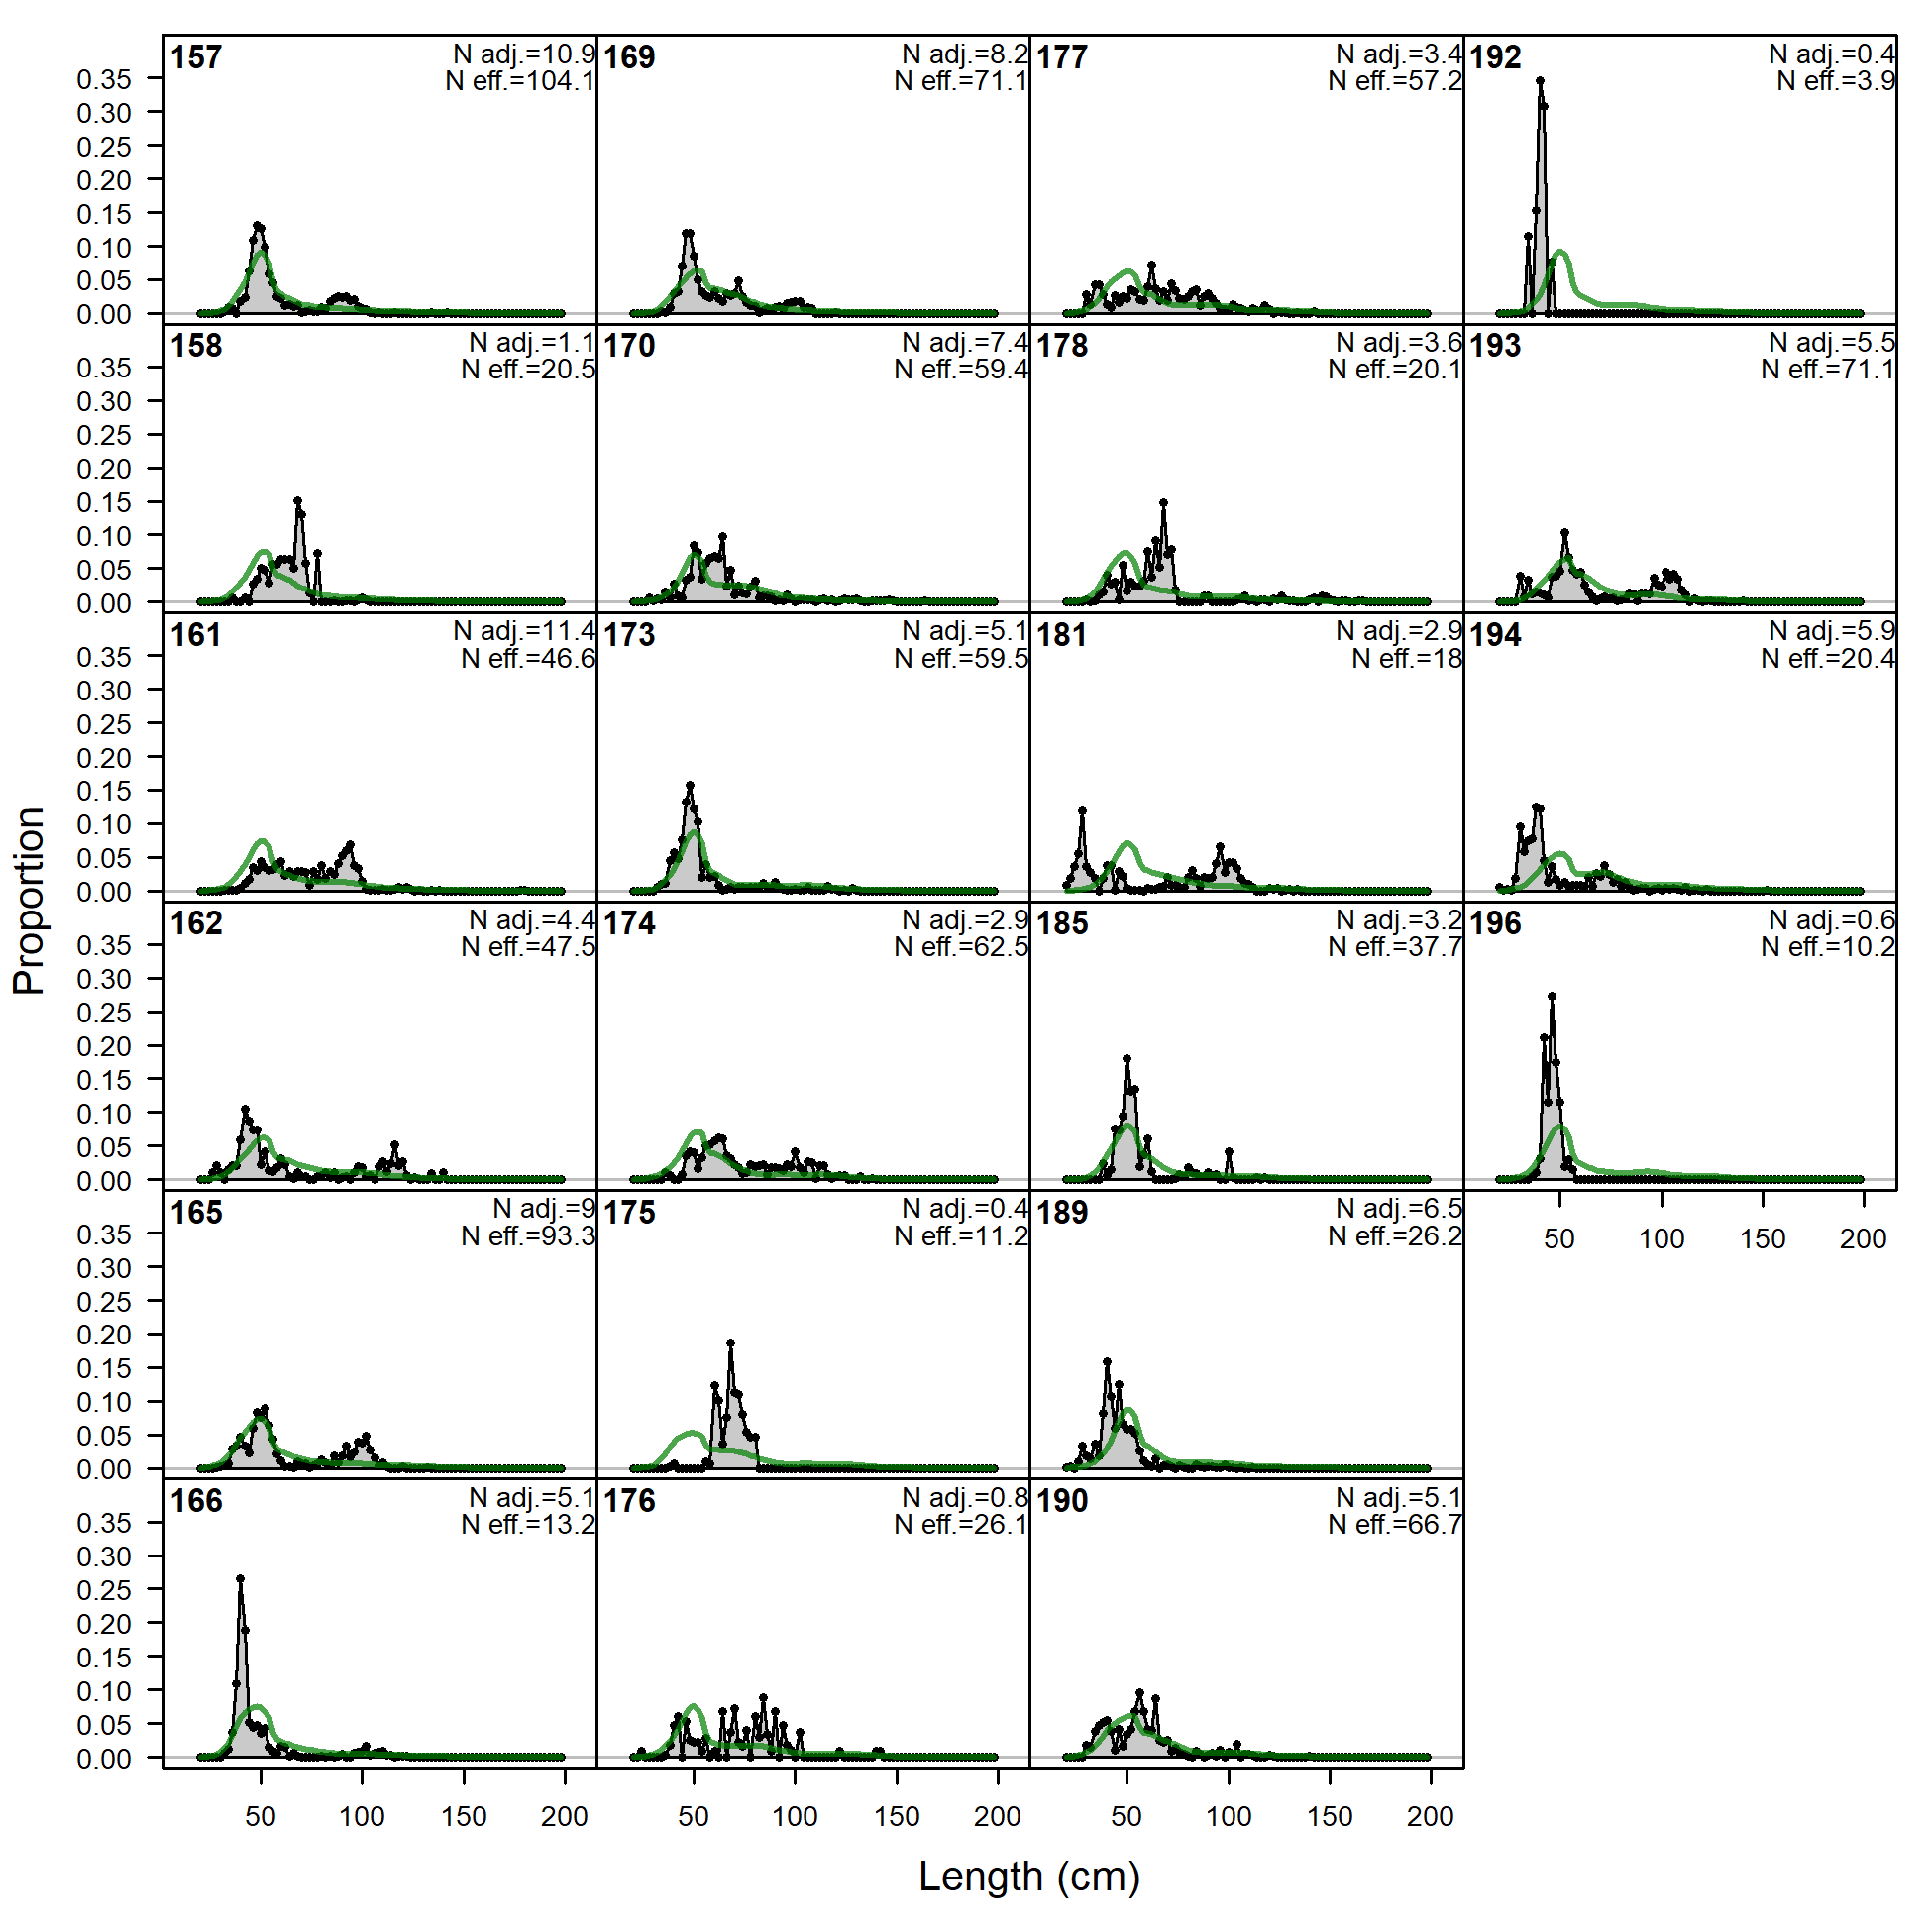
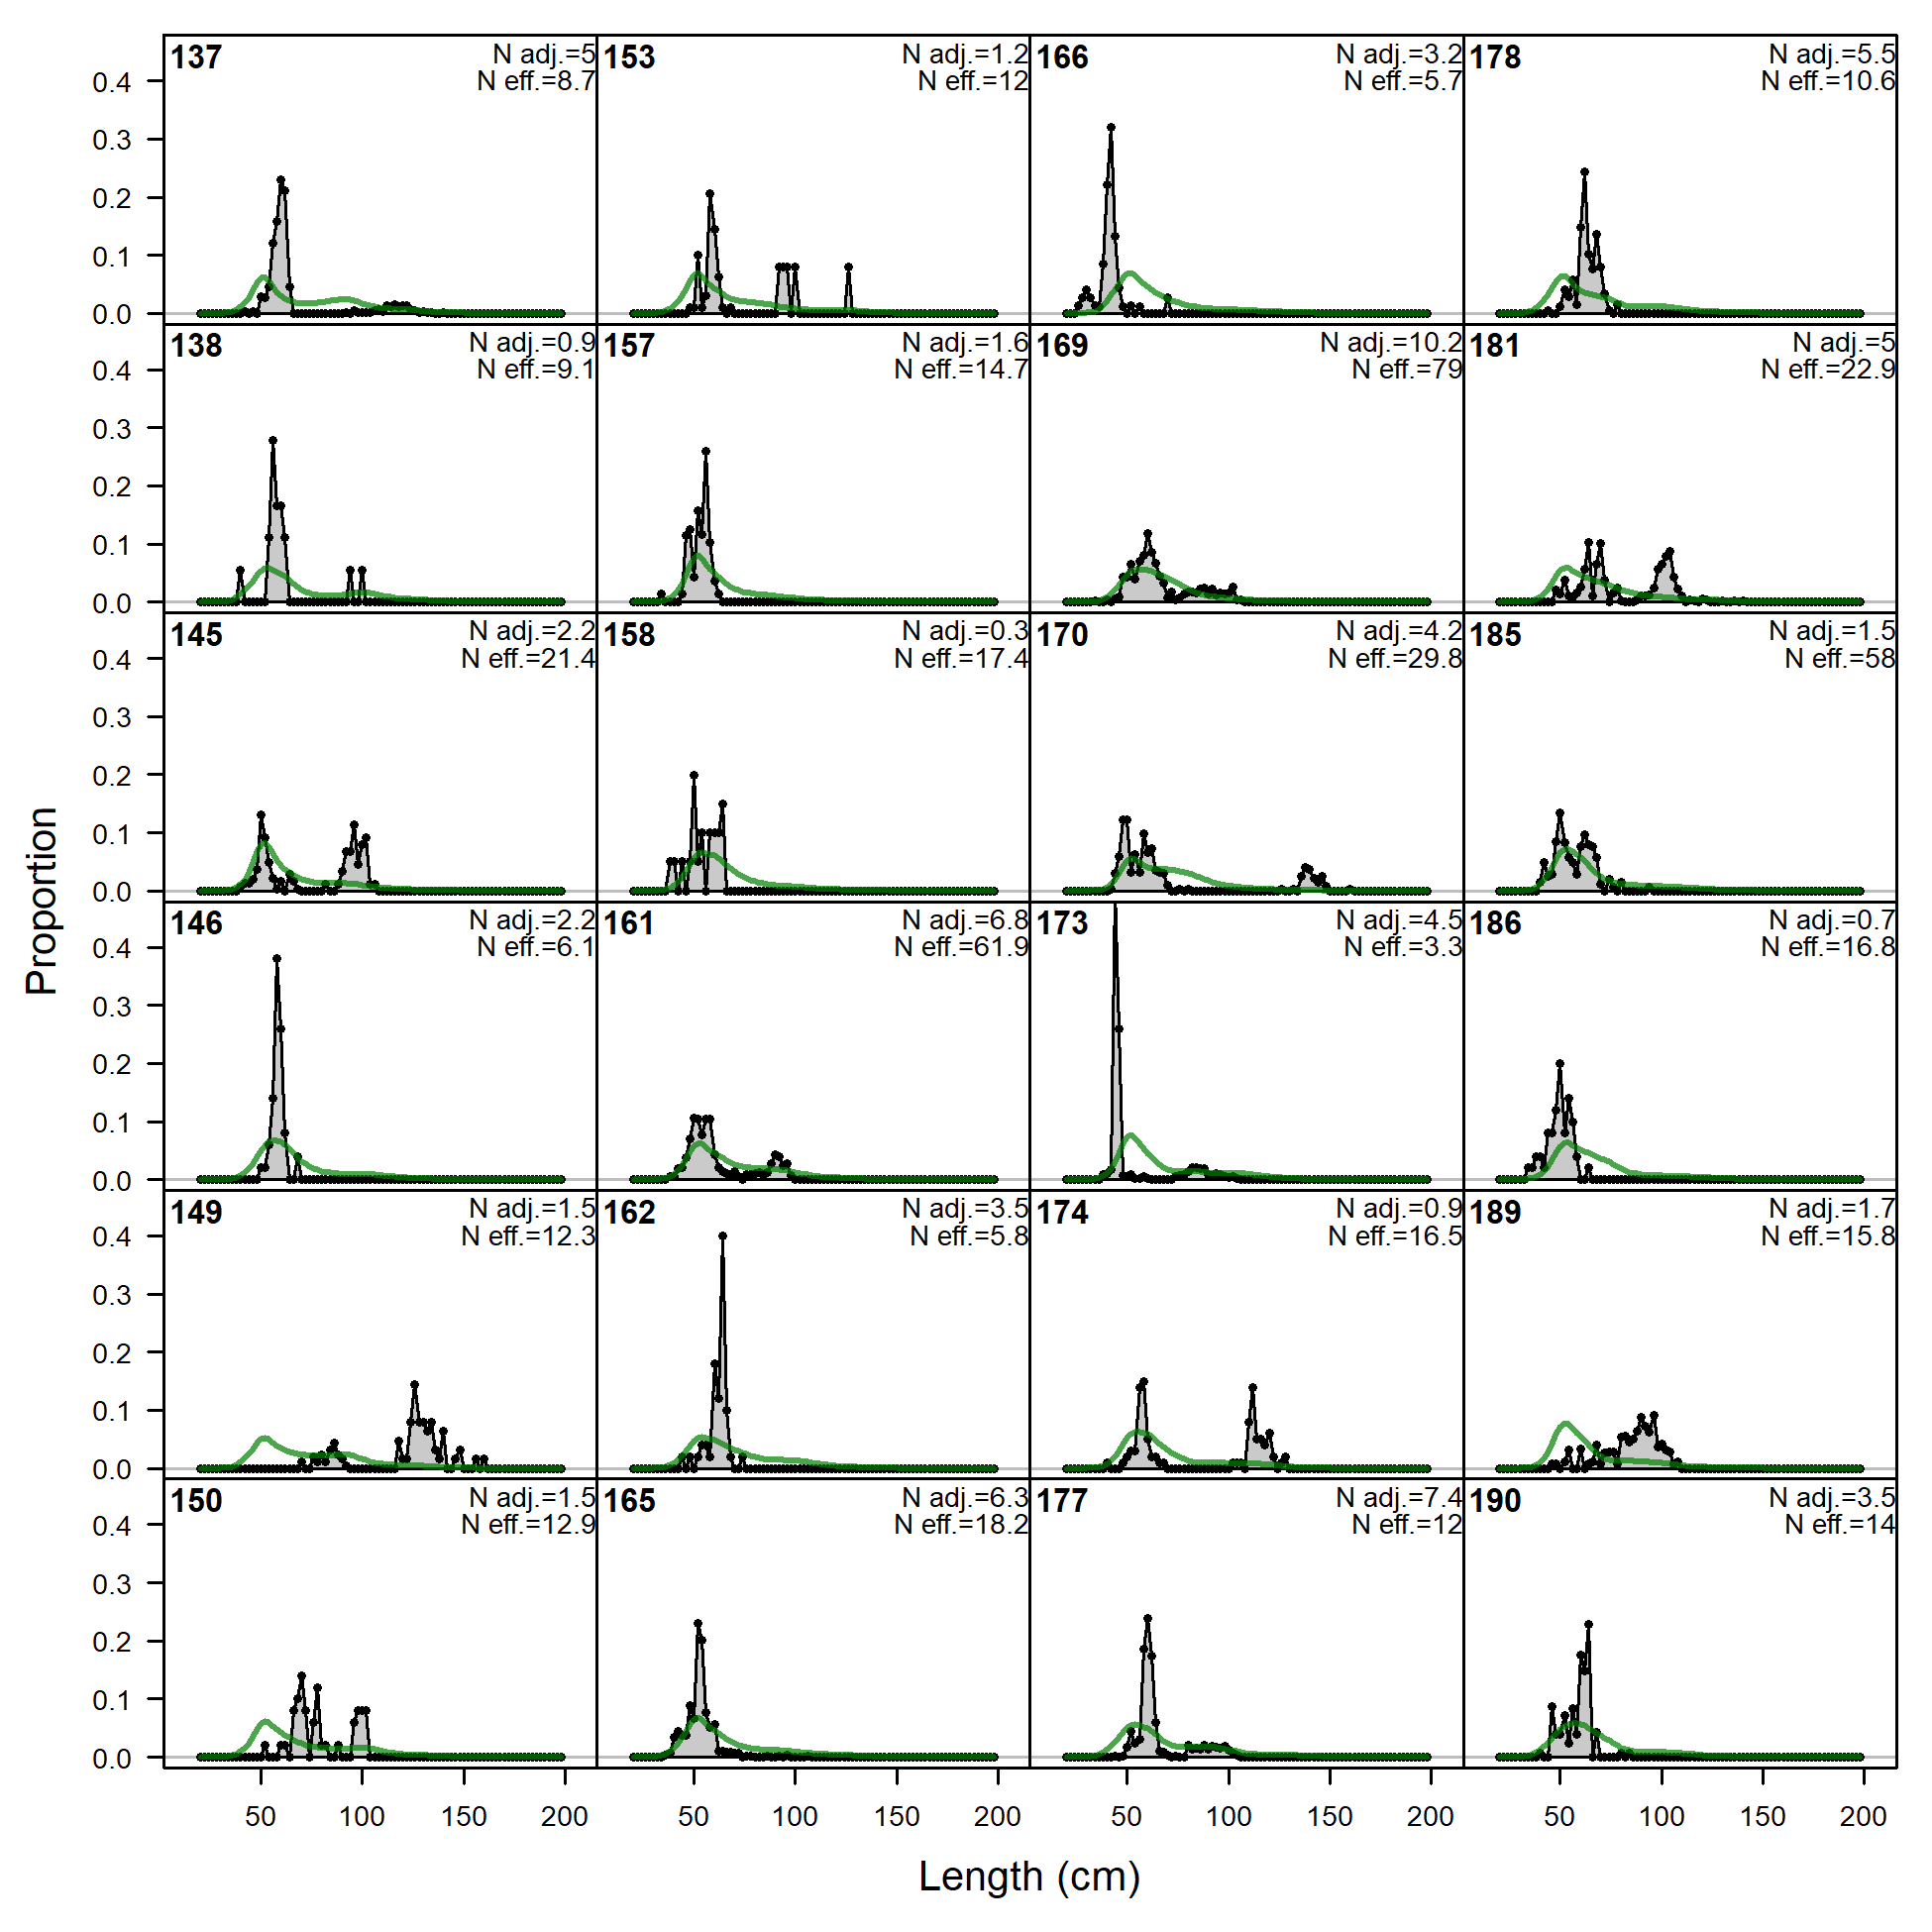
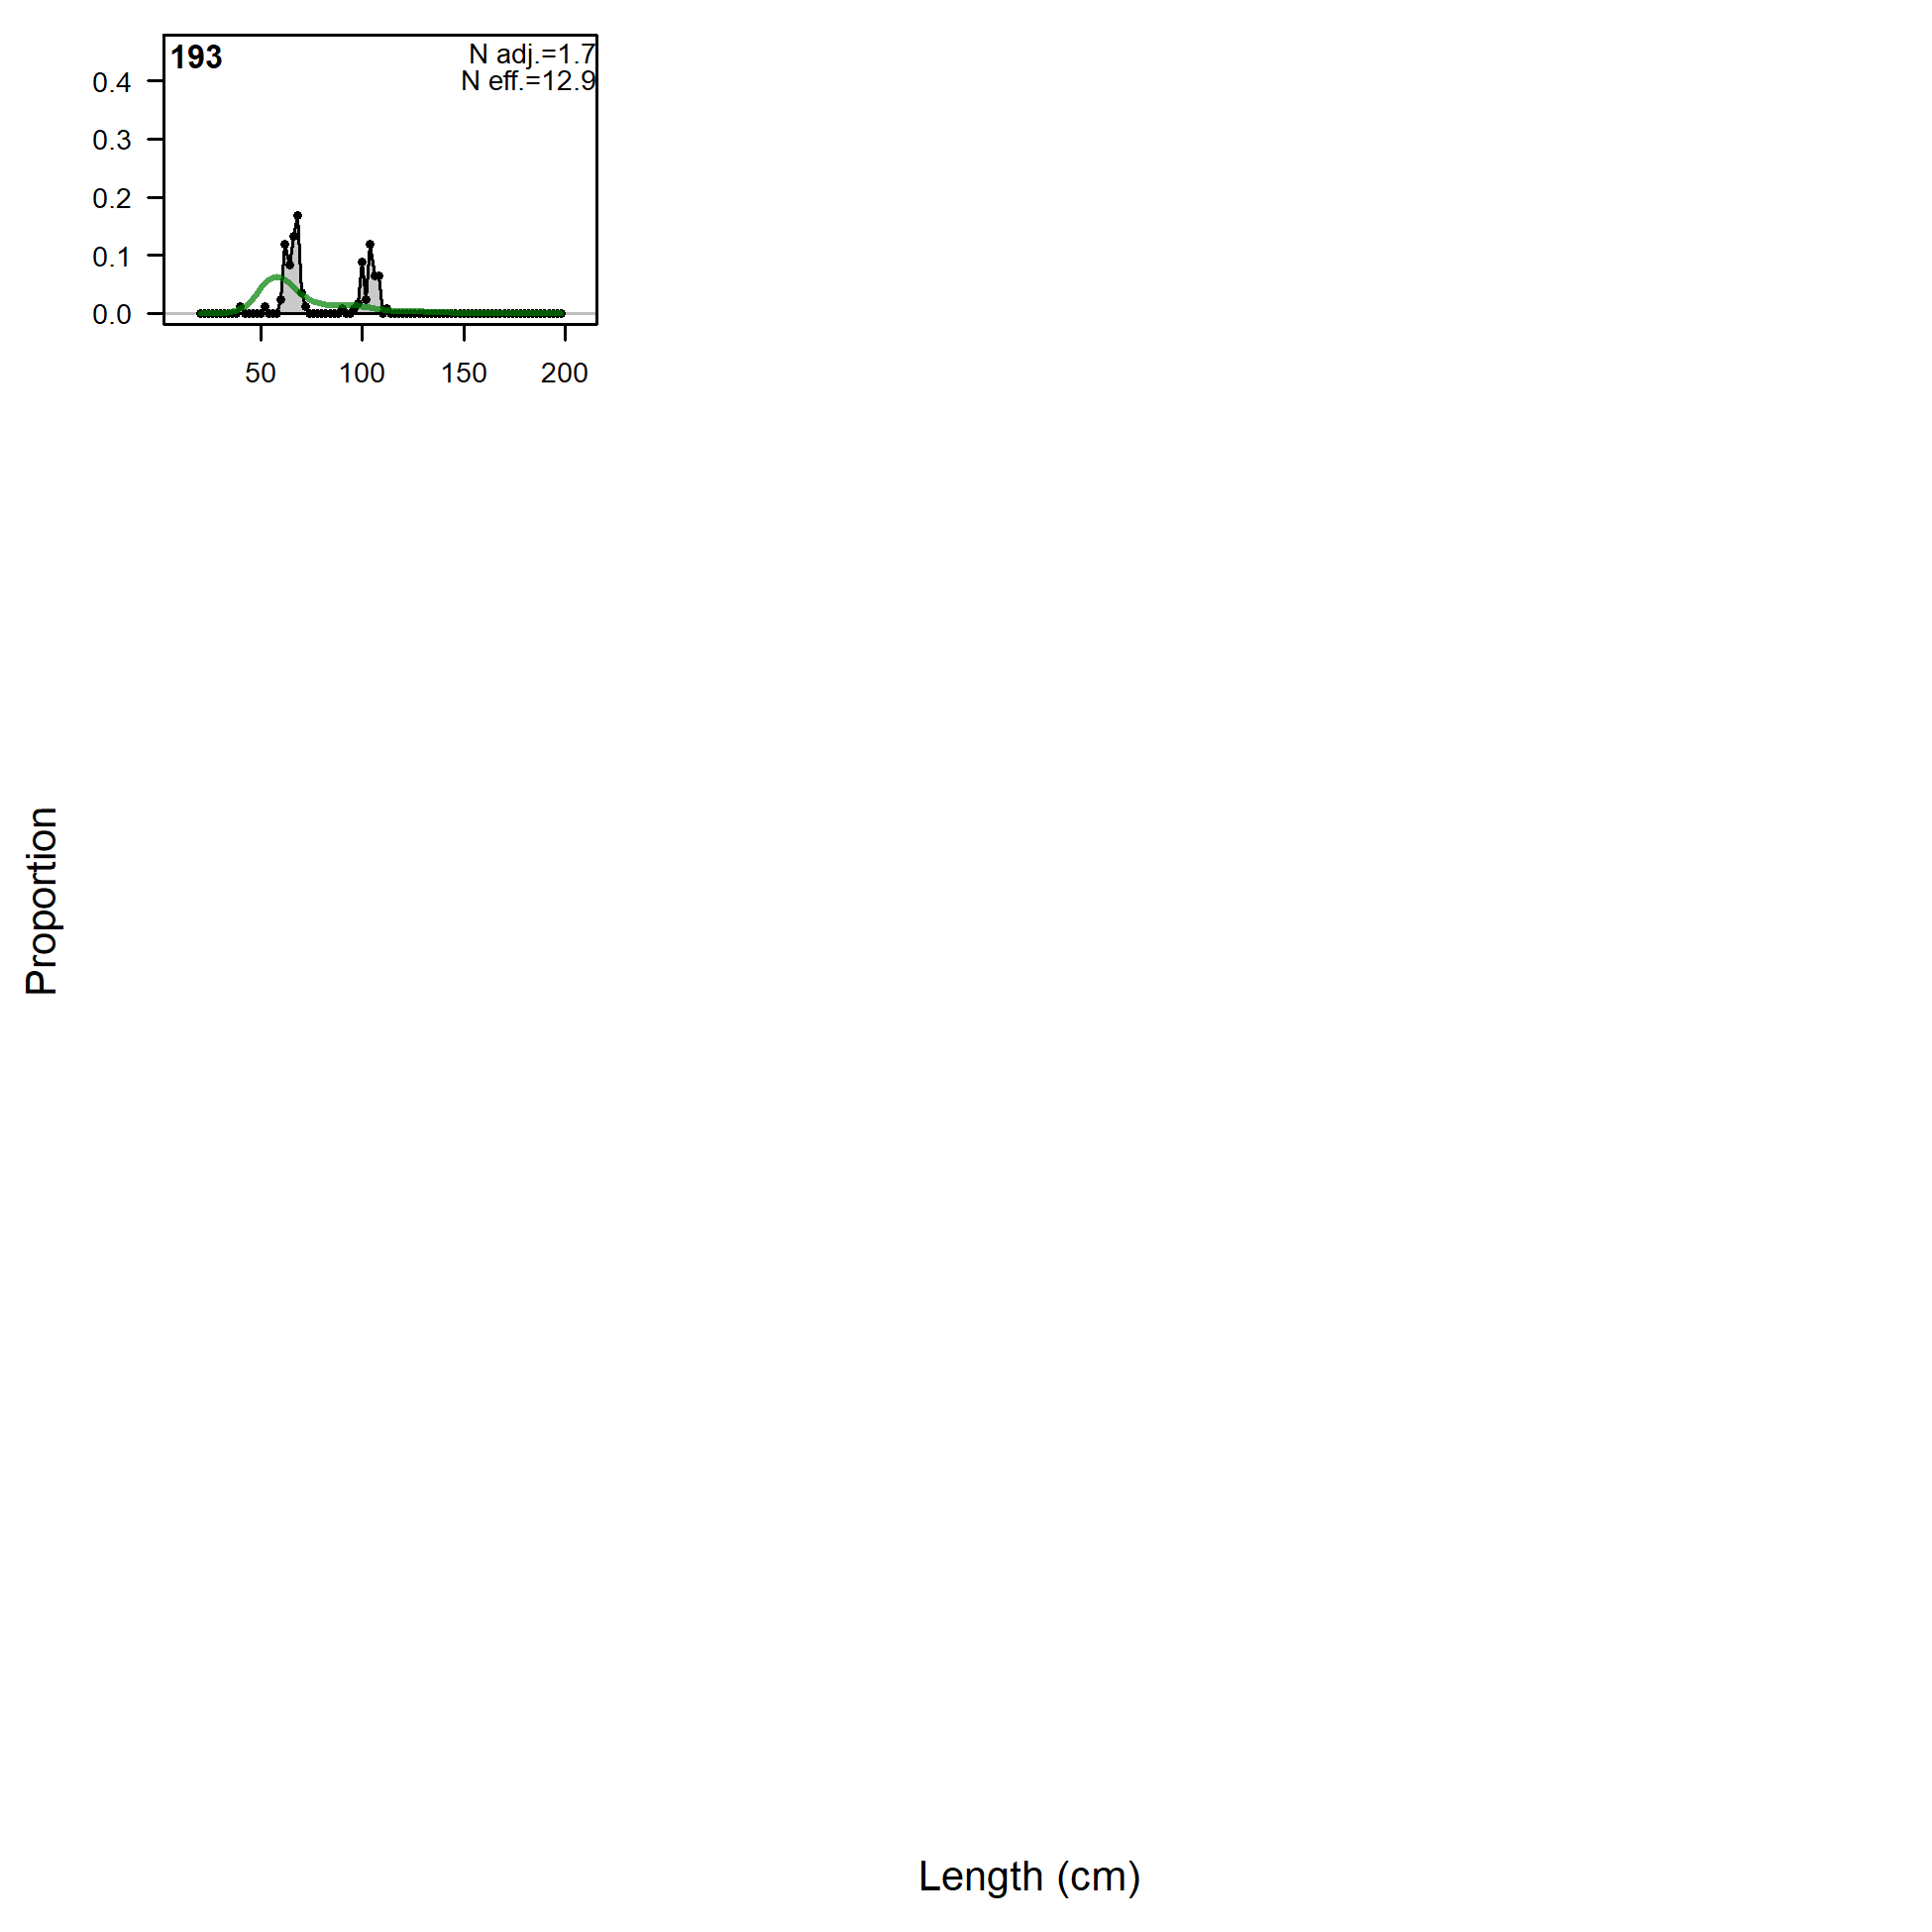
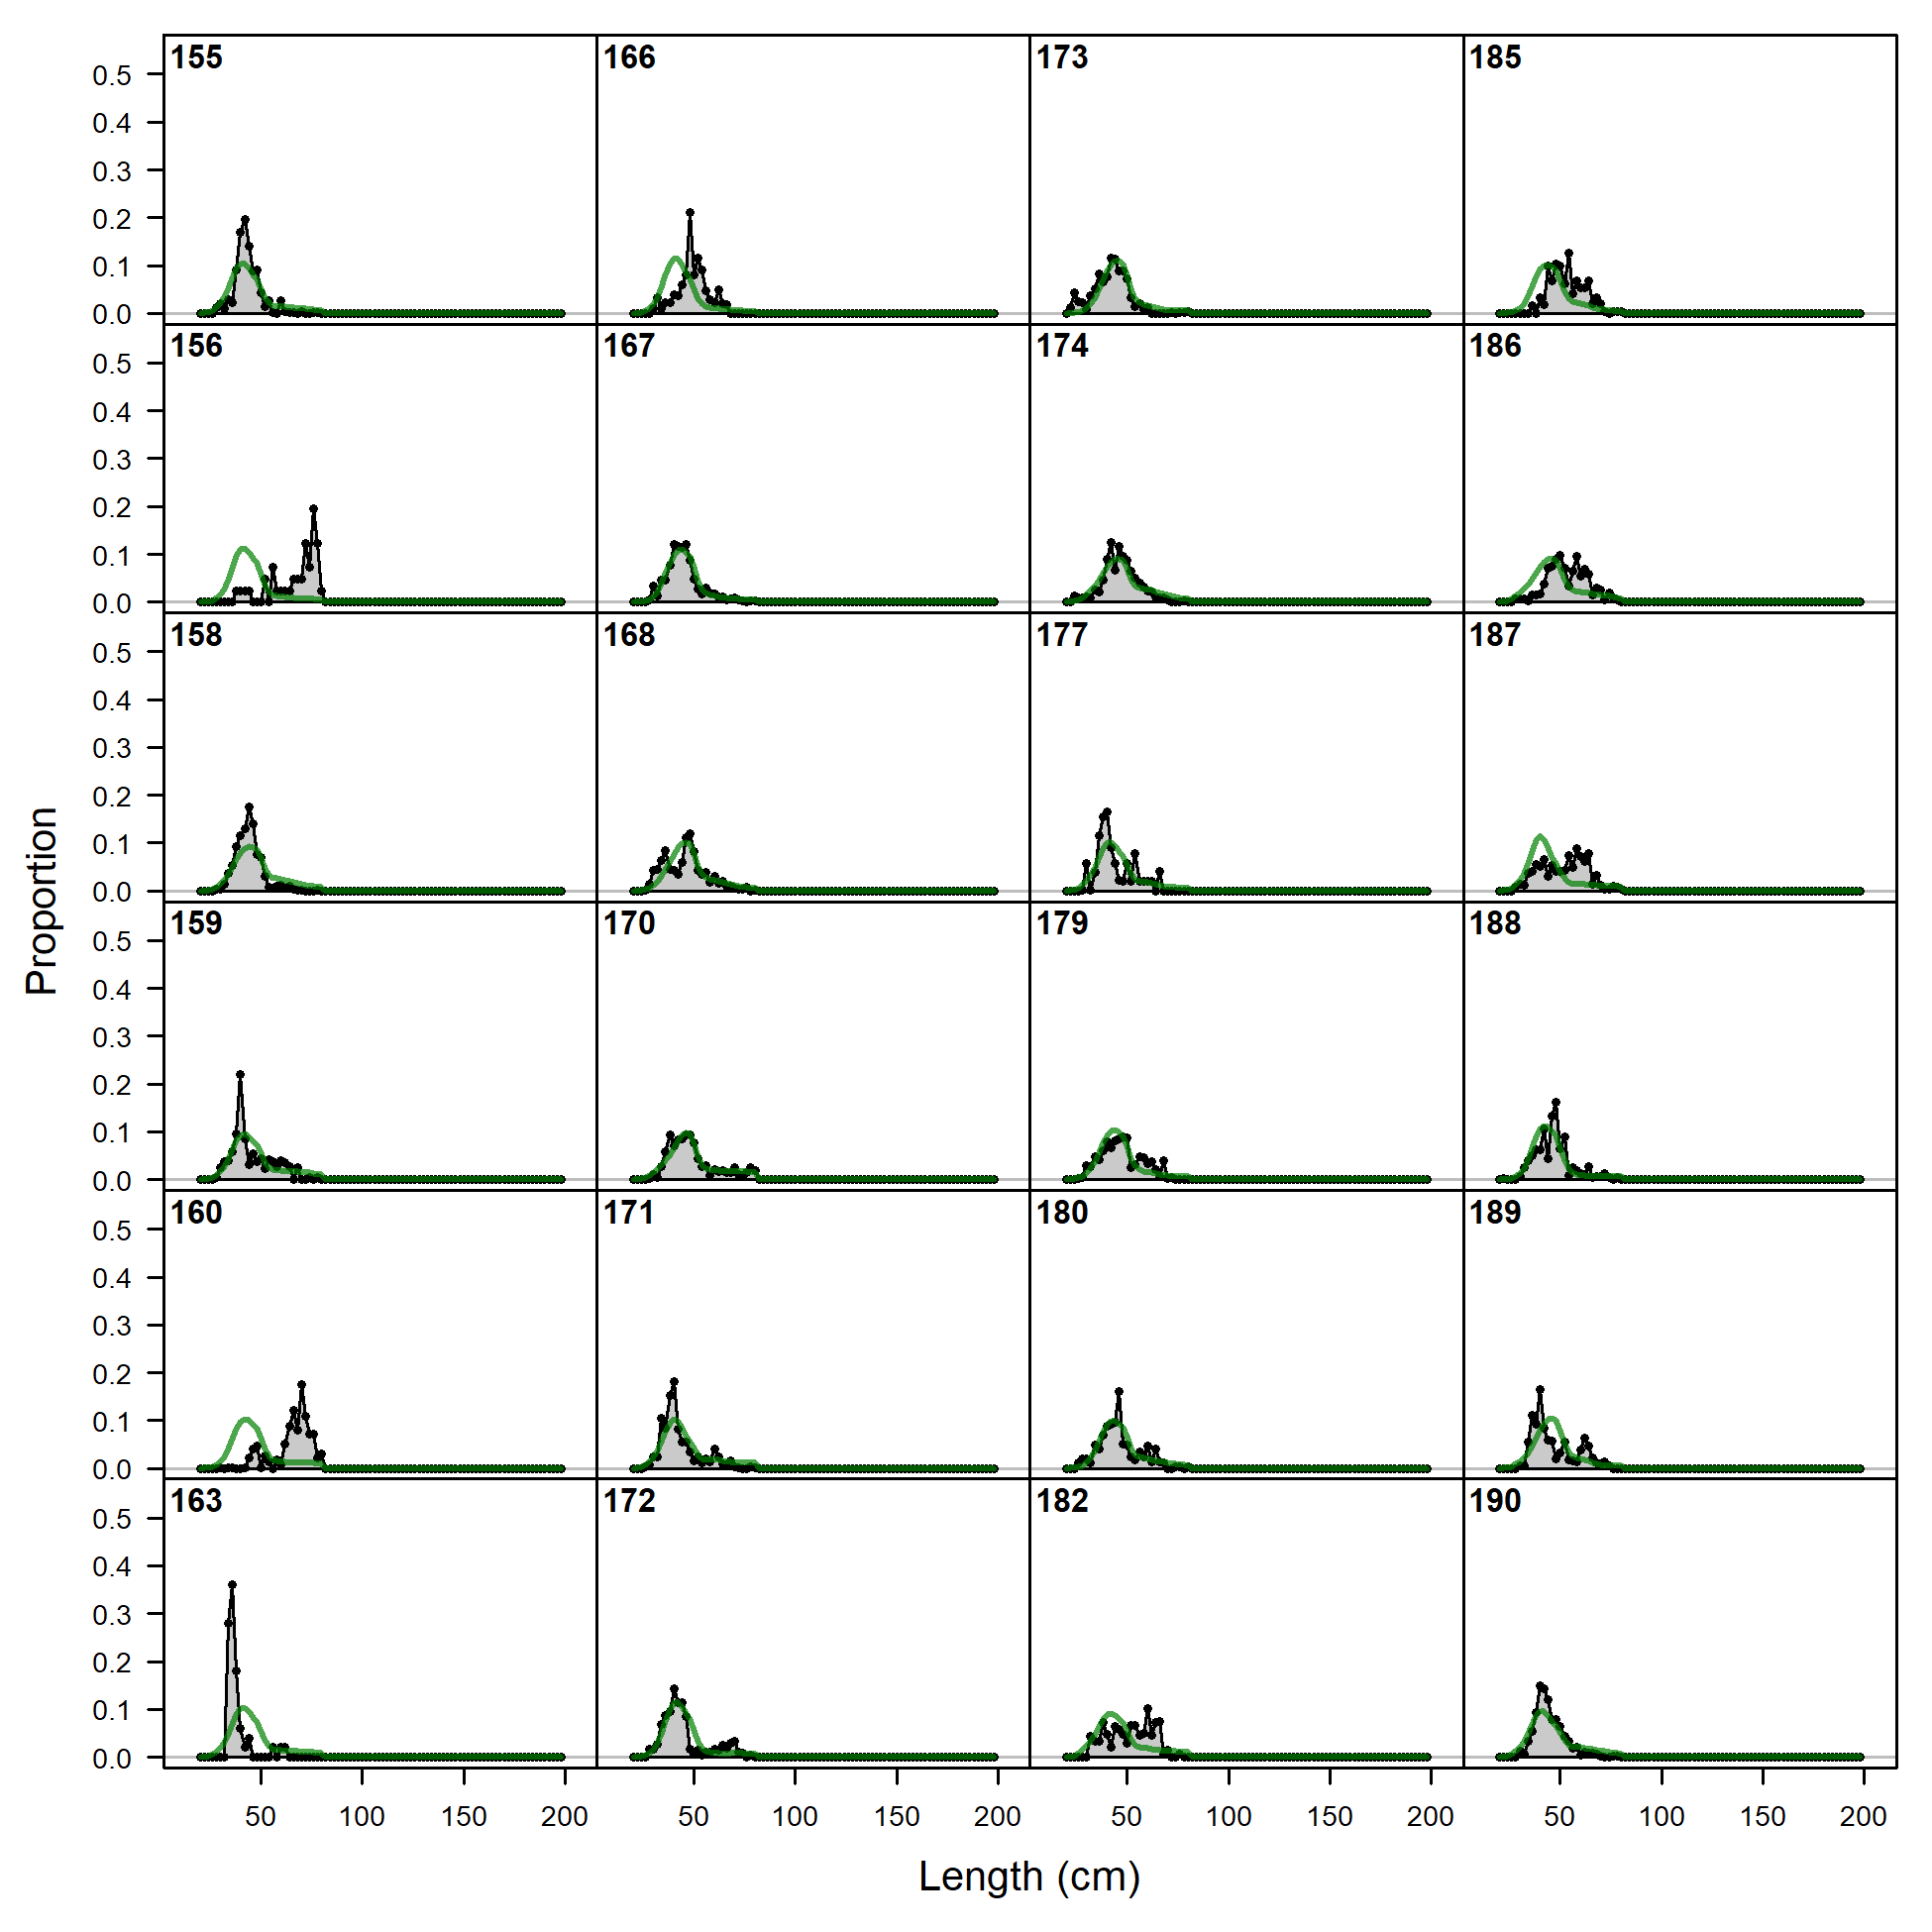
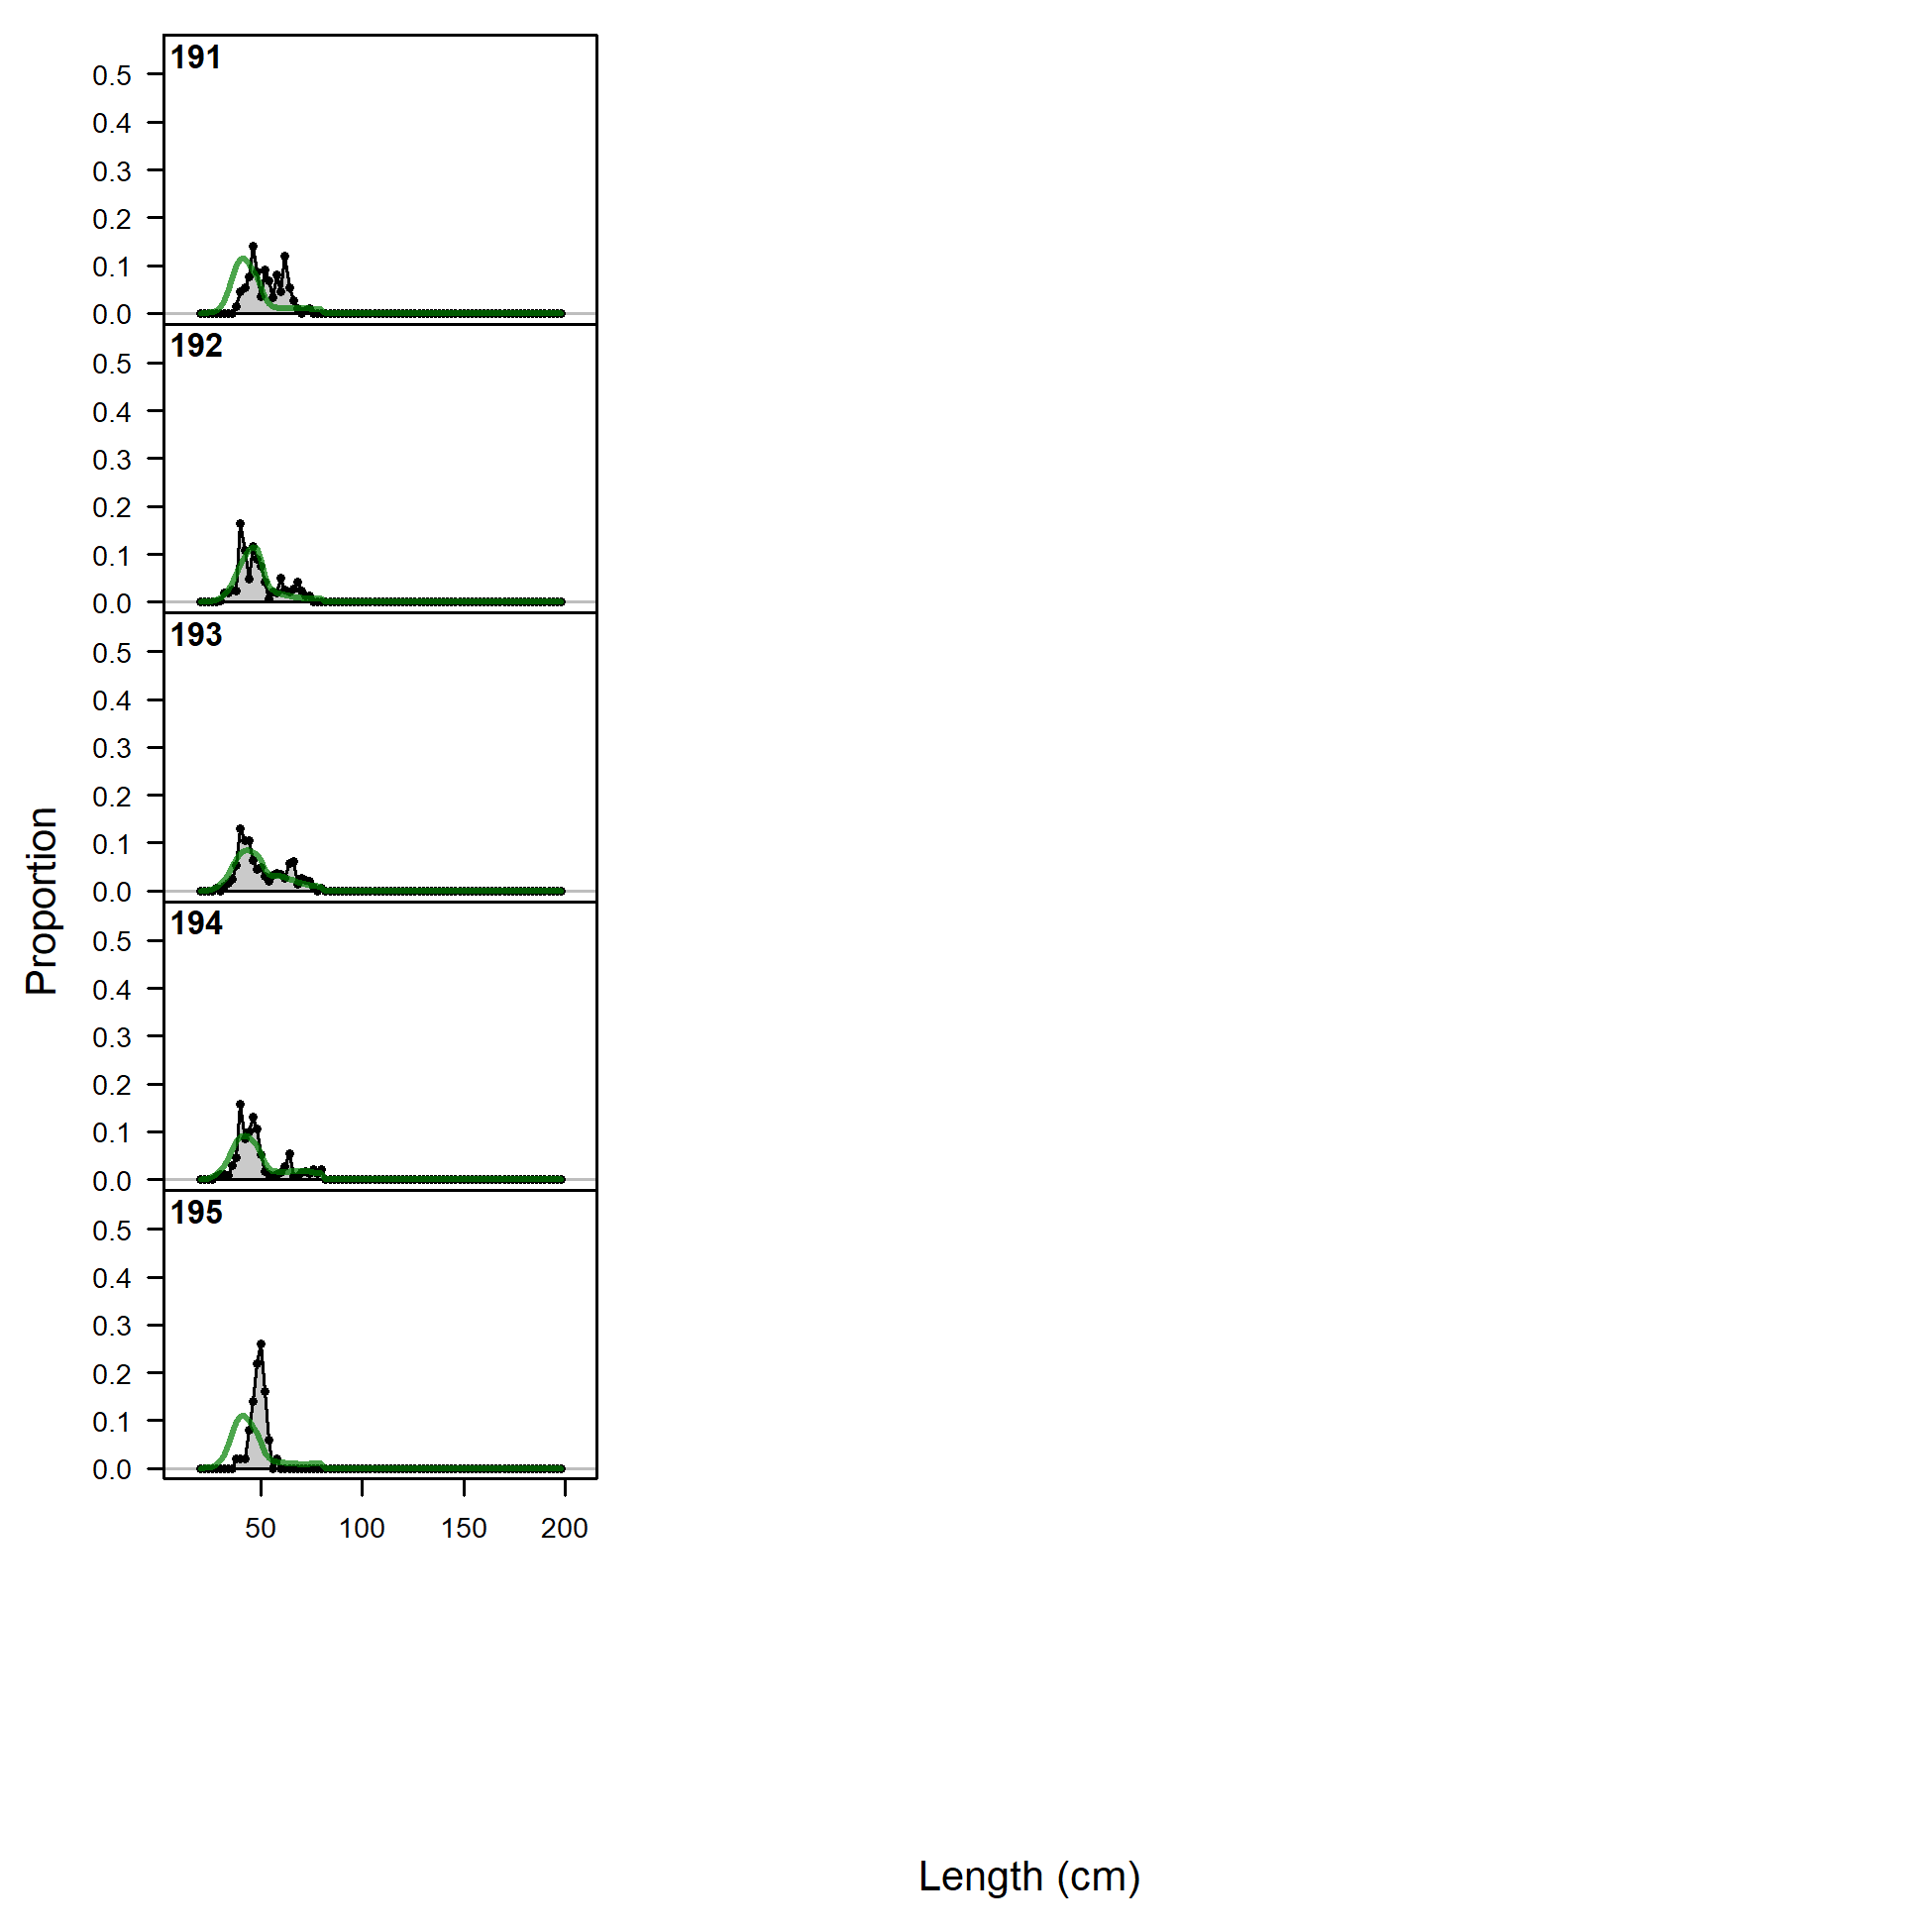
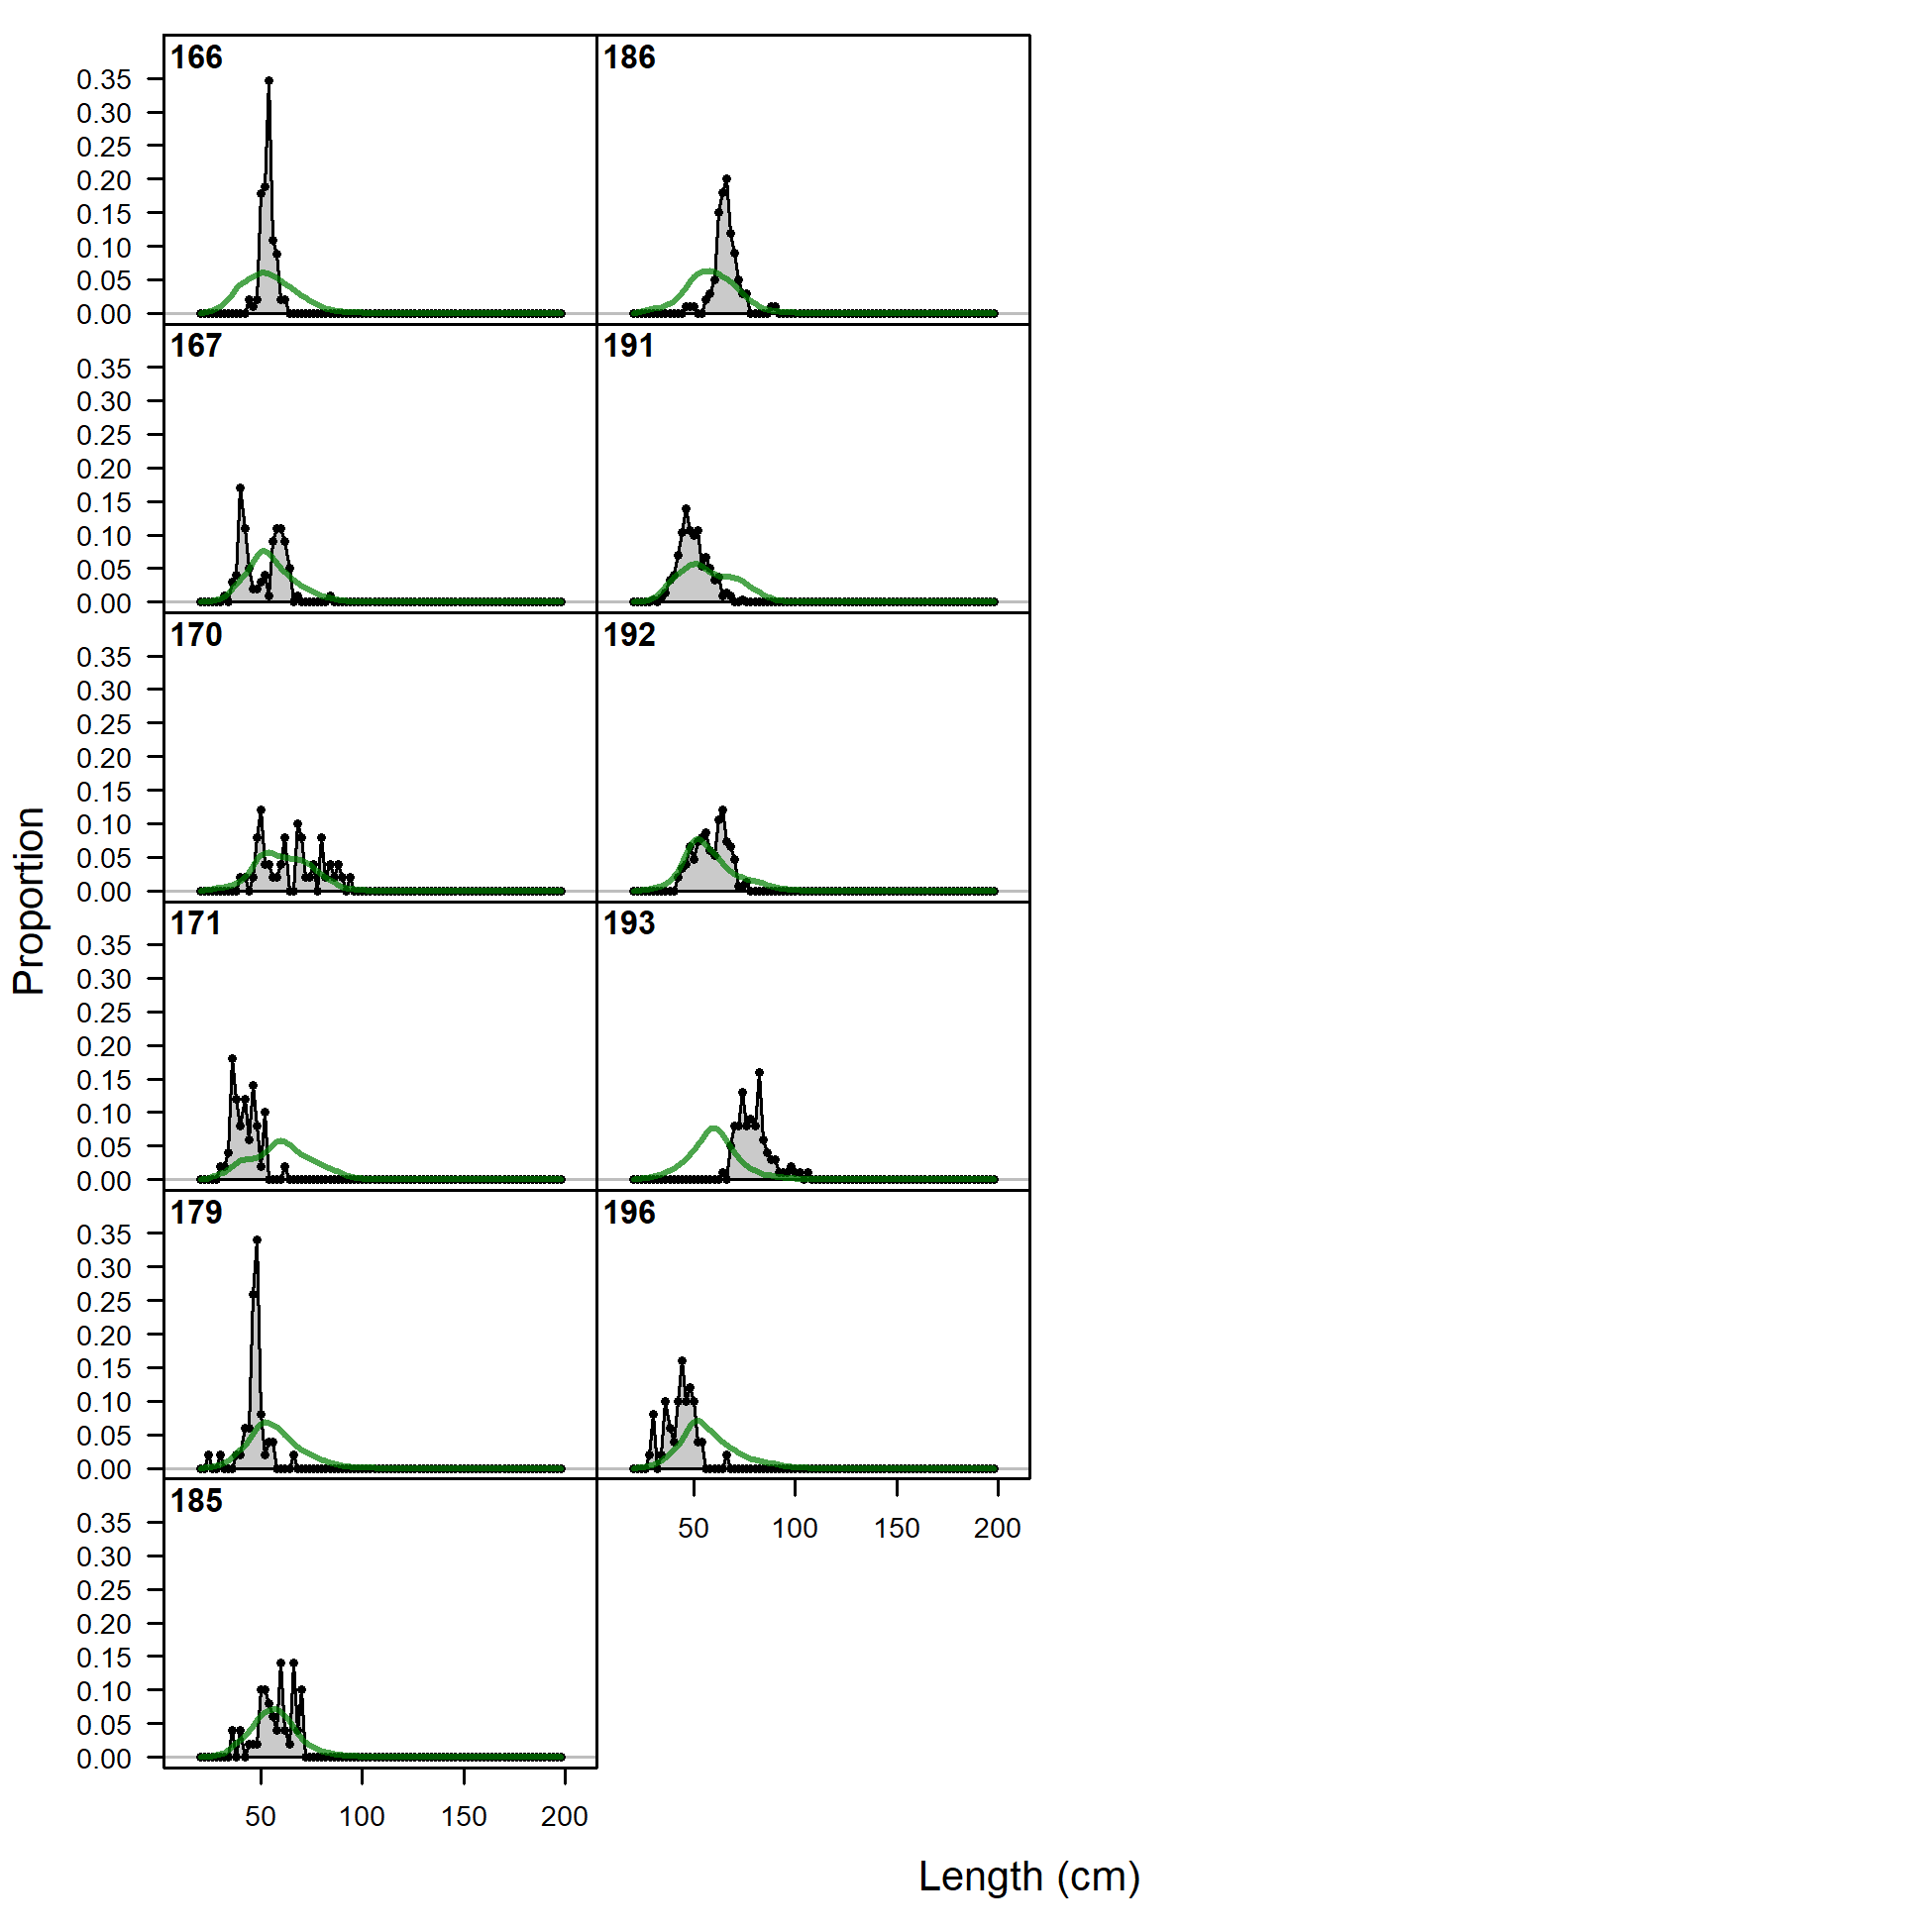
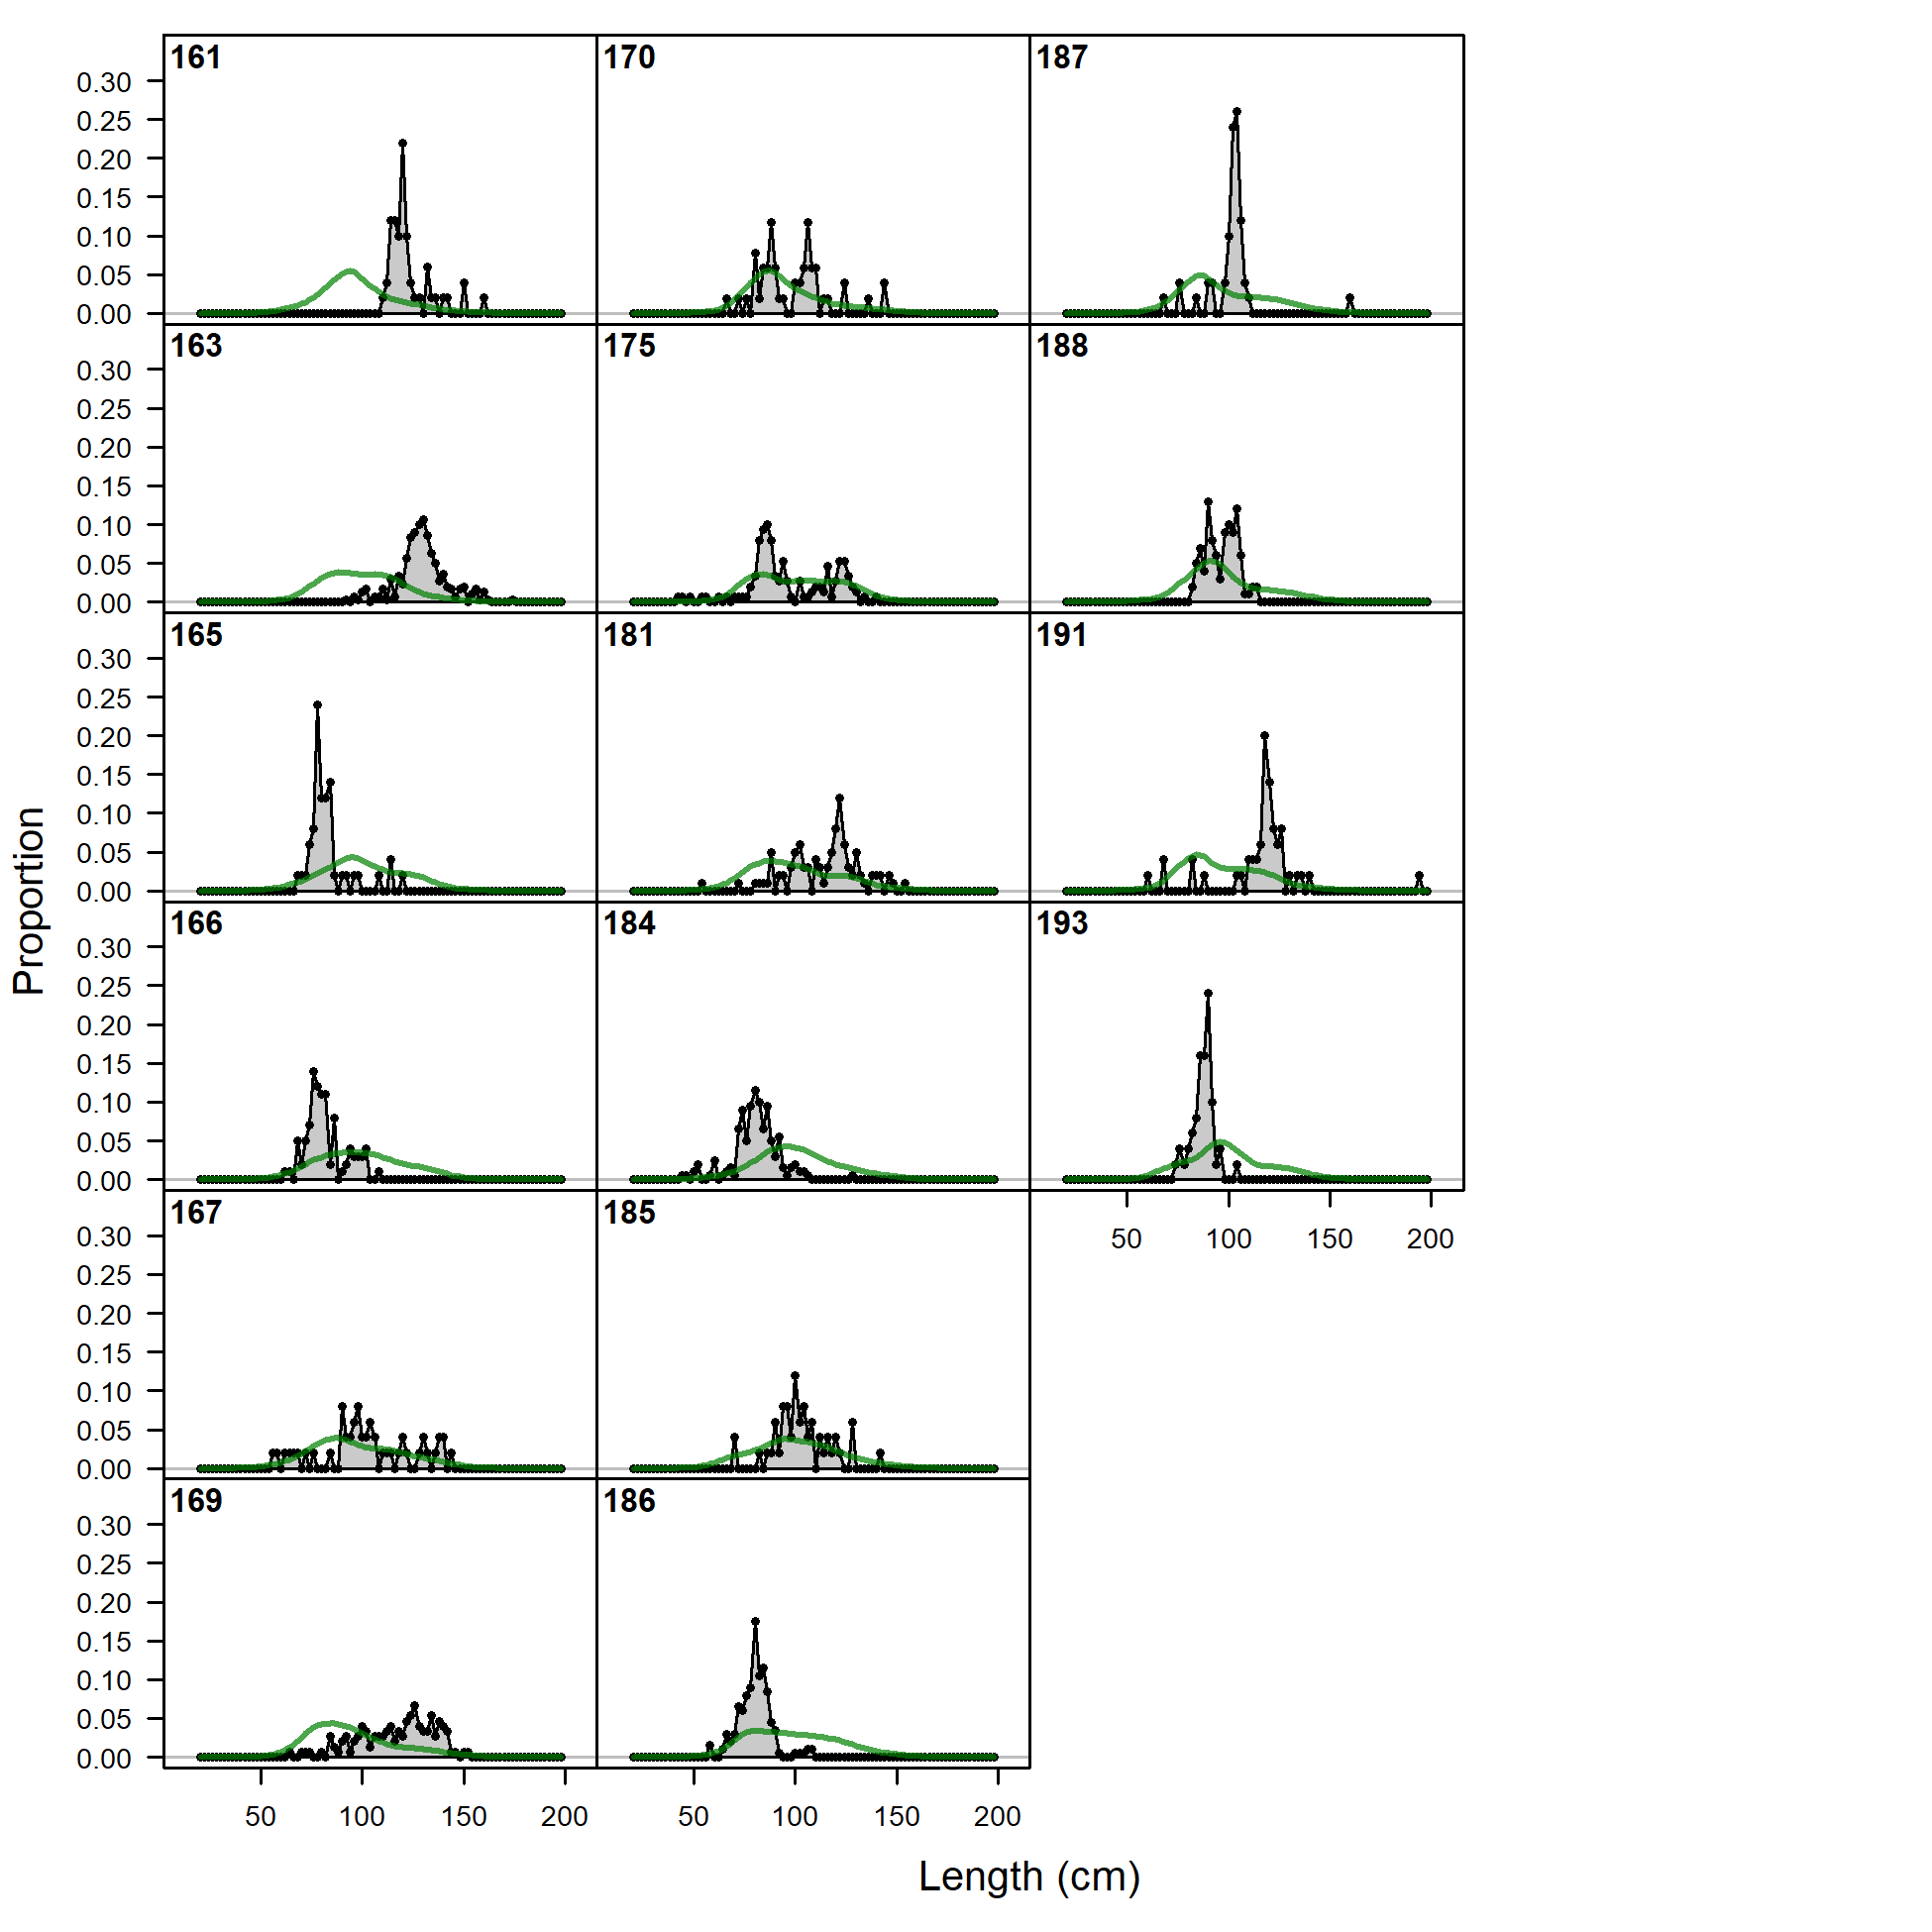
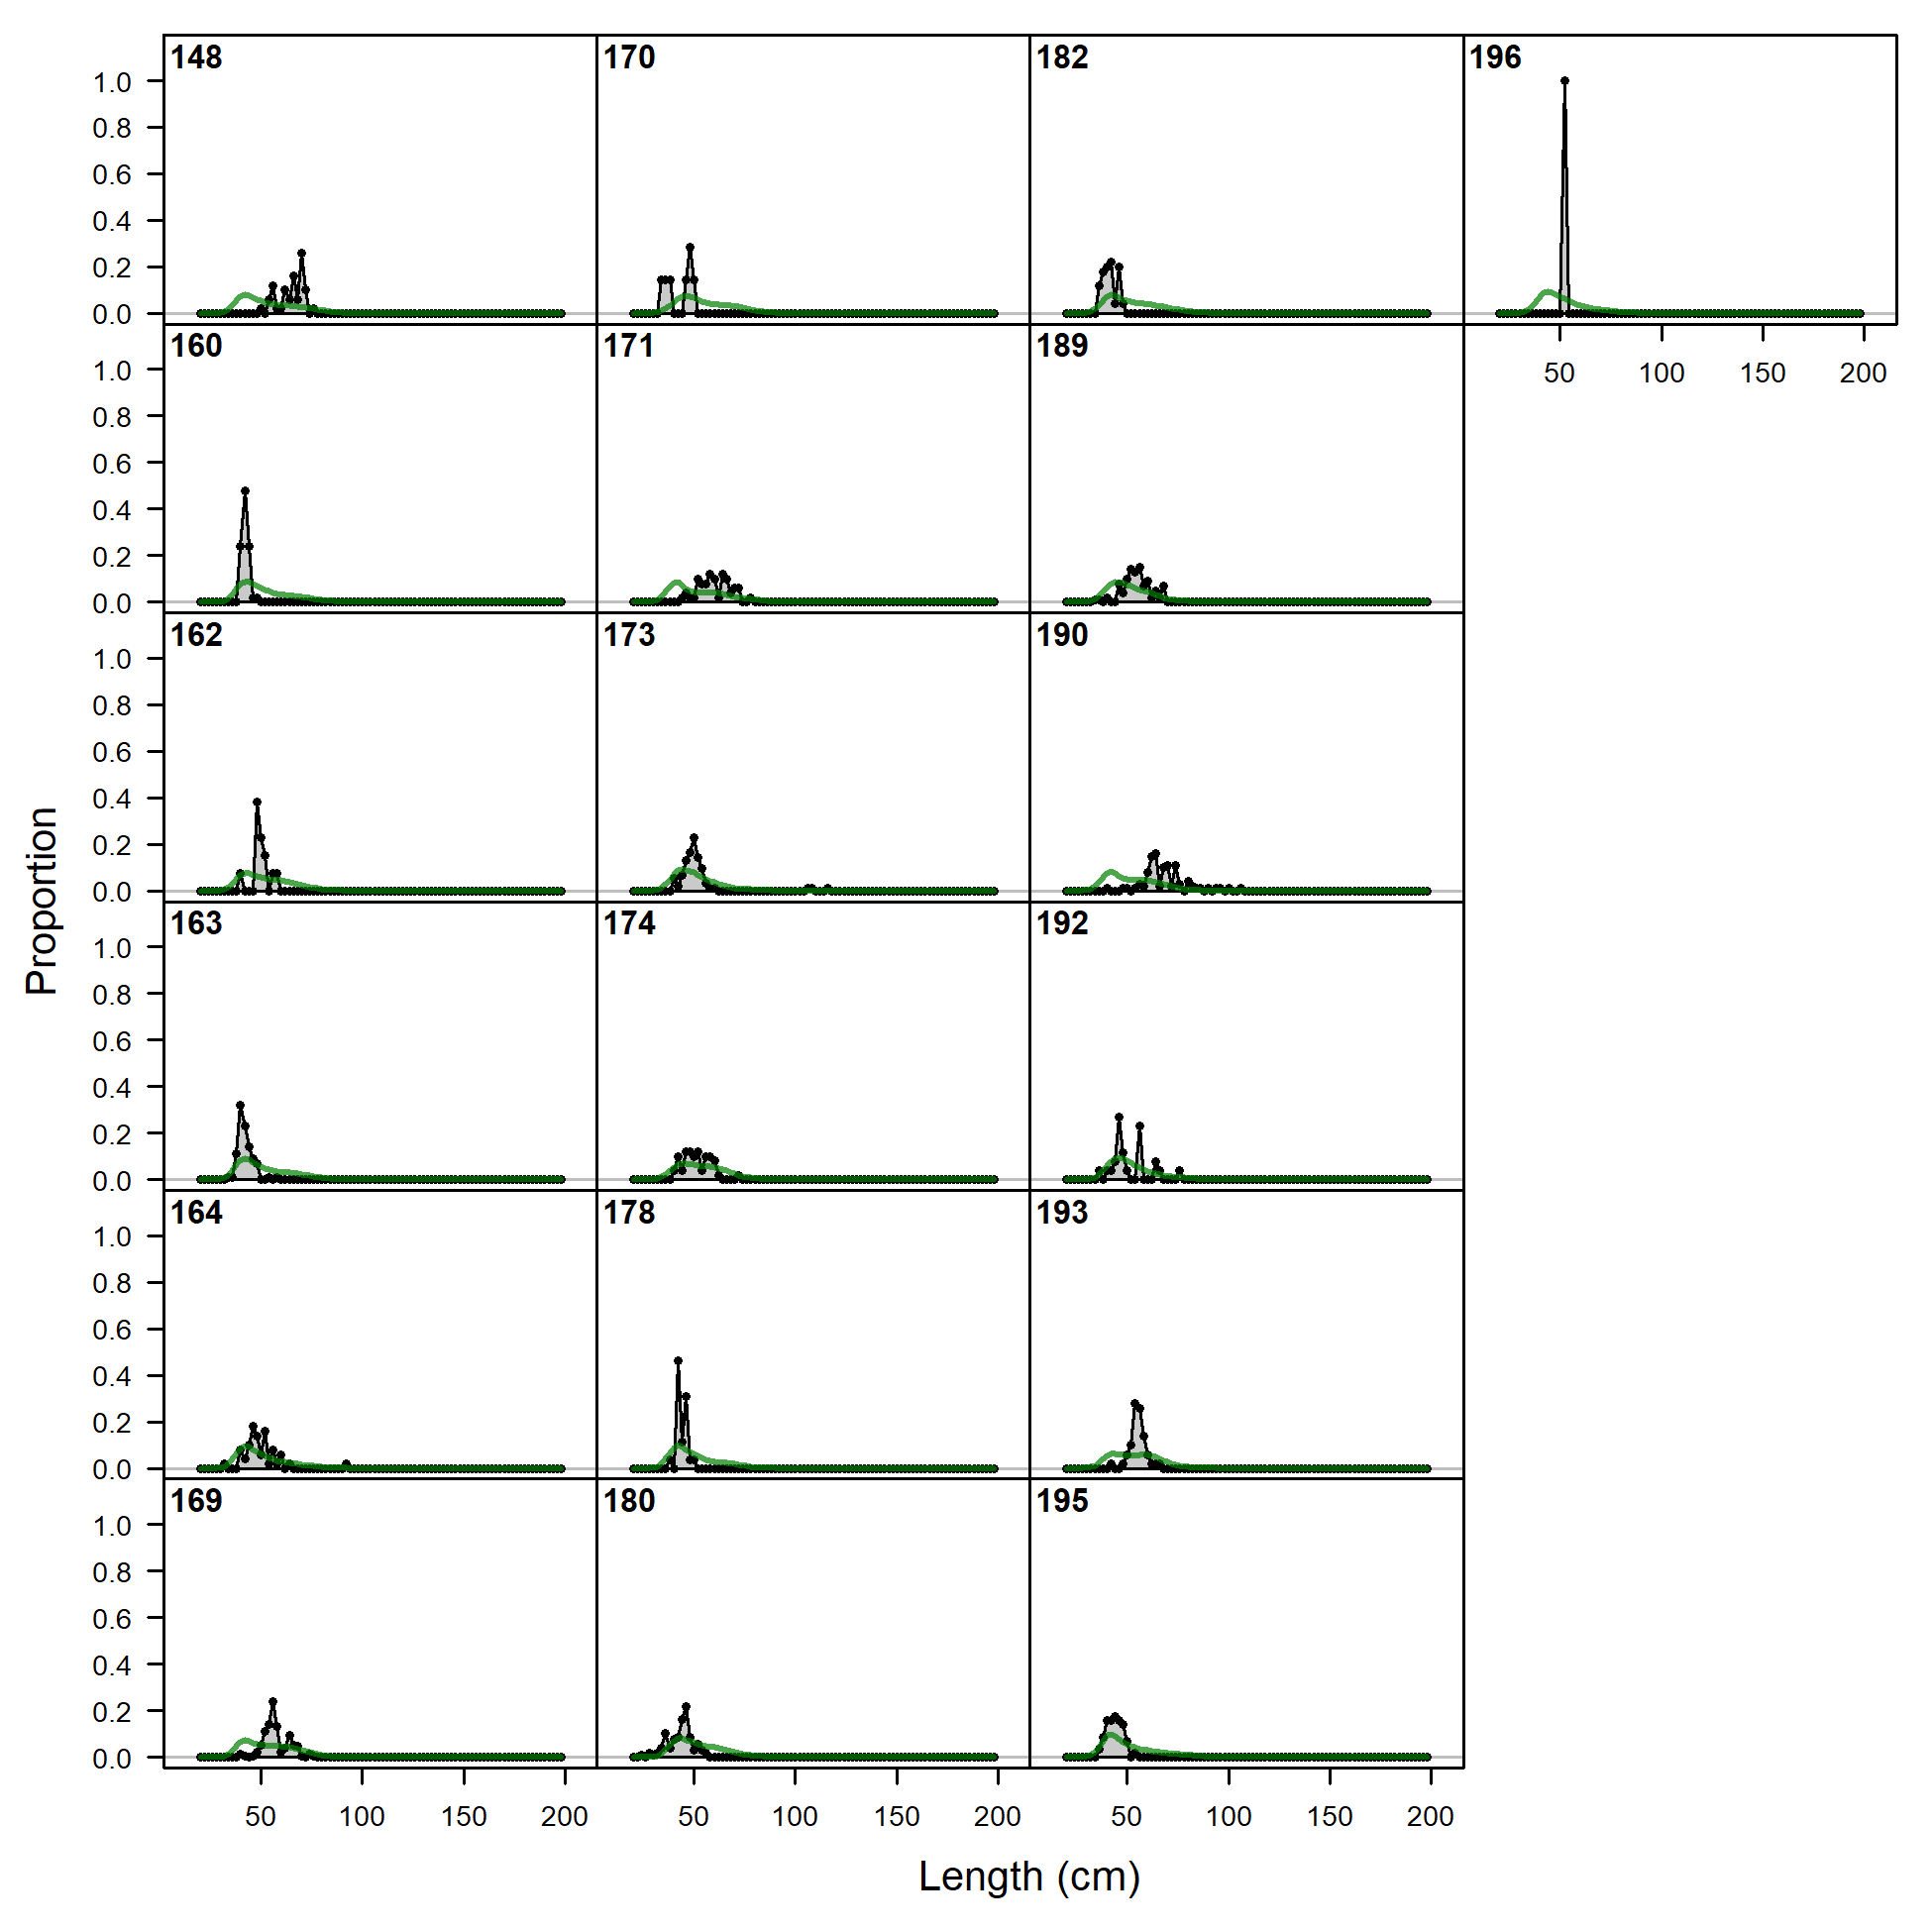
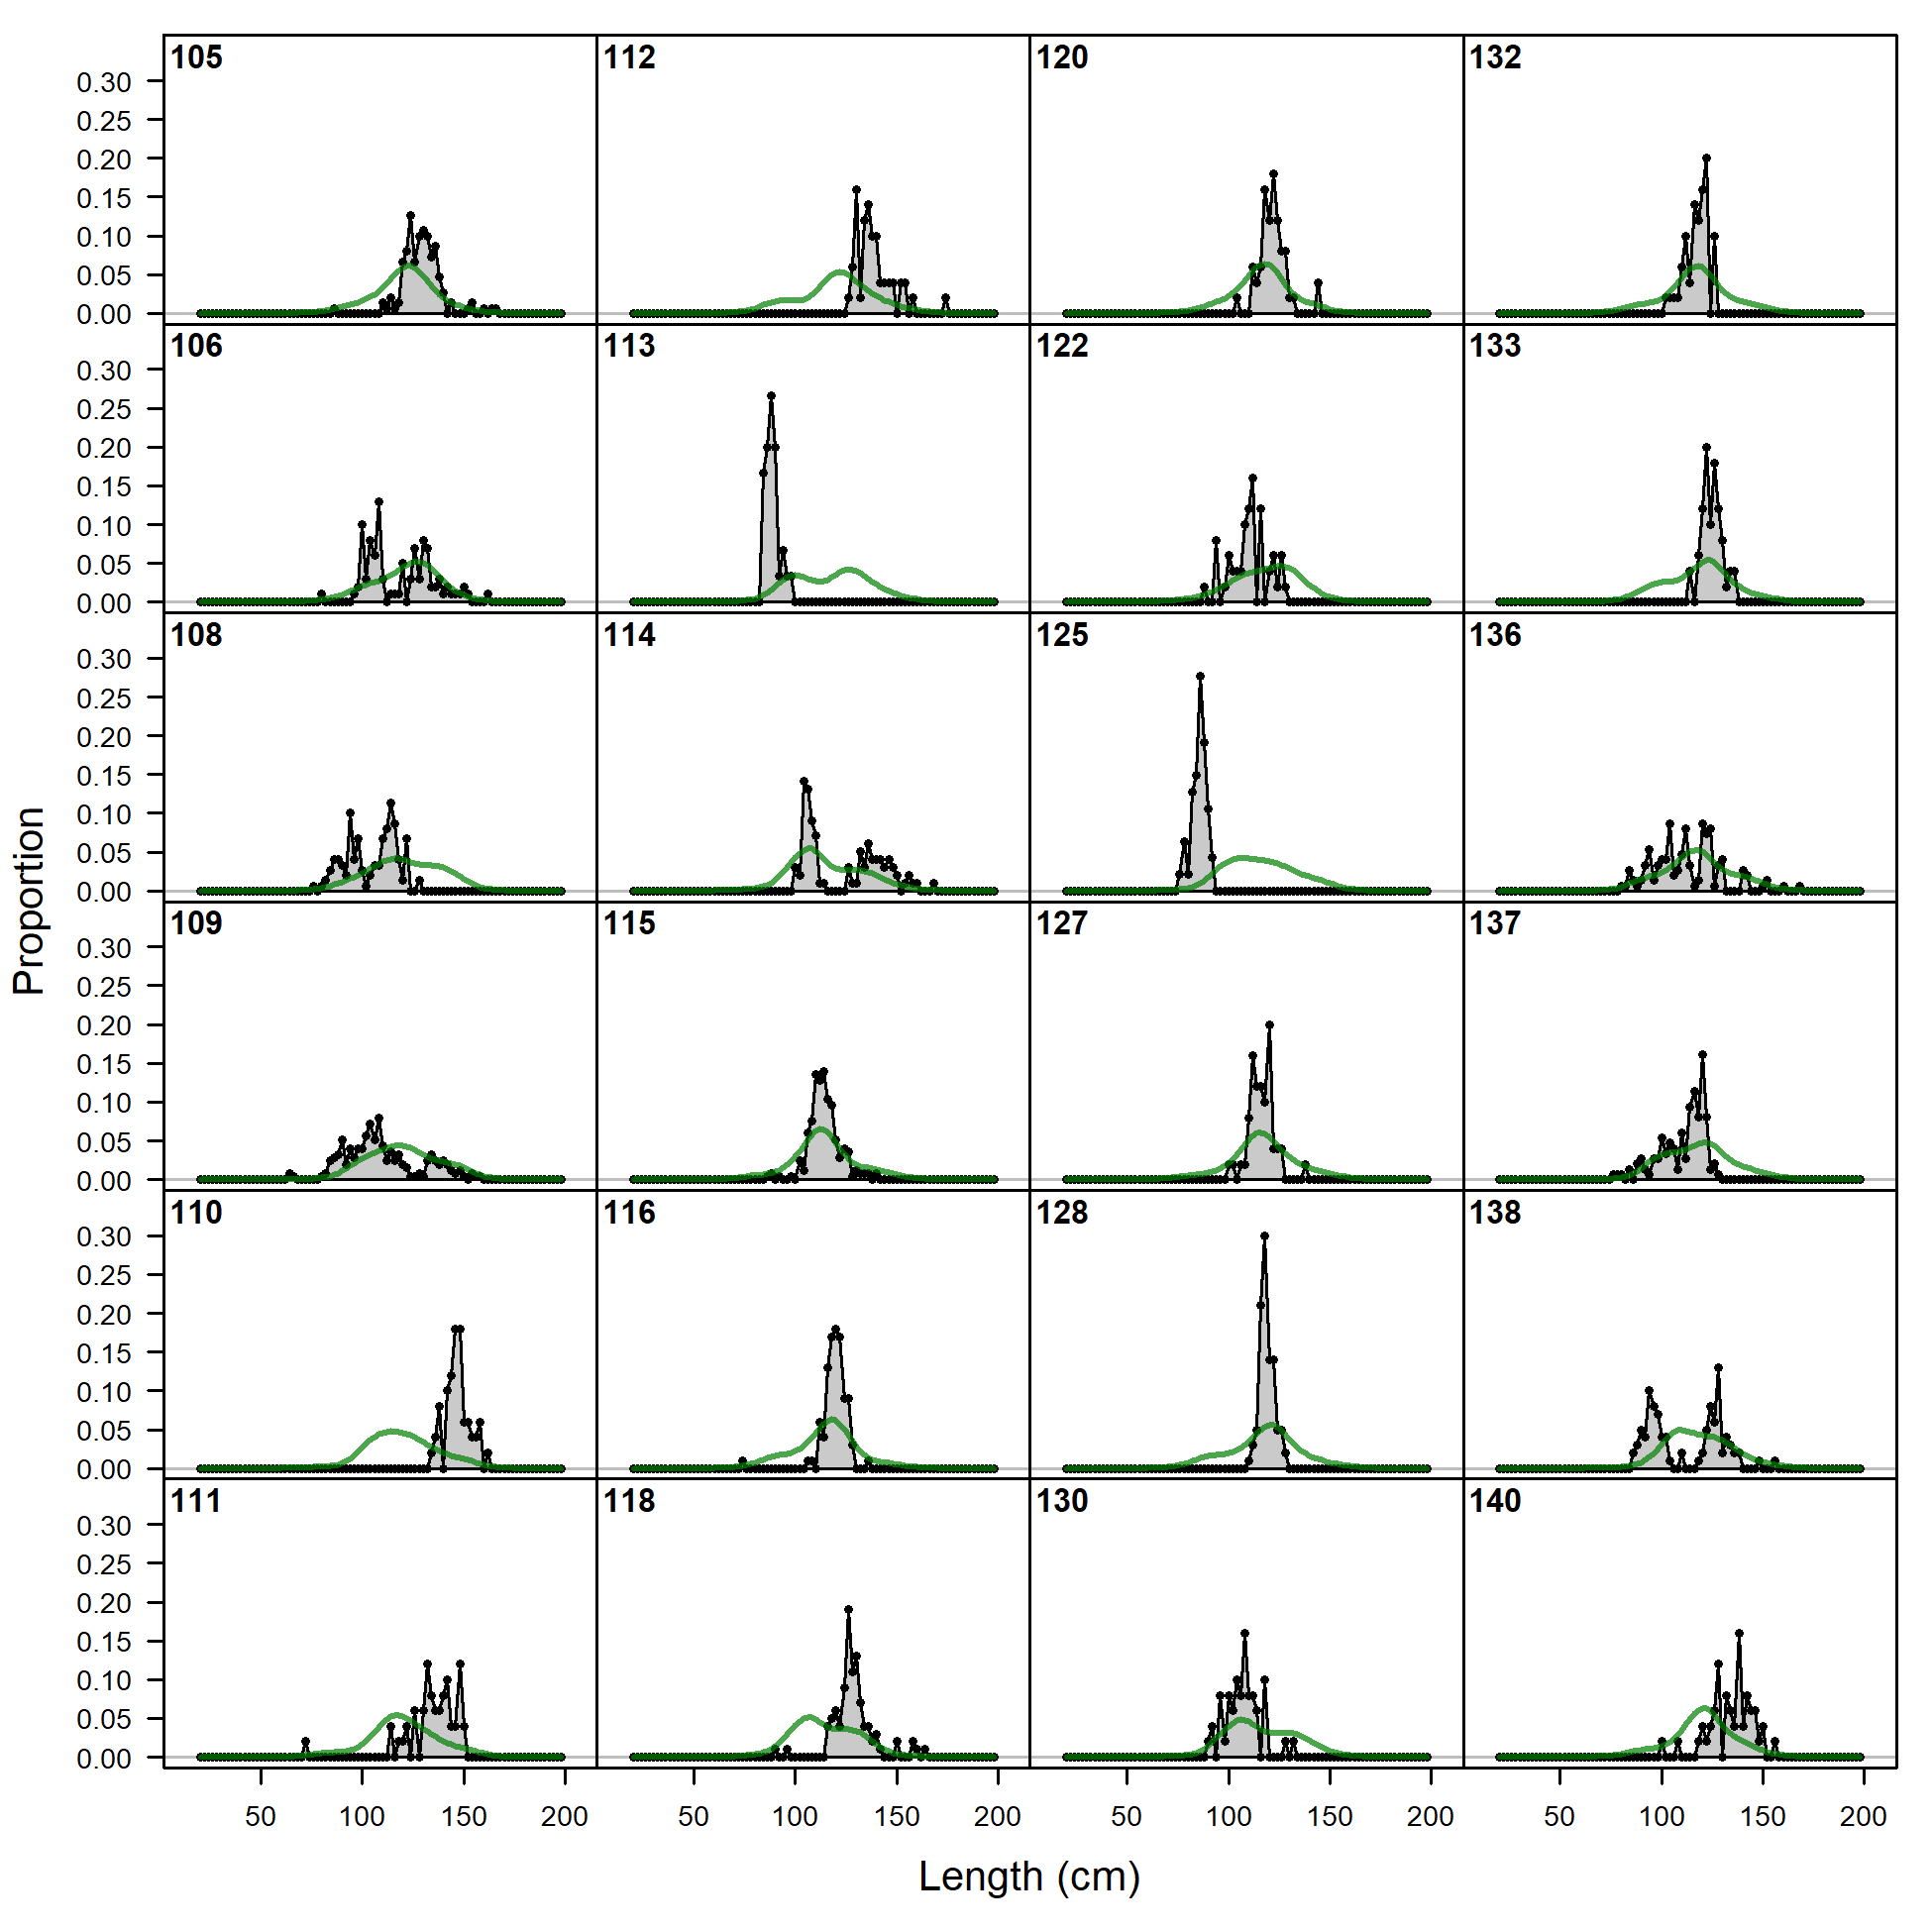
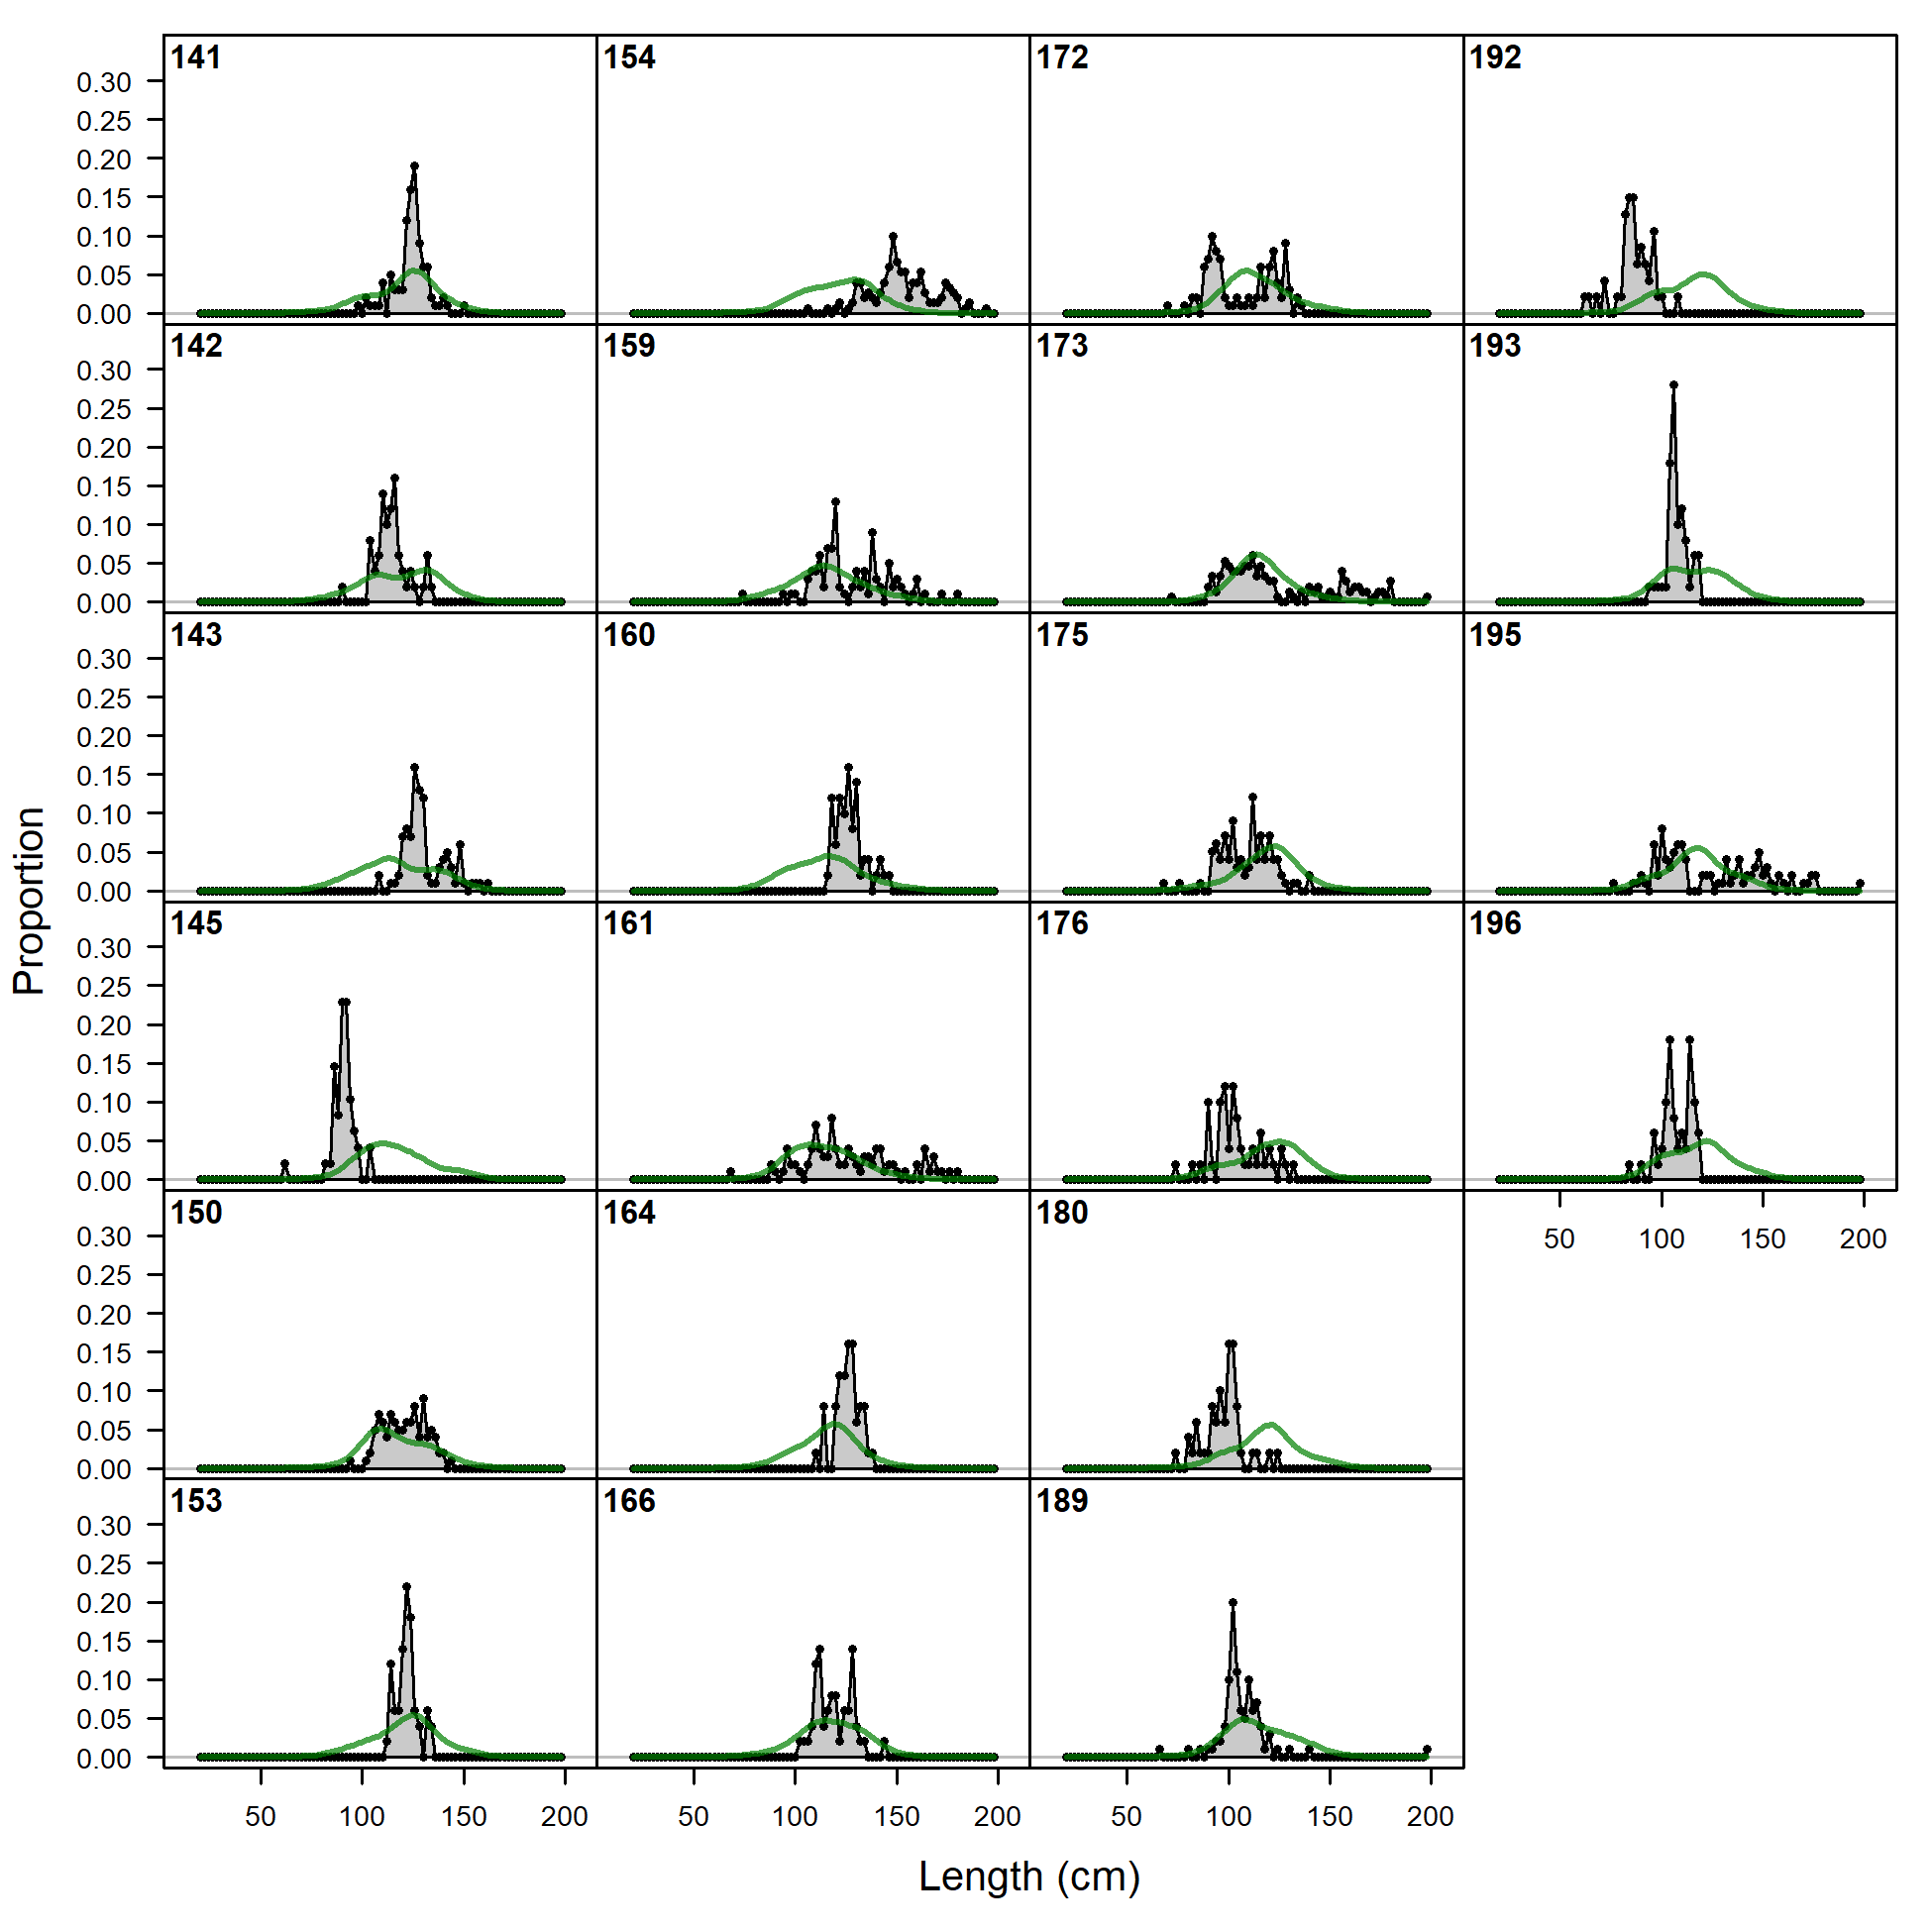
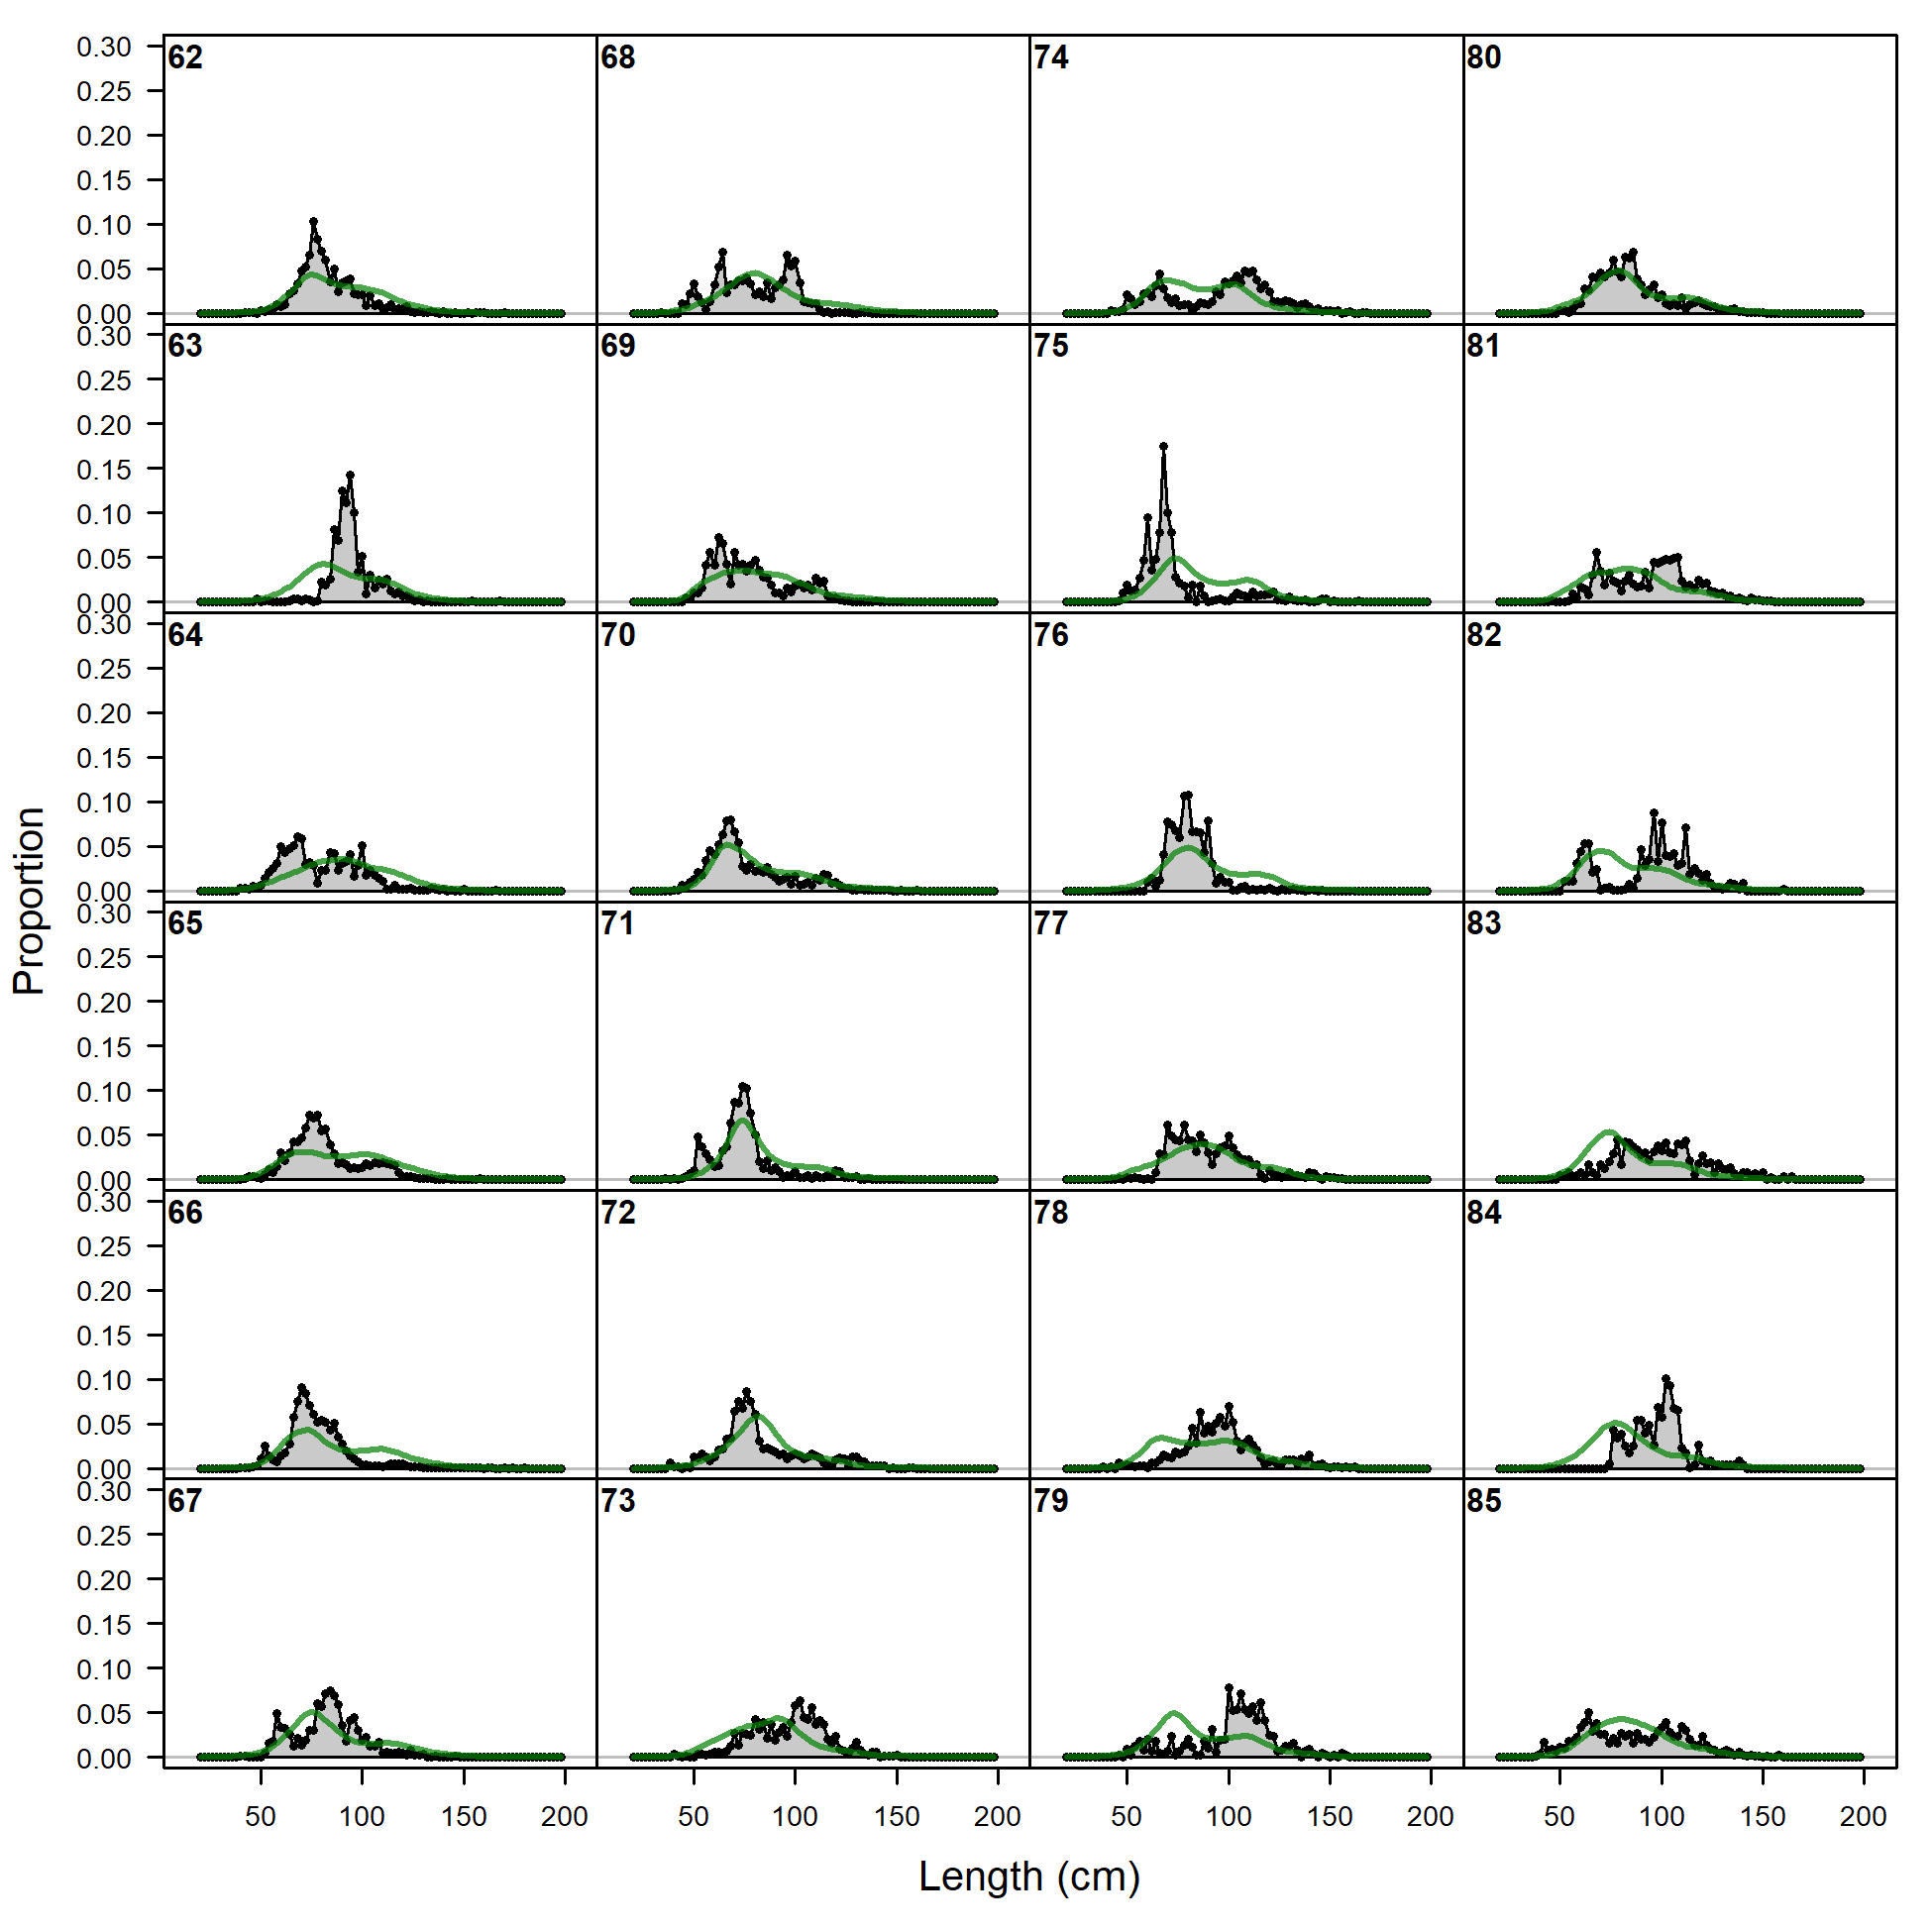
Length comps, retained, F3_PS_OBJ_Offshore (plot 1 of 5).
'N adj.' is the input sample size after data-weighting adjustment. N eff. is the calculated effective sample size used in the McAllister-Ianelli tuning method. (plot 2 of 5) (plot 3 of 5) (plot 4 of 5) (plot 5 of 5)
file: comp_lenfit_flt3mkt2_page5.png
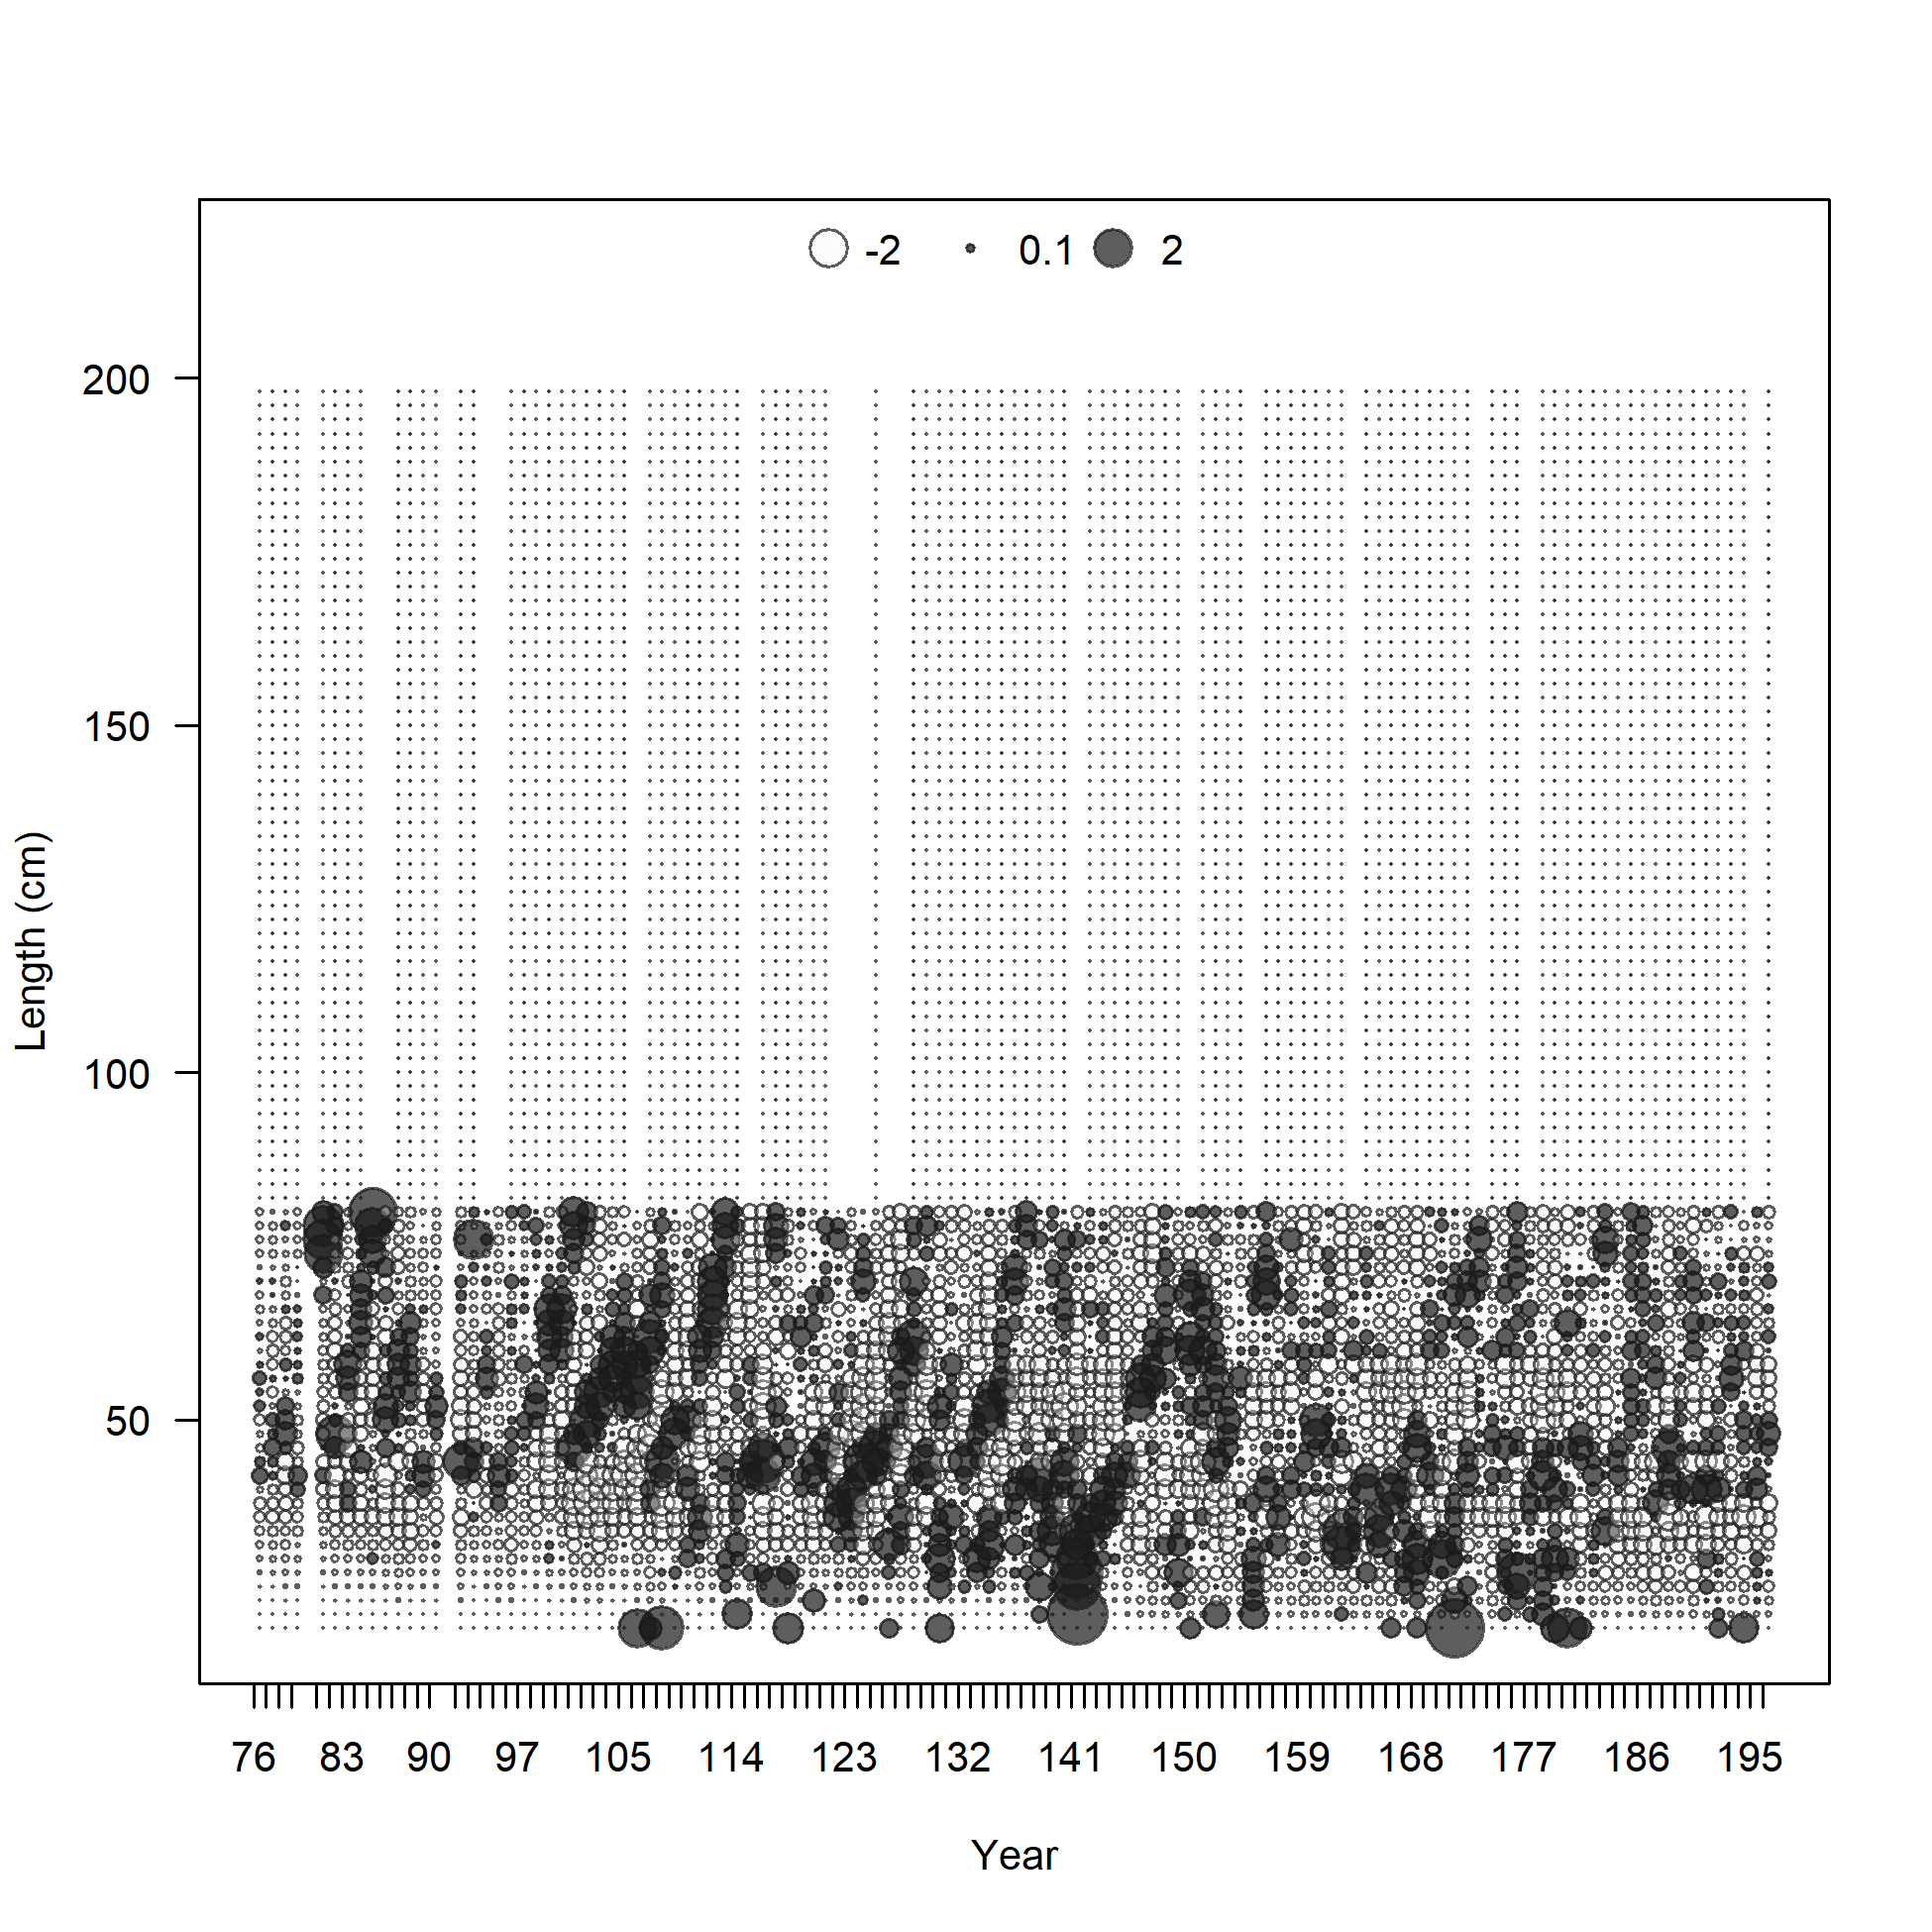
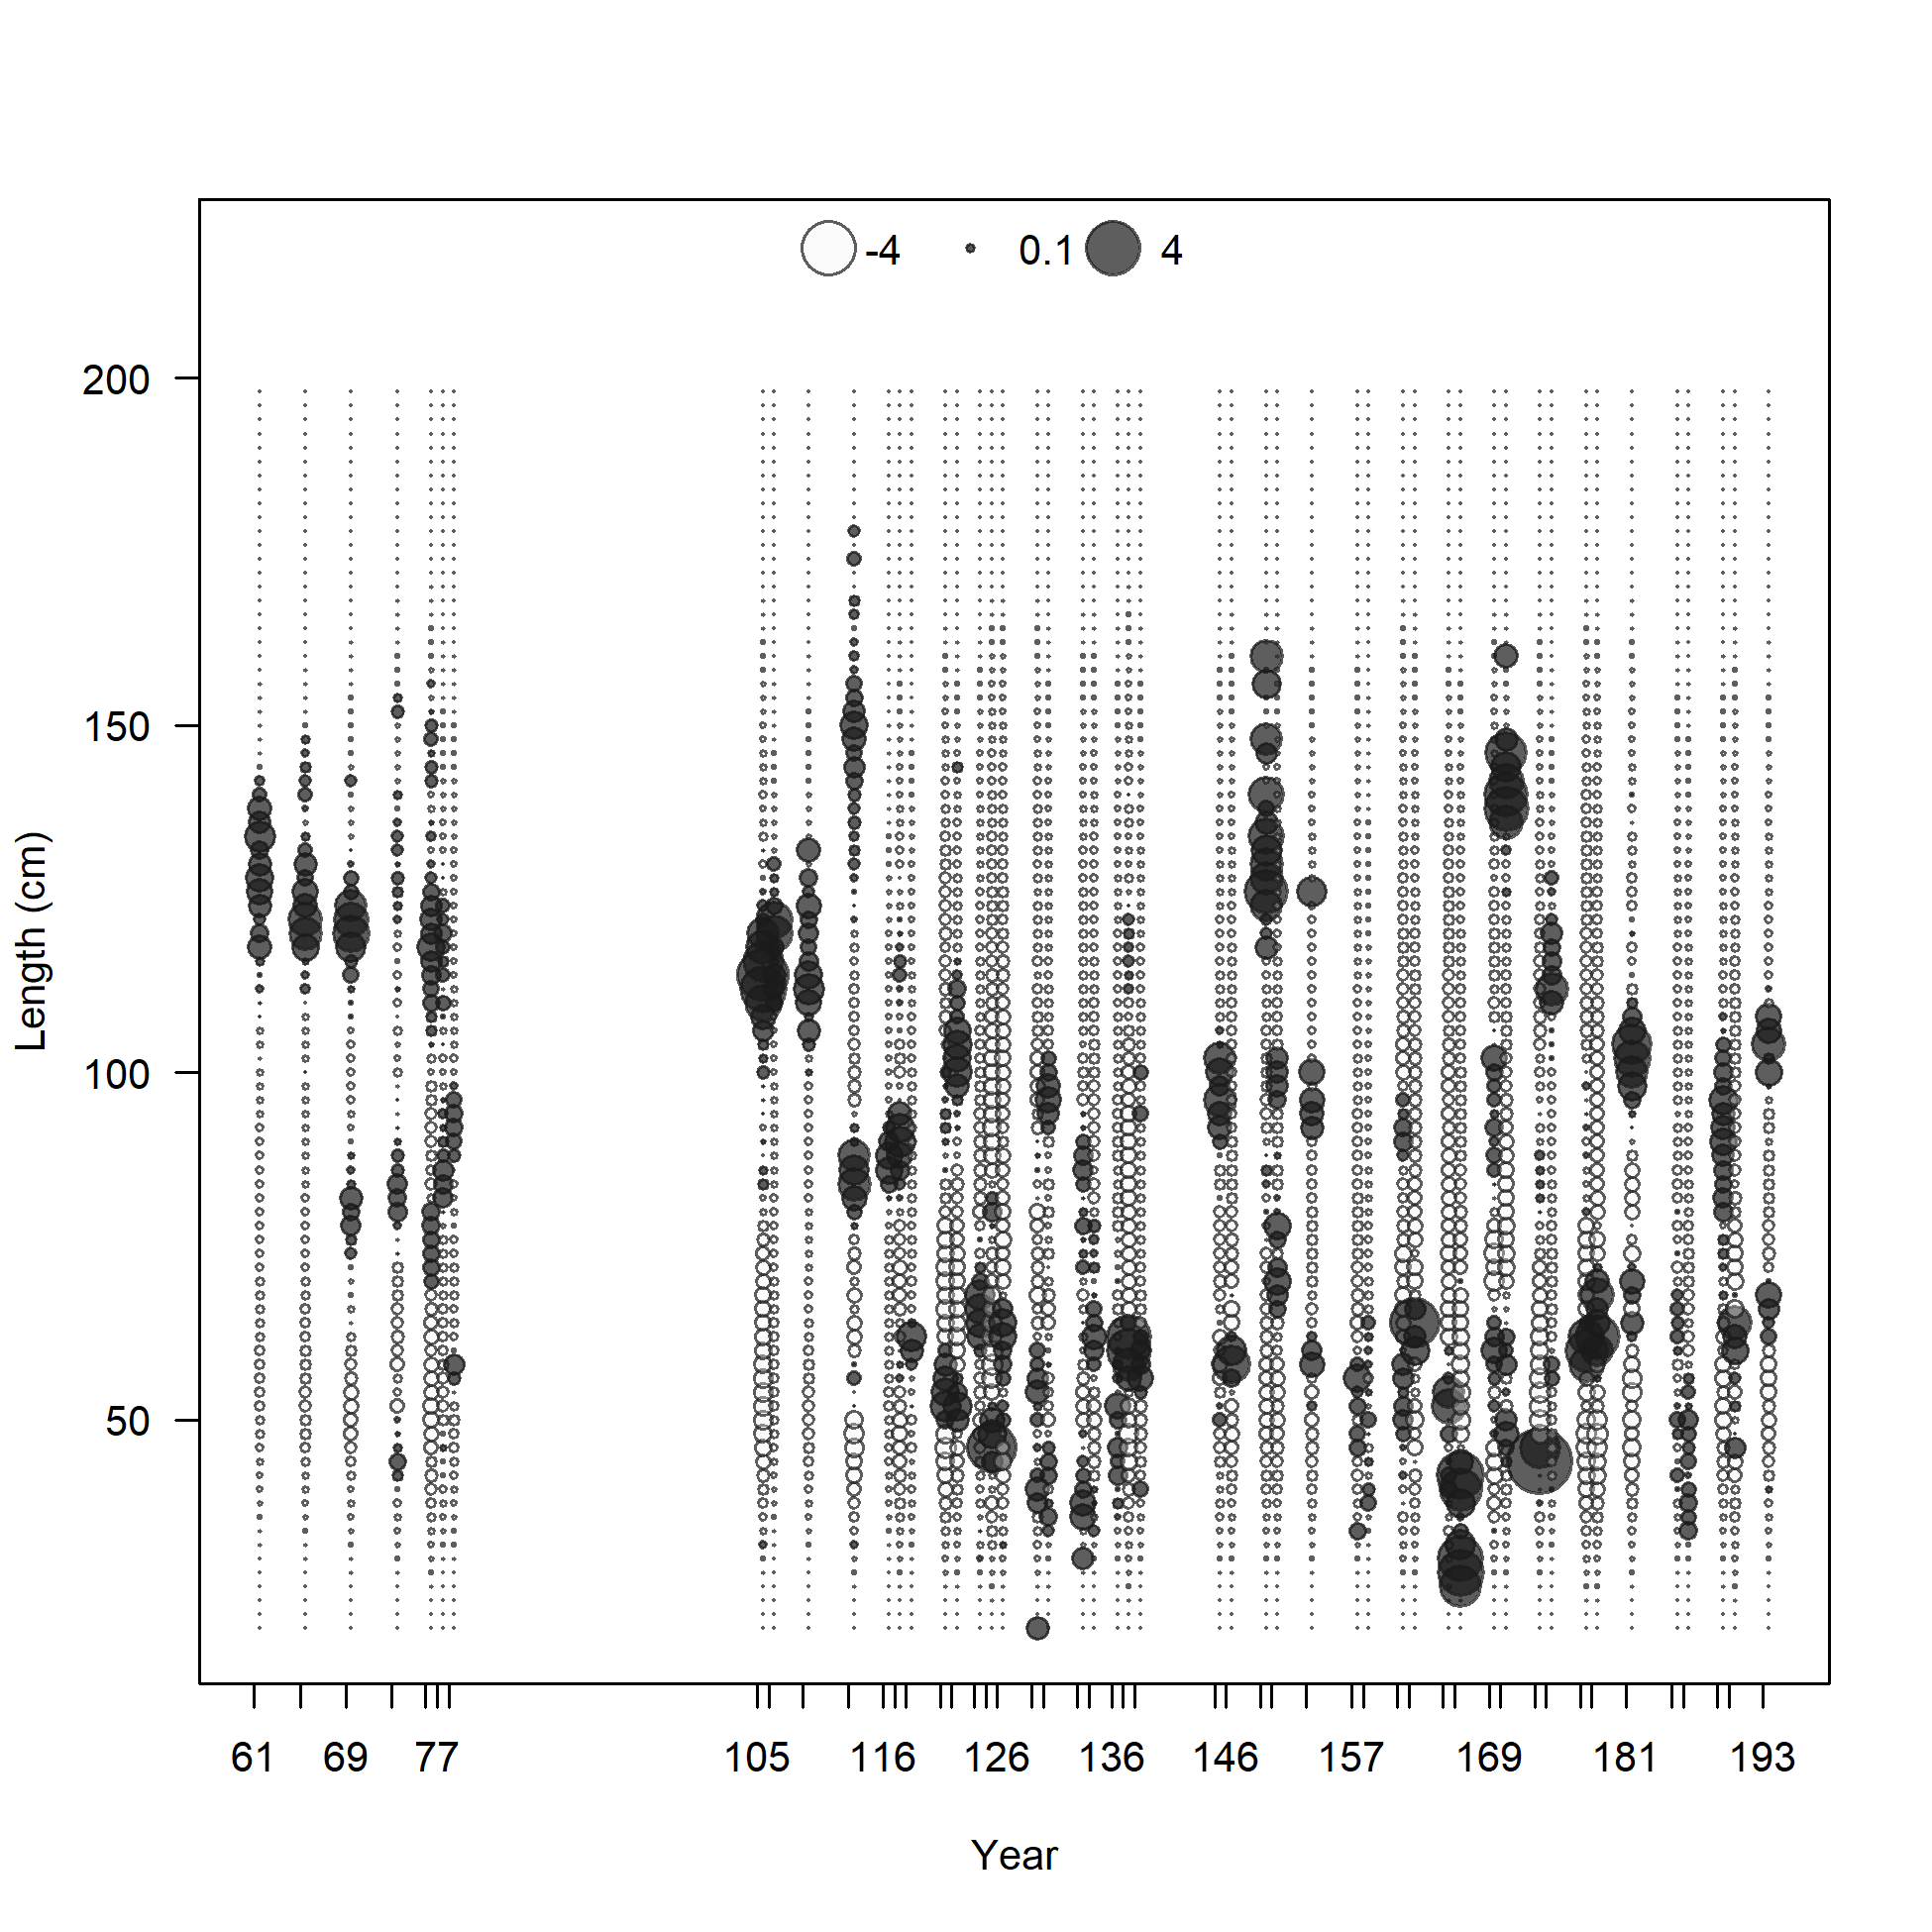
Pearson residuals, retained, F3_PS_OBJ_Offshore (max=4.79) (plot 5 of 5)
Closed bubbles are positive residuals (observed > expected) and open bubbles are negative residuals (observed < expected).
file: comp_lenfit_residsflt3mkt2_page5.png
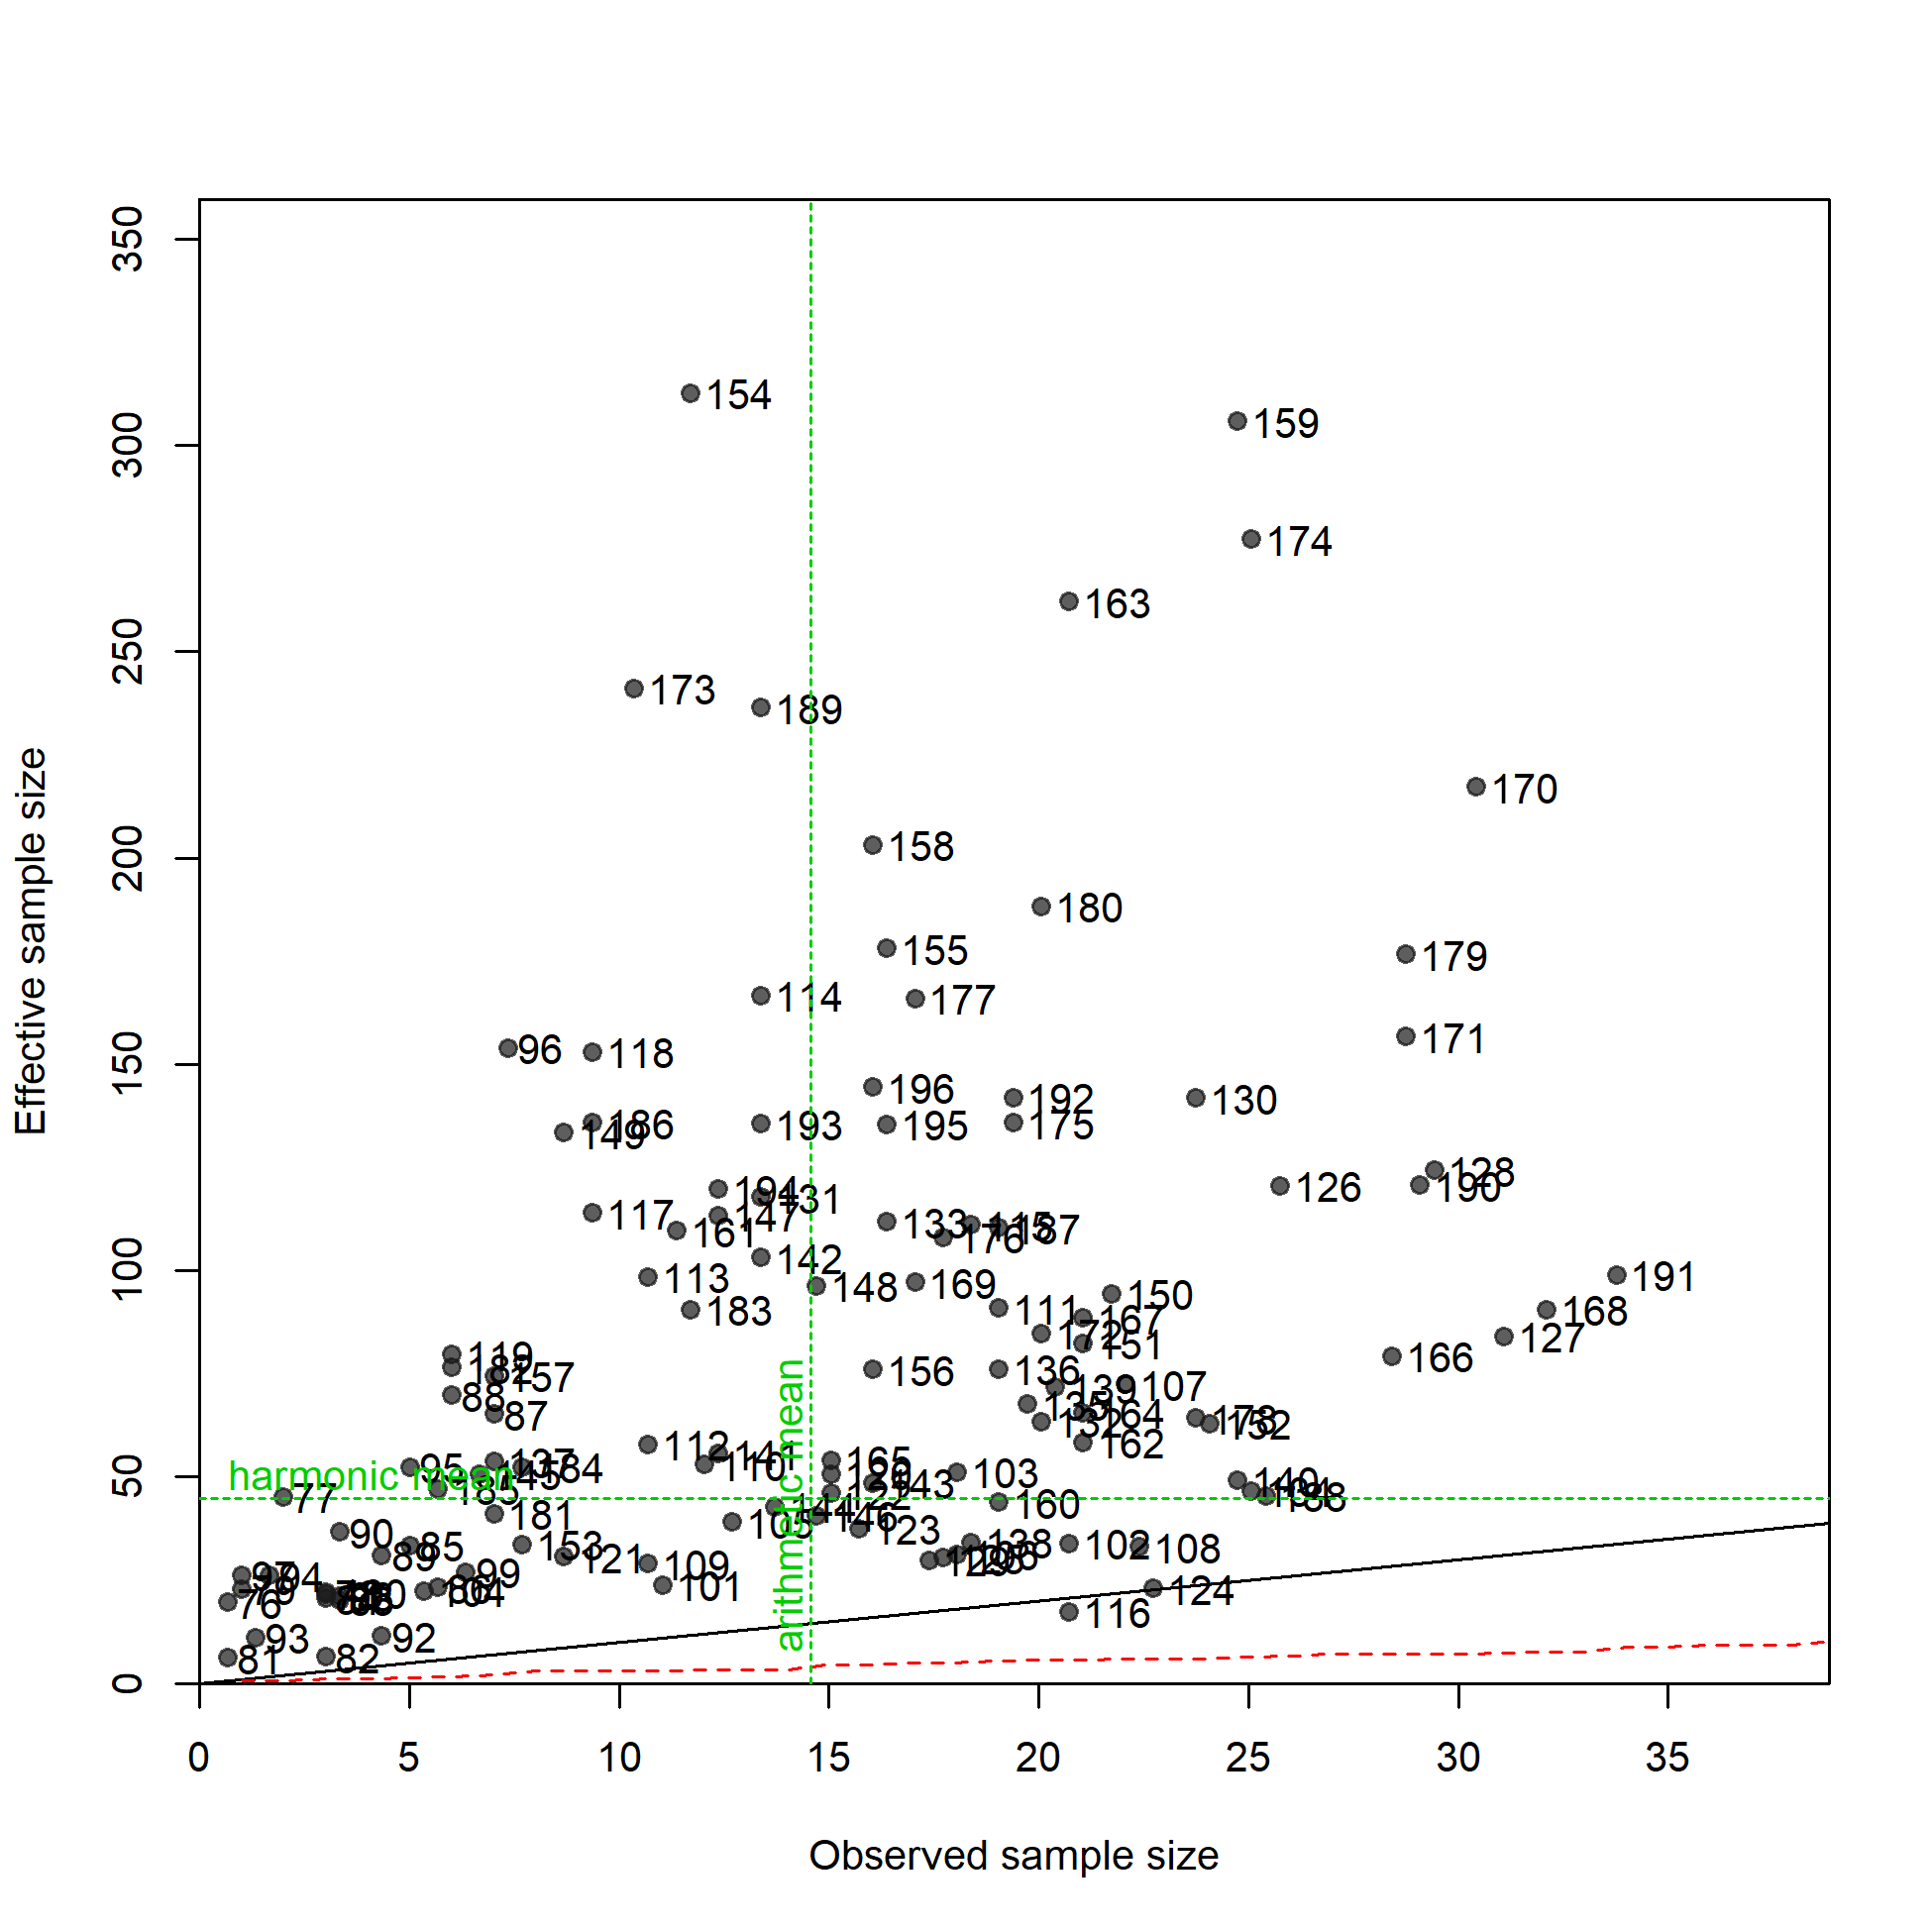
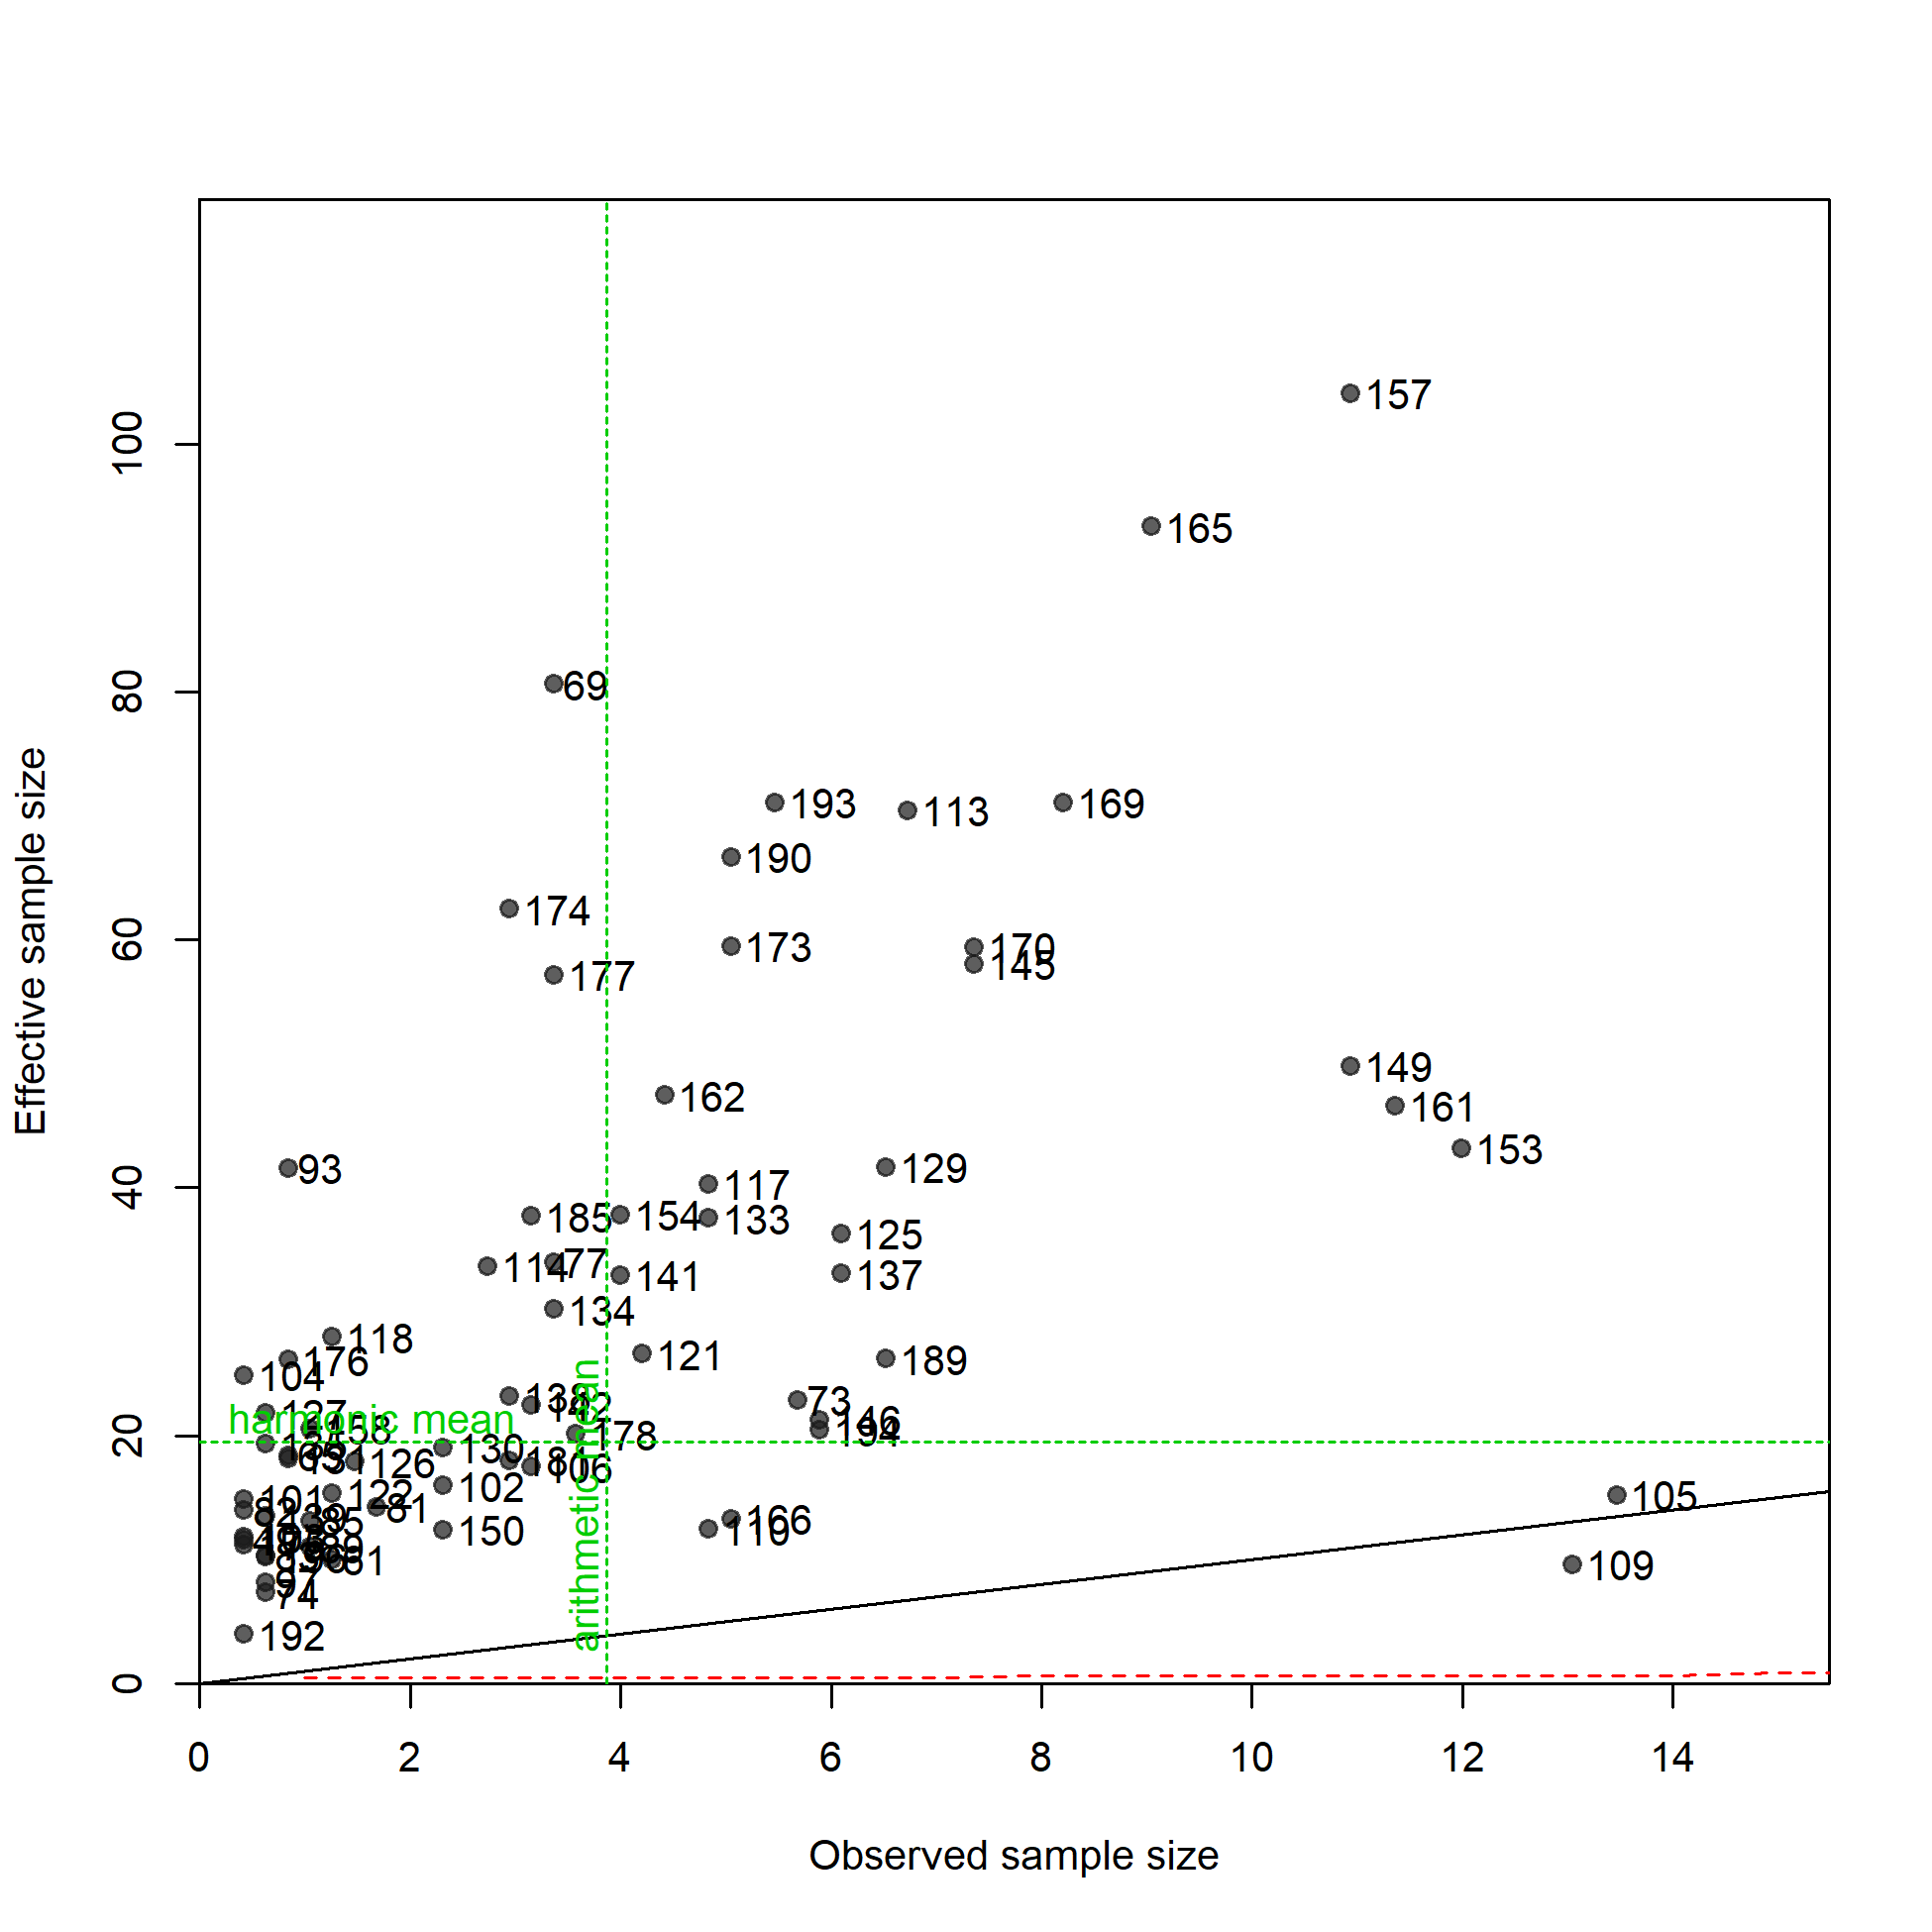
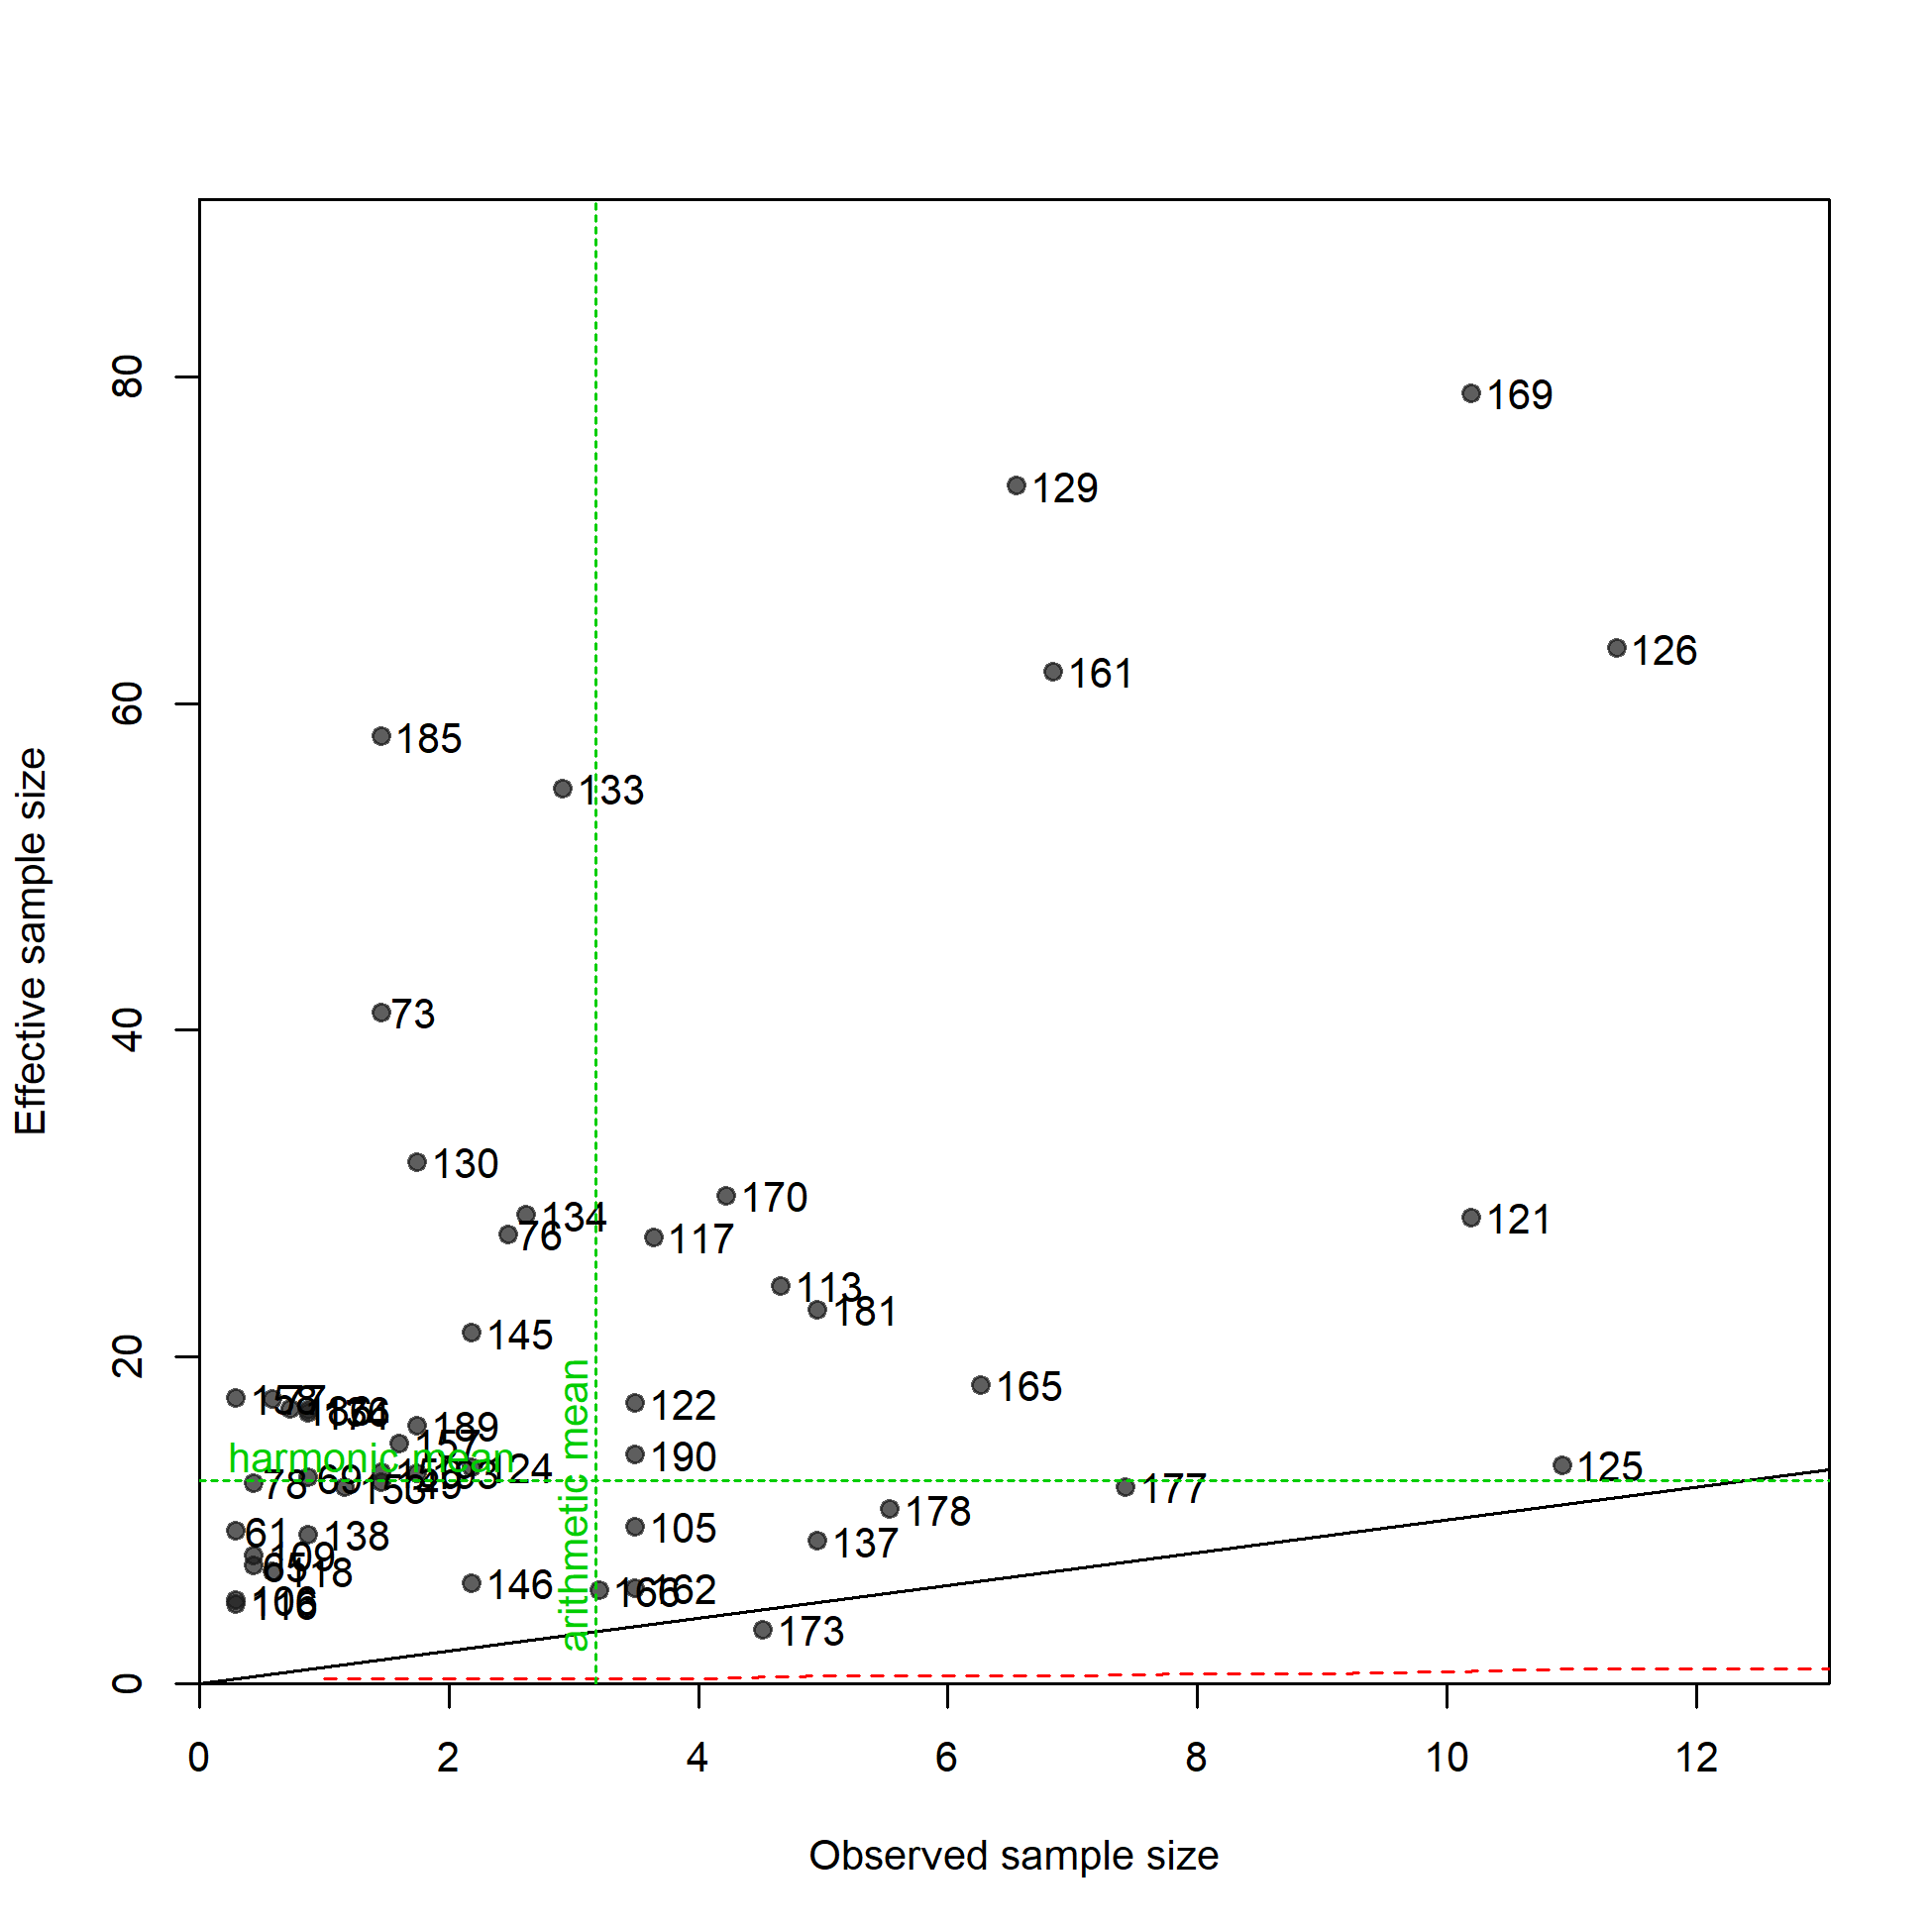
N-EffN comparison, Length comps, retained, F3_PS_OBJ_Offshore
file: comp_lenfit_sampsize_flt3mkt2.png
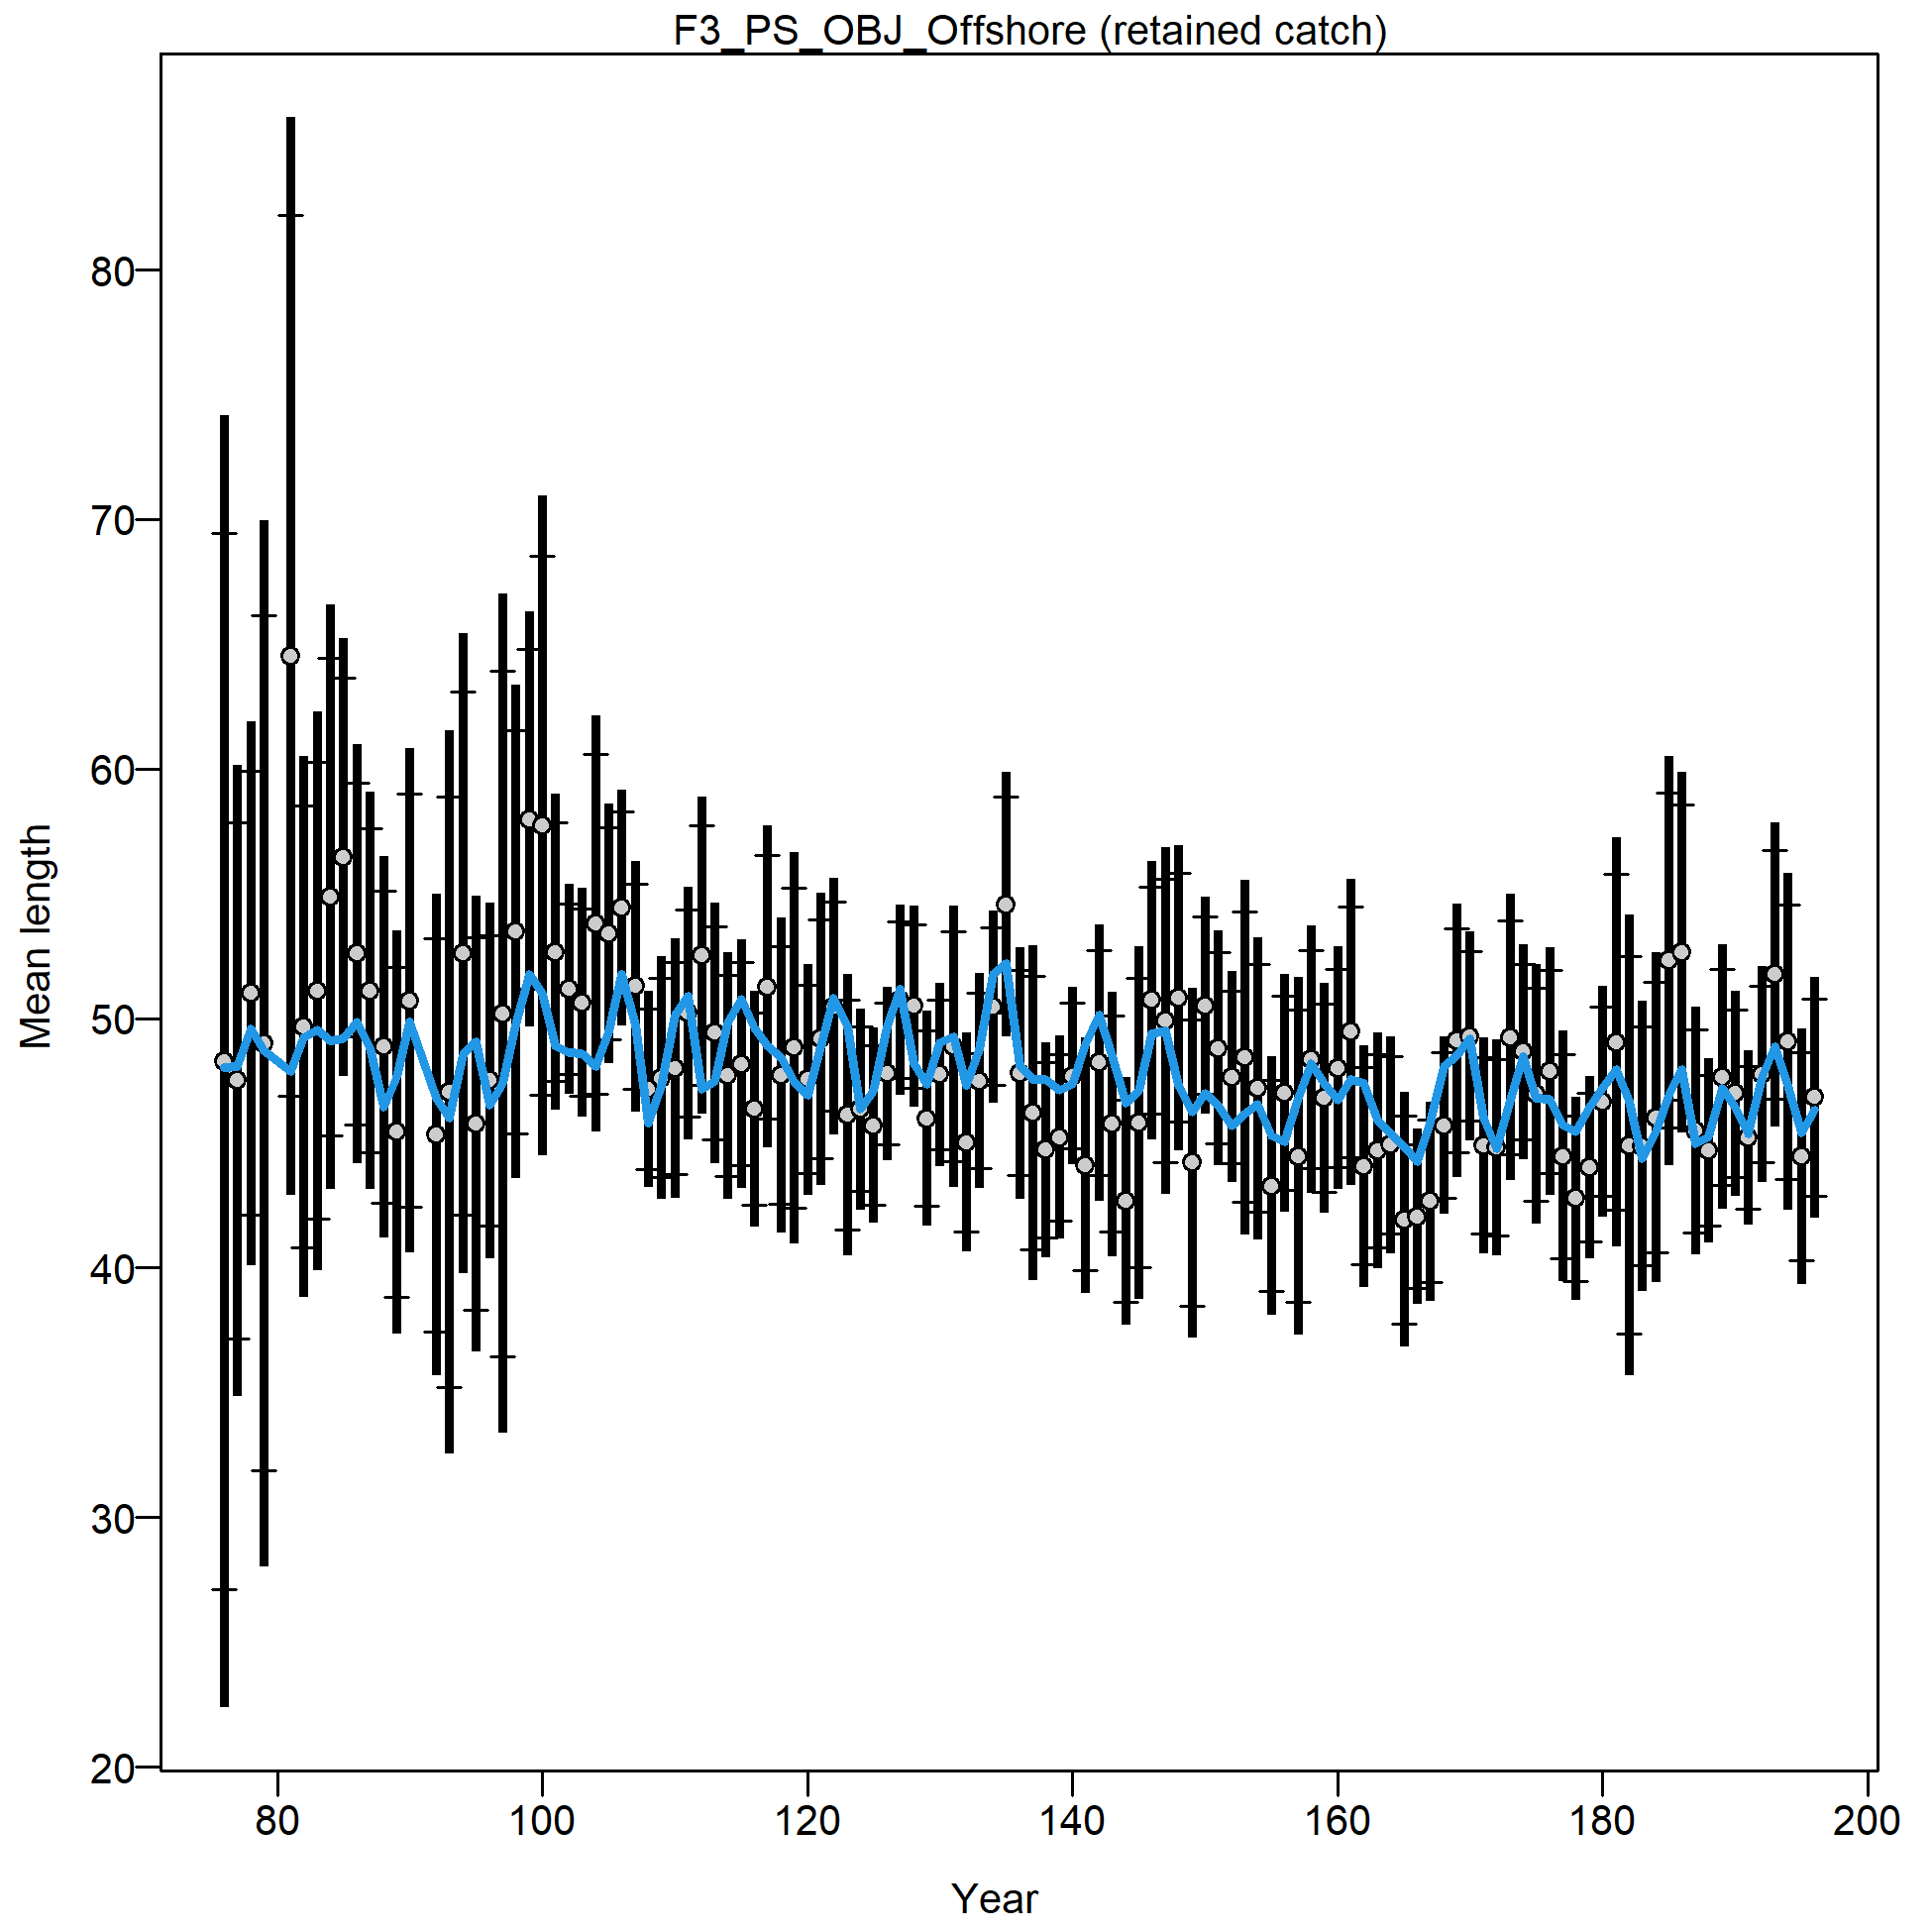
Mean length for F3_PS_OBJ_Offshore with 95% confidence intervals based on current sample sizes.
Francis data weighting method TA1.8: thinner intervals (with capped ends) show result of further adjusting sample sizes based on suggested multiplier (with 95% interval) for len data from F3_PS_OBJ_Offshore:
1.4969 (1.2274-1.8895)
For more info, see Francis (2011).
file: comp_lenfit_data_weighting_TA1-8_F3_PS_OBJ_Offshore.png
Length comps, whole catch, F5_PS_OBJ_South_coastal (plot 1 of 3).
'N adj.' is the input sample size after data-weighting adjustment. N eff. is the calculated effective sample size used in the McAllister-Ianelli tuning method.
file: comp_lenfit_flt5mkt0_page1.png

Length comps, whole catch, F5_PS_OBJ_South_coastal (plot 1 of 3).
'N adj.' is the input sample size after data-weighting adjustment. N eff. is the calculated effective sample size used in the McAllister-Ianelli tuning method. (plot 2 of 3)
file: comp_lenfit_flt5mkt0_page2.png
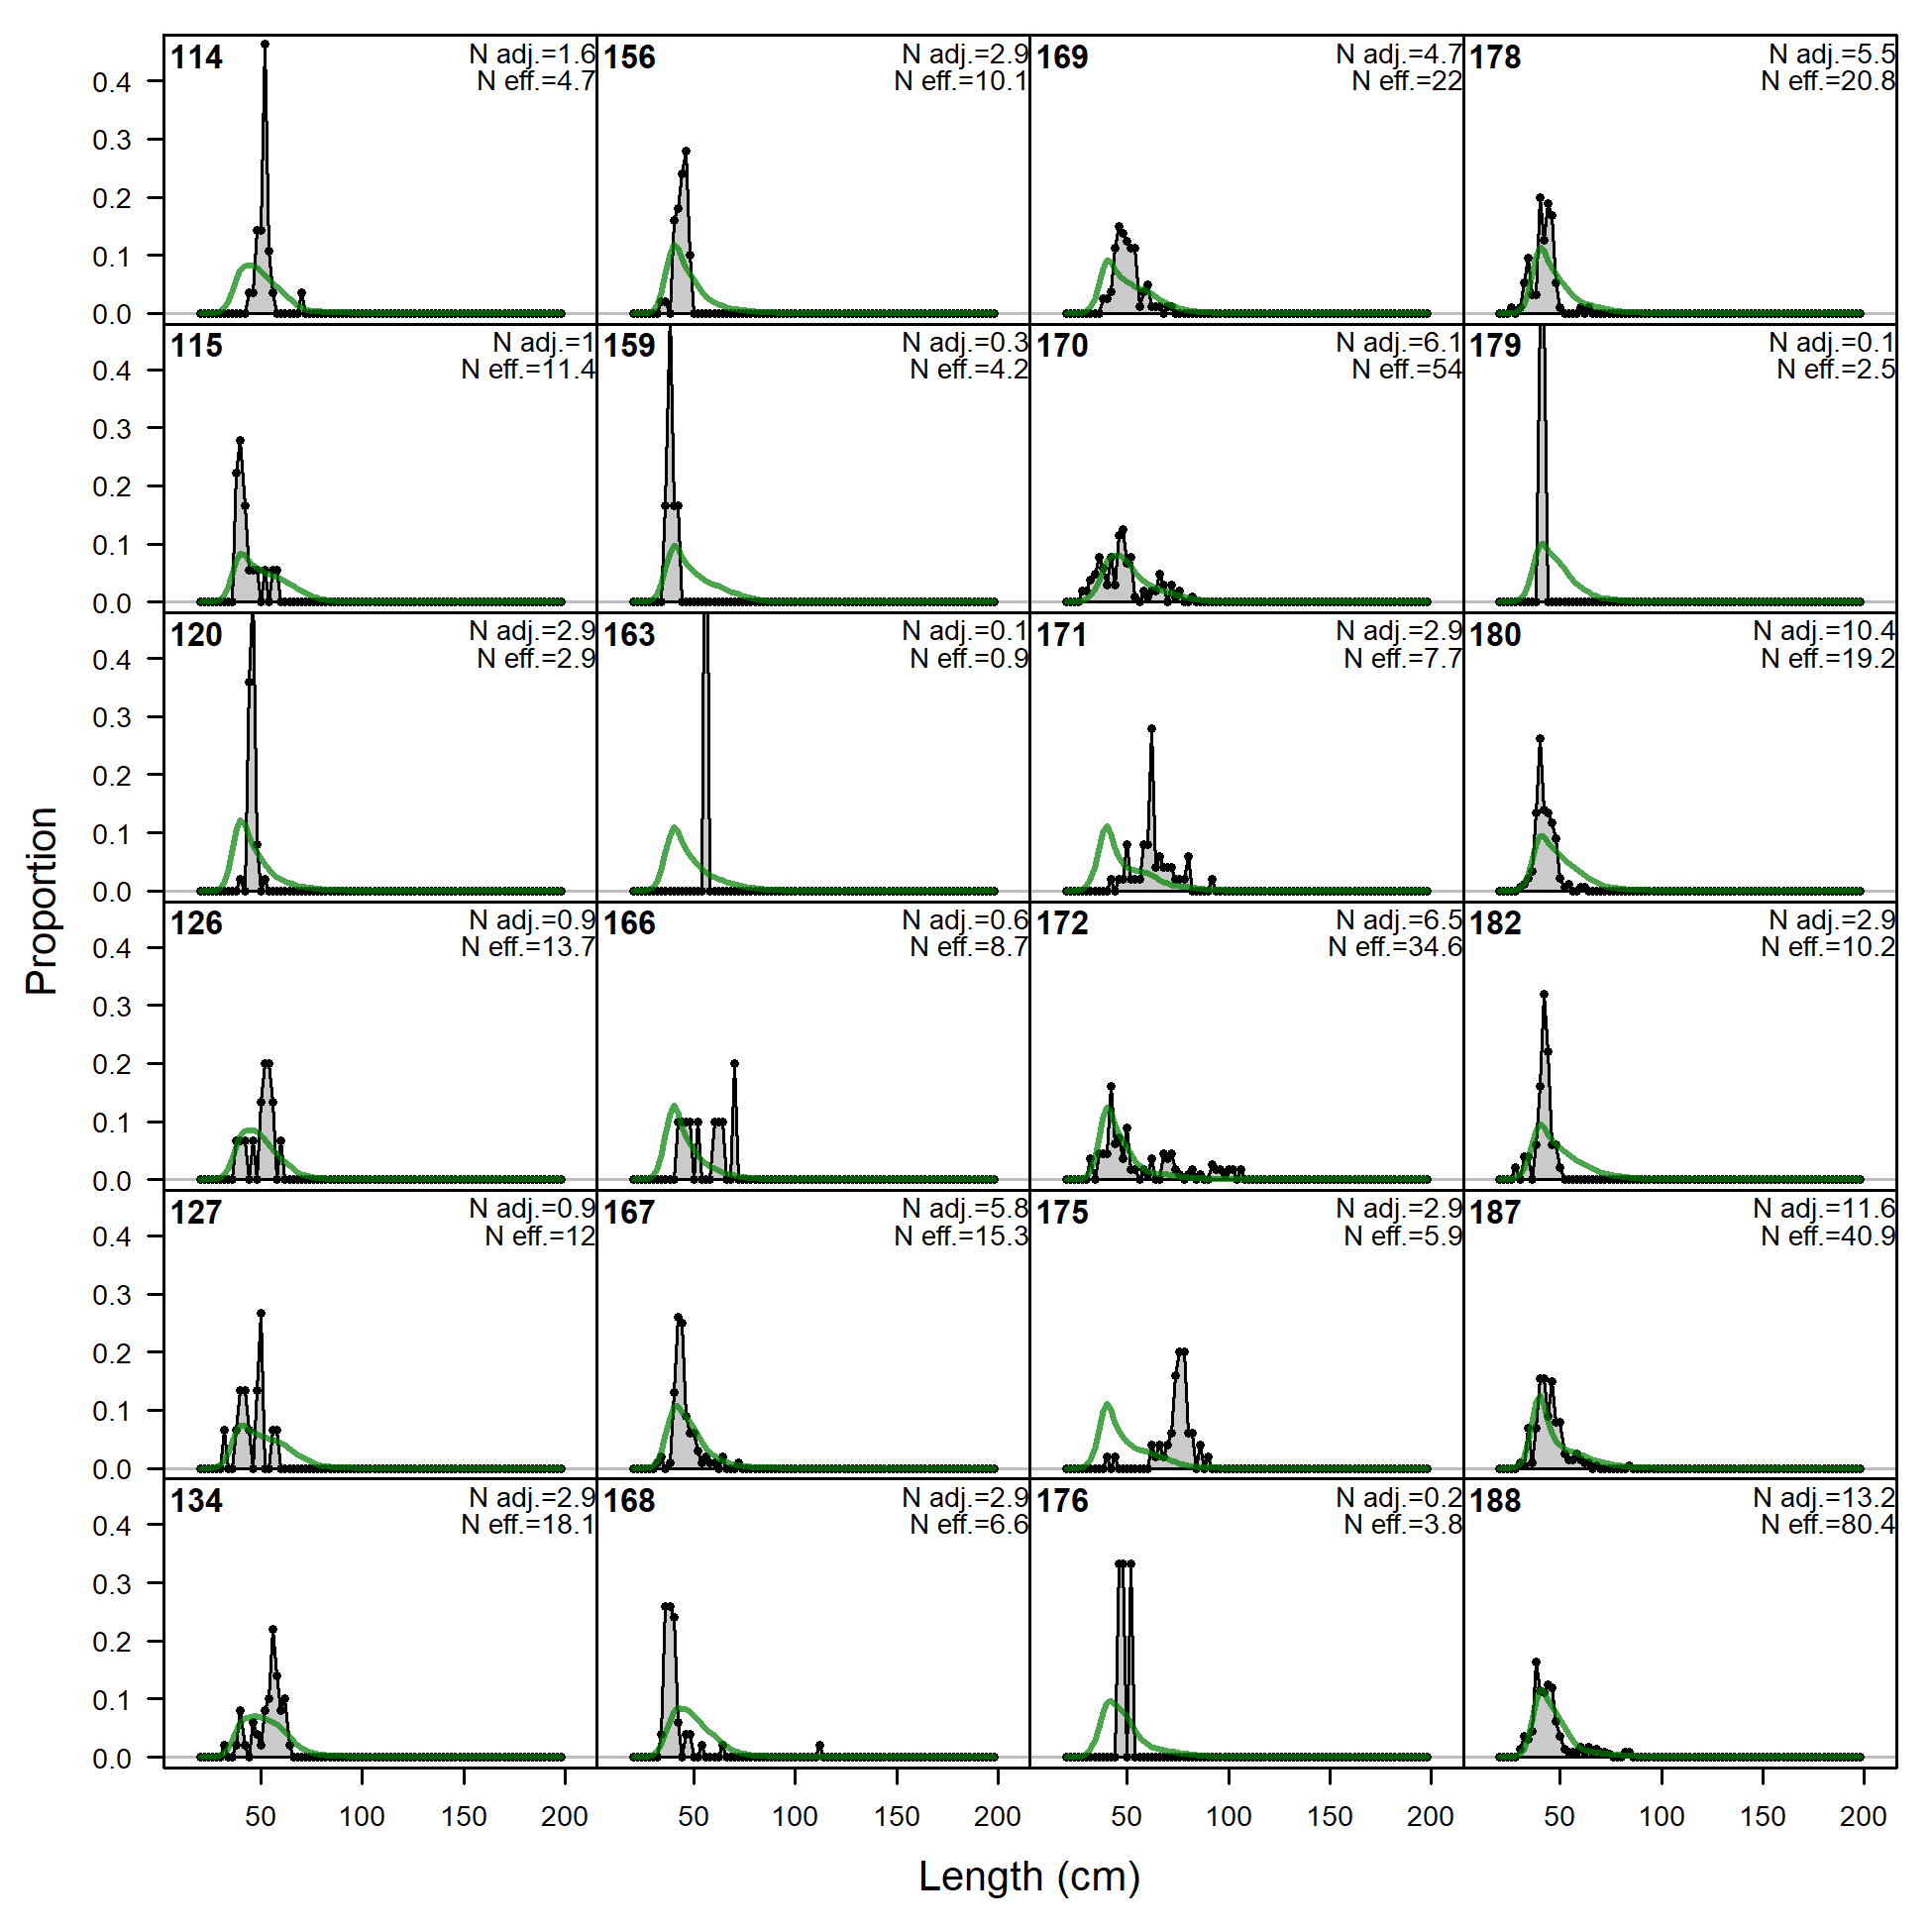
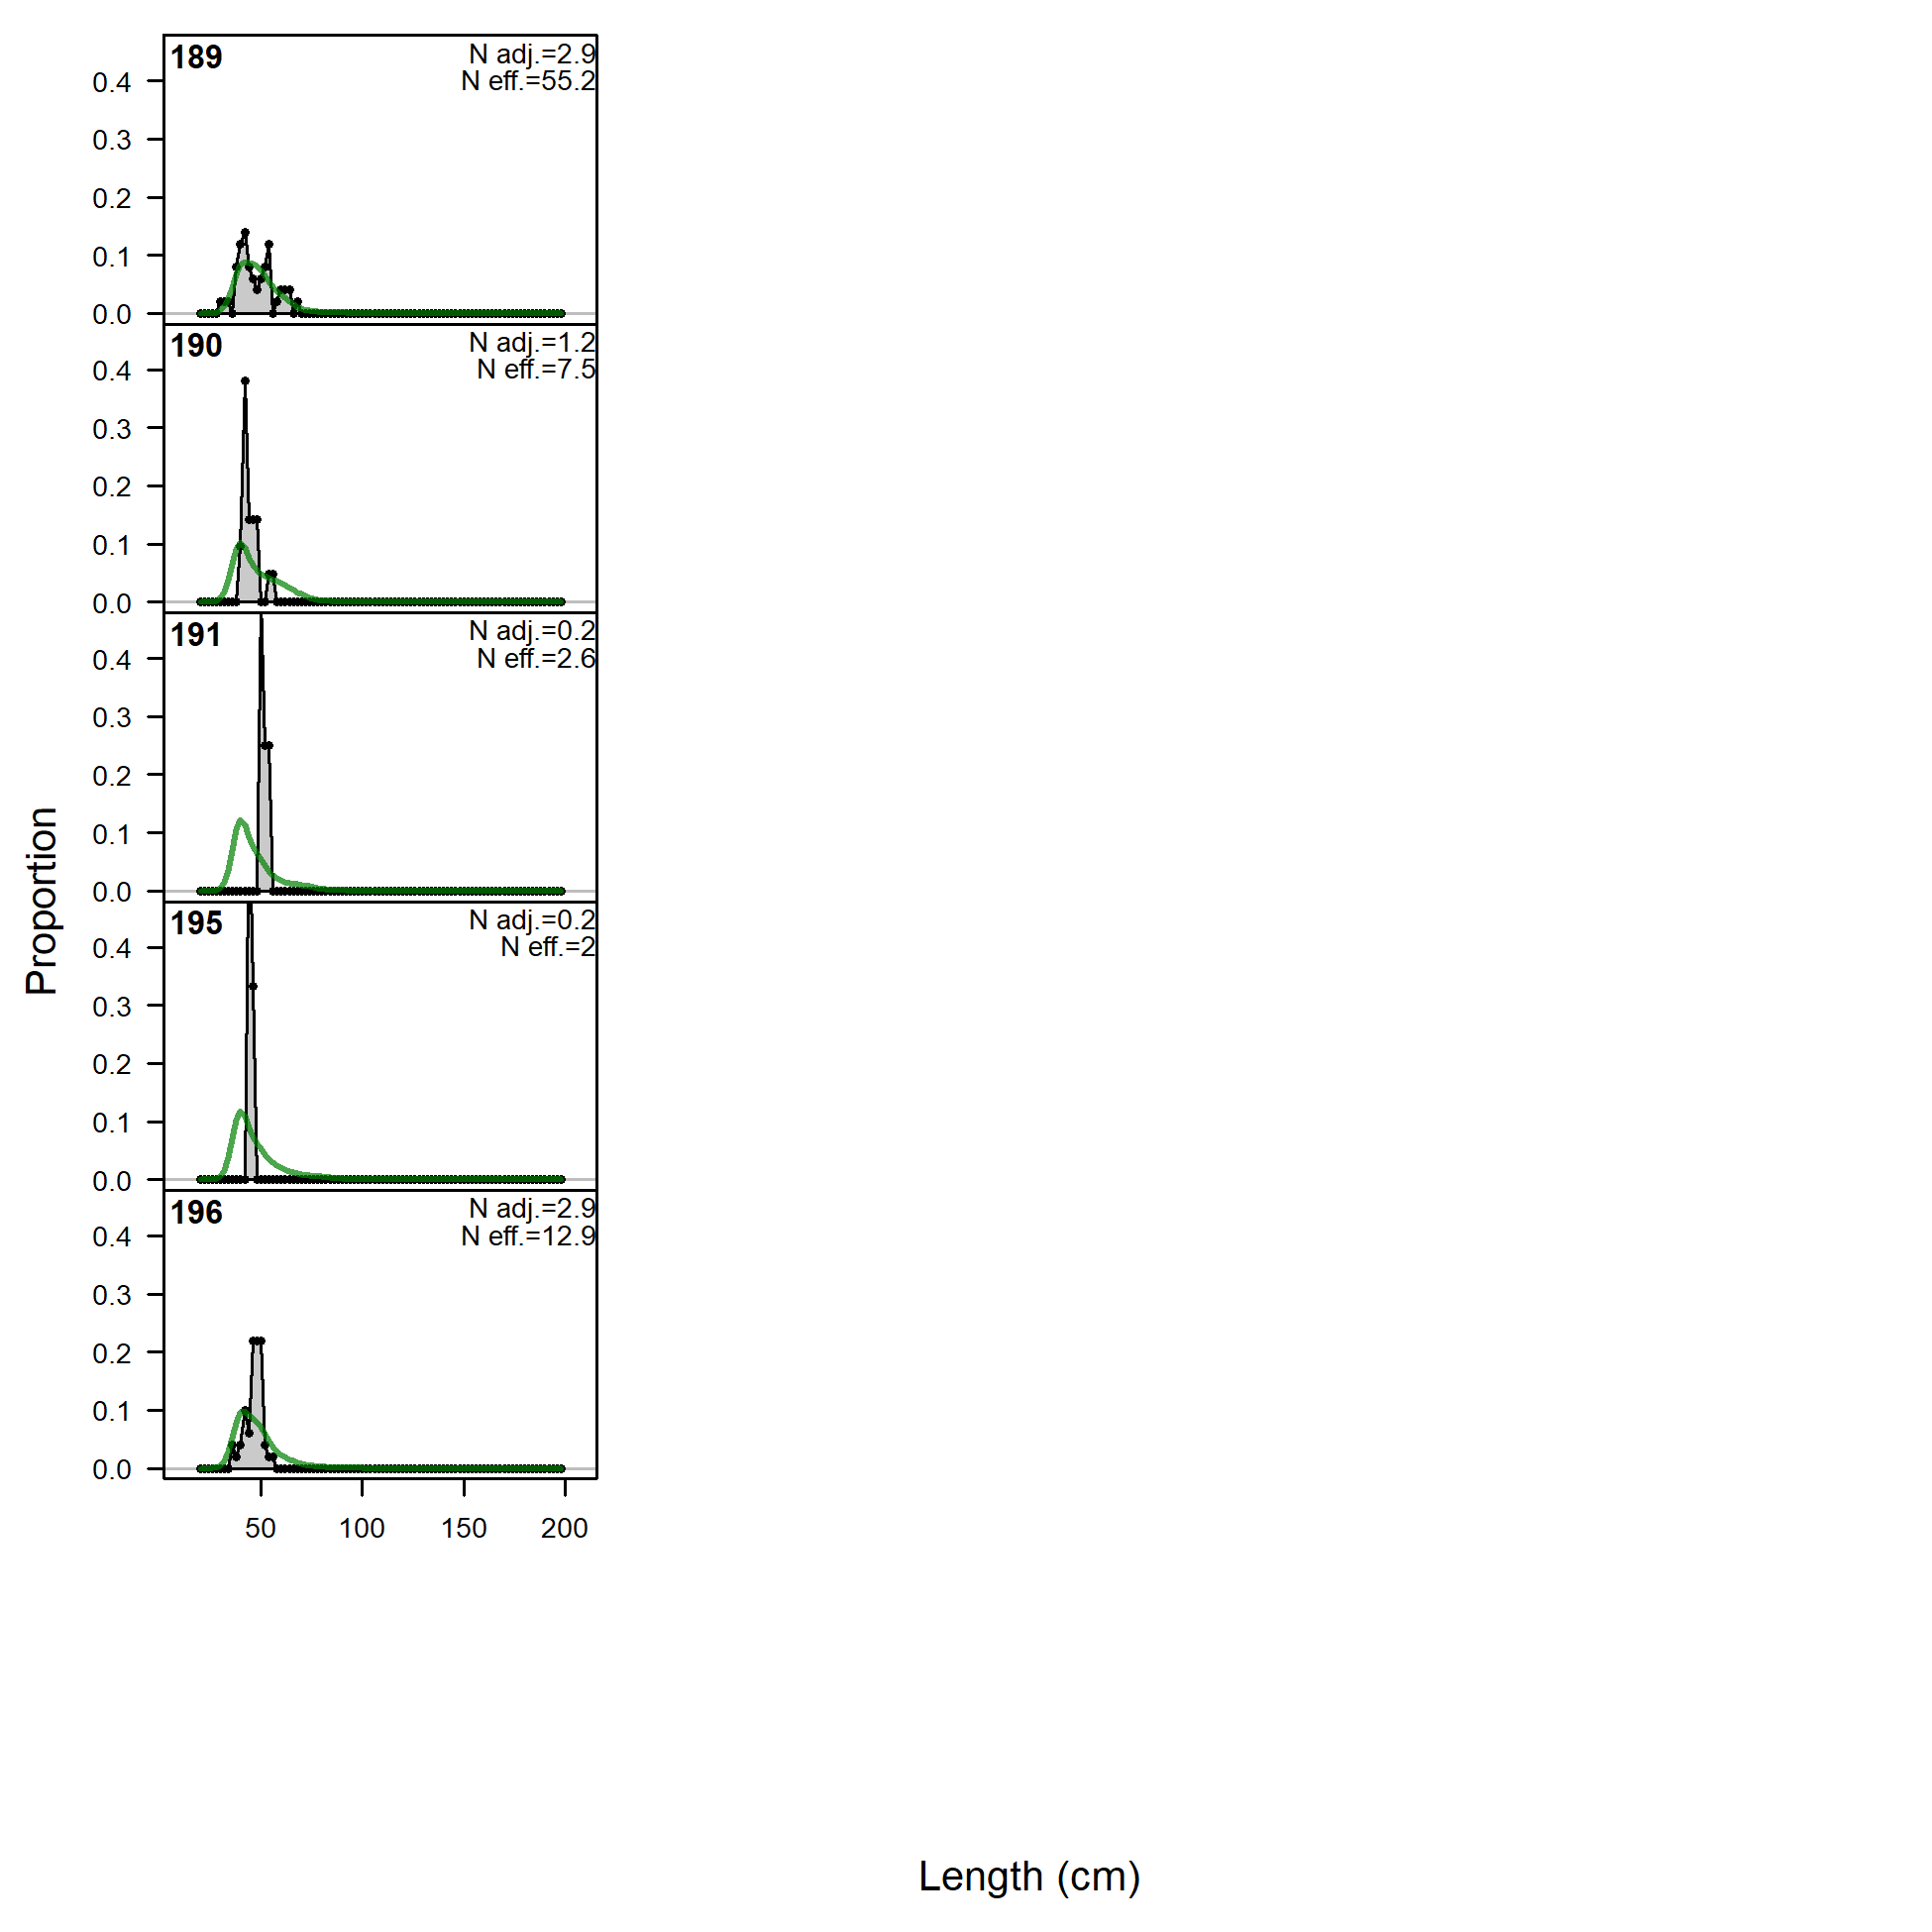
Length comps, whole catch, F5_PS_OBJ_South_coastal (plot 1 of 3).
'N adj.' is the input sample size after data-weighting adjustment. N eff. is the calculated effective sample size used in the McAllister-Ianelli tuning method. (plot 2 of 3) (plot 3 of 3)
file: comp_lenfit_flt5mkt0_page3.png
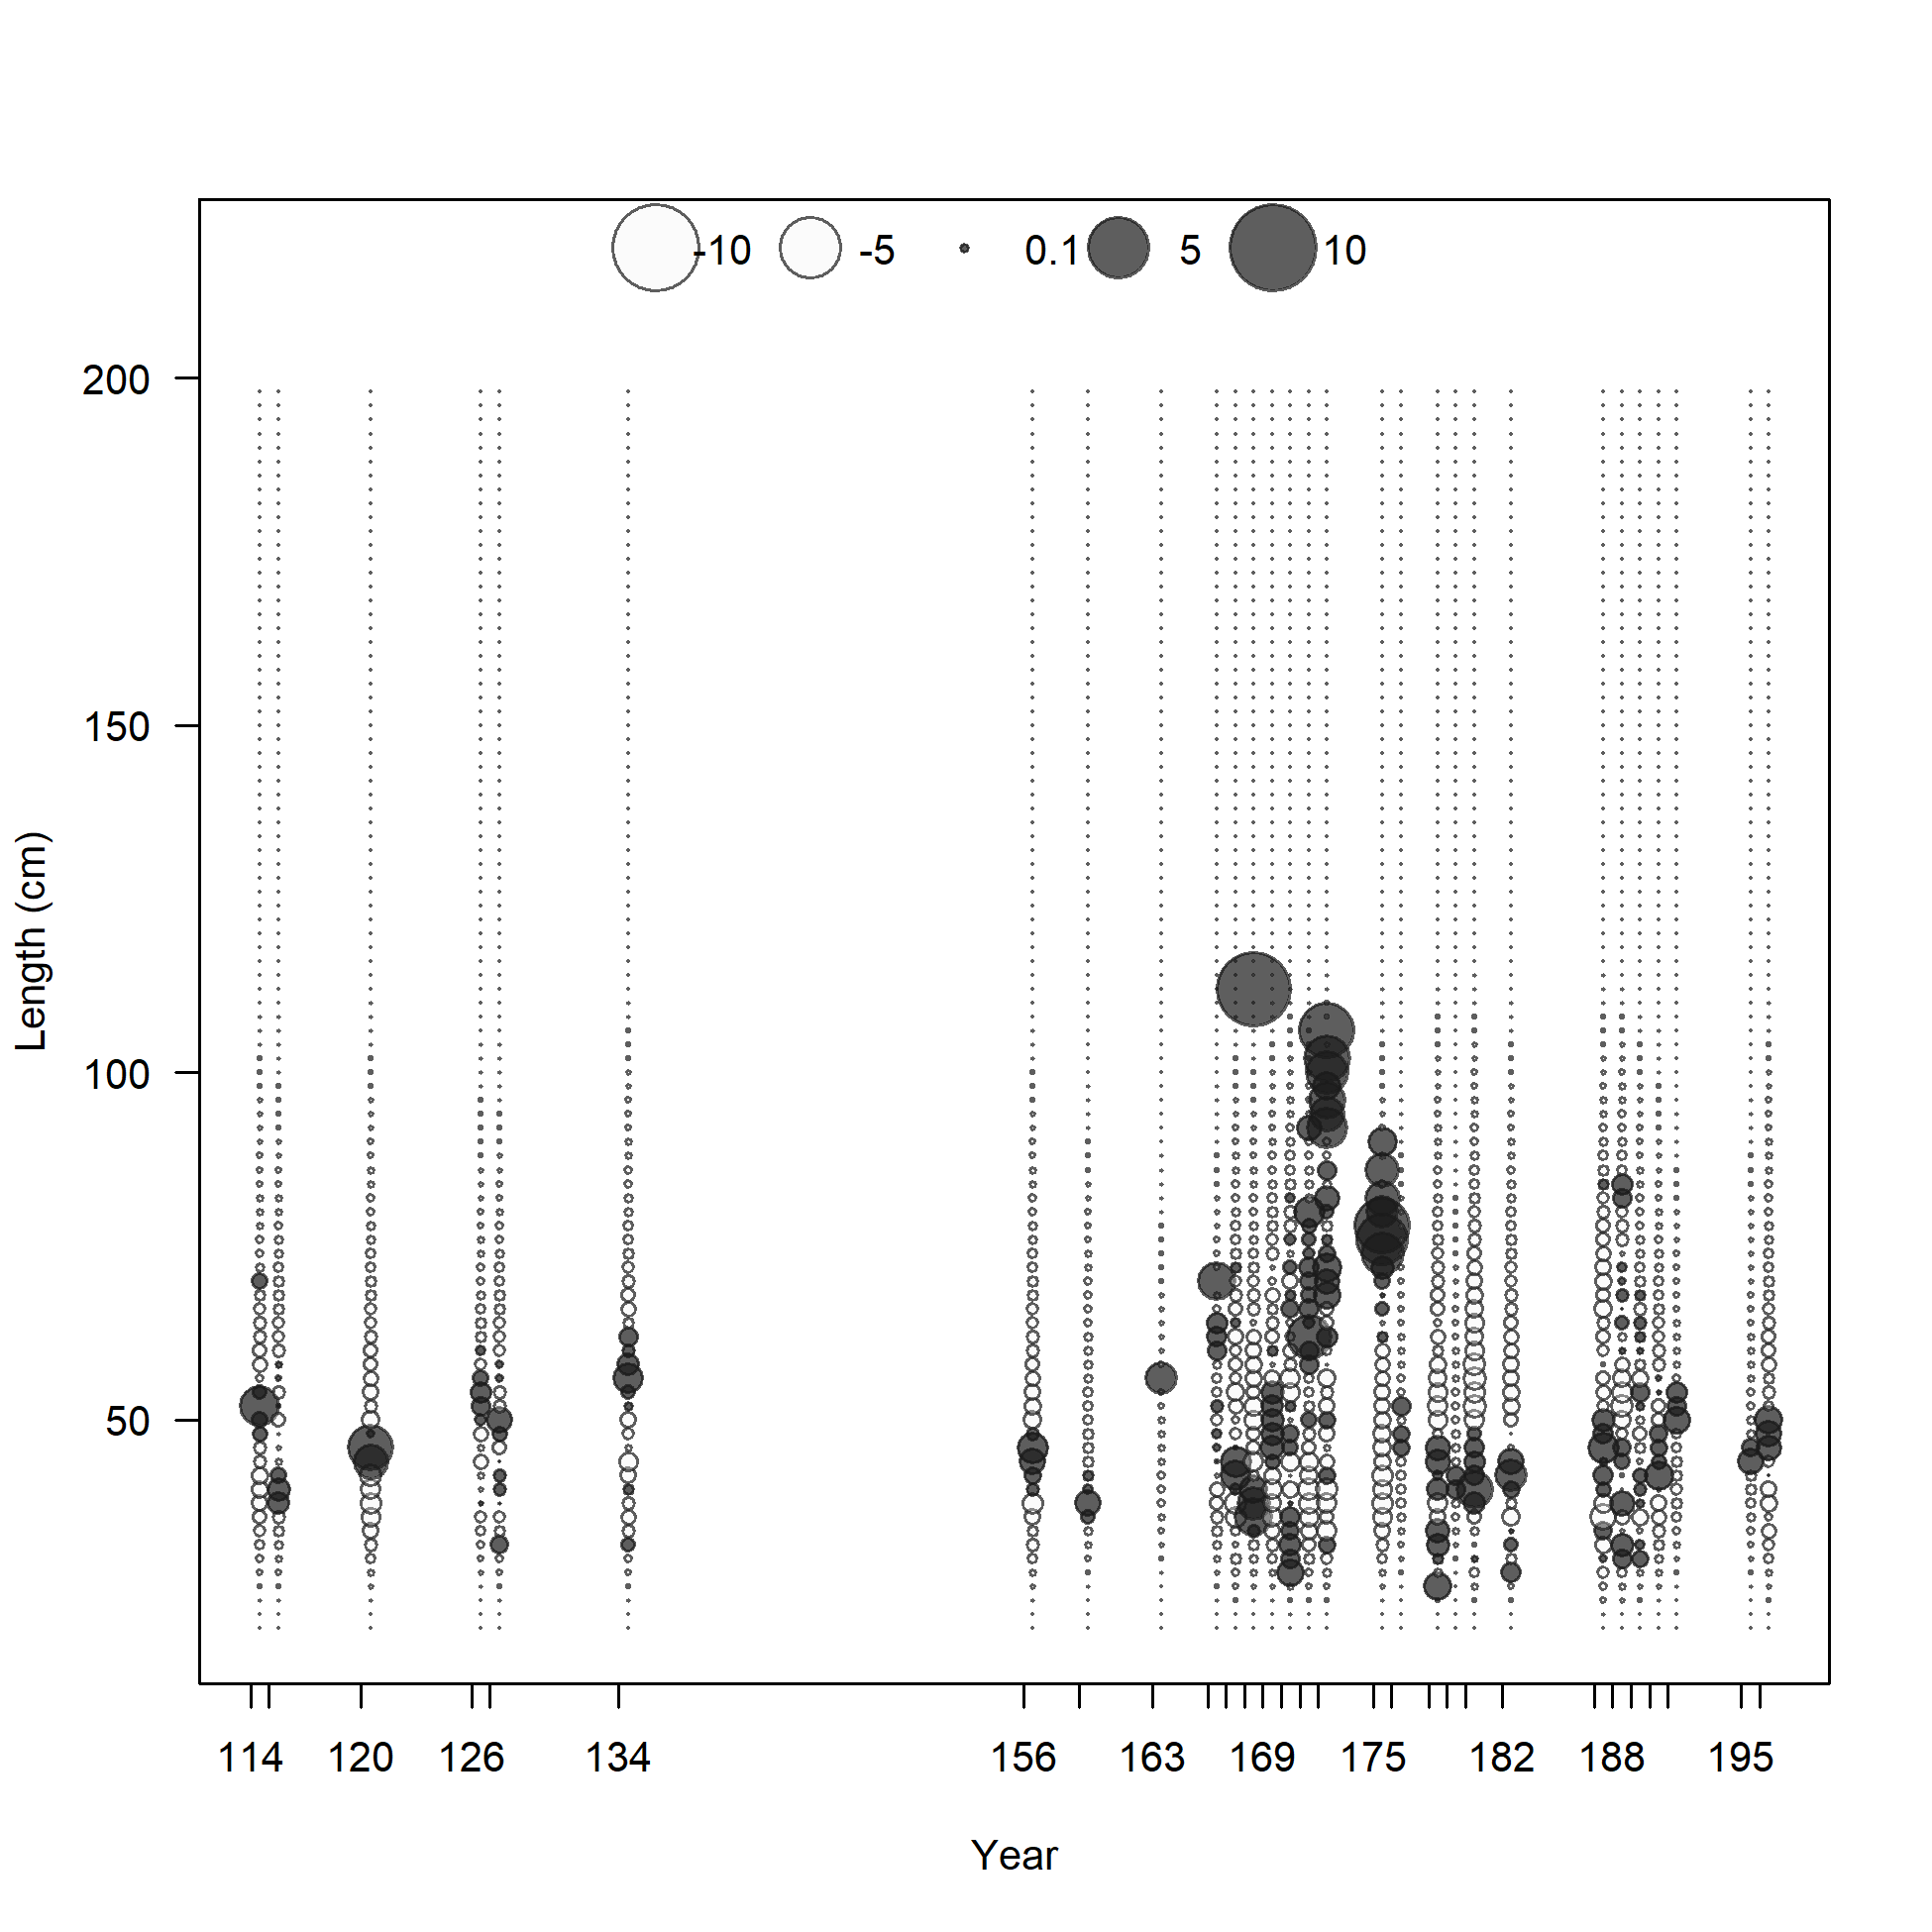
Pearson residuals, whole catch, F5_PS_OBJ_South_coastal (max=4.89) (plot 3 of 3)
Closed bubbles are positive residuals (observed > expected) and open bubbles are negative residuals (observed < expected).
file: comp_lenfit_residsflt5mkt0_page3.png
N-EffN comparison, Length comps, whole catch, F5_PS_OBJ_South_coastal
file: comp_lenfit_sampsize_flt5mkt0.png
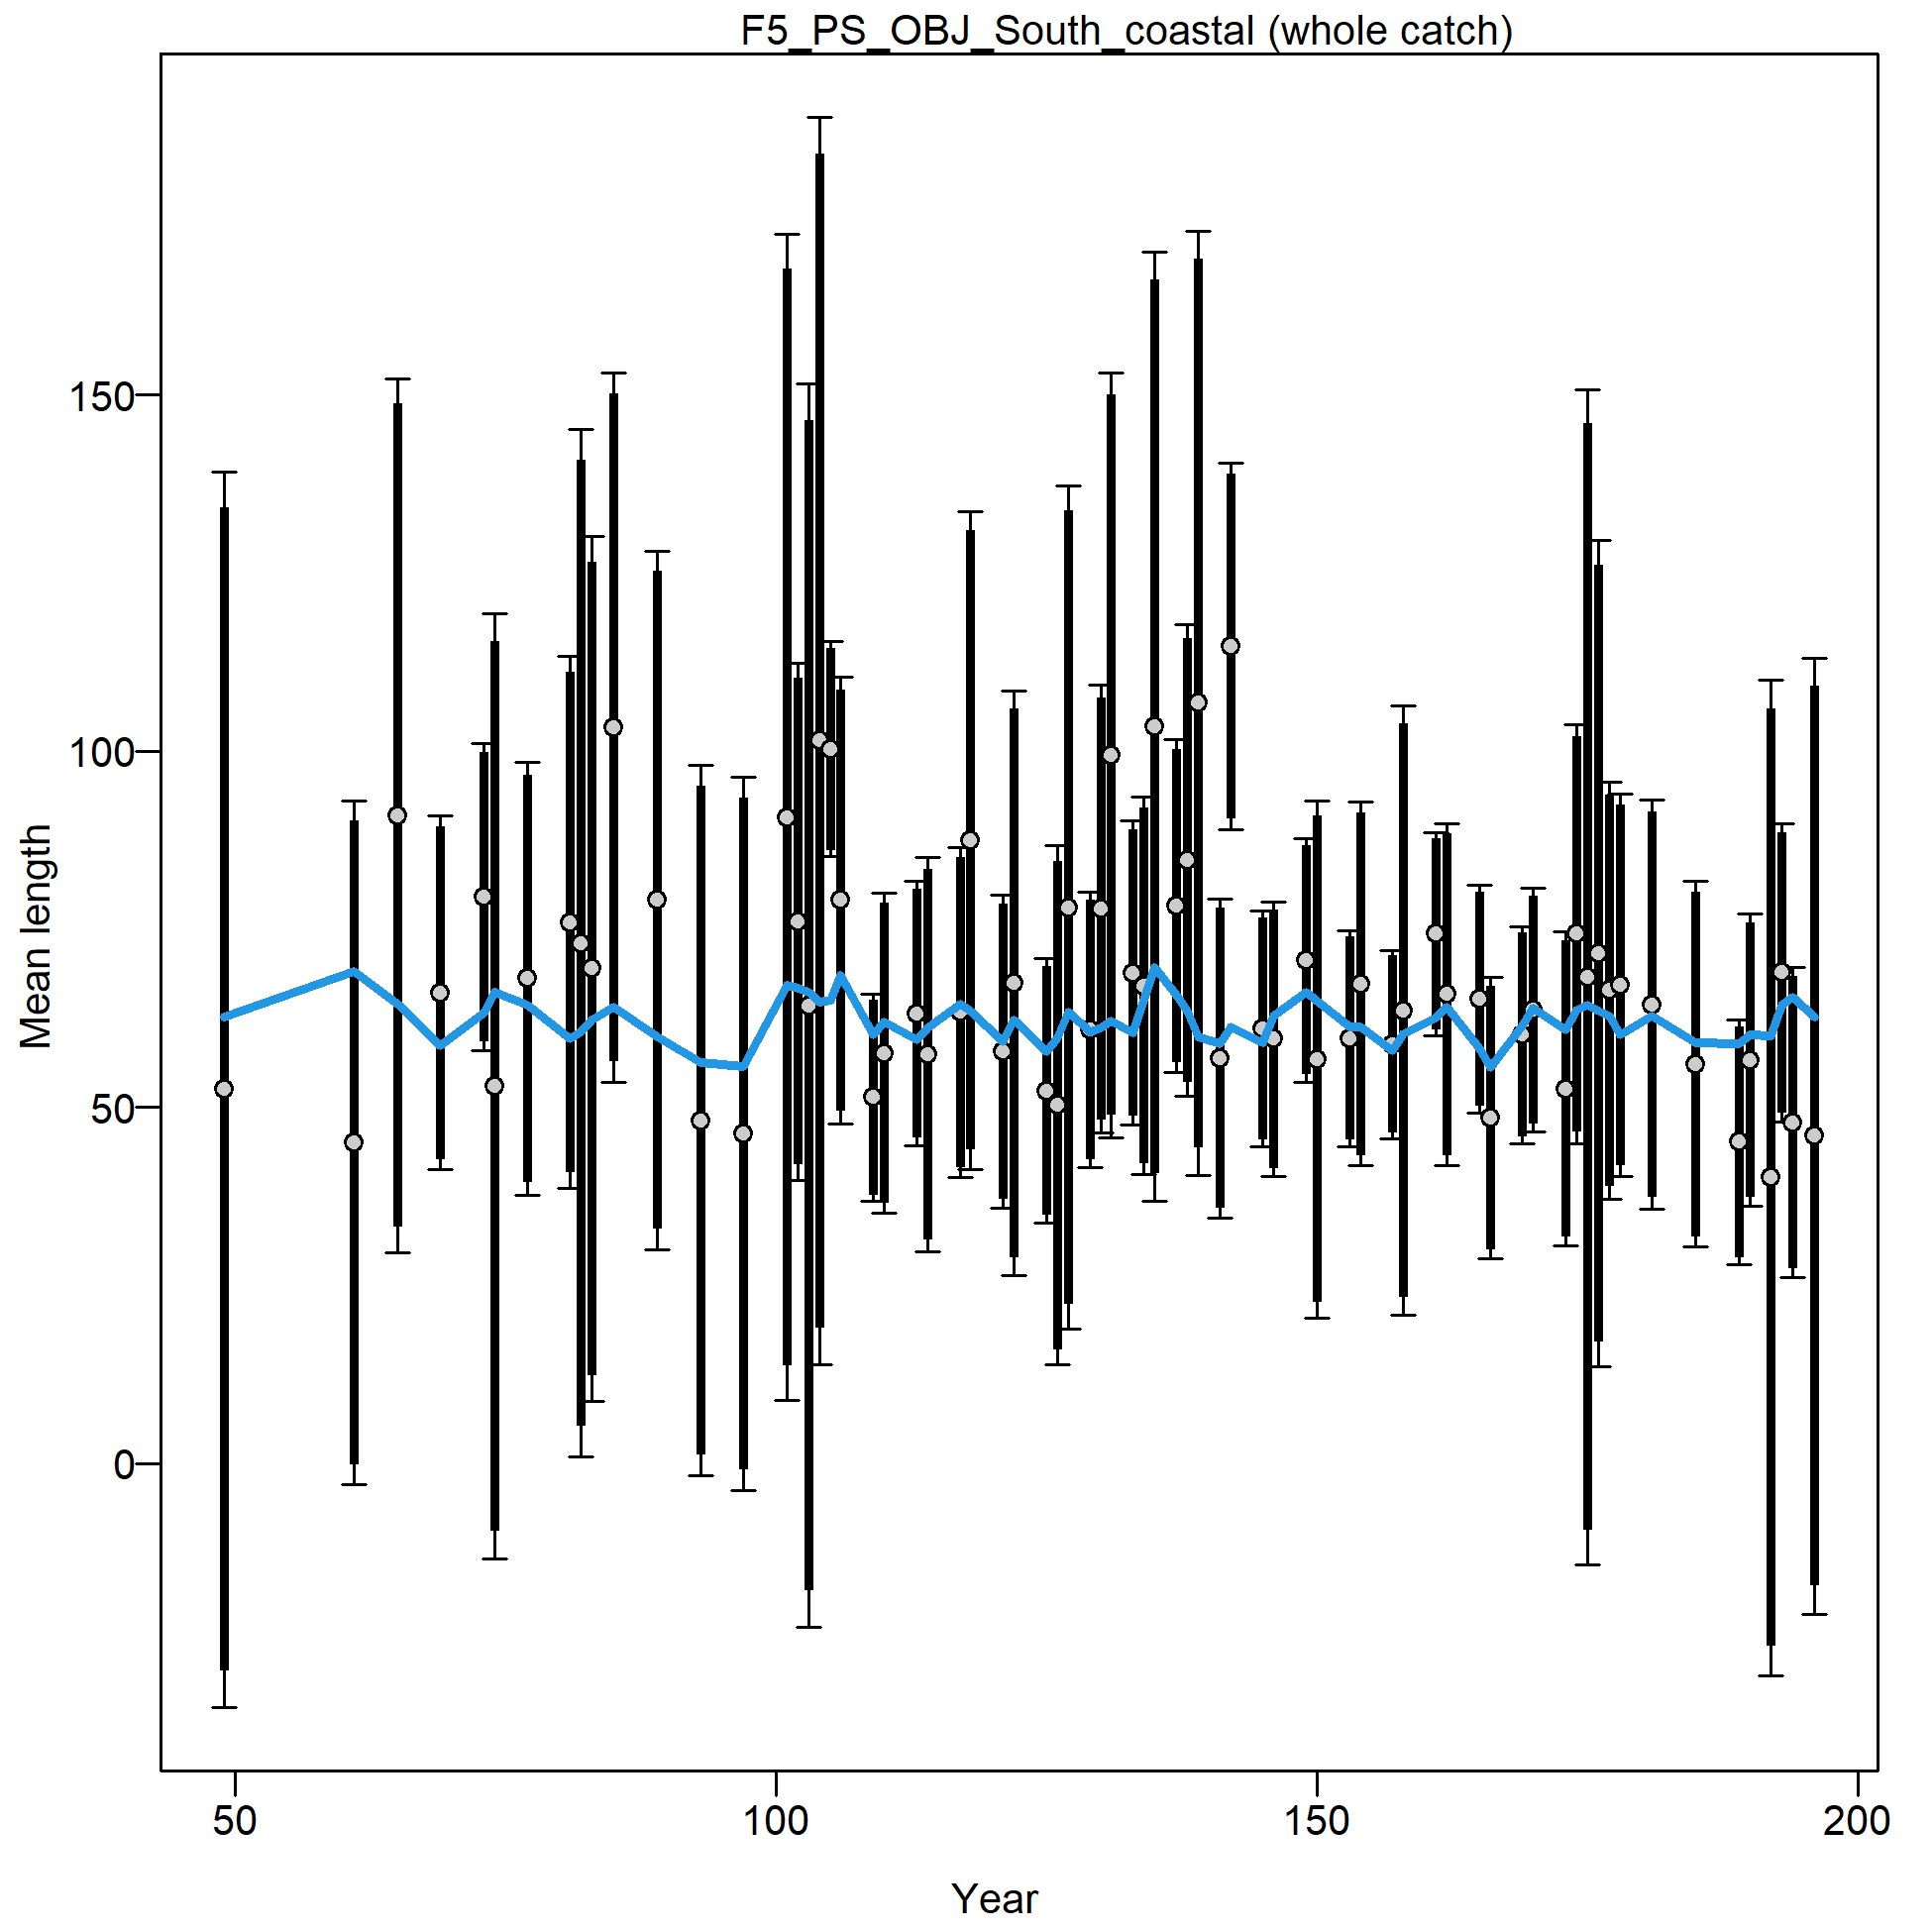
Mean length for F5_PS_OBJ_South_coastal with 95% confidence intervals based on current sample sizes.
Francis data weighting method TA1.8: thinner intervals (with capped ends) show result of further adjusting sample sizes based on suggested multiplier (with 95% interval) for len data from F5_PS_OBJ_South_coastal:
0.886 (0.499-2.1337)
For more info, see Francis (2011).
file: comp_lenfit_data_weighting_TA1-8_F5_PS_OBJ_South_coastal.png
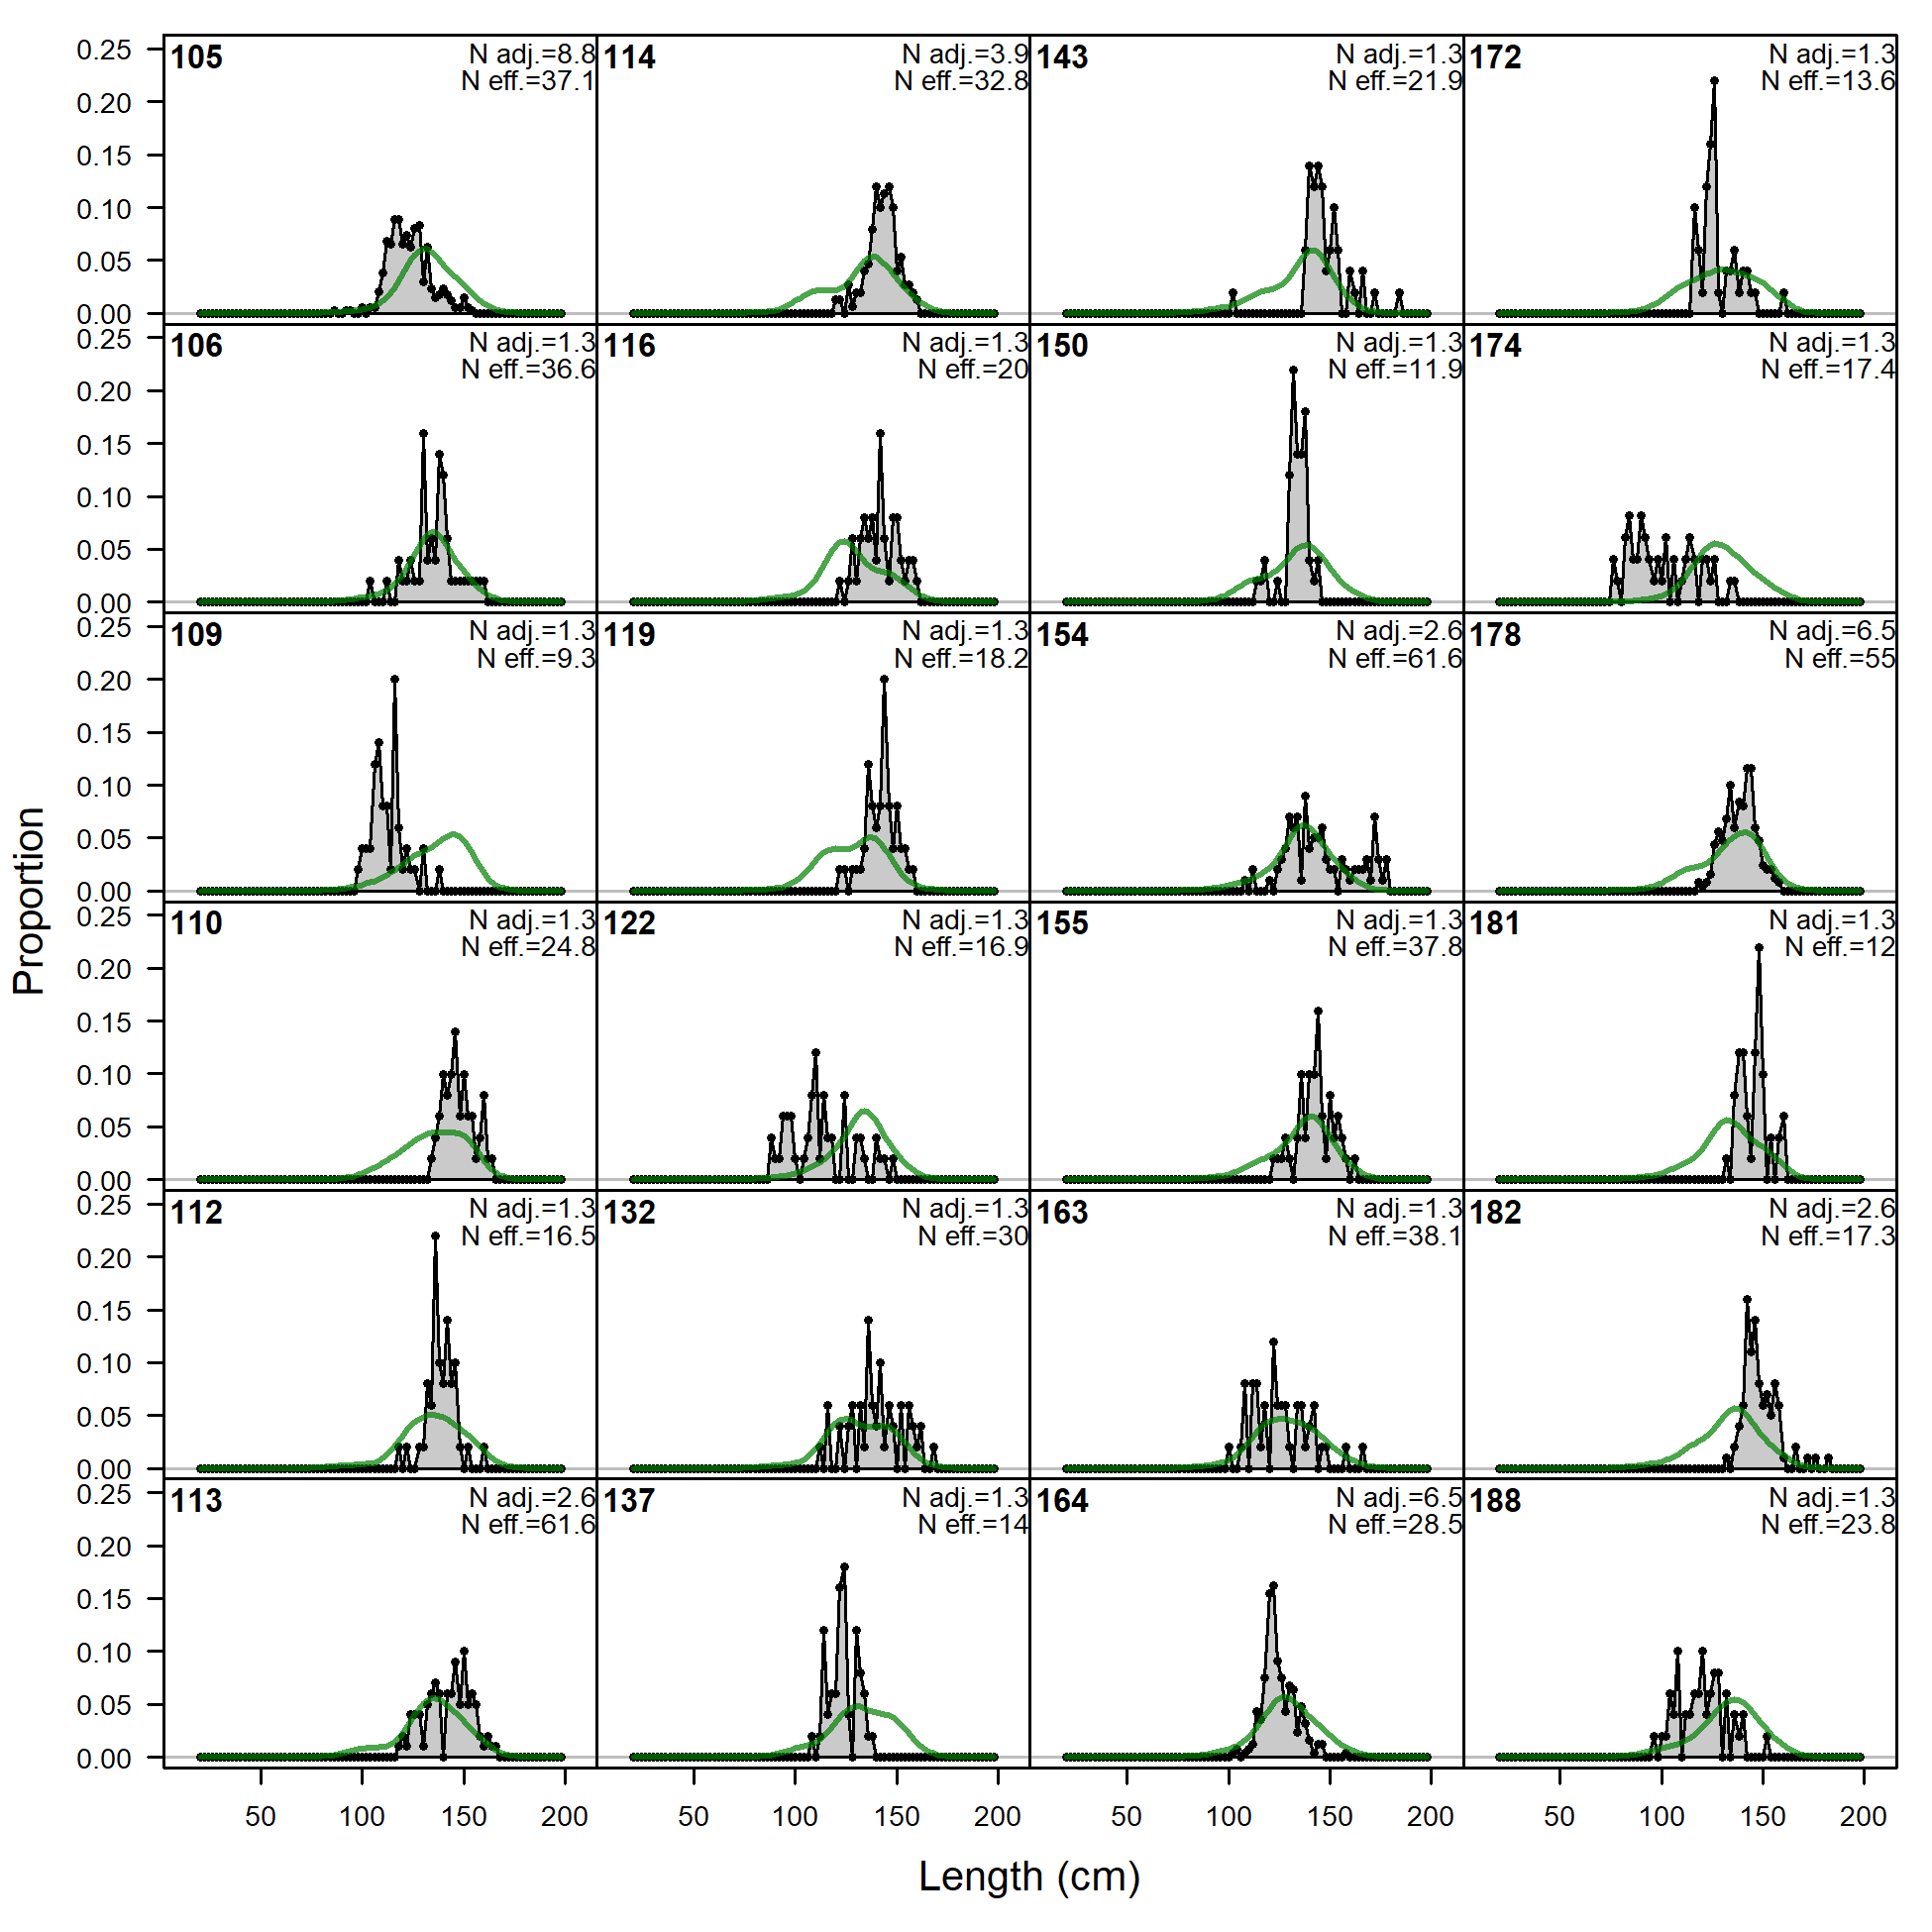
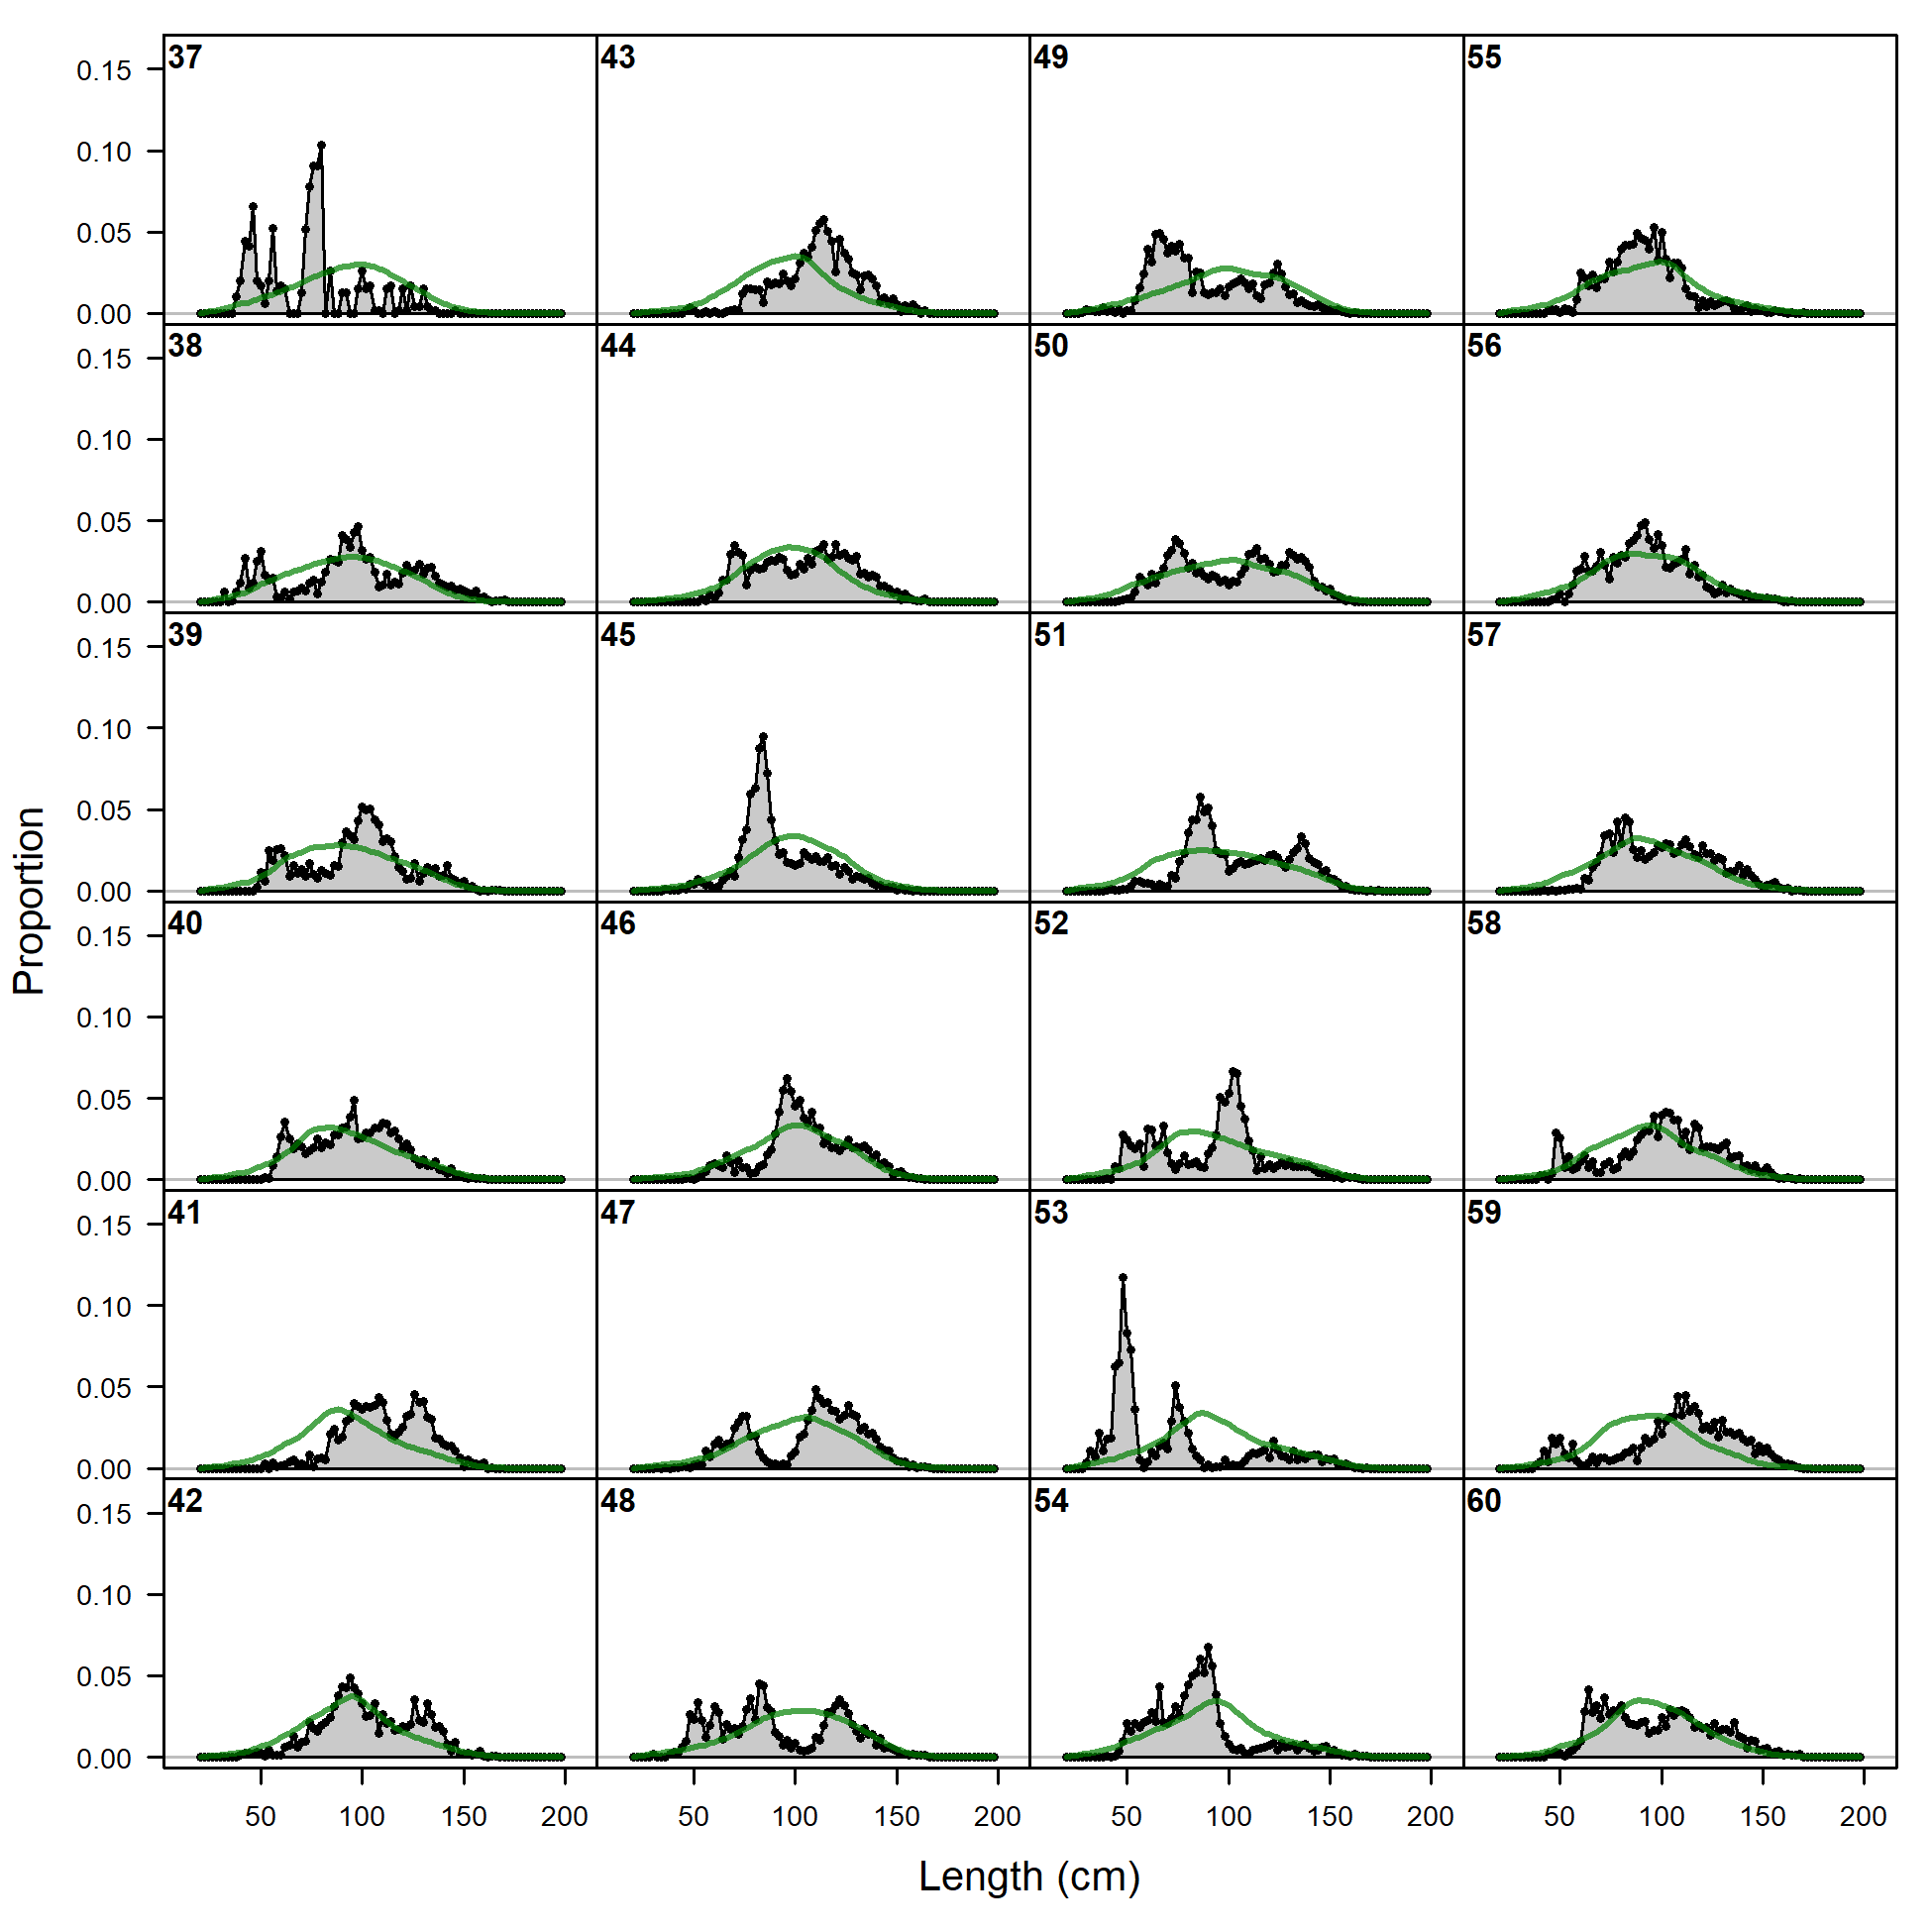
Length comps, whole catch, F9_PS_NOA_Offshore_small (plot 1 of 2).
'N adj.' is the input sample size after data-weighting adjustment. N eff. is the calculated effective sample size used in the McAllister-Ianelli tuning method.
file: comp_lenfit_flt9mkt0_page1.png
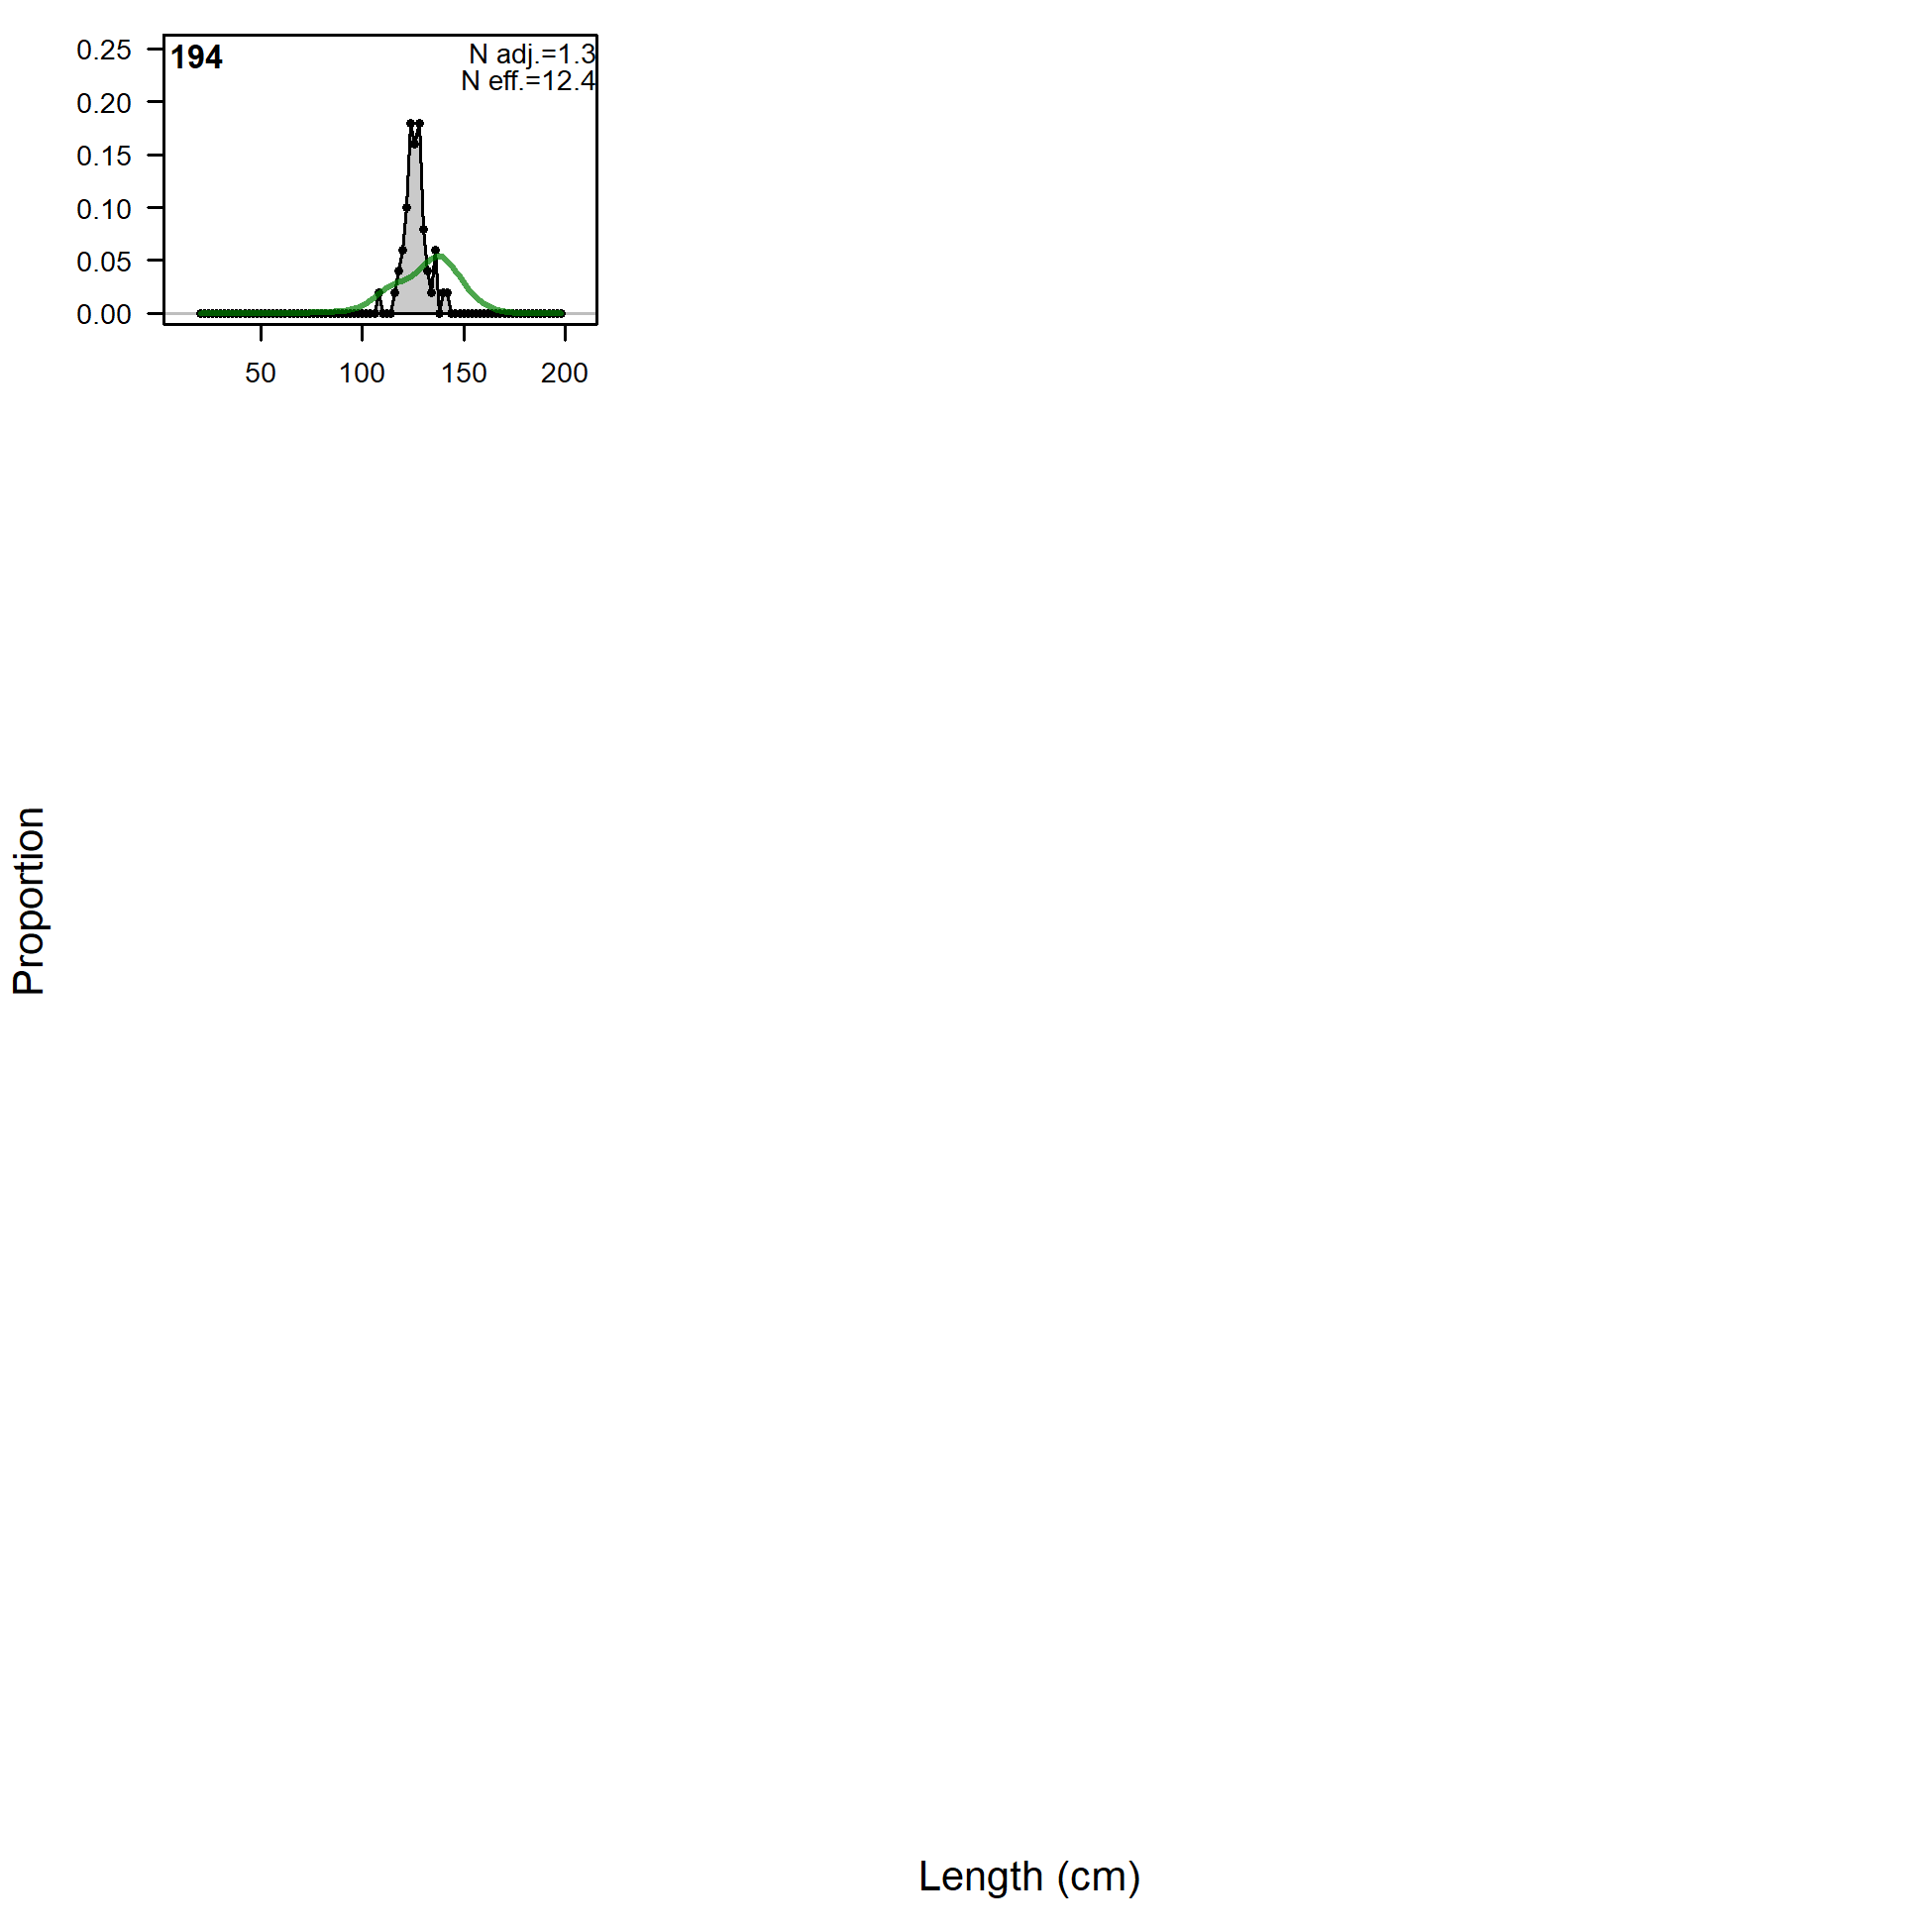
Length comps, whole catch, F9_PS_NOA_Offshore_small (plot 1 of 2).
'N adj.' is the input sample size after data-weighting adjustment. N eff. is the calculated effective sample size used in the McAllister-Ianelli tuning method. (plot 2 of 2)
file: comp_lenfit_flt9mkt0_page2.png
Pearson residuals, whole catch, F9_PS_NOA_Offshore_small (max=7.44) (plot 2 of 2)
Closed bubbles are positive residuals (observed > expected) and open bubbles are negative residuals (observed < expected).
file: comp_lenfit_residsflt9mkt0_page2.png
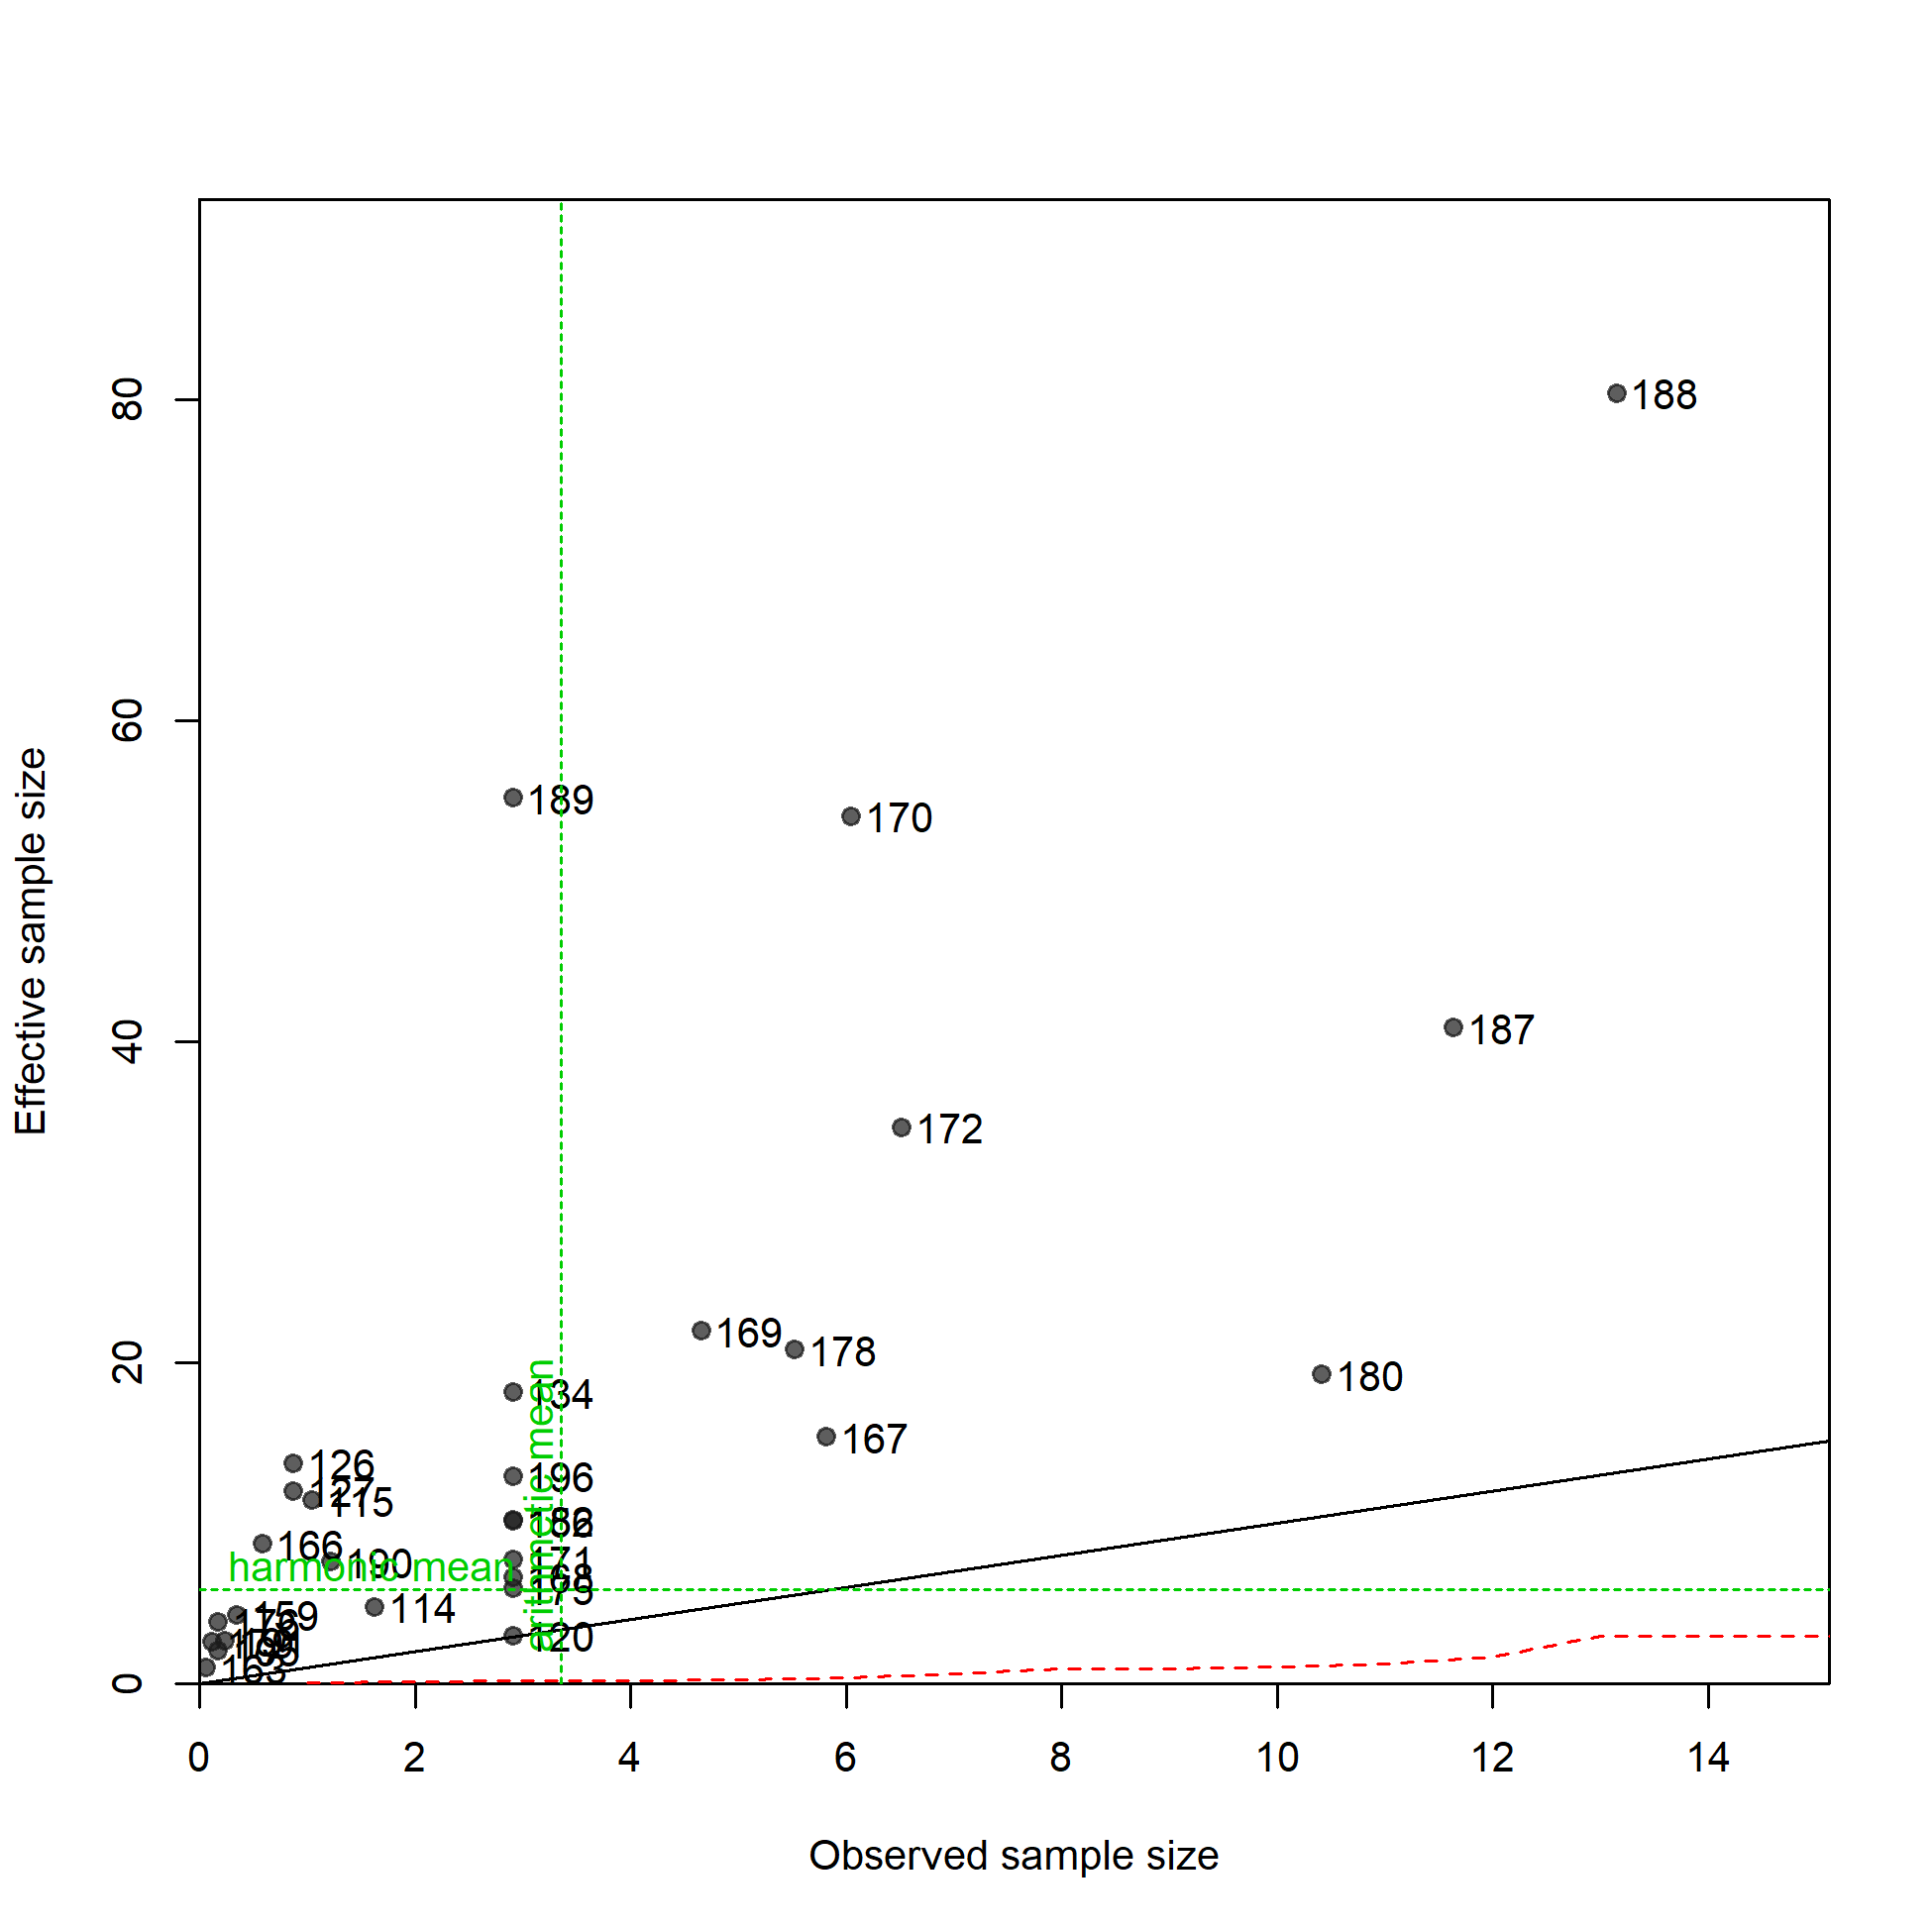
N-EffN comparison, Length comps, whole catch, F9_PS_NOA_Offshore_small
file: comp_lenfit_sampsize_flt9mkt0.png
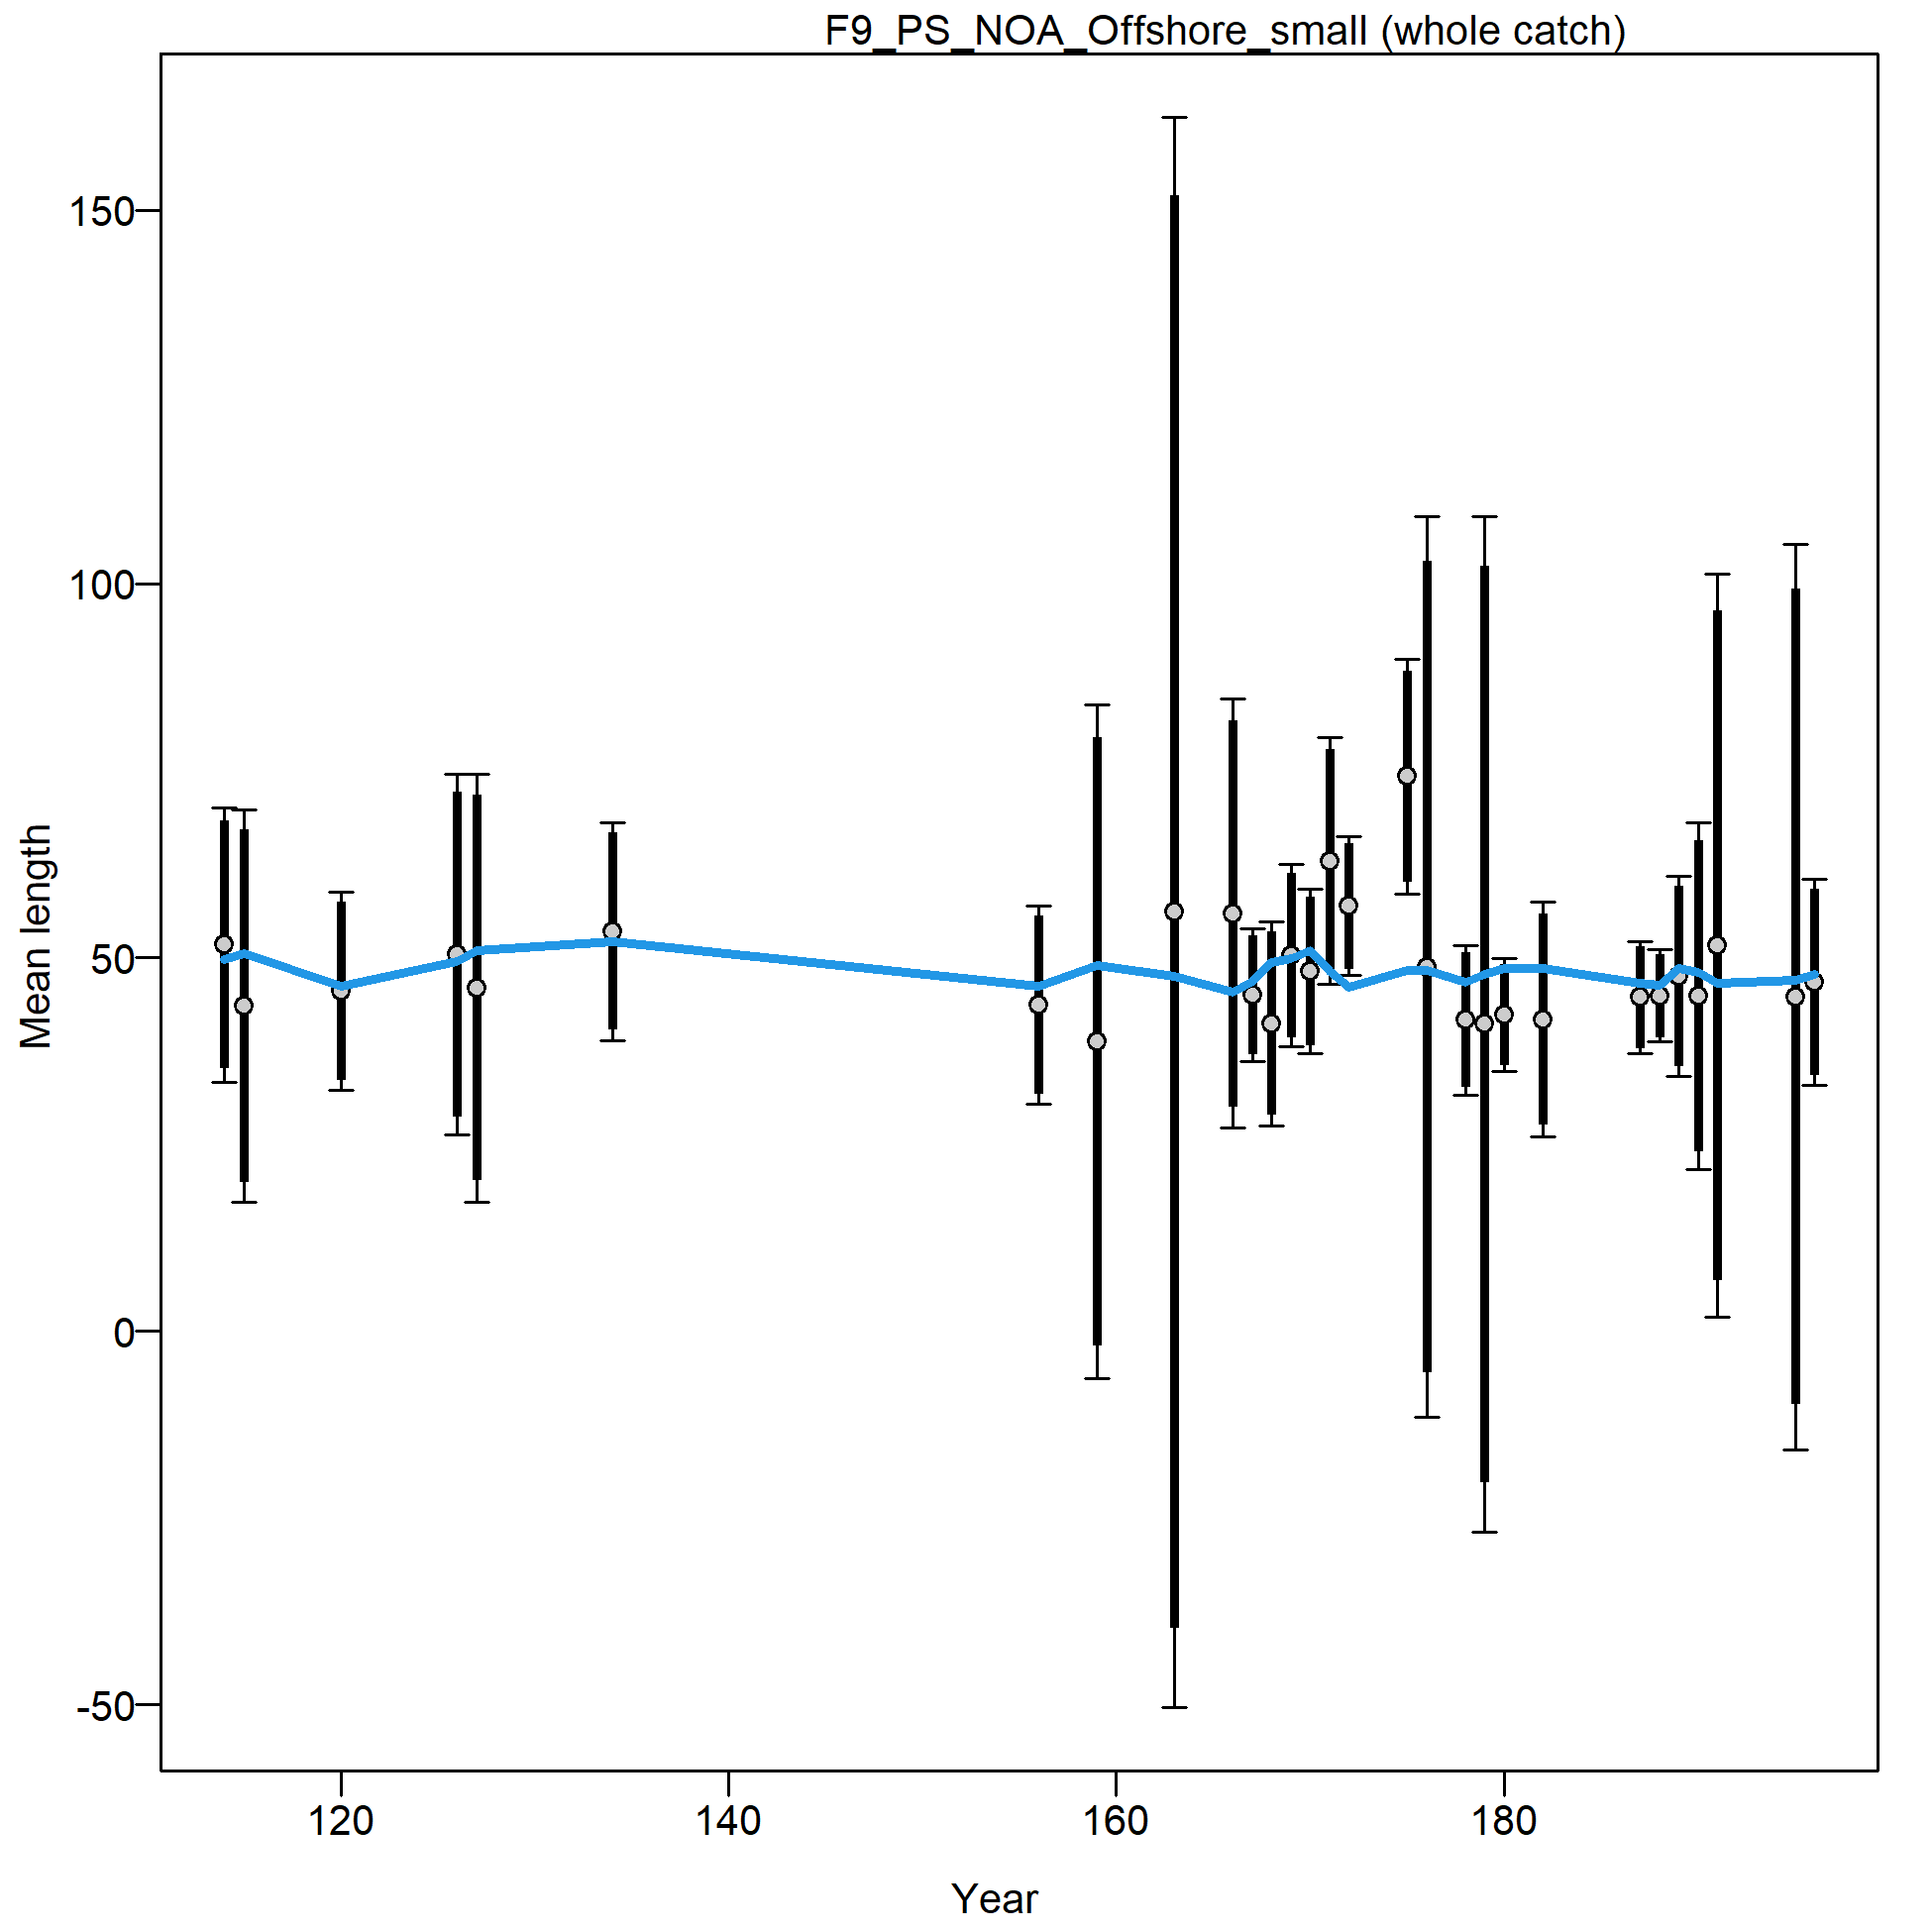
Mean length for F9_PS_NOA_Offshore_small with 95% confidence intervals based on current sample sizes.
Francis data weighting method TA1.8: thinner intervals (with capped ends) show result of further adjusting sample sizes based on suggested multiplier (with 95% interval) for len data from F9_PS_NOA_Offshore_small:
0.8118 (0.4606-3.1991)
For more info, see Francis (2011).
file: comp_lenfit_data_weighting_TA1-8_F9_PS_NOA_Offshore_small.png
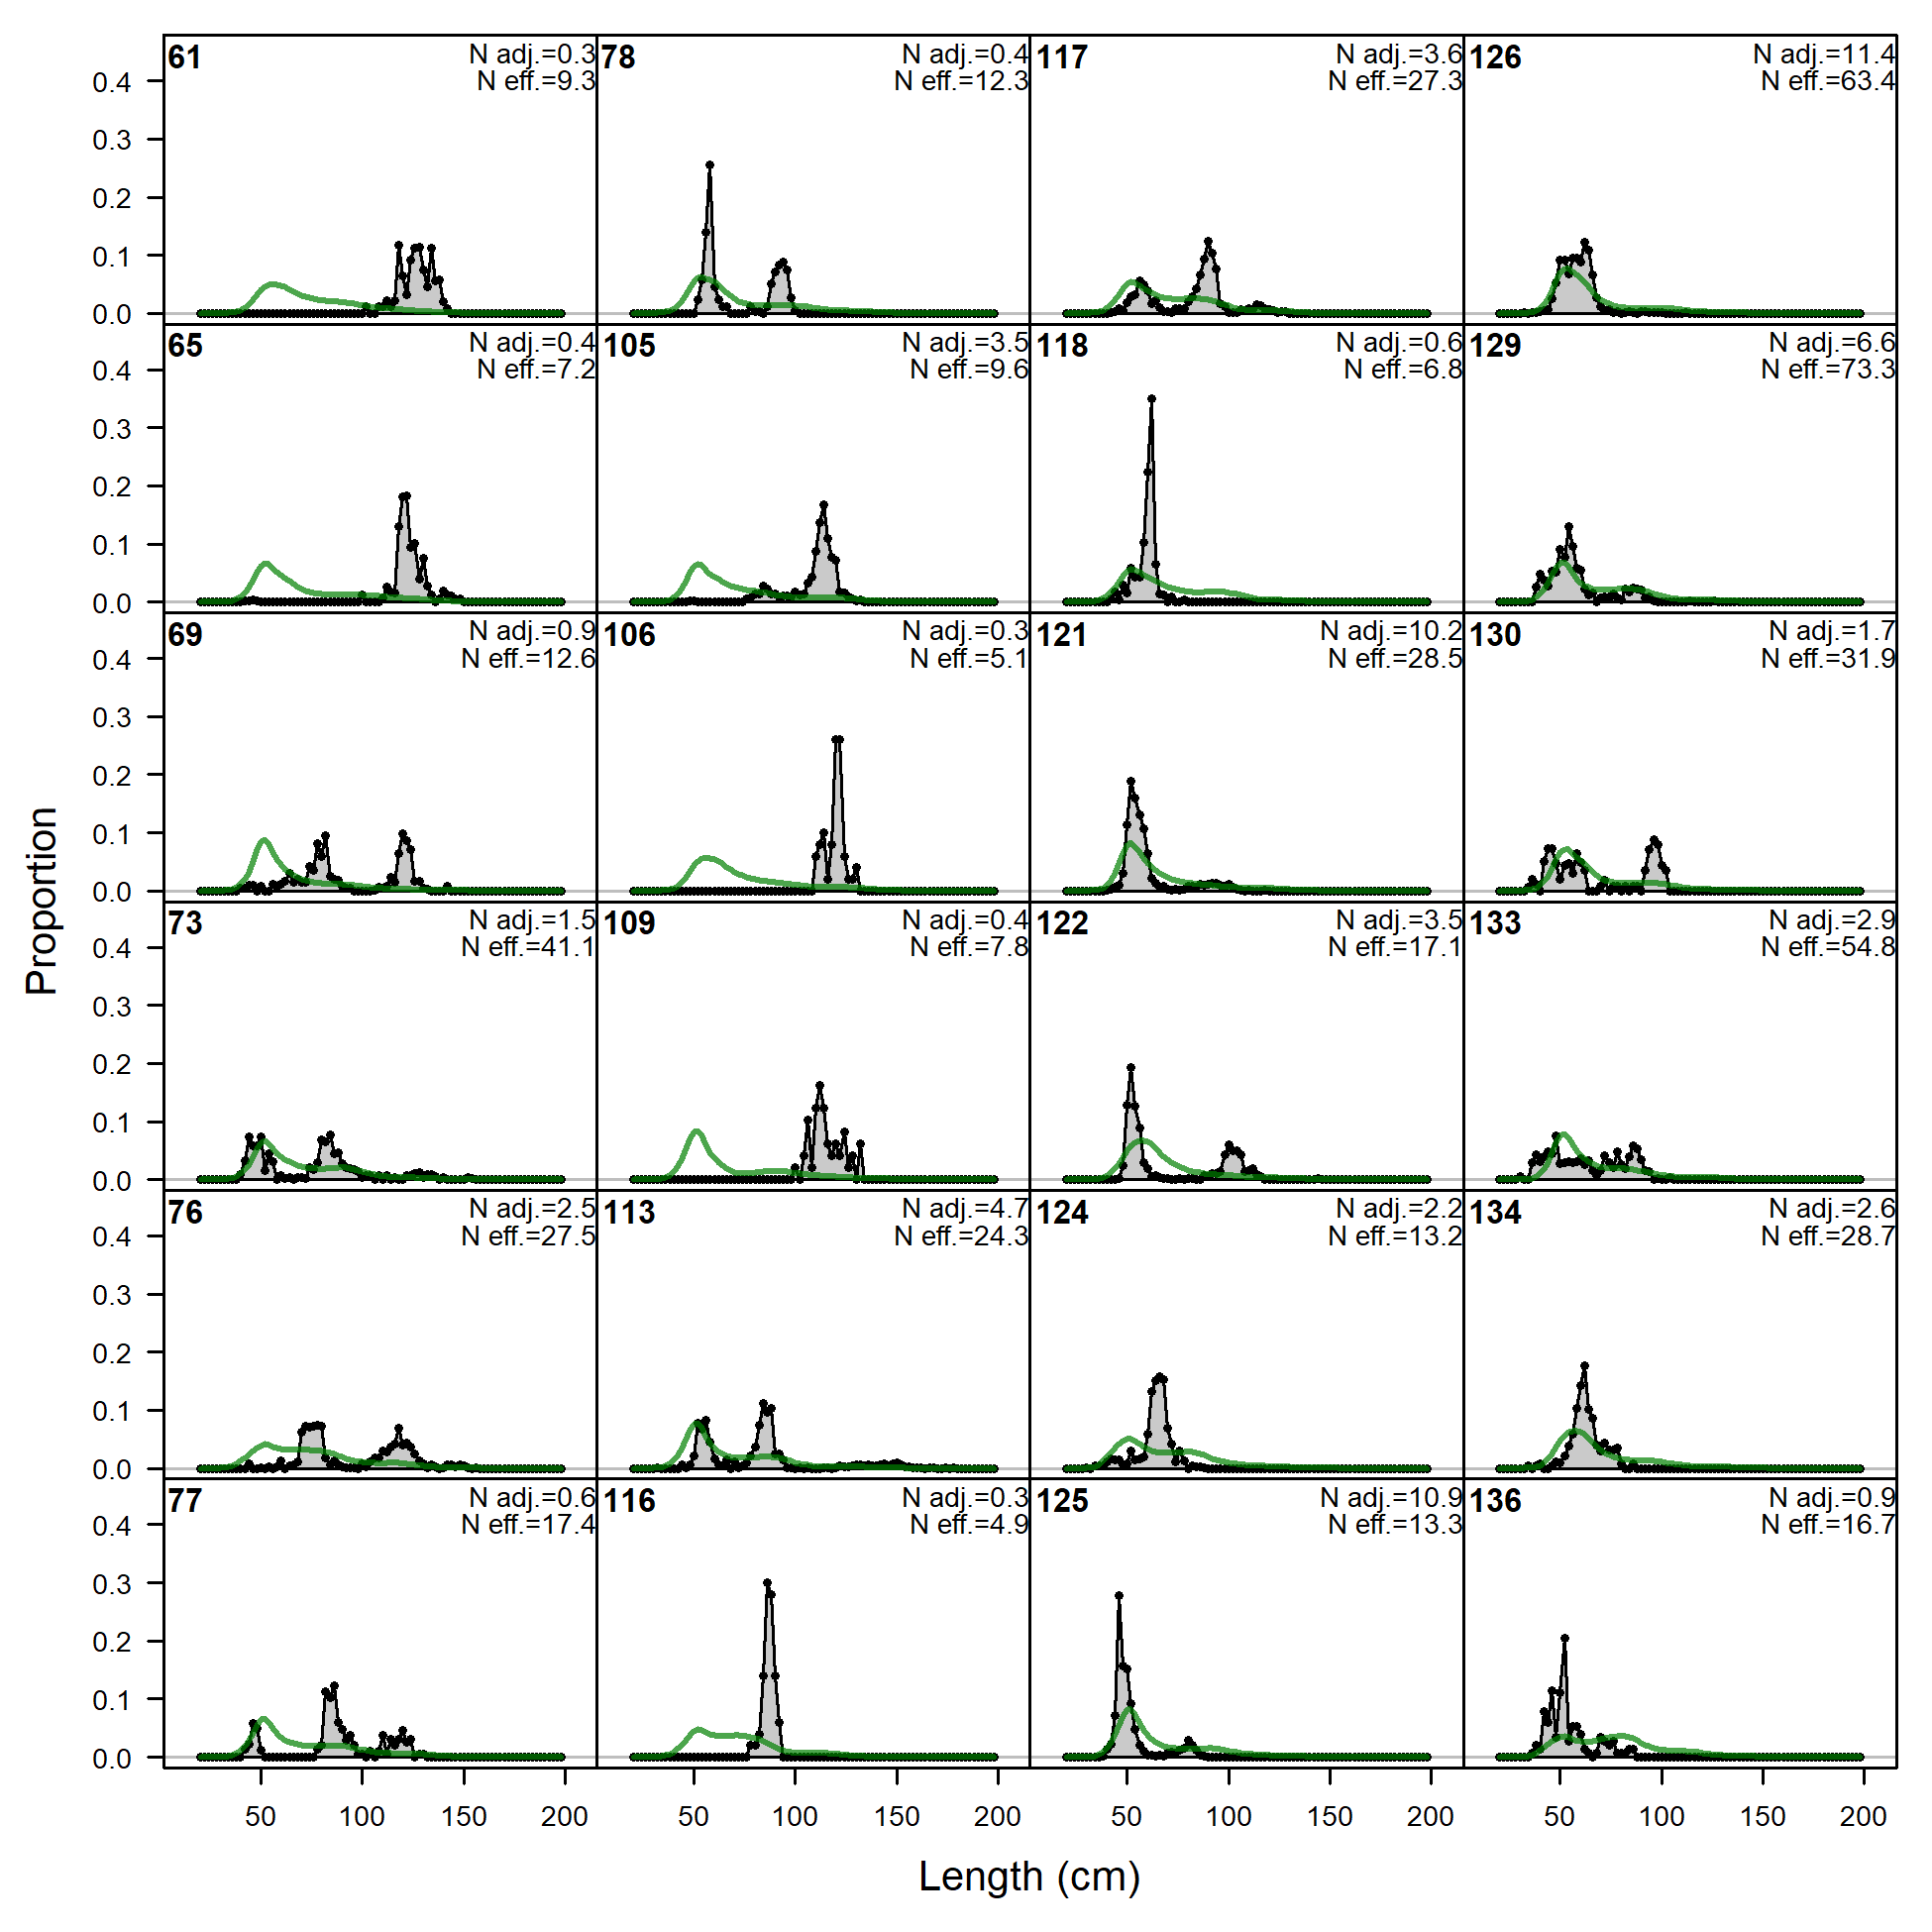
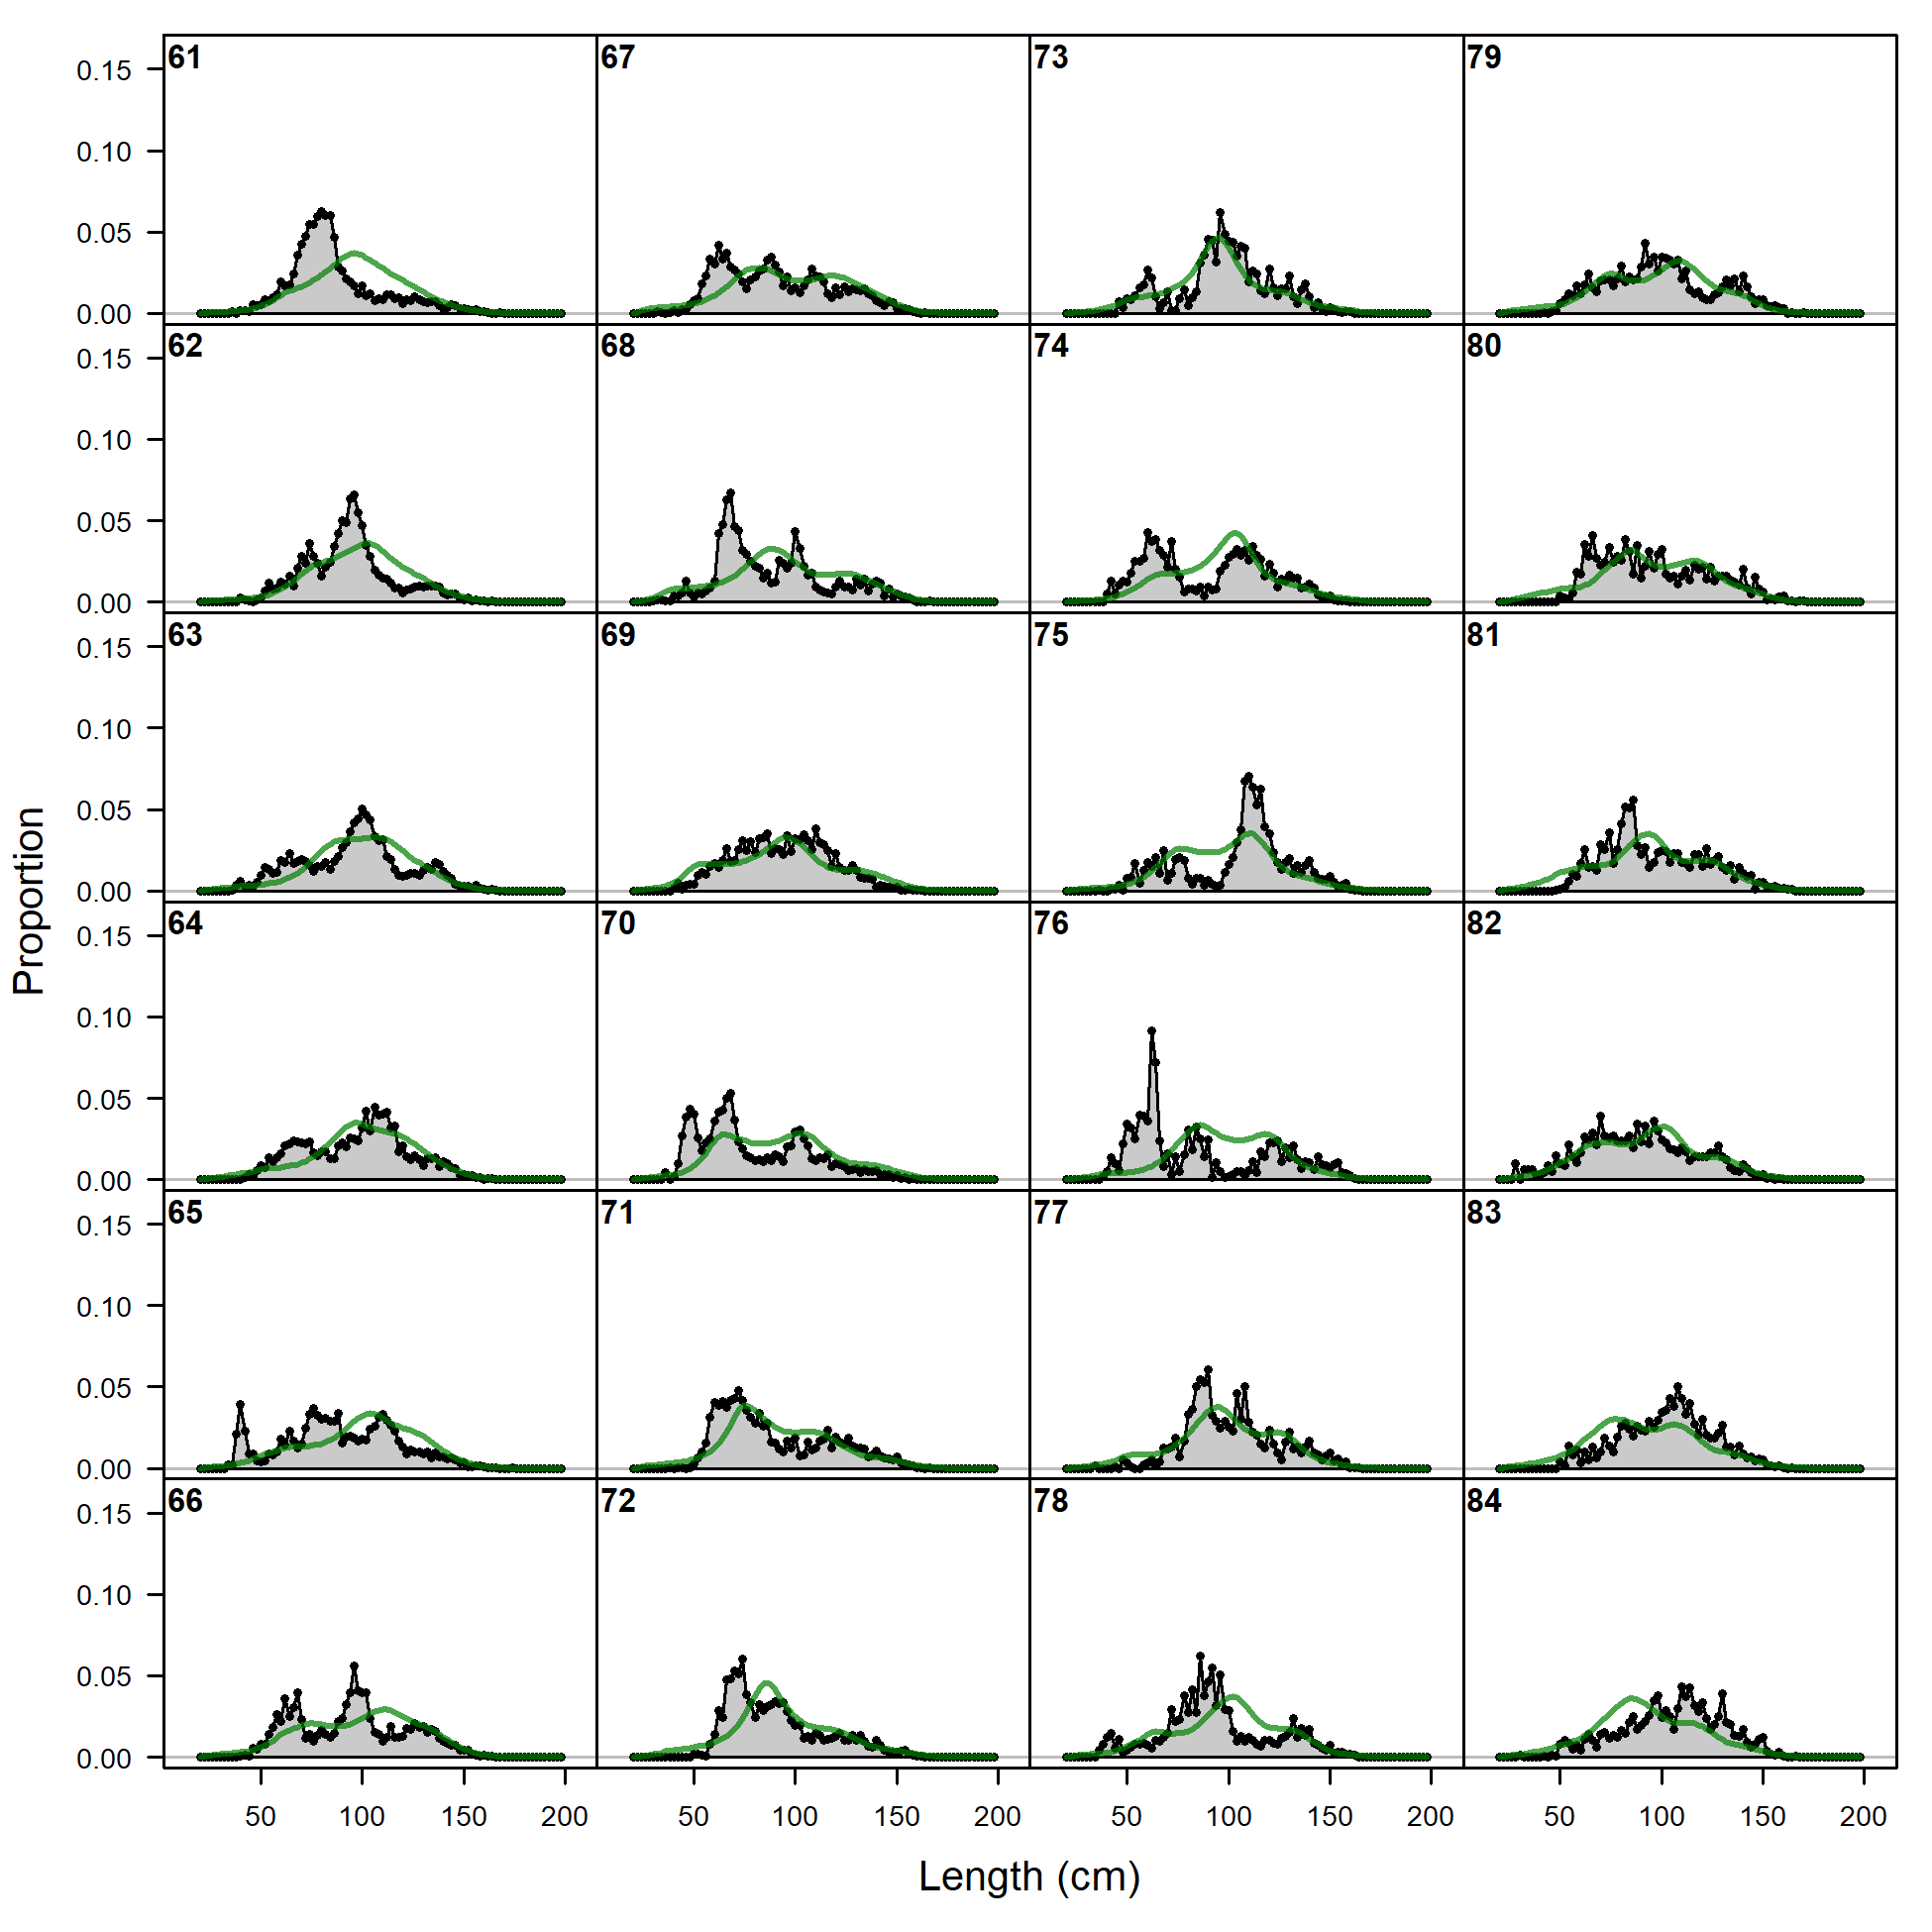
Length comps, retained, F10_PS_NOA_Offshore_large (plot 1 of 2).
'N adj.' is the input sample size after data-weighting adjustment. N eff. is the calculated effective sample size used in the McAllister-Ianelli tuning method.
file: comp_lenfit_flt10mkt2_page1.png
Length comps, retained, F10_PS_NOA_Offshore_large (plot 1 of 2).
'N adj.' is the input sample size after data-weighting adjustment. N eff. is the calculated effective sample size used in the McAllister-Ianelli tuning method. (plot 2 of 2)
file: comp_lenfit_flt10mkt2_page2.png
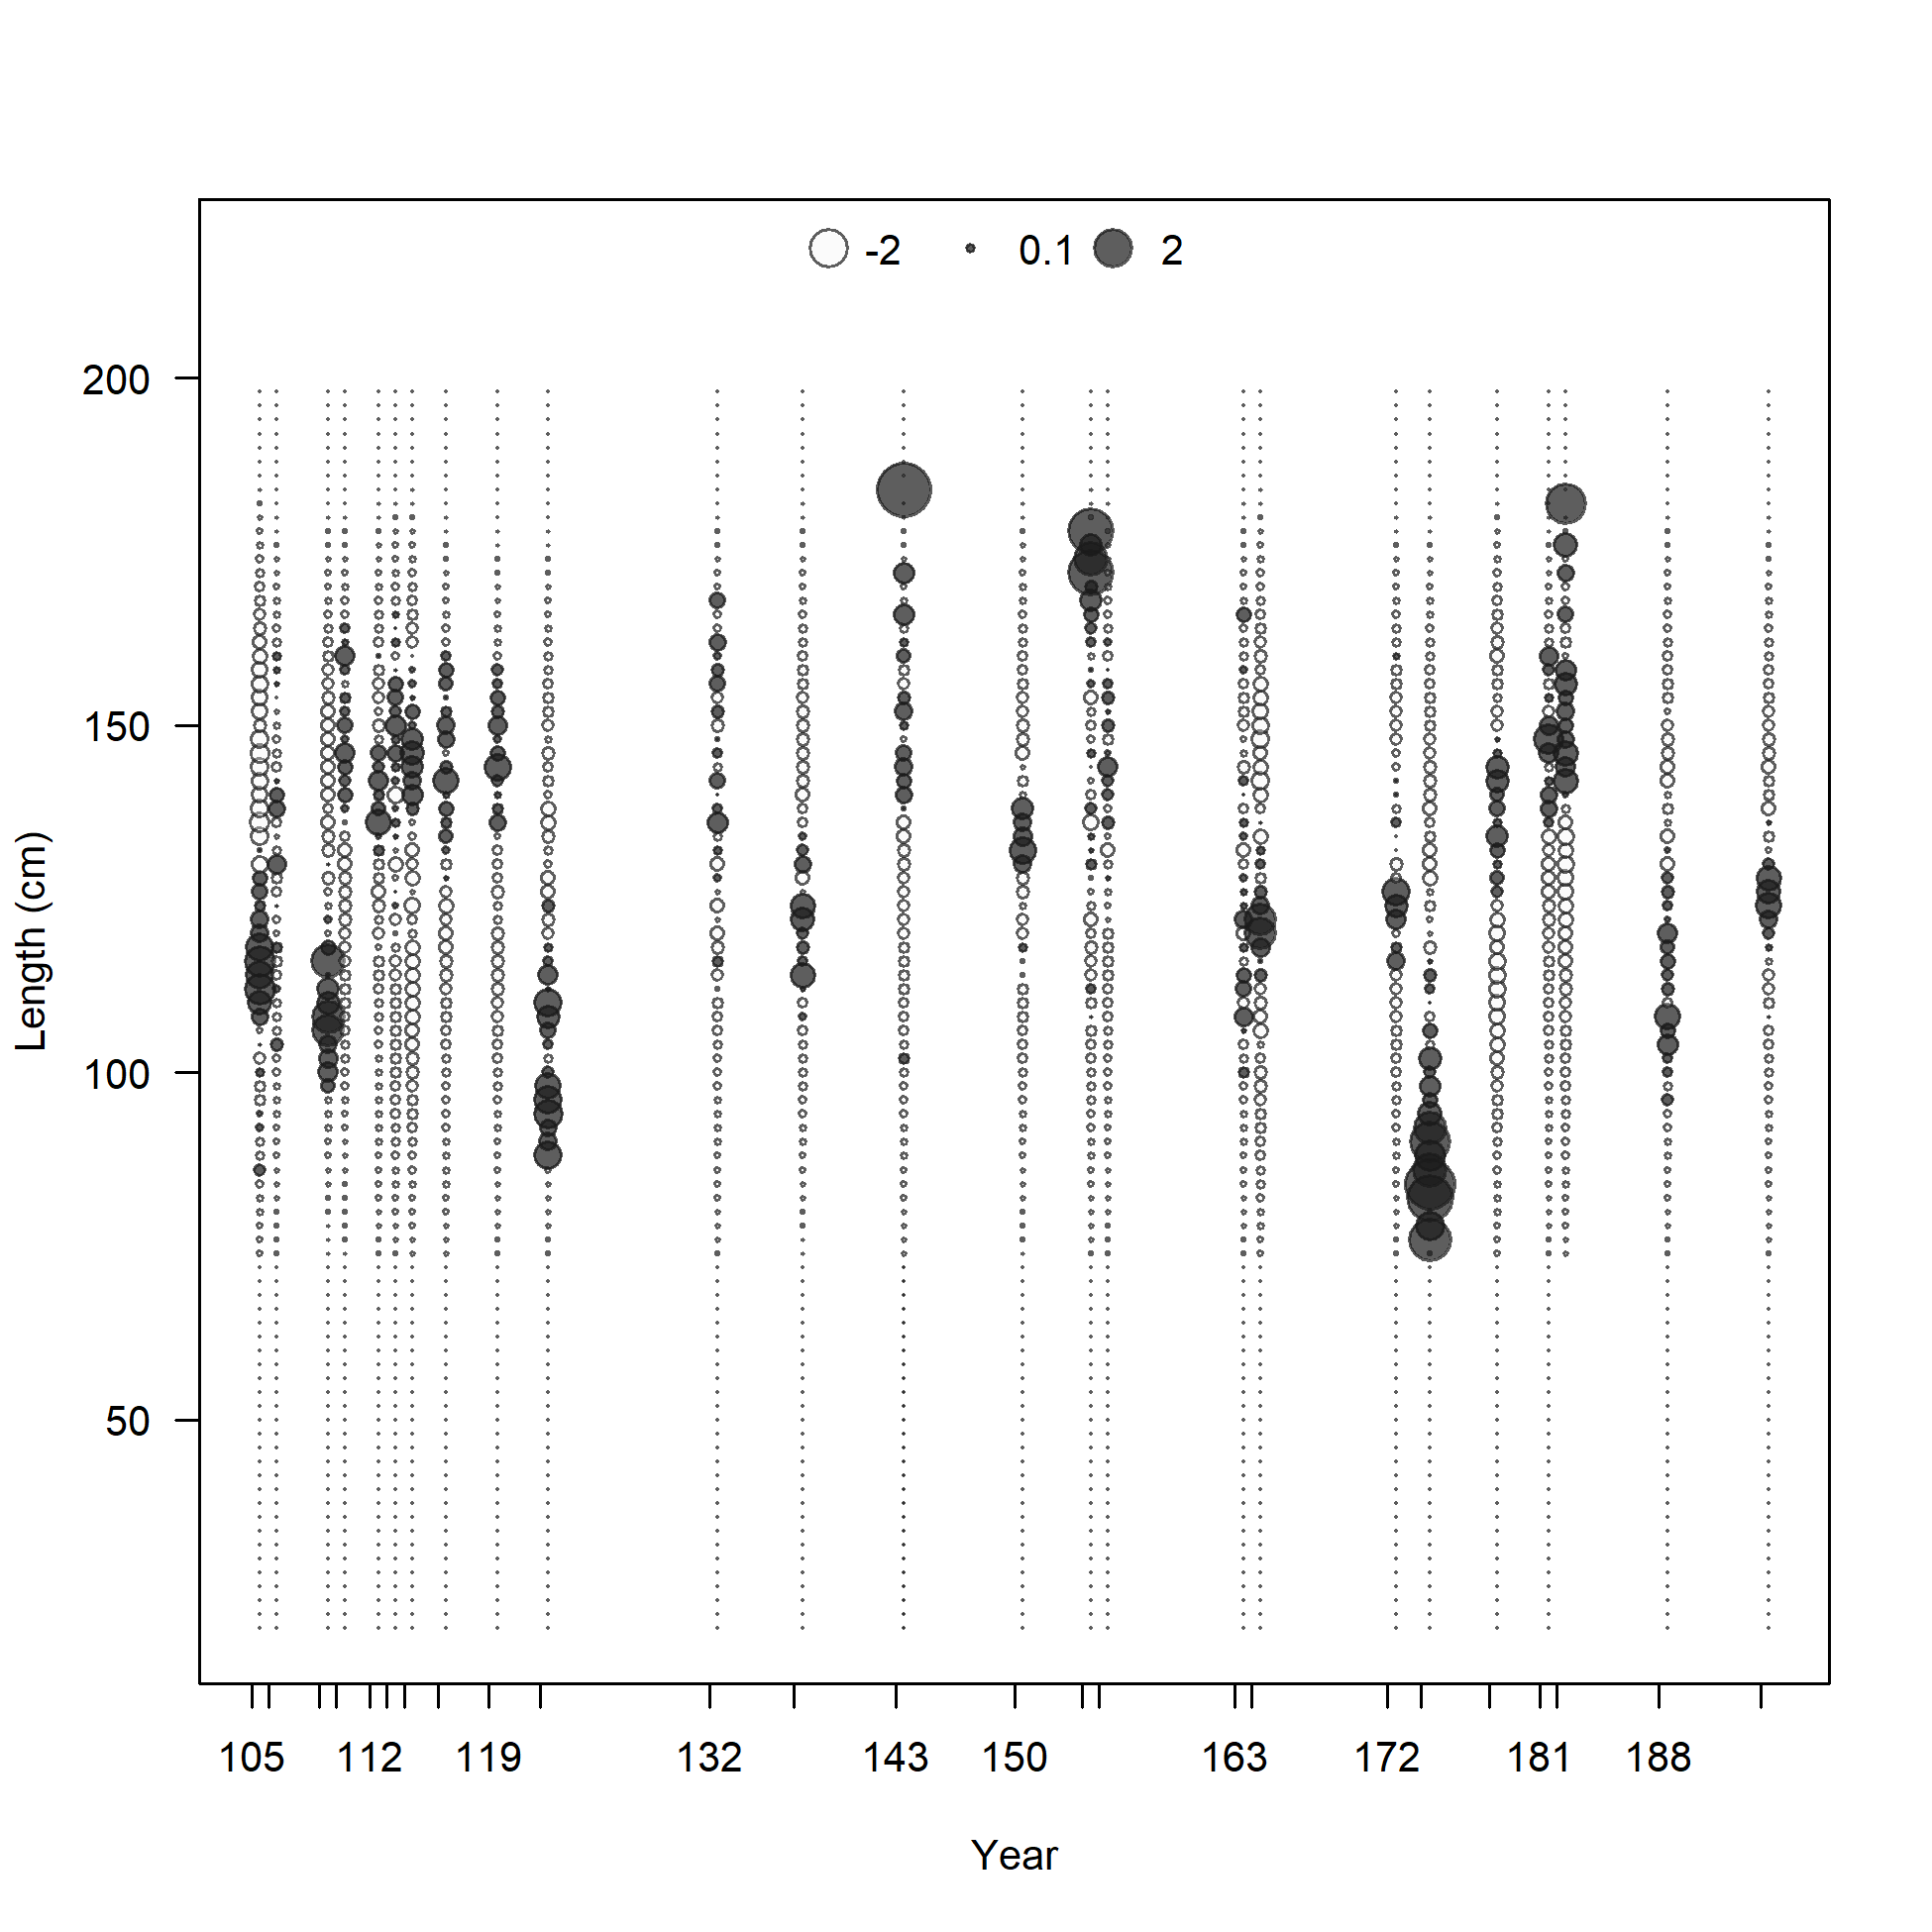
Pearson residuals, retained, F10_PS_NOA_Offshore_large (max=3.93) (plot 2 of 2)
Closed bubbles are positive residuals (observed > expected) and open bubbles are negative residuals (observed < expected).
file: comp_lenfit_residsflt10mkt2_page2.png
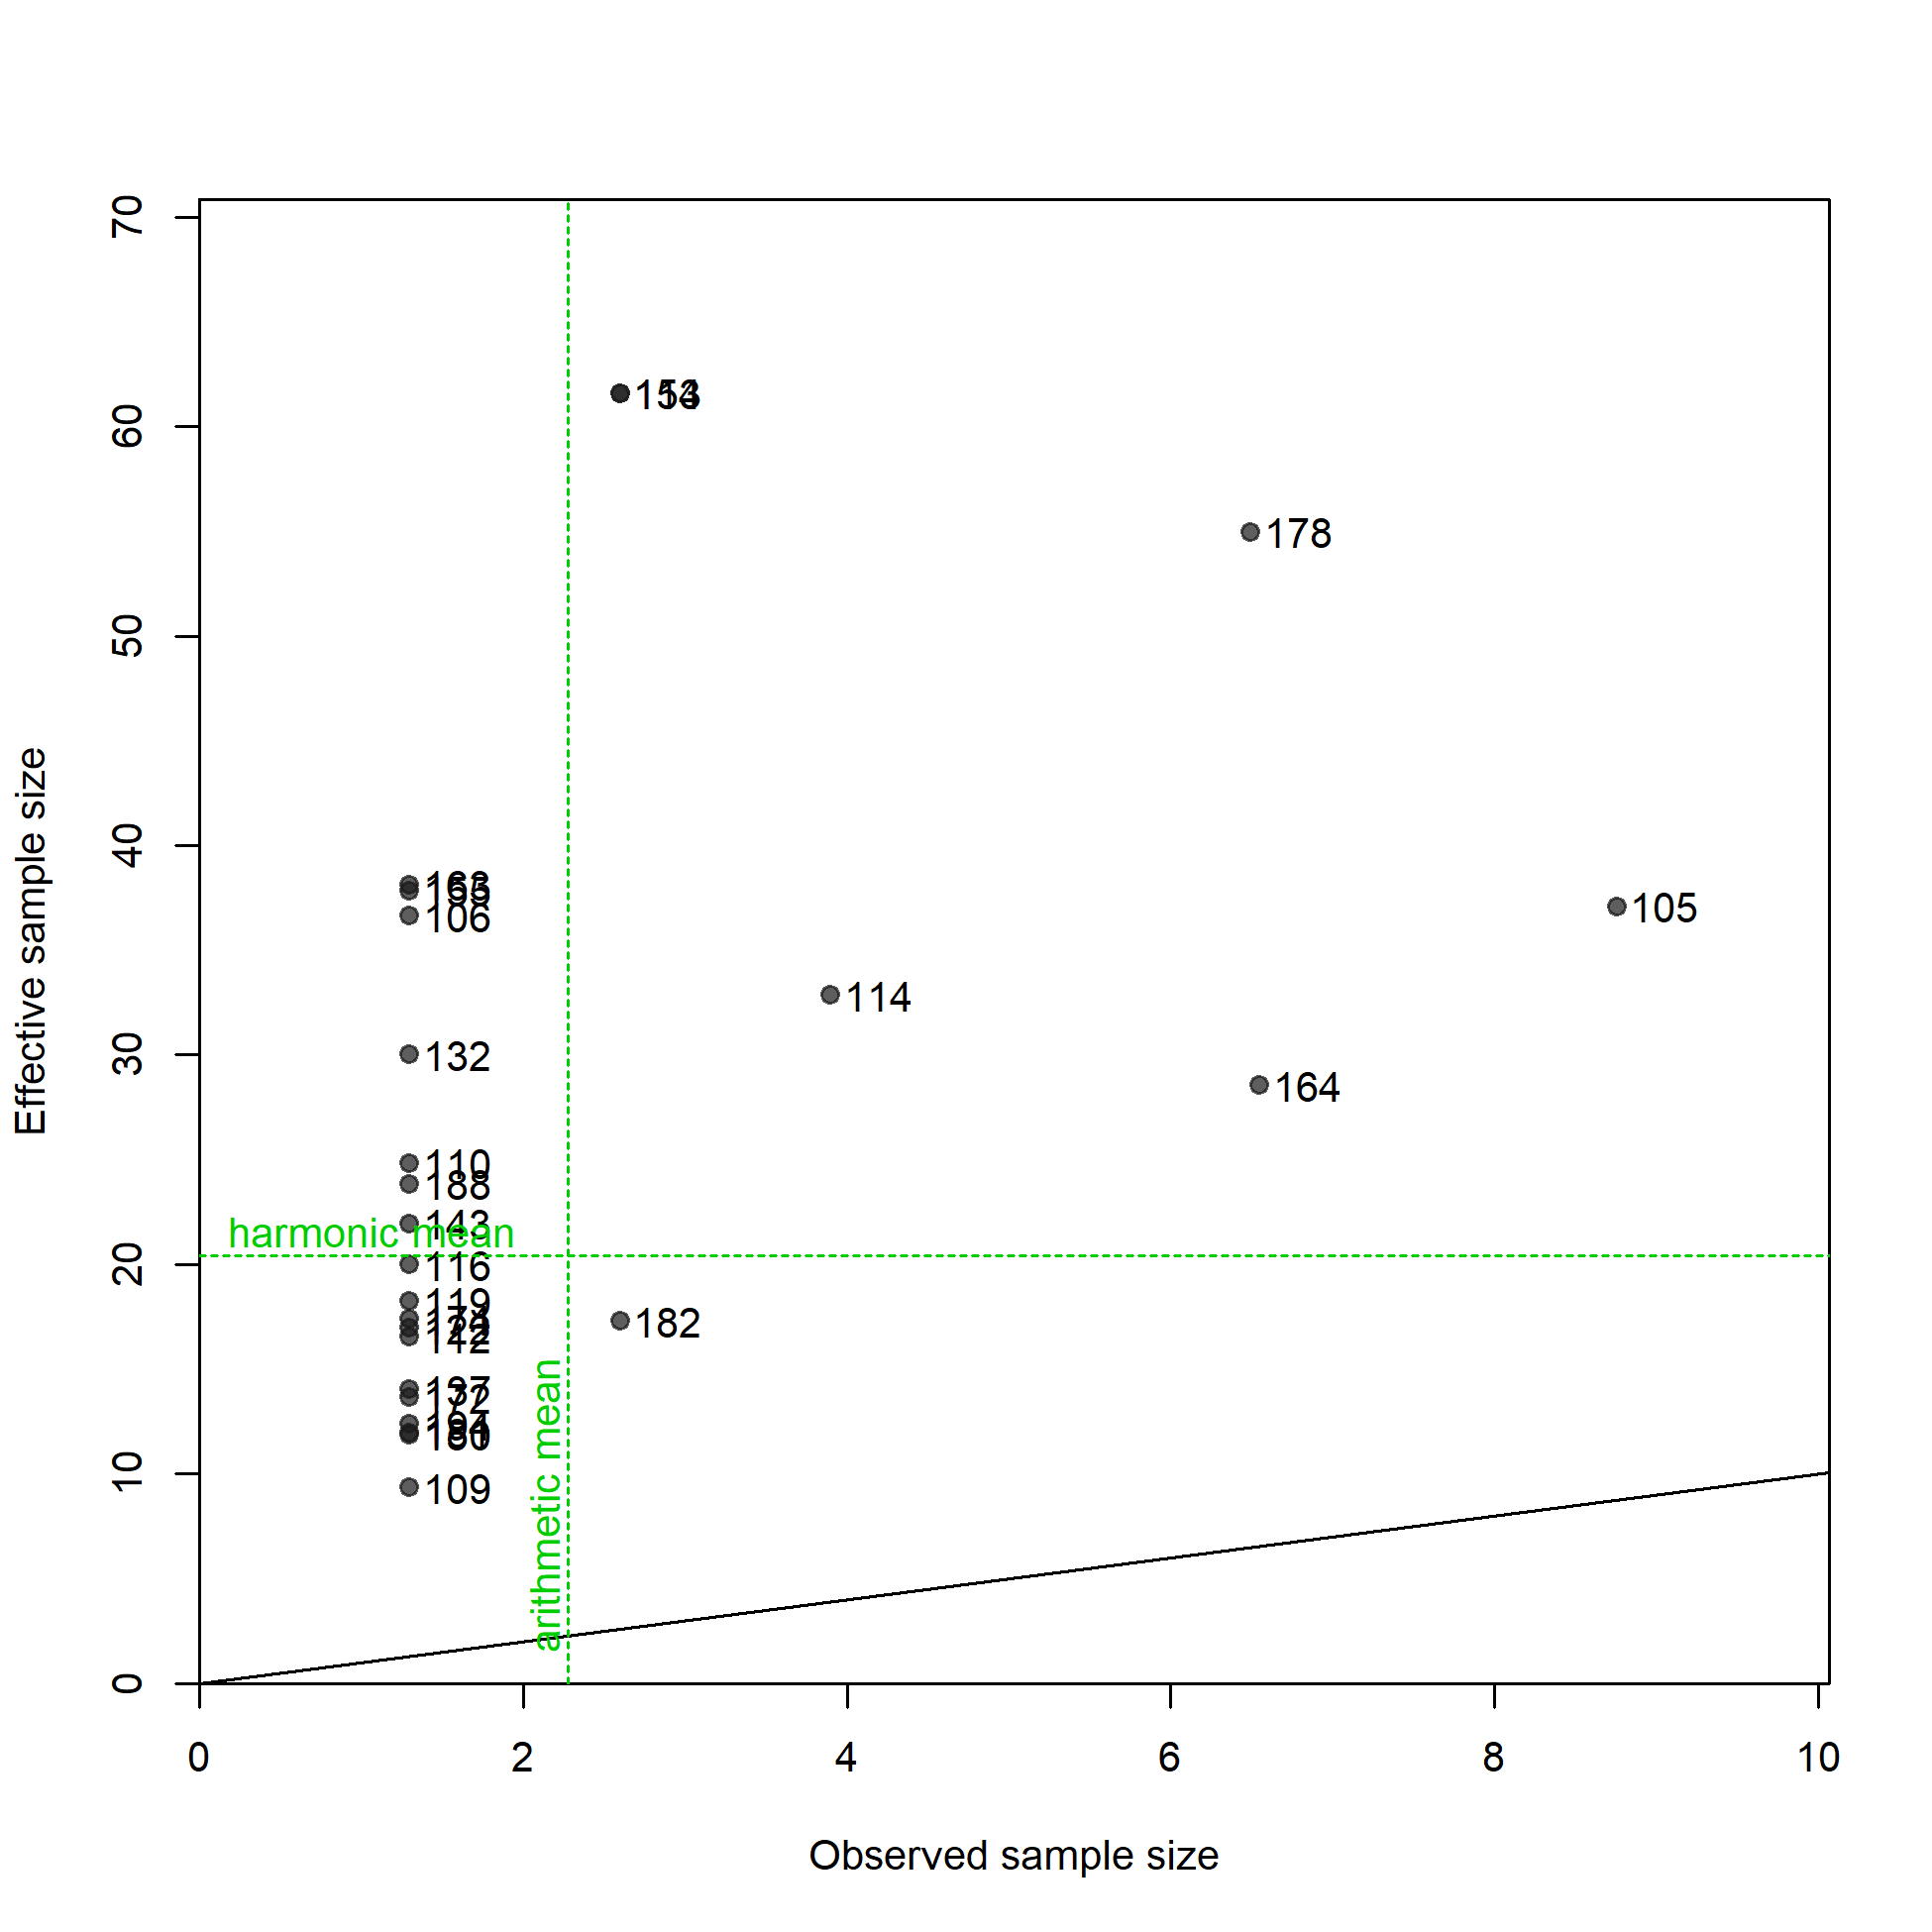
N-EffN comparison, Length comps, retained, F10_PS_NOA_Offshore_large
file: comp_lenfit_sampsize_flt10mkt2.png
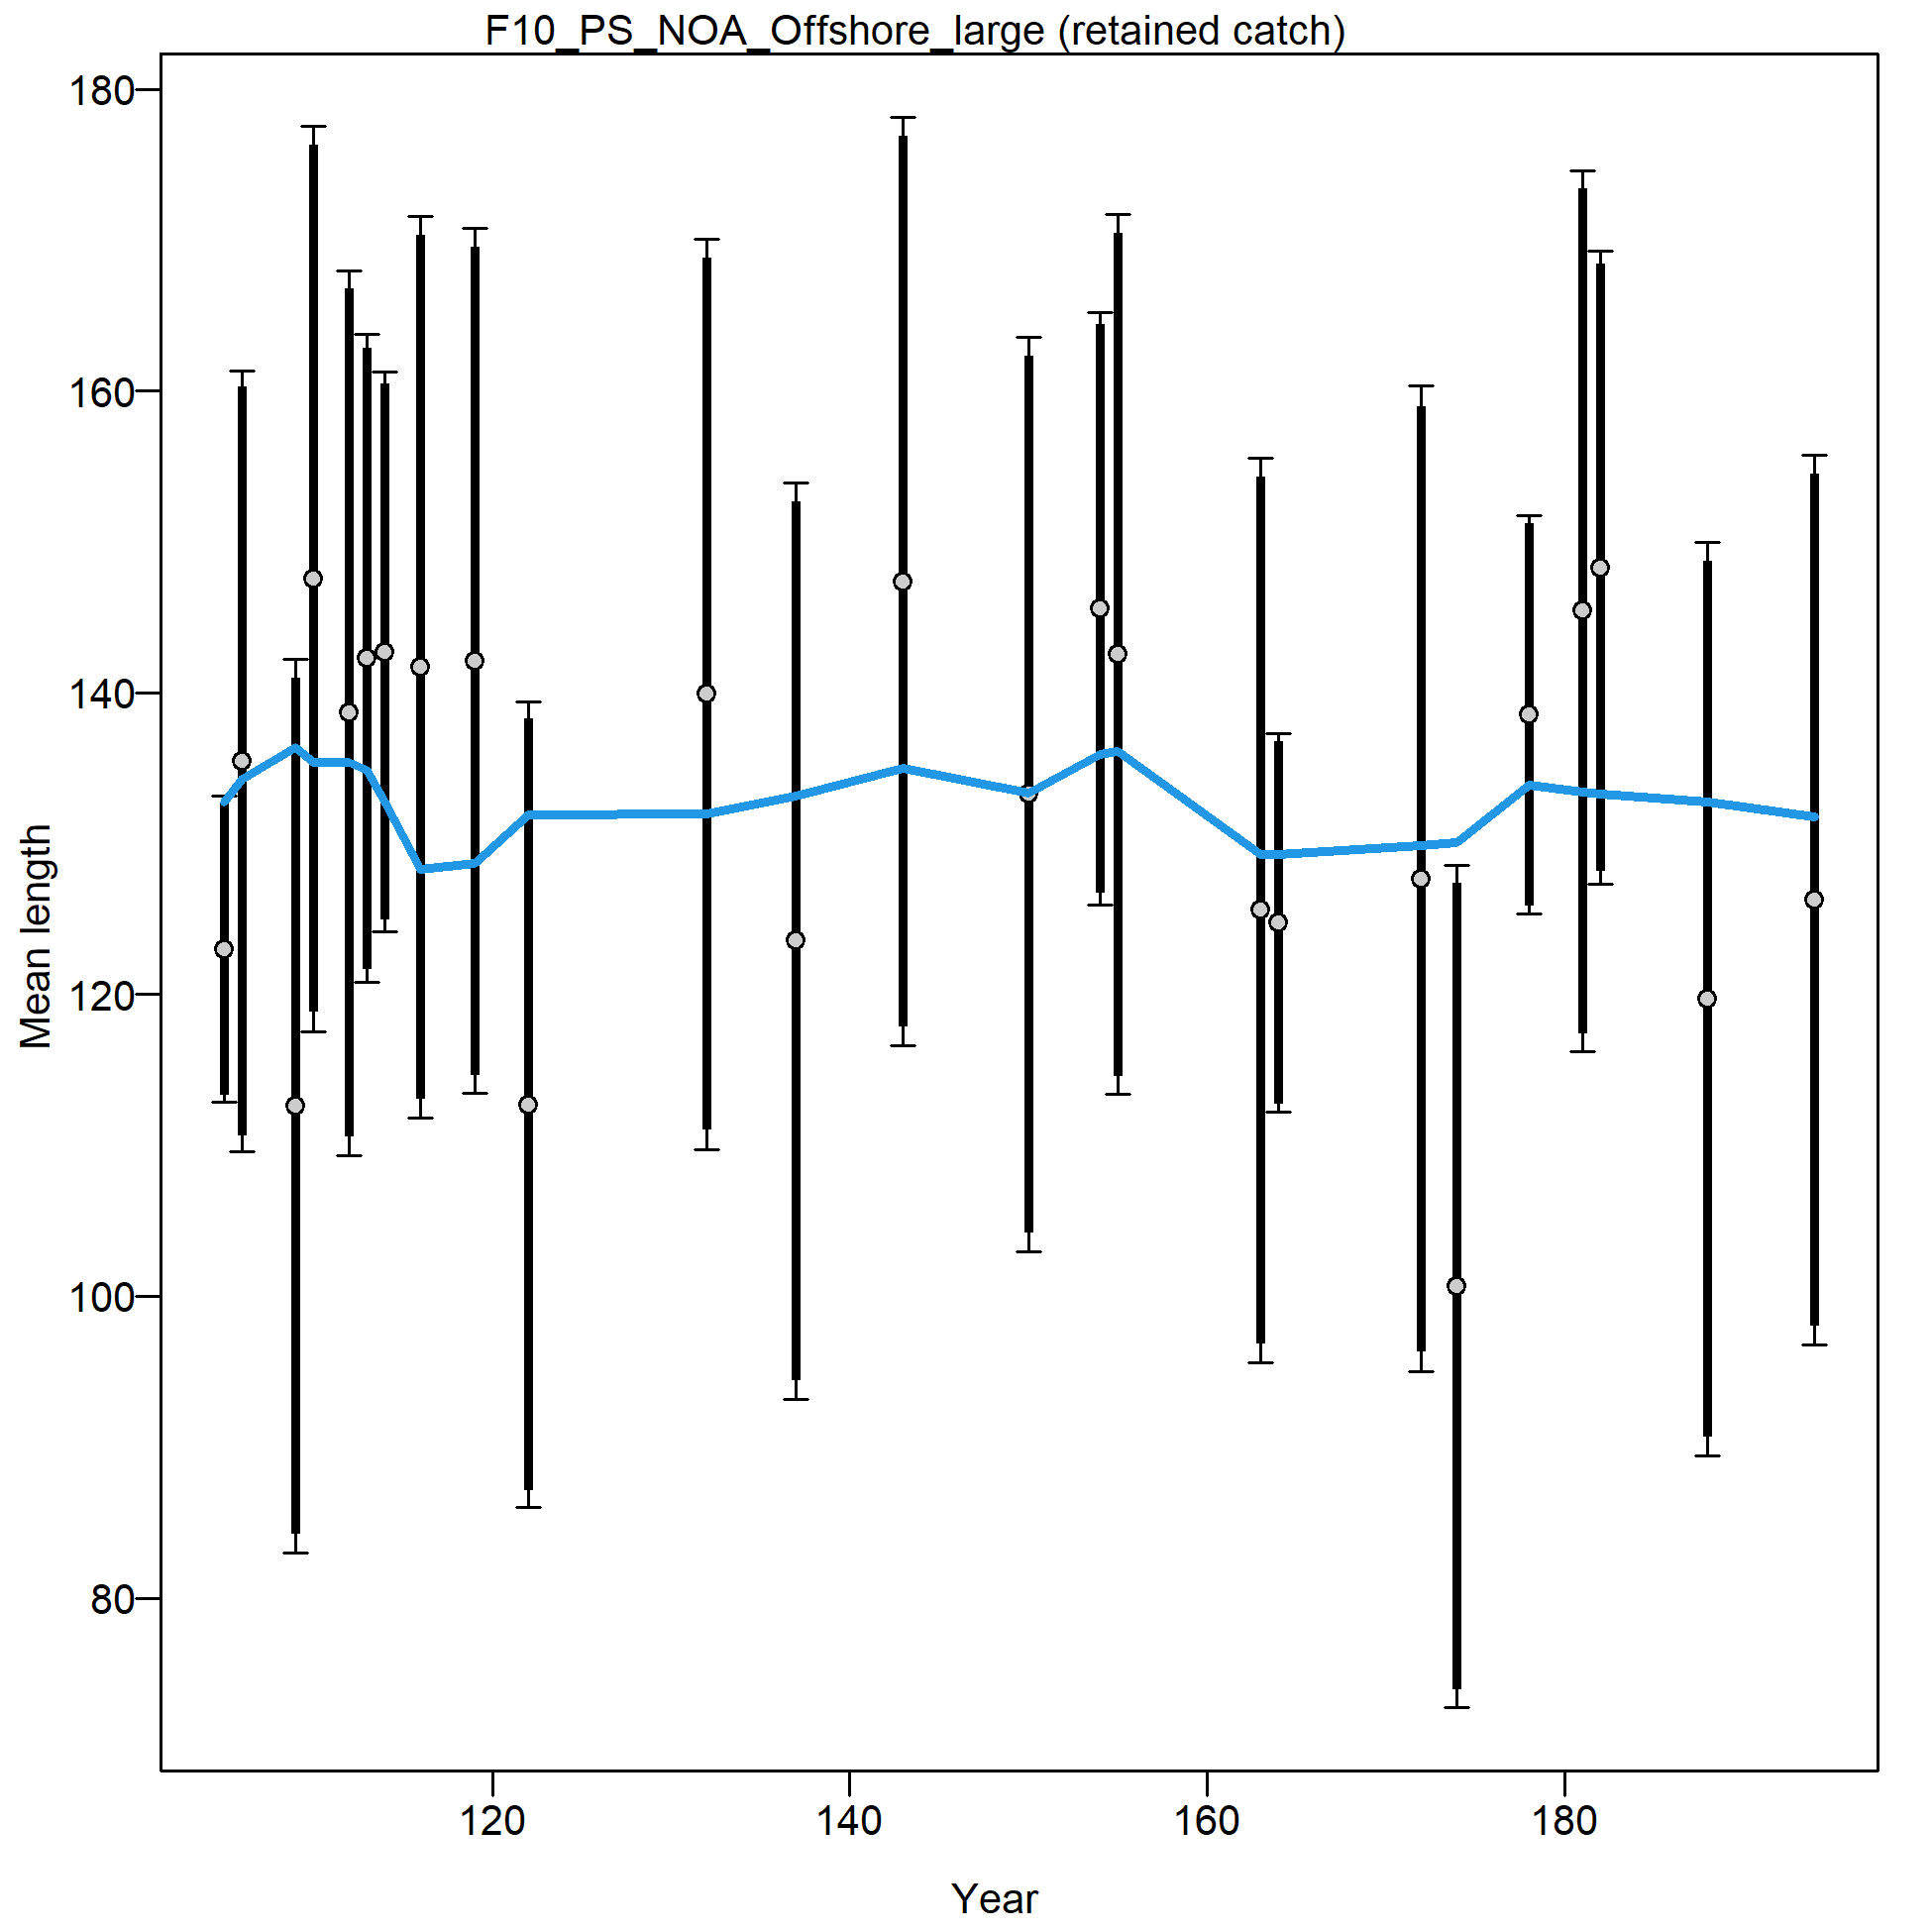
Mean length for F10_PS_NOA_Offshore_large with 95% confidence intervals based on current sample sizes.
Francis data weighting method TA1.8: thinner intervals (with capped ends) show result of further adjusting sample sizes based on suggested multiplier (with 95% interval) for len data from F10_PS_NOA_Offshore_large:
0.9183 (0.6566-1.9555)
For more info, see Francis (2011).
file: comp_lenfit_data_weighting_TA1-8_F10_PS_NOA_Offshore_large.png
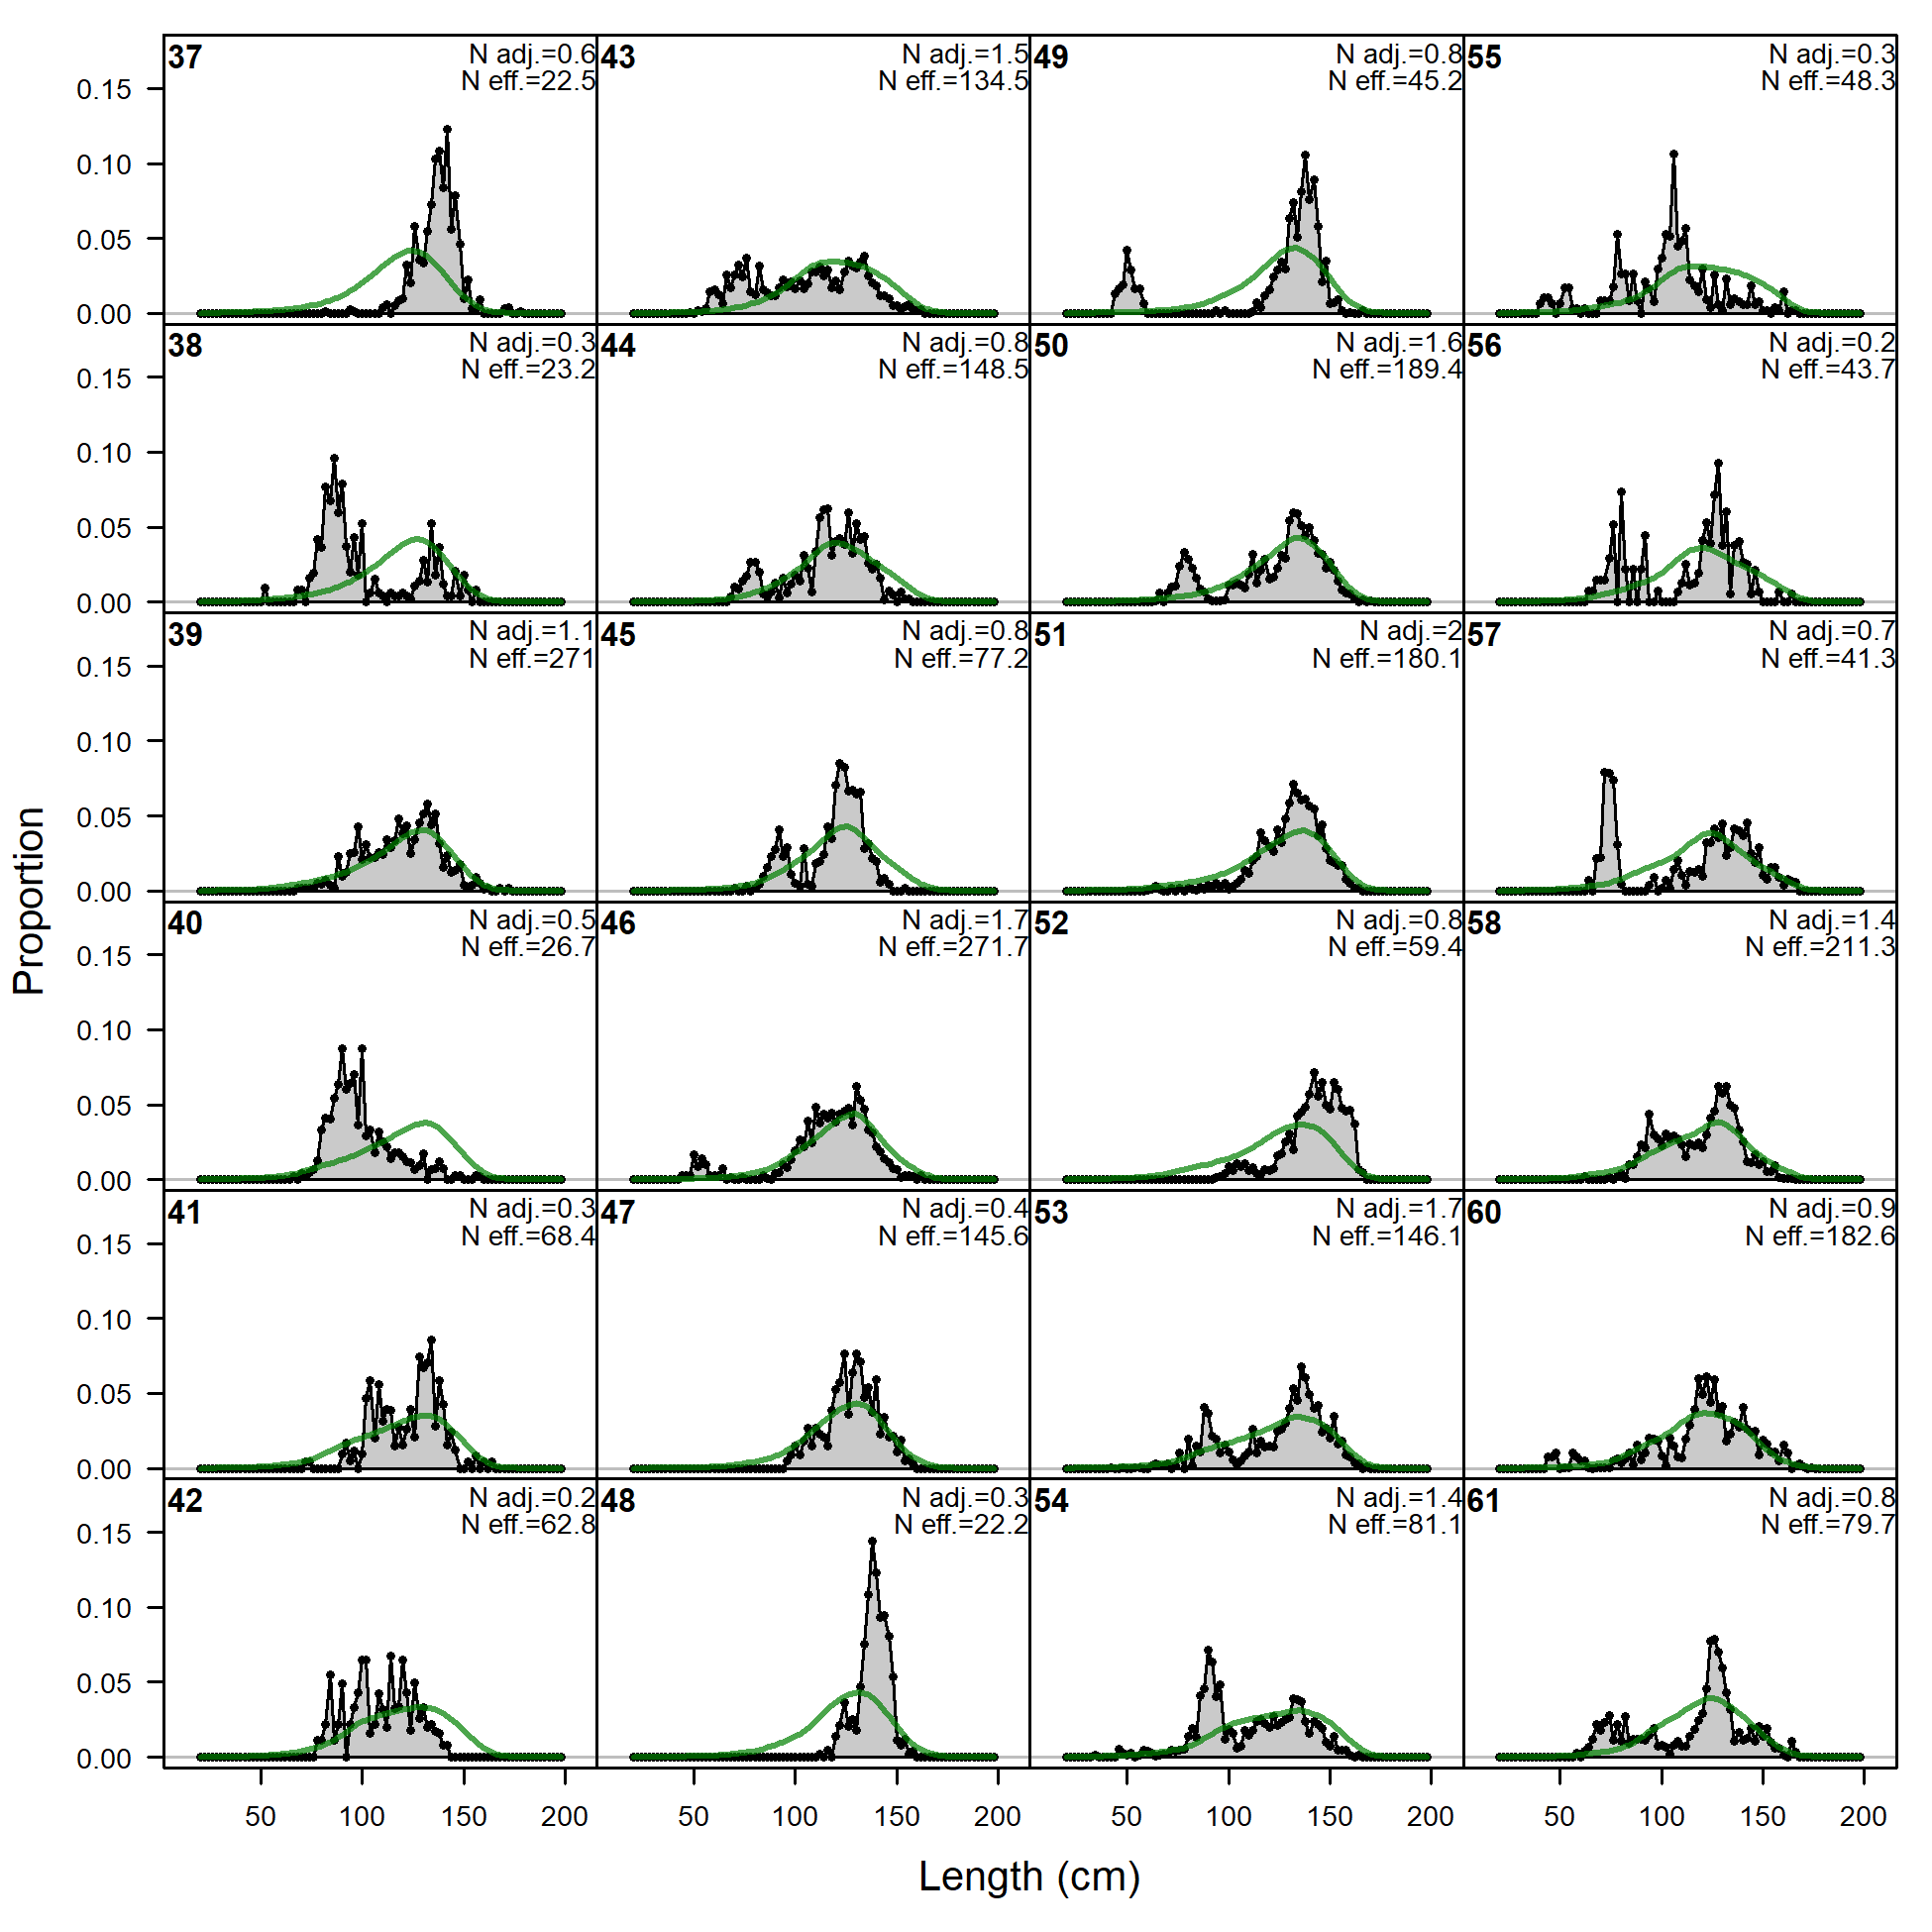
Length comps, whole catch, F13_PS_NOA_South_coastal (plot 1 of 3).
'N adj.' is the input sample size after data-weighting adjustment. N eff. is the calculated effective sample size used in the McAllister-Ianelli tuning method.
file: comp_lenfit_flt13mkt0_page1.png
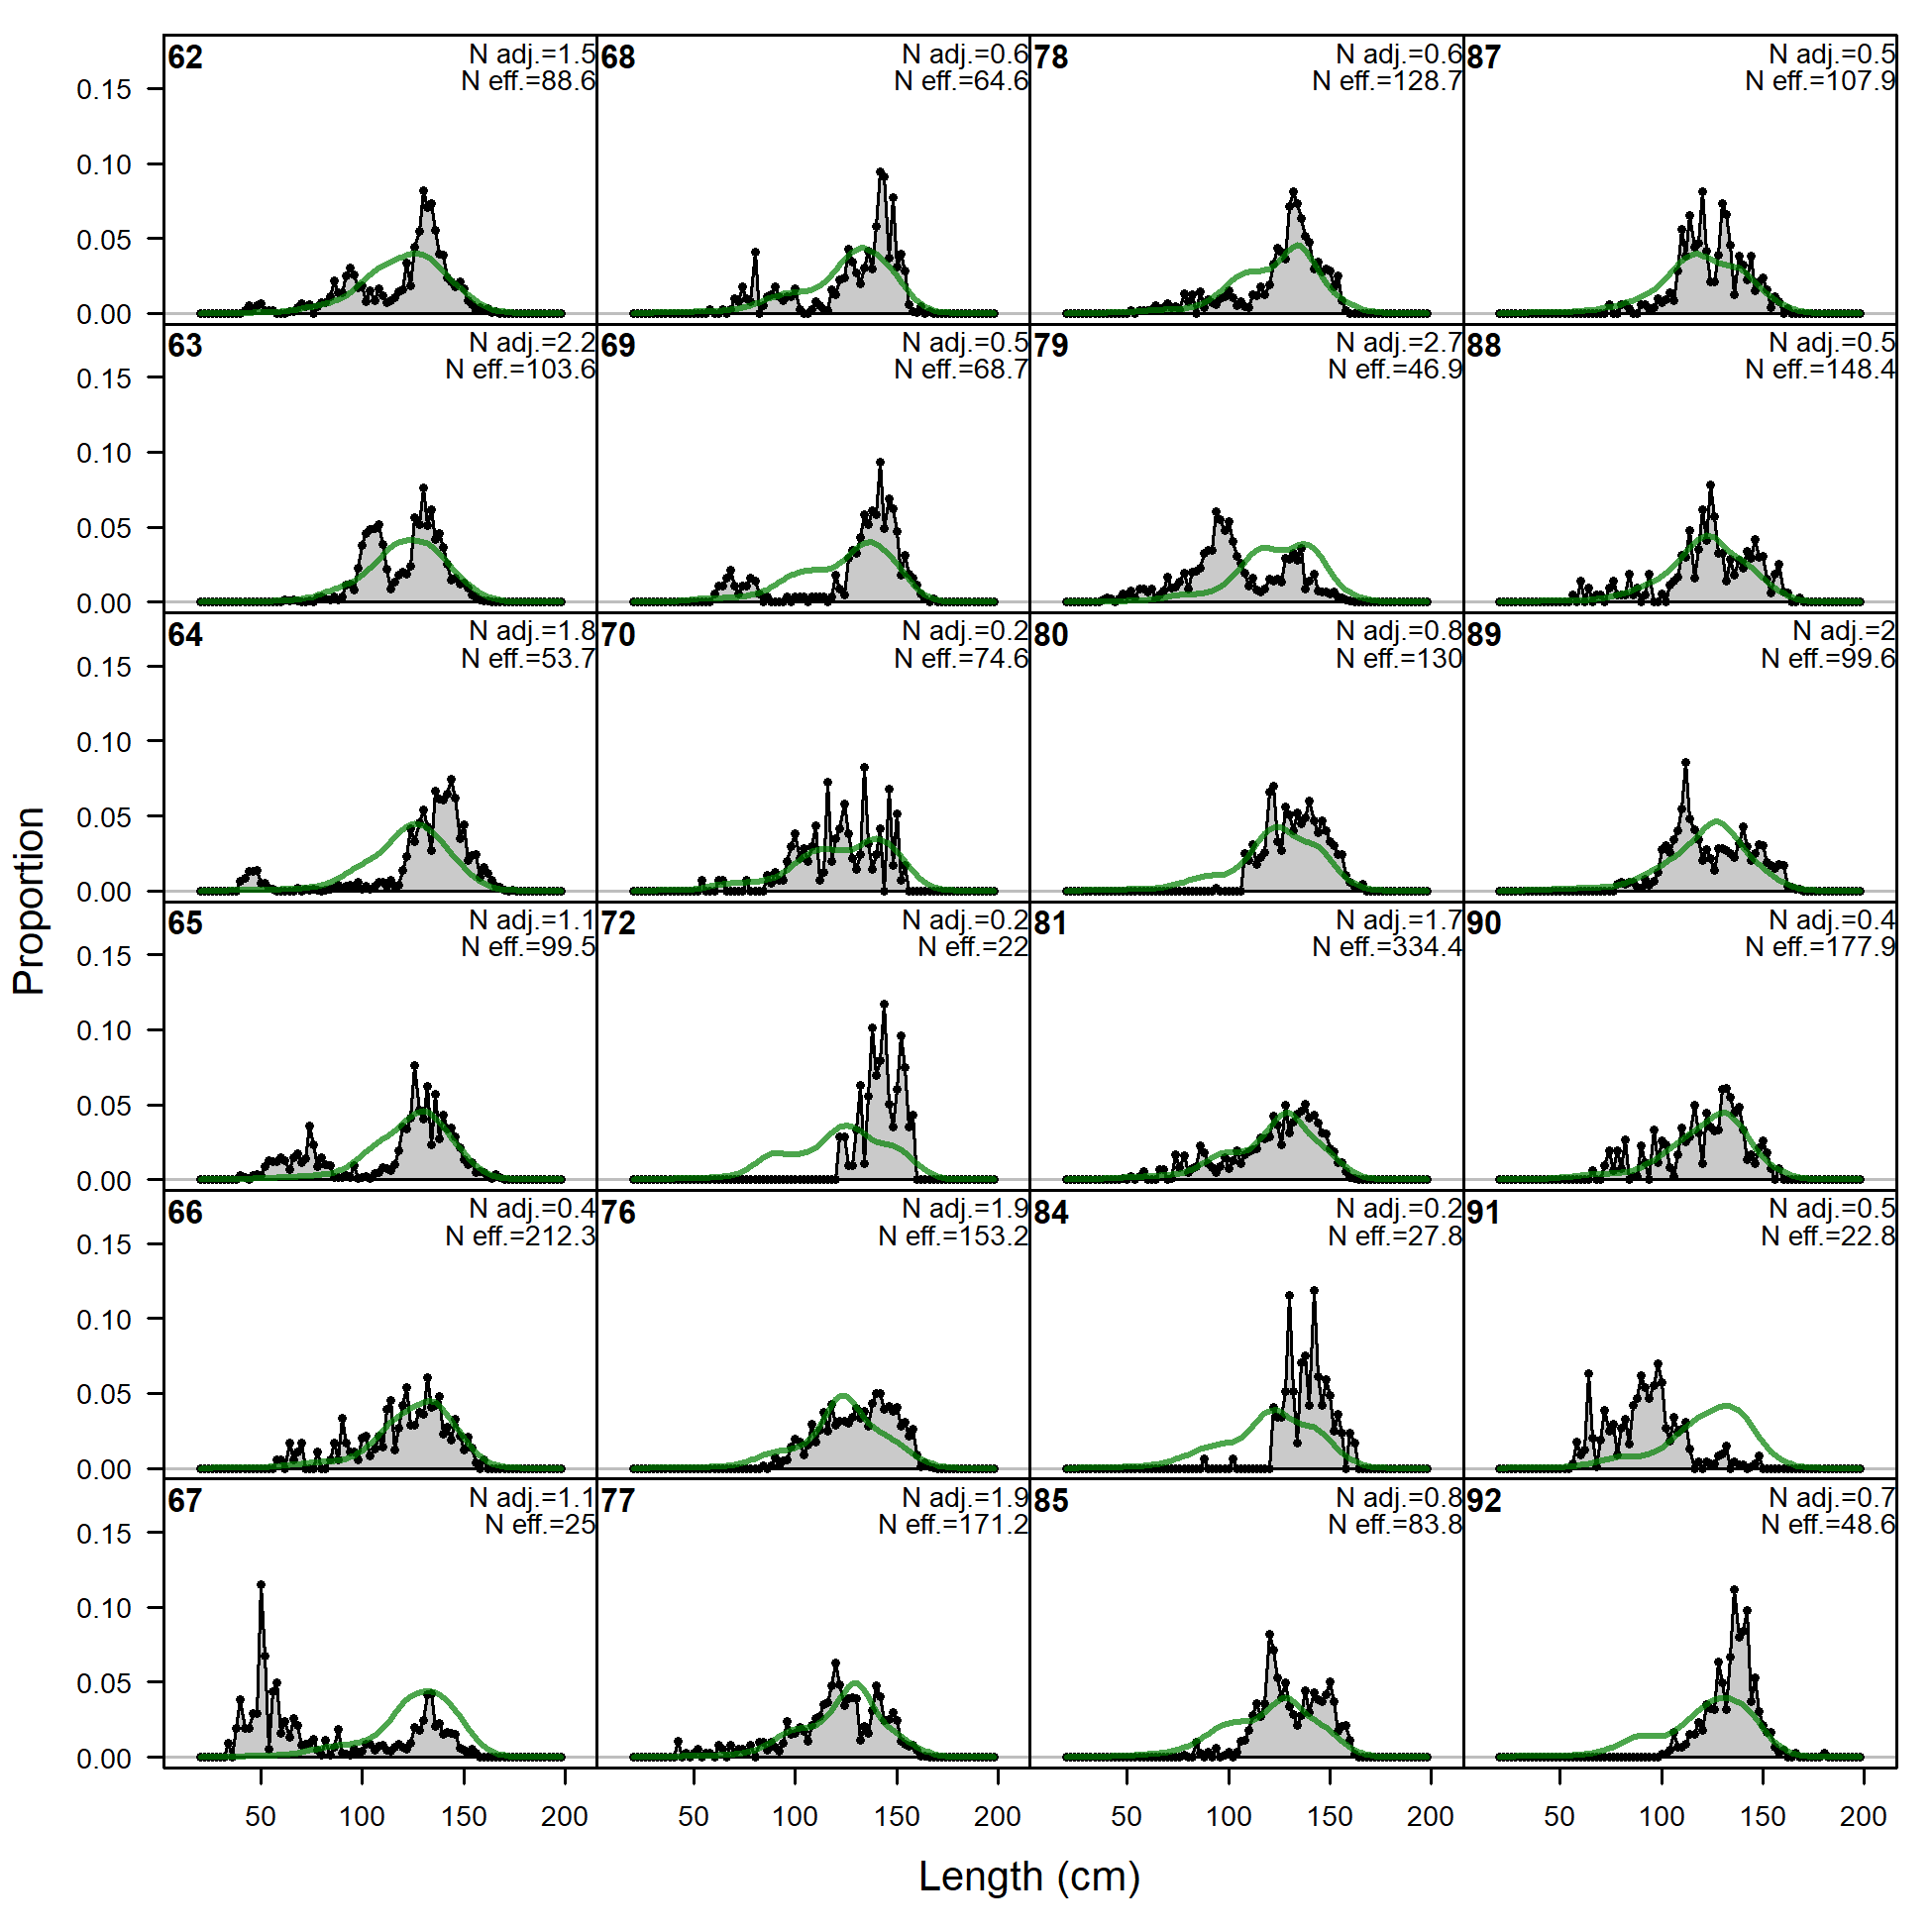
Length comps, whole catch, F13_PS_NOA_South_coastal (plot 1 of 3).
'N adj.' is the input sample size after data-weighting adjustment. N eff. is the calculated effective sample size used in the McAllister-Ianelli tuning method. (plot 2 of 3)
file: comp_lenfit_flt13mkt0_page2.png
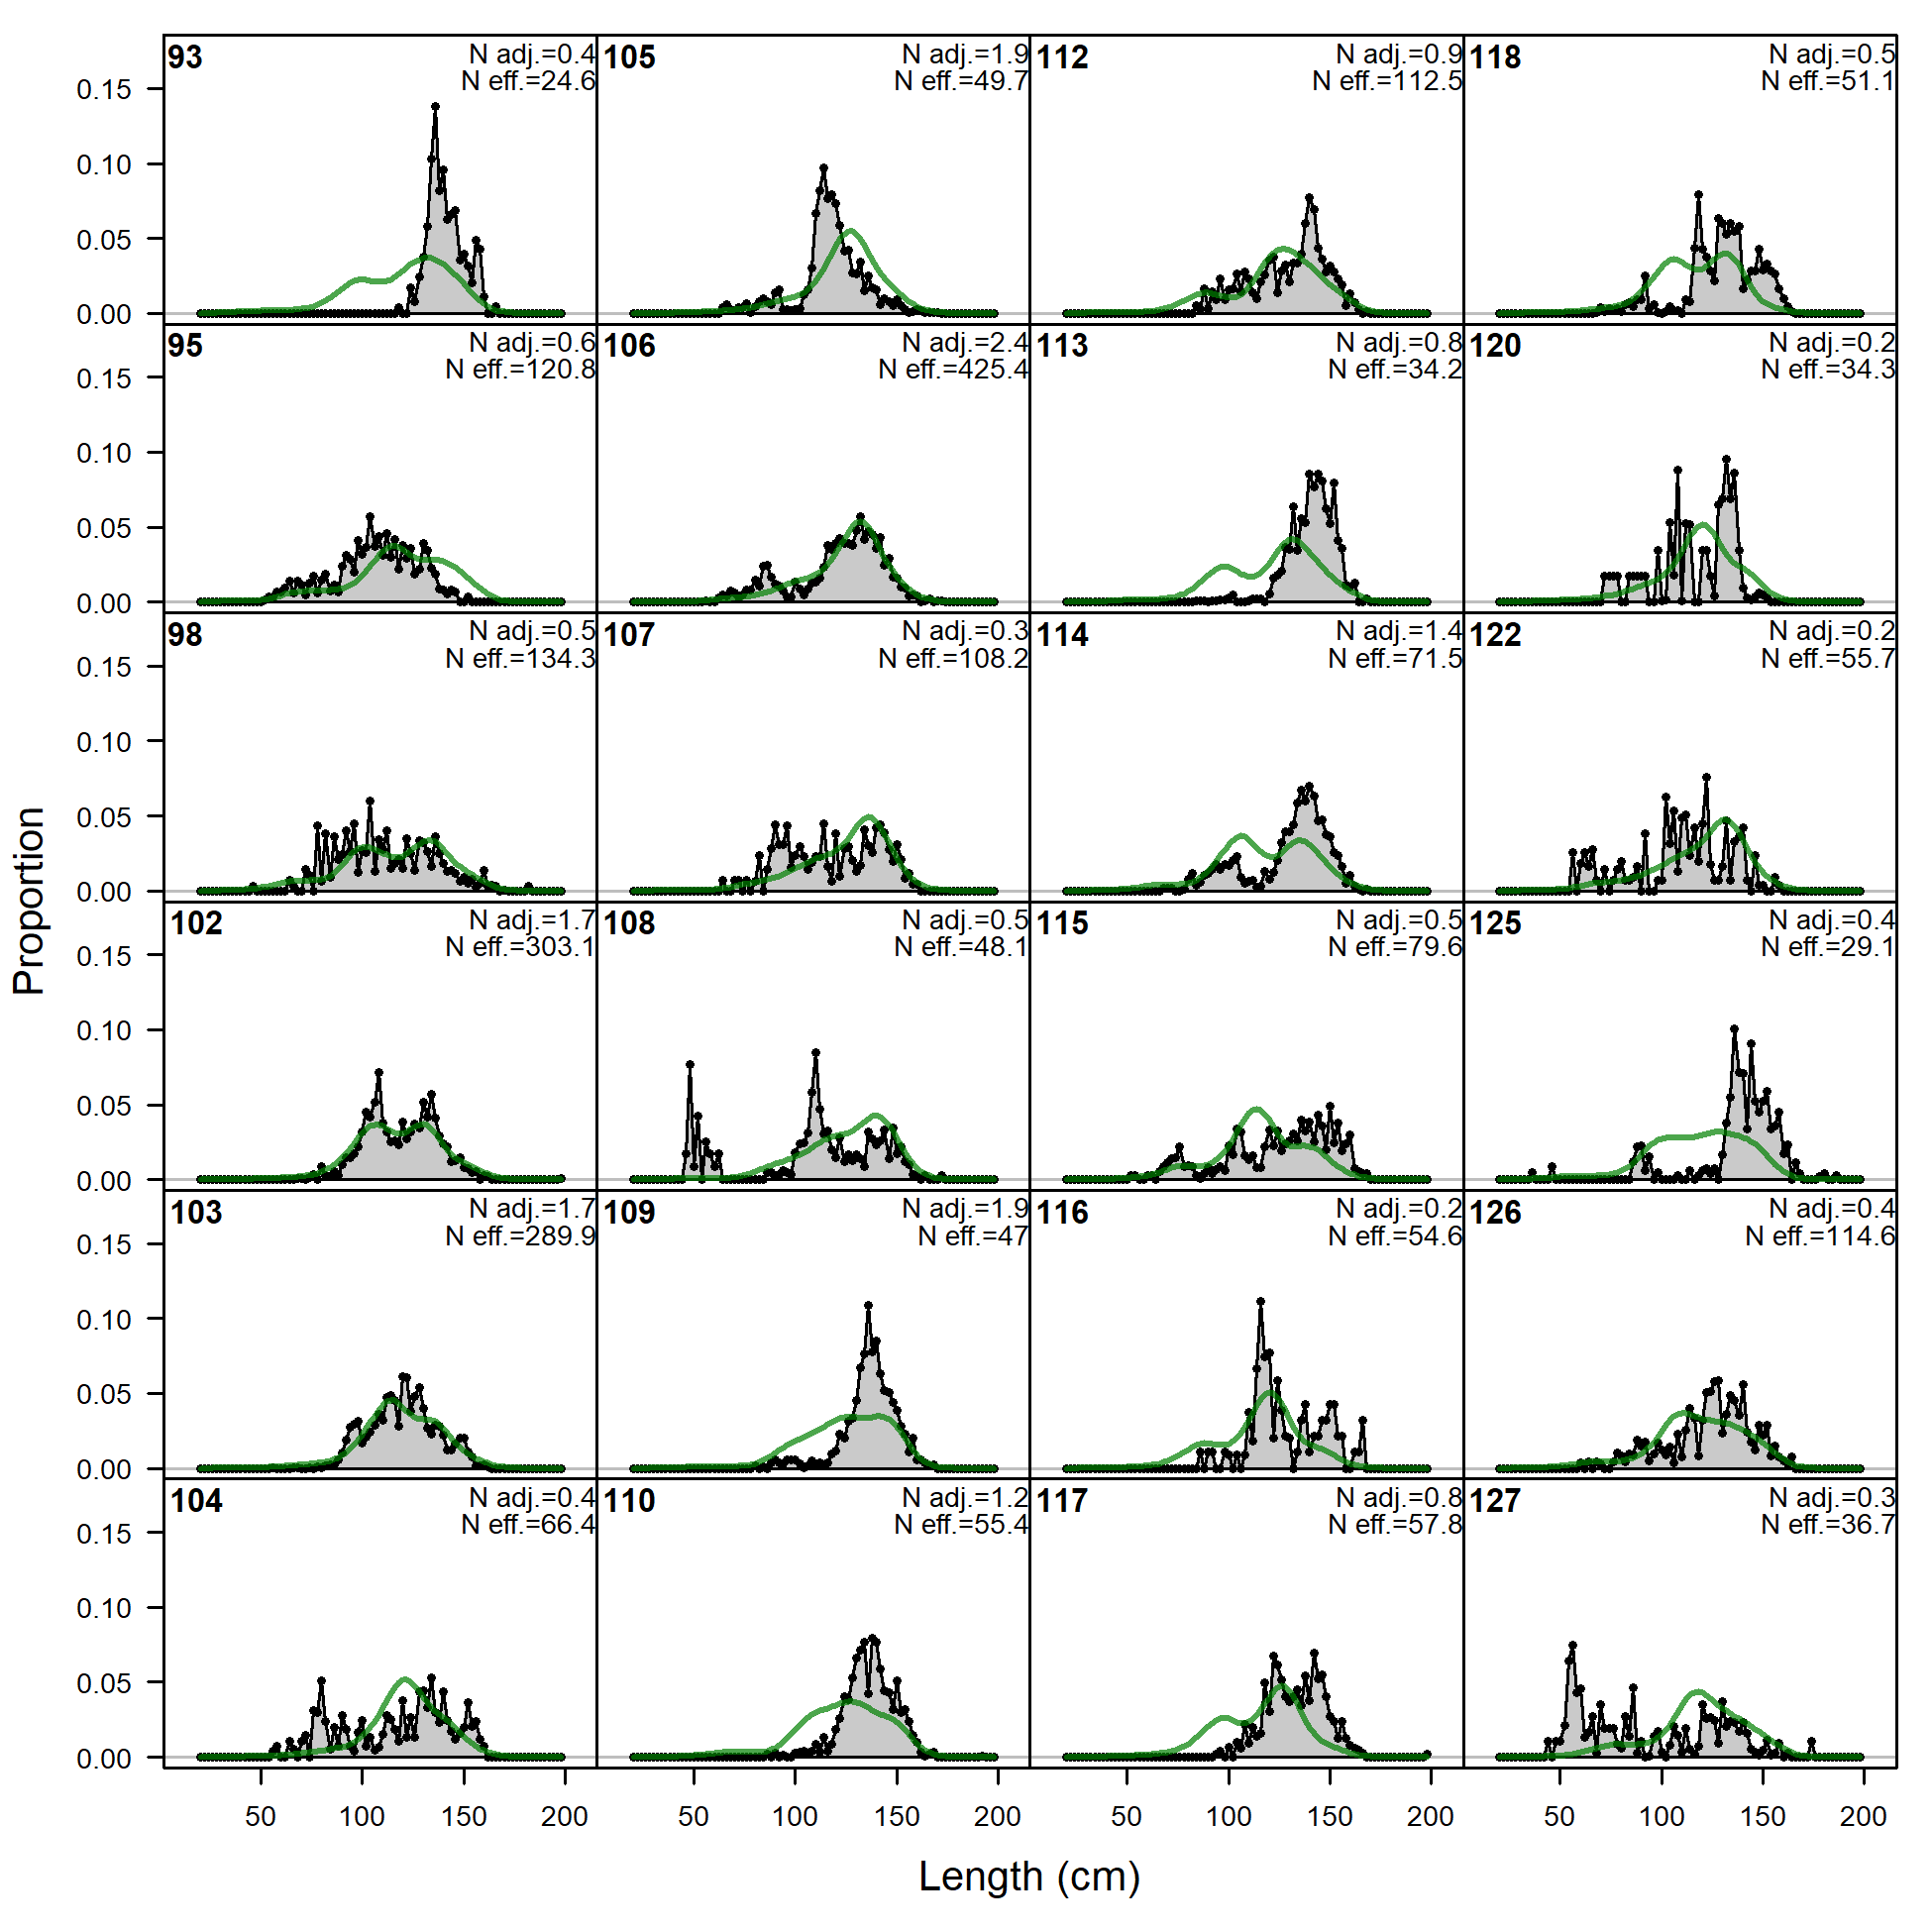
Length comps, whole catch, F13_PS_NOA_South_coastal (plot 1 of 3).
'N adj.' is the input sample size after data-weighting adjustment. N eff. is the calculated effective sample size used in the McAllister-Ianelli tuning method. (plot 2 of 3) (plot 3 of 3)
file: comp_lenfit_flt13mkt0_page3.png
Pearson residuals, whole catch, F13_PS_NOA_South_coastal (max=5.76) (plot 3 of 3)
Closed bubbles are positive residuals (observed > expected) and open bubbles are negative residuals (observed < expected).
file: comp_lenfit_residsflt13mkt0_page3.png
N-EffN comparison, Length comps, whole catch, F13_PS_NOA_South_coastal
file: comp_lenfit_sampsize_flt13mkt0.png
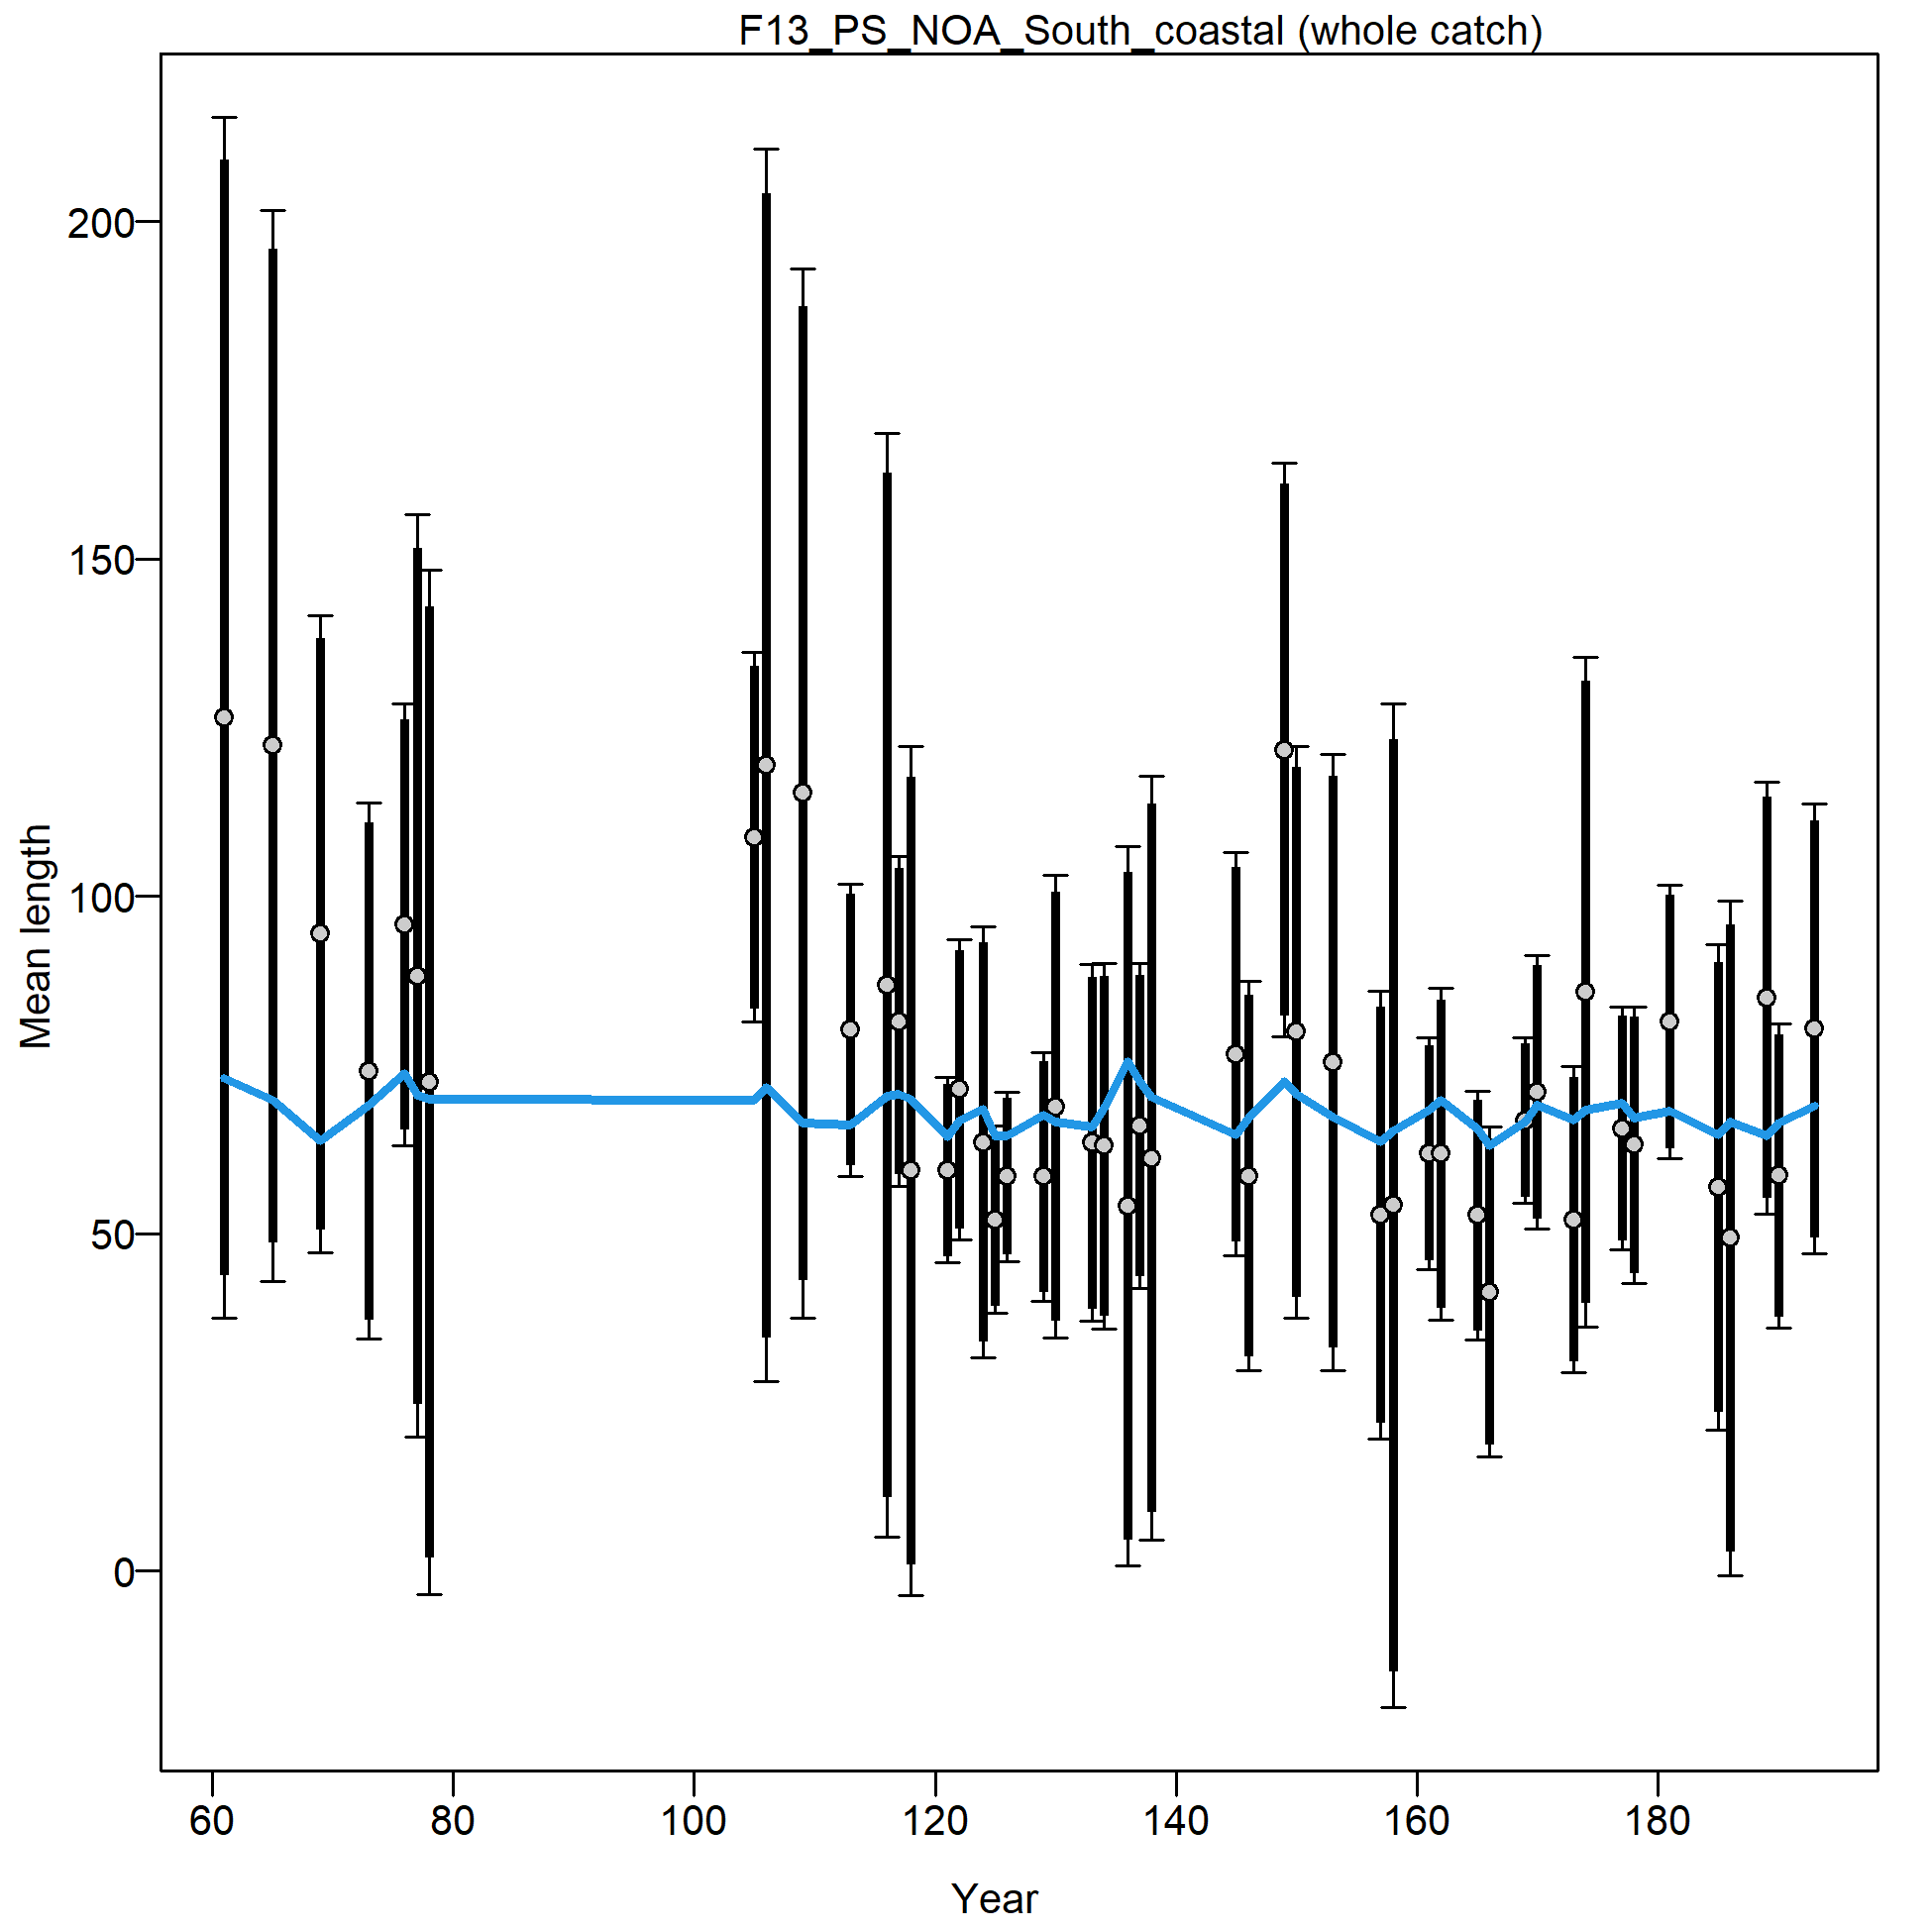
Mean length for F13_PS_NOA_South_coastal with 95% confidence intervals based on current sample sizes.
Francis data weighting method TA1.8: thinner intervals (with capped ends) show result of further adjusting sample sizes based on suggested multiplier (with 95% interval) for len data from F13_PS_NOA_South_coastal:
0.8617 (0.6172-1.3545)
For more info, see Francis (2011).
file: comp_lenfit_data_weighting_TA1-8_F13_PS_NOA_South_coastal.png
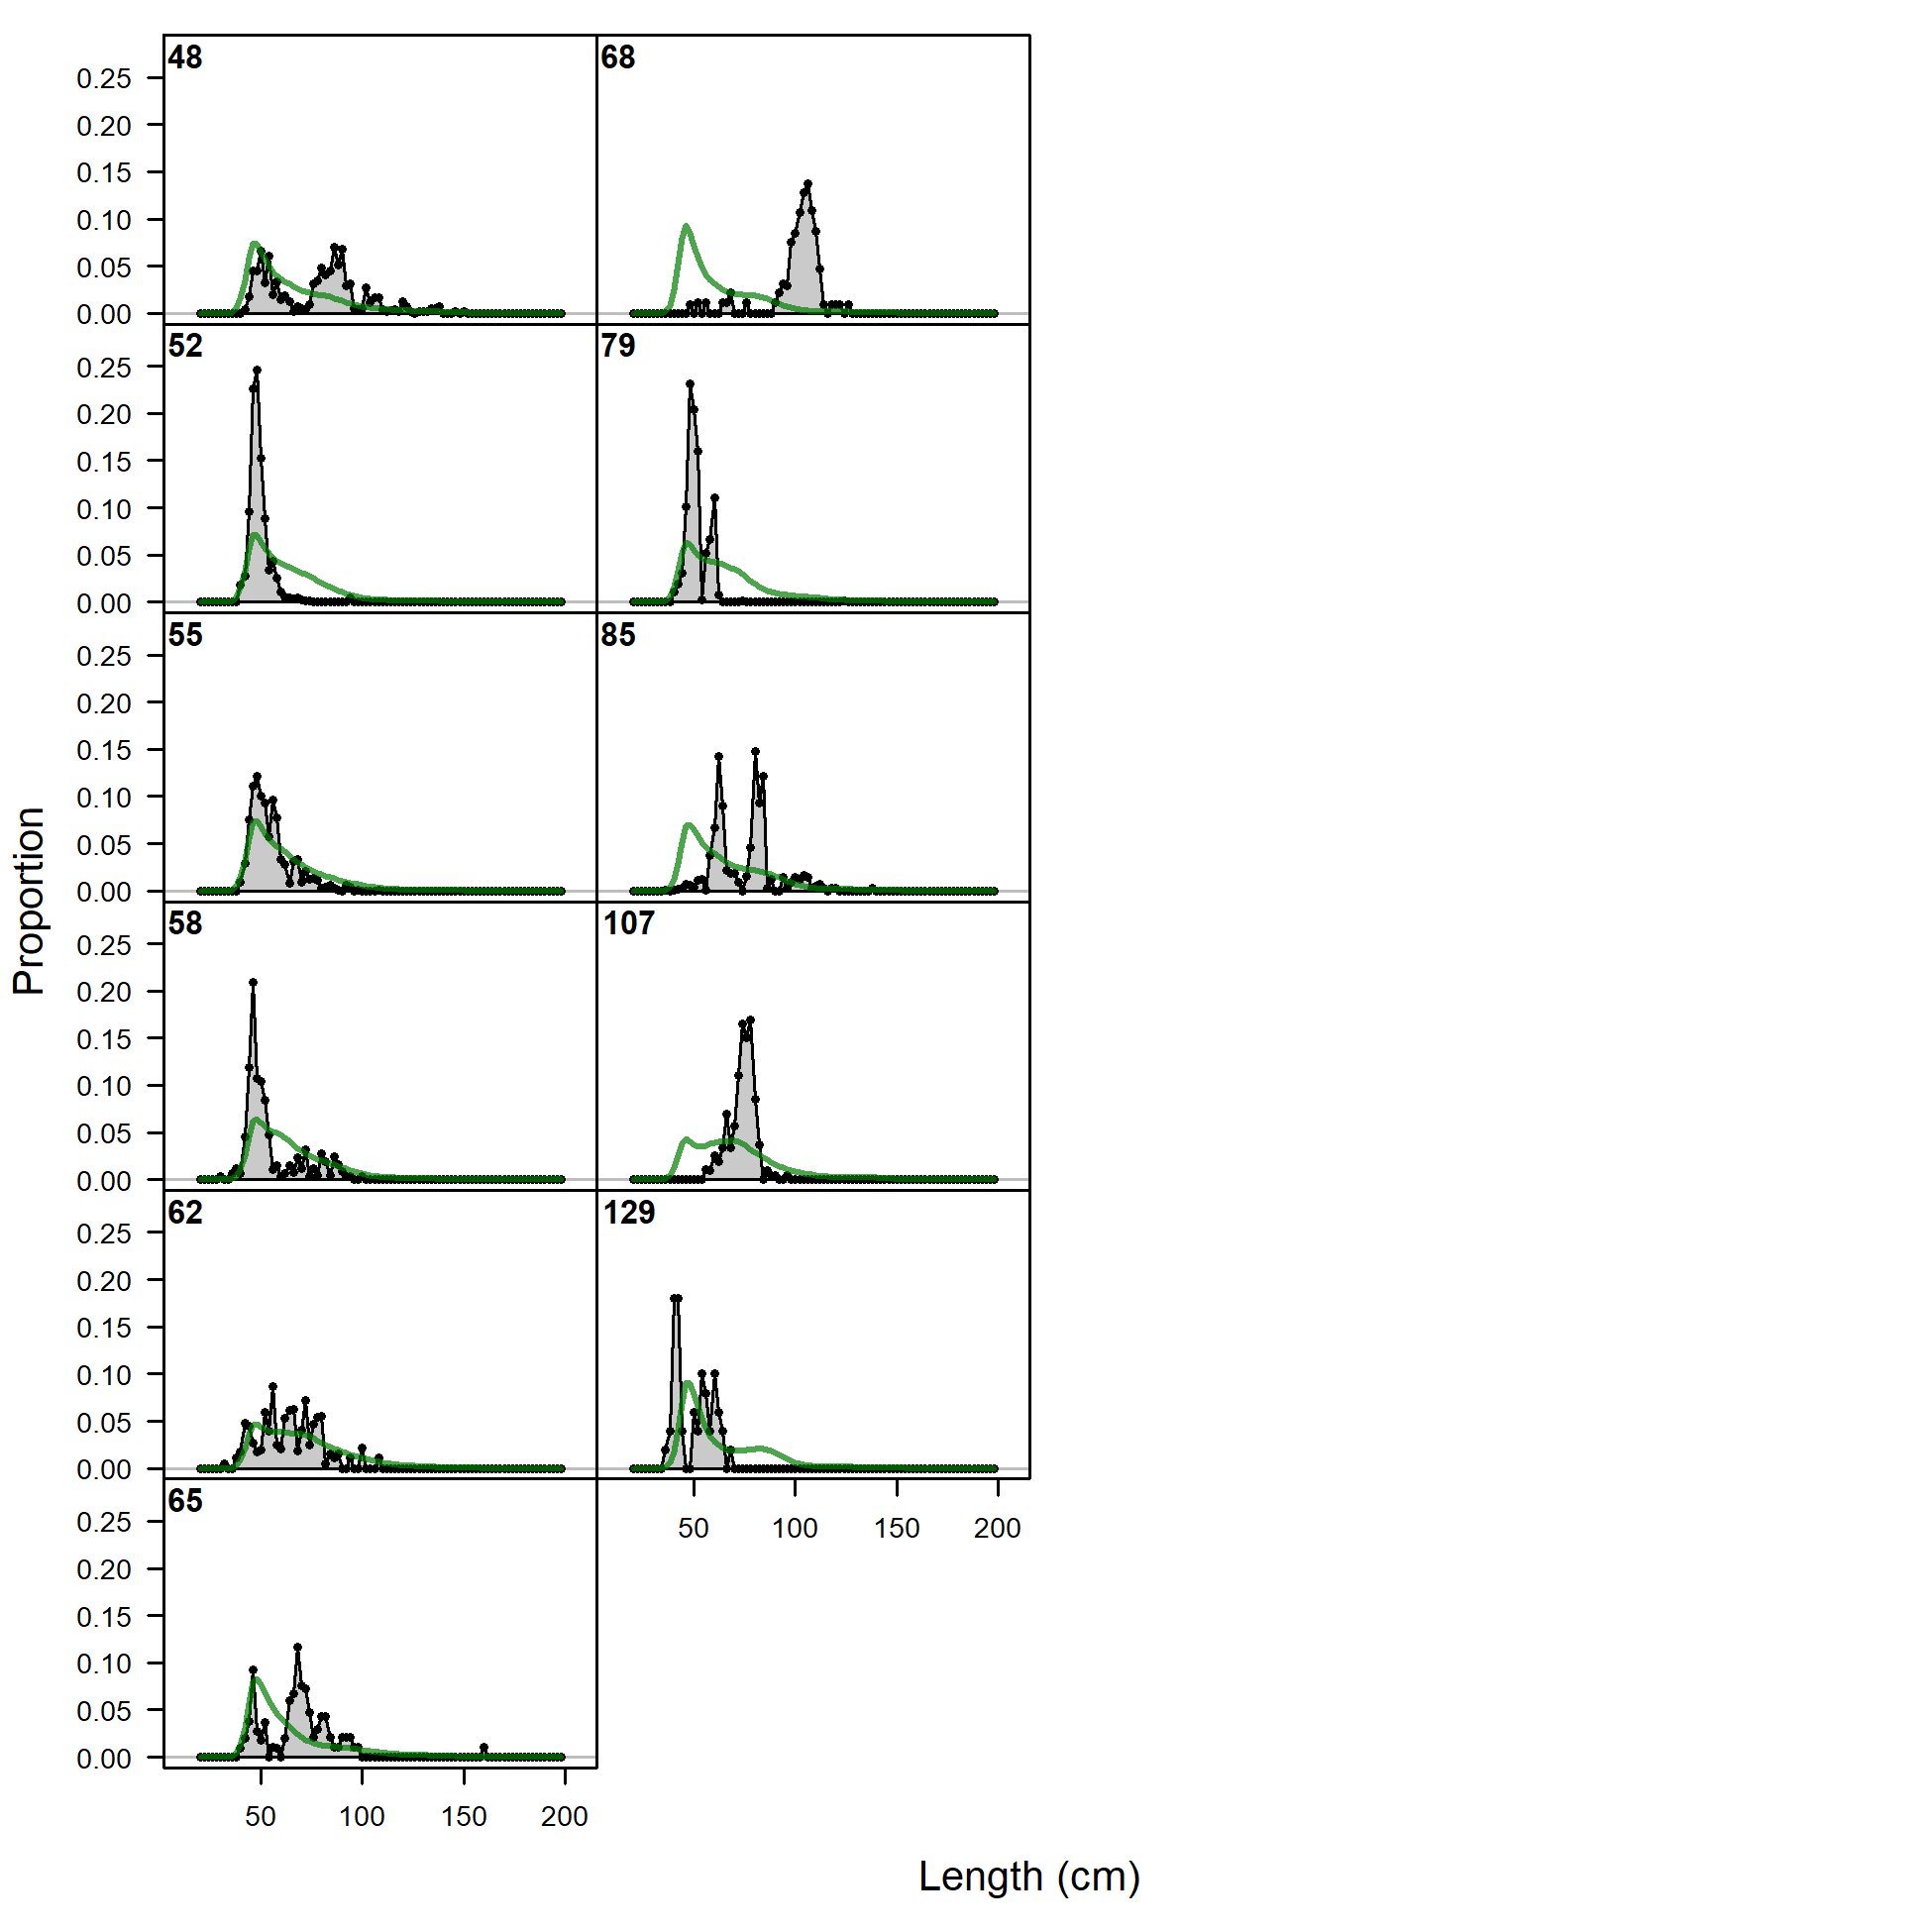
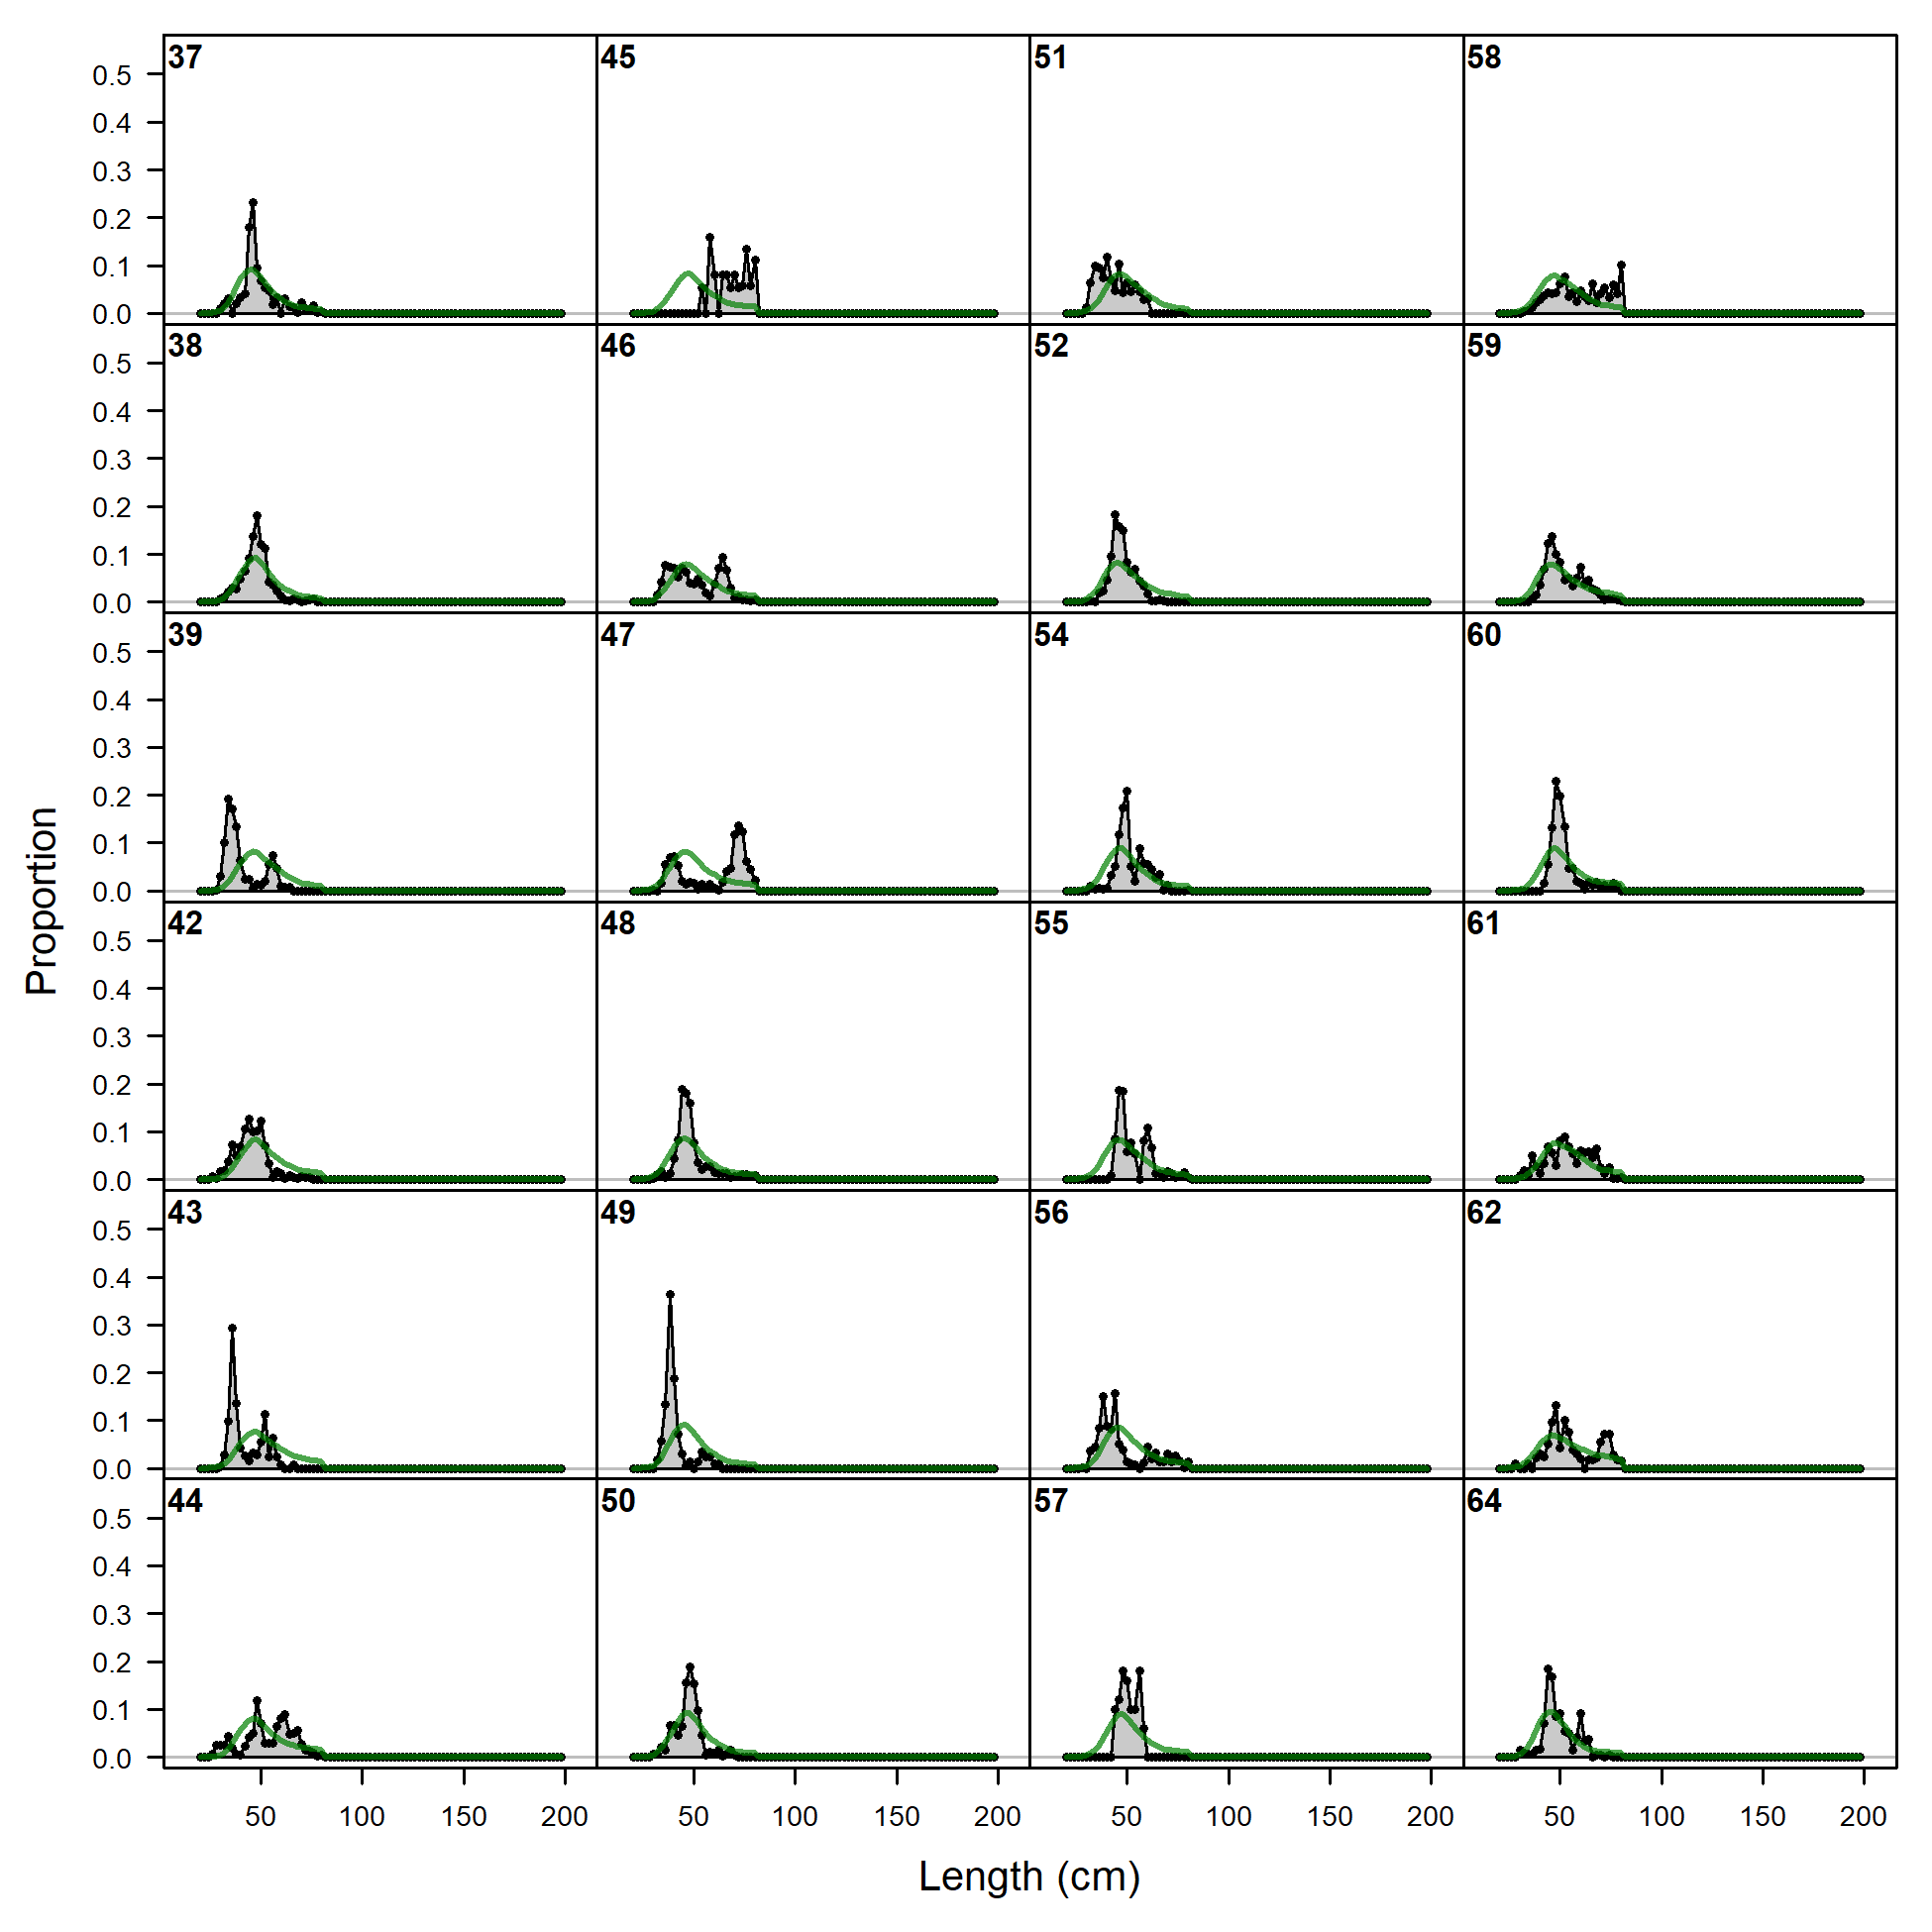
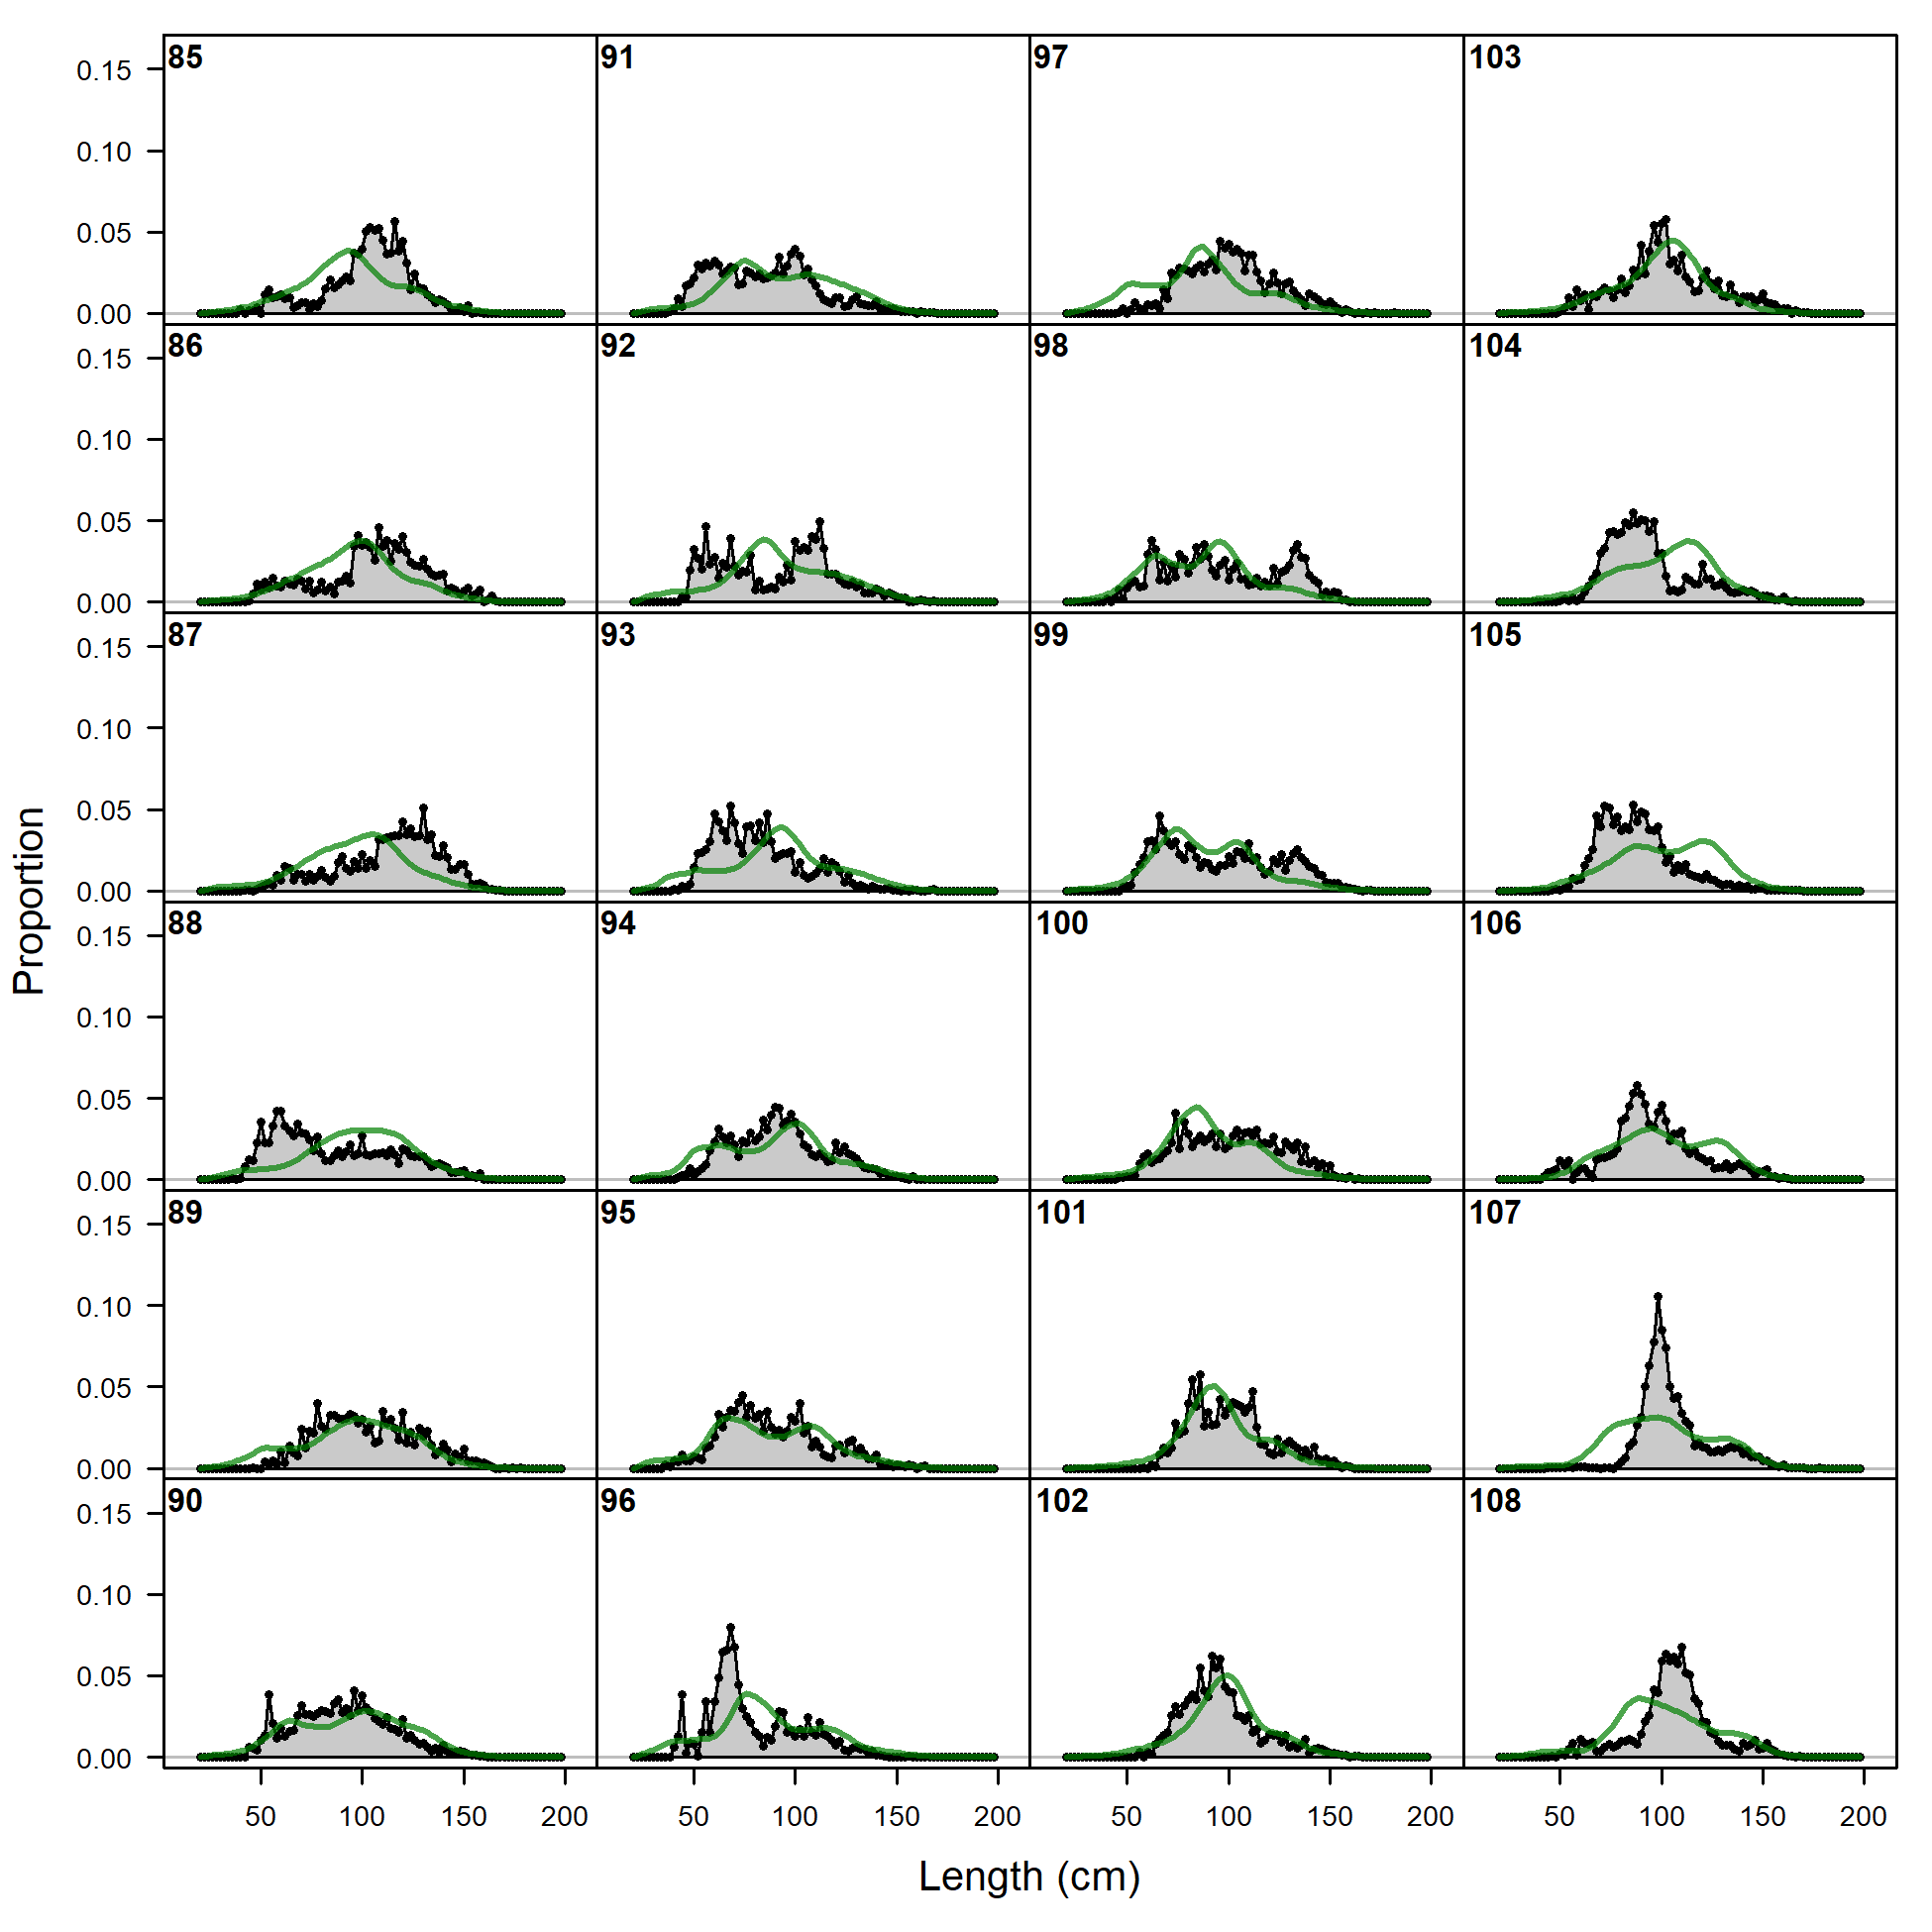
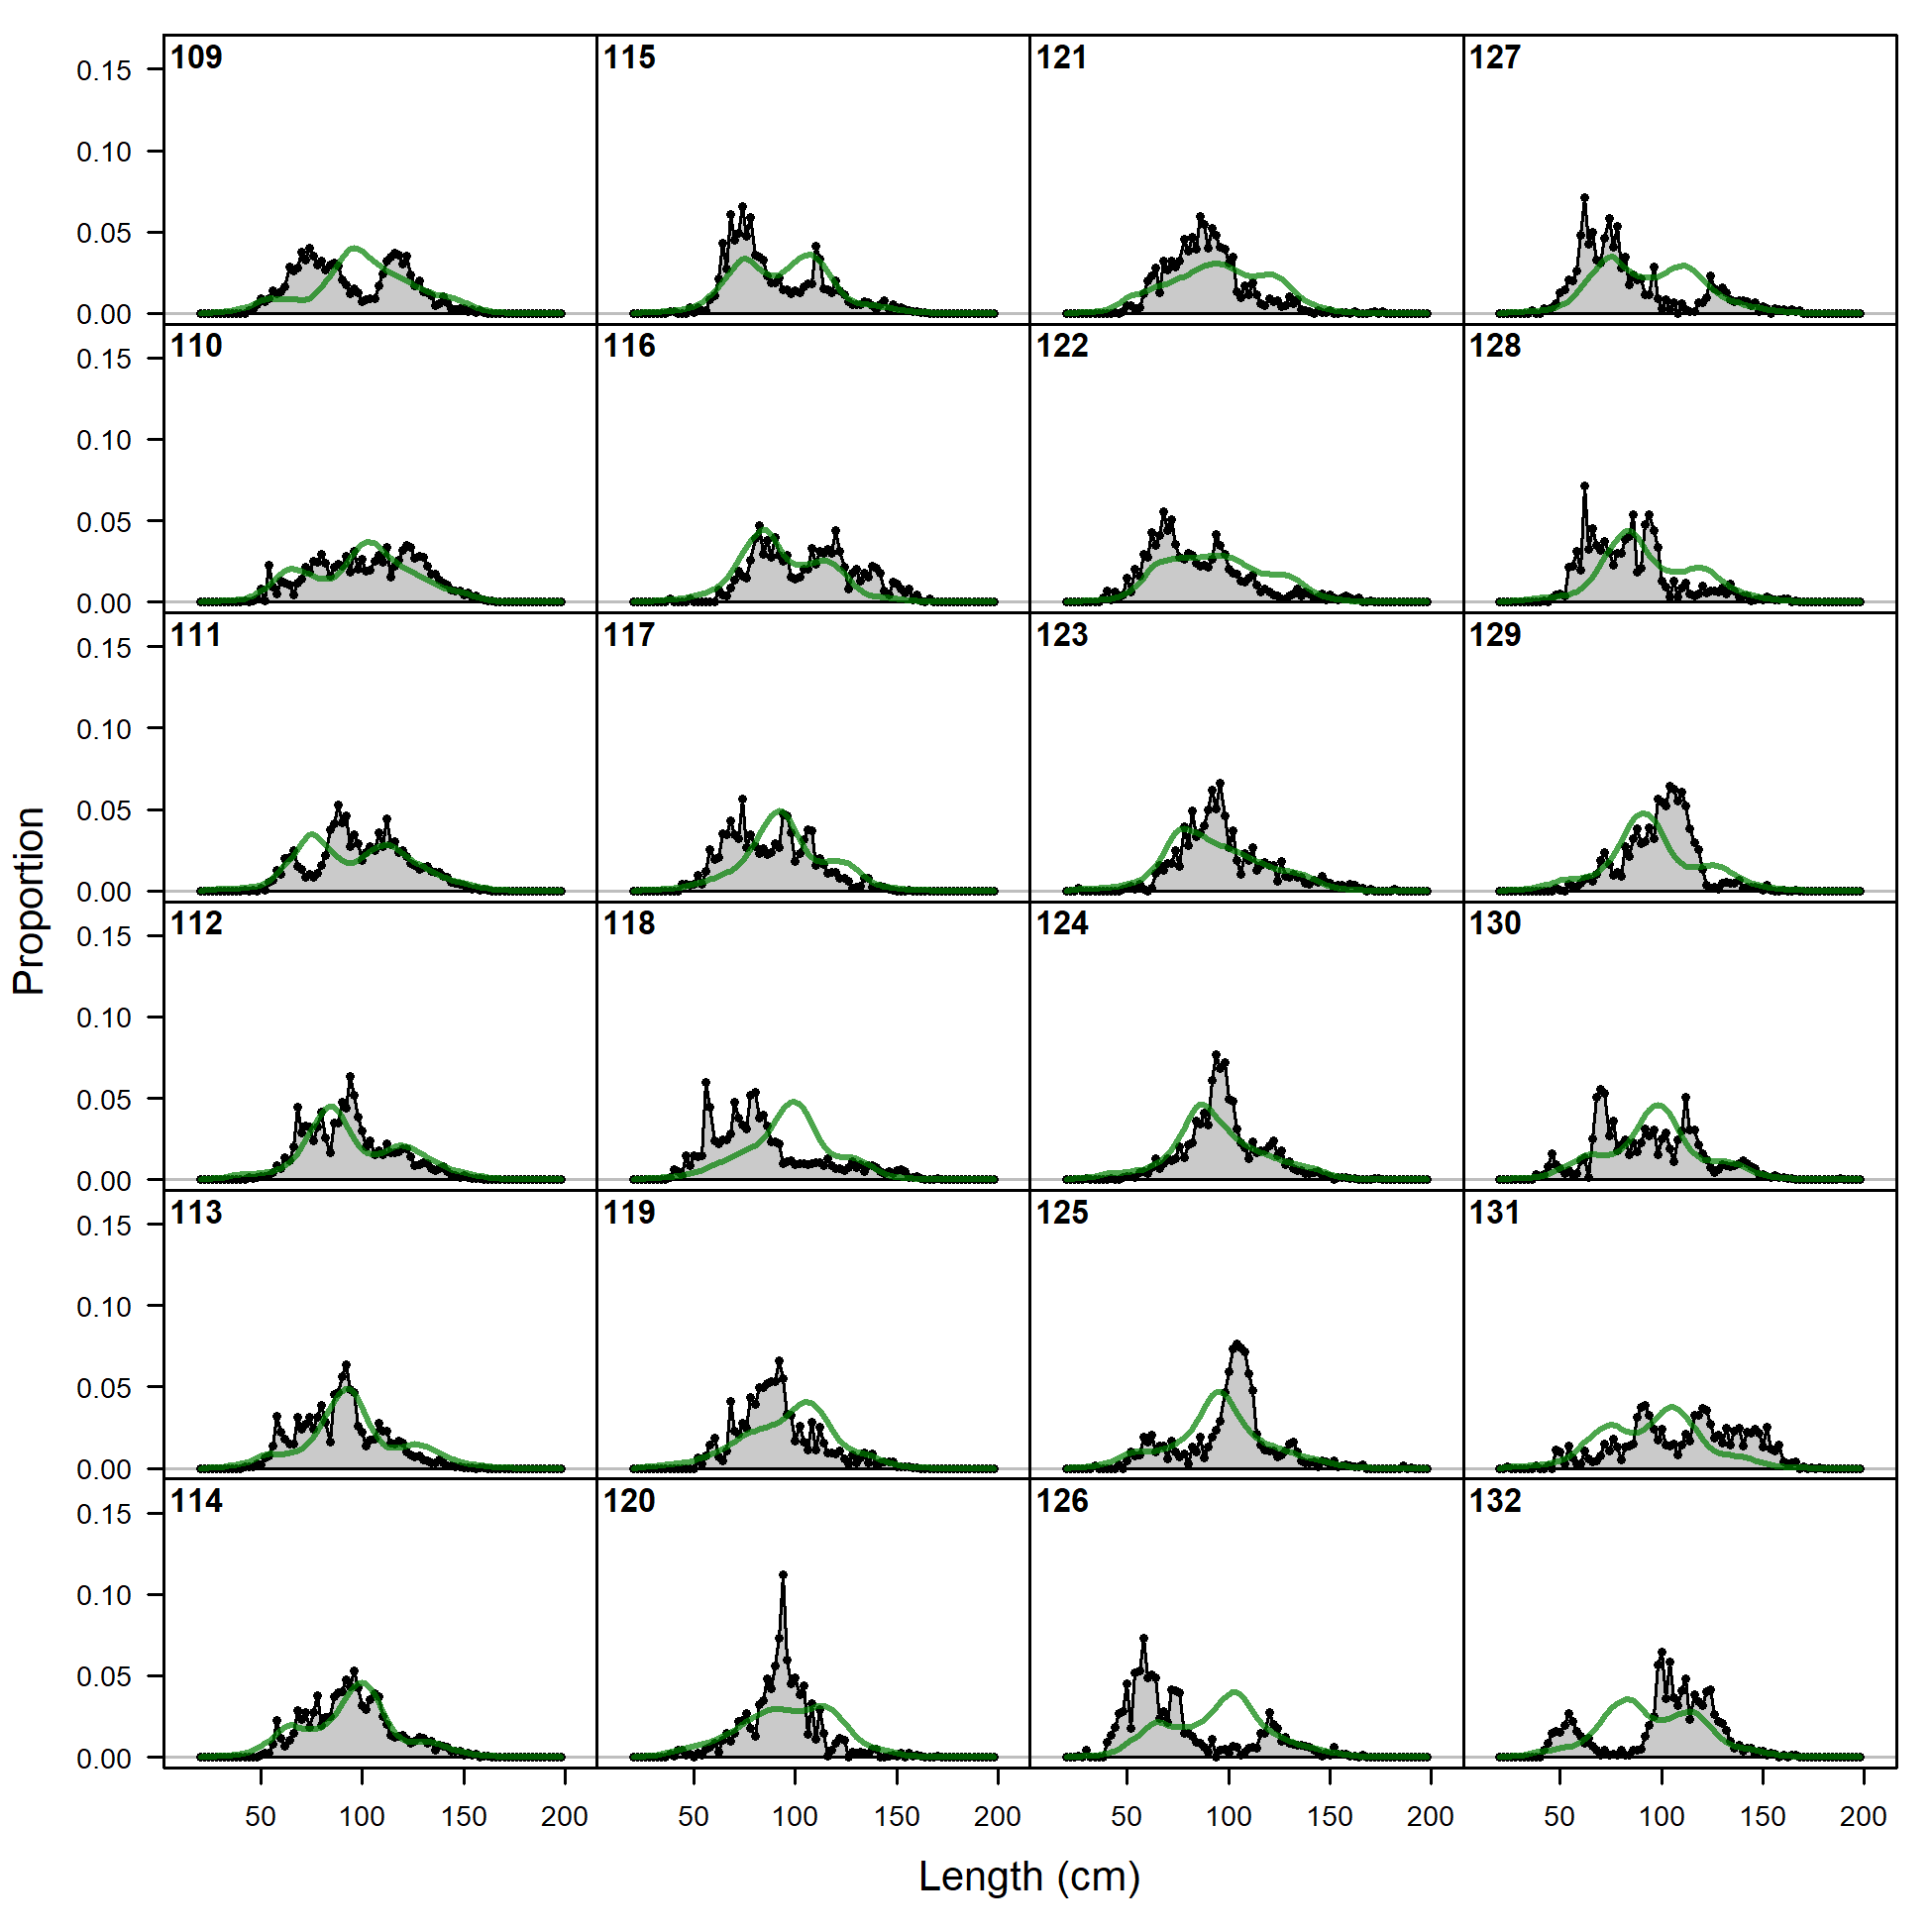
Length comps, whole catch, F16_PS_DEL_Offshore_South (plot 1 of 6).
'N adj.' is the input sample size after data-weighting adjustment. N eff. is the calculated effective sample size used in the McAllister-Ianelli tuning method.
file: comp_lenfit_flt16mkt0_page1.png
Length comps, whole catch, F16_PS_DEL_Offshore_South (plot 1 of 6).
'N adj.' is the input sample size after data-weighting adjustment. N eff. is the calculated effective sample size used in the McAllister-Ianelli tuning method. (plot 2 of 6)
file: comp_lenfit_flt16mkt0_page2.png
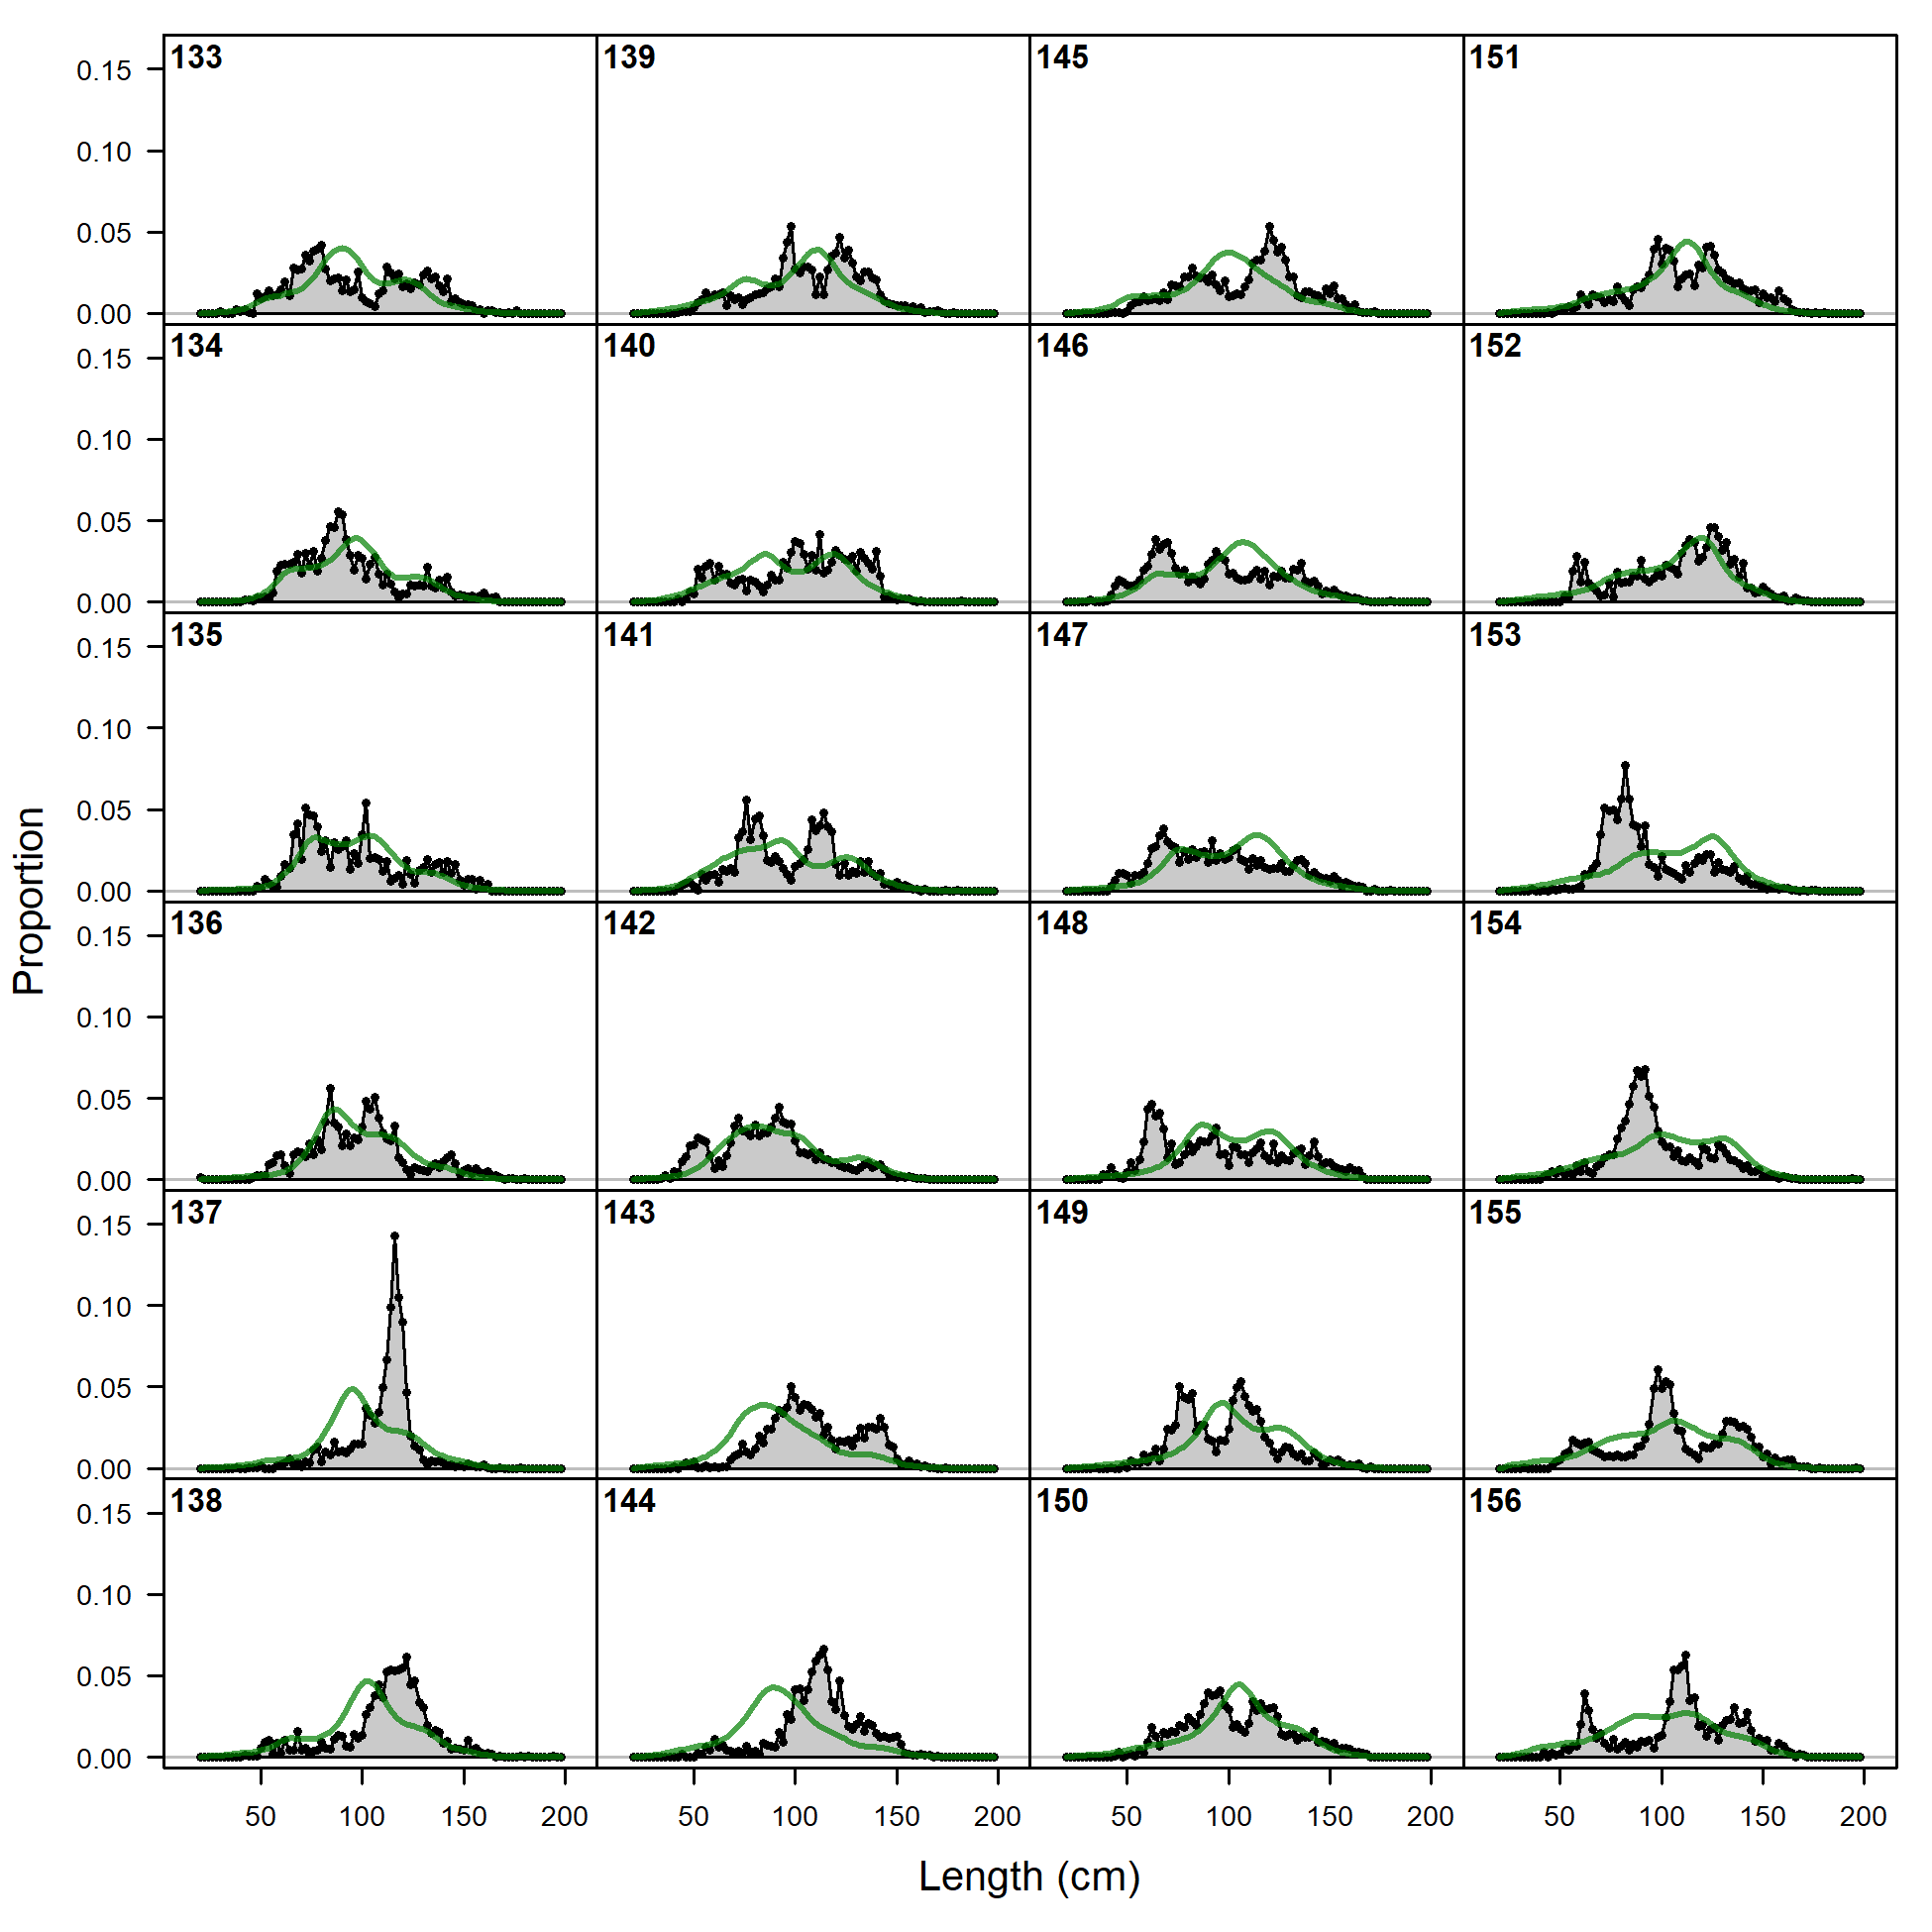
Length comps, whole catch, F16_PS_DEL_Offshore_South (plot 1 of 6).
'N adj.' is the input sample size after data-weighting adjustment. N eff. is the calculated effective sample size used in the McAllister-Ianelli tuning method. (plot 2 of 6) (plot 3 of 6)
file: comp_lenfit_flt16mkt0_page3.png
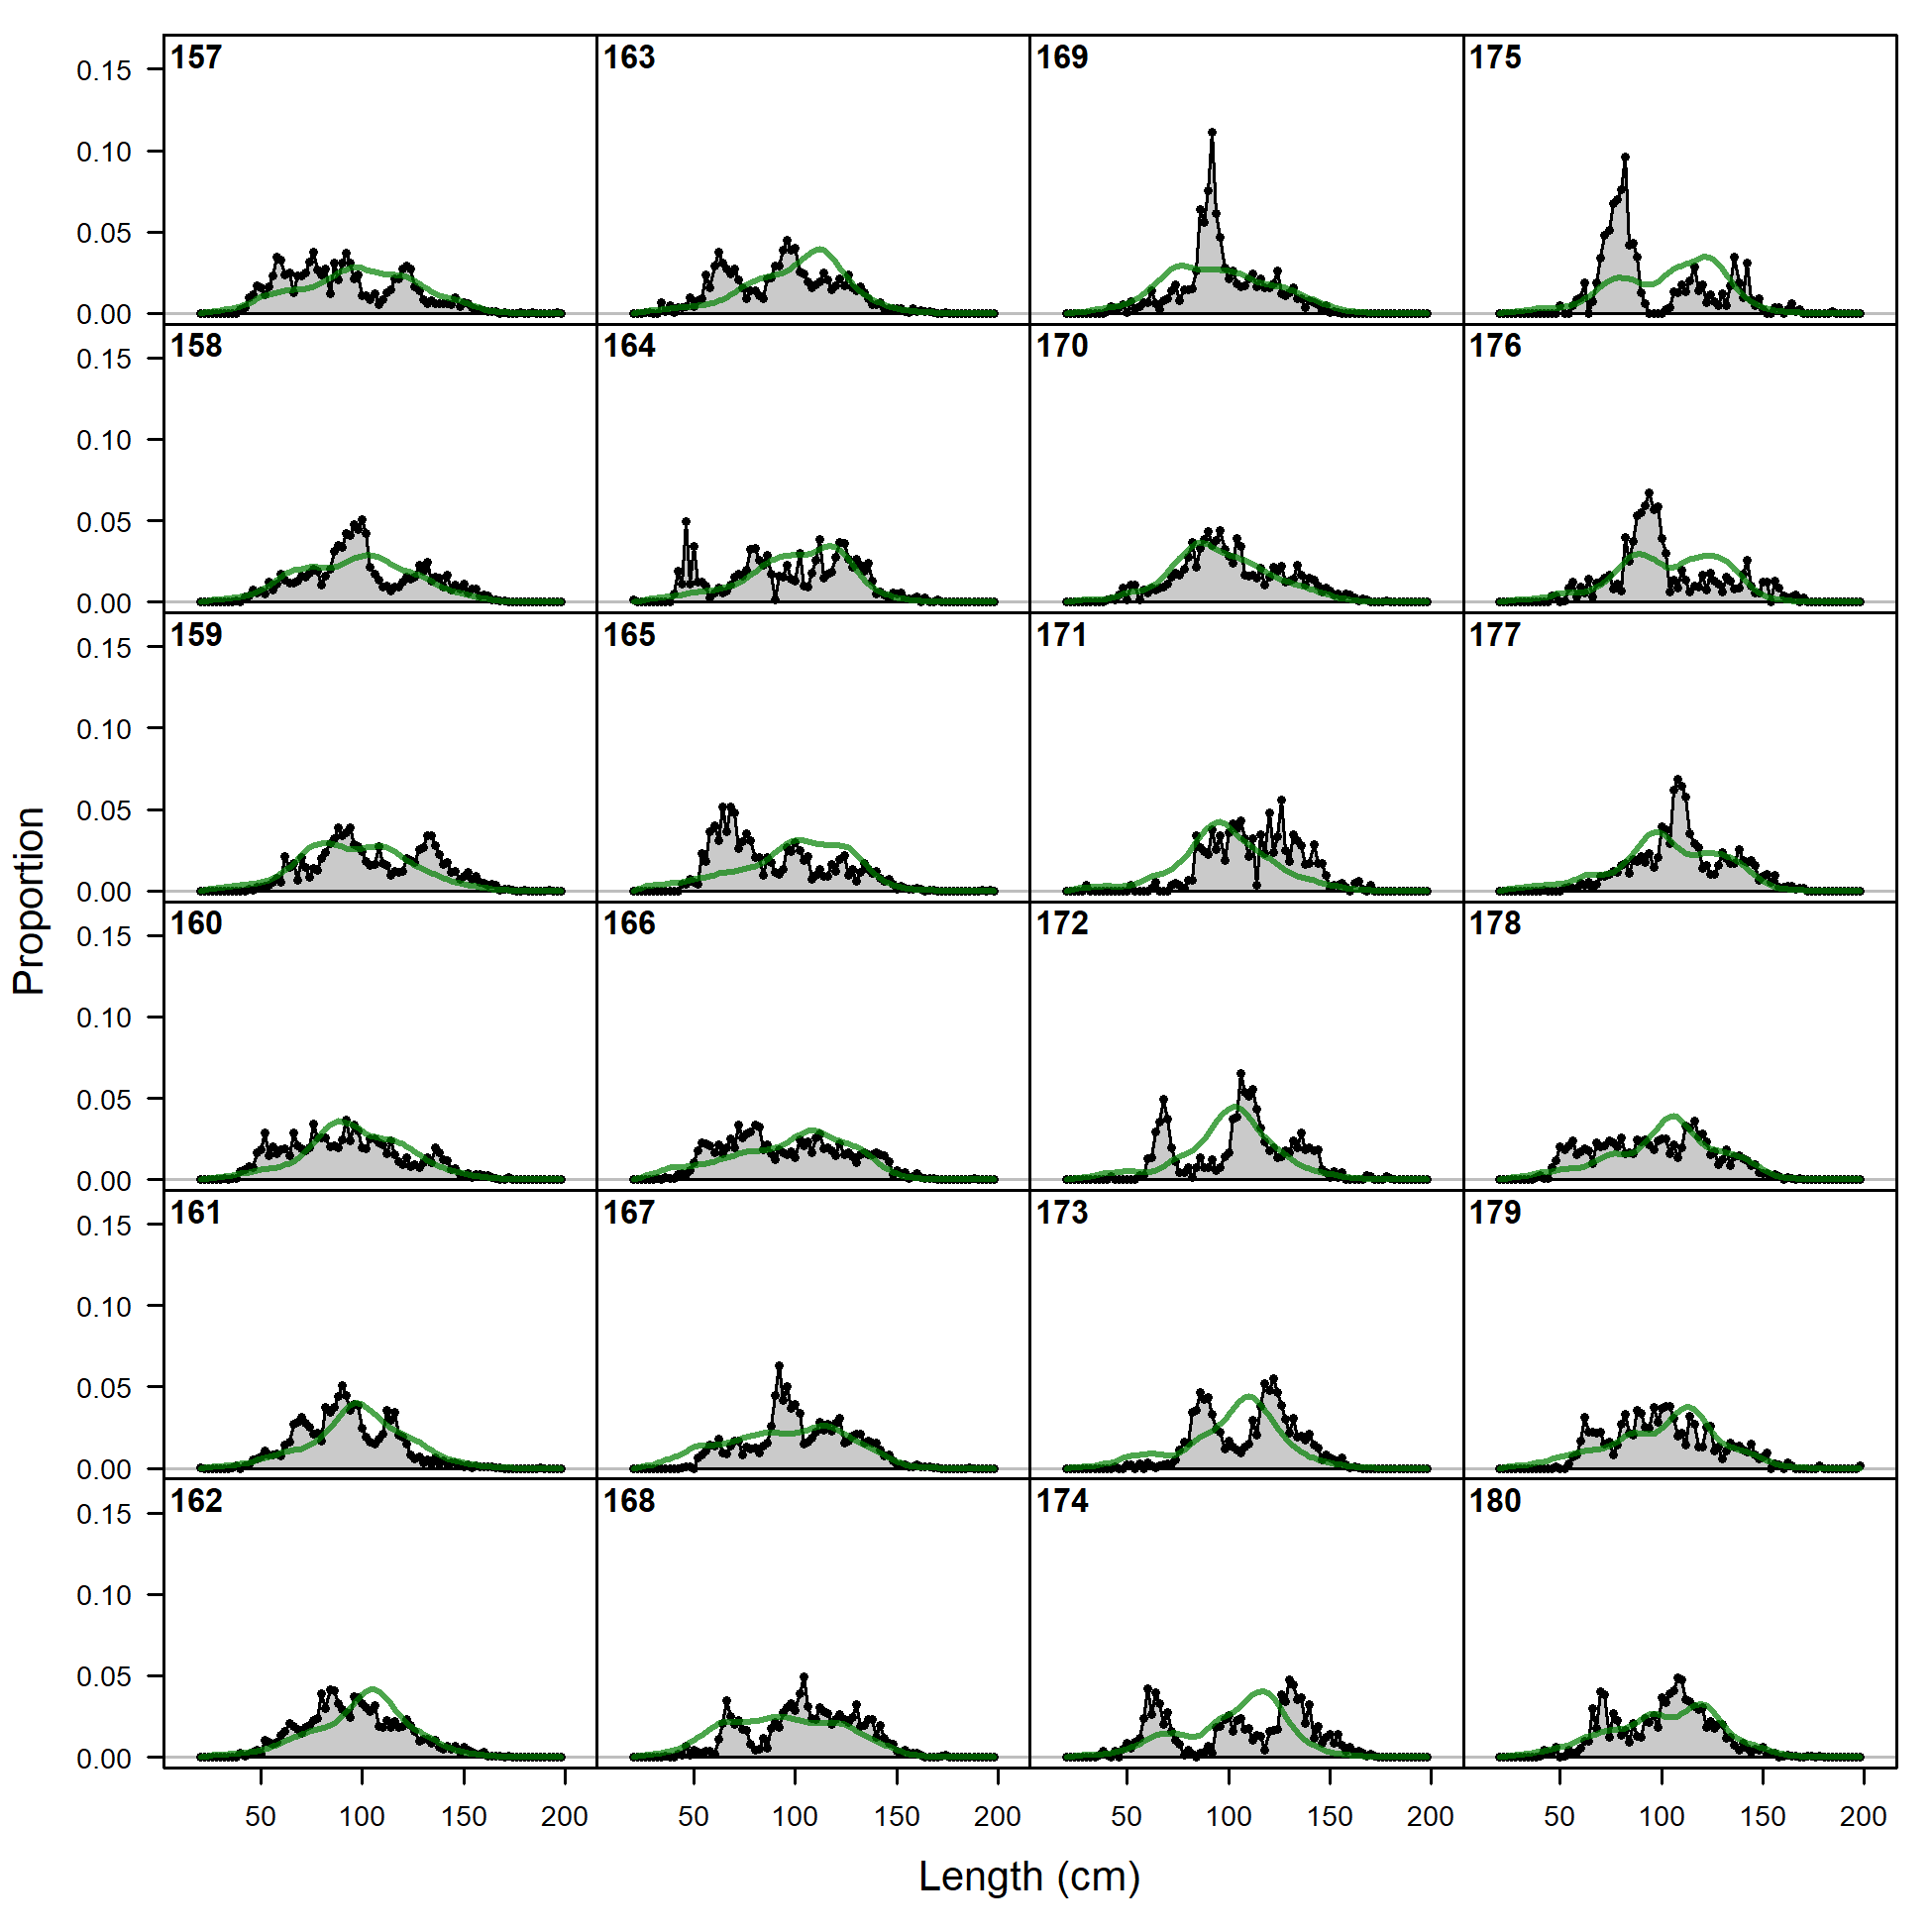
Length comps, whole catch, F16_PS_DEL_Offshore_South (plot 1 of 6).
'N adj.' is the input sample size after data-weighting adjustment. N eff. is the calculated effective sample size used in the McAllister-Ianelli tuning method. (plot 2 of 6) (plot 3 of 6) (plot 4 of 6)
file: comp_lenfit_flt16mkt0_page4.png
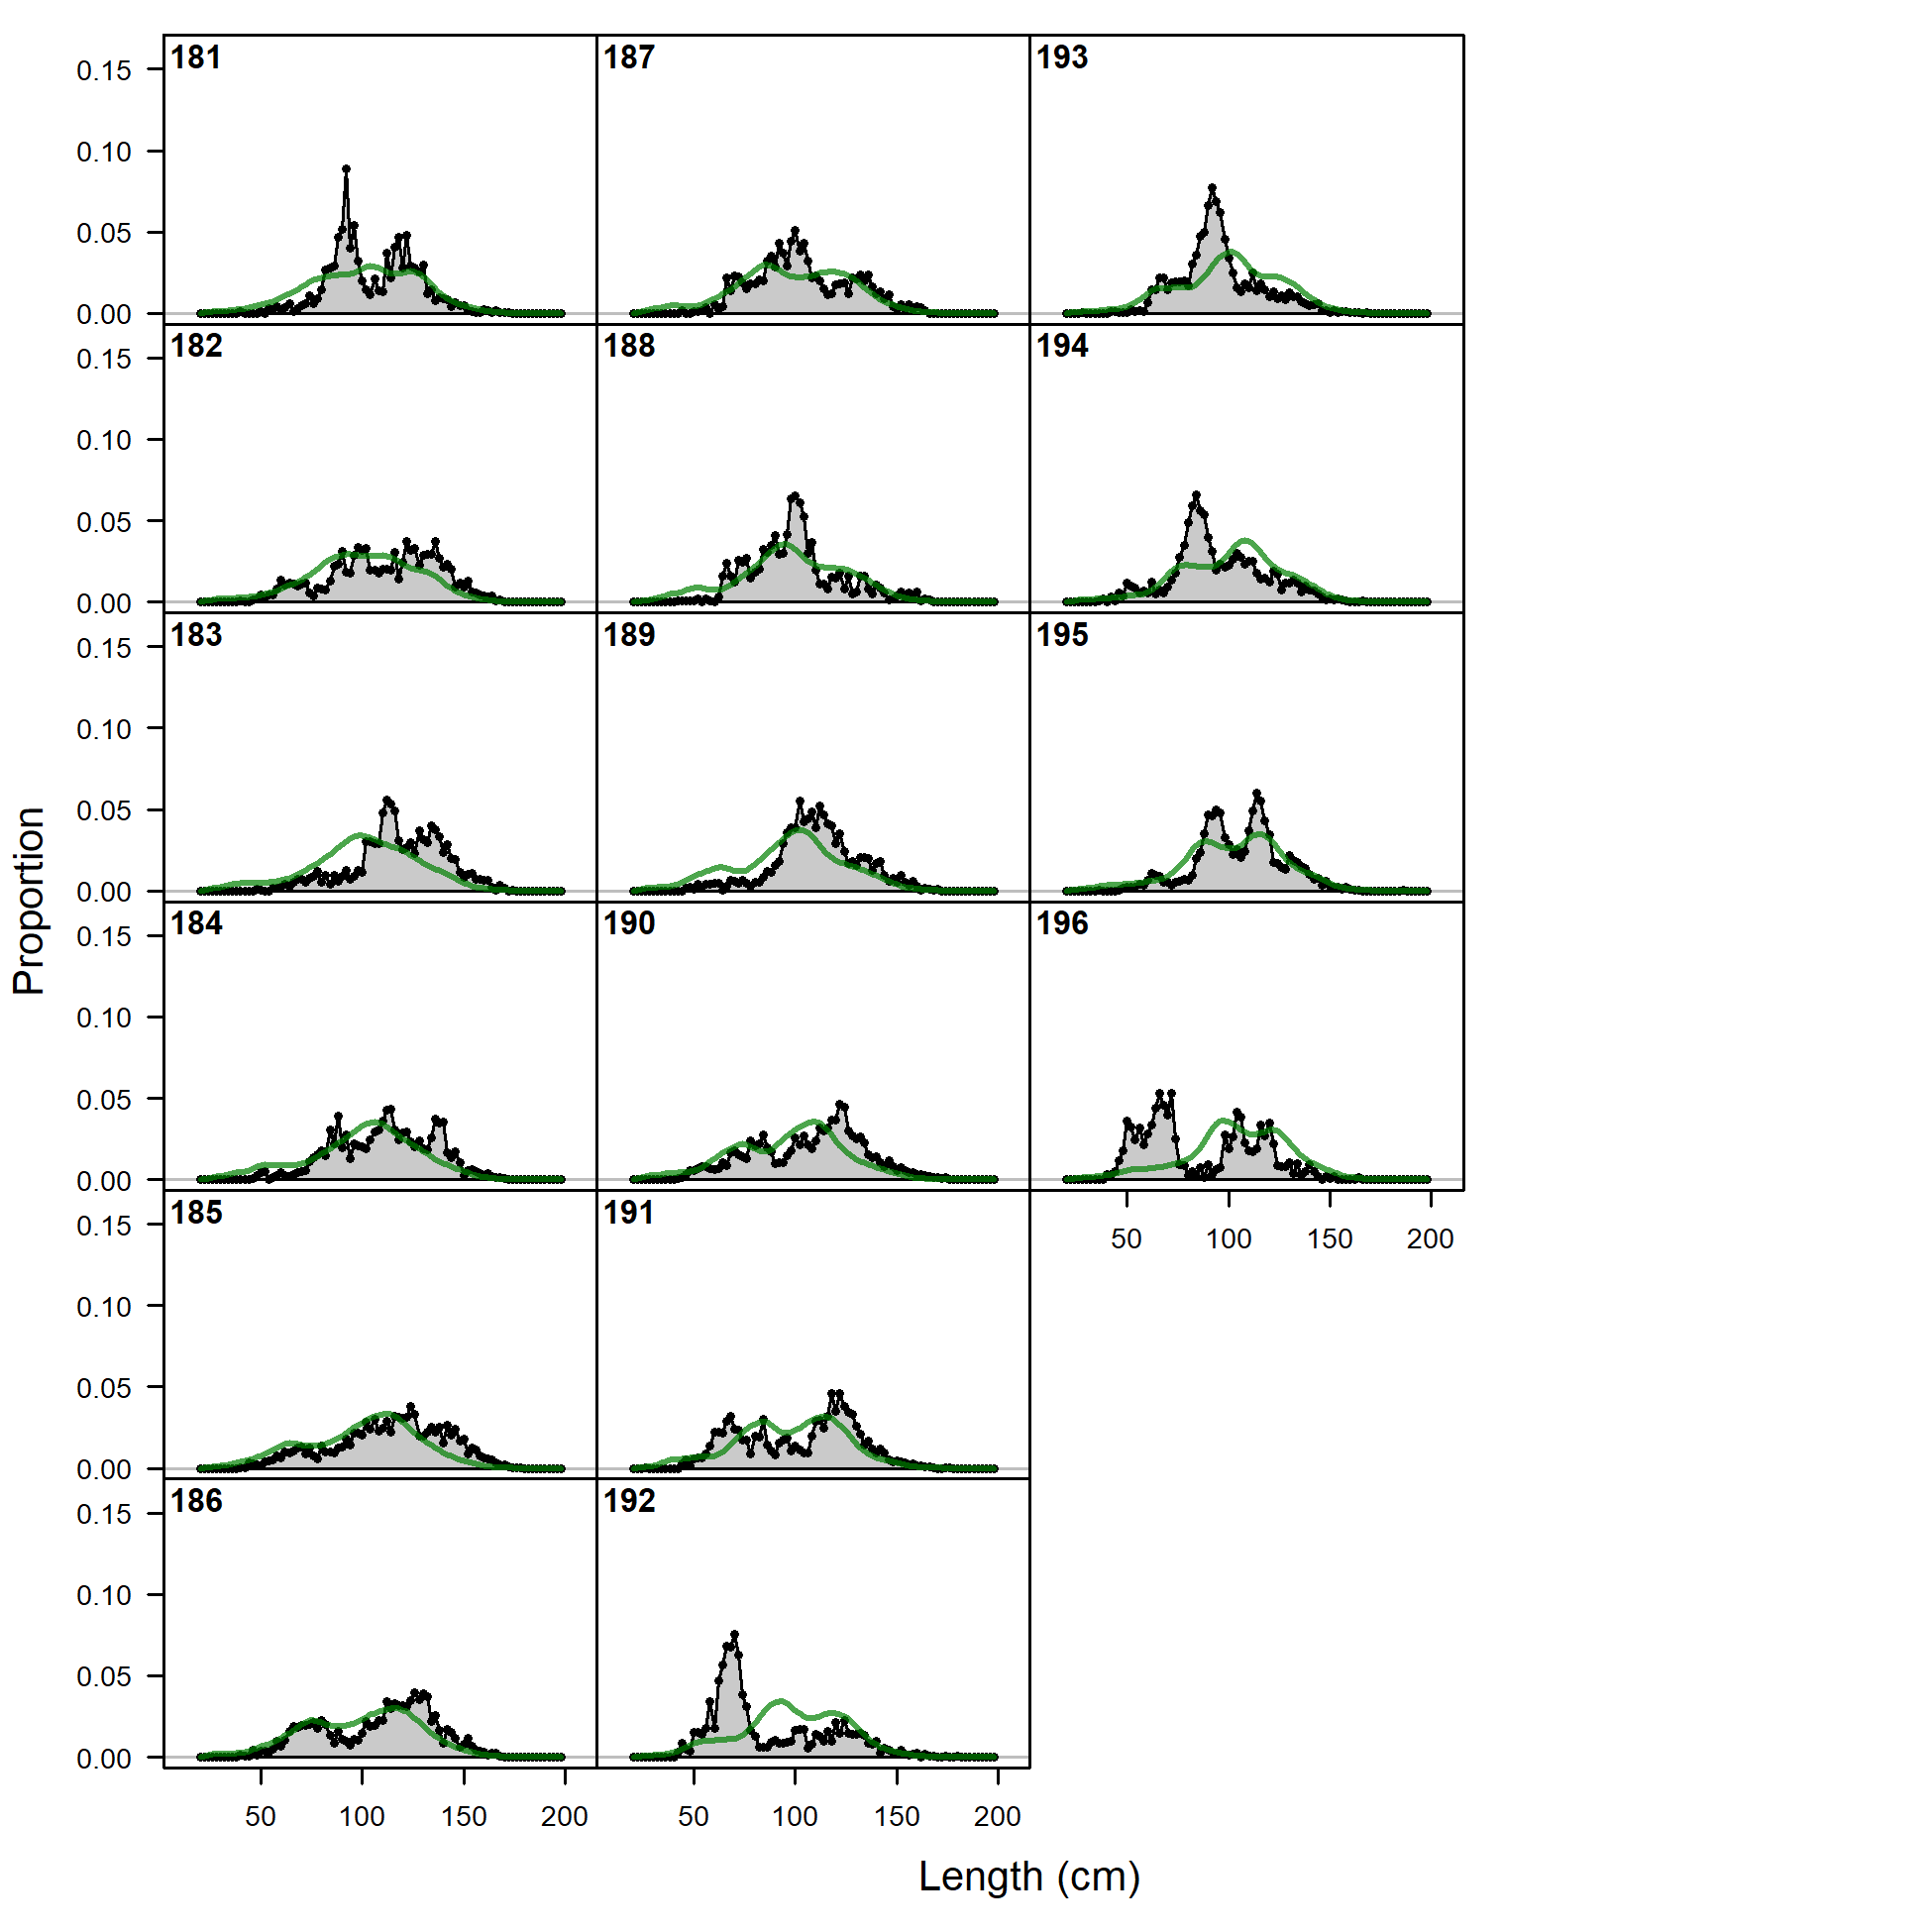
Length comps, whole catch, F16_PS_DEL_Offshore_South (plot 1 of 6).
'N adj.' is the input sample size after data-weighting adjustment. N eff. is the calculated effective sample size used in the McAllister-Ianelli tuning method. (plot 2 of 6) (plot 3 of 6) (plot 4 of 6) (plot 5 of 6)
file: comp_lenfit_flt16mkt0_page5.png
Length comps, whole catch, F16_PS_DEL_Offshore_South (plot 1 of 6).
'N adj.' is the input sample size after data-weighting adjustment. N eff. is the calculated effective sample size used in the McAllister-Ianelli tuning method. (plot 2 of 6) (plot 3 of 6) (plot 4 of 6) (plot 5 of 6) (plot 6 of 6)
file: comp_lenfit_flt16mkt0_page6.png
Pearson residuals, whole catch, F16_PS_DEL_Offshore_South (max=4.81) (plot 6 of 6)
Closed bubbles are positive residuals (observed > expected) and open bubbles are negative residuals (observed < expected).
file: comp_lenfit_residsflt16mkt0_page6.png
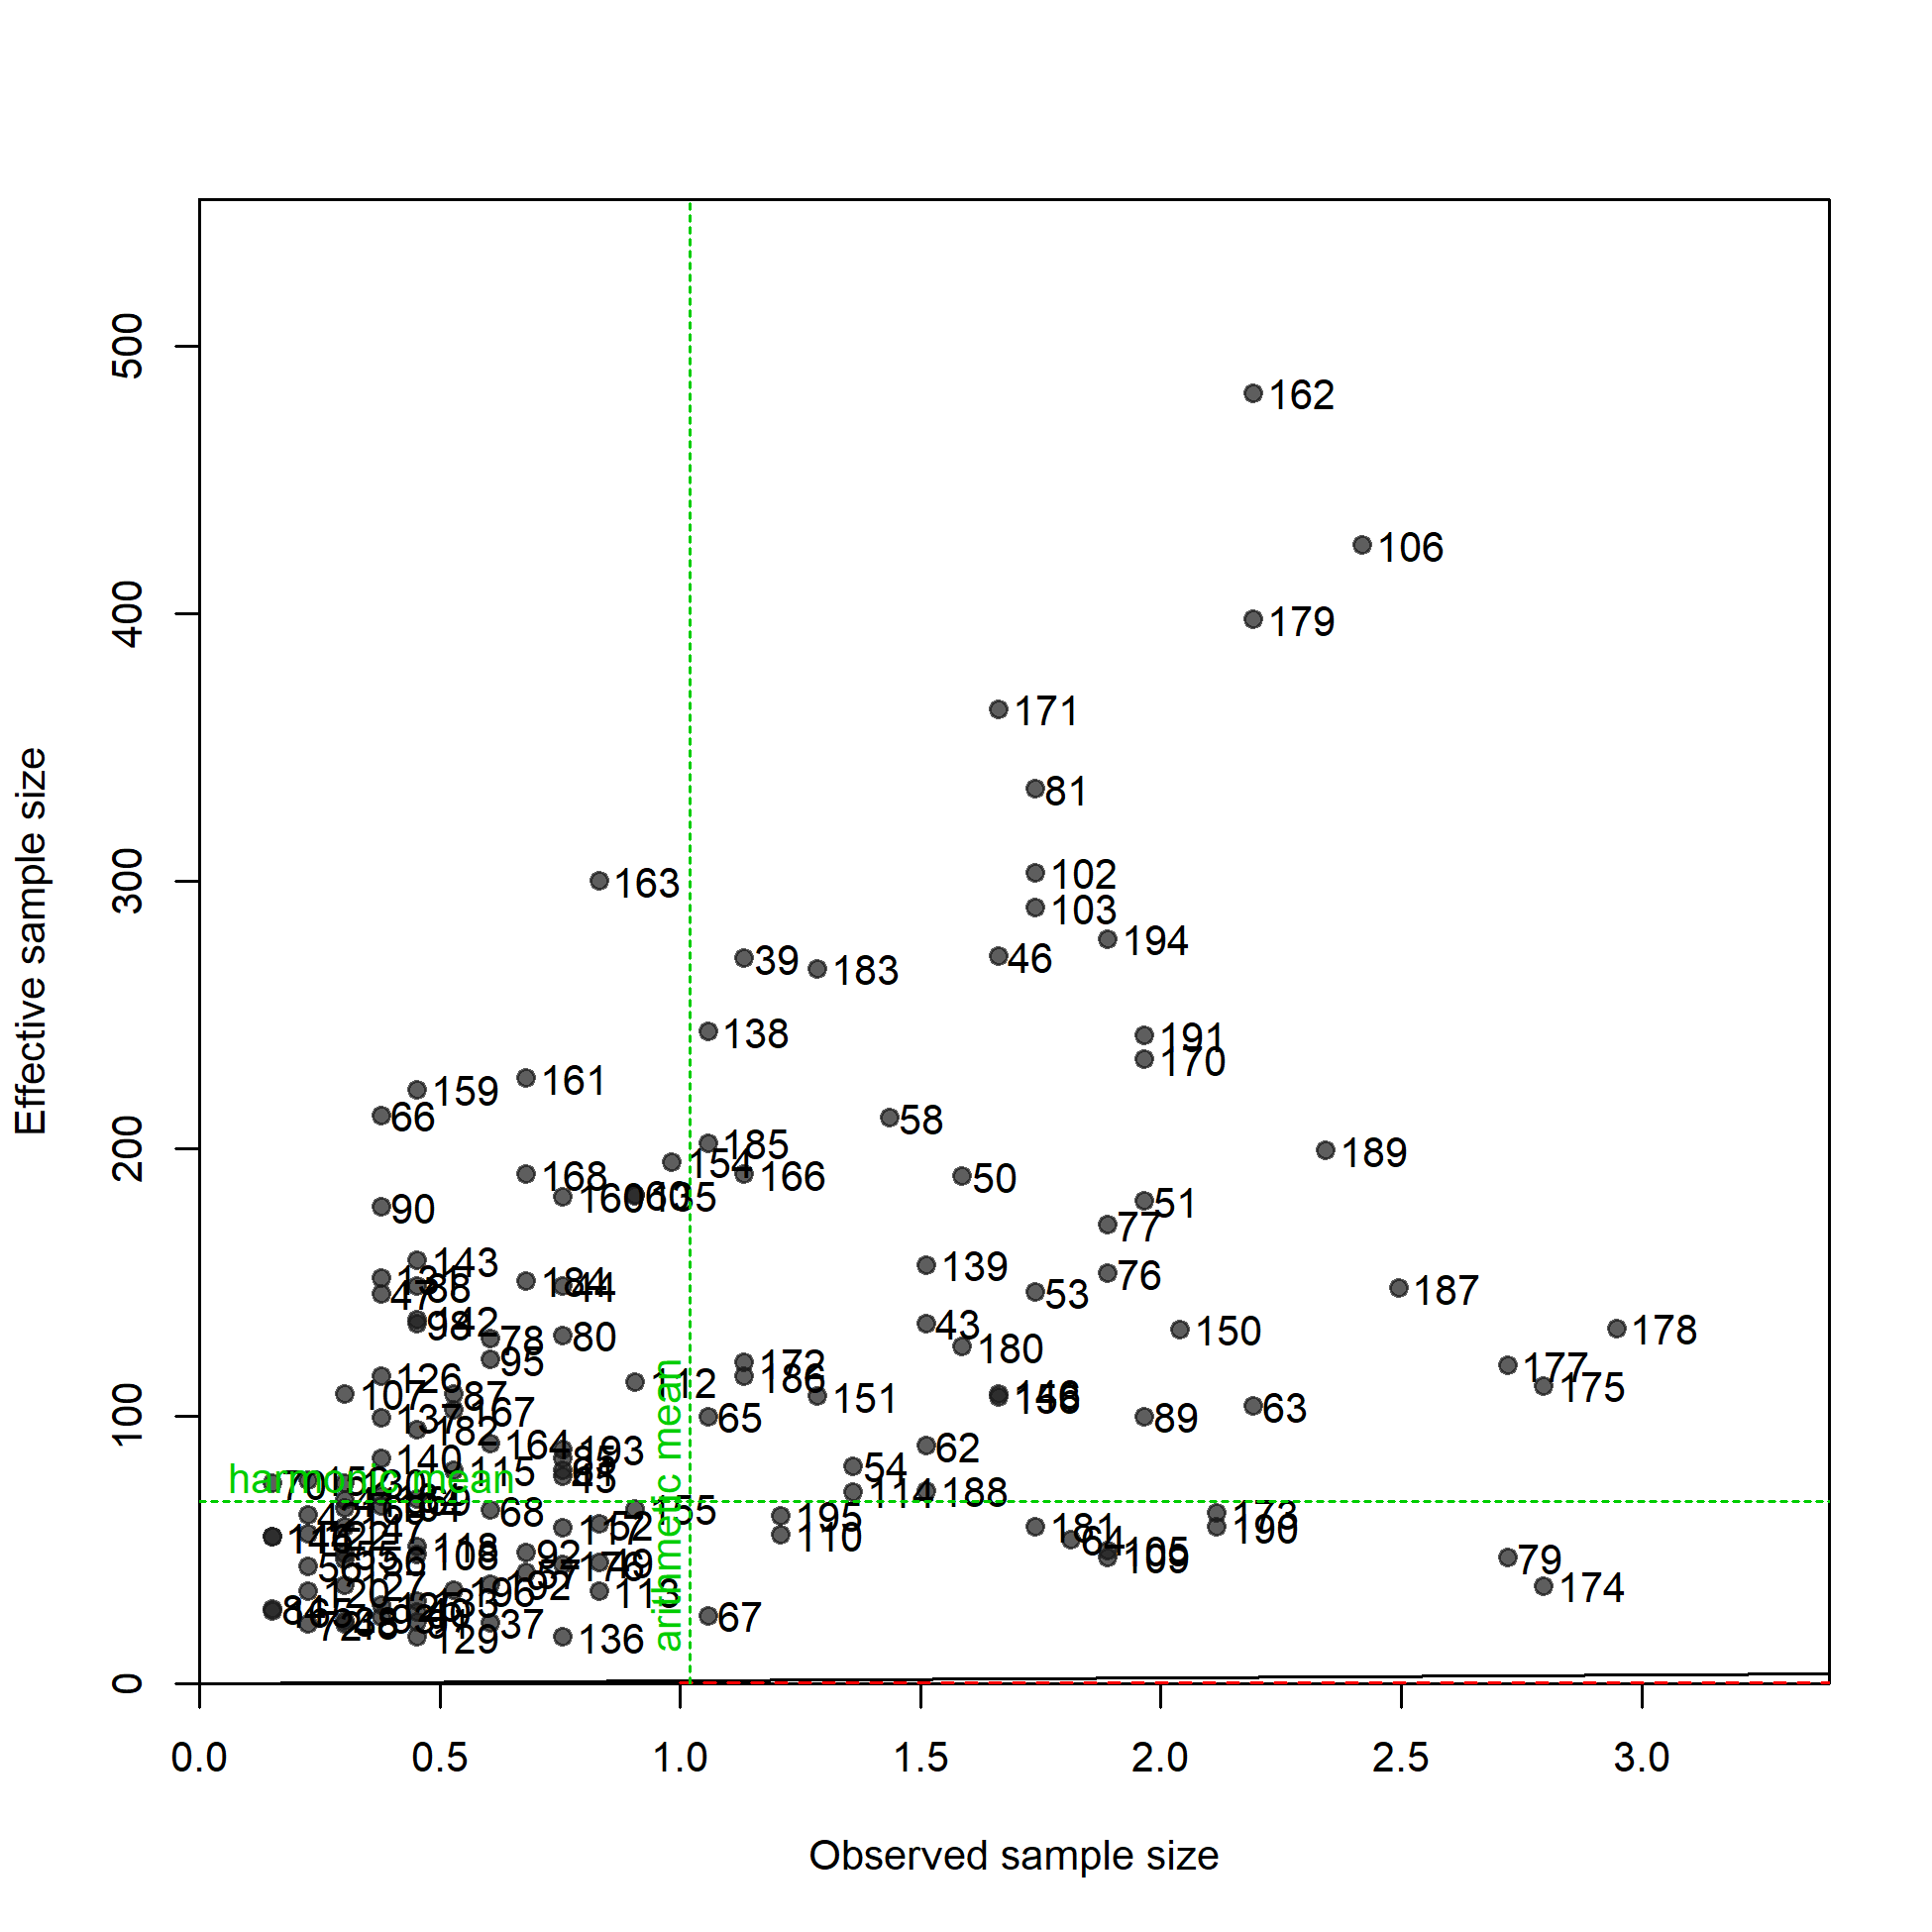
N-EffN comparison, Length comps, whole catch, F16_PS_DEL_Offshore_South
file: comp_lenfit_sampsize_flt16mkt0.png
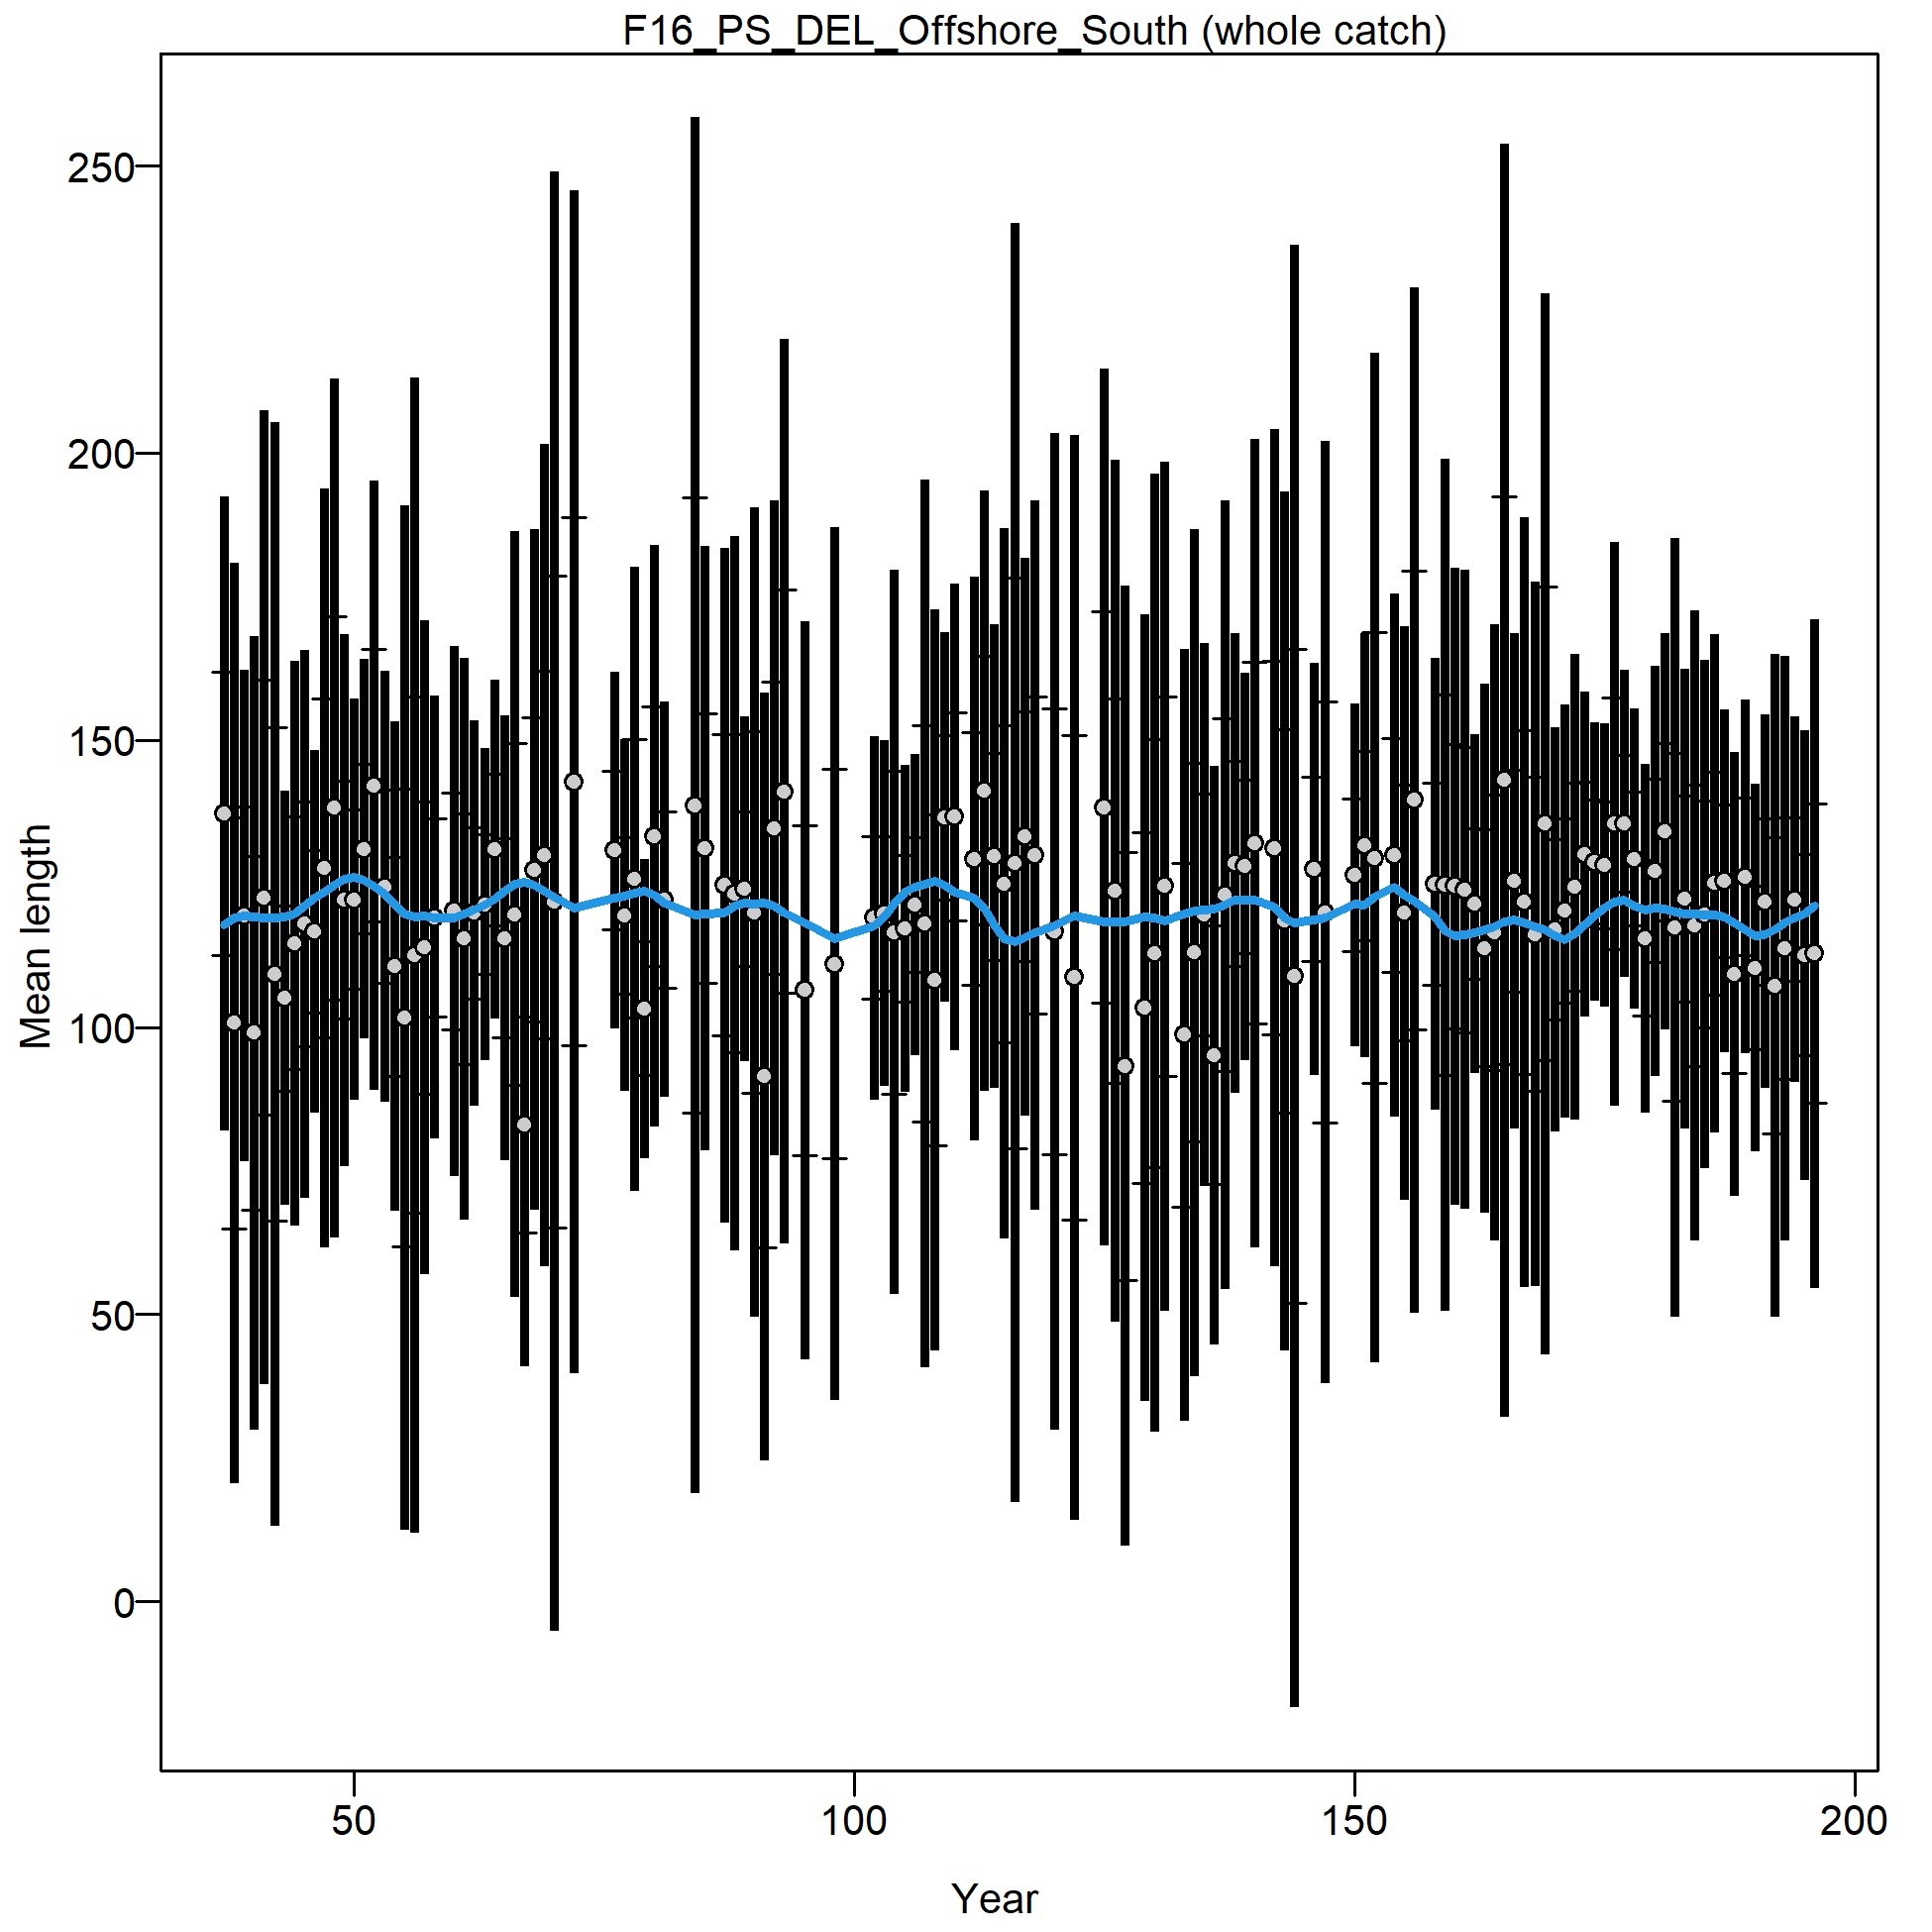
Mean length for F16_PS_DEL_Offshore_South with 95% confidence intervals based on current sample sizes.
Francis data weighting method TA1.8: thinner intervals (with capped ends) show result of further adjusting sample sizes based on suggested multiplier (with 95% interval) for len data from F16_PS_DEL_Offshore_South:
5.013 (3.4417-7.4159)
For more info, see Francis (2011).
file: comp_lenfit_data_weighting_TA1-8_F16_PS_DEL_Offshore_South.png
Excluded length comps, whole catch, F1_PS_OBJ_North_coastal.
'N adj.' is the input sample size after data-weighting adjustment. N eff. is the calculated effective sample size used in the McAllister-Ianelli tuning method.
file: comp_gstlenfit_flt1mkt0.png

Pearson residuals, whole catch, F1_PS_OBJ_North_coastal (max=NA)
Closed bubbles are positive residuals (observed > expected) and open bubbles are negative residuals (observed < expected).
file: comp_gstlenfit_residsflt1mkt0.png
Excluded length comps, retained, F2_PS_OBJ_Core (plot 1 of 6).
'N adj.' is the input sample size after data-weighting adjustment. N eff. is the calculated effective sample size used in the McAllister-Ianelli tuning method.
file: comp_gstlenfit_flt2mkt2_page1.png
Excluded length comps, retained, F2_PS_OBJ_Core (plot 1 of 6).
'N adj.' is the input sample size after data-weighting adjustment. N eff. is the calculated effective sample size used in the McAllister-Ianelli tuning method. (plot 2 of 6)
file: comp_gstlenfit_flt2mkt2_page2.png
Excluded length comps, retained, F2_PS_OBJ_Core (plot 1 of 6).
'N adj.' is the input sample size after data-weighting adjustment. N eff. is the calculated effective sample size used in the McAllister-Ianelli tuning method. (plot 2 of 6) (plot 3 of 6)
file: comp_gstlenfit_flt2mkt2_page3.png
Excluded length comps, retained, F2_PS_OBJ_Core (plot 1 of 6).
'N adj.' is the input sample size after data-weighting adjustment. N eff. is the calculated effective sample size used in the McAllister-Ianelli tuning method. (plot 2 of 6) (plot 3 of 6) (plot 4 of 6)
file: comp_gstlenfit_flt2mkt2_page4.png
Excluded length comps, retained, F2_PS_OBJ_Core (plot 1 of 6).
'N adj.' is the input sample size after data-weighting adjustment. N eff. is the calculated effective sample size used in the McAllister-Ianelli tuning method. (plot 2 of 6) (plot 3 of 6) (plot 4 of 6) (plot 5 of 6)
file: comp_gstlenfit_flt2mkt2_page5.png
Excluded length comps, retained, F2_PS_OBJ_Core (plot 1 of 6).
'N adj.' is the input sample size after data-weighting adjustment. N eff. is the calculated effective sample size used in the McAllister-Ianelli tuning method. (plot 2 of 6) (plot 3 of 6) (plot 4 of 6) (plot 5 of 6) (plot 6 of 6)
file: comp_gstlenfit_flt2mkt2_page6.png

Pearson residuals, retained, F2_PS_OBJ_Core (max=NA) (plot 6 of 6)
Closed bubbles are positive residuals (observed > expected) and open bubbles are negative residuals (observed < expected).
file: comp_gstlenfit_residsflt2mkt2_page6.png
Excluded length comps, retained, F4_PS_OBJ_Galapagos (plot 1 of 5).
'N adj.' is the input sample size after data-weighting adjustment. N eff. is the calculated effective sample size used in the McAllister-Ianelli tuning method.
file: comp_gstlenfit_flt4mkt2_page1.png

Excluded length comps, retained, F4_PS_OBJ_Galapagos (plot 1 of 5).
'N adj.' is the input sample size after data-weighting adjustment. N eff. is the calculated effective sample size used in the McAllister-Ianelli tuning method. (plot 2 of 5)
file: comp_gstlenfit_flt4mkt2_page2.png
Excluded length comps, retained, F4_PS_OBJ_Galapagos (plot 1 of 5).
'N adj.' is the input sample size after data-weighting adjustment. N eff. is the calculated effective sample size used in the McAllister-Ianelli tuning method. (plot 2 of 5) (plot 3 of 5)
file: comp_gstlenfit_flt4mkt2_page3.png
Excluded length comps, retained, F4_PS_OBJ_Galapagos (plot 1 of 5).
'N adj.' is the input sample size after data-weighting adjustment. N eff. is the calculated effective sample size used in the McAllister-Ianelli tuning method. (plot 2 of 5) (plot 3 of 5) (plot 4 of 5)
file: comp_gstlenfit_flt4mkt2_page4.png
Excluded length comps, retained, F4_PS_OBJ_Galapagos (plot 1 of 5).
'N adj.' is the input sample size after data-weighting adjustment. N eff. is the calculated effective sample size used in the McAllister-Ianelli tuning method. (plot 2 of 5) (plot 3 of 5) (plot 4 of 5) (plot 5 of 5)
file: comp_gstlenfit_flt4mkt2_page5.png

Pearson residuals, retained, F4_PS_OBJ_Galapagos (max=NA) (plot 5 of 5)
Closed bubbles are positive residuals (observed > expected) and open bubbles are negative residuals (observed < expected).
file: comp_gstlenfit_residsflt4mkt2_page5.png
Excluded length comps, whole catch, F6_PS_NOA_North_coastal (plot 1 of 6).
'N adj.' is the input sample size after data-weighting adjustment. N eff. is the calculated effective sample size used in the McAllister-Ianelli tuning method.
file: comp_gstlenfit_flt6mkt0_page1.png
Excluded length comps, whole catch, F6_PS_NOA_North_coastal (plot 1 of 6).
'N adj.' is the input sample size after data-weighting adjustment. N eff. is the calculated effective sample size used in the McAllister-Ianelli tuning method. (plot 2 of 6)
file: comp_gstlenfit_flt6mkt0_page2.png
Excluded length comps, whole catch, F6_PS_NOA_North_coastal (plot 1 of 6).
'N adj.' is the input sample size after data-weighting adjustment. N eff. is the calculated effective sample size used in the McAllister-Ianelli tuning method. (plot 2 of 6) (plot 3 of 6)
file: comp_gstlenfit_flt6mkt0_page3.png
Excluded length comps, whole catch, F6_PS_NOA_North_coastal (plot 1 of 6).
'N adj.' is the input sample size after data-weighting adjustment. N eff. is the calculated effective sample size used in the McAllister-Ianelli tuning method. (plot 2 of 6) (plot 3 of 6) (plot 4 of 6)
file: comp_gstlenfit_flt6mkt0_page4.png
Excluded length comps, whole catch, F6_PS_NOA_North_coastal (plot 1 of 6).
'N adj.' is the input sample size after data-weighting adjustment. N eff. is the calculated effective sample size used in the McAllister-Ianelli tuning method. (plot 2 of 6) (plot 3 of 6) (plot 4 of 6) (plot 5 of 6)
file: comp_gstlenfit_flt6mkt0_page5.png
Excluded length comps, whole catch, F6_PS_NOA_North_coastal (plot 1 of 6).
'N adj.' is the input sample size after data-weighting adjustment. N eff. is the calculated effective sample size used in the McAllister-Ianelli tuning method. (plot 2 of 6) (plot 3 of 6) (plot 4 of 6) (plot 5 of 6) (plot 6 of 6)
file: comp_gstlenfit_flt6mkt0_page6.png

Pearson residuals, whole catch, F6_PS_NOA_North_coastal (max=NA) (plot 6 of 6)
Closed bubbles are positive residuals (observed > expected) and open bubbles are negative residuals (observed < expected).
file: comp_gstlenfit_residsflt6mkt0_page6.png
Excluded length comps, whole catch, F7_PS_NOA_Core_small (plot 1 of 2).
'N adj.' is the input sample size after data-weighting adjustment. N eff. is the calculated effective sample size used in the McAllister-Ianelli tuning method.
file: comp_gstlenfit_flt7mkt0_page1.png
Excluded length comps, whole catch, F7_PS_NOA_Core_small (plot 1 of 2).
'N adj.' is the input sample size after data-weighting adjustment. N eff. is the calculated effective sample size used in the McAllister-Ianelli tuning method. (plot 2 of 2)
file: comp_gstlenfit_flt7mkt0_page2.png

Pearson residuals, whole catch, F7_PS_NOA_Core_small (max=NA) (plot 2 of 2)
Closed bubbles are positive residuals (observed > expected) and open bubbles are negative residuals (observed < expected).
file: comp_gstlenfit_residsflt7mkt0_page2.png
Excluded length comps, retained, F8_PS_NOA_Core_large (plot 1 of 2).
'N adj.' is the input sample size after data-weighting adjustment. N eff. is the calculated effective sample size used in the McAllister-Ianelli tuning method.
file: comp_gstlenfit_flt8mkt2_page1.png
Excluded length comps, retained, F8_PS_NOA_Core_large (plot 1 of 2).
'N adj.' is the input sample size after data-weighting adjustment. N eff. is the calculated effective sample size used in the McAllister-Ianelli tuning method. (plot 2 of 2)
file: comp_gstlenfit_flt8mkt2_page2.png

Pearson residuals, retained, F8_PS_NOA_Core_large (max=NA) (plot 2 of 2)
Closed bubbles are positive residuals (observed > expected) and open bubbles are negative residuals (observed < expected).
file: comp_gstlenfit_residsflt8mkt2_page2.png
Excluded length comps, whole catch, F11_PS_NOA_Galapagos_small (plot 1 of 2).
'N adj.' is the input sample size after data-weighting adjustment. N eff. is the calculated effective sample size used in the McAllister-Ianelli tuning method.
file: comp_gstlenfit_flt11mkt0_page1.png
Excluded length comps, whole catch, F11_PS_NOA_Galapagos_small (plot 1 of 2).
'N adj.' is the input sample size after data-weighting adjustment. N eff. is the calculated effective sample size used in the McAllister-Ianelli tuning method. (plot 2 of 2)
file: comp_gstlenfit_flt11mkt0_page2.png

Pearson residuals, whole catch, F11_PS_NOA_Galapagos_small (max=NA) (plot 2 of 2)
Closed bubbles are positive residuals (observed > expected) and open bubbles are negative residuals (observed < expected).
file: comp_gstlenfit_residsflt11mkt0_page2.png
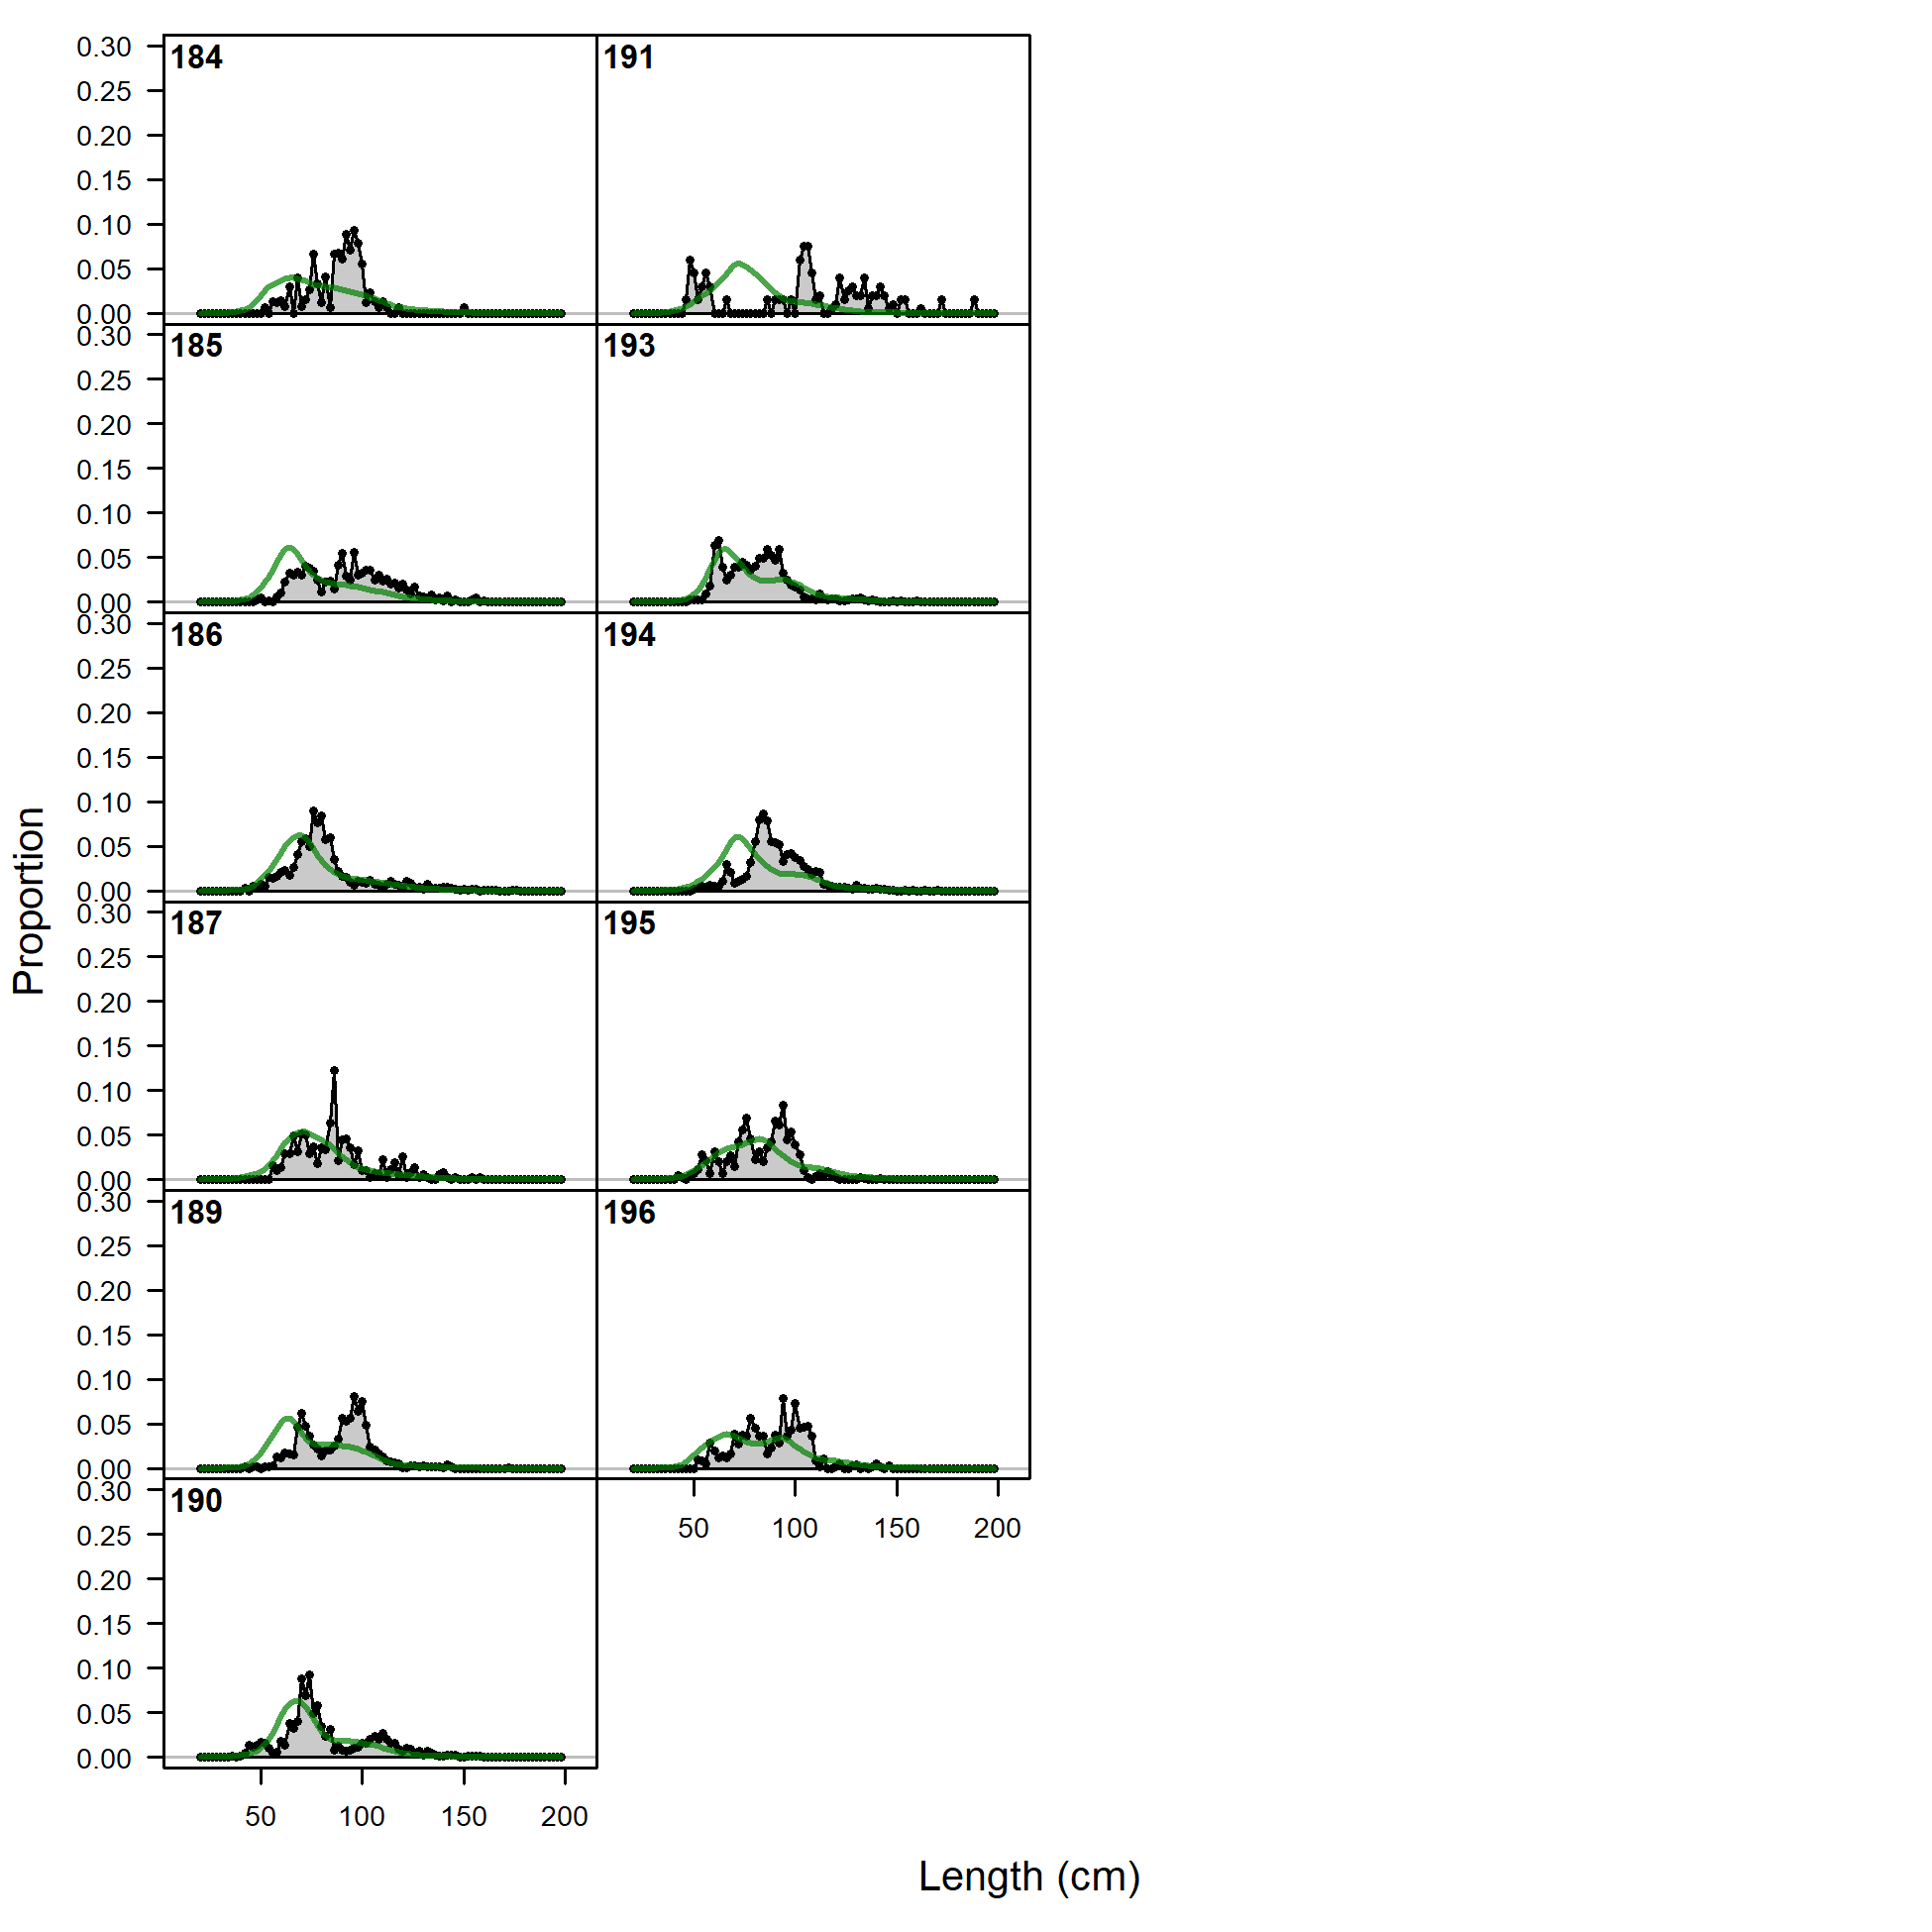
Excluded length comps, retained, F12_PS_NOA_Galapagos_large (plot 1 of 2).
'N adj.' is the input sample size after data-weighting adjustment. N eff. is the calculated effective sample size used in the McAllister-Ianelli tuning method.
file: comp_gstlenfit_flt12mkt2_page1.png
Excluded length comps, retained, F12_PS_NOA_Galapagos_large (plot 1 of 2).
'N adj.' is the input sample size after data-weighting adjustment. N eff. is the calculated effective sample size used in the McAllister-Ianelli tuning method. (plot 2 of 2)
file: comp_gstlenfit_flt12mkt2_page2.png

Pearson residuals, retained, F12_PS_NOA_Galapagos_large (max=NA) (plot 2 of 2)
Closed bubbles are positive residuals (observed > expected) and open bubbles are negative residuals (observed < expected).
file: comp_gstlenfit_residsflt12mkt2_page2.png

Excluded length comps, whole catch, F14_PS_DEL_North_coastal (plot 1 of 7).
'N adj.' is the input sample size after data-weighting adjustment. N eff. is the calculated effective sample size used in the McAllister-Ianelli tuning method.
file: comp_gstlenfit_flt14mkt0_page1.png
Excluded length comps, whole catch, F14_PS_DEL_North_coastal (plot 1 of 7).
'N adj.' is the input sample size after data-weighting adjustment. N eff. is the calculated effective sample size used in the McAllister-Ianelli tuning method. (plot 2 of 7)
file: comp_gstlenfit_flt14mkt0_page2.png
Excluded length comps, whole catch, F14_PS_DEL_North_coastal (plot 1 of 7).
'N adj.' is the input sample size after data-weighting adjustment. N eff. is the calculated effective sample size used in the McAllister-Ianelli tuning method. (plot 2 of 7) (plot 3 of 7)
file: comp_gstlenfit_flt14mkt0_page3.png
Excluded length comps, whole catch, F14_PS_DEL_North_coastal (plot 1 of 7).
'N adj.' is the input sample size after data-weighting adjustment. N eff. is the calculated effective sample size used in the McAllister-Ianelli tuning method. (plot 2 of 7) (plot 3 of 7) (plot 4 of 7)
file: comp_gstlenfit_flt14mkt0_page4.png
Excluded length comps, whole catch, F14_PS_DEL_North_coastal (plot 1 of 7).
'N adj.' is the input sample size after data-weighting adjustment. N eff. is the calculated effective sample size used in the McAllister-Ianelli tuning method. (plot 2 of 7) (plot 3 of 7) (plot 4 of 7) (plot 5 of 7)
file: comp_gstlenfit_flt14mkt0_page5.png
Excluded length comps, whole catch, F14_PS_DEL_North_coastal (plot 1 of 7).
'N adj.' is the input sample size after data-weighting adjustment. N eff. is the calculated effective sample size used in the McAllister-Ianelli tuning method. (plot 2 of 7) (plot 3 of 7) (plot 4 of 7) (plot 5 of 7) (plot 6 of 7)
file: comp_gstlenfit_flt14mkt0_page6.png
Excluded length comps, whole catch, F14_PS_DEL_North_coastal (plot 1 of 7).
'N adj.' is the input sample size after data-weighting adjustment. N eff. is the calculated effective sample size used in the McAllister-Ianelli tuning method. (plot 2 of 7) (plot 3 of 7) (plot 4 of 7) (plot 5 of 7) (plot 6 of 7) (plot 7 of 7)
file: comp_gstlenfit_flt14mkt0_page7.png

Pearson residuals, whole catch, F14_PS_DEL_North_coastal (max=NA) (plot 7 of 7)
Closed bubbles are positive residuals (observed > expected) and open bubbles are negative residuals (observed < expected).
file: comp_gstlenfit_residsflt14mkt0_page7.png
Excluded length comps, whole catch, F15_PS_DEL_Core (plot 1 of 7).
'N adj.' is the input sample size after data-weighting adjustment. N eff. is the calculated effective sample size used in the McAllister-Ianelli tuning method.
file: comp_gstlenfit_flt15mkt0_page1.png
Excluded length comps, whole catch, F15_PS_DEL_Core (plot 1 of 7).
'N adj.' is the input sample size after data-weighting adjustment. N eff. is the calculated effective sample size used in the McAllister-Ianelli tuning method. (plot 2 of 7)
file: comp_gstlenfit_flt15mkt0_page2.png
Excluded length comps, whole catch, F15_PS_DEL_Core (plot 1 of 7).
'N adj.' is the input sample size after data-weighting adjustment. N eff. is the calculated effective sample size used in the McAllister-Ianelli tuning method. (plot 2 of 7) (plot 3 of 7)
file: comp_gstlenfit_flt15mkt0_page3.png
Excluded length comps, whole catch, F15_PS_DEL_Core (plot 1 of 7).
'N adj.' is the input sample size after data-weighting adjustment. N eff. is the calculated effective sample size used in the McAllister-Ianelli tuning method. (plot 2 of 7) (plot 3 of 7) (plot 4 of 7)
file: comp_gstlenfit_flt15mkt0_page4.png
Excluded length comps, whole catch, F15_PS_DEL_Core (plot 1 of 7).
'N adj.' is the input sample size after data-weighting adjustment. N eff. is the calculated effective sample size used in the McAllister-Ianelli tuning method. (plot 2 of 7) (plot 3 of 7) (plot 4 of 7) (plot 5 of 7)
file: comp_gstlenfit_flt15mkt0_page5.png
Excluded length comps, whole catch, F15_PS_DEL_Core (plot 1 of 7).
'N adj.' is the input sample size after data-weighting adjustment. N eff. is the calculated effective sample size used in the McAllister-Ianelli tuning method. (plot 2 of 7) (plot 3 of 7) (plot 4 of 7) (plot 5 of 7) (plot 6 of 7)
file: comp_gstlenfit_flt15mkt0_page6.png
Excluded length comps, whole catch, F15_PS_DEL_Core (plot 1 of 7).
'N adj.' is the input sample size after data-weighting adjustment. N eff. is the calculated effective sample size used in the McAllister-Ianelli tuning method. (plot 2 of 7) (plot 3 of 7) (plot 4 of 7) (plot 5 of 7) (plot 6 of 7) (plot 7 of 7)
file: comp_gstlenfit_flt15mkt0_page7.png

Pearson residuals, whole catch, F15_PS_DEL_Core (max=NA) (plot 7 of 7)
Closed bubbles are positive residuals (observed > expected) and open bubbles are negative residuals (observed < expected).
file: comp_gstlenfit_residsflt15mkt0_page7.png
Excluded length comps, whole catch, F17_PS_DEL_Galapagos (plot 1 of 4).
'N adj.' is the input sample size after data-weighting adjustment. N eff. is the calculated effective sample size used in the McAllister-Ianelli tuning method.
file: comp_gstlenfit_flt17mkt0_page1.png
Excluded length comps, whole catch, F17_PS_DEL_Galapagos (plot 1 of 4).
'N adj.' is the input sample size after data-weighting adjustment. N eff. is the calculated effective sample size used in the McAllister-Ianelli tuning method. (plot 2 of 4)
file: comp_gstlenfit_flt17mkt0_page2.png
Excluded length comps, whole catch, F17_PS_DEL_Galapagos (plot 1 of 4).
'N adj.' is the input sample size after data-weighting adjustment. N eff. is the calculated effective sample size used in the McAllister-Ianelli tuning method. (plot 2 of 4) (plot 3 of 4)
file: comp_gstlenfit_flt17mkt0_page3.png
Excluded length comps, whole catch, F17_PS_DEL_Galapagos (plot 1 of 4).
'N adj.' is the input sample size after data-weighting adjustment. N eff. is the calculated effective sample size used in the McAllister-Ianelli tuning method. (plot 2 of 4) (plot 3 of 4) (plot 4 of 4)
file: comp_gstlenfit_flt17mkt0_page4.png

Pearson residuals, whole catch, F17_PS_DEL_Galapagos (max=NA) (plot 4 of 4)
Closed bubbles are positive residuals (observed > expected) and open bubbles are negative residuals (observed < expected).
file: comp_gstlenfit_residsflt17mkt0_page4.png
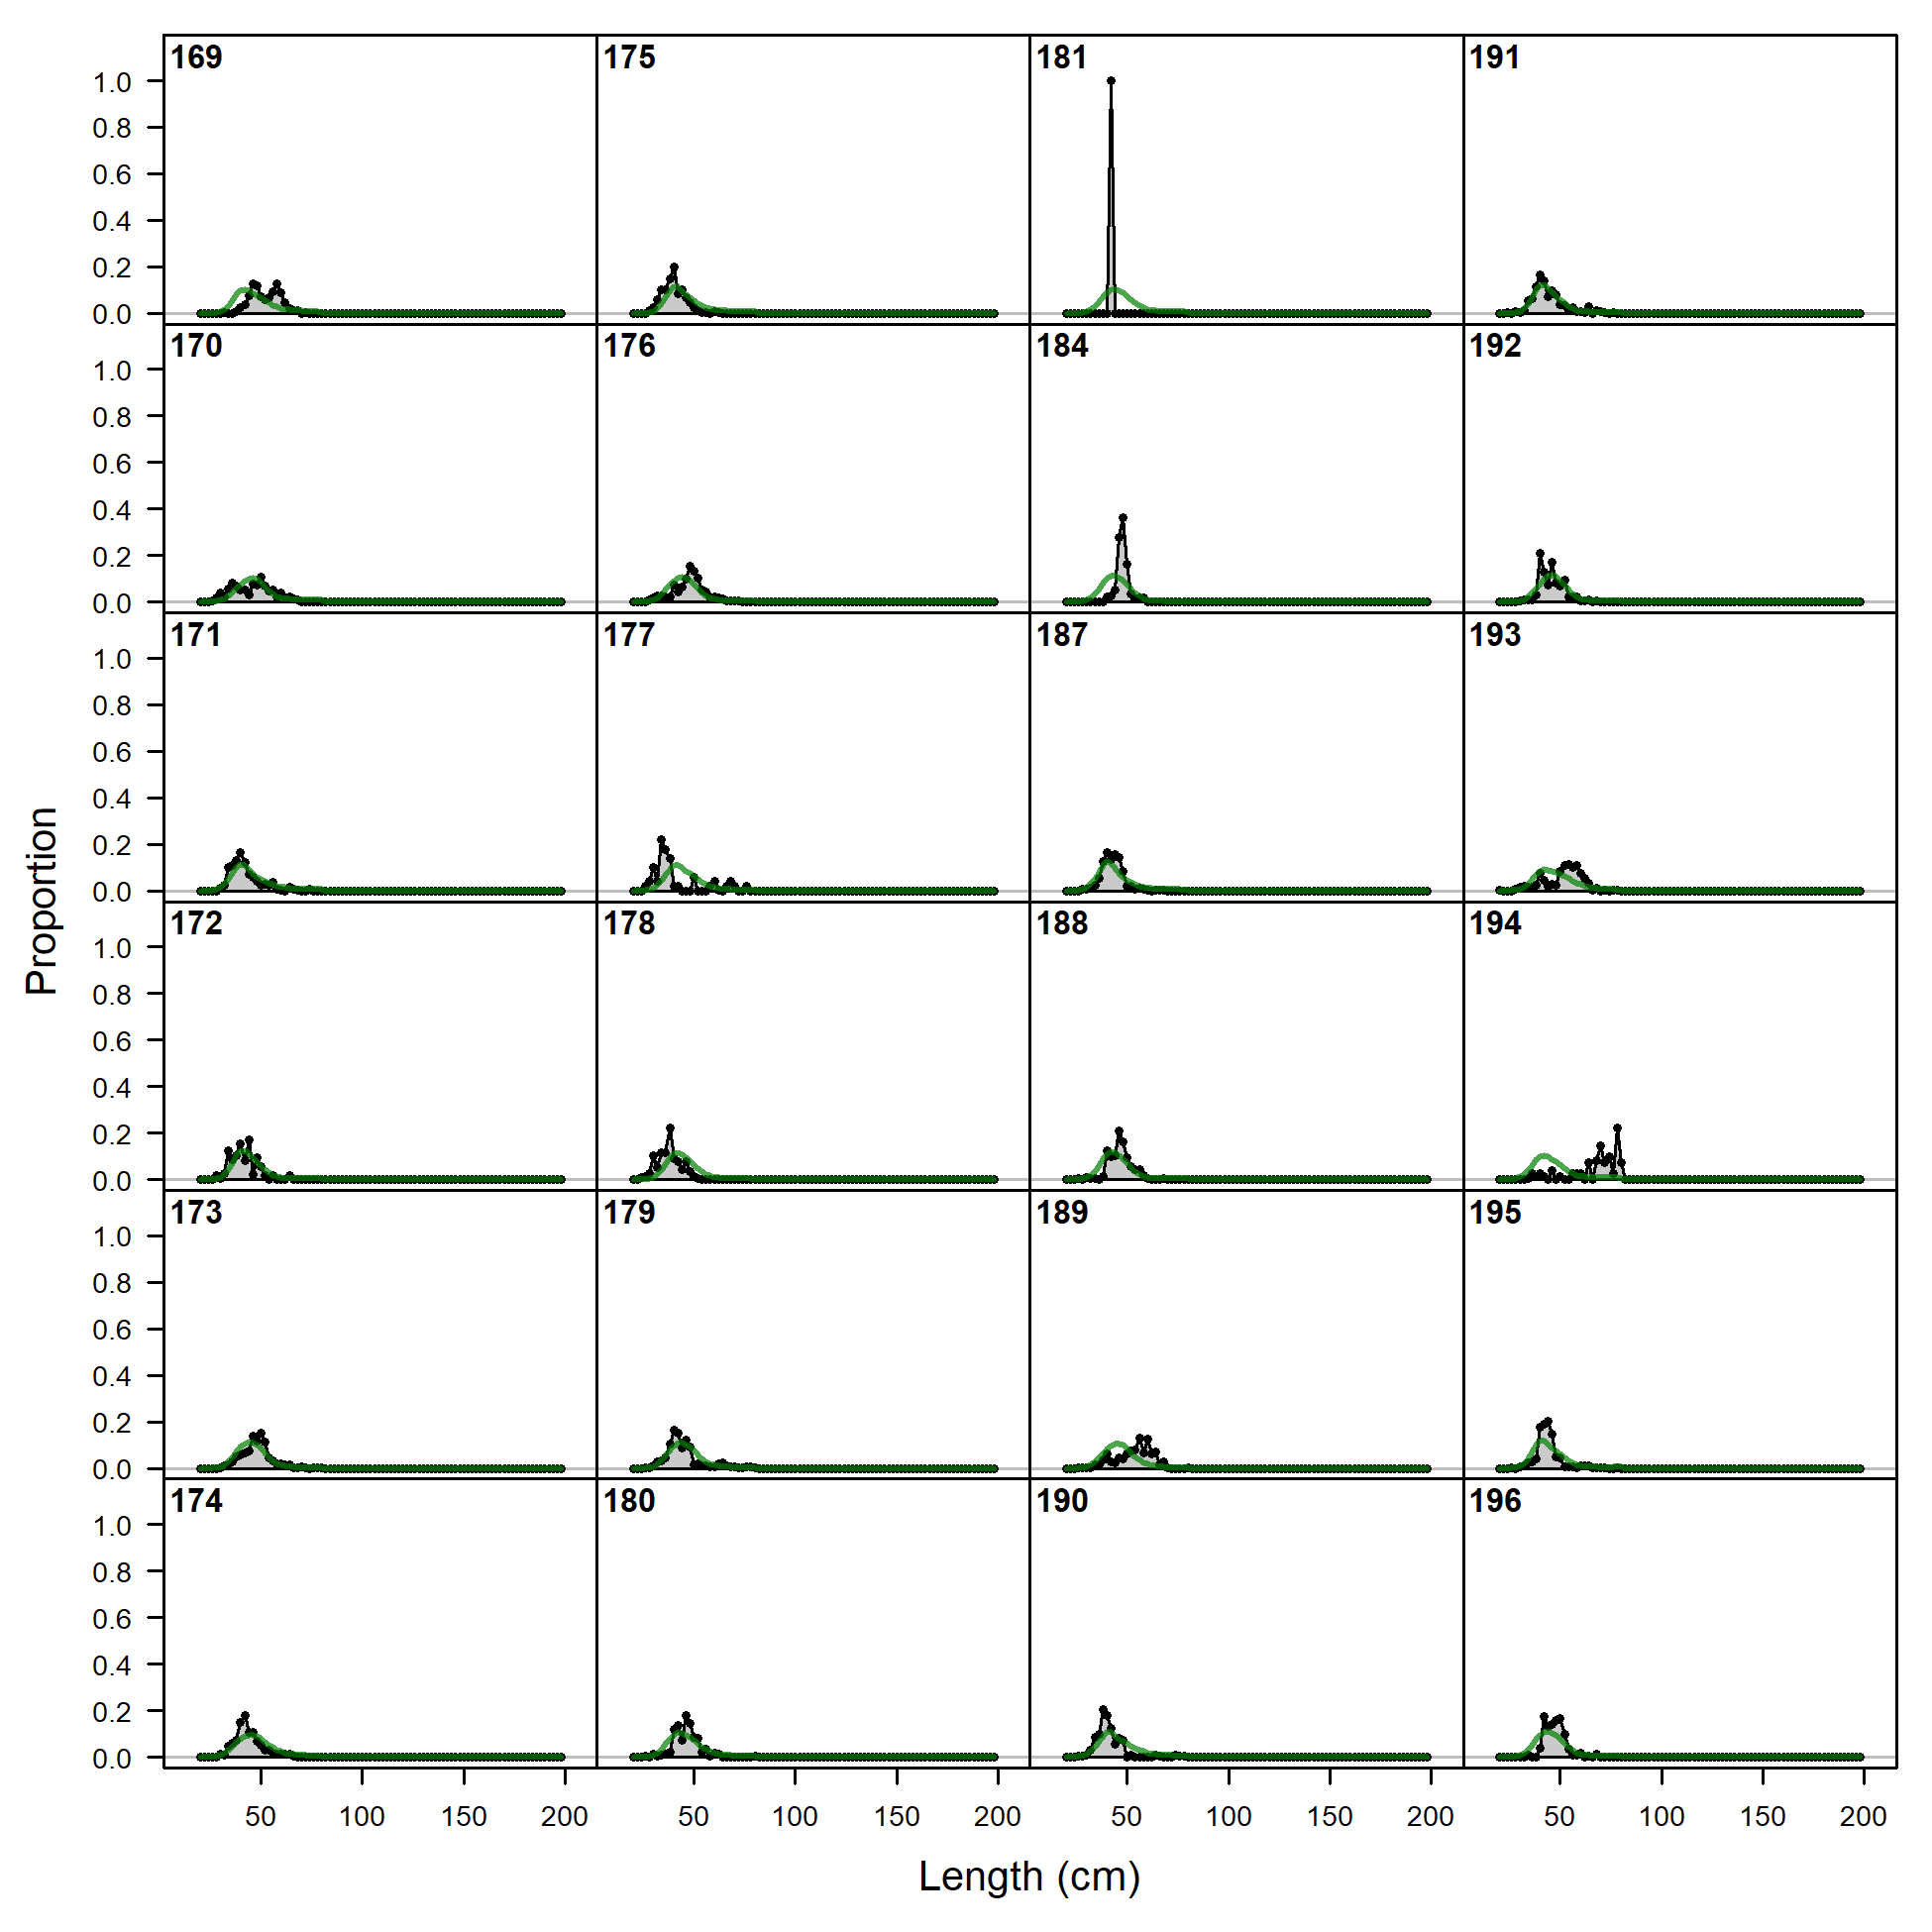
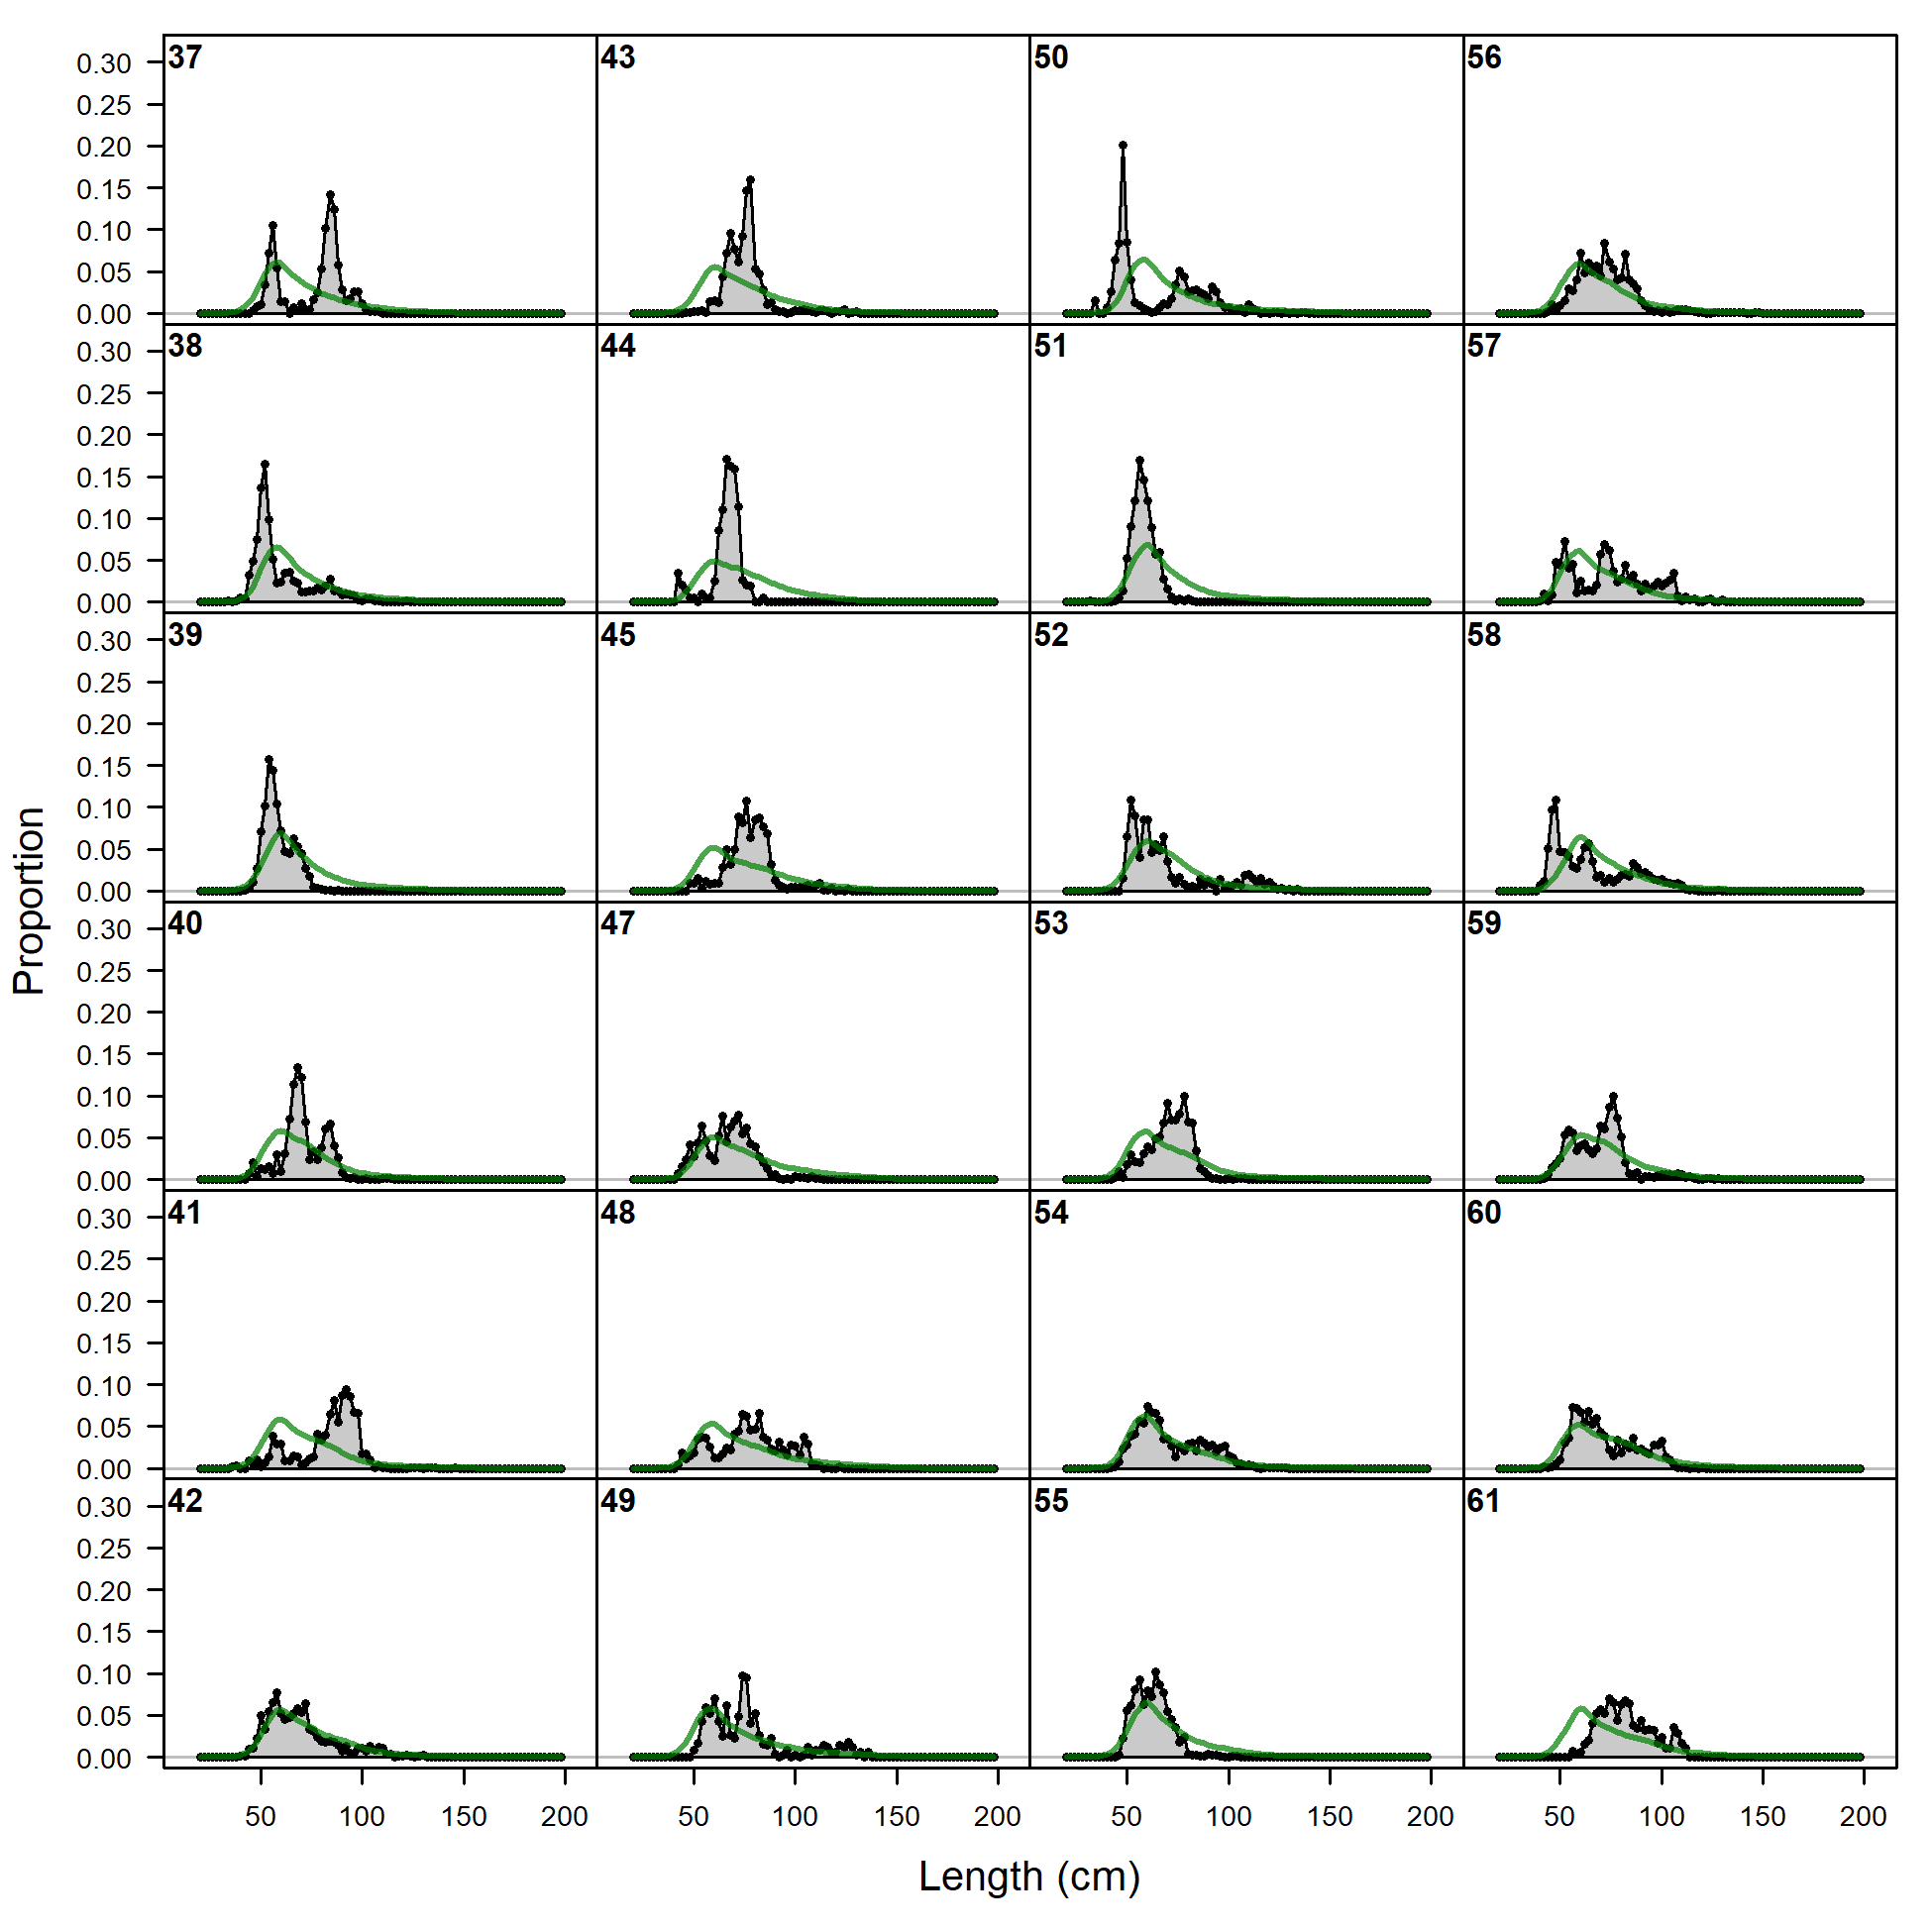
Excluded length comps, whole catch, F23_LP (plot 1 of 3).
'N adj.' is the input sample size after data-weighting adjustment. N eff. is the calculated effective sample size used in the McAllister-Ianelli tuning method.
file: comp_gstlenfit_flt23mkt0_page1.png
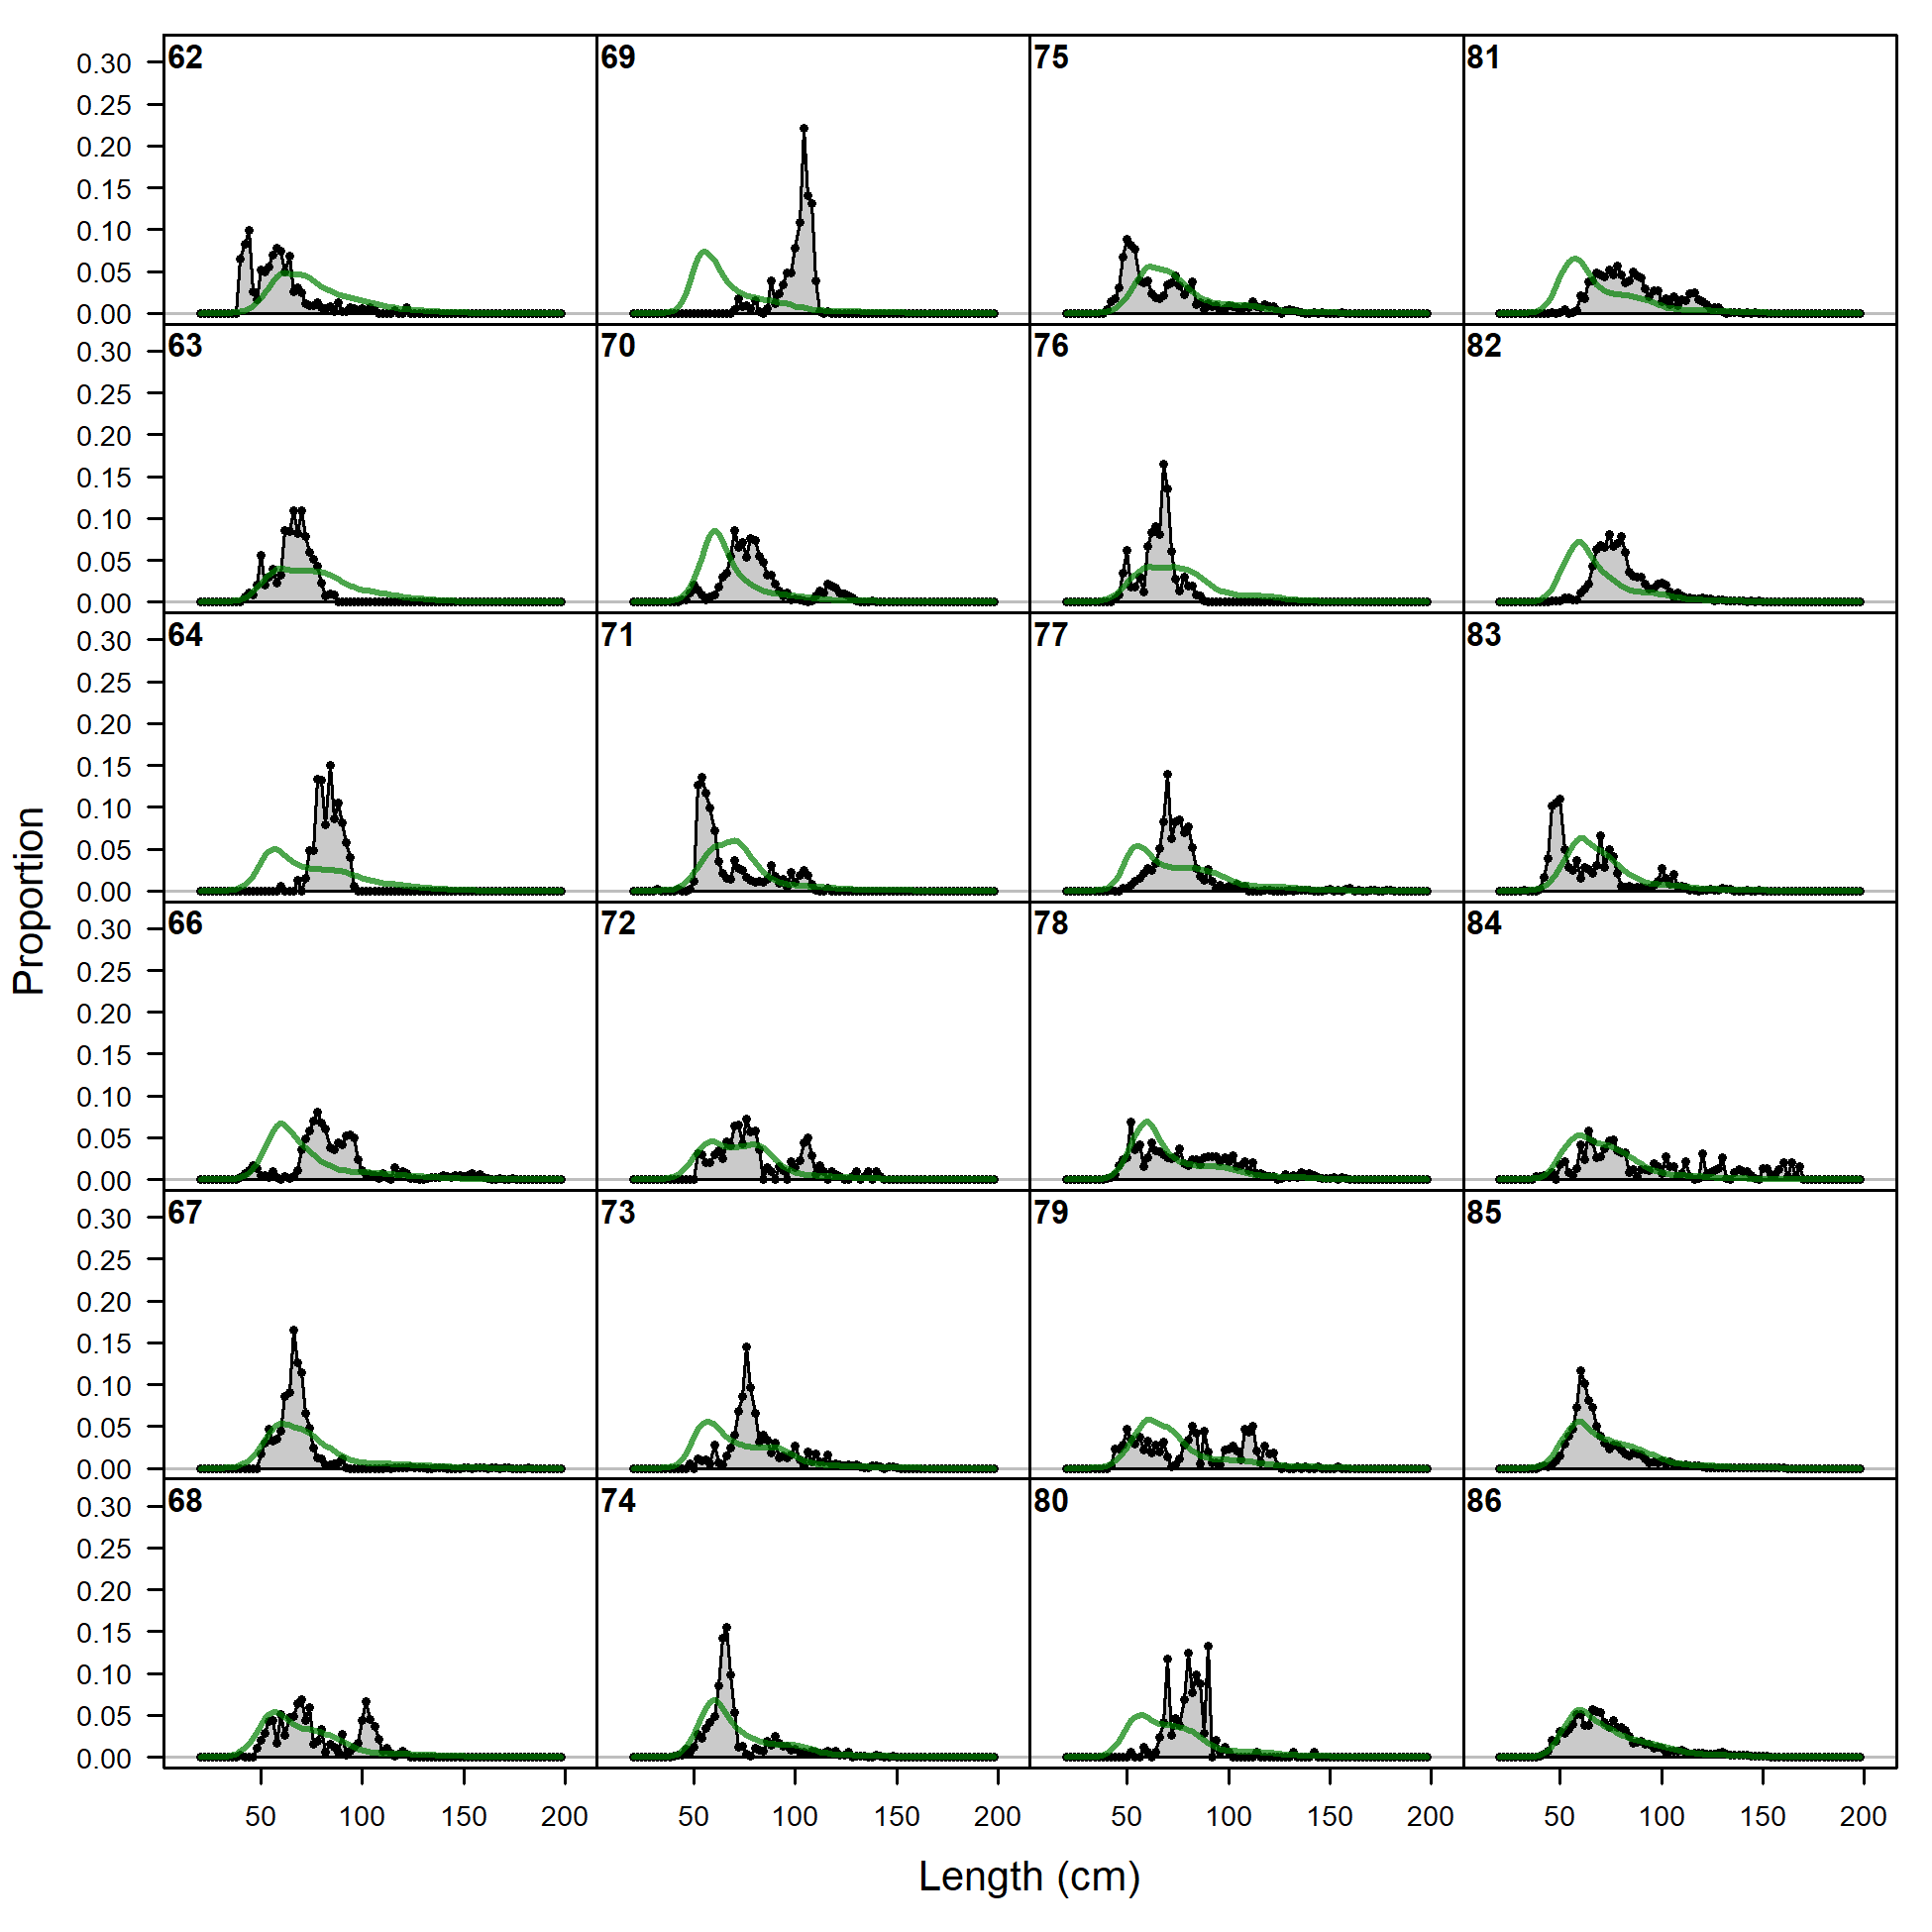
Excluded length comps, whole catch, F23_LP (plot 1 of 3).
'N adj.' is the input sample size after data-weighting adjustment. N eff. is the calculated effective sample size used in the McAllister-Ianelli tuning method. (plot 2 of 3)
file: comp_gstlenfit_flt23mkt0_page2.png
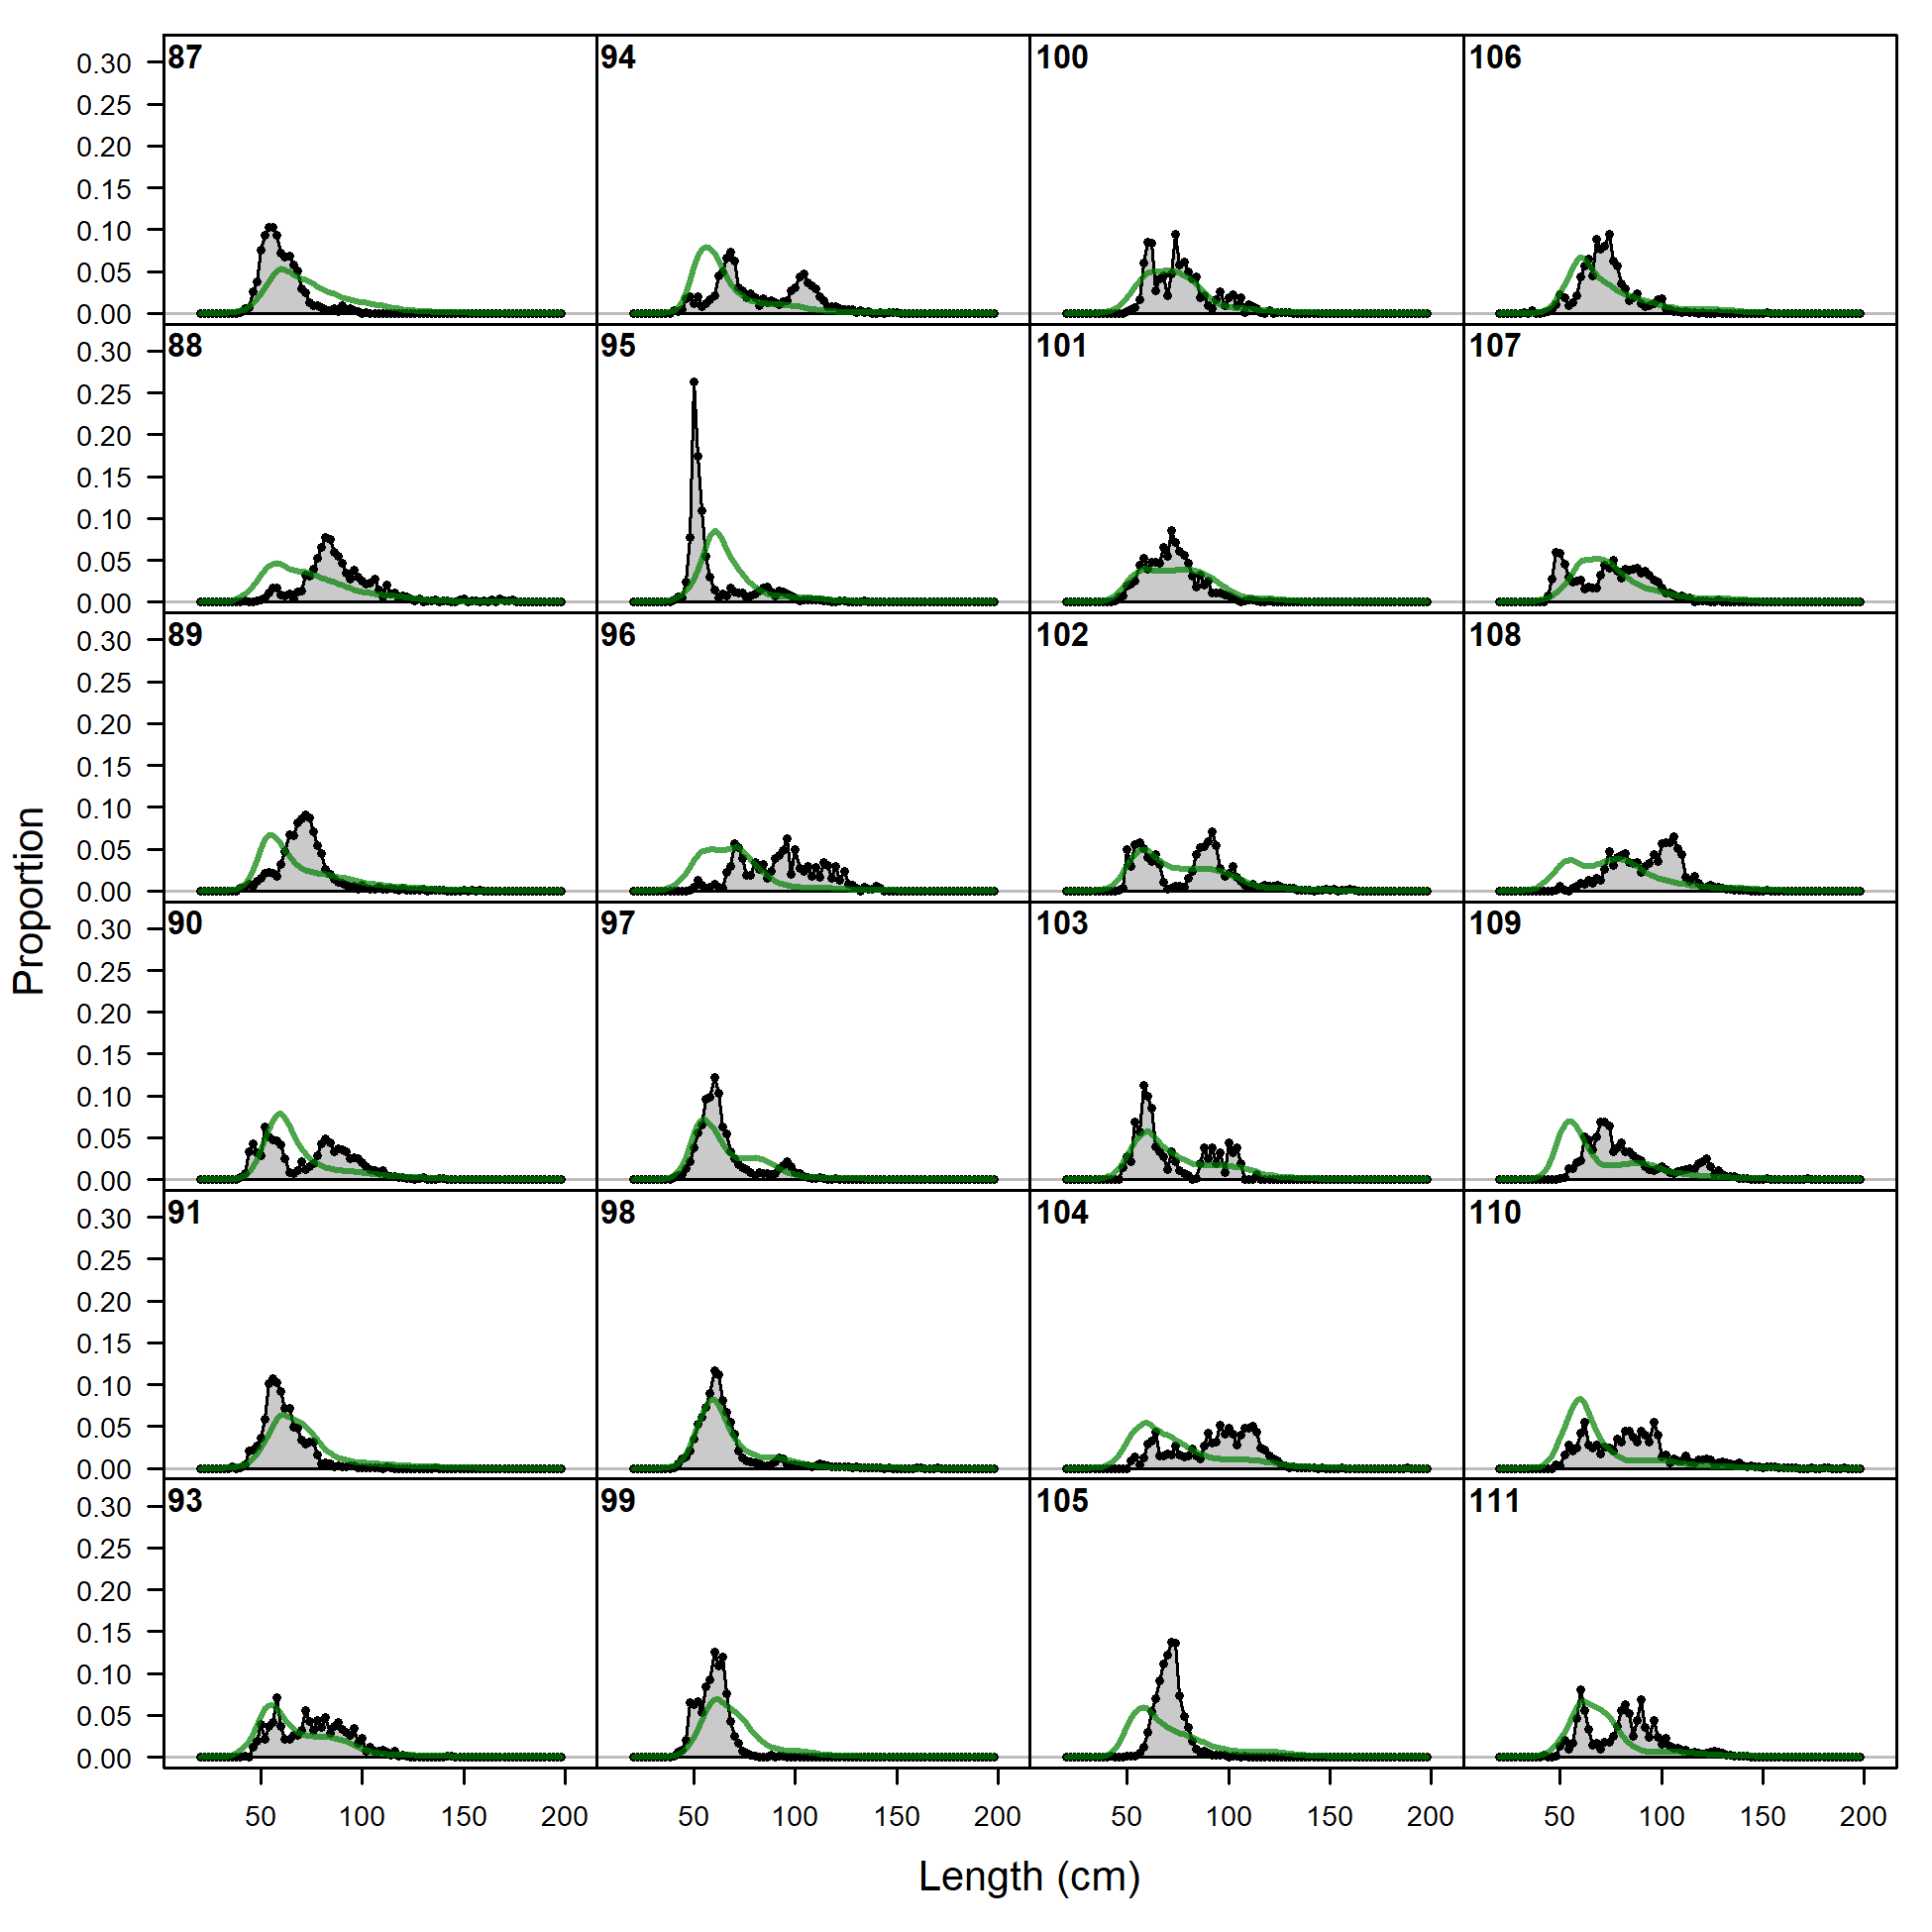
Excluded length comps, whole catch, F23_LP (plot 1 of 3).
'N adj.' is the input sample size after data-weighting adjustment. N eff. is the calculated effective sample size used in the McAllister-Ianelli tuning method. (plot 2 of 3) (plot 3 of 3)
file: comp_gstlenfit_flt23mkt0_page3.png

Pearson residuals, whole catch, F23_LP (max=NA) (plot 3 of 3)
Closed bubbles are positive residuals (observed > expected) and open bubbles are negative residuals (observed < expected).
file: comp_gstlenfit_residsflt23mkt0_page3.png