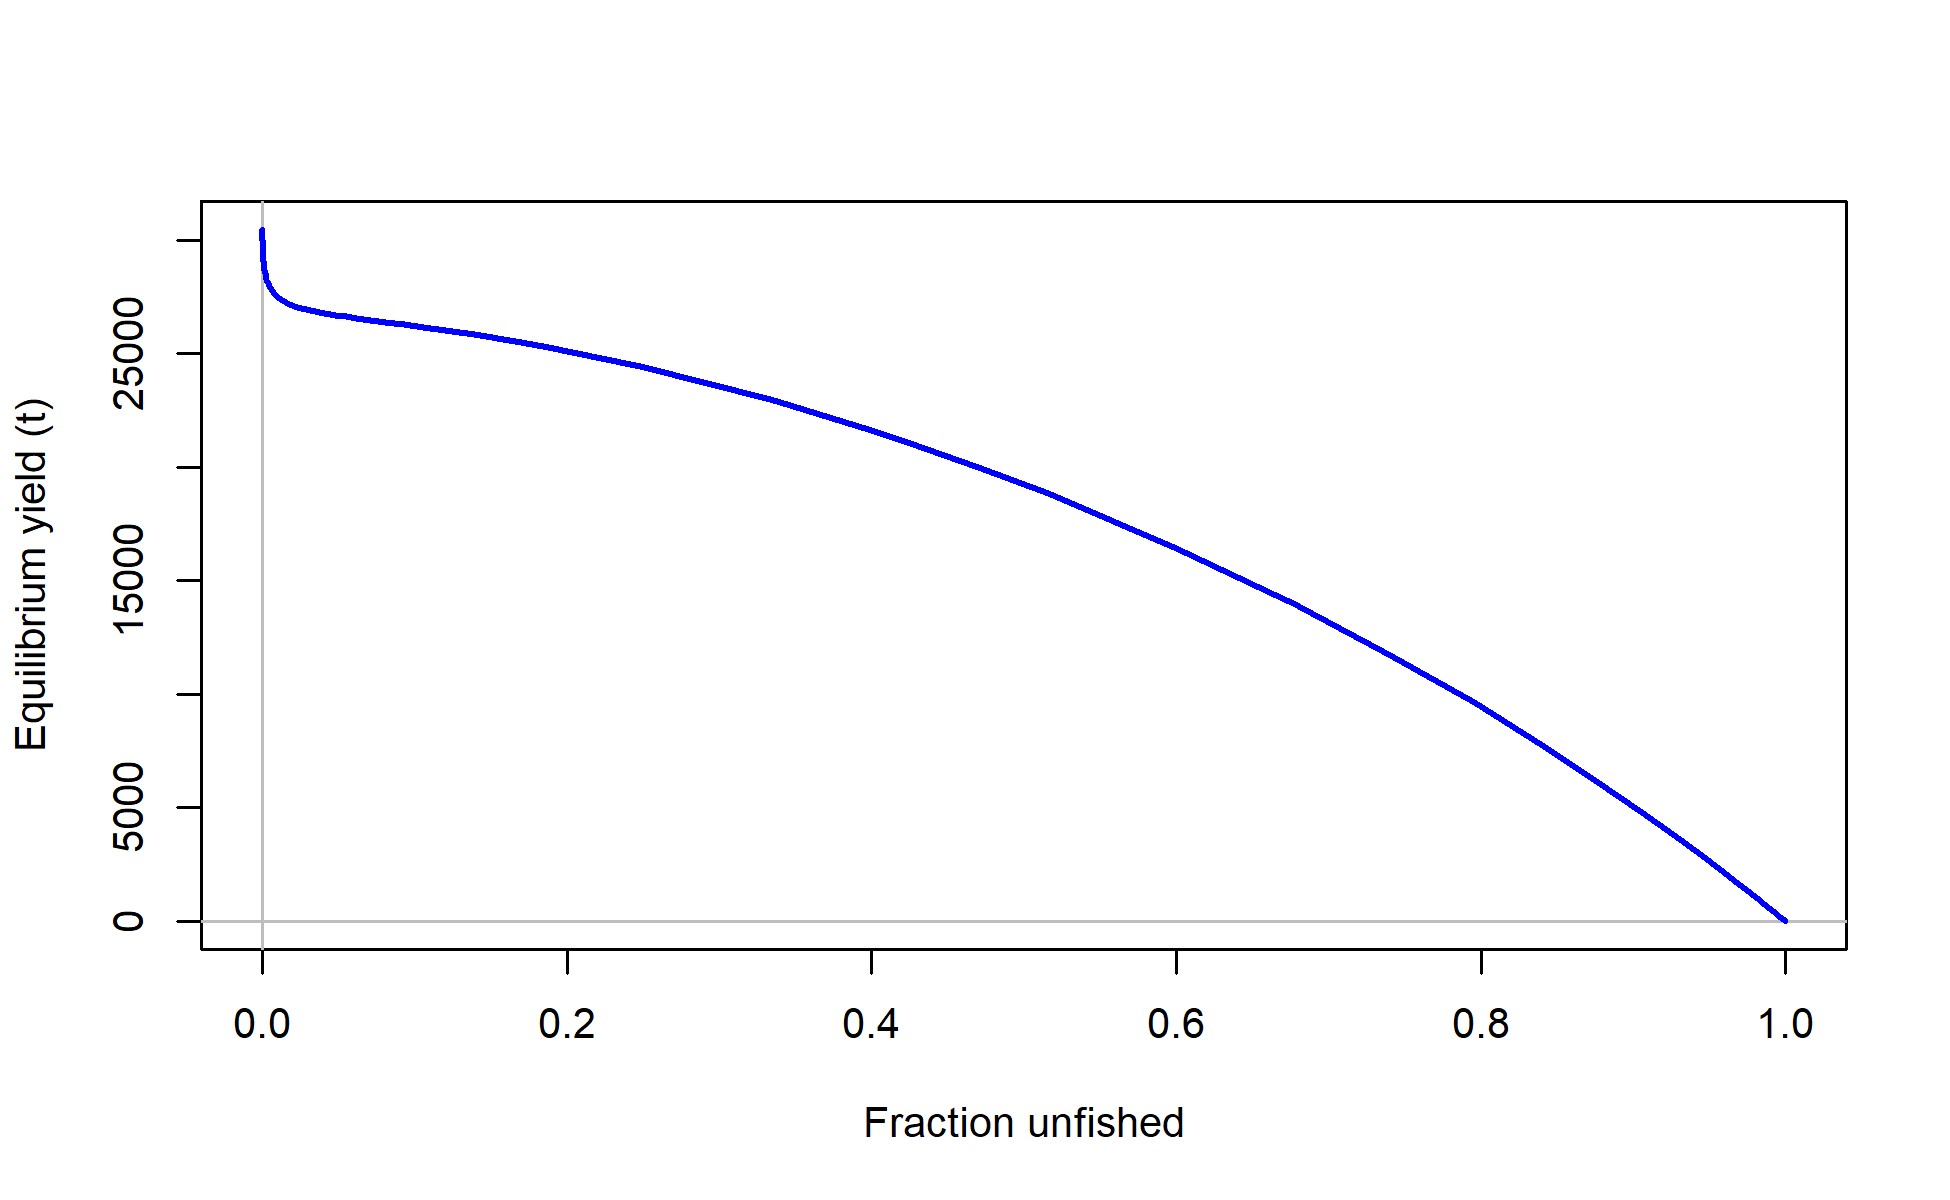
Yield curve
file: yield1_yield_curve.png
Yield curve
file: yield1_yield_curve.png
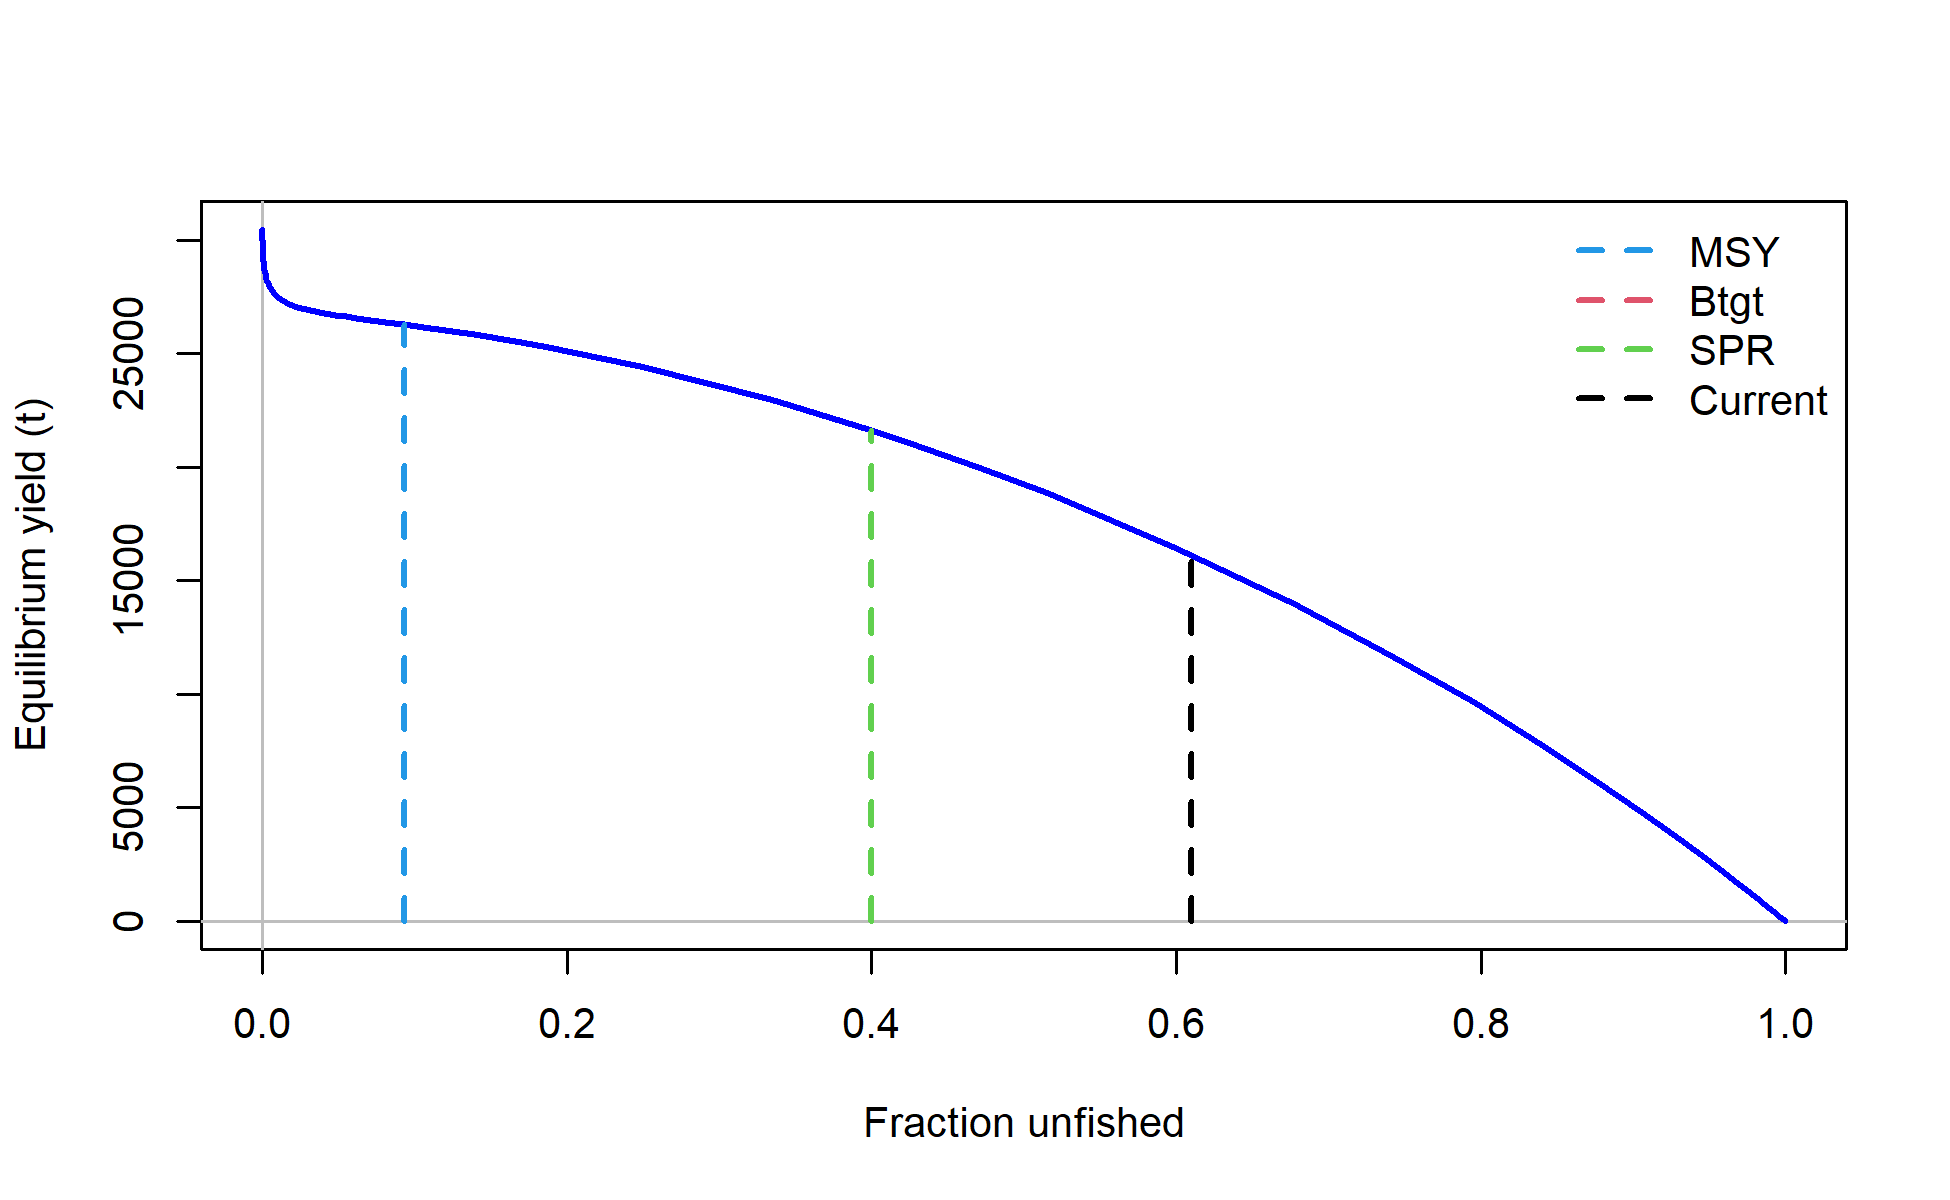
Yield curve with reference points
file: yield2_yield_curve_with_refpoints.png
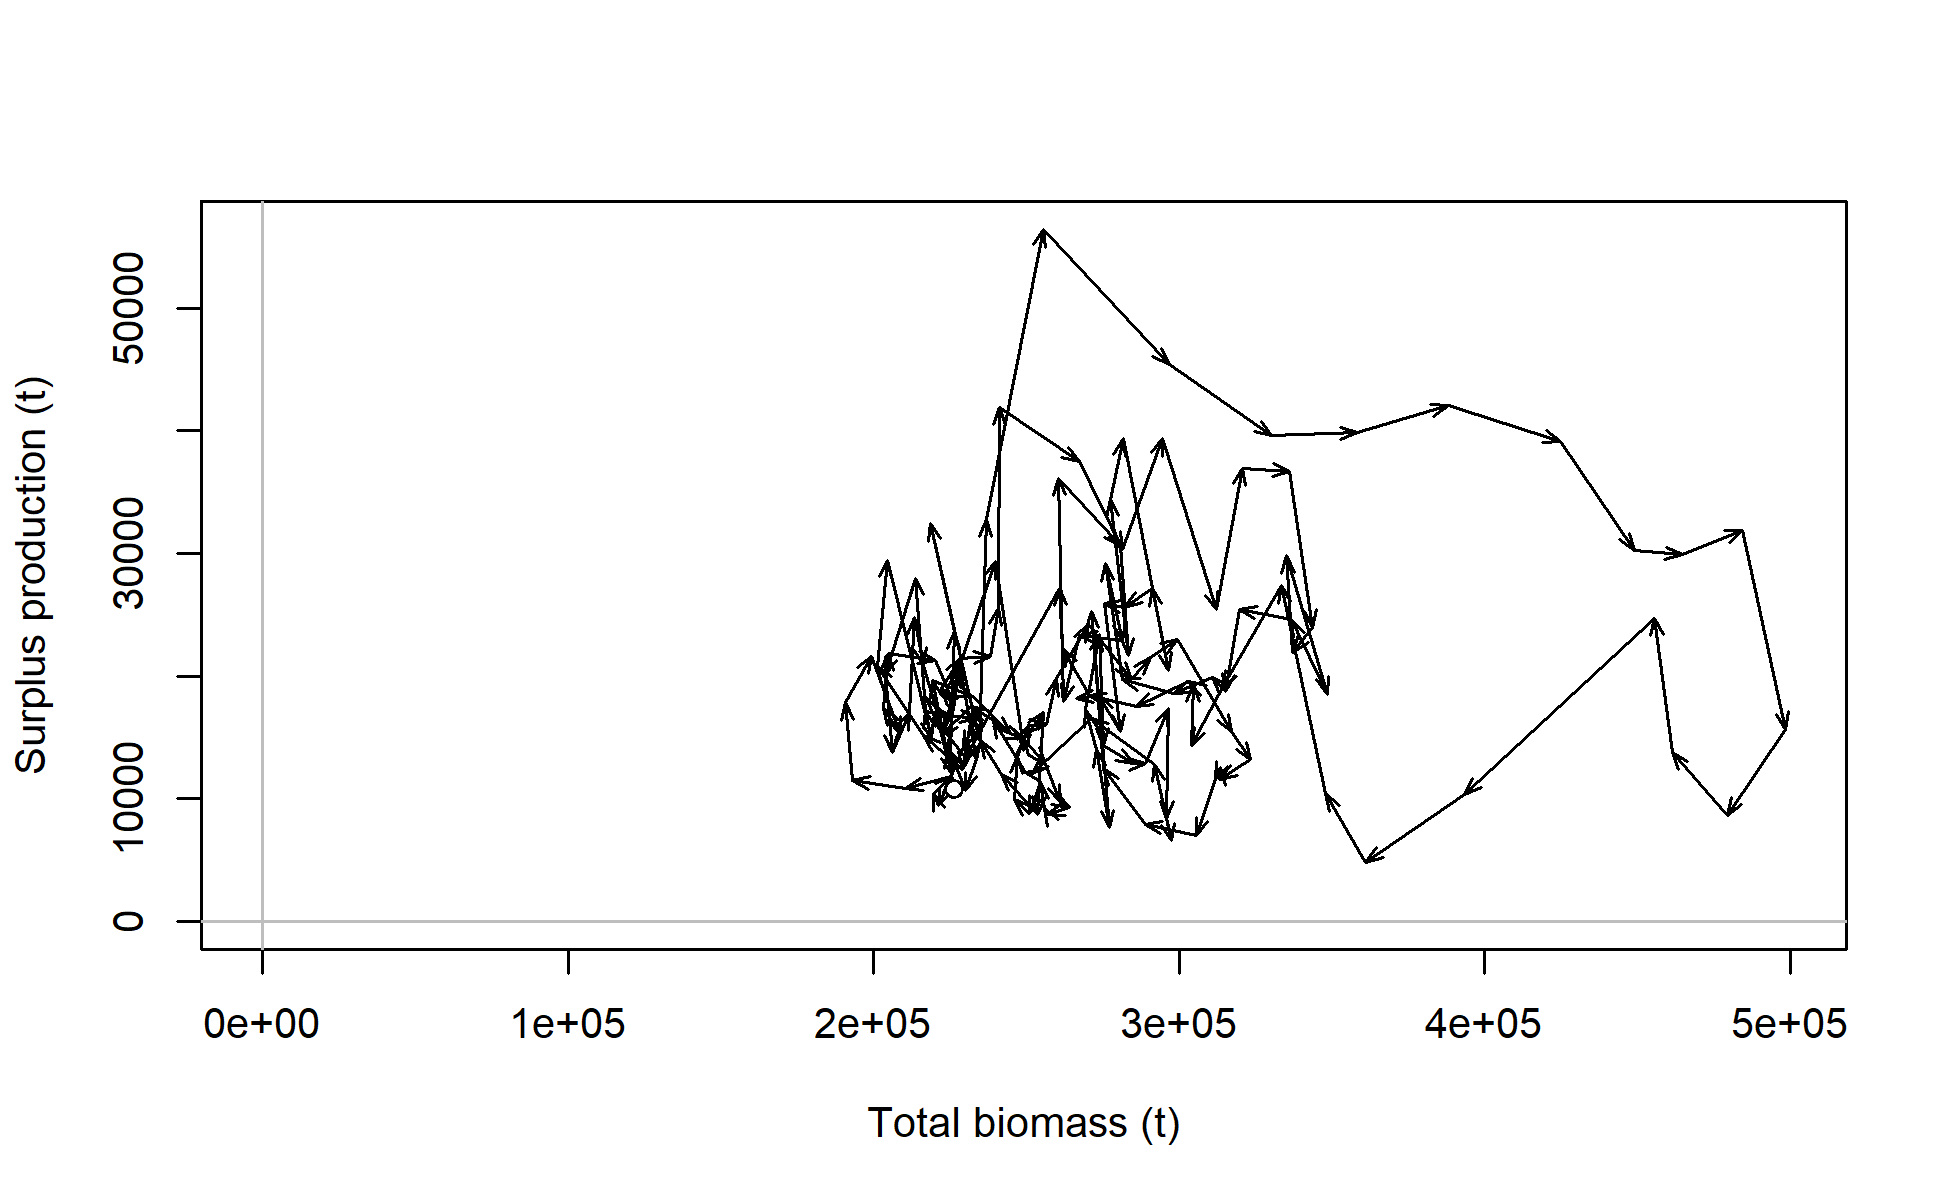
Surplus production vs. total biomass plot. For interpretation, see
Walters, Hilborn, and Christensen, 2008, Surplus production dynamics in declining and recovering fish populations. Can. J. Fish. Aquat. Sci. 65: 2536-2551. https://doi.org/10.1139/F08-170.
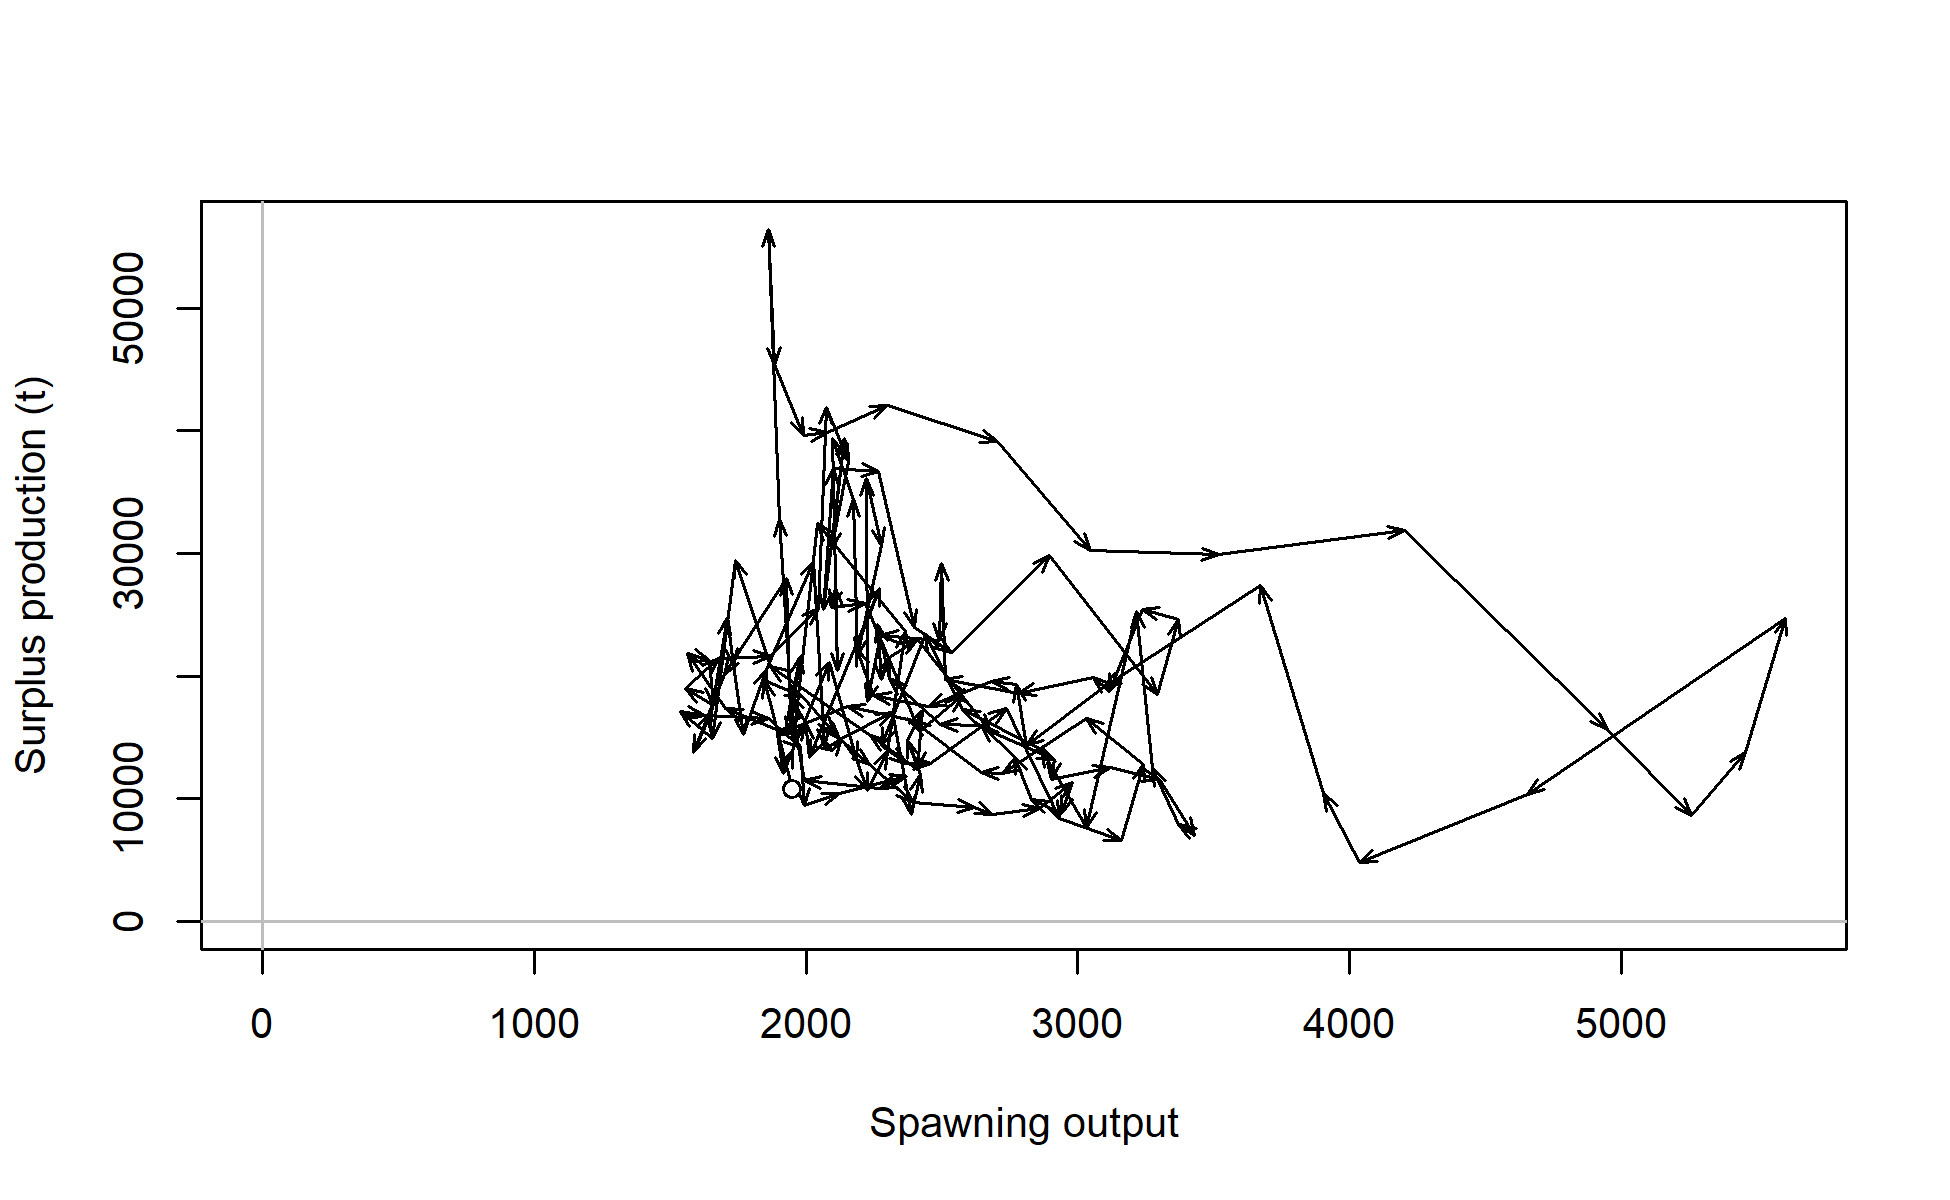
Surplus production vs. spawning biomass plot. For interpretation, see
Forrest, Kronlund, Cleary, and Grinnell. 2023. An evidence-based approach for selecting a limit reference point for Pacific herring (Clupea pallasii) stocks in British Columbia, Canada. Can. J. Fish. Aquat. Sci. 80: 1071-1083. https://doi.org/10.1139/cjfas-2022-0168.
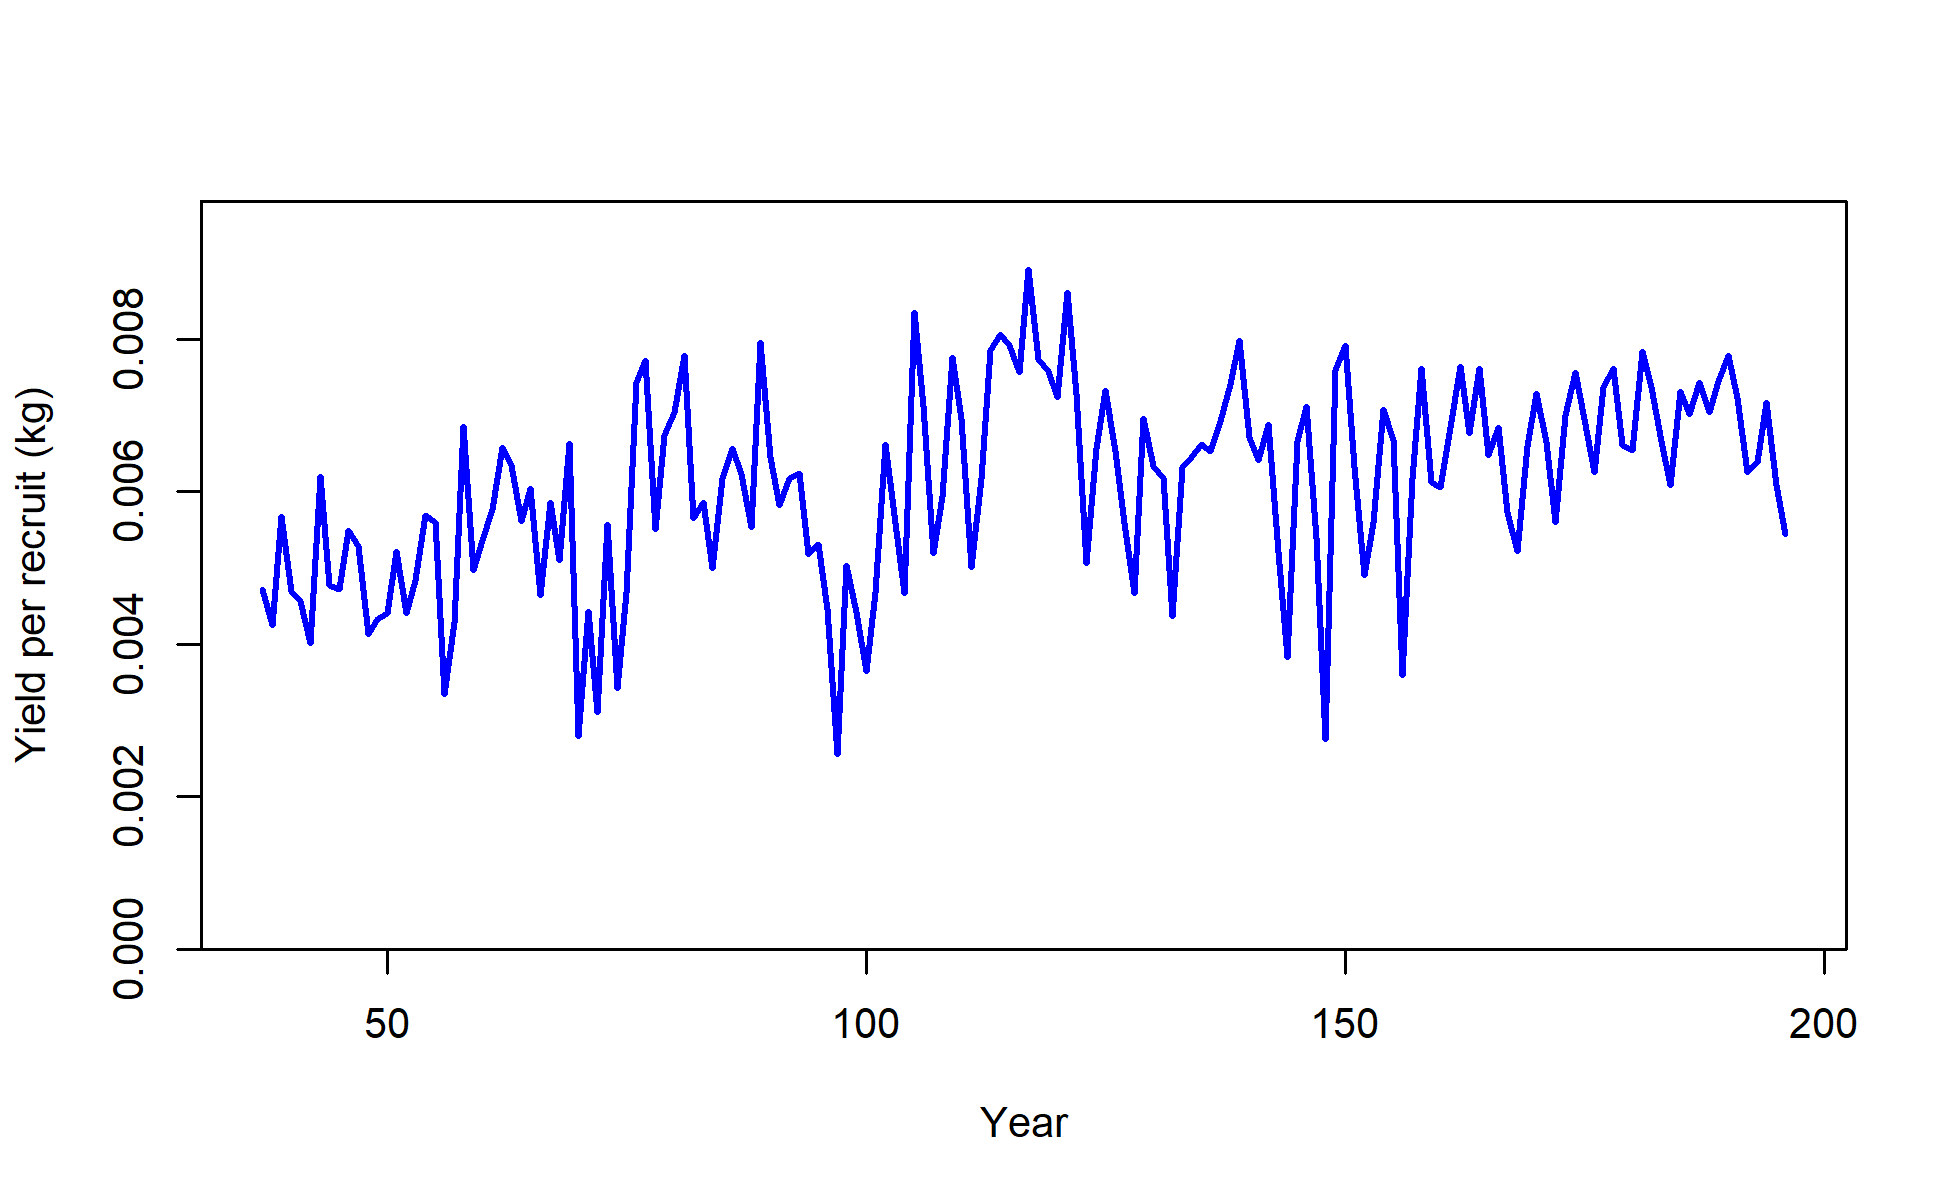
Time series of yield per recruit (kg)
file: yield5_YPR_timeseries.png